june 2013 survey - texas
TRANSCRIPT

Volumetric and Sedimentation Survey
of LAKE BROWNWOOD
June 2013 Survey
May 2014
Texas Water Development Board
Carlos Rubinstein, Chairman | Bech Bruun, Member | Kathleen Jackson, Member
Kevin Patteson, Executive Administrator
Prepared for:
Brown County Water Improvement District No. 1
With Support Provided by:
U.S. Army Corps of Engineers, Fort Worth District
Authorizationfor use or reproduction ofany original material contained in thispublication, i.e. not obtainedfrom other sources, isfreely granted. TheBoard would appreciate acknowledgement.
This report was prepared by staff of the Surface Water Resources Division:
Ruben S. Solis, Ph.D., P.E.Jason J. Kemp, Team Lead
Holly HolmquistNathan Brock
Michael Vielleux
Khan IqbalBianca Whitaker
Kyle Garmany
\**i
&>
Published and distributed by the
Texas WaterDevelopment Board
P.O. Box 13231, Austin, TX 78711-3231

Executive summary
In September 2009, the Texas Water Development Board (TWDB) entered into
agreement with the U.S. Army Corps of Engineers, Fort Worth District, to perform a volumetric
and sedimentation survey of Lake Brownwood. The U.S. Army Corps of Engineers, Fort Worth
District, provided 50% of the funding for this survey through their Planning Assistance to
States Program, while the Brown County Water Improvement District No. 1 provided the
remaining 50%. Surveying was performed using a multi-frequency (200 kHz, 50 kHz, and 24
kHz), sub-bottom profiling depth sounder. In addition, sediment core samples were collected in
select locations and correlated with the multi-frequency depth sounder signal returns to estimate
sediment accumulation thicknesses and sedimentation rates.
Brownwood Dam and Lake Brownwood are located on Pecan Bayou in Brown County,
approximately eight miles north of Brownwood, Texas. The conservation pool elevation of
Lake Brownwood is 1,425.0 feet (NAVD88). TWDB collected bathymetric data for Lake
Brownwood on June 10-14, 2013, while the daily average water surface elevations measured
between 1,412.31 and 1,412.19 feet (NAVD88). Additional data was collected on August 5,
2013, while the daily average water surface elevation measured 1,416.42 feet (NAVD88).
The 2013 TWDB volumetric survey indicates that Lake Brownwood has a total
reservoir capacity of 131,530 acre-feet and encompasses 6,814 acres at conservation pool
elevation (1,425.0 feet NAVD88). Previous capacity estimates include: the original capacity
estimate of 157,360 acre-feet; a 1959 survey by the U.S. Soil Conservation Service indicating a
capacity of 143,400 acre-feet; and re-analysis of the 1997 TWDB volumetric survey data using
current processing procedures that resulted in an updated capacity estimate of 134,955 acre-
feet.
Based on two methods for estimating sedimentation rates, the 2013 TWDB
sedimentation survey estimates Lake Brownwood to have an average loss of capacity
between 131 and 323 acre-feet per year since impoundment due to sedimentation below
conservation pool elevation (1,425.0 feet NAVD88). The sedimentation survey indicates
sediment accumulation varies throughout the reservoir. Sediment accumulations measured by
this survey are greatest in the submerged river channels and in small pockets throughout the
reservoir. Of these, the greatest accumulations are in Pecan Bayou north and northeast of Lake
Brownwood State Park and in Jim Ned Creek downstream of the confluence with Rocky Creek
and north of Flat Rock Park. TWDB recommends that a similar methodology be used to
resurvey Lake Brownwood in 10 years or after a major flood event.

Table of Contents
Introduction ........................................................................................................................... 1 Lake Brownwood general information ............................................................................... 1 Volumetric and sedimentation survey of Lake Brownwood ............................................. 4
Datum .................................................................................................................................. 4 TWDB bathymetric and sedimentation data collection ...................................................... 4
Data processing ..................................................................................................................... 6 Model boundaries ................................................................................................................ 6 Triangulated Irregular Network model ............................................................................... 7 Spatial interpolation of reservoir bathymetry ...................................................................... 8 Area, volume, and contour calculation .............................................................................. 11 Analysis of sediment data from Lake Brownwood ........................................................... 14
Survey results ...................................................................................................................... 20 Volumetric survey ............................................................................................................. 20 Sedimentation survey ........................................................................................................ 21
Recommendations ............................................................................................................... 23 TWDB contact information ............................................................................................... 23 References ............................................................................................................................ 24
List of Tables
Table 1: Pertinent data for Brownwood Dam and Lake Brownwood Table 2: Sediment core sampling analysis data - Lake Brownwood Table 3: Current and previous survey capacity and surface area data Table 4: Capacity loss comparisons for Lake Brownwood
List of Figures
Figure 1: Location of Lake Brownwood Figure 2: Data collected during 2013 TWDB Lake Brownwood survey Figure 3: Anisotropic spatial interpolation of Lake Brownwood Figure 4: Elevation relief map Figure 5: Depth ranges map Figure 6: 5-foot contour map Figure 7: Sediment core sample B-3 from Lake Brownwood Figure 8: Comparison of sediment core B-3 with acoustic signal returns Figure 9: Cross-section of data collected during 2013 survey Figure 10: Sediment thicknesses throughout Lake Brownwood
Appendices
Appendix A: Lake Brownwood 2013 capacity table Appendix B: Lake Brownwood 2013 area table Appendix C: Lake Brownwood 2013 capacity curve Appendix D: Lake Brownwood 2013 area curve
Note: References to brand names throughout this report do not imply endorsement by the Texas Water Development Board

1
Introduction
The Hydrographic Survey Program of the Texas Water Development Board
(TWDB) was authorized by the 72nd Texas State Legislature in 1991. Section 15.804 of the
Texas Water Code authorizes TWDB to perform surveys to determine reservoir storage
capacity, sedimentation levels, rates of sedimentation, and projected water supply
availability.
In September 2009, TWDB entered into agreement with the U.S. Army Corps of
Engineers, Fort Worth District, to perform a volumetric and sedimentation survey of Lake
Brownwood. The U.S. Army Corps of Engineers, Fort Worth District, provided 50% of the
funding for this survey through their Planning Assistance to States Program, while the
Brown County Water Improvement District No. 1 provided the remaining 50% (TWDB,
2009). This report describes the methods used to conduct the volumetric and sedimentation
survey, including data collection and processing techniques. This report serves as the final
contract deliverable from TWDB to the Brown County Water Improvement District No. 1
and the U.S. Army Corps of Engineers, Fort Worth District, and contains as deliverables:
(1) a shaded relief plot of the reservoir bottom [Figure 4], (2) a bottom contour map [Figure
6], (3) an estimate of sediment accumulation and location [Figure 10], and (4) an elevation-
area-capacity table of the reservoir acceptable to the Texas Commission on Environmental
Quality [Appendix A, B].
Lake Brownwood general information
Brownwood Dam and Lake Brownwood are located on Pecan Bayou in Brown
County, approximately eight miles north of Brownwood, Texas (Figure 1). Pecan Bayou is
a tributary of the Colorado River, and the dam is located just downstream of the confluence
of Jim Ned Creek with Pecan Bayou. Brownwood Dam and Lake Brownwood are owned
and operated by Brown County Water Improvement District No. 1 (BCWID, 2013a).
Construction of the dam began in 1930, and was completed in 1933. Deliberate
impoundment of water began in July 1933 (TWDB, 1971). Lake Brownwood is a water
supply reservoir primarily for municipal and irrigation purposes. The Brown County Water
Improvement District No. 1 supplies Lake Brownwood water to the Cities of Brownwood,
Early, Bangs, Santa Anna, the Brookesmith SUD, and other small systems around the lake
(BCWID, 2013a). Additional pertinent data about Brownwood Dam and Lake Brownwood
can be found in Table 1.

2
Water rights for Lake Brownwood have been appropriated to the Brown County
Water Improvement District No. 1 through Certificate of Adjudication No. 14-2454 and
Amendment to Certificate of Adjudication No. 14-2454A. The complete certificates are on
file in the Information Resources Division of the Texas Commission on Environmental
Quality.
Figure 1. Location of Lake Brownwood

3
Table 1. Pertinent data for Brownwood Dam and Lake Brownwood Owner Brown County Water Improvement District No. 1 Design Engineer
D.W. Ross Location of dam
On Pecan Bayou in Brown County, 8 miles north of Brownwood Drainage area 1,535 square miles Dam Type Earthfill Length 1,580 feet Height 140 feet Top width 21 feet Spillway (emergency)
Location 800 feet to left of dam Type Concrete sill on natural cut Crest length 479 feet Crest elevation 1,425 feet NAVD88
Spillway (service) Type 2 concrete conduits Control 2 concrete broome-type gates
Outlet works Type 1 concrete conduit, 5-foot diameter Control Slide gate Invert elevation 1,405.5 feet
Reservoir data (Based on 2013 TWDB survey) Elevation Capacity Area Feature (feet NAVD88a) (acre-feet) (acres) Top of dam 1,470.0 N/A N/A Spillway crest (conservation pool) 1,425.0 131,530 6,814 Outlet works 1,408.5 46,805 3,604 1,380.0 1,377 222 1,360.0 0 0
Usable conservation storage spaceb - 131,530 - Source: (TWDB, 1971; Freese & Nichols, 2014) Note: Dam modification was completed in August 1983. Modification included raising the height of the dam by 20 feet and reducing two flood release tubes from 144-inch diameter to 42-inch diameter and replacing the old aqueduct feeder with a 42-inch diameter pipe. These three 42-inch intakes are on the lake side of the dam at elevations 1,408.5, 1,380.0, and 1,360.0 feet NAVD88 (BCWID, 2013b, Freese & Nichols, 2014) a NAVD88 = North American Vertical Datum 1988 b Usable conservation storage space equals total capacity at conservation pool elevation minus dead pool capacity. Dead pool refers to water that cannot be drained by gravity through a dam’s outlet works.

4
Volumetric and sedimentation survey of Lake Brownwood
Datum
The vertical datum used during this survey is the North American Vertical Datum
1988 (NAVD88). Water surface elevations obtained from the United States Geological
Survey (USGS) for the reservoir elevation gage USGS 08143000 Lk Brownwood nr
Brownwood, TX (USGS, 2014) are reported in the National Geodetic Vertical Datum 1929.
According to the USGS, “In the past, the U.S. Geological Survey (USGS) has used the
datum that was used in the construction of Lake Brownwood, which is known as the
‘Reservoir Datum’, for reporting reservoir stage for Lake Brownwood (Station No.
08143000) to maintain continuity with the historical record. The ‘Reservoir Datum’ is 0.50
ft higher than National Geodetic Vertical Datum 1929 (NGVD 1929). The elevation of the
crest of the spillway is 1424.6 ft above MSL (NGVD 1929) or 1425.1 ft above ‘Reservoir
Datum’… As of Feb 23, 1999 all records published for Lake Brownwood are based on
National Geodetic Vertical Datum of 1929 and include the remark ‘prior to Feb 1999, non-
recording gages at same site at datum 0.50 ft higher.” Recent surveys of the Brownwood
Dam spillway have determined the elevation of the spillway to be 1425.0 feet NAVD88 (D.
King, personal communication, March 26, 2014), therefore, water surface elevations
obtained from the USGS were converted to NAVD88 by subtracting 0.1 feet from the gage
readings. Elevations herein are reported in feet relative to the NAVD88 datum. Volume and
area calculations in this report are referenced to the converted water levels provided by the
USGS gage. The horizontal datum used for this report is North American Datum 1983
(NAD83), and the horizontal coordinate system is State Plane Texas Central Zone (feet).
TWDB bathymetric and sedimentation data collection
TWDB collected bathymetric data for Lake Brownwood on June 10-14, 2013, while
the daily average water surface elevations measured between 1,412.31 and 1,412.19 feet
(NAVD88). Additional data was collected on August 5, 2013, while the daily average water
surface elevation measured 1,416.42 feet (NAVD88). For data collection, TWDB used a
Specialty Devices, Inc. (SDI), single-beam, multi-frequency (200 kHz, 50 kHz, and 24
kHz) sub-bottom profiling depth sounder integrated with differential global positioning
system (DGPS) equipment. Data was collected along pre-planned survey lines oriented
perpendicular to the assumed location of the original river channels and spaced
approximately 500 feet apart. Many of the same survey lines were also used by TWDB

5
during the 1997 survey. The depth sounder was calibrated daily using a velocity profiler to
measure the speed of sound in the water column and a weighted tape or stadia rod for depth
reading verification. Figure 2 shows where data collection occurred during the 2013 TWDB
survey.
All sounding data was collected and reviewed before sediment core sampling sites
were selected. Sediment core samples are collected at regularly spaced intervals within the
reservoir, or at locations where interpretation of the acoustic display would be difficult
without site-specific sediment core data. After analyzing the sounding data, TWDB selected
six locations to collect sediment core samples (Figure 2). The sediment core samples were
collected on August 13, 2013, with a custom-coring boat and SDI VibeCore system.
Sediment cores are collected in 3-inch diameter aluminum tubes. Analysis of the
acoustic data collected during the bathymetric survey assists in determining the depth of
penetration the tube must be driven during sediment sampling. The goal is to collect a
sediment core sample extending from the current reservoir-bottom, through the
accumulated sediment, and to the pre-impoundment surface. After retrieving the sample, a
stadia rod is inserted into the top of the tube to assist in locating the top of the sediment in
the tube. This identifies the location of the layer corresponding to the current reservoir
surface. The aluminum tube is cut to this level, capped, and transported back to TWDB
headquarters for further analysis. During this time, some settling of the upper layer can
occur.

6
Figure 2. Data collected during 2013 TWDB Lake Brownwood survey
Data processing
Model boundaries
The reservoir boundary was digitized from aerial photographs, also known as digital
orthophoto quarter-quadrangle images (DOQQs), obtained from the Texas Natural
Resources Information System (TNIRIS, 2014) using Environmental Systems Research
Institute’s ArcGIS software. The quarter-quadrangles that cover Lake Brownwood are Lake
Brownwood (NW, NE, SW, SE), Thrifty (NE), Byrds (SE), and Owens (NW). The DOQQs
were photographed on November 4, 2004 (Owens NW), and November 26, 2004, while the
daily average water surface elevation measured 1,424.67 feet, and 1,425.69 feet,
respectively (NAVD88). According to metadata associated with the 2004 DOQQs, the
photographs have a resolution or ground sample distance of 1.0-meters and a horizontal
accuracy of within ±5 meters of reference DOQQs from the National Digital Ortho Program
(USDA, 2013). The area of the lake within the Owens NW quarter quadrangle is not

7
significant, therefore, for this analysis; the boundary was digitized at the land-water
interface in the 2004 photographs and assigned an elevation of 1,425.7 feet.
Where survey data alone was not sufficient to model the reservoir topography and in
areas inaccessible by boat due to reservoir conditions at the time of the survey, additional
boundary information was obtained from aerial photographs taken on August 4, 2008, and
July 20, 2012, August 2, 2012, and August 3, 2012, while the daily average water surface
elevation measured 1,420.74 feet, 1,413.11 feet, 1,412.65 feet, and 1,412.61 feet,
respectively. The 2008 and 2012 boundary information was added to the lake model as
points with elevations assigned to the points based on water surface elevations when the
photographs were taken. According to metadata associated with both the 2008 and 2012
DOQQs, the photographs have a resolution or ground sample distance of 1.0-meters and a
horizontal accuracy within ±6 meters to true ground (USDA, 2013, TNRIS, 2010, TNRIS,
2012).
Triangulated Irregular Network model
Following completion of data collection, the raw data files collected by TWDB
were edited to remove data anomalies. DepthPic©, software developed by SDI, Inc., was
used to display, interpret, and edit the multi-frequency data by manually removing data
anomalies in the current bottom surface and manually digitizing the reservoir-bottom
surface at the time of initial impoundment (i.e. pre-impoundment surface). For processing
outside of DepthPic©, an in-house software package, HydroTools, was used to identify the
current reservoir-bottom surface, pre-impoundment surface, sediment thickness at each
sounding location, and output the data into a single file. The water surface elevation at the
time of each sounding was used to convert each sounding depth to a corresponding
reservoir-bottom elevation. This survey point dataset was then preconditioned by inserting a
uniform grid of artificial survey points between the actual survey lines. Bathymetric
elevations at these artificial points were determined using an anisotropic spatial
interpolation algorithm described in the next section. This technique creates a high
resolution, uniform grid of interpolated bathymetric elevation points throughout a majority
of the reservoir (McEwen et al., 2011a). Finally, the point file resulting from spatial
interpolation was used in conjunction with sounding and boundary data to create volumetric
and sediment Triangulated Irregular Network (TIN) models utilizing the 3D Analyst
Extension of ArcGIS. The 3D Analyst algorithm uses Delaunay’s criteria for triangulation

8
to create a grid composed of triangles from non-uniformly spaced points, including the
boundary vertices (ESRI, 1995).
Spatial interpolation of reservoir bathymetry
Isotropic spatial interpolation techniques such as the Delaunay triangulation used by
the 3D Analyst extension of ArcGIS are, in many instances, unable to suitably interpolate
bathymetries between survey lines common to reservoir surveys. Reservoirs and stream
channels are anisotropic morphological features where bathymetry at any particular location
is more similar to upstream and downstream locations than to transverse locations.
Interpolation schemes that do not consider this anisotropy lead to the creation of several
types of artifacts in the final representation of the reservoir bottom surface and hence to
errors in volume. These include: artificially-curved contour lines extending into the
reservoir where the reservoir walls are steep or the reservoir is relatively narrow;
intermittent representation of submerged stream channel connectivity; and oscillations of
contour lines in between survey lines. These artifacts reduce the accuracy of the resulting
volumetric and sediment TIN models in areas between actual survey data.
To improve the accuracy of bathymetric representation between survey lines,
TWDB developed various anisotropic spatial interpolation techniques. Generally, the
directionality of interpolation at different locations of a reservoir can be determined from
external data sources. A basic assumption is that the reservoir profile in the vicinity of a
particular location has upstream and downstream similarity. In addition, the sinuosity and
directionality of submerged stream channels can be determined by directly examining the
survey data or more robustly by examining scanned USGS 7.5 minute quadrangle maps
(known as digital raster graphics or DRGs) and hypsography files (the vector format of
USGS 7.5 minute quadrangle map contours), when available. Using the survey data,
polygons are created to partition the reservoir into segments with centerlines defining
directionality of interpolation within each segment. For surveys with similar spatial
coverage, these interpolation definition files are in principle independent of the survey data
and could be applied to past and future survey data of the same reservoir. In practice,
however, minor revisions of the interpolation definition files may be needed to account for
differences in spatial coverage and boundary conditions between surveys. Using the
interpolation definition files and survey data, the current reservoir-bottom elevation, pre-
impoundment elevation, and sediment thickness are calculated for each point in the high

9
resolution uniform grid of artificial survey points. The reservoir boundary, artificial survey
points grid, and survey data points are used to create volumetric and sediment TIN models
representing the reservoir bathymetry and sediment accumulation throughout the reservoir.
Specific details of this interpolation technique can be found in the HydroTools manual
(McEwen et al., 2011a) and in McEwen et al., 2011b.
In areas inaccessible to survey data collection such as small coves and shallow
upstream areas of the reservoir, linear extrapolation is used for volumetric and sediment
accumulation estimations. The linear extrapolation follows a linear definition file linking
the survey points file to the lake boundary file (McEwen et al., 2011a). Without
extrapolated data, the TIN Model builds flat triangles. A flat triangle is defined as a triangle
where all three vertices are equal in elevation, generally the elevation of the reservoir
boundary. Reducing flat triangles, by applying linear extrapolation, improves the elevation-
capacity and elevation-area calculations. It is not always possible to remove all flat
triangles, and linear extrapolation is only applied where adding bathymetry is deemed
reasonable. For example, linear extrapolation was deemed reasonable and applied to Lake
Brownwood in the following situations: in small coves of the main body of the lake and in
obvious channel features from the USGS 7.5 minute quadrangle maps or those visible in the
2008 and 2012 DOQQs.
Figure 3 illustrates typical results from application of the anisotropic interpolation
and linear extrapolation techniques to Lake Brownwood. In Figure 3A, deeper channels
indicated by surveyed cross sections are not continuously represented in areas between
survey cross sections. This is an artifact of the TIN generation routine rather than an
accurate representation of the physical bathymetric surface. Inclusion of interpolation
points, represented in Figure 3C, in creation of the volumetric TIN model directs Delaunay
triangulation to better represent the reservoir bathymetry between survey cross-sections.
The bathymetry shown in Figure 3C was used in computing reservoir capacity and area
tables (Appendix A, B).

10
Figure 3. Anisotropic spatial interpolation and linear extrapolation of Lake Brownwood sounding
data - A) bathymetric contours without interpolated points, B) sounding points (black) and interpolated points (red), C) bathymetric contours with the interpolated points

11
Area, volume, and contour calculation
Using ArcInfo software and the volumetric TIN model, volumes and areas were
calculated for the entire reservoir at 0.1 feet intervals, from 1,361.5 to 1,425.7 feet. The use
of contour data from the 2008 and 2012 DOQQs helped provide otherwise unavailable
topographic data in areas that were inaccessible by boat or too shallow for the instruments
to work properly. However, the TIN models developed in these areas led to the creation of
anomalous “flat triangles”, that is triangles whose three vertices all have the same elevation.
The flat triangles in turn lead to anomalous calculations of surface area and volume at the
boundary elevations, 1,412.61 feet, 1,412.65 feet, 1,413.11 feet, 1,420.74 feet, and 1,425.7
feet. To eliminate the effects of the flat triangles on area and volume calculations, areas
between elevations 1,412.5 feet and 1,425.7 feet were linearly interpolated between the
computed values, and volumes above elevation 1,412.5 feet were calculated based on the
corrected areas. The elevation-capacity table and elevation-area table, updated for 2013, are
presented in Appendices A and B, respectively. The capacity curve is presented in
Appendix C, and the area curve is presented in Appendix D.
The volumetric TIN model was converted to a raster representation using a cell size
of 2 feet by 2 feet. The raster data was then used to produce: an elevation relief map (Figure
4), representing the topography of the reservoir bottom; a depth range map (Figure 5),
showing shaded depth ranges for Lake Brownwood; and a 5-foot contour map (Figure 6 -
attached).

2,660,000
2,660,000
2,680,000
2,680,000
2,700,000
2,700,000
10,64
0,000
10,64
0,000
10,66
0,000
10,66
0,000
Figure 4Lake Brownwood
Elevation relief map
N
Projection: NAD83State Plane
Texas Central Zone (feet)
Conservation PoolElevation: 1,425.0 feet
NAVD88
June 2013 Survey 0 1 20.5Miles
Elevations(feet NAVD88)
1,420 - 1,4251,415 - 1,4201,410 - 1,4151,405 - 1,4101,400 - 1,4051,395 - 1,4001,390 - 1,3951,385 - 1,3901,380 - 1,3851,375 - 1,3801,370 - 1,3751,365 - 1,3701,361.6 - 1,365

2,660,000
2,660,000
2,680,000
2,680,000
2,700,000
2,700,000
10,64
0,000
10,64
0,000
10,66
0,000
10,66
0,000
Figure 5Lake Brownwood
Depth ranges map
N
Projection: NAD83State Plane
Texas Central Zone (feet)
Conservation PoolElevation: 1,425.0 feet
NAVD88
June 2013 Survey 0 1 20.5Miles
Depth ranges(feet)
Islands
0 - 10'10 - 20'20 - 30'30 - 40'40 -50'50 - 60'> 60'

14
Analysis of sediment data from Lake Brownwood
Sedimentation in Lake Brownwood was determined by analyzing the acoustic signal
returns of all three depth sounder frequencies in the DepthPic© software. The 200 kHz
signal was analyzed to determine the current bathymetric surface of the reservoir, while all
three frequencies, 200 kHz, 50 kHz, and 24 kHz, were analyzed to determine the reservoir
bathymetric surface at the time of initial impoundment (i.e. pre-impoundment surface).
Sediment core samples collected in the reservoir were used to assist in identifying the
location of the pre-impoundment surface in the acoustic signals. The difference between the
current surface and the pre-impoundment surface yields a sediment thickness value at each
sounding location.
Analysis of the sediment core samples was conducted at TWDB headquarters in
Austin. Each sample was split longitudinally and analyzed to identify the location of the
pre-impoundment surface. The pre-impoundment surface is identified within the sediment
core sample by one or more of the following methods: (1) a visual examination of the
sediment core for terrestrial materials, such as leaf litter, tree bark, twigs, intact roots, etc.,
concentrations of which tend to occur on or just below the pre-impoundment surface; (2)
changes in texture from well sorted, relatively fine-grained sediment to poorly sorted
mixtures of coarse and fine-grained materials; and (3) variations in the physical properties
of the sediment, particularly sediment water content and penetration resistance with depth
(Van Metre et al., 2004). The total sample length, sediment thickness, and the pre-
impoundment thickness were recorded. Physical characteristics of the sediment core,
including color, texture, relative water content, and presence of organic materials, were also
recorded (Table 2).
15
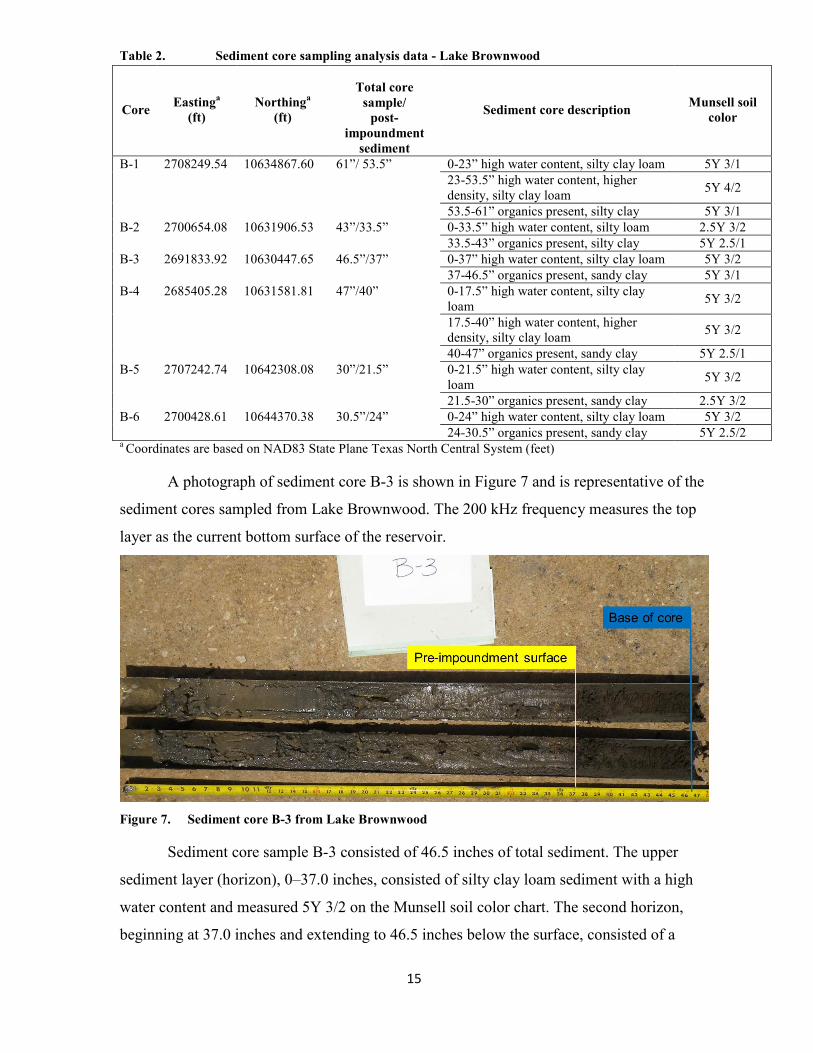
Table 2. Sediment core sampling analysis data - Lake Brownwood
Core Eastinga (ft)
Northinga (ft)
Total core sample/
post-impoundment
sediment
Sediment core description Munsell soil color
B-1 2708249.54 10634867.60 61”/ 53.5” 0-23” high water content, silty clay loam 5Y 3/1 23-53.5” high water content, higher density, silty clay loam 5Y 4/2
53.5-61” organics present, silty clay 5Y 3/1 B-2 2700654.08 10631906.53 43”/33.5” 0-33.5” high water content, silty loam 2.5Y 3/2
33.5-43” organics present, silty clay 5Y 2.5/1 B-3 2691833.92 10630447.65 46.5”/37” 0-37” high water content, silty clay loam 5Y 3/2
37-46.5” organics present, sandy clay 5Y 3/1 B-4 2685405.28 10631581.81 47”/40” 0-17.5” high water content, silty clay
loam 5Y 3/2
17.5-40” high water content, higher density, silty clay loam 5Y 3/2
40-47” organics present, sandy clay 5Y 2.5/1 B-5 2707242.74 10642308.08 30”/21.5” 0-21.5” high water content, silty clay
loam 5Y 3/2
21.5-30” organics present, sandy clay 2.5Y 3/2 B-6 2700428.61 10644370.38 30.5”/24” 0-24” high water content, silty clay loam 5Y 3/2
24-30.5” organics present, sandy clay 5Y 2.5/2 a Coordinates are based on NAD83 State Plane Texas North Central System (feet)
A photograph of sediment core B-3 is shown in Figure 7 and is representative of the
sediment cores sampled from Lake Brownwood. The 200 kHz frequency measures the top
layer as the current bottom surface of the reservoir.
Figure 7. Sediment core B-3 from Lake Brownwood
Sediment core sample B-3 consisted of 46.5 inches of total sediment. The upper
sediment layer (horizon), 0–37.0 inches, consisted of silty clay loam sediment with a high
water content and measured 5Y 3/2 on the Munsell soil color chart. The second horizon,
beginning at 37.0 inches and extending to 46.5 inches below the surface, consisted of a
16
sandy clay soil with organics present and a 5Y 3/1 Munsell soil color. The base of the
sample is denoted by the blue line in Figure 7.
The pre-impoundment boundary (yellow line in Figure 7) was evident within this
sediment core sample at 37.0 inches and identified by the change in color, texture, moisture,
porosity, and structure. Identification of the pre-impoundment surface for the remaining
sediment cores followed a similar procedure.
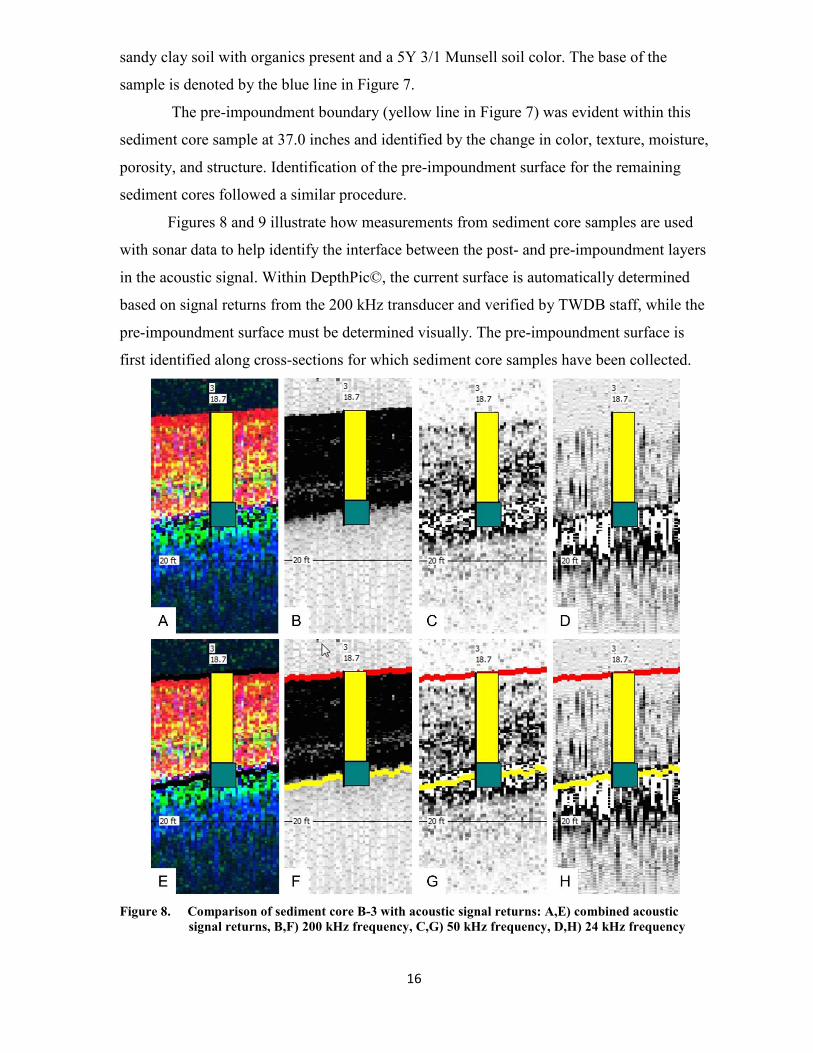
Figures 8 and 9 illustrate how measurements from sediment core samples are used
with sonar data to help identify the interface between the post- and pre-impoundment layers
in the acoustic signal. Within DepthPic©, the current surface is automatically determined
based on signal returns from the 200 kHz transducer and verified by TWDB staff, while the
pre-impoundment surface must be determined visually. The pre-impoundment surface is
first identified along cross-sections for which sediment core samples have been collected.
Figure 8. Comparison of sediment core B-3 with acoustic signal returns: A,E) combined acoustic
signal returns, B,F) 200 kHz frequency, C,G) 50 kHz frequency, D,H) 24 kHz frequency

17
Figure 8 compares sediment core sample B-3 with the acoustic signals for all
frequencies combined (A, E), 200 kHz (B, F), 50 kHz (C, G), and 24 kHz (D, H). The
sediment core sample is represented in each figure as colored boxes. The yellow boxes
represent post-impoundment sediment, and the blue box represents the pre-impoundment
sediment. In Figure 8A-D, the bathymetric surfaces are not shown. In Figure 8E, the current
bathymetric surface is represented as the top black line and in Figures 8 F-H as the top red
line. The pre-impoundment surface is identified by comparing boundaries observed in the
200 kHz, 50 kHz and 24 kHz signals to the location of the pre-impoundment surface of the
sediment core sample. Each sediment core sample was compared to all three frequencies
and the boundary in the 200 kHz signal most closely matched the pre-impoundment
interface of the sediment core samples; therefore, the 200 kHz signal was used to locate the
pre-impoundment layer. The pre-impoundment surface was manually drawn and is
represented by the bottom black line in Figure 8E, and by the yellow line in Figures 8F-H.
Figure 9 shows sediment core sample B-3 correlated with the 200 kHz frequency of the
nearest surveyed cross-section. The pre-impoundment surface identified along cross-
sections where sediment core samples were collected is used as a guide for identifying the
pre-impoundment surface along cross-sections where sediment core samples were not
collected.
Figure 9. Cross-section of data collected during 2013 survey, displayed in DepthPic© (200 kHz
frequency), correlated with sediment core sample B-3 and showing the current surface in red and pre-impoundment surface in yellow
After the pre-impoundment surface from all cross-sections was identified, a
sediment thickness TIN model is created following standard GIS techniques (Furnans,
2007). Sediment thicknesses were interpolated between surveyed cross-sections using
HydroTools with the same interpolation definition file used for bathymetric interpolation.
For the purposes of the TIN model creation, TWDB assumed sediment thickness at the
reservoir boundary was zero feet (defined as the 1,425.7 foot NAVD88 elevation contour).

18
The sediment thickness was also assumed zero at each point digitized from the 2008 and
2012 DOQQs. The sediment thickness TIN model was converted to a raster representation
using a cell size of 5 feet by 5 feet and used to produce a sediment thickness map of Lake
Brownwood (Figure 10).

2,660,000
2,660,000
2,680,000
2,680,000
2,700,000
2,700,000
10,64
0,000
10,64
0,000
10,66
0,000
10,66
0,000
Figure 10Lake Brownwood
Sediment thickness map
N
Projection: NAD83State Plane
Texas Central Zone (feet)
Conservation PoolElevation: 1,425.0 feet
NAVD88
June 2013 Survey 0 1 20.5Miles
Sediment thickness(feet)
IslandsLake BrownwoodElevation 1,425.7 feetNAVD88
0 - 0.50.5 - 1.01.0 - 1.51.5 - 2.02.0 - 2.52.5 - 3.03.0 - 3.53.5 - 4.04.0 - 4.54.5 - 5.05.0 - 5.55.5 - 6.06.0 - 6.56.5 - 7.07.0 - 7.57.5 - 8.08.0 - 8.5

20
Survey results
Volumetric survey
The results of the 2013 TWDB volumetric survey indicate Lake Brownwood
has a total reservoir capacity of 131,530 acre-feet and encompasses 6,814 acres at
conservation pool elevation (1,425.0 feet, NAVD88). Previous capacity estimates include
the original design estimate of 157,360 acre-feet, and a 1959 sediment survey by the U.S.
Soil Conservation Service, indicating a capacity of 143,400 acre-feet. Because of
differences in past and present survey methodologies, direct comparison of volumetric
surveys to estimate loss of capacity is difficult and can be unreliable.
TWDB previously surveyed Lake Brownwood in 1997. To properly compare results
of TWDB surveys, TWDB applied the 2014 data processing techniques to the data
collected in 1997. Specifically, TWDB applied anisotropic spatial interpolation to the
survey data collected in 1997 using the same interpolation definition file as was used for the
2013 survey, with minor edits to account for differences in data coverage and boundary
conditions. A new TIN model was created using the original boundary, with some edits.
The 1997 survey used the 1,425.0-foot contour from 7.5 minute USGS quadrangle maps,
with a stated accuracy of ±1/2 the contour interval, as an outer model boundary (USBB,
1947). However, in 1997, this boundary was edited to include all survey data points and
clipped in the upper reaches by a seemingly arbitrary determination of the end of the lake.
For re-calculation, the clipped parts of the lake were added back to the 1997 model
boundary. Re-evaluation of the 1997 survey resulted in a 2.7 percent increase in the total
capacity estimate (Table 3).

21
Table 3. Current and previous survey capacity and surface area data
Survey Surface area (acres)
Total capacity (acre-feet)
Originala 7,300 157,360
U.S. Soil Conservation Service 1932b 7,298 149,925
U.S. Soil Conservation Service 1940b 7,298 145,720
U.S. Soil Conservation Service 1959b 7,298 135,963
TWDB 1997c 6,587 131,429
TWDB 1997 (re-calculated) 6,924 134,955
TWDB 2013 6,814 131,530
Note: Conservation pool elevation or spillway crest elevation for Lake Brownwood is reported differently depending on the source. The U.S. Soil Conservation Service reports the spillway crest elevation at 1,424.5 feet above mean sea level (SCS, 1959). TWDB and the USGS report spillway crest elevation at 1,424.6 feet NGVD29 (TWDB, 1971, USGS, 2014). The USGS also reports the spillway crest elevation as 1,425.1 feet “Reservoir Datum” (USGS, 2014). Recent surveys of Brownwood Dam have determined the spillway crest elevation is 1,425.0 feet NAVD88 (D. King, personal communication, March 26, 2014). a Source: (TWDB, 1971) b Source: (SCS, 1959) c Source: (TWDB, 1997)
Sedimentation survey
Based on two methods for estimating sedimentation rates, the 2013 TWDB
sedimentation survey estimates Lake Brownwood to have an average loss of capacity
between 131 and 323 acre-feet per year since impoundment due to sedimentation
below conservation pool elevation (1,425.0 feet NAVD88). The sedimentation survey
indicates sediment accumulation varies throughout the reservoir. Sediment accumulations
measured by this survey are greatest in the submerged river channels and in small pockets
throughout the reservoir. Of these, the greatest accumulations are in Pecan Bayou north and
northeast of Lake Brownwood State Park and in Jim Ned Creek downstream of the
confluence with Rocky Creek and north of Flat Rock Park. Comparison of capacity
estimates of Lake Brownwood derived using differing methodologies are provided in Table
4 for sedimentation rate calculation.

22
Table 4. Capacity loss comparisons for Lake Brownwood
Survey Volume comparisons at conservation pool elevation (acre-feet)
Pre-impoundment (acre-feet)
Original 157,360 <> <> <> <> <> SCS 1932 <> 149,925 <> <> <> <> SCS 1940 <> <> 145,720 <> <> <> SCS 1959 <> <> <> 135,963 <> <>
TWDB 1997 (re-calculated) <> <> <> <> 134,955 <>
TWDB pre-impoundment
estimate based on 2013 survey
<> <> <> <> <> 142,048a
2013 volumetric survey 131,530 131,530 131,530 131,530 131,530 131,530
Volume difference (acre-feet) 25,830 (16.4%) 18,395 (12.3%) 14,190 (9.7%) 4,433 (3.3%) 3,425 (2.5%) 10,518 (7.4%)
Number of years 80 81 73 54 16 80 Capacity loss rate (acre-feet/year) 323 227 194 82 214 131
Note: Brownwood Dam was completed in 1933, and deliberate impoundment began in July, 1933. a 2013 TWDB calculated capacity of 131,530 acre-feet plus 2013 TWDB calculated sediment volume of 10,518 acre-feet

23
Recommendations
To improve estimates of sediment accumulation rates, TWDB recommends
resurveying Lake Brownwood in approximately 10 years or after a major flood event. To
further improve estimates of sediment accumulation, TWDB recommends another
sedimentation survey. A re-survey would allow a more accurate quantification of the
average sediment accumulation rate for Lake Brownwood.
TWDB contact information
More information about the Hydrographic Survey Program can be found at:
http://www.twdb.texas.gov/surfacewater/surveys/index.asp
Any questions regarding the TWDB Hydrographic Survey Program may be addressed to:
Jason J. Kemp Team Lead, TWDB Hydrographic Survey Program Phone: (512) 463-2456 Email: [email protected]
Or
Ruben S. Solis, Ph.D., P.E. Director, Surface Water Resources Division Phone: (512) 936-0820 Email: [email protected]

24
References
BCWID (Brown County Water Improvement District No. 1), 2013a, History – Brown County Water Improvement District, http://www.bcwid.org/history.html, accessed February 2014.
BCWID (Brown County Water Improvement District No. 1), 2013b, Historical Milestones – Brown County Water Improvement District, http://www.bcwid.org/historical-milestones.html, accessed February 2014.
ESRI (Environmental Systems Research Institute), 1995, ARC/INFO Surface Modeling and Display, TIN Users Guide, ESRI, 380 New York Street, Redlands, CA 92373.
Freese & Nichols Consulting Engineers, 2014, Plate 2, Flow Diagram.
Furnans, J., Austin, B., 2007, Hydrographic survey methods for determining reservoir volume, Environmental Modeling & Software, doi:10.1016/j.envsoft.2007.05.011.
McEwen, T., Brock, N., Kemp, J., Pothina, D. & Weyant, H., 2011a, HydroTools User’s Manual, Texas Water Development Board.
McEwen, T., Pothina, D. & Negusse, S., 2011b, Improving efficiency and repeatability of lake volume estimates using Python, submitted, Proceedings of the 10th Python for Scientific Computing Conference (SciPy 2011).
SCS (U.S. Department of Agriculture Soil Conservation Service), 1959, Report on Sedimentation of Lake Brownwood, Brown County, Texas, August 3 – October 16, 1959.
TNRIS (Texas Natural Resources Information System), 2010, http://www.tnris.org/2008-09-1m-Orthoimagery, accessed February 2014.
TNRIS (Texas Natural Resources Information System), 2012, http://www.tnris.org/node/199, accessed February 2014.
TNRIS (Texas Natural Resources Information System), 2014, http://www.tnris.org/, accessed February 2014.
TWDB (Texas Water Development Board), 1971, Brownwood Dam and Brownwood Reservoir, Report 126, Engineering Data on Dams and Reservoirs in Texas, Part III.
TWDB (Texas Water Development Board), 1997, Volumetric Survey of Lake Brownwood, http://www.twdb.texas.gov/hydro_survey/Brownwood/1997-04/Brownwood1997_FinalReport.PDF.
TWDB (Texas Water Development Board), 2009, Contract No. 0904801005 with U.S. Army Corps of Engineers, Fort Worth District.
USBB (United States Bureau of the Budget), 1947, United States National Map Accuracy Standards, http://nationalmap.gov/standards/pdf/NMAS647.PDF.

25
USDA (U.S. Department of Agriculture), 2013, National Agricultural Imagery Program (NAIP) Information Sheet, http://www.fsa.usda.gov/Internet/FSA_File/naip_info_sheet_2013.pdf.
USGS (United States Geological Survey), 2007, USGS – National Geospatial Data Standards – Digital Line Graph Standards, http://rockyweb.cr.usgs.gov/nmpstds/dlgstds.html
USGS (United States Geological Survey), 2014, U.S. Geological Survey National Water Information System: Web Interface, USGS Real-Time Water Data for USGS 080143000 Lk Brownwood nr Brownwood, TX, http://waterdata.usgs.gov/tx/nwis/uv/?site_no=08143000&PARAmeter_cd=00062,72020,00054, accessed February 2014.
Van Metre, P.C., Wilson, J.T., Fuller, C.C., Callender, Edward, and Mahler, B.J., 2004, Collection, analysis, and age-dating of sediment cores from 56 U.S. lakes and reservoirs sampled by the U.S. Geological Survey, 1992-2001: U.S. Geological Survey Scientific Investigations Report 2004-5184, United States Geological Survey, 180p.

ELEVATION in Feet 0.0 0.1 0.2 0.3 0.4 0.5 0.6 0.7 0.8 0.9
1,361 0 0 0 0 0 0 0 0 0 01,362 0 0 0 0 0 0 1 1 1 11,363 1 2 2 2 2 2 3 3 3 31,364 4 4 4 5 5 5 6 6 6 71,365 7 8 9 9 10 11 12 13 14 161,366 17 19 20 22 24 26 28 30 32 351,367 37 40 43 45 48 51 54 57 60 641,368 67 70 74 77 81 84 88 92 97 1011,369 105 110 114 119 123 128 133 138 143 1491,370 154 159 165 170 176 181 187 193 199 2051,371 211 217 223 230 236 243 250 258 265 2731,372 280 288 296 304 312 321 329 337 346 3551,373 364 373 382 391 400 410 419 429 439 4491,374 459 469 479 490 501 511 522 534 545 5561,375 568 580 592 604 617 629 642 654 667 6811,376 694 707 721 734 748 762 776 791 805 8191,377 834 849 864 879 894 910 925 941 957 9741,378 990 1,007 1,024 1,042 1,059 1,077 1,095 1,114 1,132 1,1511,379 1,170 1,189 1,209 1,229 1,250 1,270 1,291 1,312 1,334 1,3551,380 1,377 1,400 1,422 1,445 1,468 1,491 1,515 1,539 1,563 1,5881,381 1,613 1,638 1,664 1,690 1,716 1,743 1,770 1,797 1,825 1,8531,382 1,882 1,911 1,941 1,971 2,001 2,032 2,064 2,096 2,129 2,1621,383 2,196 2,230 2,265 2,301 2,337 2,373 2,411 2,449 2,487 2,5261,384 2,566 2,606 2,647 2,689 2,731 2,774 2,817 2,862 2,907 2,9531,385 2,999 3,047 3,096 3,145 3,196 3,247 3,299 3,352 3,406 3,4611,386 3,516 3,573 3,630 3,687 3,746 3,805 3,865 3,926 3,987 4,0491,387 4,112 4,176 4,240 4,306 4,372 4,439 4,507 4,576 4,646 4,7161,388 4,788 4,861 4,935 5,010 5,086 5,163 5,241 5,319 5,399 5,4801,389 5,561 5,644 5,729 5,814 5,901 5,989 6,078 6,169 6,261 6,3551,390 6,449 6,545 6,643 6,742 6,842 6,943 7,046 7,150 7,255 7,3621,391 7,470 7,580 7,691 7,803 7,917 8,032 8,148 8,265 8,384 8,5041,392 8,625 8,748 8,871 8,996 9,122 9,249 9,378 9,507 9,638 9,7701,393 9,903 10,038 10,173 10,310 10,448 10,587 10,728 10,870 11,013 11,1581,394 11,304 11,451 11,599 11,749 11,900 12,053 12,206 12,361 12,517 12,6741,395 12,832 12,991 13,151 13,312 13,474 13,638 13,802 13,967 14,134 14,3021,396 14,471 14,641 14,812 14,984 15,158 15,333 15,509 15,687 15,866 16,0451,397 16,226 16,408 16,590 16,774 16,959 17,144 17,331 17,519 17,708 17,8981,398 18,090 18,282 18,476 18,671 18,866 19,064 19,262 19,461 19,662 19,8651,399 20,068 20,274 20,480 20,689 20,898 21,109 21,321 21,535 21,750 21,9681,400 22,187 22,408 22,630 22,855 23,081 23,309 23,539 23,771 24,005 24,2421,401 24,481 24,722 24,966 25,213 25,460 25,710 25,961 26,214 26,468 26,7241,402 26,981 27,239 27,498 27,759 28,021 28,284 28,548 28,813 29,079 29,3461,403 29,615 29,885 30,156 30,428 30,702 30,976 31,253 31,530 31,810 32,0901,404 32,372 32,655 32,939 33,225 33,512 33,801 34,091 34,383 34,677 34,9721,405 35,269 35,567 35,867 36,169 36,473 36,778 37,086 37,395 37,706 38,0191,406 38,333 38,650 38,969 39,290 39,612 39,936 40,263 40,591 40,922 41,2541,407 41,588 41,924 42,262 42,602 42,944 43,286 43,631 43,976 44,324 44,6731,408 45,024 45,377 45,732 46,088 46,446 46,805 47,167 47,529 47,894 48,2611,409 48,628 48,997 49,368 49,741 50,114 50,489 50,865 51,242 51,621 52,0011,410 52,383 52,765 53,150 53,536 53,923 54,312 54,702 55,093 55,487 55,8821,411 56,278 56,676 57,075 57,476 57,879 58,283 58,689 59,097 59,506 59,9181,412 60,331 60,746 61,163 61,582 62,003 62,426 62,851 63,279 63,708 64,1391,413 64,573 65,009 65,446 65,886 66,328 66,771 67,217 67,665 68,115 68,5671,414 69,021 69,477 69,936 70,396 70,858 71,322 71,789 72,257 72,728 73,2011,415 73,675 74,152 74,631 75,111 75,594 76,079 76,566 77,055 77,546 78,040
Appendix ALake Brownwood
RESERVOIR CAPACITY TABLETEXAS WATER DEVELOPMENT BOARD June 2013 Survey
CAPACITY IN ACRE-FEET Conservation Pool Elevation 1,425.0 feet NAVD88ELEVATION INCREMENT IS ONE TENTH FOOT

ELEVATION in Feet 0.0 0.1 0.2 0.3 0.4 0.5 0.6 0.7 0.8 0.9
1,416 78,535 79,032 79,531 80,033 80,536 81,042 81,549 82,059 82,571 83,0841,417 83,600 84,118 84,638 85,160 85,684 86,210 86,738 87,268 87,801 88,3351,418 88,871 89,410 89,950 90,493 91,037 91,584 92,133 92,684 93,236 93,7911,419 94,348 94,907 95,468 96,031 96,597 97,164 97,733 98,304 98,878 99,4531,420 100,031 100,610 101,192 101,776 102,362 102,949 103,539 104,131 104,725 105,3211,421 105,919 106,519 107,122 107,726 108,332 108,940 109,551 110,163 110,778 111,3951,422 112,013 112,634 113,257 113,882 114,508 115,137 115,768 116,401 117,037 117,6741,423 118,313 118,954 119,598 120,243 120,890 121,540 122,192 122,845 123,501 124,1591,424 124,818 125,480 126,144 126,810 127,478 128,148 128,820 129,495 130,171 130,8491,425 131,530 132,212 132,897 133,583 134,272 134,962 135,655 136,350
CAPACITY IN ACRE-FEET Conservation Pool Elevation 1,425.0 feet NAVD88ELEVATION INCREMENT IS ONE TENTH FOOT
Note: Capacities above elevation 1,412.5 feet calculated from interpolated areas
TEXAS WATER DEVELOPMENT BOARD June 2013 Survey
Appendix A (continued)Lake Brownwood
RESERVOIR CAPACITY TABLE
ELEVATION in Feet 0.0 0.1 0.2 0.3 0.4 0.5 0.6 0.7 0.8 0.9
1,361 0 0 0 0 0 0 0 0 0 01,362 0 1 1 1 1 1 2 2 2 21,363 2 2 2 2 2 2 2 3 3 31,364 3 3 3 3 3 3 4 4 5 51,365 6 6 7 7 8 9 10 12 13 141,366 14 15 17 18 19 20 22 23 24 251,367 26 26 27 27 28 30 31 31 32 331,368 33 34 35 36 37 37 40 41 42 431,369 44 45 46 47 48 49 50 51 52 521,370 53 54 55 55 56 57 58 58 59 601,371 61 62 63 65 67 70 72 74 75 761,372 78 79 80 81 82 83 84 86 87 881,373 89 90 91 93 94 95 96 97 99 1001,374 102 103 105 106 108 109 111 112 114 1161,375 118 120 121 122 124 125 127 129 131 1321,376 133 135 136 137 139 140 142 143 144 1461,377 147 149 151 152 154 155 157 160 162 1651,378 167 170 172 175 177 180 182 185 187 1901,379 193 196 199 202 205 208 210 213 216 2191,380 222 224 227 229 232 235 237 241 244 2481,381 251 254 258 261 265 269 272 276 280 2851,382 289 293 298 303 308 313 319 324 330 3361,383 341 346 352 358 364 370 376 382 388 3951,384 401 407 412 418 425 432 439 447 455 4631,385 472 480 490 500 509 518 527 535 543 5511,386 558 566 574 582 589 596 603 610 618 6251,387 632 640 648 658 667 676 685 693 703 7141,388 724 734 744 755 764 773 782 792 802 8121,389 824 837 849 861 874 887 900 914 928 9411,390 955 967 980 994 1,008 1,021 1,034 1,047 1,062 1,0751,391 1,088 1,102 1,117 1,131 1,143 1,154 1,167 1,180 1,193 1,2071,392 1,219 1,231 1,242 1,253 1,265 1,279 1,291 1,302 1,315 1,3271,393 1,338 1,349 1,361 1,374 1,386 1,399 1,413 1,426 1,440 1,4521,394 1,465 1,479 1,492 1,504 1,517 1,529 1,541 1,553 1,564 1,5751,395 1,586 1,596 1,607 1,617 1,627 1,638 1,649 1,660 1,671 1,6841,396 1,695 1,707 1,719 1,731 1,744 1,756 1,770 1,781 1,792 1,8021,397 1,812 1,821 1,832 1,841 1,852 1,862 1,874 1,885 1,896 1,9071,398 1,919 1,931 1,942 1,953 1,965 1,977 1,989 2,002 2,016 2,0301,399 2,046 2,060 2,074 2,088 2,102 2,116 2,131 2,146 2,162 2,1831,400 2,200 2,218 2,236 2,253 2,270 2,288 2,309 2,331 2,353 2,3771,401 2,403 2,428 2,454 2,471 2,488 2,504 2,519 2,533 2,550 2,5641,402 2,578 2,590 2,601 2,612 2,622 2,634 2,645 2,656 2,667 2,6801,403 2,692 2,704 2,716 2,729 2,742 2,756 2,771 2,785 2,798 2,8111,404 2,824 2,837 2,851 2,865 2,881 2,897 2,912 2,927 2,944 2,9601,405 2,975 2,992 3,010 3,028 3,047 3,064 3,083 3,100 3,119 3,1371,406 3,156 3,177 3,197 3,216 3,235 3,255 3,275 3,294 3,314 3,3331,407 3,352 3,371 3,388 3,405 3,421 3,436 3,451 3,467 3,484 3,5011,408 3,518 3,537 3,554 3,570 3,587 3,604 3,623 3,639 3,654 3,6691,409 3,685 3,701 3,715 3,728 3,741 3,754 3,768 3,781 3,795 3,8091,410 3,823 3,837 3,851 3,865 3,880 3,894 3,909 3,924 3,940 3,9551,411 3,971 3,987 4,003 4,018 4,035 4,051 4,068 4,086 4,104 4,1221,412 4,141 4,160 4,179 4,200 4,220 4,243 4,263 4,284 4,304 4,3251,413 4,345 4,366 4,387 4,407 4,428 4,448 4,469 4,489 4,510 4,5311,414 4,551 4,572 4,592 4,613 4,633 4,654 4,675 4,695 4,716 4,7361,415 4,757 4,777 4,798 4,819 4,839 4,860 4,880 4,901 4,921 4,942
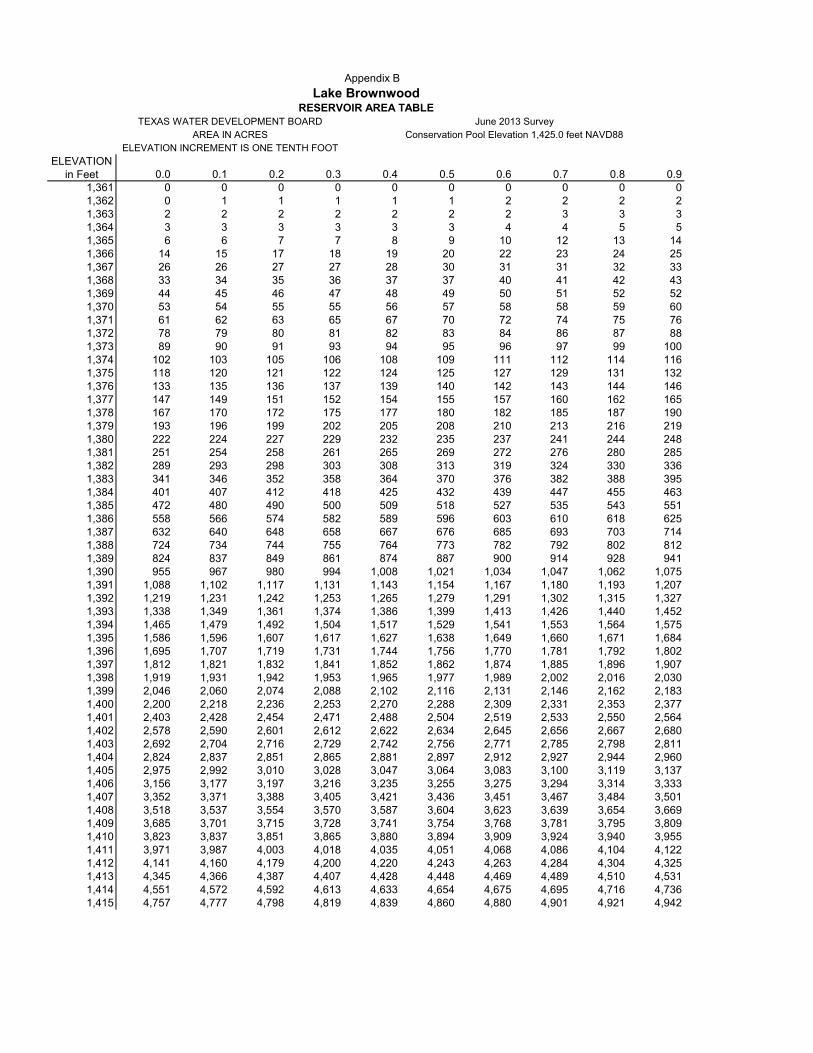
Appendix BLake Brownwood
RESERVOIR AREA TABLETEXAS WATER DEVELOPMENT BOARD June 2013 Survey
AREA IN ACRES Conservation Pool Elevation 1,425.0 feet NAVD88ELEVATION INCREMENT IS ONE TENTH FOOT

ELEVATION in Feet 0.0 0.1 0.2 0.3 0.4 0.5 0.6 0.7 0.8 0.9
1,416 4,963 4,983 5,004 5,024 5,045 5,065 5,086 5,107 5,127 5,1481,417 5,168 5,189 5,209 5,230 5,251 5,271 5,292 5,312 5,333 5,3531,418 5,374 5,395 5,415 5,436 5,456 5,477 5,497 5,518 5,539 5,5591,419 5,580 5,600 5,621 5,641 5,662 5,683 5,703 5,724 5,744 5,7651,420 5,785 5,806 5,827 5,847 5,868 5,888 5,909 5,929 5,950 5,9711,421 5,991 6,012 6,032 6,053 6,073 6,094 6,115 6,135 6,156 6,1761,422 6,197 6,217 6,238 6,259 6,279 6,300 6,320 6,341 6,361 6,3821,423 6,403 6,423 6,444 6,464 6,485 6,505 6,526 6,547 6,567 6,5881,424 6,608 6,629 6,649 6,670 6,691 6,711 6,732 6,752 6,773 6,7931,425 6,814 6,835 6,855 6,876 6,896 6,917 6,937 6,958
AREA IN ACRES Conservation Pool Elevation 1,425.0 feet NAVD88ELEVATION INCREMENT IS ONE TENTH FOOT
Note: Areas above elevation 1,412.5 feet interpolated
TEXAS WATER DEVELOPMENT BOARD June 2013 Survey
Appendix B (continued)Lake Brownwood
RESERVOIR AREA TABLE

0
10000
20000
30000
40000
50000
60000
70000
80000
90000
100000
110000
120000
130000
140000
1360 1370 1380 1390 1400 1410 1420 1430
Stor
age
capa
city
(acr
e-fe
et)
Elevation (feet above mean sea level)
Total capacity 2013 Conservation pool elevation 1,425.0 feet NAVD88
Lake Brownwood June 2013 Survey Prepared by: TWDB
Appendix C: Capacity curve

0
1000
2000
3000
4000
5000
6000
7000
1360 1370 1380 1390 1400 1410 1420 1430
Area
(acr
es)
Elevation (feet above mean sea level)
Total area 2013 Conservation pool elevation 1,425.0 feet NAVD88
Lake Brownwood June 2013 Survey Prepared by: TWDB
Appendix D: Area curve

2,660,000
2,660,000
2,675,000
2,675,000
2,690,000
2,690,000
2,705,000
2,705,000
10,63
0,000
10,63
0,000
10,64
5,000
10,64
5,000
10,66
0,000
10,66
0,000
1375
1370
1380
1390
1400
1410
1420
13651385
1390
1395
1400
1405
1410
1415
1420
1405
1400
1395
13951390
1410
14001405
14101415
1420
1400
1400
1405
1405
1410
14101415
1420
1420
1415
1390
1385
Figure 6 Lake Brownwood5' - contour map
This map is the product of a survey conducted bythe Texas Water Development Board's Hydrographic
Survey Program to determine the capacity of Lake Brownwood. The Texas Water
Development Board makes no representations norassumes any liability.
Conservation Pool Elevation 1,425.0 feet NAVD88
Projection: NAD83State Plane
Texas Central Zone
(feet NAVD88)CONTOURS
Islands
0 1 20.5Miles
N
June 2013 survey
Lake BrownwoodElevation 1,425.7 feetNAVD88
1425142014151410140514001395139013851380137513701365
Brown County