june 2015 pricing portfolios constructed on cyclicality
TRANSCRIPT

1
Thesis Paper for Master program in finance
Authors: Alexandros Spanoudis & Shant Sanossian
June 2015
Pricing Portfolios Constructed on Cyclicality Considerations
Using Non-Domestic Regional Factors:
Evidence from Eurozone Region
Supervisor: Lu Liu

2
Abstract
This research paper tests the traditional market based pricing models and their ability to
explain the return on portfolios constructed on cyclicality basis in the Eurozone region. The
paper goes beyond the domestic market portfolios (indices) regularly used for asset pricing to
the more regional or international approach of asset pricing through using regional market
portfolios as a predictor factor as a potential indicator of the Eurozone economic integration
level. The paper tests both conditional and unconditional asset pricing approaches using
returns over two portfolios, Cyclical and Defensive, which contain the entire Eurozone equity
market securities over the period between 2001 and 2012. Further we separate out test period
in two economic cycle phases (expansion and recession) and three instability periods. Both
non-conditional CAPM and Fama and French three factor models proved different kind of
inefficiency to price portfolios based on cyclicality. Both CAPM and FF3M proved high
pricing error (significant alphas) for the cyclical portfolio however insignificant pricing error
(insignificant alphas) for the defensive portfolio during all total/recession/expansion periods.
The STOXX Europe 600 proved to be a significant predictor variable for cyclical portfolios
during all total/recession/expansion periods while very low statistically significance for
defensive portfolios for all total/recession/expansion periods.
Keywords: Capital Asset Pricing Model, Fama French Three Factor Models, Conditional
Capital Asset Pricing Model, Conditional Fama French Three Factor Models, Cyclical
Portfolios pricing, Defensive portfolios pricing, Eurozone, STOXX 600 Europe.

3
1. Contents
2. Introduction ......................................................................................................................... 4
3. Literature Review ................................................................................................................ 6
3.1. The Mean-Variance Criterion and Portfolio Selection Theories ................................. 6
3.2. The rise of CAPM ........................................................................................................ 7
3.2.1. Return trends observations and CAPM critics ..................................................... 9
3.3. The Fama and French Three Factor Model ............................................................... 10
3.3.1. Fama French Tree Factor Model and its explanation power .............................. 10
3.4. Comparison between the CAPM and Fama French Three Factor Model ................. 12
3.5. The introduction of the Conditional Asset Pricing .................................................... 12
4. Methodology ..................................................................................................................... 14
5. Data ................................................................................................................................... 17
5.1. Dependent Variables .................................................................................................. 17
5.2. Independent Variables ............................................................................................... 18
5.3. Economic Instruments ............................................................................................... 19
6. Empirical Results .............................................................................................................. 20
6.1. Unconditional Asset Pricing ...................................................................................... 20
6.1.1. Total Period 2001-2012 ...................................................................................... 20
6.1.2. Sub period 2001-1007 (Expansion) .................................................................... 21
6.1.3. Sub period 2008-2012 (Recession) .................................................................... 22
6.2. Conditional Tests ....................................................................................................... 24
6.2.1. Total Period 2001-2012 ...................................................................................... 24
6.2.2. Sub period 2001-2007 (Expansion) .................................................................... 26
6.2.3. Sub Period 2008-2012 (Recession) .................................................................... 28
7. Conclusion ........................................................................................................................ 31
8. References ......................................................................................................................... 32
9. Appendices ........................................................................................................................ 36

4
2. Introduction
Our thesis aims to find the first the appropriate conditional or unconditional asset pricing
model to be used in determining the required rate of return for valuation or asset management
purposes for portfolios mainly built on the cyclicality consideration such as, defensive stocks,
and geographically diversified stocks in many European markets at the same time. Second,
our papers’ aim is to test the international version (European) of the traditional asset pricing
models instead of the well-known and well tested local pricing models. For this purpose we
use regional rather than local explanatory variables, which could be an indicator of integration
level of the testing region (Eurozone) after the currency and economic unity during the last
decades.
The test will include portfolios constructed using the entire listed stocks in the Eurozone
market in both expansion and recession economic phases for different equity classes classified
by CAPM market beta. The models tested in our thesis are the Capital Asset Pricing Model –
CAPM as (WF. Sharpe, 1964) & (J. Lintner, 1965), Fama French Three Factor Model (E.
Fama, K. French 1993), in addition to the Conditional CAPM and Conditional Fama French
(W. Ferson, C. Harvey, 1999).
Since the sixties of the last century, researchers’ interest was accelerated in empirical studies
and theories in modeling the risk characteristics of stocks in valuation (A. Perold, 2004),the
raise of “Decision Making under Uncertainty” theories (A. Perold, 2004) and the Efficient
Market Hypothesis.
From the empirical papers we notice different stock return patterns. Stock groups follow
return patterns such as high future returns are followed by long period of low past returns (W.
De Bondt, R. Thaler, 1985), and that short term returns in the last twelve months tend to
continue (N. Jegadeesh, S. Titman, 1993).
Moreover, we observe a pattern between returns and stock characteristics classification. A
size premium was introduced for small cap shares comparing to big cap shares (R.W. Banz,
1981). A return premium of stocks with high BE/ME ratio (P. Rosenberg, K. Reid, R.
Lanstein, 1985), the expected return on equity shares are positively related to Debt/Equity
ratio (L.C. Bhandari, 1988). Stock market liquidity could also characterized through a
premium which was added to the FF three factor model by (Pastor & Stanbaugh, 2004)
E. Fama & K. French through their research in 2004, they presented many shortcomings of
CAPM which through its single explanatory factor failed to prove good empirical results in

5
explaining the return variations and its related patters mentioned above, and they called them
the “anomalies” (E. Fama & K. French, 1996).
The three factor model explains the reversal long term return pattern (W. DeBondt, R. Thaler,
1985) through its HML factor. The model also explains the small firms return premium as
small corporations have higher risk and tend to load positively on the SMB factor, and this is
consistent with the findings of Banz in 1981. FF three factor model also gives contradictory
expectation to the continuing pattern of short term returns in the future (N. Jegadeesh, S.
Titman, 1993), as strong corporations that have high short term returns in the past will have
low BE/ME and thus negative slope for the HML factor.
Through our literature review during the past weeks, we notice that researchers used to test
and compare the explanatory power of well-known asset pricing models through portfolios
based on mainly on size and market multiples (E. Fama, K. French, 1993). We have read
already many thesis projects which compared models through portfolios based on geographic
area such as Canadian market (K. Lam 2005), US market (C. Eriksson, 2013), Norwegian
market (E. Rossvoll, 2013), Finish Market (M. Paavola, 2007), Swedish market (D. Kilsgård,
F. Wittorf, 2010), Greek market (N. Theriou, V. Aggelidis, T. Spiridis, 2004). Many other
people tested these models using sectorial portfolios (V. Kapur, 2007), pro-cyclical stocks
portfolios from UK market (C. Budianschi, L. Kocarev, 2013).
Reviewing the academic literature related to asset pricing models many researchers mention
that special stocks categorized on cyclicality could have special characteristics as same as size
and growth. Also, another notable observation is that the previous researches do not cover
much the defensive stocks (or portfolios constructed on cyclicality considerations) as a
potential special stocks group.
In this paper we aim to answer some critical questions concerning asset pricing models: Does
the introduction of conditional version of asset pricing models enhance the model explanation
power taking in consideration non-stable periods? Does the introduction of macro-economic
instruments lengthen the age of models through more stable coefficient? Which model has the
best fit to each of the constructed portfolios at different market conditions?

6
3. Literature Review
Asset valuation and required returns on investment was a hot topic and debate area in
researchers’ communities since the rise of the capital markets in the 16th century in Europe
(de la Vega, 1688). The main question was how the risk is considered to effect the investment
value (A. Perold, 2004). Researches accelerated in the second half of the twentieth century
starting with Neumann and Morgenstern in 1944 and Savage in 1954 (A. Perold, 2004).
Before this time there were no sufficient and accurate measuring tools for the required rate of
returns on the listed stocks (L. Fisher, J.H. Lorie, 1964). The efficient capital markets theories
were established to test and identify where the securities prices efficiently reflect all available
information (EF. Fama, 1970). In addition Sharpe, Lintner and Scholes introduced the capital
asset pricing theory (EF Fama, K. French, 2004). The importance of required return concept
comes from the fact that many financial decisions for example, capital budgeting,
performance evaluation and actions are strongly related to it (J. Bartholdy, P. Peare, 2003)
since researchers observe that the value of any investment is related to how much its returns
cover its capital cost (Dangerfield, Merk, Narayanaswamy, 1999). However, the valuation
process is highly sensitive to the estimated input variables (M. Goedhart, T. Koller, D.
Wessels, 2005).
3.1. The Mean-Variance Criterion and Portfolio Selection Theories
The birth of Mean-Variance criterion was the base of the modern asset pricing theory, when
Harry Markowitz in his paper of Portfolio Selection introduced that any rational investor
would consider two dimensions in any investment, the expected return as a desired factor and
the variance of return as an undesired factor (H. Markowitz, 1952 – 1959) (R. Roy, 1952)
based on the utility theory (O. Morgenstern, L. Von Neumann, 1953). They assumed that
investors are risk averse and they would chose efficient portfolios where the expected return
to each level of variance is maximized. The portfolio theory assumed that the risk could be
eliminated through diversification and investment allocation between many uncorrelated
assets (H. Markowitz, 1952). Theory also found that diversification would not make risk
totally disappeared as the portfolio overall would be correlated with the market portfolio. This
was the cornerstone of the Tobin’s theorem which assumes that rational risk averse investors
would maximize their utility by holding a portfolio consists of a long position in a portfolio
with the highest sharpe ratio in the universe through borrowing or lending.

7
Two additional assumptions where added during the next few years through (WF Sharpe,
1964) and (J. Lintner, 1965) to the original portfolio theory of Markowitz which are the
availability of a risk free security which investors could invest or borrow unlimitedly, and the
homogenous expectations of all investors about the returns distribution during the past and
assuming that this distributions are true and reliable in the future. All assumptions together
suppose that the portfolio with the maximum sharpe ratio is the value weighted market
portfolio which all investors tend to hold (A. Perold, 2004).
3.2. The rise of CAPM
At an early stage was found that the average return on common stocks is higher than the less
risky alternative investment opportunities (L. Fisher, J.H. Lorie, 1964), but the equity
investment premium was first introduced by in 1976 where noticed that the mean annual
return on the S&P 500 index was around 10.9 percent during the period between 1926 and
1974 which was higher than the risk free return of around 8.8 percent (R. Ibbotson, R.
Sinquefield, 1976). Observations above, in addition to the Markowitz mean-variance
criterion, made the base of the first asset pricing model, the Capital Asset Pricing Model,
which is an efficient market model centered by the idea that the rational investors will form a
portfolio of that minimizes the return risk at any given expected return and maximizes the
expected return and any risk level (E.F. Fama, K. French, 2003). The CAPM was developed
independently through Sharpe (1964), Lintner (1965), and Black (1972) to model better the
mean-variance concept of Markowitz (1959). Theory assumes that the return on all listed
stocks are positively linearly related to the excess return of Markowitz’ introduced efficient
market portfolio through the slope coefficient of β which is assumed to be a sufficient
indicator of the return expected on holding any security. This means that the excess return of
market portfolio alone can explain the return on any other security or portfolio. The expected
rate of return on the security 𝑖 is given by the following equation, which is also referred to as
the Security Market Line:
𝐸(𝑅𝑖𝑡) = 𝑅𝑓,𝑡−1 + 𝛽𝑖(𝐸(𝑅𝑚𝑡) − 𝑅𝑓,𝑡−1), 𝑖 = 1,2, … ,𝑁 (1)
𝑅𝑓 is simply the risk free rate of return which is certain and uncorrelated with the market
portfolio return. This asset is difficult to find but short term government bills could be used as
a benchmark. 𝐸(𝑅𝑖) is the expected rate of return on the asset 𝑖. The equation above simply
tests the relation between the excess rate of return on the stock 𝑖 through [𝐸(𝑅𝑖) − 𝑅𝑓] and the

8
excess market return [𝐸(𝑅𝑚) − 𝑅𝑓] through the market beta 𝛽𝑖. The 𝛽𝑖 is the simple
regressions coefficient of the security 𝑖 returns as dependent variable on the excess market
returns as independent variable, and calculated as following:
𝛽𝑖 =𝐶𝑜𝑣𝑅𝑖𝑡,𝑅𝑚𝑡
𝑉𝑎𝑟𝑅𝑚𝑡
(2)
The beta coefficient 𝛽𝑖 measures the linear relationship between the return on the asset 𝑅𝑖 and
the return on the market portfolio𝑅𝑚, and also measures the systematic risk which is unable to
be reduced through diversification. In other word, we can say that CAPM prices the assets in
equilibrium (V. Bawa, E. Lindenberg, 1977) and only the systematic risk is priced. So if
CAPM holds, the market portfolio is enough to explain the excess return on the assets through
the equation:
𝐸(𝑅𝑖𝑡) − 𝑅𝑓,𝑡−1 = 𝛼𝑖𝑡 + 𝛽𝑖(𝐸(𝑅𝑚𝑡) − 𝑅𝑓,𝑡−1) (3)
No abnormal return is expected according to the formula above. This will be the base of our
test in the methodology part.
Through decades the CAPM was tested by big number of researchers using historical data
representing the returns of securities listed in different markets located in different geographic
regions and from different periods of times, in addition to the relative market index historic
returns (G. P. Diacogiannis, 1994).
The CAPM is considered as one of the easiest asset pricing models because of its
mathematical simplicity. That’s why it is widely used among financial professionals in
various areas such as capital budgeting, valuation and portfolio management (M. Chen, 2003).
A research done during 2003 confirmed that 73.5% out of 392 CFOs in the United States of
America use the CAPM as a main tool to determine the cost of capital (J. Graham, C. Harvey,
2003). A similar study also was conducted in the European market, which noticed that around
45% of the firms use the CAPM also to calculate the cost of capital (D. Broumen, A De Jong,
KCG. Koedijk, 2004). There are many reasons that make CAPM popular. One reason is that
CAPM is based on the fact that the other alternative models do not show better empirical
results that CAPM. That alternative models lack the intuitive appeal of the CAPM, and finally
that the empirical proofs against CAPM are unclear and not well justified (R. Jagannathan, Z.
Wang, 1996).

9
CAPM was extended and modified by many scientists such as removing the riskless asset
(Black, 1972), by introducing nonmarketable assets (D. Mayers, 1973), or introducing
international investments (B.H. Solnik, 1974).
3.2.1. Return trends observations and CAPM critics
During the last two decades from the last century many researches concentrated in testing the
returns patterns and behavior through time (EF. Fama, K French, 1996). Many of them
confirmed that the CAPM itself was unable to explain many return trends and the market beta
itself was not a sufficient factor to expect the required rate of return on the equity securities.
Some examples of these patterns are that returns are expected to be high in the future when
low returns were observed for long period of time in the past (W. De Bondt & R. Thaler,
1985).Also, returns observed during the last twelve months is expected to continue at the
same pattern (N. Jegadeesh, S. Titman, 1993), and that the listed equity shares of small
companies proved to outperform by its return on the returns of listed equity share of huge
companies (R.W. Banz, 1981). Banz researched in 1981 was an early warning that the size of
the company could be priced and could have a risk premium indicating that the CAPM with
its single explanatory variable is unable to explain. The problem was that Banz was unable to
provide any empirical or academic support whether this premium was a result of the size of it
is as a proxy or another factor is related to the size and is unknown. Some other researchers
tested the multiples effect on the asset pricing and if any premiums are present such as the
observation that listed equity shares with higher E/P has a return premium compared to the
listed equity shares with lower E/P (M. Reinganum, 1981) (S. Basu, 1983). Other scholars
assumed that the high BE/ME ratio has a return premium also (P. Rosenberg, K. Reid and R.
Lanstein, 1985), companies with low E/P ratios and high BE/ME yield and low Dividend/P
has in general higher risk adjusted returns on its common listed stocks (Lakonishok, Shleifer
& Vishny, 1994), others found that there is a positive relation between the Debt/Equity ratio
and the expected rate of return on equity shares (L.C. Bhandari, 1988).
Eugene Fama and Kenneth French through their publication titled “The Capital Assets Pricing
Model: Theory and Evidence” during 2004 highlighted many weaknesses of the CAPM and
proved its inability through its single factor model to explain most of the return patterns
mentioned above. They also introduced the “anomalies” terminology on these patterns (E.
Fama, K. French, 1996). The CAPM is considered by many researches as an over simplified
model that assumes some unrealistic assumption such as market equilibrium and investors

10
rationalism without taking in consideration some proved facts such as the emotional effects on
the returns (Lakonishok, Shleifer, Vishny, 1994)
3.3. The Fama and French Three Factor Model
This asset pricing model was first developed and introduced by Keneth French and Eugene
Fama during 1993. The main objective of this model was to solve the mystery of anomalies
that made the explanation by using the simple one factor traditional CAPM not possible in
many markets and in many different periods. They proved that in NYSE and NASDAQ
during the period between from 1962 to 1989 the average returns were not correlated with the
market beta of socks but more correlated with company size and BE/ME ratio (EF. Fama, K.
French, 1992). According to their research the expected return on any risky security could be
linearly explain through three independent variable which are the return on the same market
portfolio of the CAPM model in addition to the introduction of two new variables mainly
calculated for the use of this model and mainly related to the corporate size and ME/ME., the
model is given through the following equation:
𝐸(𝑅𝑖) − 𝑅𝑓 = 𝑏𝑖[𝐸(𝑅𝑀) − 𝑅𝑓] + 𝑠𝑖𝐸(𝑆𝑀𝐵) + ℎ𝑖𝐸(𝐻𝑀𝐿) (4)
The dependent variable in this model is the expected excess return on the risky security or
portfolio given by 𝐸(𝑅𝑖) − 𝑅𝑓. The independent variables are the expected excess return on
the CAPM’s market portfolio, the expected return premium for the exposure related to the
size of the company that issues the security represented by the 𝐸(𝑆𝑀𝐵) which is calculated
by subtracting the average returns on the big companies in the whole market by the returns on
the small companies (Small minus Big) (EF. Fama, K. Fama, 1993), and the expected return
premium for the exposure to companies with high BE/ME ratio and calculated by the average
return on the portfolios with high BE/ME ratio minus the return on the portfolios with the low
BE/ME ratio (High minus Low) (EF. Fama, K. Fama, 1993). We can summarize the
mentioned above by the fact that the HML variable captures the effect of valuation, and the
SMB variable captures the effect of size mentioned in the anomalies researches (Koller et al,
2010).
3.3.1. Fama French Tree Factor Model and its explanation power
The new asset pricing three factor model introduced by Fama and French showed better
explanation power comparing to the traditional CAPM. In addition, Fama and French Three
Factor Model depicted a better explanation power and portfolio management evaluation

11
ability for portfolios made on consideration of corporate size and/or the Book to Market of
equity ratio (EF. Fama, K. French, 1993). In their empirical paper they proved much better
results for evaluating or explaining the returns on portfolios classified by industries (EF.
Fama, K. French, 1994) and better results for portfolios constructed on many other
consideration such as sales growth, CF/P and E/P etc. (EF. Fama, K. French, 1996). The last
findings could be logically justified by the idea that sales growth, CF/P and E/P are all
significantly correlated to the BE/ME ratio which is a main factor in the Fama and French
Three Factor Model represented by the (HML). Corporations with weak perspectives has
generally higher E/P ratio, higher CF/P ratio and lower revenue growth ratio this place them
in the high BE/ME category securities. This is the logic behind the negative beta of HML
independent variable found by Fama and French (EF. Fama, K. French, 1996). This also
supports the assumptions and finding of many researches that investors tend to ask less return
on the share with high growth perspective and thus over value such securities and vice versa
(J. Lakonishok, A. Shleifer, R.W. Vishny, 1994).
As previously mentioned many unexplained return pattern was observed such as the statistical
findings that the short term return of risk securities tend to continue in the near future (N.
Jegadeesh, S. Titman, 1993), but the Fama and French Three Factor Model was unable to
explain this pattern (EF. Fama, K. French, 1996).
Other critical point and debate area is the fact that the model completely relies on the
hypothesis of efficient market where it assumes that any excess return could be generated by
bearing higher risk and assumes that both the size and the BE/ME factors are benchmark to
different kind of risks and should have return premium. According to many empirical findings
the value strategies outperform the market but this does not for sure reflect higher risk
associated with the investment (J. Lakonishok, A. Shleifer, R.W. Vishny, 1994), this fact
makes the model academically nonsense. Another shortcoming could be that the return
premium is based on the overreaction hypothesis that assumes that investors exaggerate by the
reaction to bad news and future expectation (F.M. De Bondt, R. Thaler, 1985).
Even though many studies during the last two decades illustrated that the Fama French Three
Factor Model has a very good explanatory power for risk securities returns (M. Drew, T.
Naughton, M. Veeraraghavan, 2003), many studies confirmed that the model’s result could be
driven by the sample of data used (A. C. MacKinlay, 1994)

12
3.4. Comparison between the CAPM and Fama French Three Factor Model
During the last two decades a big amount of studies took place by big number of researchers
who compared the performance of the CAPM with the FF 3 factor model using data from
different geographic regions, different periods and different market conditions. For example a
study took place on the Brazilian market’s stock returns and found that the CAPM beta nad
the Fama French Size and value factors were significant explanatory factors for many samples
taken from many different periods (A. Da Silva, 2008). Another study on the Australian
market compared the CAPM and the marginal explanatory power of four addition factors
which are the size, the book to market and the momentum with the assumption of the time
varying factor loadings and they found that these additional factors have high significant
marginal explanatory power during the period from 1992 to 2005 (K. Kassimatis, 2008).
Through the review for the available literature, we found that even though a lot of researches
took place in almost all European individual markets, but we noticed that rarely researchers
tested the performance of asset pricing models on well diversified portfolios with allocation in
stocks in all European markets together. In 1972 a research was done to test the CAPM
individually on eight different European major markets using data from 1966 to 1971 in order
to test whether the efficient market hypothesis is still valid in European less efficient markets
than the US market (F. Modigliani, G. Pogue, B. Solnik, 1972) this test implemented using
local market indexes and not integrated European index, and found that the systematic risk
represented by the market beta is significant explanatory factor for European securities except
Germany. Some other studied the fact of using the European factors (e.g. HML, SMB) instead
of individual country factors to expect stock returns in all the Eurozone countries and found
that the Eurozone did not show significant integration after the monetary unity and the unified
European Fama & French Three Factor model is not performing well (B. Akgul, 2013).
3.5. The introduction of the Conditional Asset Pricing
Many researchers agreed that the performance of the traditional CAPM is poor. They
suggested that the failure of CAPM may be due to its static nature and its main assumptions of
a stable beta and risk premium. The conditional asset pricing model idea is based on the
assumption that loadings on the explanatory variables that are used in asset pricing models
predict the return change and vary over time according to the business cycles (R. Jagannathan,
Z. Wang, 1996). Many of these new models rely mainly on the same existing factors of the
conventional asset pricing models (W. Ferson, C. Harvey, 1999) but instead concentrate in
reflecting return patterns using lagged macro-economic instruments. This is based on the

13
assumption that the betas and thus the predicted returns from the model could vary according
to the available information and news in different periods of time (R. Jagannathan, Z. Wang,
1996). Jagannathan and Wang, (1996) allowed the beta to vary over time by explaining that
the relative risk and the expected excess return of a specific asset could vary through different
economic periods. They assumed that would be better to use all available information and
other variables to form expectations by using conditional moments
These macro-economic lagged instruments were used also by many old researches as Fama
and French during 1988 and 1989. Many researchers did their study on this idea and found,
for instance, that stock covariances with working power income could have a substantial
influence in the United States (R. Jagannathan, Z. Wang, 1996) or in Japan (R. Jagannathan,
K. Kubota, H. Takehara, 1998).
Additionally, Ferson and Harvey (1999) found that there are some proxies, related to
particular lagged instruments, for time variation in expected returns that could have an
implication impact while testing cross-sectional returns.

14
4. Methodology
The CAPM is mainly based on the assumption of market efficiency, that all investors have
homogenous expectations in addition to the risk reverse behavior represented by a strictly
increasing concave utility function. Investors will to invest in assets desiring highest possible
return to the lowest possible risk. Based on these assumptions, investors will hold a portfolio
consisting of risk free asset in addition to an optimal portfolio represented in the market
portfolio which is located in the efficient mean-variance frontier. In order this to exist,
according to the Sharpe (1964) and Lintner (1965), investors can lend and borrow unlimitedly
at the risk free rate and they will now hold any portfolio with an expected rate of return below
the risk free rate.
The CAPM test methodology of time series regressions of excess security return as a
dependent variable and the excess market portfolio return as independent variable was
introduced in 1972 by Black, Scholes and Jensen.
[𝐸(𝑅𝑖𝑡) − 𝑅𝑓,𝑡−1] = 𝛼𝑖 + 𝛽𝑖[𝐸(𝑅𝑚𝑡) − 𝑅𝑓,𝑡] + 𝜀𝑖𝑡, 𝑖 = 1,2, … ,𝑁 (5)
Where the [𝐸(𝑅𝑚𝑡) − 𝑅𝑓𝑡] is the expected excess return on the market portfolio at time𝑡 on
the risk free rate of return, the [𝐸(𝑅𝑖𝑡) − 𝑅𝑓,𝑡−1] is the expected excess return on the security
(or portfolio) in the risk free rate of return at time 𝑡, and finally the 𝑅𝑓𝑡 is the risk free rate of
return at time 𝑡. The stock 𝑖 has 𝑁 time series observations. The intercept 𝛼𝑖 is the expected
excess return on the security (or portfolio) when the excess return on the market portfolio is
equal to zero which reflects the abnormal risk adjusted return, which is contradictory with the
CAPM assumption of the efficient market hypothesis, that’s why here it is a measure of
pricing error of the expected returns. So logically if the CAPM assumption of efficient market
hypothesis holds then the intercept coefficient should not be significantly different from zero.
𝐻0: 𝛼𝑖𝑡 = 0,𝐻1: 𝛼𝑖𝑡 ≠ 0
The Fama French Three Factor Models test methodology is very similar to the CAPM
methodology, where also we test the time series regression of the excess security returns as a
dependent variable but with three different independent variables which are the excess market
portfolio return and the SMB and HML:
[𝐸(𝑅𝑖𝑡) − 𝑅𝑓,𝑡−1] = 𝛼𝑖 + 𝛽𝑖[𝐸(𝑅𝑚𝑡) − 𝑅𝑓,𝑡] + 𝑠𝑗𝑆𝑀𝐵𝑡 + ℎ𝑗𝐻𝑀𝐿𝑡 + 𝜀𝑖𝑡, 𝑖 = 1,2, … ,𝑁 (6)

15
Where the [𝐸(𝑅𝑚𝑡) − 𝑅𝑓𝑡] is the expected excess return on the market portfolio at time 𝑡 on
the risk free rate of return, the [𝐸(𝑅𝑖𝑡) − 𝑅𝑓,𝑡−1] is the expected excess return on the security
(or portfolio) in the risk free rate of return at time 𝑡, the 𝑅𝑓𝑡 is the risk free rate of return at
time 𝑡, 𝑆𝑀𝐵𝑡 is the difference between the average returns on small size portfolios and the
returns on the big size portfolios (Small minus Big) at time 𝑡, and finally, the 𝐻𝑀𝐿𝑡 which is
the difference in the average return of the portfolios with high BE/ME ratio and the average
return on the portfolios with low BE/ME ratio. The stock 𝑖 has 𝑁 time series observations.
The intercept 𝛼𝑖 is the expected excess return on the security (or portfolio) when the excess
return on the market portfolio is equal to zero which reflects the abnormal risk adjusted
return, which is contradictory with the Fama French Three Factor Model assumption of the
efficient market hypothesis, that’s why here it is a measure of pricing error of the expected
returns. So logically if the Fama French Three Factor Model assumption of efficient market
hypothesis holds then the intercept coefficient should not be significantly different from zero.
One way to test empirically the condition CAPM and Fama and French three factor models is
by letting the covariance of the equity stocks returns to vary through time horizon. There are
different methods to test the conditional asset pricing models. In our paper we used the
method introduced by Ferson and Harvey (1999). In this method and in contrary to the
unconditional asset pricing models the main assumption is that the market beta and pricing
error (α) vary across time as will be shown in the following equations:
𝑅𝑖𝑡 = 𝛼𝑖 + 𝛽𝑖𝑅𝑚𝑡 + 𝜀𝑖𝑡 (7)
By allowing the market beta and pricing error (α) vary across time the equation (7) will be:
𝑅𝑖𝑡 = 𝛼𝑖𝑡 + 𝛽𝑖𝑡𝑅𝑚𝑡 + 𝜀𝑖 (8)
𝛼𝑖𝑡 = 𝛼𝑖0 + 𝛼𝑖1′ 𝑍𝑡−1 (9)
𝛽𝑖𝑡 = 𝛽𝑖0 + 𝛽𝑖1′ 𝑍𝑡−1 (10)
Where 𝑍𝑡−1 is a 𝐿 ∗ 1 vector of the values of economic variables (instruments) available at the
previous period of 𝑡 − 1. 𝛼1𝑖 and 𝛽1𝑖 are also 𝐿 ∗ 1 vector of the parameters. The idea of this
method is that even though the parameters vary through time, the relationship between the
parameters and the lagged economic instruments will remain constant over time. Combining

16
the equations above we end up to the following equation taking in consideration of only one
economic instrument:
𝑟𝑖,𝑡+1 = (𝛼0𝑖 + 𝛼1𝑖′ 𝑍𝑡) + (𝑏0𝑖 + 𝑑1𝑖
′ 𝑍𝑡)𝑟𝑝,𝑡+1 + 𝜀𝑖,𝑡+1 (11)
In our paper we combined three different lagged economic instruments for both CAPM and
Fama and French three Factor Models which are the credit yield spread between Aaa rated
corporate bonds and Baa rated corporate bonds, the difference of government bond yield
between 10-year and 1-year maturity and the market dividend yield.
The new created parameters are estimated using OLS linear regression with seven explanatory
variables for the conditional CAPM and fifteen explanatory variables for the Fama and French
Three Factors Models. The null hypothesis is the same for all before, that the intercept alpha
is equal to zero.

17
5. Data
The thesis will use monthly frequency for all dependent and independent variables using data
from the entire Eurozone region in a period from beginning of 2001 to the end of 2012. This
period was chosen carefully because it reflects equally weighted expansion period and
recession period in addition to three different instability period which are beginning of 2000
(Dot Com Crisis), 2008 (financial crisis and economic downturn) in addition to the Euro crisis
during 2011.
All same tests will be done on three periods, one for the total period from 2001 to 2012,
another for the expansion period (from 2001 to 2007) and finally the recession period from
2008 to 2012. The idea behind this division is to test the asset pricing performance of the used
models in different market conditions, and how the conditional instruments playing a role in
enhancing the explanation power the models.
The Eurozone countries on the thesis date were as following: Austria, Belgium, Cyprus,
Estonia, Finland, France, Germany, Greece, Ireland, Italy, Latvia, Lithuania, Luxemburg,
Malta, Netherland, Portugal, Slovakia, Slovenia and Spain.
5.1. Dependent Variables
The dependent variable in all models is the same which is the monthly excess return of the
constructed portfolio on the risk free rate of return. Two different portfolios were constructed
using all listed stocks in the entire Eurozone (contains totally 2262 Stocks). Portfolios are
constructed on the cyclicality consideration using the market beta of the Worldscope which is
calculated using 23-35 consecutive monthly return data and local indexes. The defensive
stocks portfolio which is our main interest consist of 1691 stocks build using the
consideration of market beta less than one. The cyclical stocks portfolio consists of 571
stocks. Stocks with market beta exactly equal to 1 were excluded from the population.
Data is collected using Datastream, and monthly returns are calculated using Datasrteam
calculation function directly. The portfolio monthly return was calculated using the UCI
Manager tool at Datastream which is mainly used for equally weighted equity index
calculation purposes.
Our portfolio constructing procedure faced an obvious limitation presented by using current
market beta as definition for cyclicality. These market betas are based on ready betas provided
by Datastream, which are calculated by local market indices during the last three years. We

18
noticed that this parameter is instable through time and might affect our empirical outcomes.
For example, stocks that are considered defensive based on the recent three years data could
be considered as cyclical based on old historical data. Also a defensive stock relative to a
local market index could not have the same cyclicality relative to a regional market index
(STOXX 600 Europe).
5.2. Independent Variables
Market Portfolio
For the return on the market portfolio, we researched for a well-diversified market index. We
used in our thesis the monthly return data of the Dow Jones STOXX Europe 600 from
Datastream.
Risk Free Return
We used the one month German government T-bill as an indicator for the risk free security in
our models. The monthly returns were used.
Fama and French Three Factor Models Specific Factors
We used the SMB and HML monthly data from the official website of Fama and French. The
data used is specific for the main European including non-Eurozone countries (e.g.
Switzerland and UK). Considered countries are: Austria, Belgium, Denmark, Finland, France,
Germany, Greece, Ireland, Italy, the Netherlands, Norway, Portugal, Spain, Sweden,
Switzerland, and the United Kingdom.
Calculation Methodology of Independent Variables – SMB & HML
In out thesis paper we used the SMB and HML factors data directly from the official website
of Fama & French. In order to construct the SMB and HML variables, they divided the equity
securities into two different portfolios according to the size of the corporations (based on the
market capitalization) and then further divided the portfolios into three different portfolios for
each according to the BE/ME ratio. These portfolios are resorted on annual basis on June each
year using the annual statements of all the listed corporations. The breakpoint of the size
factor is 90% of market cap for the bid corporations and the bottom 10% of the small
corporation. On the other hand the breakpoint of the BE/ME factor is 30th percentile and 70th
percentile. Using this classification they form 6 different portfolios (Small/Growth,
Small/Neutral, Small/Value, Big/Growth, Big/Neutral, Big/Value).

19
The SMB (Small minus Big) is the difference of the weighted average return of the three
small size portfolios (Small/Growth, Small/Neutral, Small/Value) and the three big size
portfolios (Big/Growth, Big/Neutral, Big/Value).
𝑆𝑀𝐵 = 13⁄ [Small/Growth, Small/Neutral, Small/Value]
− 13⁄ [Big/Growth, Big/Neutral, Big/Value]
The HML (High minus Low) is the difference between the weighted average return of the two
high BE/ME portfolios (Small/Value, Big/Value) and the two low BE/ME portfolios
(Small/Growth, Big/Growth).
𝑆𝑀𝐵 = 12⁄ [Small/Value, Big/Value] − 1
2⁄ [Small/Growth, Big/Growth]
5.3. Economic Instruments
For the conditional asset pricing models we will use many macro-economic lagged monthly
instruments (W. Ferson, C. Harvey, 1999)
Credit Yield Spread between Aaa rated corporate bonds and Baa rated corporate bonds
This variable is found directly from Datastream, the one used is the yield spread of Moody’s
Aaa and Baa corporate bonds in the US market. Used data are monthly. It worth mentioning
that by lacking data series related to the European market of the corporate credit yield spread
differences might also be a limitation to our study by affecting our empirical results.
Difference of government bond yield between 10-year and 1-year maturity
The German bonds were used in our case. The 10 year bonds yields were taken from
Datastream and the 1 year bonds yields were taken from www.investing.com
Market Dividend Yield
The DJ STOXX 600 monthly dividend yield was used, and taken from Datastream. The
dividend yield represents the distributed dividends per stock as a percentage of the stocks
market price. This series provided by Datastream calculates the dividends level as expected
annual dividends by excluding the unusual nonrecurring periodic dividends.

20
6. Empirical Results
6.1. Unconditional Asset Pricing
At this section we present the results of OLS regression for the unconditional and conditional
CAPM and Fama & French 3 factors model.
Table 1 presents the results from the time series CAPM model,
𝐸[𝑅𝑖𝑡] − 𝑅𝑓 = 𝛼 + 𝛽𝑖(𝐸[𝑅𝑚𝑡] − 𝑅𝑓), and Fama and French three factor model, 𝐸(𝑅𝑖) −
𝑅𝑓 = 𝑏𝑖[𝐸(𝑅𝑀) − 𝑅𝑓] + 𝑠𝑖𝐸(𝑆𝑀𝐵) + ℎ𝑖𝐸(𝐻𝑀𝐿)
6.1.1. Total Period 2001-2012
We regress the excess portfolio return of the defensive stocks on a constant and the excess
market return. A t-test is conducted for the hypothesis that the intercept is equal to zero. We
found that for the cyclical portfolio the intercept is equal to zero and market excess return has
a positive and significant t-statistic which is consistent with the theory. The critical t-value at
a two-tailed 5-percent significance level is around 2.2. We can observe that the t-value of the
intercept is -0.51, which is not significantly different from zero, and thus we do not reject the
null hypothesis. On the other hand for the defensive stocks portfolio we reject the null
hypothesis, H0: αi=0 for any i=1,…,N, that the intercept is equal to zero concluding that the
CAPM does not hold based on the assumption of Sharpe and Lintner CAPM. R2 is computed
as the ratio of the explained sum of squares to the total sum of squares. Statistically, R2
measures the ‘goodness of fit’ of the model. In our regression, the values of R2 are 0.69 for
the defensive portfolio CAPM and 0.02 for the cyclical portfolio CAPM respectively.
Our empirical tests for the time-series of Fama and French three factor model show that the
intercept is equal to zero. The intercept has a t-value of -0.96 and thus we don’t reject the null
hypothesis that intercept is equal to zero. Similar to CAPM we find that for the defensive
portfolio we reject the null hypothesis that the intercept is equal to zero.
Also, in the cyclical portfolio test we find that the excess market return is positive and
significant at 5% level of significance and there is a positive and significant HML factor. The
SMB factor is negative and insignificant based on its t-value. Fama and French research show
that coefficients for size (SMB) was negatively significant and BM (HML) was positive
significant. Our outcome does not give a significant size factor for the cyclical portfolio.
Our results concerning CAPM model backing the mixed support for the CAPM as in the
academic articles that we have reviewed. For the defensive portfolio CAPM does not hold, as

21
the alfa does not equal to zero so the null hypothesis is rejected. Our conclusion is that
different stock characteristics based on beta, as we have conducted our portfolio, give
different results. Same mixed report exist for FF3 factors model. For the defensive portfolio
FF3 does not hold and we don’t find a significant size factor for the cyclical portfolio as Fama
and French indicate in their paper.
6.1.2. Sub period 2001-1007 (Expansion)
We separate the whole period into two sub periods. The expansion sub period 2001-2007 and
the recession sub period 2008-2012. We do this separation in order to test how the models
perform in different periods and which model performs better at different market conditions.
Also, We notice from the theory we reviewed that, stocks which are categorized on cyclicality
could have special characteristics as same as size and growth and that defensive stocks (or
portfolios constructed on cyclicality considerations) are not covered as a potential special
stocks group.
As it can be seen by table 1 for the cyclical portfolio the intercept is almost equal to zero
having a t-stat equal to 0.01, but excess market return is not statistically significant with t-stat
0.68. For the defensive portfolio CAPM did not hold since the regression outcome gives an
intercept that is not equal to zero.
The results for FF3 test show that for the cyclical portfolio market excess return is not
statistically significant as it is for the whole period test, the coefficient of HML factor is
negative and still is statistically significant, and the SMB factor is positive but without any
explanatory value in our model since it is statistically insignificant.
In contrast testing the FF3 model for the defensive portfolio our results depict that the
intercept is almost equal to zero as FF3 theory suggests, market excess return has a high
explanatory value to our model and this time SMB factor is positive and significant with the
HML factor coefficient being negative though insignificant.

22
6.1.3. Sub period 2008-2012 (Recession)
In the recession sub period we observe the best result for the unconditional CAPM from all
the tests we have conducted so far. Regarding the defensive portfolio, we find that an
intercept equal to zero and a highly significant excess market return with a great explanatory
value in our regression model. As can be seen form table 1, market excess return has a t-
statistic of 9.85 with and a R2 of 0.62.
The results for the cyclical portfolio, as are presented in the table 1, are similar with the
previous observations, where we do not reject the null hypothesis that the intercept is equal to
zero and the market excess return has a proper explanatory value but at the 10% confidence
interval.
Concerning FF3 model we found that for the cyclical portfolio (table 1) the model holds
however only the book to market factor has an explanatory value in our model. This result is
similar with result that we have already observed for the expansion period.
Additionally table 1 show that for the defensive portfolio in the recession period none of
Fama and French sensitivities factors have a significant effect on our model.
Concluding our empirical results for both periods we notice that CAPM performs better in
contrast with the theory that proposes the opposite. Including extra factors in the
unconditional CAPM, as Fama and French (1992) do, we observe that the model does not
perform better than the unconditional CAPM especially in the recession period. Probably this
is due to the change in behavior of investors during the recession period. Most often investors
buy assets which perform well in the past and this increases the market value of these assets
and in turn decreases their future return. But in the recession period investor’s behavior
dramatically changed and we observe a positive but insignificant book to market factor.
23
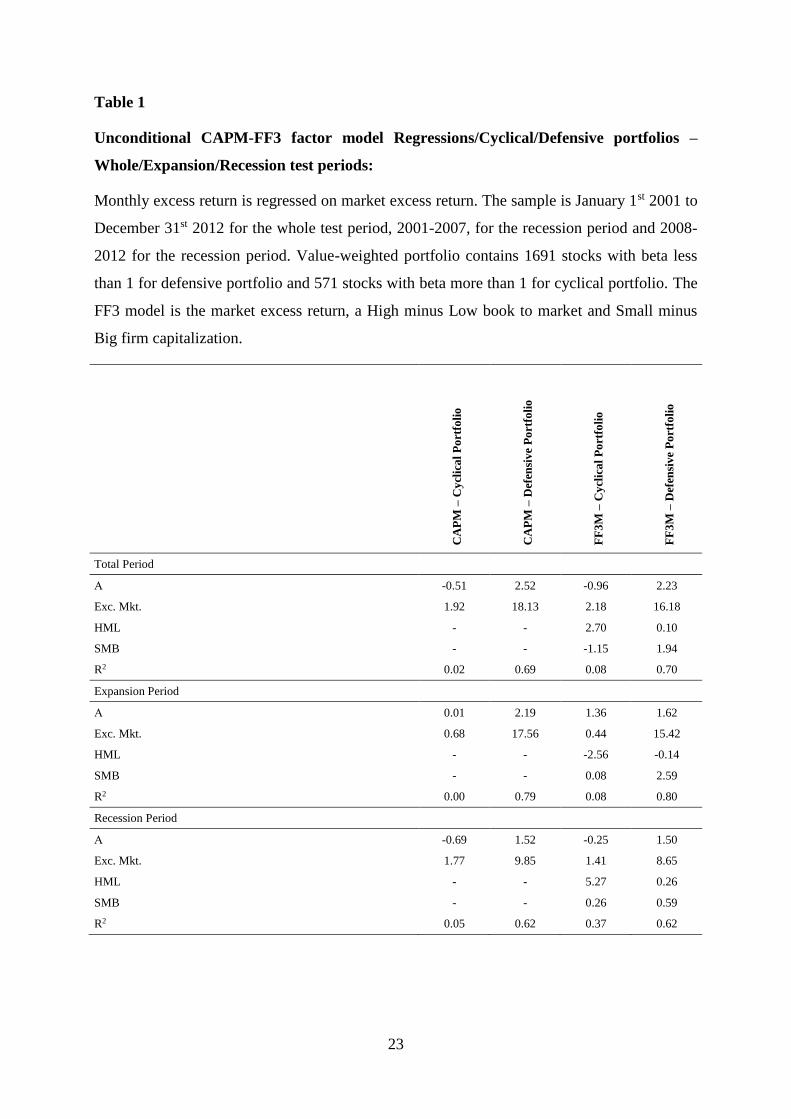
Table 1
Unconditional CAPM-FF3 factor model Regressions/Cyclical/Defensive portfolios –
Whole/Expansion/Recession test periods:
Monthly excess return is regressed on market excess return. The sample is January 1st 2001 to
December 31st 2012 for the whole test period, 2001-2007, for the recession period and 2008-
2012 for the recession period. Value-weighted portfolio contains 1691 stocks with beta less
than 1 for defensive portfolio and 571 stocks with beta more than 1 for cyclical portfolio. The
FF3 model is the market excess return, a High minus Low book to market and Small minus
Big firm capitalization.
C
AP
M –
Cy
clic
al
Po
rtfo
lio
CA
PM
– D
efen
siv
e P
ort
foli
o
FF
3M
– C
ycl
ica
l P
ort
foli
o
FF
3M
– D
efen
siv
e P
ort
foli
o
Total Period
Α -0.51 2.52 -0.96 2.23
Exc. Mkt. 1.92 18.13 2.18 16.18
HML - - 2.70 0.10
SMB - - -1.15 1.94
R2 0.02 0.69 0.08 0.70
Expansion Period
Α 0.01 2.19 1.36 1.62
Exc. Mkt. 0.68 17.56 0.44 15.42
HML - - -2.56 -0.14
SMB - - 0.08 2.59
R2 0.00 0.79 0.08 0.80
Recession Period
Α -0.69 1.52 -0.25 1.50
Exc. Mkt. 1.77 9.85 1.41 8.65
HML - - 5.27 0.26
SMB - - 0.26 0.59
R2 0.05 0.62 0.37 0.62

24
6.2. Conditional Tests
At this section we use different lagged instruments to test the CAPM similar to Ferson and
Harvey (1999) paper. We use macro lagged instrument in order to test if these instruments
enhance the model by giving more stable coefficients and also if the introduction of
conditional version of asset pricing models improves the model’s explanation power by taking
into consideration different economic phases.
6.2.1. Total Period 2001-2012
We regress the cyclical and defensive portfolios over time using the lagged instruments and
based on the results that are presented on table 2 we notice that the CAPM model holds for
both portfolios, since intercept is zero, but none of the lagged variables are significant in the
cyclical portfolio. For the defensive portfolio yield_spread(-1), market excess return “exc
mkt” and y_r, are significant at the 10% confidence interval. We concluded that CAPM
explains the conditional expected returns of the defensive portfolio but not for the cyclical
one. These results imply that the Conditional CAPM fits the data better than the unconditional
form.
Further, for the FF3 model similar to CAPM each portfolio excess return is regressed on an
intercept, the lagged instruments, the FF-tree factors, and the products of FF3-factors with the
lagged instruments. As it can be seen by table 2 for the cyclical portfolio FF3-factors model
does not hold since the intercept is not zero as Fama and French (1992) suggests. Additionally
the defensive portfolio holds and the “y_r” and “y_smb” variables show to have an
explanatory value over our model. These results imply that we don’t reject the conditional
version of the FF3 factors model of the defensive portfolio since there are some lagged
instruments that can explain the conditional expected returns of the specific portfolio as
theory also suggests.

25
Table 2
Conditional CAPM-FF3 factor model Regressions/Cyclical/Defensive portfolios – Whole
test period:
Monthly excess returns are regressed on a set of lagged instrumental variables. The lagged
instrumental variables include “yield spread” which is the difference between Moody’s Baa
and Aaa corporate bond yields; “dif_10_1_yr”, is the difference between a ten-year and one-
year bond yield; “stoxx_dy”, is the dividend yield of stoxx600 index;”Y_R”, multiplication
of “yield_spread” and market excess return; “dir_r” is the “dif_10_1_Y times the market
excess return; and “dy_r” is the stoxx_dy” times excess market return. The sample is from 1st
January 2001 to 31st December 2012, 2001-2007 and 2008-2012. The number of observations
are 115. Value-weighted portfolio contains 571 stocks with beta more than 1 and 1691 stocks
with beta less than 1. The FF3 model are the market excess return, a High minus Low book to
market and Small minus Big firm capitalization. “y_hml”, y_smb”, dif_ hml”, dif_smb”,
“dy_hml”,”dy_smb” are the lagged instrument multiply by FF3 factors.
FF
3M
Cy
clic
al
FF
3M
Def
ensi
ve
CA
PM
Cy
clic
al
CA
PM
Def
ensi
ve
Total Period
Intercept -1.83 1.08 -1.02 0.98
YIELD_SPREAD(-1) -0.58 0.74 -0.58 1.85
STOXX_DY(-1) 1.34 -0.78 0.80 -1.06
DIF_10_1_YR(-1) 1.48 -0.96 1.19 -1.03
Exc.Mkt -1.15 1.11 0.27 1.69
Y_R -0.82 -2.34 0.17 -1.70
SMB 0.03 1.34
HML -0.86 -1.06
Y_HML -1.64 -0.86
Y_SMB -0.20 2.15
DIF_R -1.39 -0.60 -1.01 -1.16
DIF_HML -0.67 0.40
DIF_SMB -0.89 -0.87
DY_R 1.50 1.57 0.15 1.21
DY_HML 1.89 1.08
DY_SMB 0.20 -1.58

26
6.2.2. Sub period 2001-2007 (Expansion)
Continuing our empirical tests for the expansion period of interest 2001-2007 we observe that
the conditional CAPM for the cyclical portfolio does not hold since we cannot reject the null
hypothesis that intercept is equal to zero. The lagged instruments for both cyclical and
defensive portfolios have no explanatory value in our regression model. None of the lagged
instruments and the products have a t-test at least less than 10 % (table 3).
In comparison to that, we notice that the FF3 factors model holds for both portfolios since the
regression intercept is close to zero as Fama and French (1993) found. For the defensive
portfolio the lagged instruments are not significant and only yield_spead lagged instrument
and its product with HML are significant for the cyclical portfolio.
We can conclude that FF3 factor model performs approximately well. By adding other factors
to the conditional CAPM our results are improved. Thus we determine that FF3 factors add
some value to our model.

27
Table 3
Conditional CAPM-FF3 factor model Regressions/Cyclical/Defensive portfolios –
Expansion test period.
Monthly excess returns are regressed on a set of lagged instrumental variables. The lagged
instrumental variables include “yield spread” which is the difference between Moody’s Baa
and Aaa corporate bond yields; “dif_10_1_yr”, is the difference between a ten-year and one-
year bond yield; “stoxx_dy”, is the dividend yield of stoxx600 index;”Y_R”, multiplication of
“yield_spread” and market excess return; “dir_r” is the “dif_10_1_Y times the market excess
return; and “dy_r” is the stoxx_dy” times excess market return. The sample is from 1st
January 2001 to 31st December 2007. The number of observations are 115. Value-weighted
portfolio contains 571 stocks with beta more than 1 and 1691 stocks with beta less than 1. The
FF3 model are the market excess return, a High minus Low book to market and Small minus
Big firm capitalization. “y_hml”, y_smb”, dif_ hml”, dif_smb”, “dy_hml”,”dy_smb” are the
lagged instrument multiply by FF3 factors.
FF
3M
Cy
clic
al
FF
3M
Def
ensi
ve
CA
PM
Cy
clic
al
CA
PM
Def
ensi
ve
Expansion Period
Intercept -1.53 -0.89 -1.90 0.04
YIELD_SPREAD(-1) 1.71 0.59 1.49 -0.33
STOXX_DY(-1) 0.73 0.73 1.28 0.17
DIF_10_1_YR(-1) -0.63 -0.14 0.57 -0.31
Exc.Mkt 0.51 0.03 -0.65 -0.69
Y_R -0.24 -0.95 -0.22 -0.13
SMB -0.78 0.11
HML 1.55 0.52
Y_HML -2.58 -0.26
Y_SMB 0.84 -0.32
DIF_R 0.22 -0.74 -1.19 -0.27
DIF_HML 0.47 -0.30
DIF_SMB -0.41 0.61
DY_R -0.47 0.83 0.83 1.23
DY_HML 0.07 -0.35
DY_SMB 0.40 0.10

28
6.2.3. Sub Period 2008-2012 (Recession)
As can be seen by table 4 there are some differences among the cyclical and defensive
portfolio CAPM model. For the defensive portfolio intercept seems to be close to zero as
CAPM theory suggests but the same is not true for the cyclical portfolio. Also, the defensive
portfolio has a significant excess market return at the 10 per cent confidence interval however
excess market return is insignificant for the cyclical portfolio. Further our results illustrate
that the lagged instruments do not have any explanatory value on the defensive portfolio and
only the difference between the 10-year and one-year bond yield variable is significant for the
cyclical portfolio.
FF3-factors model does not hold for both cyclical and defensive portfolio as our results show
that both have time-varying intercepts and thus not zero. Our results entail that the FF3-
factors model does not explain the conditional expected returns of these portfolios.

29
Table 4
Conditional CAPM-FF3 factor model Regressions/Cyclical/Defensive portfolios –
Recession test period.
Monthly excess returns are regressed on a set of lagged instrumental variables. The lagged
instrumental variables include “yield spread” which is the difference between Moody’s Baa
and Aaa corporate bond yields; “dif_10_1_yr”, is the difference between a ten-year and one-
year bond yield; “stoxx_dy”, is the dividend yield of stoxx600 index;”Y_R”, multiplication
of “yield_spread” and market excess return; “dir_r” is the “dif_10_1_Y times the market
excess return; and “dy_r” is the stoxx_dy” times excess market return. The sample is from 1st
January 2008 to 31st December 2012. The number of observations is 115. Value-weighted
portfolio contains 571 stocks with beta more than 1 and 1691 stocks with beta less than 1. The
FF3 model are the market excess return, a High minus Low book to market and Small minus
Big firm capitalization. “y_hml”, y_smb”, dif_ hml”, dif_smb”, “dy_hml”,”dy_smb” are the
lagged instrument multiply by FF3 factors.
FF
3M
Cy
clic
al
FF
3M
Def
ensi
ve
CA
PM
Cy
clic
al
CA
PM
Def
ensi
ve
Recession Period
Intercept -2.39 1.98 -1.88 1.41
YIELD_SPREAD(-1) -0.85 0.67 -0.67 1.66
STOXX_DY(-1) 1.81 -1.35 1.24 -1.29
DIF_10_1_YR(-1) 2.20 -1.68 2.06 0.10
Exc.Mkt -1.58 1.88 -0.54 1.88
Y_R -0.96 -1.94 -0.12 -1.03
SMB 0.64 0.59
HML -0.43 -0.87
Y_HML -1.31 -0.60
Y_SMB -0.01 2.24
DIF_R -0.68 -0.83 -0.10 -0.56
DIF_HML -0.58 0.17
DIF_SMB -0.99 -0.74
DY_R 1.72 0.67 0.54 0.16
DY_HML 1.28 0.93
DY_SMB -0.26 -1.27

30
Based on our empirical findings we can summarize our results in the following two tables:
Pricing errors (alphas) significance:
CAPM FF3M CCAPM CFF3M
Cyclical Portfolio
Total Period 2001-2012 -0.51 -0.96 -1.02 -1.83
Expansion 2001-2008 0.01 1.36 -1.90 -1.53
Recession 2008-2012 -0.69 -0.25 -1.88 -2.39
Defensive Portfolio
Total Period 2001-2012 2.52 2.23 0.98 1.08
Expansion 2001-2008 2.19 2.23 0.04 -0.89
Recession 2008-2012 1.52 1.50 1.41 1.98
Note: shading refers to insignificant alpha coefficient at significant level of 10%

31
7. Conclusion
This paper investigates the efficiency of both unconditional and conditional CAPM and Fama
and French three factors models in determining the required rate of return for valuation or
asset management purposes for portfolios mainly built on the cyclicality consideration such
as, defensive stocks, and geographically diversified stocks in the whole Eurozone. The test
period spread over 11 years starting from 2001 to 2012 which includes both expansion and
recession economic phases. The tests that we run are based on the notion that special stocks
which are categorized on cyclicality could have special characteristics as same as size and
growth in different economic phases. Also, that the previous researches do not cover much the
defensive stocks (or portfolios constructed on cyclicality considerations) as a potential special
stocks group.
Our empirical results show that the unconditional CAPM performs better in contrast with the
theory that proposes the opposite. Including extra factors in the unconditional CAPM, as
Fama and French (1992) do, we observe that the model does not perform better than the
unconditional CAPM especially in the recession period. On the other hand, regarding the
conditional asset pricing models, adding other factors to the conditional CAPM our results are
improved. Thus we determine that FF3 factors add some value to our model.
Moreover, we found that the conditional pricing models proved a higher pricing accuracy than
the unconditional ones for the defensive portfolio as can be observed through the significant
pricing errors (alphas) for the unconditional form relative to the insignificant pricing errors
(alphas) for the conditional version in almost all periods. However, we noticed that adding
economic lagged instruments in our models are making the explanatory power of the market
portfolio as an independent variable less significant reference to well explanatory power in
case of the unconditional models mainly for the defensive portfolio.
Additionally, we found that the conditional version of the FF3 factors model can explain the
conditional expected returns. By adding other factors to the conditional CAPM our results are
improved. Thus we determine that FF3 factors add some value to our model.

32
8. References
A. Parold, 2004, The Capital Asset Pricing Model, The Journal of Economic Perspectives,
Vol. 18 No. 3 Summer 2004, pp. 3-24.
B.H. Solnik, 1974, Equilibrium in an international capital market, Journal of Economic
Theory, 8 (1974), pp. 500–504.
C. Budianschi, L. Kocarev, 2013, Fama and French Model vs CAPM: Procyclical stocks,
Thesis paper, Lund University
C. Eriksson, 2013, Empirical Researchers of the Capital Asset Pricing Model and the Fama
and French three factor model on the U.S stock market, Thesis paper, Mälardalens Iniversity
D. Broumen, A De Jong, KCG. Koedijk, 2004, Corporate Finance in Europe Confronting
Theory with Practice, EFA 2004 Maastricht Meetings Paper No. 2769
D. Kilsgård, F. Wittorf, 2010, The Fama and French Three Factor Model-Evidence of the
Swedish Stock Market, Thesis paper, Lund University
D. Mayers, 1973, Nonmarketable Assets and the Determination of Capital Asset Prices in the
Absence of a Riskless Asset, The Journal of Business, Vol. 46, No. 2, pp. 258-267.
E. Fama & K. French, 1996, Multifactor Explanations of Asset Pricing Anomalies, The
Journal of Finance, Volume 51, Issue 1, pp 55–84.
E. Fama, K. French, 1993, Common risk factors in the returns on stocks and bonds, Journal of
Financial Economics, Volume 33, Issue 1, pp. 3–56.
E.Rossvoll, 2013, Asset Pricing Models and the Norwegian Stock Market, Thesis paper,
Institute of Economics, NTNU
EF Fama, K. French, 2004, The Capital Asset Pricing Model: Theory and Evidence, Journal
of Economic Perspectives, Vol. 18, No. 325-46
EF. Fama, 1970, EFFICIENT CAPITAL MARKETS: A REVIEW OF THEORY AND
EMPIRICAL WORK, The Journal of Finance, Volume 25, Issue 2, pp 383–417.
EF. Fama, K French, 1996, Multifactor Explanations of Asset Pricing Anomalies, The
Journal of Finance, Volume 51, Issue 1, pp.55–84.
EF. Fama, K. French, 1992, The Cross-Section of Expected Stock Returns, The Journal of
Finance, Volume 47, Issue 2, pp 427–465.
33
F. Modigliani, G. Pogue, B. Solnik, 1972, A critique of the asset pricing theory's tests Part I:
On past and potential testability of the theory, Journal of Financial Economics, Volume 4,
Issue 2, pp 129–176.
G. P. Diacogiannis, 1994, Three-parameter asset pricing, Managerial and Decision
Economics, Volume 15, Issue 2, pp. 149–158.
H. Markowitz, 1952, PORTFOLIO SELECTION, The Journal of Finance, Volume 7, Issue 1,
pp.77–91.
H. Markowitz, 1959, Portfolio selection: efficient diversification of investments, Basil
Blackwall, New York.
J. Bartholdy, P. Peare, 2003, Unbiased estimation of expected return using CAPM,
International Review of Financial Analysis, Volume 12, Issue 1, pp.69–81.
J. Graham, C. Harvey, 2003, The theory and practice of corporate finance: evidence from the
field, Journal of Financial Economics, Volume 60, Issues 2–3, pp. 187–243
J. Lintner, 1965, The Valuation of Risk Assets and the Selection of Risky Investments in
Stock Portfolios and Capital Budgets, The Review of Economics and Statistics, Vol. 47, No. 1
(Feb., 1965), pp. 13-37.
K. Kassimatis, 2008, Size, Book to Market and Momentum Effects in the Australian Stock
Market, Australian Journal of Management, vol. 33, no. 1, pp. 145-168.
K.Lam, 2005, Is the Fama NAD French three factor model better than than the CAPM?,
Thesis paper, Simon Fraser University
L. Fisher, J.H. Lorie, 1964, Rates of Return on Investments in Common Stocks, The Journal
of Business, Vol. 37, No. 1, pp. 1-21.
L. Fisher, J.H. Lorie, 1964, The Journal of Business, Vol. 37, No. 1, pp. 1-21.
L.C. Bhandari, 1988, Debt/Equity Ratio and Expected Common Stock Returns: Empirical
Evidence, The Journal of Finance, Volume 43, Issue 2, pp. 507–528.
Lakonishok, Shleifer & Vishny, 1994, Contrarian Investment, Extrapolation, and Risk, The
Journal of Finance, Volume 49, Issue 5, pp 1541–1578.
M. Chen, 2003, Risk and return: CAPM and CCAPM, The Quarterly Review of Economics
and Finance, Volume 43, Issue 2, pp.369–393.

34
M. Drew, T. Naughton, M. Veeraraghavan, 2003, Firm Size, Book-to-Market Equity and
Security Returns: Evidence from the Shanghai Stock Exchange, Australian Journal of
Management, vol. 28 no. 2, pp. 119-139.
M. Goedhart, T. Koller, D. Wessels, 2005, The Right Role for Multiples in Valuation,
McKinsey on Finance, No. 15, pp. 7-11.
M.Paavola, 2007, Empirical Tests of Asset Pricing Models in Finish Stock Market, Thesis
paper, Lappeenranta University of Technology
N. Jegadeesh, S. Titman, 1993, Returns to Buying Winners and Selling Losers: Implications
for Stock Market Efficiency, The Journal of Finance, Volume 48, Issue 1, pp 65–91.
N. Theriou, V. Aggelidis, T. Spiridis, 2004, Empirical Testing of Asset Capital Asset Pricing
Model, Thesis paper, TEI of Kavala
P. Rosenberg, K. Reid, R. Lanstein, 1985, Persuasive evidence of market inefficiency, The
Journal of Portfolio Management, Vol. 11, No. 3: pp. 9-16
R. Ibbotson, R. Sinquefield, 1976, Stocks, Bonds, Bills, and Inflation: Year-by-Year
Historical Returns, Journal of Business, Vol.49, pp. 11-47.
R. Jagannathan, K. Kubota, H. Takehara, 1998, Relationship between Labor‐Income Risk and
Average Return: Empirical Evidence from the Japanese Stock Market, The Journal of
Business, Vol. 71, No. 3 pp. 319-347.
R. Jagannathan, Z. Wang, 1996, The Conditional CAPM and the Cross-Section of Expected
Returns, The Journal of Finance, Volume 51, Issue 1, pp. 3–53.
R.W. Banz, 1981, The relationship between return and market value of common stocks,
Journal of Financial Economics, Volume 9, Issue 1, pp. 3–18.
S. Basu, 1983, The relationship between earnings' yield, market value and return for NYSE
common stocks: Further evidence, Journal of Financial Economics, Volume 12, Issue 1, pp.
129–156.
V. Bawa, E. Lindenberg, 1977, Capital market equilibrium in a mean-lower partial moment
framework, Journal of Financial Economics, Volume 5, Issue 2, pp 189–200.
W. De Bondt, R. Thaler, 1985, Does the Stock Market Overreact, The Journal of Finance,
Volume 40, Issue 3, pp.793–805.

35
W. Ferson, C. Harvey, 1999, Conditioning Variables and the Cross Section of Stock Returns,
The Journal of Finance, Volume 54, Issue 4, pp 1325–1360.
V. Kapur, 2007, Is the Fama and French Model a Good Indicator of Market Sectoral
Performance?: Study of the relationship between excess industry returns and the Fama and
French three factor model, Thesis paper, New York University
WF. Sharpe, 1964, CAPITAL ASSET PRICES: A THEORY OF MARKET EQUILIBRIUM
UNDER CONDITIONS OF RISK, The Journal of Finance, Volume 19, Issue 3, pp 425–442.
Electronic sources:
http://www.investing.com/rates-bonds/germany-1-year-bond-yield-historical-data
http://mba.tuck.dartmouth.edu/pages/faculty/ken.french/data_library.html

36
9. Appendices
Unconditional CAPM and Famma French Regression for both Cyclical and Defensive portfolios – Expansion test period:
Cyclical Stocks portfolio (all stocks Euro Zone) Defensive Stocks portfolio (all stocks Euro Zone)
Dependent Variable: C_EXCESS_RETURN
Method: Least Squares
Date: 04/06/15 Time: 15:29
Sample: 2001M01 2007M12
Included observations: 84 Variable Coefficient Std. Error t-Statistic Prob. C 0.009742 0.683824 0.014246 0.9887
M_EXCESS_RETURN 0.104640 0.152550 0.685939 0.4947 R-squared 0.005705 Mean dependent var -0.004715
Adjusted R-squared -0.006420 S.D. dependent var 6.244360
S.E. of regression 6.264373 Akaike info criterion 6.531156
Sum squared resid 3217.875 Schwarz criterion 6.589032
Log likelihood -272.3085 Hannan-Quinn criter. 6.554422
F-statistic 0.470512 Durbin-Watson stat 2.367239
Prob(F-statistic) 0.494687
Dependent Variable: D_EXCESS_RETURN
Method: Least Squares
Date: 04/06/15 Time: 15:30
Sample: 2001M01 2007M12
Included observations: 84 Variable Coefficient Std. Error t-Statistic Prob. C 0.507925 0.231643 2.192704 0.0312
M_EXCESS_RETURN 0.907710 0.051676 17.56547 0.0000 R-squared 0.790037 Mean dependent var 0.382516
Adjusted R-squared 0.787477 S.D. dependent var 4.603094
S.E. of regression 2.122037 Akaike info criterion 4.366151
Sum squared resid 369.2492 Schwarz criterion 4.424028
Log likelihood -181.3783 Hannan-Quinn criter. 4.389417
F-statistic 308.5458 Durbin-Watson stat 2.180873
Prob(F-statistic) 0.000000
Variable Coefficient Std. Error t-Statistic Prob. C 1.049992 0.769309 1.364850 0.1761
M_EXCESS_RETURN 0.072086 0.162904 0.442504 0.6593
HML -0.960877 0.374155 -2.568128 0.0121
SMB 0.029825 0.363884 0.081962 0.9349 R-squared 0.087102 Mean dependent var -0.004715
Adjusted R-squared 0.052868 S.D. dependent var 6.244360
S.E. of regression 6.077056 Akaike info criterion 6.493366
Sum squared resid 2954.449 Schwarz criterion 6.609119
Log likelihood -268.7214 Hannan-Quinn criter. 6.539897
F-statistic 2.544322 Durbin-Watson stat 2.478744
Prob(F-statistic) 0.061941
Variable Coefficient Std. Error t-Statistic Prob. C 0.422361 0.260496 1.621372 0.1089
M_EXCESS_RETURN 0.850799 0.055161 15.42388 0.0000
HML -0.018468 0.126693 -0.145770 0.8845
SMB 0.320045 0.123215 2.597448 0.0112 R-squared 0.807381 Mean dependent var 0.382516
Adjusted R-squared 0.800158 S.D. dependent var 4.603094
S.E. of regression 2.057754 Akaike info criterion 4.327555
Sum squared resid 338.7481 Schwarz criterion 4.443308
Log likelihood -177.7573 Hannan-Quinn criter. 4.374087
F-statistic 111.7759 Durbin-Watson stat 2.157628
Prob(F-statistic) 0.000000

37
Conditional CAPM and Famma French Regression for both Cyclical and Defensive portfolios – Whole test period:
Cyclical Stocks portfolio (all stocks Euro Zone) Defensive Stocks portfolio (all stocks Euro Zone)
Dependent Variable: C_EXCESS_RETURN
Method: Least Squares
Sample (adjusted): 2001M02 2012M12
Included observations: 143 after adjustments Variable Coefficient Std. Error t-Statistic Prob. C -0.779390 1.525697 -0.510842 0.6103
YIELD_SPREAD(-1) 0.405474 1.217648 0.332998 0.7396
M_EXCESS_RETURN 0.131946 0.271121 0.486669 0.6273
Y_R 0.063161 0.158972 0.397309 0.6917 R-squared 0.027414 Mean dependent var -0.371015
Adjusted R-squared 0.006423 S.D. dependent var 7.151653
S.E. of regression 7.128648 Akaike info criterion 6.793694
Sum squared resid 7063.649 Schwarz criterion 6.876570
Log likelihood -481.7491 Hannan-Quinn criter. 6.827371
F-statistic 1.306003 Durbin-Watson stat 2.258678
Prob(F-statistic) 0.274985
Dependent Variable: D_EXCESS_RETURN
Method: Least Squares
Sample (adjusted): 2001M02 2012M12
Included observations: 143 after adjustments Variable Coefficient Std. Error t-Statistic Prob. C -0.150352 0.603564 -0.249107 0.8036
YIELD_SPREAD(-1) 0.622250 0.481700 1.291778 0.1986
M_EXCESS_RETURN 1.036933 0.107255 9.667907 0.0000
Y_R -0.112816 0.062889 -1.793886 0.0750 R-squared 0.712169 Mean dependent var 0.380099
Adjusted R-squared 0.705957 S.D. dependent var 5.200636
S.E. of regression 2.820085 Akaike info criterion 4.938984
Sum squared resid 1105.450 Schwarz criterion 5.021861
Log likelihood -349.1374 Hannan-Quinn criter. 4.972662
F-statistic 114.6406 Durbin-Watson stat 2.211023
Prob(F-statistic) 0.000000
Variable Coefficient Std. Error t-Statistic Prob. C -1.742165 1.642296 -1.060811 0.2907
YIELD_SPREAD(-1) 1.136946 1.349279 0.842633 0.4009
M_EXCESS_RETURN 0.182927 0.287274 0.636768 0.5254
HML -0.563826 0.600322 -0.939207 0.3493
SMB 0.051684 0.780311 0.066235 0.9473
Y_R 0.043852 0.178114 0.246200 0.8059
Y_HML 0.909059 0.433424 2.097389 0.0378
Y_SMB -0.211448 0.600877 -0.351899 0.7255 R-squared 0.129435 Mean dependent var -0.371015
Adjusted R-squared 0.084295 S.D. dependent var 7.151653
S.E. of regression 6.843595 Akaike info criterion 6.738822
Sum squared resid 6322.698 Schwarz criterion 6.904575
Log likelihood -473.8258 Hannan-Quinn criter. 6.806176
F-statistic 2.867388 Durbin-Watson stat 2.355231
Prob(F-statistic) 0.008022
Variable Coefficient Std. Error t-Statistic Prob. C 0.304168 0.671877 0.452713 0.6515
YIELD_SPREAD(-1) 0.136025 0.552001 0.246422 0.8057
M_EXCESS_RETURN 1.064006 0.117526 9.053369 0.0000
HML 0.097980 0.245597 0.398945 0.6906
SMB -0.254554 0.319232 -0.797395 0.4266
Y_R -0.160005 0.072868 -2.195821 0.0298
Y_HML -0.022789 0.177317 -0.128520 0.8979
Y_SMB 0.358383 0.245824 1.457887 0.1472 R-squared 0.724464 Mean dependent var 0.380099
Adjusted R-squared 0.710177 S.D. dependent var 5.200636
S.E. of regression 2.799772 Akaike info criterion 4.951271
Sum squared resid 1058.227 Schwarz criterion 5.117025
Log likelihood -346.0159 Hannan-Quinn criter. 5.018625
F-statistic 50.70784 Durbin-Watson stat 2.327845
Prob(F-statistic) 0.000000

38
Conditional CAPM and Famma French Regression for both Cyclical and Defensive portfolios – Recession test period:
Cyclical Stocks portfolio (all stocks Euro Zone) Defensive Stocks portfolio (all stocks Euro Zone)
Dependent Variable: C_EXCESS_RETURN
Method: Least Squares
Date: 04/06/15 Time: 18:53
Sample: 2008M01 2012M12
Included observations: 60 Variable Coefficient Std. Error t-Statistic Prob. C -2.421859 2.671453 -0.906570 0.3685
YIELD_SPREAD(-1) 1.181131 1.708219 0.691440 0.4921
M_EXCESS_RETURN 0.326361 0.487773 0.669083 0.5062
Y_R 0.003243 0.233057 0.013917 0.9889 R-squared 0.059892 Mean dependent var -0.856638
Adjusted R-squared 0.009529 S.D. dependent var 8.237632
S.E. of regression 8.198289 Akaike info criterion 7.110068
Sum squared resid 3763.869 Schwarz criterion 7.249691
Log likelihood -209.3021 Hannan-Quinn criter. 7.164683
F-statistic 1.189212 Durbin-Watson stat 2.144614
Prob(F-statistic) 0.322179
Dependent Variable: D_EXCESS_RETURN
Method: Least Squares
Date: 04/06/15 Time: 20:50
Sample: 2008M01 2012M12
Included observations: 60 Variable Coefficient Std. Error t-Statistic Prob. C -0.177778 1.188792 -0.149545 0.8817
YIELD_SPREAD(-1) 0.625330 0.760155 0.822634 0.4142
M_EXCESS_RETURN 1.064455 0.217058 4.904009 0.0000
Y_R -0.126721 0.103710 -1.221885 0.2269 R-squared 0.642241 Mean dependent var 0.396304
Adjusted R-squared 0.623075 S.D. dependent var 5.942295
S.E. of regression 3.648226 Akaike info criterion 5.490700
Sum squared resid 745.3350 Schwarz criterion 5.630323
Log likelihood -160.7210 Hannan-Quinn criter. 5.545314
F-statistic 33.50992 Durbin-Watson stat 2.210924
Prob(F-statistic) 0.000000
Variable Coefficient Std. Error t-Statistic Prob. C -1.643123 2.626172 -0.625672 0.5343
YIELD_SPREAD(-1) 0.991863 1.769647 0.560486 0.5776
M_EXCESS_RETURN 0.233426 0.456508 0.511329 0.6113
HML 1.481424 0.924889 1.601733 0.1153
SMB 0.379323 1.328238 0.285584 0.7763
Y_R 0.008334 0.232996 0.035768 0.9716
Y_HML 0.142728 0.562182 0.253882 0.8006
Y_SMB -0.177069 0.821520 -0.215539 0.8302 R-squared 0.376736 Mean dependent var -0.856638
Adjusted R-squared 0.292835 S.D. dependent var 8.237632
S.E. of regression 6.927279 Akaike info criterion 6.832377
Sum squared resid 2495.334 Schwarz criterion 7.111623
Log likelihood -196.9713 Hannan-Quinn criter. 6.941605
F-statistic 4.490253 Durbin-Watson stat 2.430045
Prob(F-statistic) 0.000569
Variable Coefficient Std. Error t-Statistic Prob. C 1.432028 1.364515 1.049478 0.2988
YIELD_SPREAD(-1) -0.604007 0.919479 -0.656902 0.5141
M_EXCESS_RETURN 1.238109 0.237194 5.219823 0.0000
HML 0.052781 0.480556 0.109834 0.9130
SMB -1.241516 0.690130 -1.798960 0.0778
Y_R -0.251171 0.121061 -2.074752 0.0430
Y_HML 0.058873 0.292100 0.201550 0.8411
Y_SMB 0.860589 0.426848 2.016148 0.0490 R-squared 0.676646 Mean dependent var 0.396304
Adjusted R-squared 0.633118 S.D. dependent var 5.942295
S.E. of regression 3.599296 Akaike info criterion 5.522920
Sum squared resid 673.6566 Schwarz criterion 5.802166
Log likelihood -157.6876 Hannan-Quinn criter. 5.632148
F-statistic 15.54493 Durbin-Watson stat 2.362570
Prob(F-statistic) 0.000000

39
Conditional CAPM and Famma French Regression for both Cyclical and Defensive portfolios – Expansion test period:
Cyclical Stocks portfolio (all stocks Euro Zone) Defensive Stocks portfolio (all stocks Euro Zone)
Dependent Variable: C_EXCESS_RETURN
Method: Least Squares
Date: 04/06/15 Time: 18:45
Sample (adjusted): 2001M02 2007M12
Included observations: 83 after adjustments Variable Coefficient Std. Error t-Statistic Prob. C 1.144583 3.579922 0.319723 0.7500
YIELD_SPREAD(-1) -1.261468 3.701701 -0.340781 0.7342
M_EXCESS_RETURN 0.603311 0.788707 0.764936 0.4466
Y_R -0.471168 0.726575 -0.648478 0.5186 R-squared 0.011787 Mean dependent var -0.019963
Adjusted R-squared -0.025740 S.D. dependent var 6.280746
S.E. of regression 6.361067 Akaike info criterion 6.585262
Sum squared resid 3196.591 Schwarz criterion 6.701833
Log likelihood -269.2884 Hannan-Quinn criter. 6.632094
F-statistic 0.314088 Durbin-Watson stat 2.317656
Prob(F-statistic) 0.815142
Dependent Variable: D_EXCESS_RETURN
Method: Least Squares
Date: 04/06/15 Time: 19:00
Sample (adjusted): 2001M02 2007M12
Included observations: 83 after adjustments Variable Coefficient Std. Error t-Statistic Prob. C -0.380493 1.194927 -0.318424 0.7510
YIELD_SPREAD(-1) 0.904706 1.235575 0.732214 0.4662
M_EXCESS_RETURN 0.804218 0.263259 3.054854 0.0031
Y_R 0.105572 0.242520 0.435312 0.6645 R-squared 0.797330 Mean dependent var 0.368384
Adjusted R-squared 0.789634 S.D. dependent var 4.629243
S.E. of regression 2.123233 Akaike info criterion 4.390750
Sum squared resid 356.1415 Schwarz criterion 4.507321
Log likelihood -178.2161 Hannan-Quinn criter. 4.437582
F-statistic 103.5990 Durbin-Watson stat 2.256799
Prob(F-statistic) 0.000000
Variable Coefficient Std. Error t-Statistic Prob. C 2.404268 4.009634 0.599623 0.5506
YIELD_SPREAD(-1) -1.353635 4.328600 -0.312719 0.7554
M_EXCESS_RETURN -1.148687 0.714417 -1.607866 0.1121
HML -5.099699 1.722420 -2.960775 0.0041
SMB 9.205381 1.653130 5.568455 0.0000
Y_R 1.332085 0.672149 1.981829 0.0512
Y_HML 4.565290 1.855390 2.460555 0.0162
Y_SMB -9.547842 1.683656 -5.670898 0.0000 R-squared 0.364436 Mean dependent var -0.019963
Adjusted R-squared 0.305116 S.D. dependent var 6.280746
S.E. of regression 5.235611 Akaike info criterion 6.240263
Sum squared resid 2055.871 Schwarz criterion 6.473404
Log likelihood -250.9709 Hannan-Quinn criter. 6.333926
F-statistic 6.143621 Durbin-Watson stat 2.271661
Prob(F-statistic) 0.000011
Variable Coefficient Std. Error t-Statistic Prob. C 0.126617 1.605806 0.078849 0.9374
YIELD_SPREAD(-1) 0.300916 1.733548 0.173584 0.8627
M_EXCESS_RETURN 0.701052 0.286115 2.450248 0.0166
HML -0.169392 0.689807 -0.245564 0.8067
SMB 0.646941 0.662057 0.977168 0.3316
Y_R 0.155829 0.269187 0.578887 0.5644
Y_HML 0.166278 0.743060 0.223775 0.8235
Y_SMB -0.362559 0.674282 -0.537696 0.5924 R-squared 0.812354 Mean dependent var 0.368384
Adjusted R-squared 0.794841 S.D. dependent var 4.629243
S.E. of regression 2.096793 Akaike info criterion 4.410114
Sum squared resid 329.7407 Schwarz criterion 4.643255
Log likelihood -175.0197 Hannan-Quinn criter. 4.503777
F-statistic 46.38418 Durbin-Watson stat 2.215969
Prob(F-statistic) 0.000000

40