june 2017 ms - paper 1 aqa economics a-level
TRANSCRIPT

A-Level
Economics 7136/1 Paper 1 Markets And Market Failure (New) Final Mark scheme 7136 June 2017 Version/Stage: v1.0

Mark schemes are prepared by the Lead Assessment Writer and considered, together with the relevant questions, by a panel of subject teachers. This mark scheme includes any amendments made at the standardisation events which all associates participate in and is the scheme which was used by them in this examination. The standardisation process ensures that the mark scheme covers the students’ responses to questions and that every associate understands and applies it in the same correct way. As preparation for standardisation each associate analyses a number of students’ scripts. Alternative answers not already covered by the mark scheme are discussed and legislated for. If, after the standardisation process, associates encounter unusual answers which have not been raised they are required to refer these to the Lead Assessment Writer. It must be stressed that a mark scheme is a working document, in many cases further developed and expanded on the basis of students’ reactions to a particular paper. Assumptions about future mark schemes on the basis of one year’s document should be avoided; whilst the guiding principles of assessment remain constant, details will change, depending on the content of a particular examination paper. Further copies of this mark scheme are available from aqa.org.uk
Copyright © 2017 AQA and its licensors. All rights reserved. AQA retains the copyright on all its publications. However, registered schools/colleges for AQA are permitted to copy material from this booklet for their own internal use, with the following important exception: AQA cannot give permission to schools/colleges to photocopy any material that is acknowledged to a third party even for internal use within the centre.

MARK SCHEME – A-LEVEL ECONOMICS – 7136/1 – JUNE 2017
Annotations
Annotation Description ? Unclear
AN AN
APP APP
BOD Benefit of the doubt
Enhanced Off Page Comment
Comments that don’t appear on script
EVAL Evaluation
Highlight Highlight
IR Irrelevant
KU Knowledge and understanding
NAQ Not answered question
On Page Comment Text box
REP_BIG Repetition
SEEN Indicates that the point has been noted, but no credit has been given.
Tick Correct point
Cross Incorrect point
3 of 22

MARK SCHEME – A-LEVEL ECONOMICS – 7136/1 – JUNE 2017
Level of response marking instructions Level of response mark schemes are broken down into levels, each of which has a descriptor. The descriptor for the level shows the average performance for the level. There are marks in each level. Before you apply the mark scheme to a student’s answer read through the answer and annotate it (as instructed) to show the qualities that are being looked for. You can then apply the mark scheme. Step 1 Determine a level Start at the lowest level of the mark scheme and use it as a ladder to see whether the answer meets the descriptor for that level. The descriptor for the level indicates the different qualities that might be seen in the student’s answer for that level. If it meets the lowest level then go to the next one and decide if it meets this level, and so on, until you have a match between the level descriptor and the answer. With practice and familiarity you will find that for better answers you will be able to quickly skip through the lower levels of the mark scheme. When assigning a level you should look at the overall quality of the answer and not look to pick holes in small and specific parts of the answer where the student has not performed quite as well as the rest. If the answer covers different aspects of different levels of the mark scheme you should use a best fit approach for defining the level and then use the variability of the response to help decide the mark within the level, ie if the response is predominantly level 3 with a small amount of level 4 material it would be placed in level 3 but be awarded a mark near the top of the level because of the level 4 content. Step 2 Determine a mark Once you have assigned a level you need to decide on the mark. The descriptors on how to allocate marks can help with this. The exemplar materials used during standardisation will help. There will be an answer in the standardising materials which will correspond with each level of the mark scheme. This answer will have been awarded a mark by the Lead Examiner. You can compare the student’s answer with the example to determine if it is the same standard, better or worse than the example. You can then use this to allocate a mark for the answer based on the Lead Examiner’s mark on the example. You may well need to read back through the answer as you apply the mark scheme to clarify points and assure yourself that the level and the mark are appropriate. Indicative content in the mark scheme is provided as a guide for examiners. It is not intended to be exhaustive and you must credit other valid points. Students do not have to cover all of the points mentioned in the Indicative content to reach the highest level of the mark scheme. An answer which contains nothing of relevance to the question must be awarded no marks.
4 of 22

MARK SCHEME – A-LEVEL ECONOMICS – 7136/1 – JUNE 2017
Below is the levels of response marking grid to be used when marking any 25 mark question.
Level of response Response Max
25 marks
5
Sound, focused analysis and well-supported evaluation that: • is well organised, showing sound knowledge and understanding of
economic terminology, concepts and principles with few, if any, errors
• includes good application of relevant economic principles to the given context and, where appropriate, good use of data to support the response
• includes well-focused analysis with clear, logical chains of reasoning • includes supported evaluation throughout the response and in a
final conclusion.
21–25 marks
4
Sound, focused analysis and some supported evaluation that: • is well organised, showing sound knowledge and understanding of
economic terminology, concepts and principles with few, if any, errors
• includes some good application of relevant economic principles to the given context and, where appropriate, some good use of data to support the response
• includes some well-focused analysis with clear, logical chains of reasoning
• includes some reasonable, supported evaluation.
16–20 marks
3
Some reasonable analysis but generally unsupported evaluation that: • focuses on issues that are relevant to the question, showing
satisfactory knowledge and understanding of economic terminology, concepts and principles but some weaknesses may be present
• includes reasonable application of relevant economic principles to the given context and, where appropriate, some use of data to support the response
• includes some reasonable analysis but which might not be adequately developed or becomes confused in places
• includes fairly superficial evaluation; there is likely to be some attempt to make relevant judgements but these aren’t well-supported by arguments and/or data.
11–15 marks
2
A fairly weak response with some understanding that: • includes some limited knowledge and understanding of economic
terminology, concepts and principles is shown but some errors are likely
• includes some limited application of relevant economic principles to the given context and/or data to the question
• includes some limited analysis but it may lack focus and/or become confused
• includes some evaluation which is weak and unsupported.
6–10 marks
1
A very weak response that: • includes little relevant knowledge and understanding of economic
terminology, concepts and principles • includes application to the given context which is, at best, very weak • includes attempted analysis which is weak and unsupported.
1–5 marks
5 of 22

MARK SCHEME – A-LEVEL ECONOMICS – 7136/1 – JUNE 2017
Section A Context 1 Total for this Context: 40 marks 0 1 Using the data in Extract A (Figure 1), calculate the three-firm concentration ratio in the
UK parcels delivery market. Give your answer, as a percentage, to one decimal place. [2 marks]
Calculation: 32.8% + 10.4% + 10.3% = 53.5%. Response Max
2 marks
For the correct answer to one decimal place 2 marks
For the correct answer without the % sign and/or not to one decimal place 1 mark
6 of 22

MARK SCHEME – A-LEVEL ECONOMICS – 7136/1 – JUNE 2017
0 2 Explain how the data in Extract A (Figure 2) show that the UK parcels delivery market is
displaying dynamic efficiency. [4 marks]
Response Max
4 marks
• includes evidence that shows that the UK parcels delivery market is displaying dynamic efficiency.
• clearly explains how this data is evidence that the UK parcels delivery market is displaying dynamic efficiency.
4 marks
• includes evidence that shows that the UK parcels delivery market is displaying dynamic efficiency.
• unclear explanation of how this data is evidence that the UK parcels delivery market is displaying dynamic efficiency.
3 marks
• includes evidence that shows that the UK parcels delivery market is displaying dynamic efficiency.
• limited or no explanation of how this data is evidence that the UK parcels delivery market is displaying dynamic efficiency.
2 marks
• includes evidence that does not clearly show that the UK parcels delivery market is displaying dynamic efficiency.
• weak or no explanation of how this data is evidence that the UK parcels delivery market is displaying dynamic efficiency.
1 mark
Relevant issues include: • explanation of the concept of dynamic efficiency • revenue per employee has grown from approximately £160 000 in 2008 to £290 000 in 2014 • the number of employees in the sector has fallen from approximately 58 000 in 2008 to 47 000
in 2014 • these trends suggest that each employee has become more productive over time • explanation of how this is likely to have been caused by improvements in technology,
organisation, investments in capital.
7 of 22

MARK SCHEME – A-LEVEL ECONOMICS – 7136/1 – JUNE 2017
0 3 Extract B (lines 12–14) states that ‘The Universal Postal Service obligations require Royal Mail to deliver letters and parcels to all parts of the country six days a week’. With the help of a monopoly diagram, explain how the Universal Postal Service obligations are likely to affect Royal Mail’s costs and profits.
[9 marks]
Level of response
Response Max 9 marks
3 • is well organised and develops one or more of the key issues that are relevant to the question
• shows sound knowledge and understanding of relevant economic terminology, concepts and principles
• includes good application of relevant economic principles and/or good use of data to support the response
• includes well-focused analysis with a clear, logical chain of reasoning
• includes a relevant diagram that will, at the top of this level, be accurate and used appropriately
7–9 marks
2 • includes one or more issues that are relevant to the question • shows reasonable knowledge and understanding of economic
terminology, concepts and principles but some weaknesses may be present
• includes reasonable application of relevant economic principles and/or data to the question
• includes some reasonable analysis but it might not be adequately developed and may be confused in places
• may include a relevant diagram
4–6 marks
1 • is very brief and/or lacks coherence • shows some limited knowledge and understanding of economic
terminology, concepts and principles but some errors are likely • demonstrates very limited ability to apply relevant economic
principles and/or data to the question • may include some very limited analysis but the analysis lacks
focus and/or becomes confused • may include a relevant diagram but the diagram is not used
and/or is inaccurate in some respects
1–3 marks
8 of 22
MARK SCHEME – A-LEVEL ECONOMICS – 7136/1 – JUNE 2017
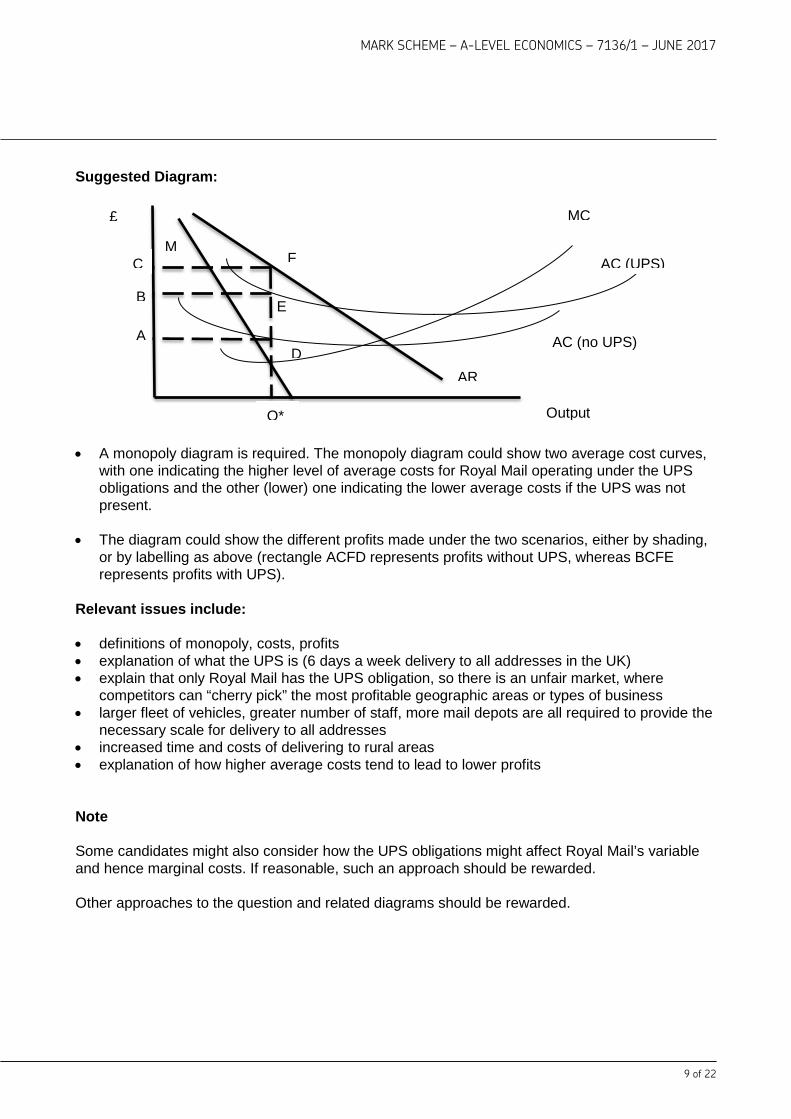
Suggested Diagram:
• A monopoly diagram is required. The monopoly diagram could show two average cost curves,
with one indicating the higher level of average costs for Royal Mail operating under the UPS obligations and the other (lower) one indicating the lower average costs if the UPS was not present.
• The diagram could show the different profits made under the two scenarios, either by shading, or by labelling as above (rectangle ACFD represents profits without UPS, whereas BCFE represents profits with UPS).
Relevant issues include: • definitions of monopoly, costs, profits • explanation of what the UPS is (6 days a week delivery to all addresses in the UK) • explain that only Royal Mail has the UPS obligation, so there is an unfair market, where
competitors can “cherry pick” the most profitable geographic areas or types of business • larger fleet of vehicles, greater number of staff, more mail depots are all required to provide the
necessary scale for delivery to all addresses • increased time and costs of delivering to rural areas • explanation of how higher average costs tend to lead to lower profits Note Some candidates might also consider how the UPS obligations might affect Royal Mail’s variable and hence marginal costs. If reasonable, such an approach should be rewarded. Other approaches to the question and related diagrams should be rewarded.
D
E B
A
M
AC (no UPS)
AC (UPS)
MC
AR
Output
£
Q*
F C
9 of 22

MARK SCHEME – A-LEVEL ECONOMICS – 7136/1 – JUNE 2017
0 4 Extract C (line 2) states that ‘Many competitors are using digital technology to drive
innovation’. Use the extracts and your knowledge of economics to assess whether the benefits outweigh the costs when the Government privatises organisations such as Royal Mail and opens up the market to competition.
[25 marks]
Areas for discussion include: • explanation of privatisation and deregulation • the arguments in favour of privatisation in general
• efficiency • investment • greater responsiveness to customer needs • adoption of best practice (including from foreign firms) • building a shareholder culture • one-off impact on public finances
• the arguments against privatisation in general • higher prices due to monopoly/oligopoly power • reduced quality of service • reduced consistency of service • greater risk of externalities • difficulties in identifying the true value of state-owned assets at time of privatisation • costs incurred in the regulation of newly privatised industries • impact on employees and trade unions
• the arguments for and against introducing competition alongside privatisation • impact on customer service quality, reliability and punctuality • impact on customer price • profitability of private operators • impact on technological innovation and dynamic efficiency • value for money for the taxpayer, perhaps with reference to the criticisms of the Government’s
handling of the sale of Royal Mail. • impact on workers’ job security, pay and conditions • regulation of Royal Mail – the split model of competition in parcels but virtually a monopoly in
letters allows for comparisons to be made about the different approaches • reference to the fact that letter collection is more competitive than letter delivery, and the
problems faced by Whistl in attempting to enter the latter market • alternatives to nationalisation and privatisation: such as contracting out, subsidies • the possibility of government failure, either in running a nationalised post service, or in
organising the privatisation process • market failure arguments.
The use of relevant diagrams to support the analysis should be taken into account when assessing the quality of the candidate’s response to the question. Use the levels mark scheme on page 4 to award candidates marks for this question.
10 of 22

MARK SCHEME – A-LEVEL ECONOMICS – 7136/1 – JUNE 2017
Section A Context 2 Total for this Context: 40 marks 0 5 Using the data in Extract D (Figure 3), calculate the mean female labour force
participation rate for the five countries listed. Give your answer to one decimal place. [2 marks]
Calculation: 348/5 = 69.6% Response Max
2 marks
For the correct answer with the % sign and to one decimal place 2 marks
For the correct answer but without the % sign and/or not to one decimal place 1 mark
11 of 22

MARK SCHEME – A-LEVEL ECONOMICS – 7136/1 – JUNE 2017
0 6 Explain how the data in Extract D (Figure 4) show that the degree of inequality between
the pay of male and female workers is falling. [4 marks]
Response Max
4 marks
• includes evidence that shows that the degree of inequality between the pay of male and female workers is falling.
• clearly explains how the data show that the degree of inequality between the pay of male and female workers is falling.
4 marks
• includes evidence that shows that the degree of inequality between the pay of male and female workers is falling.
• unclear explanation of how the data show that the degree of inequality between the pay of male and female workers is falling.
3 marks
• includes evidence that shows that the degree of inequality between the pay of male and female workers is falling.
• limited explanation of how the data show that the degree of inequality between the pay of male and female workers is falling.
2 marks
• includes evidence that does not clearly show that the degree of inequality between the pay of male and female workers is falling.
• no explanation of how the data show that the degree of inequality between the pay of male and female workers is falling.
1 mark
Relevant issues include: • explanation of the degree of inequality / gender pay gap • evidence that women are paid less than men, but this percentage is increasing over the period
(70.1% in 2000, 78.1% in 2008, 80.7% in 2015) • evidence that women’s pay has risen 65.6% over the period, but men’s has risen by only
43.7%. • credit should be given to candidates who quote changes in absolute differences (e.g. £6238 in
2000 £5763 in 2015) in male and female earnings, but to earn 4 marks they should recognise that the ‘degree of inequality’ is measured by the relative pay of male and female workers, as indicated for example, by bullet points 2 and 3
12 of 22

MARK SCHEME – A-LEVEL ECONOMICS – 7136/1 – JUNE 2017
0 7 Extract E (lines 22–23) states that ‘The tendency for women to participate in
low-productivity sectors is now a bigger factor in their low pay than discrimination’. With the help of a diagram, explain how the difference between the marginal revenue product of male and female workers might account for the lower average earnings of women.
[9 marks]
Level of response
Response Max 9 marks
3 • is well organised and develops one or more of the key issues that are relevant to the question
• shows sound knowledge and understanding of relevant economic terminology, concepts and principles
• includes good application of relevant economic principles and/or good use of data to support the response
• includes well-focused analysis with a clear, logical chain of reasoning
• includes a relevant diagram that will, at the top of this level, be accurate and used appropriately
7–9 marks
2 • includes one or more issues that are relevant to the question • shows reasonable knowledge and understanding of economic
terminology, concepts and principles but some weaknesses may be present
• includes reasonable application of relevant economic principles and/or data to the question
• includes some reasonable analysis but it might not be adequately developed and may be confused in places
• may include a relevant diagram
4–6 marks
1 • is very brief and/or lacks coherence • shows some limited knowledge and understanding of economic
terminology, concepts and principles but some errors are likely • demonstrates very limited ability to apply relevant economic
principles and/or data to the question • may include some very limited analysis but the analysis lacks
focus and/or becomes confused • may include a relevant diagram but the diagram is not used
and/or is inaccurate in some respects
1–3 marks
A labour market diagram is expected, showing two different demands for labour/MRP curves representing productivity differentials between men and women.
13 of 22

MARK SCHEME – A-LEVEL ECONOMICS – 7136/1 – JUNE 2017
Relevant issues include: • explanation of MRP / MPP • relationship between marginal productivity and the demand for labour • why labour productivity is likely to affect the wage rate • women are more likely to work in so-called ‘lower productivity industries’, such as the care
sector, than men • the tendency of men to work in occupations where marginal revenue is higher • women tend to be under-represented in more senior roles in many organisations • some employers may perceive women as less productive than their male counterparts within
the same firms/roles, for reasons such as time out of work to have children, discrimination, physical attributes, working hours inflexibility, etc. In sectors where physical productivity is hard to measure, employer perceptions will be critical to labour demand.
14 of 22

MARK SCHEME – A-LEVEL ECONOMICS – 7136/1 – JUNE 2017
0 8 Extract F (lines 19–20) notes that ‘The UK Government recognises the need to raise
aspirations and attainment for girls’. Use the extracts and your knowledge of economics to evaluate the policies that government might use to reduce the gender pay gap.
[25 marks]
Areas for discussion include: • what is meant by the UK gender pay gap • how the pay gap has evolved over time • significance of UK gender pay gap compared with other countries • how supporting trade unions can reduce the wage gap, noting female union membership is
already higher than male, and yet the pay gap persists • higher wages through collective bargaining • the declining significance of unions in general • discussion of how the government would actually encourage women to join unions and
whether that is an appropriate policy for government to pursue • supporting women in the workplace through, eg training, working conditions, encouraging
women to be ambitious (see Extract F) • analysis and assessment of increasing National Minimum Wage rates • analysis and assessment of increasing female labour force participation • legislating for boardroom quotas, as seen in Norway, as a way to promote aspiration and
break the ‘glass ceiling’ • other policies to promote aspiration amongst females, and break down traditional social norms
with respect to, eg school/degree subject choices • UK policy of forcing firms to disclose pay gaps • tougher penalties for firms discriminating against women • impact of policy intervention on wage costs • the case against further intervention, or even reducing existing interventions, to allow market
forces in the labour market to reduce the pay gap • evaluation of how much the pay gap is actually a problem that needs to be addressed
The use of relevant diagrams to support the analysis should be taken into account when assessing the quality of the candidate’s response to the question. Use the levels mark scheme on page 4 to award candidates marks for this question.
15 of 22

MARK SCHEME – A-LEVEL ECONOMICS – 7136/1 – JUNE 2017
Section B
Below is the levels of response marking grid which should be used to mark the 15 mark questions
Level of response
Response
Max 15 marks
3 A good response provides an answer that:
• is well organised and develops a selection of the key issues that are relevant to the question
• shows sound knowledge and understanding of economic terminology, concepts and principles with few, if any, errors
• includes good application of relevant economic principles to the given context and, where appropriate, good use of data to support the response
• includes well-focused analysis with clear, logical chains of reasoning.
11–15 marks
2 A reasonable response provides an answer that:
• focuses on issues that are relevant to the question • shows satisfactory knowledge and understanding of economic
terminology, concepts and principles but some weaknesses may be present
• includes reasonable application of relevant economic principles to the given context and, where appropriate, some use of data to support the response
• includes some reasonable analysis but which might not be adequately developed or becomes confused in places.
6–10 marks
1 A weak response provides an answer that:
• has identified one or more relevant issues • has some limited knowledge and understanding of economic
terminology, concepts and principles but some errors are likely • has very limited application of relevant economic principles to
the given context and/or data to the question • might have some limited analysis but it may lack focus and/or
become confused.
1–5 marks
16 of 22

MARK SCHEME – A-LEVEL ECONOMICS – 7136/1 – JUNE 2017
Section B Essay 1
Total for this Essay: 40 marks
0 9 Explain how price and output are determined for a firm in a monopolistically competitive market, in both the short run and the long run.
[15 marks]
Areas for discussion include: • features of monopolistically competitive market including differentiated products, spare
capacity, some influence over price, good information, no barriers to entry or exit, many producers and consumers
• pricing decisions are made independently of rivals’ strategies • short-run analysis explaining how firms set quantity by profit maximising (MC=MR), and the
price they charge can be worked out from the AR curve. This leads to a degree of abnormal profit assuming AC<AR
• in the long run rival firms have an opportunity to enter the market, given absence of barriers to entry. This results in the existing firm’s demand curve shifting left. The firms still profit maximise, but this is now at a lower level of output, where abnormal profit is likely to be lower/eliminated
The use of relevant diagrams to support the analysis should be taken into account when assessing the quality of the candidate’s response to the question. Use the levels mark scheme on page 15 to award candidates marks for this question.
17 of 22

MARK SCHEME – A-LEVEL ECONOMICS – 7136/1 – JUNE 2017
1 0 Evaluate the view that government regulation of monopolistically competitive markets is
unnecessary, and that policies to encourage competition and prevent the abuse of monopoly power should focus entirely on oligopolies and monopolies.
[25 marks]
Areas for discussion include: • features of monopolistically competitive industries and examples • features of oligopolistic industries and examples • features of monopoly industries and examples • the objectives of government regulators – efficiency/fairness/safety/transparency/political
objectives • the view that regulators should focus on making markets (in whatever form) contestable, and
not worry about the number of firms in the market • reference to the fact that monopolistically competitive sectors have very low barriers to entry so
are likely to be highly contestable • monopolistic competition: picking up on the question’s reference to excessive advertising
spending (much of which is of little social benefit), excessive product differentiation and choice for consumers (too much choice?)
• examples of successful/unsuccessful regulatory interventions • the ability of markets to reduce information asymmetries via, eg review websites, product
testing websites • the need for oligopoly regulation - anti-cartel investigation and enforcement, increasing
competition via breaking up incumbents or encouraging start-ups or international competitors • reference to The Competition and Markets Authority and sectoral regulators such as Ofgem
and Ofwat • different approaches to the regulation of monopolies • allocative/productive/dynamic efficiency/X-inefficiency • issues related to consumer/producer surplus • issues related to economies of scale or natural monopolies • the different types of government regulation – economic/health & safety/consumer rights, etc • market failure arguments • government failure arguments. The use of relevant diagrams to support the analysis should be taken into account when assessing the quality of the candidate’s response to the question. Use the levels mark scheme on page 4 to award candidates marks for this question.
18 of 22

MARK SCHEME – A-LEVEL ECONOMICS – 7136/1 – JUNE 2017
Essay 2
Total for this Essay 40 marks 1 1 Explain the main causes of poverty in the UK.
[15 marks] Areas for discussion include: • distinction between absolute and relative poverty • measures of absolute and relative poverty in the UK • drawing a distinction between wealth and income poverty • drawing a distinction between poverty before/and after housing costs • increasing tendency for those in poverty to be in work as a result of
• low productivity and thus wages • low skills • flexible labour markets and lower trade union power • issues with the tax and benefit system – the poverty trap
• reasons why out-of-work people may be in relative poverty – the unemployment trap • connections between the economic cycle and relative poverty • child poverty. The use of relevant diagrams to support the analysis should be taken into account when assessing the quality of the candidate’s response to the question. Use the levels mark scheme on page 15 to award candidates marks for this question.
19 of 22

MARK SCHEME – A-LEVEL ECONOMICS – 7136/1 – JUNE 2017
1 2 To what extent can the problem of poverty in the UK be solved through the operation of
market forces? Justify your answer. [25 marks]
Areas for discussion include: • discussion of whether relative poverty is a problem, whether it is inevitable and insoluble. • discussion of market forces • the argument that some relative poverty has been created or reinforced by the state, through,
for example the unemployment trap or a culture of benefits dependency • discussion of the fact that the individual people defined as being in relative poverty have not
always been so, and that the UK has reasonably good levels of social mobility with people moving in/out of relative poverty
• market forces can lead to job creation, providing one of the strongest routes out of poverty • low labour taxes and low welfare spending provide stronger incentives for workers to escape
poverty by their own means • many problems associated with housing are linked to failures of policy rather than the market
(eg lack of new homes resulting from Green Belt planning law, etc.) • trickle down effects • the need for government intervention to prevent wealth from being excessively concentrated in
the hands of the rich • why market forces are unlikely to deal adequately with some causes of poverty, eg poverty
amongst the sick, disabled, the old and infirm • arguments in favour of progressive direct taxes rather than regressive indirect taxes • policies that retain an element of incentives, such as working tax credit • the need for government intervention to establish a minimum level of essential human capital
and physical capital investments (eg education and transport infrastructure) • the tendency of markets to increase rather than decrease poverty • the distinction between the impact of market forces on absolute, as opposed to relative,
poverty.
The use of relevant diagrams to support the analysis should be taken into account when assessing the quality of the candidate’s response to the question.
Use the levels mark scheme on page 4 to award candidates marks for this question.
20 of 22
MARK SCHEME – A-LEVEL ECONOMICS – 7136/1 – JUNE 2017
Essay 3
Total for this Essay: 40 marks 1 3 Explain why, in a free market, sugary drinks may be overconsumed.
[15 marks] Areas for discussion include: • explanation of market failure • sugary drinks as demerit goods leading to over-consumption • asymmetric/imperfect information problems as consumers may fail to recognise the true costs
and benefits of what they consume • negative externalities in consumption • examples of negative externalities in consumption arising from sugary drinks • explanation of the specific health concerns and their burden on the NHS • concerns about dental hygiene amongst children • addictive properties of sugary drinks leading to inelastic demand • reference to ‘behavioural’ reasons why sugary drinks might be over-consumed, eg bounded
rationality, bounded self-control, social norms and other cognitive biases • the tendency to undervalue the long-run consequences of consuming sugary drinks (the over-
optimism bias). The use of relevant diagrams to support the analysis should be taken into account when assessing the quality of the candidate’s response to the question. Use the levels mark scheme on page 15 to award candidates marks for this question.
21 of 22

MARK SCHEME – A-LEVEL ECONOMICS – 7136/1 – JUNE 2017
1 4 Evaluate the view that imposing a tax is the most effective government policy for reducing
the market failures arising from overconsumption of unhealthy food and drink. [25 marks]
Areas for discussion include: • the existence of market failure • explanation of how taxes reduce consumption • distinction between specific and ad valorem tax • the argument that if demand is inelastic, this will result in larger tax revenues which can be put
towards public health spending to the same effect • the extent to which the burden of the sugar tax will be passed on to consumers rather than
hitting profits of producers • the likely extent to which producers change their recipes to avoid the tax • the fact that the tax only applies to some sugary drinks, and not others (eg milk-based or fruit-
based drinks), and does not apply to sugary foods such as chocolate bars • unintended consequences (positive and negative) which have emerged (or could emerge) from
the policy • alternative policies such as a minimum price per litre, a rationing of quantity, a ban in school
vending machines, quantitative limits on the sugar added to drinks in the production process, subsidy for healthier alternatives
• policies to increase uptake of healthier alternatives such as water or milk including information campaigns, subsidies, free school milk, etc
• whether more prominent labelling (perhaps using a “teaspoon of sugar” measure) is more or less effective
• whether consumer drinks choice is an appropriate area of interference by the Government, or alternatively evidence of the “nanny state”
• whether insights from behavioural economics offer possible solutions, eg nudge economics, social norms
• government failure arguments The use of relevant diagrams to support the analysis should be taken into account when assessing the quality of the candidate’s response to the question. Use the levels mark scheme on page 4 to award candidates marks for this question.
22 of 22