jupiter mines limited report
TRANSCRIPT

J U P I T E R M I N E S L I M I T E D
REPORT
Jup
iter Min
es Limited
| An
nu
al Rep
ort 2021

Corporate Directory Australian Business Number51 105 991 740
DirectorsBrian GilbertsonNon-executive Chairman; Independent
Paul MurrayNon-executive Director; Independent
Andrew BellNon-executive Director; Independent
Yeongjin HeoNon-executive Director; Non-independent
Hans-Jürgen MendeNon-executive Director; Non-independent
Brian BeemNon-executive Director (Alternate to Hans-Jürgen Mende); Non-independent
Priyank ThapliyalExecutive Director
ExecutivesPriyank ThapliyalChief Executive Officer
Melissa NorthChief Financial Officer and Company Secretary
Principal and Registered OfficeLevel 1016 St Georges TerracePerth WA 6000
Telephone: (08) 9346 5500Email: [email protected]
Share RegistryLink Market Services LimitedQV1 Building Level 12 250 St Georges Terrace Perth WA 6000
Telephone: 1300 554 474Fax: (02) 9287 0303Email: [email protected]: www.linkmarketservices.com.au
AuditorsGrant Thornton Audit Pty Ltd Level 43, 152-158 St Georges Terrace, Perth WA 6000
Telephone: (08) 9480 2000Facsimile: (08) 9322 7787Email: [email protected]: www.grantthornton.com.au
/ Annual Report 2021
ContentsChairman’s Letter 2
Operating and Financial Review 3
Tshipi Borwa Manganese Mine 3
Operating and Financial Review 3
Tshipi Environmental, Social & Governance Report 4
Tshipi Financial Summary 7
Manganese Marketing 8
Central Yilgarn Iron Projects 9
Mineral Resources and Ore Reserves Update 10
Directors’ Report 18
Remuneration Report 23
Corporate Governance Statement 29
Annual Financial Report 40
Statement of Consolidated Profit or Loss and Other Comprehensive Income 41
Statement of Consolidated Financial Position 42
Statement of Consolidated Changes in Equity 43
Statement of Consolidated Cash Flows 44
Notes to the Consolidated Financial Statements 45
Directors’ Declaration 74
Auditor’s Independence Declaration 75
Independent Auditor’s Report 76
Additional Information for Listed Companies 79
2 Jupiter Mines Limited
Chairman’s LetterDear Shareholders,
On behalf of the Board of Jupiter Mines, I am pleased to present the Annual Report for the financial year ending 28 February 2021.
It has certainly been a difficult year for all. This time last year, we were embarking on an unprecedented global humanitarian and economic crisis. To say that Jupiter, and Tshipi, have fared well is an understatement when many businesses suffered. As the overall wellness of its employees and contractors is paramount, Tshipi has employed several resources in response to COVID-19 pandemic.
Whilst the manganese price remined depressed over the year, Tshipi continued to be the enterprising operation it is, by adjusting targets in light of reduced and altered logistics availability. Tshipi remained profitable throughout the pandemic, exporting 3.4 million tonnes and paying dividends to shareholders of just over ZAR 1.43 billion. I applaud the efforts of the management teams on the ground.
Jupiter remained cautious at the beginning of the financial year, however declared total dividends of $59 million, an average yield of 10%.
In the midst of increasing iron ore prices and restricted supply, the Jupiter Board embarked on a demerger of its Central Yilgarn Iron Project, into new company, Juno Minerals. Jupiter shareholders received an in-specie distribution of shares in Juno, and Juno listed on the ASX earlier this month. With the spin-out of Juno now complete, Jupiter moves forward as a pure play manganese company, with a focus on the expansion of the Tshipi mine and consolidation within the Kalahari manganese region.
I again thank all shareholders for your continued support of Jupiter.
Yours Faithfully,
Brian GilbertsonChairman
/ Annual Report 2021 3
Op
eRA
tin
g A
nd
Fin
An
ciA
L R
evie
w
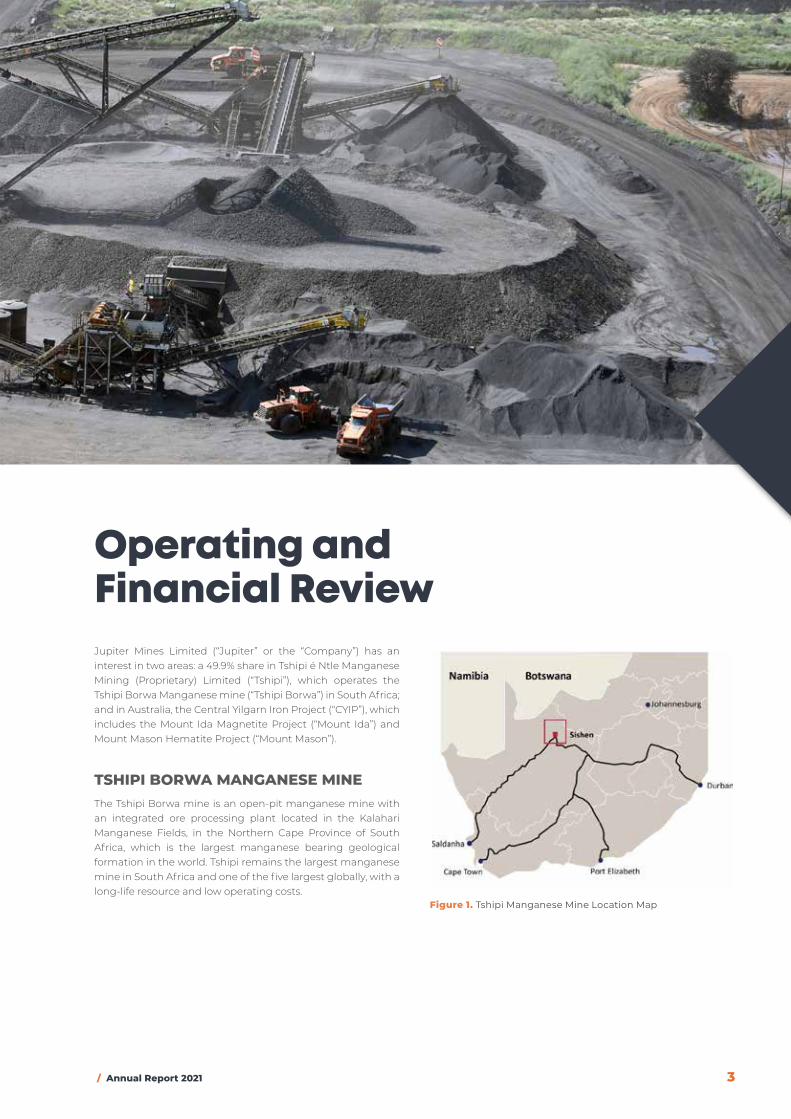
Operating and Financial ReviewJupiter Mines Limited (“Jupiter” or the “Company”) has an interest in two areas: a 49.9% share in Tshipi é Ntle Manganese Mining (Proprietary) Limited (“Tshipi”), which operates the Tshipi Borwa Manganese mine (“Tshipi Borwa”) in South Africa; and in Australia, the Central Yilgarn Iron Project (“CYIP”), which includes the Mount Ida Magnetite Project (“Mount Ida”) and Mount Mason Hematite Project (“Mount Mason”).
tSHipi BORwA MAngAneSe Mine The Tshipi Borwa mine is an open-pit manganese mine with an integrated ore processing plant located in the Kalahari Manganese Fields, in the Northern Cape Province of South Africa, which is the largest manganese bearing geological formation in the world. Tshipi remains the largest manganese mine in South Africa and one of the five largest globally, with a long-life resource and low operating costs.
Figure 1. Tshipi Manganese Mine Location Map
4 Jupiter Mines Limited
Op
erat
ing
an
d F
inan
cial
Rev
iew
Despite a challenging year due to mining and COVID-19 related restrictions, Tshipi exported 3.417 million tonnes (FY2020: 3.408 million tonnes), the second highest exports recorded by Tshipi.
Unit FY2021 FY2020
Mined volume Bcm 12,014,820 12,357,691
Production Tonnes 3,352,146 3,410,111
Sales Tonnes 3,417,585 3,408,552
Average Cost, Insurance & Freight (“CIF”) price achieved (high grade lumpy) CIF, USD/dmtu 4.19 4.86
Average cost of production FOB, ZAR/dmtu 33.80 31.22
Average cost of production FOB, USD/dmtu 2.05 2.14
During the year, Tshipi experienced mining challenges due to difficulty in cuts, delayed fleet mobilisation, excessive rainfall and the South African COVID-19 lockdown. However, Tshipi completed FY2021 above adjusted targeted production with 3.353 million tonnes (FY2020: 3.410 million tonnes).
Manganese prices remained depressed over the year, averaging US$3.83 (per dmtu, Metal Bulletin 37% Free on Board (“FOB”) Port Elizabeth) (FY2020: US$4.18) due to the uncertainty around the COVID-19 pandemic and reduced industrial activity in China.
Tshipi however remained profit and cash positive throughout the year and declared and paid dividends of ZAR1.43 billion (FY2020: ZAR2.015 billion).
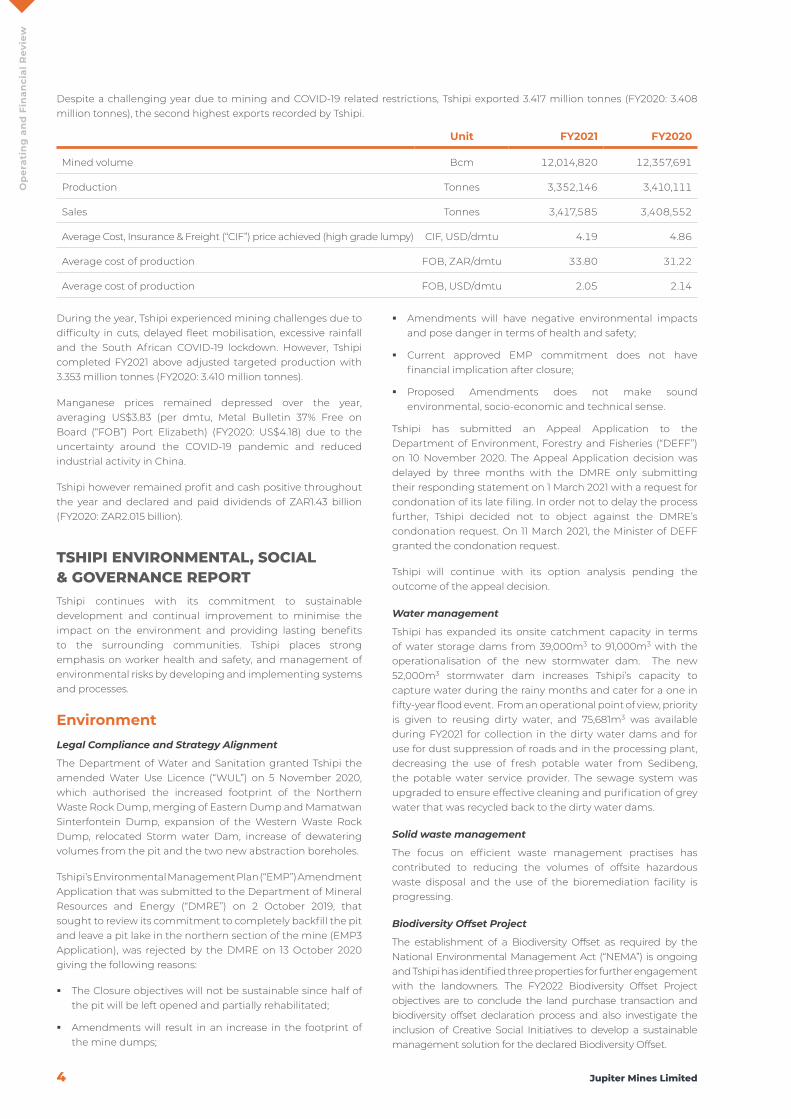
tSHipi enviROnMentAL, SOciAL & gOveRnAnce RepORtTshipi continues with its commitment to sustainable development and continual improvement to minimise the impact on the environment and providing lasting benefits to the surrounding communities. Tshipi places strong emphasis on worker health and safety, and management of environmental risks by developing and implementing systems and processes.
EnvironmentLegal Compliance and Strategy Alignment
The Department of Water and Sanitation granted Tshipi the amended Water Use Licence (“WUL”) on 5 November 2020, which authorised the increased footprint of the Northern Waste Rock Dump, merging of Eastern Dump and Mamatwan Sinterfontein Dump, expansion of the Western Waste Rock Dump, relocated Storm water Dam, increase of dewatering volumes from the pit and the two new abstraction boreholes.
Tshipi’s Environmental Management Plan (“EMP”) Amendment Application that was submitted to the Department of Mineral Resources and Energy (“DMRE”) on 2 October 2019, that sought to review its commitment to completely backfill the pit and leave a pit lake in the northern section of the mine (EMP3 Application), was rejected by the DMRE on 13 October 2020 giving the following reasons:
� The Closure objectives will not be sustainable since half of the pit will be left opened and partially rehabilitated;
� Amendments will result in an increase in the footprint of the mine dumps;
� Amendments will have negative environmental impacts and pose danger in terms of health and safety;
� Current approved EMP commitment does not have financial implication after closure;
� Proposed Amendments does not make sound environmental, socio-economic and technical sense.
Tshipi has submitted an Appeal Application to the Department of Environment, Forestry and Fisheries (“DEFF”) on 10 November 2020. The Appeal Application decision was delayed by three months with the DMRE only submitting their responding statement on 1 March 2021 with a request for condonation of its late filing. In order not to delay the process further, Tshipi decided not to object against the DMRE’s condonation request. On 11 March 2021, the Minister of DEFF granted the condonation request.
Tshipi will continue with its option analysis pending the outcome of the appeal decision.
Water management
Tshipi has expanded its onsite catchment capacity in terms of water storage dams from 39,000m3 to 91,000m3 with the operationalisation of the new stormwater dam. The new 52,000m3 stormwater dam increases Tshipi’s capacity to capture water during the rainy months and cater for a one in fifty-year flood event. From an operational point of view, priority is given to reusing dirty water, and 75,681m3 was available during FY2021 for collection in the dirty water dams and for use for dust suppression of roads and in the processing plant, decreasing the use of fresh potable water from Sedibeng, the potable water service provider. The sewage system was upgraded to ensure effective cleaning and purification of grey water that was recycled back to the dirty water dams.
Solid waste management
The focus on efficient waste management practises has contributed to reducing the volumes of offsite hazardous waste disposal and the use of the bioremediation facility is progressing.
Biodiversity Offset Project
The establishment of a Biodiversity Offset as required by the National Environmental Management Act (“NEMA”) is ongoing and Tshipi has identified three properties for further engagement with the landowners. The FY2022 Biodiversity Offset Project objectives are to conclude the land purchase transaction and biodiversity offset declaration process and also investigate the inclusion of Creative Social Initiatives to develop a sustainable management solution for the declared Biodiversity Offset.
/ Annual Report 2021 5
Op
erat
ing
an
d F
inan
cial
Rev
iew
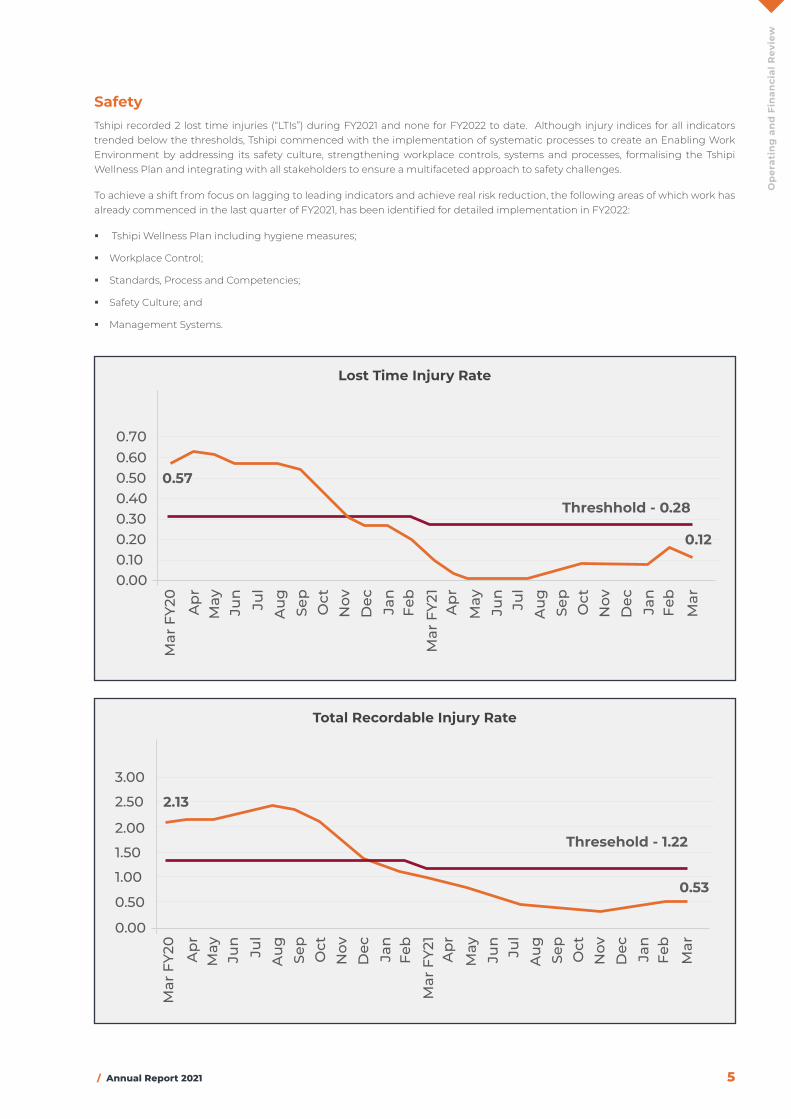
SafetyTshipi recorded 2 lost time injuries (“LTIs”) during FY2021 and none for FY2022 to date. Although injury indices for all indicators trended below the thresholds, Tshipi commenced with the implementation of systematic processes to create an Enabling Work Environment by addressing its safety culture, strengthening workplace controls, systems and processes, formalising the Tshipi Wellness Plan and integrating with all stakeholders to ensure a multifaceted approach to safety challenges.
To achieve a shift from focus on lagging to leading indicators and achieve real risk reduction, the following areas of which work has already commenced in the last quarter of FY2021, has been identified for detailed implementation in FY2022:
� Tshipi Wellness Plan including hygiene measures;
� Workplace Control;
� Standards, Process and Competencies;
� Safety Culture; and
� Management Systems.
Lost Time Injury Rate
Total Recordable Injury Rate
0.20
0.00
0.40
0.600.50
0.30
0.10
0.70
Mar
FY2
0
Mar
FY2
1
Ap
rM
ayJu
n
Jun
Jul
Jul
Au
gSe
pO
ctN
ovD
ec Jan
Feb
Au
gSe
pO
ctN
ovD
ec Jan
Feb
Mar
Ap
r
May
0.57
0.12
Threshhold - 0.28
Thresehold - 1.22
0.00
0.50
1.50
2.50
1.00
2.00
3.00
Mar
FY2
0
Mar
FY2
1
Ap
rM
ayJu
n
Jun
Jul
Jul
Au
gSe
pO
ctN
ovD
ec Jan
Feb
Au
gSe
pO
ctN
ovD
ec Jan
Feb
Mar
Ap
r
May
0.53
2.13

6 Jupiter Mines Limited
Op
erat
ing
an
d F
inan
cial
Rev
iew
Health & Corporate Social Responsibility The overall wellness of employees remains a strategic imperative to Tshipi and more so with the outbreak of COVID-19 during March 2020 in South Africa. Tshipi augmented the onsite health service with further capacity in terms of full-time screening staff and resources, which assisted greatly in containing the spread of COVID-19 when Tshipi recorded its first case on 13 July 2020. A Moolmans employee sadly passed away on 12 May 2021. The cause of death on the certificate was due to natural death, however subsequently a positive COVID-19 test result was received.
Tshipi continues to provide free onsite medical screening and health care for all employees, including Contractors. Through the Wellness section and the Memorandum of Understanding with the Department of Health, the clinic provides medication and long-term treatment for Diabetes, Hypertension, Asthma, Epilepsy and HIV and Aids, and has recorded an uptake of 81% of employees that were impacted by health issues. Tshipi has also employed a Dietician on a part-time basis to address the underlying causes of employee health issues and 61% of impacted employees are making use of this service. The Clinic has conducted 2,600 medical screenings during FY2021, of which the only abnormalities, recorded at 3%, were associated with pre-employment offsite hearing loss.
Health incidents are trending in the right direction, confirming that the strategy is yielding the intended benefits to employees and the operation at large.
In response to the COVID-19 pandemic, Tshipi continues maintaining a rigorous screening process and testing program for those employees who fulfil the criteria for testing, and enforcement of onsite and offsite preventative behaviour campaign as its highest control against the spread of COVID-19. In addition to the onboarding of COVID-19 Medical Screening staff to conduct daily screening of all employees, COVID Compliance Coordinators have also been onboarded to conduct continuous compliance monitoring and awareness communication of critical COVID-19 Controls.
Tshipi has also introduced Antigen rapid testing to enable a quick response to COVID-19 suspected cases.
Tshipi has taken action in preparation for the Governmental roll out of COVID-19 vaccines but is however cautiously assessing the potential legal risks associated with Tshipi’s registration and operation of a vaccination site especially in the absence of guidance from legislation and regulator.
Social Economic DevelopmentTshipi’s Corporate Social Responsibility (“CSR”) standing and trend is satisfactory and embeds its belief in transformation and sustainable development. Tshipi is compliant with all CSR legislation and regulations and this ensures that it continues to secure its social license to operate.
Overview of achievements for this reporting period:
� A black ownership exceeding the minimum threshold maintained;
� A workforce comprising of more than 91% Historically Disadvantaged South Africans (“HDSA”);
� Invested in training initiatives for HDSA learners, artisans, apprentices, scholars and employees as committed in Tshipi’s social labour plans;
� Continues with initiatives to divert spend on procuring goods and services to BEE compliant, Black Women Owned, Black Youth Owned and HDSA Owned companies as per commitments with the regulator;
� Completed projects to refurbish school and providing access to water and ablution facilities for school children as well as purchasing of school furniture;
� Contributed towards food security (food parcels) in support of the local Mayor’s initiative over December 2020.
� Tshipi is compliant with the Mining Charter for an audit period of FY2021. Tshipi achieved Level 2 on scorecard elements (Human Resources Development, Employment Equity and Inclusive Procurement, Supplier and Enterprise Development. Tshipi is fully compliant on all ring-fenced elements (Ownership, Housing and Living Condition, and Mine Community Development);
� Tshipi has signed a 3-year wage agreement with the Trade Union on 15 May 2020. The agreement covers the period from FY2021 until FY2023; and
� Tshipi has created an Enterprise and Supplier Development Fund. Creating a Social Fund has allowed Tshipi to proactively respond to the BBBEE Codes and Mining Charter requirements. The Fund will support and invest in supply chain and value chain initiatives mainly but also Social Labour Plan initiatives. The Fund will provide financial and non-financial support in partnership with implementation partners where necessary.
Tshipi’s achievements show how it has used its business success to benefit the environment, economy and tackle social issues.
/ Annual Report 2021 7
Op
erat
ing
an
d F
inan
cial
Rev
iew
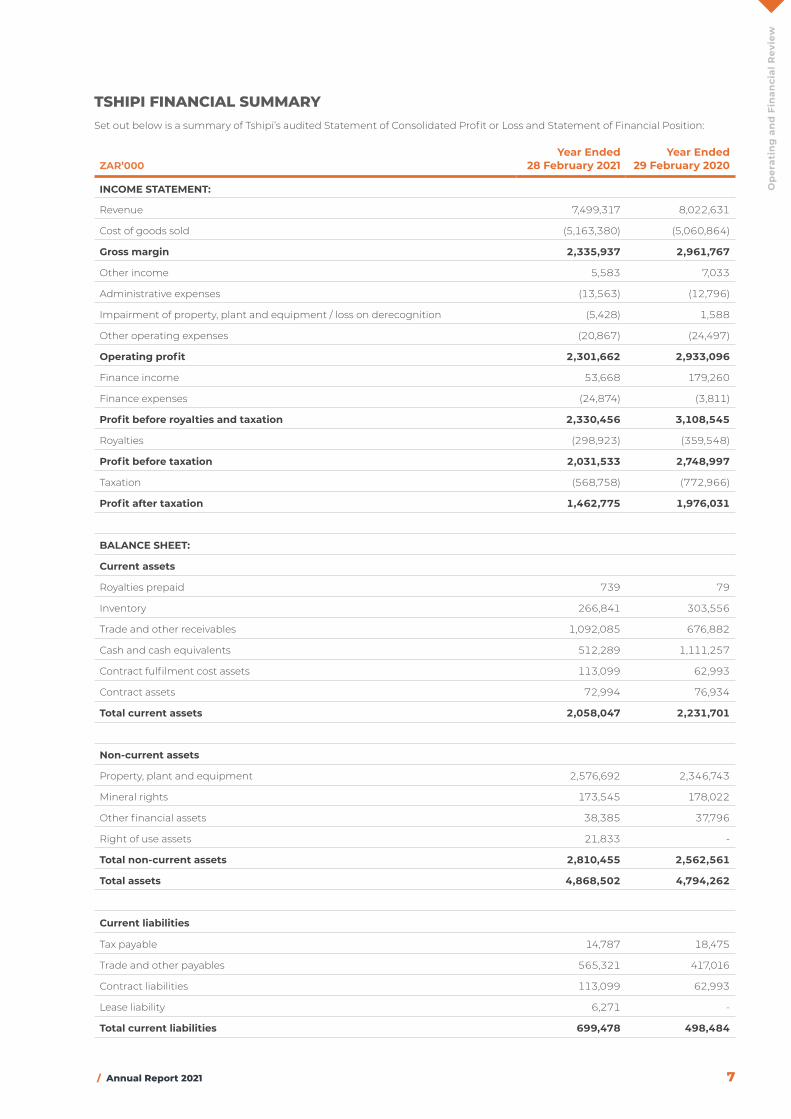
tSHipi FinAnciAL SUMMARYSet out below is a summary of Tshipi’s audited Statement of Consolidated Profit or Loss and Statement of Financial Position:
ZAR’000Year Ended
28 February 2021Year Ended
29 February 2020
INCOME STATEMENT:
Revenue 7,499,317 8,022,631
Cost of goods sold (5,163,380) (5,060,864)
Gross margin 2,335,937 2,961,767
Other income 5,583 7,033
Administrative expenses (13,563) (12,796)
Impairment of property, plant and equipment / loss on derecognition (5,428) 1,588
Other operating expenses (20,867) (24,497)
Operating profit 2,301,662 2,933,096
Finance income 53,668 179,260
Finance expenses (24,874) (3,811)
Profit before royalties and taxation 2,330,456 3,108,545
Royalties (298,923) (359,548)
Profit before taxation 2,031,533 2,748,997
Taxation (568,758) (772,966)
Profit after taxation 1,462,775 1,976,031
BALANCE SHEET:
Current assets
Royalties prepaid 739 79
Inventory 266,841 303,556
Trade and other receivables 1,092,085 676,882
Cash and cash equivalents 512,289 1,111,257
Contract fulfilment cost assets 113,099 62,993
Contract assets 72,994 76,934
Total current assets 2,058,047 2,231,701
Non-current assets
Property, plant and equipment 2,576,692 2,346,743
Mineral rights 173,545 178,022
Other financial assets 38,385 37,796
Right of use assets 21,833 -
Total non-current assets 2,810,455 2,562,561
Total assets 4,868,502 4,794,262
Current liabilities
Tax payable 14,787 18,475
Trade and other payables 565,321 417,016
Contract liabilities 113,099 62,993
Lease liability 6,271 -
Total current liabilities 699,478 498,484
8 Jupiter Mines Limited
Op
erat
ing
an
d F
inan
cial
Rev
iew
ZAR’000Year Ended
28 February 2021Year Ended
29 February 2020
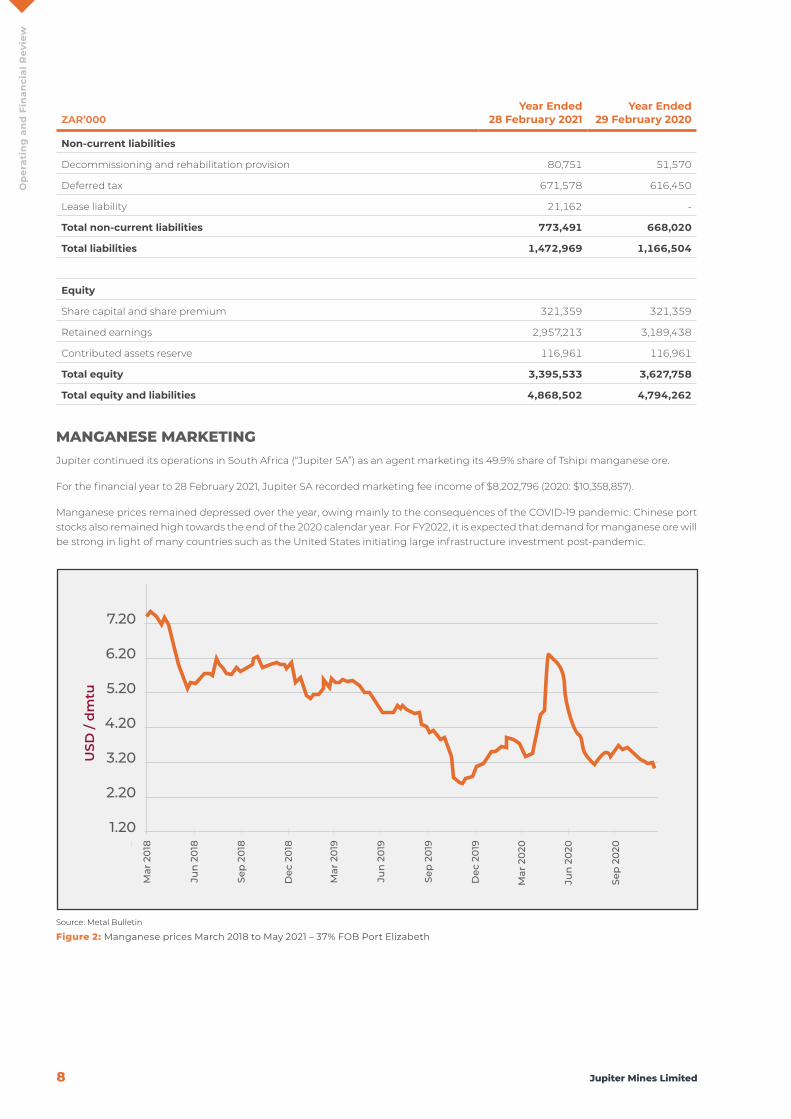
Non-current liabilities
Decommissioning and rehabilitation provision 80,751 51,570
Deferred tax 671,578 616,450
Lease liability 21,162 -
Total non-current liabilities 773,491 668,020
Total liabilities 1,472,969 1,166,504
Equity
Share capital and share premium 321,359 321,359
Retained earnings 2,957,213 3,189,438
Contributed assets reserve 116,961 116,961
Total equity 3,395,533 3,627,758
Total equity and liabilities 4,868,502 4,794,262
MAngAneSe MARKetingJupiter continued its operations in South Africa (“Jupiter SA”) as an agent marketing its 49.9% share of Tshipi manganese ore.
For the financial year to 28 February 2021, Jupiter SA recorded marketing fee income of $8,202,796 (2020: $10,358,857).
Manganese prices remained depressed over the year, owing mainly to the consequences of the COVID-19 pandemic. Chinese port stocks also remained high towards the end of the 2020 calendar year. For FY2022, it is expected that demand for manganese ore will be strong in light of many countries such as the United States initiating large infrastructure investment post-pandemic.
1.20
USD
/ d
mtu
2.20
3.20
4.20
5.20
6.20
7.20
Mar
20
18
Jun
20
18
Sep
20
18
Dec
20
18
Mar
20
19
Jun
20
19
Sep
20
19
Jun
20
20
Sep
20
20
Dec
20
19
Mar
20
20
Source: Metal Bulletin
Figure 2: Manganese prices March 2018 to May 2021 – 37% FOB Port Elizabeth

/ Annual Report 2021 9
Op
erat
ing
an
d F
inan
cial
Rev
iew
centRAL YiLgARn iROn pROJectSThe Central Yilgarn Iron Project is located 130km by road northwest of the town of Menzies. The CYIP consists of the long-life Mount Ida Magnetite project and the smaller Mount Mason Hematite DSO project. Both projects are planned around existing infrastructure in the region, including the Leonora to Esperance railway line, and the Port of Esperance.
The flagship Mount Ida Magnetite Project has the high quality JORC mineral resources to be a tier one long-life magnetite mine.
The Mount Mason high-grade hematite mineralisation is located approximately 12km northwest of the Mount Ida Magnetite Project. It has the potential to be a low-cost start-up, near term project with a short payback period.
In October 2020, Jupiter announced its intention to demerger the CYIP assets into a new company, Juno Minerals Limited (“Juno”). Juno would also apply to be listed on the ASX with the focus of developing the Mount Mason project in the near-term. The Mining Assets Sale and Purchase Agreement was completed in January 2021, and the demerger was finalised in early May.
Figure 3. CYIP Project Location Map
10 Jupiter Mines Limited
Min
eral
Res
ou
rces
an
d O
re R
eser
ves
Up
dat
e
Mineral Resources and Ore Reserves UpdateJupiter reports mineral resources and ore reserves in accordance with the 2012 edition of the Australasian Code for Reporting Exploration Results, Mineral Resources and Ore Reserves (the JORC Code) as required by Chapter 5 of the ASX Listing Rules.
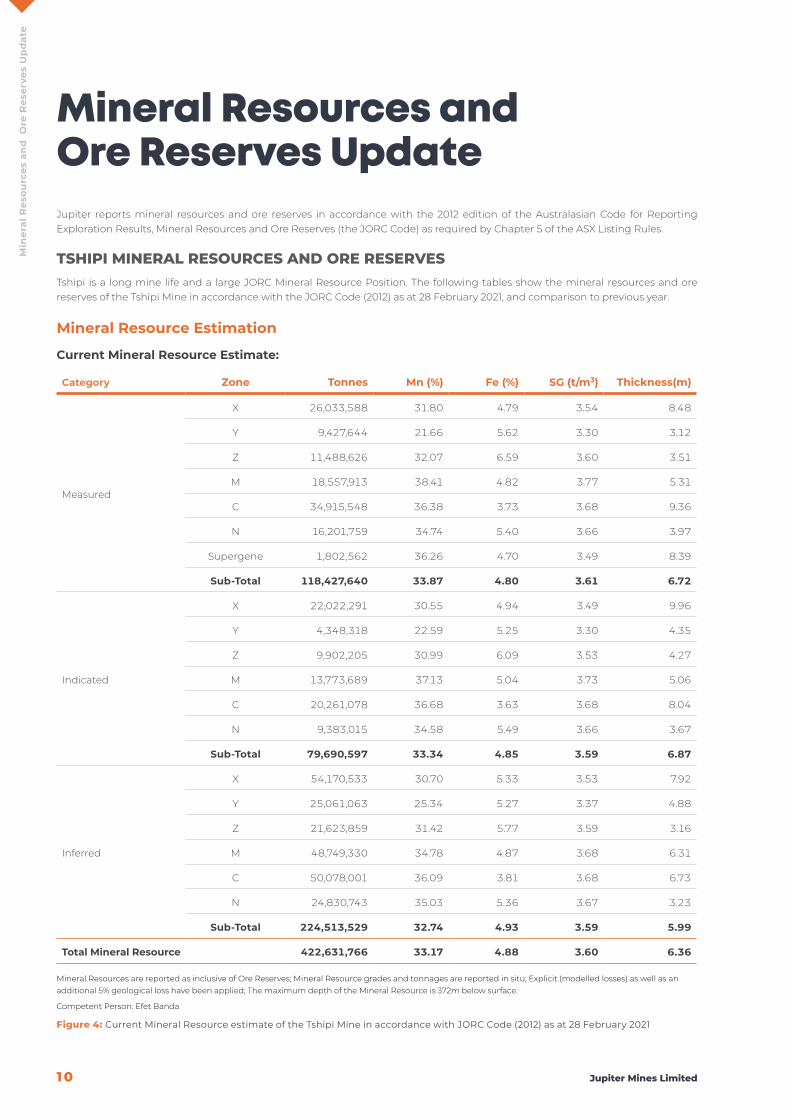
tSHipi MineRAL ReSOURceS And ORe ReSeRveSTshipi is a long mine life and a large JORC Mineral Resource Position. The following tables show the mineral resources and ore reserves of the Tshipi Mine in accordance with the JORC Code (2012) as at 28 February 2021, and comparison to previous year.
Mineral Resource Estimation
Current Mineral Resource Estimate:
Category Zone Tonnes Mn (%) Fe (%) SG (t/m3) Thickness(m)
Measured
X 26,033,588 31.80 4.79 3.54 8.48
Y 9,427,644 21.66 5.62 3.30 3.12
Z 11,488,626 32.07 6.59 3.60 3.51
M 18,557,913 38.41 4.82 3.77 5.31
C 34,915,548 36.38 3.73 3.68 9.36
N 16,201,759 34.74 5.40 3.66 3.97
Supergene 1,802,562 36.26 4.70 3.49 8.39
Sub-Total 118,427,640 33.87 4.80 3.61 6.72
Indicated
X 22,022,291 30.55 4.94 3.49 9.96
Y 4,348,318 22.59 5.25 3.30 4.35
Z 9,902,205 30.99 6.09 3.53 4.27
M 13,773,689 37.13 5.04 3.73 5.06
C 20,261,078 36.68 3.63 3.68 8.04
N 9,383,015 34.58 5.49 3.66 3.67
Sub-Total 79,690,597 33.34 4.85 3.59 6.87
Inferred
X 54,170,533 30.70 5.33 3.53 7.92
Y 25,061,063 25.34 5.27 3.37 4.88
Z 21,623,859 31.42 5.77 3.59 3.16
M 48,749,330 34.78 4.87 3.68 6.31
C 50,078,001 36.09 3.81 3.68 6.73
N 24,830,743 35.03 5.36 3.67 3.23
Sub-Total 224,513,529 32.74 4.93 3.59 5.99
Total Mineral Resource 422,631,766 33.17 4.88 3.60 6.36
Mineral Resources are reported as inclusive of Ore Reserves; Mineral Resource grades and tonnages are reported in situ; Explicit (modelled losses) as well as an additional 5% geological loss have been applied; The maximum depth of the Mineral Resource is 372m below surface.
Competent Person: Efet Banda
Figure 4: Current Mineral Resource estimate of the Tshipi Mine in accordance with JORC Code (2012) as at 28 February 2021
/ Annual Report 2021 1 1
Min
eral
Res
ou
rces
an
d O
re R
eser
ves
Up
dat
e
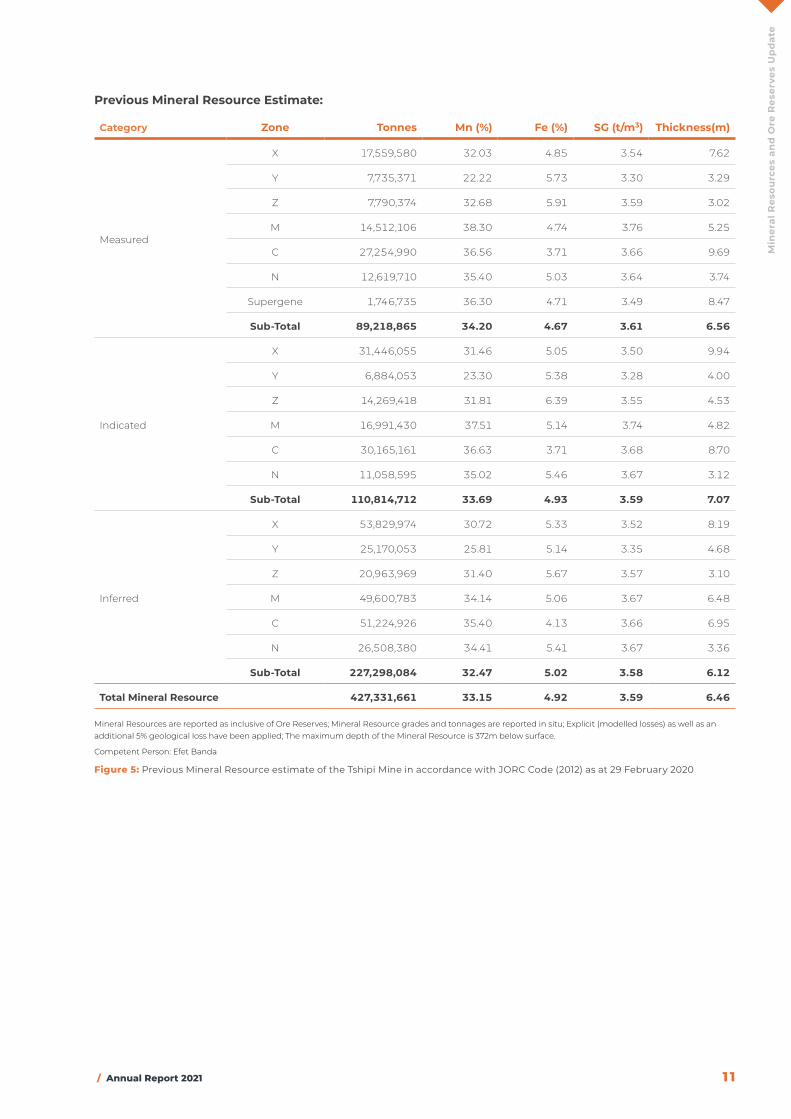
Previous Mineral Resource Estimate:
Category Zone Tonnes Mn (%) Fe (%) SG (t/m3) Thickness(m)
Measured
X 17,559,580 32.03 4.85 3.54 7.62
Y 7,735,371 22.22 5.73 3.30 3.29
Z 7,790,374 32.68 5.91 3.59 3.02
M 14,512,106 38.30 4.74 3.76 5.25
C 27,254,990 36.56 3.71 3.66 9.69
N 12,619,710 35.40 5.03 3.64 3.74
Supergene 1,746,735 36.30 4.71 3.49 8.47
Sub-Total 89,218,865 34.20 4.67 3.61 6.56
Indicated
X 31,446,055 31.46 5.05 3.50 9.94
Y 6,884,053 23.30 5.38 3.28 4.00
Z 14,269,418 31.81 6.39 3.55 4.53
M 16,991,430 37.51 5.14 3.74 4.82
C 30,165,161 36.63 3.71 3.68 8.70
N 11,058,595 35.02 5.46 3.67 3.12
Sub-Total 110,814,712 33.69 4.93 3.59 7.07
Inferred
X 53,829,974 30.72 5.33 3.52 8.19
Y 25,170,053 25.81 5.14 3.35 4.68
Z 20,963,969 31.40 5.67 3.57 3.10
M 49,600,783 34.14 5.06 3.67 6.48
C 51,224,926 35.40 4.13 3.66 6.95
N 26,508,380 34.41 5.41 3.67 3.36
Sub-Total 227,298,084 32.47 5.02 3.58 6.12
Total Mineral Resource 427,331,661 33.15 4.92 3.59 6.46
Mineral Resources are reported as inclusive of Ore Reserves; Mineral Resource grades and tonnages are reported in situ; Explicit (modelled losses) as well as an additional 5% geological loss have been applied; The maximum depth of the Mineral Resource is 372m below surface.
Competent Person: Efet Banda
Figure 5: Previous Mineral Resource estimate of the Tshipi Mine in accordance with JORC Code (2012) as at 29 February 2020
12 Jupiter Mines Limited
Min
eral
Res
ou
rces
an
d O
re R
eser
ves
Up
dat
e
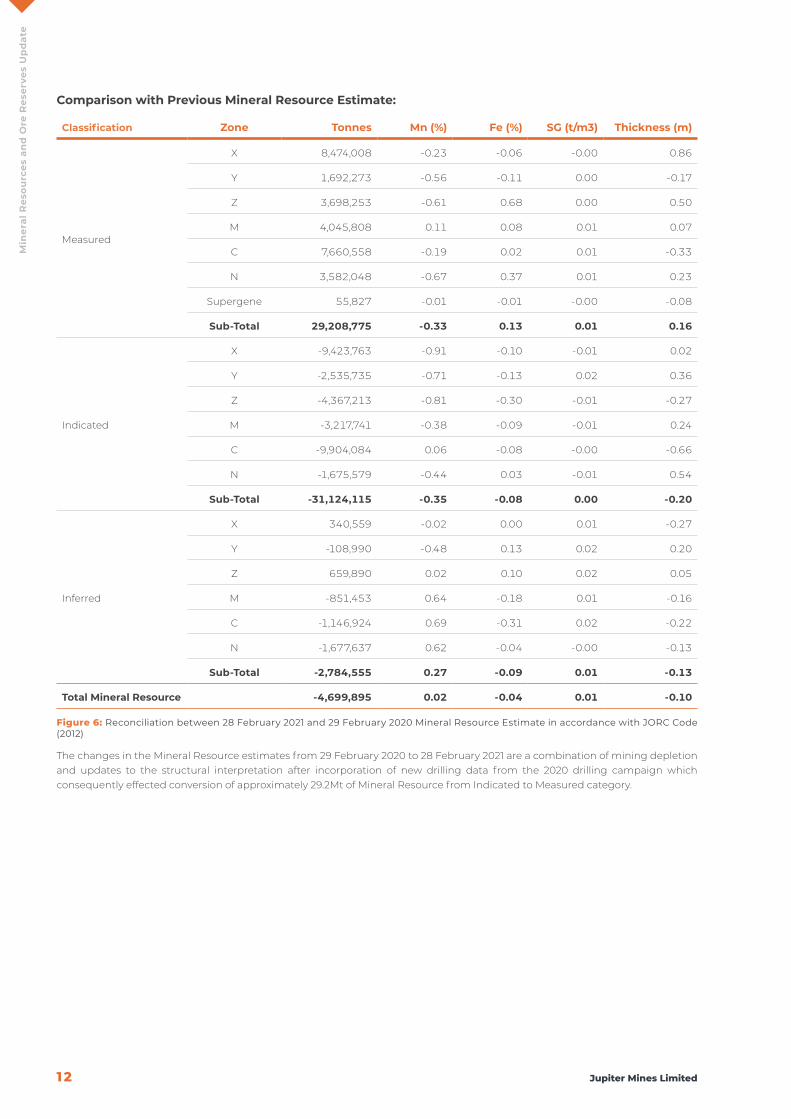
Comparison with Previous Mineral Resource Estimate:
Classification Zone Tonnes Mn (%) Fe (%) SG (t/m3) Thickness (m)
Measured
X 8,474,008 -0.23 -0.06 -0.00 0.86
Y 1,692,273 -0.56 -0.11 0.00 -0.17
Z 3,698,253 -0.61 0.68 0.00 0.50
M 4,045,808 0.11 0.08 0.01 0.07
C 7,660,558 -0.19 0.02 0.01 -0.33
N 3,582,048 -0.67 0.37 0.01 0.23
Supergene 55,827 -0.01 -0.01 -0.00 -0.08
Sub-Total 29,208,775 -0.33 0.13 0.01 0.16
Indicated
X -9,423,763 -0.91 -0.10 -0.01 0.02
Y -2,535,735 -0.71 -0.13 0.02 0.36
Z -4,367,213 -0.81 -0.30 -0.01 -0.27
M -3,217,741 -0.38 -0.09 -0.01 0.24
C -9,904,084 0.06 -0.08 -0.00 -0.66
N -1,675,579 -0.44 0.03 -0.01 0.54
Sub-Total -31,124,115 -0.35 -0.08 0.00 -0.20
Inferred
X 340,559 -0.02 0.00 0.01 -0.27
Y -108,990 -0.48 0.13 0.02 0.20
Z 659,890 0.02 0.10 0.02 0.05
M -851,453 0.64 -0.18 0.01 -0.16
C -1,146,924 0.69 -0.31 0.02 -0.22
N -1,677,637 0.62 -0.04 -0.00 -0.13
Sub-Total -2,784,555 0.27 -0.09 0.01 -0.13
Total Mineral Resource -4,699,895 0.02 -0.04 0.01 -0.10
Figure 6: Reconciliation between 28 February 2021 and 29 February 2020 Mineral Resource Estimate in accordance with JORC Code (2012)
The changes in the Mineral Resource estimates from 29 February 2020 to 28 February 2021 are a combination of mining depletion and updates to the structural interpretation after incorporation of new drilling data from the 2020 drilling campaign which consequently effected conversion of approximately 29.2Mt of Mineral Resource from Indicated to Measured category.
/ Annual Report 2021 13
Min
eral
Res
ou
rces
an
d O
re R
eser
ves
Up
dat
e
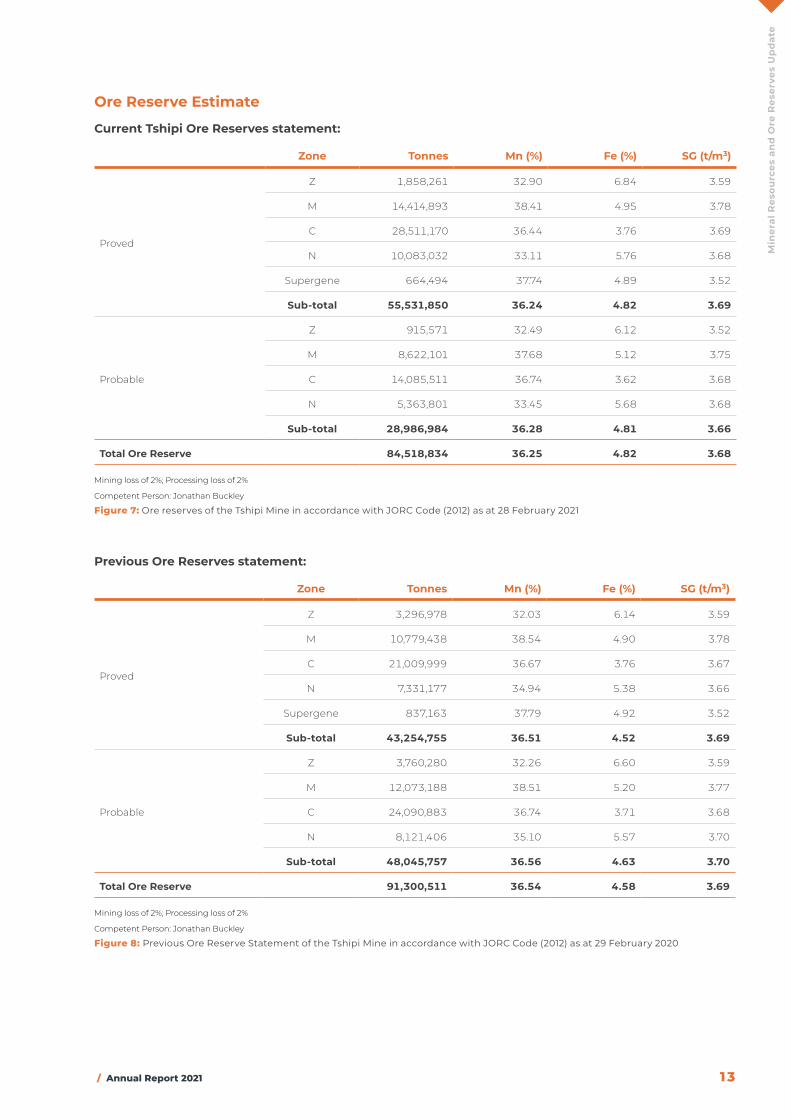
Ore Reserve Estimate
Current Tshipi Ore Reserves statement:
Zone Tonnes Mn (%) Fe (%) SG (t/m3)
Proved
Z 1,858,261 32.90 6.84 3.59
M 14,414,893 38.41 4.95 3.78
C 28,511,170 36.44 3.76 3.69
N 10,083,032 33.11 5.76 3.68
Supergene 664,494 37.74 4.89 3.52
Sub-total 55,531,850 36.24 4.82 3.69
Probable
Z 915,571 32.49 6.12 3.52
M 8,622,101 37.68 5.12 3.75
C 14,085,511 36.74 3.62 3.68
N 5,363,801 33.45 5.68 3.68
Sub-total 28,986,984 36.28 4.81 3.66
Total Ore Reserve 84,518,834 36.25 4.82 3.68
Mining loss of 2%; Processing loss of 2%
Competent Person: Jonathan Buckley
Figure 7: Ore reserves of the Tshipi Mine in accordance with JORC Code (2012) as at 28 February 2021
Previous Ore Reserves statement:
Zone Tonnes Mn (%) Fe (%) SG (t/m3)
Proved
Z 3,296,978 32.03 6.14 3.59
M 10,779,438 38.54 4.90 3.78
C 21,009,999 36.67 3.76 3.67
N 7,331,177 34.94 5.38 3.66
Supergene 837,163 37.79 4.92 3.52
Sub-total 43,254,755 36.51 4.52 3.69
Probable
Z 3,760,280 32.26 6.60 3.59
M 12,073,188 38.51 5.20 3.77
C 24,090,883 36.74 3.71 3.68
N 8,121,406 35.10 5.57 3.70
Sub-total 48,045,757 36.56 4.63 3.70
Total Ore Reserve 91,300,511 36.54 4.58 3.69
Mining loss of 2%; Processing loss of 2%
Competent Person: Jonathan Buckley
Figure 8: Previous Ore Reserve Statement of the Tshipi Mine in accordance with JORC Code (2012) as at 29 February 2020
14 Jupiter Mines Limited
Min
eral
Res
ou
rces
an
d O
re R
eser
ves
Up
dat
e
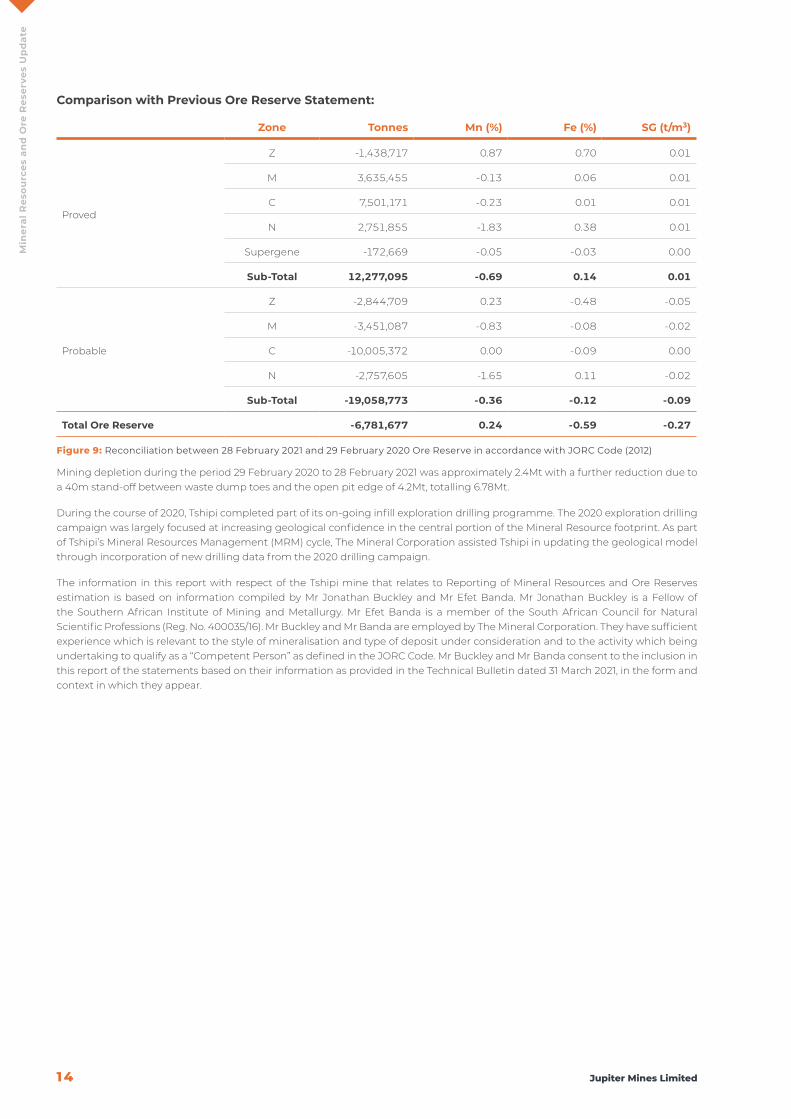
Comparison with Previous Ore Reserve Statement:
Zone Tonnes Mn (%) Fe (%) SG (t/m3)
Proved
Z -1,438,717 0.87 0.70 0.01
M 3,635,455 -0.13 0.06 0.01
C 7,501,171 -0.23 0.01 0.01
N 2,751,855 -1.83 0.38 0.01
Supergene -172,669 -0.05 -0.03 0.00
Sub-Total 12,277,095 -0.69 0.14 0.01
Probable
Z -2,844,709 0.23 -0.48 -0.05
M -3,451,087 -0.83 -0.08 -0.02
C -10,005,372 0.00 -0.09 0.00
N -2,757,605 -1.65 0.11 -0.02
Sub-Total -19,058,773 -0.36 -0.12 -0.09
Total Ore Reserve -6,781,677 0.24 -0.59 -0.27
Figure 9: Reconciliation between 28 February 2021 and 29 February 2020 Ore Reserve in accordance with JORC Code (2012)
Mining depletion during the period 29 February 2020 to 28 February 2021 was approximately 2.4Mt with a further reduction due to a 40m stand-off between waste dump toes and the open pit edge of 4.2Mt, totalling 6.78Mt.
During the course of 2020, Tshipi completed part of its on-going infill exploration drilling programme. The 2020 exploration drilling campaign was largely focused at increasing geological confidence in the central portion of the Mineral Resource footprint. As part of Tshipi’s Mineral Resources Management (MRM) cycle, The Mineral Corporation assisted Tshipi in updating the geological model through incorporation of new drilling data from the 2020 drilling campaign.
The information in this report with respect of the Tshipi mine that relates to Reporting of Mineral Resources and Ore Reserves estimation is based on information compiled by Mr Jonathan Buckley and Mr Efet Banda. Mr Jonathan Buckley is a Fellow of the Southern African Institute of Mining and Metallurgy. Mr Efet Banda is a member of the South African Council for Natural Scientific Professions (Reg. No. 400035/16). Mr Buckley and Mr Banda are employed by The Mineral Corporation. They have sufficient experience which is relevant to the style of mineralisation and type of deposit under consideration and to the activity which being undertaking to qualify as a “Competent Person” as defined in the JORC Code. Mr Buckley and Mr Banda consent to the inclusion in this report of the statements based on their information as provided in the Technical Bulletin dated 31 March 2021, in the form and context in which they appear.

/ Annual Report 2021 15
Min
eral
Res
ou
rces
an
d O
re R
eser
ves
Up
dat
e
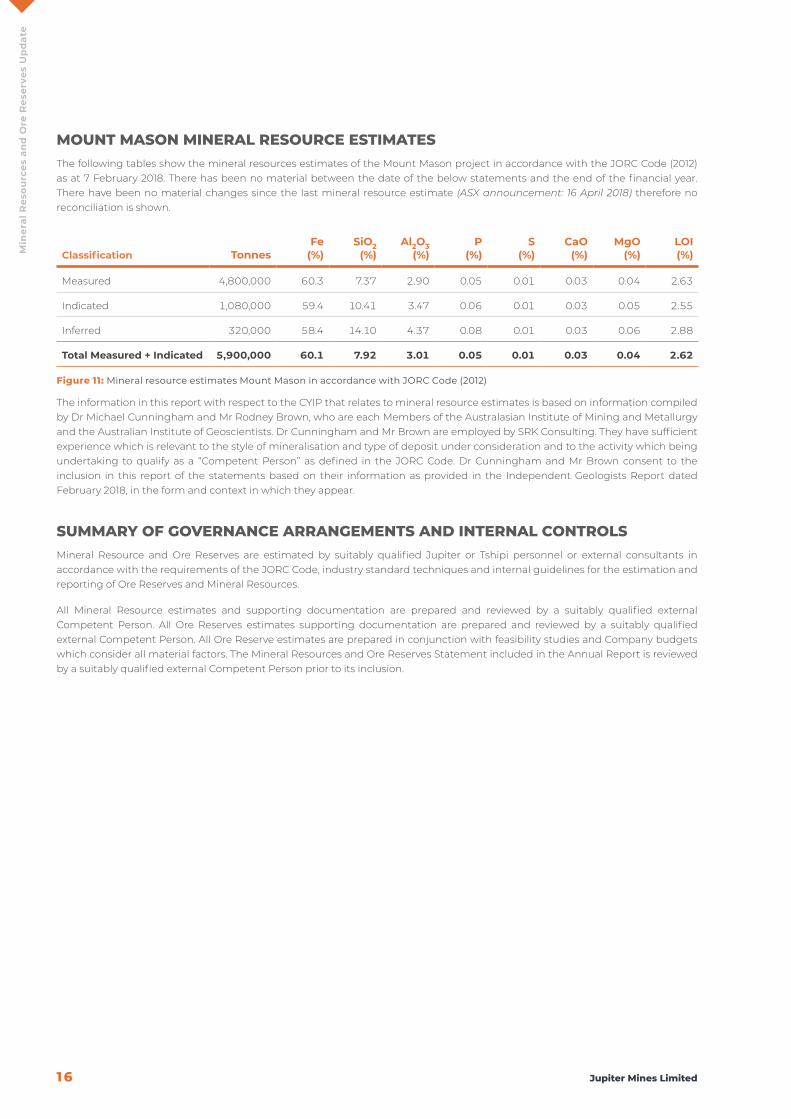
MOUnt idA MineRAL ReSOURce eStiMAteSThe following tables show the Mineral Resource estimates of the Mount Ida project in accordance with the JORC Code (2012) as at 7 February 2018. There has been no material between the date of the below statements and the end of the financial year. There have been no material changes since the last mineral resource estimate (ASX announcement: 16 April 2018) therefore no reconciliation is shown.
Central Zone based on Unweathered BIF with a 10% Magnetic Fe block grade cut-off
Zone/Class MaterialTonnes
x106Fe
(%)SiO2
(%)Al2O3
(%)CaO
(%)P
(%)S
(%)LOI(%)
MgO(%)
MnO(%)
Central
Indicated
In situ total 1,062 30.23 48.47 1.88 2.70 0.07 0.28 -0.56 3.00 0.07
In situ Magnetic 38.45% 25.64 2.64 0.02 0.07 0.01 0.09 -1.14 0.05 0.01
Concentrate 409 66.69 6.86 0.05 0.17 0.01 0.23 -2,97 0.12 0.02
Central
Inferred
In situ total 169 27.03 51.68 2.40 2.92 0.07 0.31 -0.43 3.33 0.10
In situ Magnetic 32.12% 21.31 2.34 0.02 0.06 0.01 0.10 -0.96 0.05 0.01
Concentrate 54 66.34 7.28 0.05 0.17 0.02 0.32 -2.98 0.15 0.02
Central
Total
In situ total 1,231 29.79 48.91 1.95 2.73 0.07 0.28 -0.54 3.05 0.08
In situ Magnetic 37.58% 35.05 2.60 0.02 0.06 0.01 0.09 -1.12 0.05 0.01
Concentrate 463 66.65 6.91 0.05 0.17 0.01 0.24 -2.97 0.12 0.02
South and North Zone based on Unweathered BIF with a 10% Magnetic Fe block grade cut-off
Zone/Class MaterialTonnes
x106Fe
(%)SiO2
(%)Al2O3
(%)CaO
(%)P
(%)S
(%)LOI(%)
MgO(%)
MnO(%)
South
Indicated
In situ total 567 28.63 49.92 2.35 3.47 0.07 0.36 -0.65 2.76 0.09
In situ Magnetic 34.26% 22.93 2.26 0.02 0.07 0.01 0.17 -1.02 0.05 0.01
Concentrate 194 66.93 6.60 0.06 0.21 0.02 0.50 -2.96 0.14 0.03
North
Inferred
In situ total 48 31.63 48.82 1.54 2.20 0.07 0.12 -0.84 2.07 0.06
In situ Magnetic 42.36% 28.32 2.97 0.01 0.07 0.01 0.04 -1.32 0.05 0.02
Concentrate 20 66.85 7.02 0.03 0.16 0.02 0.09 -3.11 0.13 0.05
Nth + Sth
Total
In situ total 615 28.86 49.84 2.28 3.37 0.07 0.34 -0.67 2.71 0.09
In situ Magnetic 34.89% 23.35 2.32 0.02 0.07 0.01 0.16 -1.04 0.05 0.01
Concentrate 214 66.92 6.64 0.05 0.20 0.02 0.46 -2.98 0.14 0.04
Combined Central, South and North Zones based on Unweathered BIF with a 10% Magnetic Fe block grade cut-off
Zone/Class MaterialTonnes
x106Fe
(%)SiO2
(%)Al2O3
(%)CaO
(%)P
(%)S
(%)LOI(%)
MgO(%)
MnO(%)
Combined
Indicated
In situ total 1,062 30.23 48.47 1.88 2.70 0.07 0.28 -0.56 3.00 0.07
In situ Magnetic 38.45% 25.64 2.64 0.02 0.07 0.01 0.09 -1.14 0.05 0.01
Concentrate 408 66.69 6.86 0.05 0.17 0.01 0.23 -2.97 0.12 0.02
Combined
Inferred
In situ total 784 28.47 50.24 2.31 3.28 0.07 0.34 -0.62 2.84 0.09
In situ Magnetic 34.29% 22.91 2.32 0.02 0.07 0.01 0.15 -1.02 0.05 0.01
Concentrate 269 66.81 6.77 0.05 0.20 0.02 0.43 -2.98 0.14 0.03
Combined
Total
In situ total 1,846 29.48 49.22 2.06 2.95 0.07 0.30 -0.58 2.94 0.08
In situ Magnetic 36.68% 24.48 2.50 0.02 0.07 0.01 0.11 -1.09 0.05 0.01
Concentrate 677 66.74 6.83 0.05 0.18 0.01 0.31 -2.97 0.13 0.03
Figure 10: Mineral resource estimates for Mount Ida in accordance with JORC Code (2012)
16 Jupiter Mines Limited
Min
eral
Res
ou
rces
an
d O
re R
eser
ves
Up
dat
e
MOUnt MASOn MineRAL ReSOURce eStiMAteSThe following tables show the mineral resources estimates of the Mount Mason project in accordance with the JORC Code (2012) as at 7 February 2018. There has been no material between the date of the below statements and the end of the financial year. There have been no material changes since the last mineral resource estimate (ASX announcement: 16 April 2018) therefore no reconciliation is shown.
Classification TonnesFe
(%)SiO2
(%)Al2O3
(%)P
(%)S
(%)CaO
(%)MgO
(%)LOI(%)
Measured 4,800,000 60.3 7.37 2.90 0.05 0.01 0.03 0.04 2.63
Indicated 1,080,000 59.4 10.41 3.47 0.06 0.01 0.03 0.05 2.55
Inferred 320,000 58.4 14.10 4.37 0.08 0.01 0.03 0.06 2.88
Total Measured + Indicated 5,900,000 60.1 7.92 3.01 0.05 0.01 0.03 0.04 2.62
Figure 11: Mineral resource estimates Mount Mason in accordance with JORC Code (2012)
The information in this report with respect to the CYIP that relates to mineral resource estimates is based on information compiled by Dr Michael Cunningham and Mr Rodney Brown, who are each Members of the Australasian Institute of Mining and Metallurgy and the Australian Institute of Geoscientists. Dr Cunningham and Mr Brown are employed by SRK Consulting. They have sufficient experience which is relevant to the style of mineralisation and type of deposit under consideration and to the activity which being undertaking to qualify as a “Competent Person” as defined in the JORC Code. Dr Cunningham and Mr Brown consent to the inclusion in this report of the statements based on their information as provided in the Independent Geologists Report dated February 2018, in the form and context in which they appear.
SUMMARY OF gOveRnAnce ARRAngeMentS And inteRnAL cOntROLSMineral Resource and Ore Reserves are estimated by suitably qualified Jupiter or Tshipi personnel or external consultants in accordance with the requirements of the JORC Code, industry standard techniques and internal guidelines for the estimation and reporting of Ore Reserves and Mineral Resources.
All Mineral Resource estimates and supporting documentation are prepared and reviewed by a suitably qualified external Competent Person. All Ore Reserves estimates supporting documentation are prepared and reviewed by a suitably qualified external Competent Person. All Ore Reserve estimates are prepared in conjunction with feasibility studies and Company budgets which consider all material factors. The Mineral Resources and Ore Reserves Statement included in the Annual Report is reviewed by a suitably qualified external Competent Person prior to its inclusion.
/ Annual Report 2021 17
Min
eral
Res
ou
rces
an
d O
re R
eser
ves
Up
dat
e
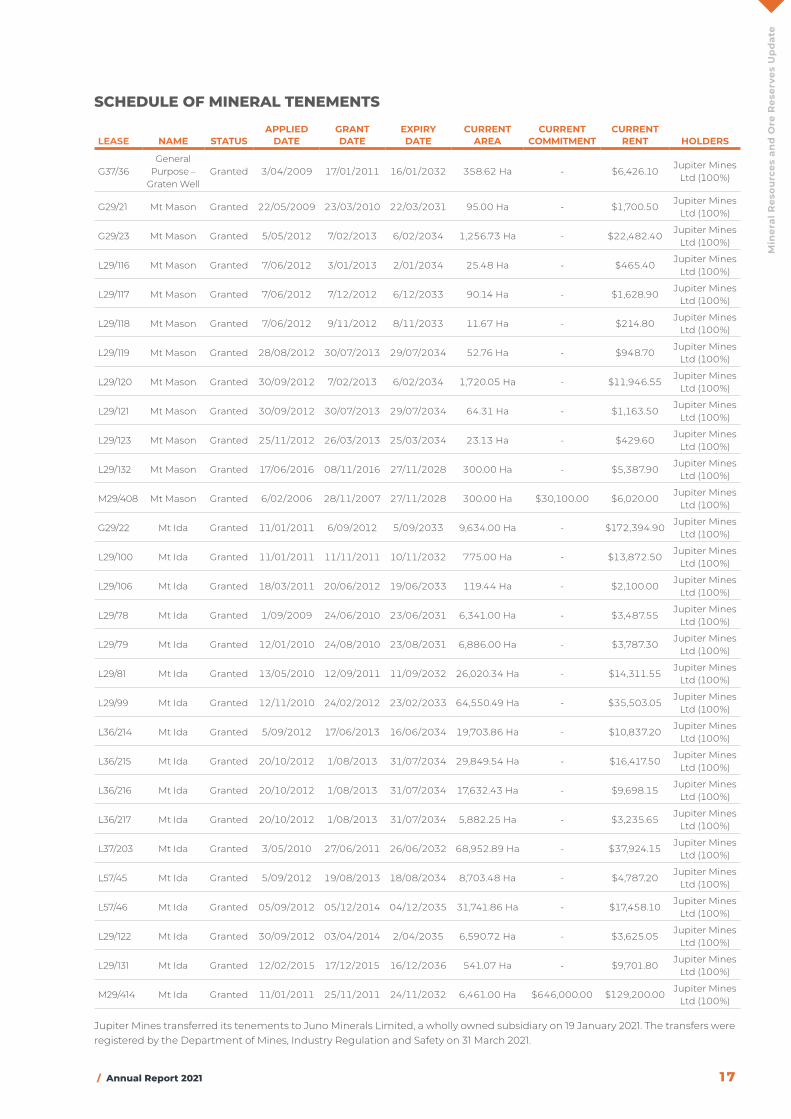
ScHedULe OF MineRAL teneMentS
LEASE NAME STATUSAPPLIED
DATEGRANT DATE
EXPIRY DATE
CURRENT AREA
CURRENT COMMITMENT
CURRENT RENT HOLDERS
G37/36 General
Purpose – Graten Well
Granted 3/04/2009 17/01/2011 16/01/2032 358.62 Ha - $6,426.10Jupiter Mines
Ltd (100%)
G29/21 Mt Mason Granted 22/05/2009 23/03/2010 22/03/2031 95.00 Ha - $1,700.50Jupiter Mines
Ltd (100%)
G29/23 Mt Mason Granted 5/05/2012 7/02/2013 6/02/2034 1,256.73 Ha - $22,482.40Jupiter Mines
Ltd (100%)
L29/116 Mt Mason Granted 7/06/2012 3/01/2013 2/01/2034 25.48 Ha - $465.40Jupiter Mines
Ltd (100%)
L29/117 Mt Mason Granted 7/06/2012 7/12/2012 6/12/2033 90.14 Ha - $1,628.90Jupiter Mines
Ltd (100%)
L29/118 Mt Mason Granted 7/06/2012 9/11/2012 8/11/2033 11.67 Ha - $214.80Jupiter Mines
Ltd (100%)
L29/119 Mt Mason Granted 28/08/2012 30/07/2013 29/07/2034 52.76 Ha - $948.70Jupiter Mines
Ltd (100%)
L29/120 Mt Mason Granted 30/09/2012 7/02/2013 6/02/2034 1,720.05 Ha - $11,946.55Jupiter Mines
Ltd (100%)
L29/121 Mt Mason Granted 30/09/2012 30/07/2013 29/07/2034 64.31 Ha - $1,163.50Jupiter Mines
Ltd (100%)
L29/123 Mt Mason Granted 25/11/2012 26/03/2013 25/03/2034 23.13 Ha - $429.60Jupiter Mines
Ltd (100%)
L29/132 Mt Mason Granted 17/06/2016 08/11/2016 27/11/2028 300.00 Ha - $5,387.90Jupiter Mines
Ltd (100%)
M29/408 Mt Mason Granted 6/02/2006 28/11/2007 27/11/2028 300.00 Ha $30,100.00 $6,020.00Jupiter Mines
Ltd (100%)
G29/22 Mt Ida Granted 11/01/2011 6/09/2012 5/09/2033 9,634.00 Ha - $172,394.90Jupiter Mines
Ltd (100%)
L29/100 Mt Ida Granted 11/01/2011 11/11/2011 10/11/2032 775.00 Ha - $13,872.50Jupiter Mines
Ltd (100%)
L29/106 Mt Ida Granted 18/03/2011 20/06/2012 19/06/2033 119.44 Ha - $2,100.00Jupiter Mines
Ltd (100%)
L29/78 Mt Ida Granted 1/09/2009 24/06/2010 23/06/2031 6,341.00 Ha - $3,487.55Jupiter Mines
Ltd (100%)
L29/79 Mt Ida Granted 12/01/2010 24/08/2010 23/08/2031 6,886.00 Ha - $3,787.30Jupiter Mines
Ltd (100%)
L29/81 Mt Ida Granted 13/05/2010 12/09/2011 11/09/2032 26,020.34 Ha - $14,311.55Jupiter Mines
Ltd (100%)
L29/99 Mt Ida Granted 12/11/2010 24/02/2012 23/02/2033 64,550.49 Ha - $35,503.05Jupiter Mines
Ltd (100%)
L36/214 Mt Ida Granted 5/09/2012 17/06/2013 16/06/2034 19,703.86 Ha - $10,837.20Jupiter Mines
Ltd (100%)
L36/215 Mt Ida Granted 20/10/2012 1/08/2013 31/07/2034 29,849.54 Ha - $16,417.50Jupiter Mines
Ltd (100%)
L36/216 Mt Ida Granted 20/10/2012 1/08/2013 31/07/2034 17,632.43 Ha - $9,698.15Jupiter Mines
Ltd (100%)
L36/217 Mt Ida Granted 20/10/2012 1/08/2013 31/07/2034 5,882.25 Ha - $3,235.65Jupiter Mines
Ltd (100%)
L37/203 Mt Ida Granted 3/05/2010 27/06/2011 26/06/2032 68,952.89 Ha - $37,924.15Jupiter Mines
Ltd (100%)
L57/45 Mt Ida Granted 5/09/2012 19/08/2013 18/08/2034 8,703.48 Ha - $4,787.20Jupiter Mines
Ltd (100%)
L57/46 Mt Ida Granted 05/09/2012 05/12/2014 04/12/2035 31,741.86 Ha - $17,458.10Jupiter Mines
Ltd (100%)
L29/122 Mt Ida Granted 30/09/2012 03/04/2014 2/04/2035 6,590.72 Ha - $3,625.05Jupiter Mines
Ltd (100%)
L29/131 Mt Ida Granted 12/02/2015 17/12/2015 16/12/2036 541.07 Ha - $9,701.80Jupiter Mines
Ltd (100%)
M29/414 Mt Ida Granted 11/01/2011 25/11/2011 24/11/2032 6,461.00 Ha $646,000.00 $129,200.00Jupiter Mines
Ltd (100%)
Jupiter Mines transferred its tenements to Juno Minerals Limited, a wholly owned subsidiary on 19 January 2021. The transfers were registered by the Department of Mines, Industry Regulation and Safety on 31 March 2021.
18 Jupiter Mines Limited
Dir
ecto
rs’ R
epo
rt
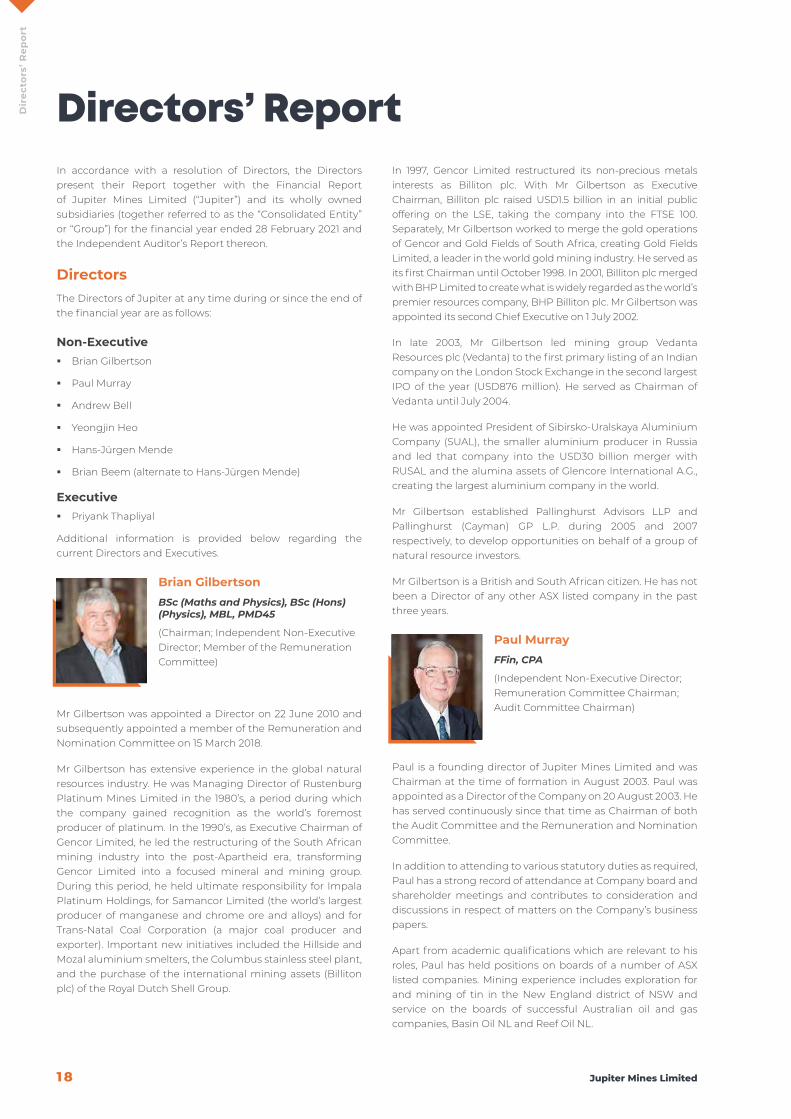
Directors’ Report In accordance with a resolution of Directors, the Directors present their Report together with the Financial Report of Jupiter Mines Limited (“Jupiter”) and its wholly owned subsidiaries (together referred to as the “Consolidated Entity” or “Group”) for the financial year ended 28 February 2021 and the Independent Auditor’s Report thereon.
DirectorsThe Directors of Jupiter at any time during or since the end of the financial year are as follows:
Non-Executive � Brian Gilbertson
� Paul Murray
� Andrew Bell
� Yeongjin Heo
� Hans-Jürgen Mende
� Brian Beem (alternate to Hans-Jürgen Mende)
Executive � Priyank Thapliyal
Additional information is provided below regarding the current Directors and Executives.
Brian Gilbertson BSc (Maths and Physics), BSc (Hons) (Physics), MBL, PMD45
(Chairman; Independent Non-Executive Director; Member of the Remuneration Committee)
Mr Gilbertson was appointed a Director on 22 June 2010 and subsequently appointed a member of the Remuneration and Nomination Committee on 15 March 2018.
Mr Gilbertson has extensive experience in the global natural resources industry. He was Managing Director of Rustenburg Platinum Mines Limited in the 1980’s, a period during which the company gained recognition as the world’s foremost producer of platinum. In the 1990’s, as Executive Chairman of Gencor Limited, he led the restructuring of the South African mining industry into the post-Apartheid era, transforming Gencor Limited into a focused mineral and mining group. During this period, he held ultimate responsibility for Impala Platinum Holdings, for Samancor Limited (the world’s largest producer of manganese and chrome ore and alloys) and for Trans-Natal Coal Corporation (a major coal producer and exporter). Important new initiatives included the Hillside and Mozal aluminium smelters, the Columbus stainless steel plant, and the purchase of the international mining assets (Billiton plc) of the Royal Dutch Shell Group.
In 1997, Gencor Limited restructured its non-precious metals interests as Billiton plc. With Mr Gilbertson as Executive Chairman, Billiton plc raised USD1.5 billion in an initial public offering on the LSE, taking the company into the FTSE 100. Separately, Mr Gilbertson worked to merge the gold operations of Gencor and Gold Fields of South Africa, creating Gold Fields Limited, a leader in the world gold mining industry. He served as its first Chairman until October 1998. In 2001, Billiton plc merged with BHP Limited to create what is widely regarded as the world’s premier resources company, BHP Billiton plc. Mr Gilbertson was appointed its second Chief Executive on 1 July 2002.
In late 2003, Mr Gilbertson led mining group Vedanta Resources plc (Vedanta) to the first primary listing of an Indian company on the London Stock Exchange in the second largest IPO of the year (USD876 million). He served as Chairman of Vedanta until July 2004.
He was appointed President of Sibirsko-Uralskaya Aluminium Company (SUAL), the smaller aluminium producer in Russia and led that company into the USD30 billion merger with RUSAL and the alumina assets of Glencore International A.G., creating the largest aluminium company in the world.
Mr Gilbertson established Pallinghurst Advisors LLP and Pallinghurst (Cayman) GP L.P. during 2005 and 2007 respectively, to develop opportunities on behalf of a group of natural resource investors.
Mr Gilbertson is a British and South African citizen. He has not been a Director of any other ASX listed company in the past three years.
Paul MurrayFFin, CPA
(Independent Non-Executive Director; Remuneration Committee Chairman; Audit Committee Chairman)
Paul is a founding director of Jupiter Mines Limited and was Chairman at the time of formation in August 2003. Paul was appointed as a Director of the Company on 20 August 2003. He has served continuously since that time as Chairman of both the Audit Committee and the Remuneration and Nomination Committee.
In addition to attending to various statutory duties as required, Paul has a strong record of attendance at Company board and shareholder meetings and contributes to consideration and discussions in respect of matters on the Company’s business papers.
Apart from academic qualifications which are relevant to his roles, Paul has held positions on boards of a number of ASX listed companies. Mining experience includes exploration for and mining of tin in the New England district of NSW and service on the boards of successful Australian oil and gas companies, Basin Oil NL and Reef Oil NL.

/ Annual Report 2021 19
Dir
ecto
rs’ R
epo
rt
Andrew Bell B.A. (Hons), M.A., LLB (Hons)
(Independent Non-Executive Director; Audit Committee Member; Remuneration Committee Member)
Andrew was appointed as a Director of Jupiter on 4 June 2008 and subsequently appointed a member of both the Audit Committee and the Remuneration and Nomination Committee on 15 March 2018.
Andrew is Chairman of Red Rock Resources plc, and Power Metal Resources plc, being companies listed on the AIM market of the London Stock Exchange Ltd. He was a natural resources analyst in London in the 1970s, then specialised in investment and investment banking covering the Asia region.
Andrew has been involved in the resource and mining sectors in Asia since the 1990s and has served on the Boards of a number of listed resource companies.
Yeongjin Heo B.A. Law (Seoul National University); MBA (University of Leeds)
(Non-Executive Director; Audit Committee Member)
Mr Heo was appointed as a Director of Jupiter and Member of the Audit Committee on 4 February 2019.
Mr Heo is the President of POSCO Australia Pty Ltd, a significant shareholder of the Company.
After joining POSCO in 1995, Mr Heo worked across the strategic planning and raw materials areas. Mr Heo brings significant experience in the resource industry to Jupiter.
Mr Heo has not been a Director of any other ASX listed companies in the past three years.
Priyank ThapliyalMaterials Science and Engineering, B Tech (IIT-Kanpur, India), M Eng (McMaster, Canada), MBA (Ivey Business School, Canada)
(Executive Director; Chief Executive Officer)
Priyank Thapliyal was appointed as a Director of the Company on 4 June 2008.
Priyank joined Sterlite Industries in 2000 and worked alongside Mr Anil Agarwal (owner) to implement the strategies that led to the creation of Vedanta Resources plc, a FTSE 100 company. Vedanta floated on the London Stock Exchange (LSE) in December 2003 and raised USD 870 million in its IPO, in what was the largest mining IPO on the LSE that year, and also the first primary listing of an Indian company on the LSE. The success of the Vedanta IPO was instrumental in other emerging market mining companies seeking LSE listings.
Subsequent to the LSE listing, he led Vedanta’s first major overseas acquisition via the USD 50 million controlling investment in Konkola Copper Mines (KCM) in Zambia in 2004. At the time of his departure in October 2005 to co-found Pallinghurst Resources LLP, the KCM stake was valued at USD 1 billion, and Vedanta had a market capitalisation of USD 7.5 billion.
Priyank was instrumental in delivering Pallinghurst Resources’ steel feed strategy via Jupiter. That has led to the creation of the flagship Tshipi Mine, from what was a greenfield project, into one of the largest, long-life and low-cost assets of strategic importance.
Prior to Vedanta, Priyank was a mining and metals investment banker with CIBC World Markets in Toronto Canada, is a qualified Metallurgical Engineer, MBA and former Falconbridge employee.
Mr Thapliyal has not been a Director of any other ASX listed companies in the past three years.
Hans-Jürgen MendeMBA (University of Cologne)
(Non-Executive Director)
Mr Mende was appointed as a Director of the Company on 9 October 2019.
Mr Mende is Executive Chairman of the AMCI Group, which he co-founded in 1986. AMCI is a substantial shareholder of Jupiter.
Mr Mende has considerable experience in the global steel and coal industries, and within Australia and South Africa. He has served on the board of many resources companies and was a founder and former non-executive director of Whitehaven Coal.
Mr Mende has not been a Director of any other ASX listed companies in the past three years.
Brian BeemB.A. Politics (Princeton University)
(Non-Executive Director; alternate to Hans-Jürgen Mende)
Mr Beem was appointed as an alternate to Hans Mende on 9 October 2019.
Mr Beem is the Managing Director of the AMCI Group and manages the majority of the portfolio of their private equity investments. Mr Beem has led numerous investments in AMCI portfolio companies and serves on several of their boards.
Mr Beem has not been a Director of any other ASX listed companies in the past three years.

20 Jupiter Mines Limited
Dir
ecto
rs’ R
epo
rt
Melissa NorthB.Com; Chartered Accountant
(Chief Financial Officer; Company Secretary)
Melissa North joined Jupiter Mines in May 2012 as Group Financial Controller and was subsequently appointed CFO and Company Secretary on 15 November 2012.
Prior to joining Jupiter, Melissa held various roles in finance management and business advisory services over almost a decade, including Group Financial Controller positions within the Chime Communications Group (London) and other large media agencies in the United Kingdom. Ms North qualified as a Chartered Accountant in 2004 after extensive work experience at Grant Thornton Perth (now Crowe Horwath).
Over her time with Jupiter, Melissa has played a critical role in the development of the Company, culminating in its ASX listing in April 2018 and its subsequent evolution into a successful ASX 300 company.
Principal ActivitiesThe principal activities of Jupiter during the year have been the operation of the Tshipi Manganese Mine in South Africa and the sale of manganese ore.
Review of Financial Results and OperationsThe consolidated results of Jupiter for the year ended 28 February 2021 was a profit of $67,519,400 after a $643,041 tax benefit (2020: profit of $95,118,503 after a $8,807,588 tax expense). Further details of the results of the Consolidated Entity are set out in the accompanying financial statements in this Annual Report.
Significant Changes in the State of AffairsIn October 2020, Jupiter announced its intention to demerge the CYIP assets into a new company, Juno Minerals Limited (“Juno”). Juno would also apply to be listed on the ASX with the focus of developing the Mount Mason project in the near-term. The Mining Assets Sale and Purchase Agreement was completed in January 2021, and the demerger was finalised in early May.
DividendsIn respect of the 2021 financial year, the Directors have declared the following dividends:
Dividend Dividend per share Total dividend Payment date
Interim unfranked, wholly conduit foreign income $0.01 $19,589,910 Paid 18 November 2020
Final unfranked, wholly conduit foreign income $0.02 $39,179,821 Paid 21 May 2021
$0.03 $58,769,731
Financial PositionAt 28 February 2021, Jupiter held $60,622,311 in cash and cash equivalents (2020: $29,285,067), had a carrying value of investments using the equity method of $430,593,793 (2020: $437,601,406).
Significant Events After Reporting DateThese financial statements were authorised for issue on 27 May 2021 by Director Priyank Thapliyal.
Jupiter received ZAR30,600,000 from its South African marketing operations on 3 May 2021.
On 22 April 2021, the Directors declared a final dividend for the year ended 28 February 2021 of $0.02 per ordinary share, paid on 21 May 2021.
On 7 May 2021, Jupiter completed the demerger of its Central Yilgarn Iron Assets through Juno Minerals Limited (“Juno”), after which Juno was no longer a wholly owned subsidiary of Jupiter.
Likely Developments, Business Strategies and ProspectsThe operations at the Tshipi Borwa Manganese Mine are expected to continue in a similar manner to present.
Environmental Regulations and PerformanceJupiter’s operations are subject to general environmental regulation under the laws of the States and Territories of Australia and South Africa. The various exploration interests held by Jupiter impose future environmental obligations for site remediation following sampling and drilling programs.
The Board is aware of these requirements and management is charged with ensuring compliance. The Directors are not aware of any breaches of these environmental regulations and licence obligations during the year.
Please refer to the Tshipi Environmental, Social & Governance Report in the Operating and Financial Review on page 4 for full details.

/ Annual Report 2021 21
Dir
ecto
rs’ R
epo
rt
Meetings – Attendance by Directors
Board MeetingsThe number of Directors’ meetings and the number of meetings attended by each of the Directors of Jupiter during the financial year under review are:
DirectorNumber of meetings held during
tenure of the Director Number of meetings attended
Brian Gilbertson 9 9
Paul Murray 9 9
Priyank Thapliyal 9 9
Andrew Bell 9 9
Yeongjin Heo 9 9
Hans-Jürgen Mende 9 3
Brian Beem 9 9
Committee MeetingsThe number of committee meetings and the number of meetings attended by each of the Directors of Jupiter during the financial year under review are:
Director
Audit Committee meetings held during tenure
Audit Committee meetings attended
Remuneration Committee meetings
held during tenure
Remuneration Committee
meetings attended
Paul Murray 2 2 2 2
Andrew Bell 2 2 2 2
Yeongjin Heo 2 2 - -
Brian Gilbertson - - 2 2
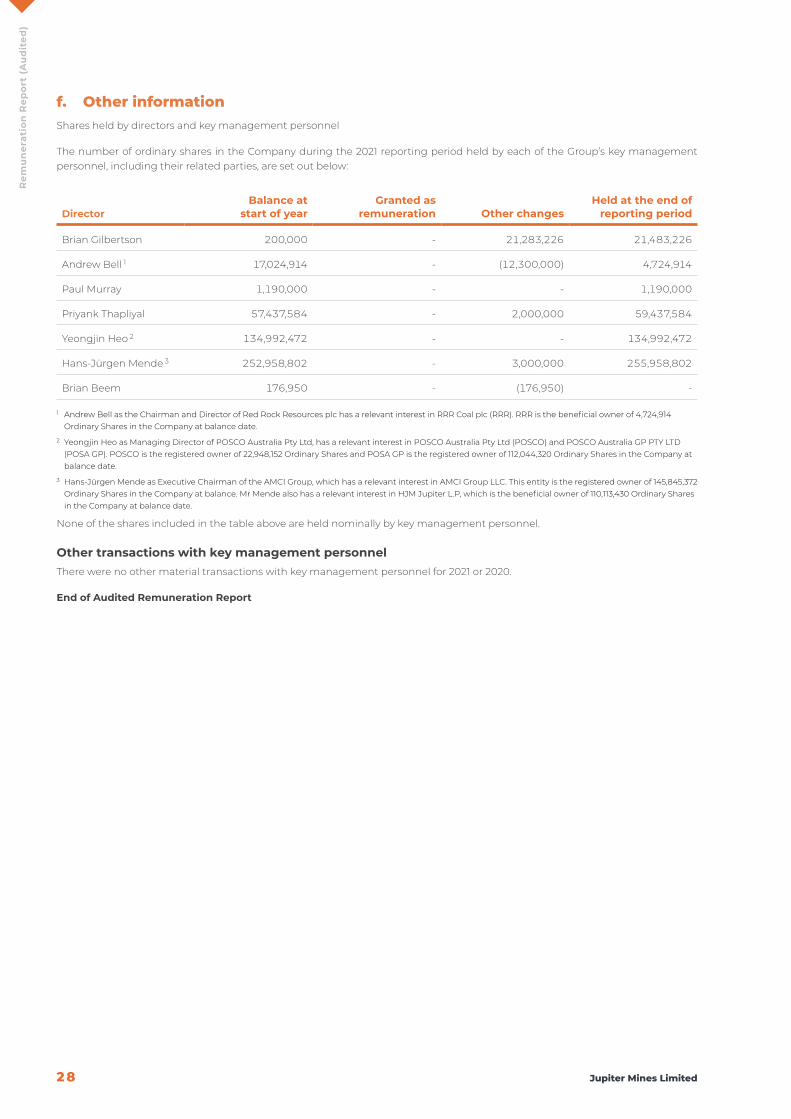
Directors’ InterestsParticulars of Directors’ interests in securities as at the date of this report are as follows:
Director Ordinary Shares Options over Ordinary Shares
Brian Gilbertson 21,483,226 -
Paul Murray 1,190,000 -
Priyank Thapliyal 59,437,584 -
Andrew Bell 1 - -
Yeongjin Heo 2 - -
Hans-Jürgen Mende 3 - -
Brian Beem - -
1 Andrew Bell as the Chairman and Director of RRR Coal plc (RRR). RRR is the beneficial owner of 4,724,914 Ordinary Shares in the Company at the date of this report.
2 Yeongjin Heo is the Managing Director of POSCO Australia Pty Ltd, has a relevant interest in POSCO Australia Pty Ltd (POSCO) and POSCO Australia GP PTY LTD (POSA GP). POSCO is the registered owner of 22,948,152 Ordinary Shares and POSA GP is the registered owner of 112,044,320 Ordinary Shares in the Company at the date of this report.
3 Hans-Jürgen Mende is the Executive Chairman of the AMCI Group, which has a relevant interest in AMCI Group LLC. This entity is the registered owner of 145,845,372 Ordinary Shares in the Company at the date of this report. Mr Mende also has a relevant interest in HJM Jupiter L.P., which is the beneficial owner of 110,113,430 Ordinary Shares in the Company at the date of this report.

22 Jupiter Mines Limited
Dir
ecto
rs’ R
epo
rt
Contracts with DirectorsThere are no agreements with any of the Directors other than remuneration agreements.
Auditor’s Independence DeclarationThe Lead Auditor’s Independence Declaration for the year ended 28 February 2021 has been received and can be found on page 75 of the Annual Report.
Indemnification and Insurance of Officers and AuditorsSince the end of the previous financial year, Jupiter has paid premiums to insure the Directors and Officers of the Consolidated Entity. Details of the nature of the liabilities covered and the amount of premium paid in respect of Directors’ and Officers’ insurance policies preclude disclosure to third parties.
Jupiter has not paid any premiums in respect of any contract insuring its auditor against a liability incurred in that role as an auditor of Jupiter. In respect of non-audit services, Grant Thornton Audit Pty Ltd, Jupiter’s auditor has the benefit of an indemnity to the extent Grant Thornton Audit Pty Ltd reasonably relies on information provided by Jupiter, which is false, misleading or incomplete. No amount has been paid under this indemnity during the financial year ending 28 February 2021 or to the date of this Report.
Non-Audit ServicesThe Board of Directors is satisfied that the provision of non-audit services during the financial year is compatible with the general standard of independence for auditors imposed by the Corporations Act 2001. The Directors are satisfied that the services disclosed below did not compromise the external auditor’s independence for the following reasons:
� all non-audit services are reviewed and approved by the Audit Committee prior to commencement to ensure they do not adversely affect the integrity and objectivity of the auditor; and
� the nature of the services provided does not compromise the general principles relating to auditor independence in accordance with APES 110: Code of Ethics for Professional Accountants set by the Accounting Professional and Ethical Standards Board.
The following fees were paid or payable to Grant Thornton Australia Limited for non-audit services provided during the year ended 28 February 2021:
Taxation and other services $171,642 (2020: $146,337)Corporate finance $34,500 (2020: Nil)
Corporate GovernanceThe Directors aspire to maintain the standards of Corporate Governance appropriate to Jupiter. Jupiter’s Corporate Governance Statement is set out on pages 29 to 39 of this Report.
Proceedings on behalf of JupiterNo person has applied for leave of Court to bring proceedings on behalf of Jupiter or intervene in any proceedings to which Jupiter is a party for the purpose of taking responsibility on behalf of Jupiter for all or any part of those proceedings. Jupiter was not a party to any such proceedings during the year.
The Consolidated Entity was not a party to any such proceedings during the reporting year.
This report is signed in accordance with a resolution of the Board of Directors.
Priyank ThapliyalGuernsey27 May 2021
/ Annual Report 2021 23
Rem
un
erat
ion
Rep
ort
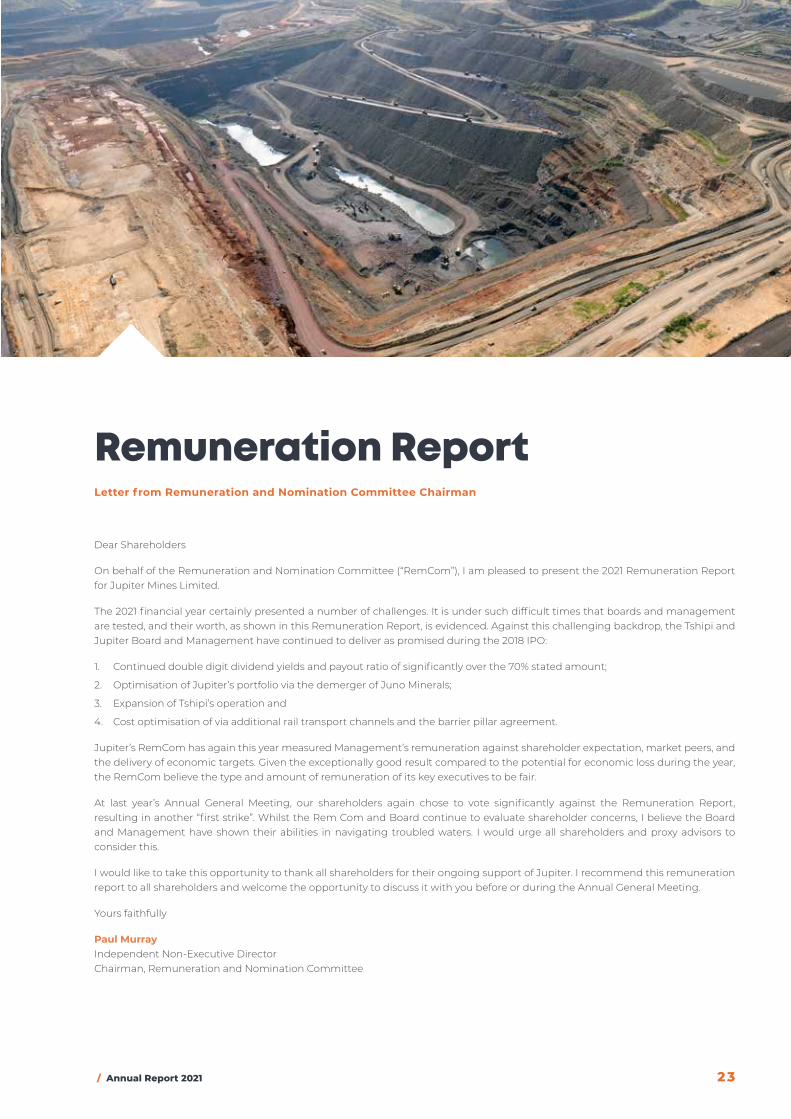
Remuneration Report Letter from Remuneration and Nomination Committee Chairman
Dear Shareholders
On behalf of the Remuneration and Nomination Committee (“RemCom”), I am pleased to present the 2021 Remuneration Report for Jupiter Mines Limited.
The 2021 financial year certainly presented a number of challenges. It is under such difficult times that boards and management are tested, and their worth, as shown in this Remuneration Report, is evidenced. Against this challenging backdrop, the Tshipi and Jupiter Board and Management have continued to deliver as promised during the 2018 IPO:
1. Continued double digit dividend yields and payout ratio of significantly over the 70% stated amount;
2. Optimisation of Jupiter’s portfolio via the demerger of Juno Minerals;
3. Expansion of Tshipi’s operation and
4. Cost optimisation of via additional rail transport channels and the barrier pillar agreement.
Jupiter’s RemCom has again this year measured Management’s remuneration against shareholder expectation, market peers, and the delivery of economic targets. Given the exceptionally good result compared to the potential for economic loss during the year, the RemCom believe the type and amount of remuneration of its key executives to be fair.
At last year’s Annual General Meeting, our shareholders again chose to vote significantly against the Remuneration Report, resulting in another “first strike”. Whilst the Rem Com and Board continue to evaluate shareholder concerns, I believe the Board and Management have shown their abilities in navigating troubled waters. I would urge all shareholders and proxy advisors to consider this.
I would like to take this opportunity to thank all shareholders for their ongoing support of Jupiter. I recommend this remuneration report to all shareholders and welcome the opportunity to discuss it with you before or during the Annual General Meeting.
Yours faithfully
Paul MurrayIndependent Non-Executive DirectorChairman, Remuneration and Nomination Committee

24 Jupiter Mines Limited
Rem
un
erat
ion
Rep
ort
(A
ud
ited
)
Remuneration Report (Audited)The Directors of Jupiter Mines Limited present the Remuneration Report for Non-Executive Directors, Executive Directors and other Key Management Personnel, prepared in accordance with the Corporations Act 2001 and the Corporations Regulations 2001.
The Remuneration Report is set out under the following main headings:
(a) Principles used to determine the nature and amount of remuneration;
(b) Details of remuneration;
(c) Service agreements;
(d) Share-based remuneration;
(e) Bonuses included in remuneration; and
(f) Other information.
a. principles used to determine remuneration strategy and structure
The principles of the Group’s executive strategy and frameworks are:
� to align rewards to business outcomes that deliver value to shareholders;
� to drive a high performance culture and rewarding high performing individuals; and
� to ensure remuneration is competitive in the relevant employment market place to support the attraction, motivation and retention of executive talent.
The Board has established a Remuneration and Nomination Committee which operates in accordance with its charter as approved by the Board and is responsible for determining and reviewing compensation arrangements for the Directors and the Executive Team.
The remuneration structure that has been adopted by the Group consists of the following components:
� fixed remuneration being annual salary; and
� short term incentives, being employee bonuses.
The Remuneration and Nomination Committee assess the appropriateness of the nature and amount of remuneration on a periodic basis by reference to recent employment market conditions with the overall objective of ensuring maximum stakeholder benefit from the retention of a high quality Board and Executive Team.
The payment of bonuses and other incentive payments are reviewed by the Remuneration and Nomination Committee annually as part of the review of executive remuneration and a recommendation is put to the Board for approval. All bonuses and incentives must be linked to pre-determined performance criteria.
Short Term Incentive (STI) Jupiter performance measures involve the use of annual performance objectives.
The performance measures have been set after consultation with the Directors and executives and are specifically tailored to the areas where each executive has a level of control. The measures target areas the Board believes hold the greatest potential for expansion and profit.
The key performance indicators (KPIs) for the Executive Team are summarised as follows:
Performance areas:
� Financial: net profit before tax and impairments and distributions to shareholders
� Non-financial: discretionary strategic and/or project based objectives set by the Board.
Consequences of performance on shareholder wealth In considering the Group’s performance and benefits for shareholder wealth, the Board have regard to the following items in respect of the current financial year and the previous four financial years:
Item 2021 2020 2019 2018 2017
EPS ($ per share) 0.0346 0.0486 0.0706 0.0434 0.0902
Cash distributions to shareholders ($) 58,769,731 93,053,074 146,924,327 82,881,285 70,635,693
Net profit after tax ($) 67,519,400 95,118,503 138,033,499 92,205,663 200,099,335
Share of profit from Tshipi investment ($) 62,937,155 98,191,396 188,505,385 94,040,638 41,474,035
/ Annual Report 2021 25
Rem
un
erat
ion
Rep
ort
(A
ud
ited
)
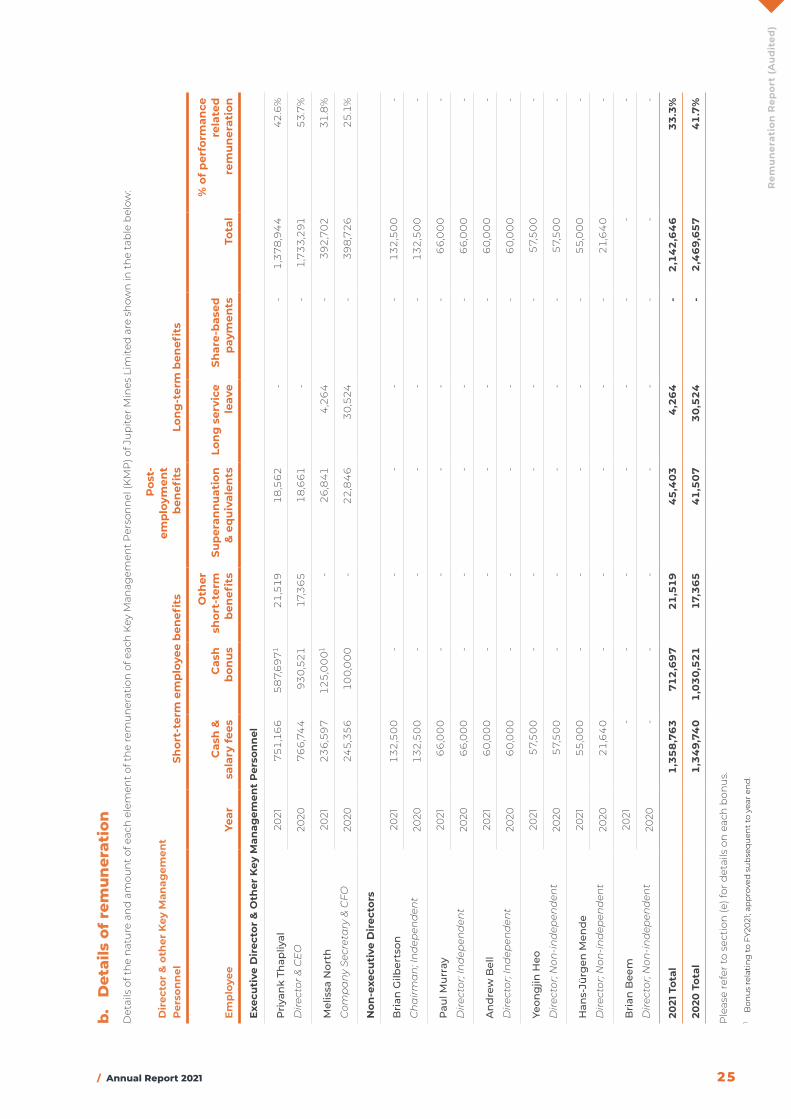
b.
det
ails
of
rem
un
erat
ion
Det
ails
of t
he
nat
ure
an
d a
mou
nt
of e
ach
ele
men
t of
th
e re
mu
ner
atio
n o
f eac
h K
ey M
anag
emen
t P
erso
nn
el (K
MP
) of J
up
iter
Min
es L
imite
d a
re s
how
n in
th
e ta
ble
bel
ow:
Dir
ecto
r &
oth
er K
ey M
anag
emen
t P
erso
nn
elSh
ort-
term
em
plo
yee
ben
efits
Pos
t-em
plo
ymen
t b
enefi
tsLo
ng
-ter
m b
enefi
ts
Emp
loye
eYe
arC
ash
&
sala
ry fe
esC
ash
b
onu
s
Oth
er
shor
t-te
rm
ben
efits
Sup
eran
nu
atio
n
& e
qu
ival
ents
Lon
g s
ervi
ce
leav
eSh
are-
bas
ed
pay
men
tsTo
tal
% o
f per
form
ance
re
late
d
rem
un
erat
ion
Exec
uti
ve D
irec
tor
& O
ther
Key
Man
agem
ent
Per
son
nel
Pri
yan
k Th
apliy
al
Dire
ctor
& C
EO
2021
751
,16
65
87,
69
71
21
,51
91
8,5
62
--
1,3
78
,94
442
.6%
2020
76
6,7
44
93
0,5
21
17,3
65
18
,661
--
1,7
33
,291
53
.7%
Mel
issa
Nor
th
Com
pa
ny
Secr
eta
ry &
CFO
2021
23
6,5
97
12
5,0
001
-2
6,8
414
,26
4-
392
,70
231
.8%
2020
245
,35
610
0,0
00
-2
2,8
46
30
,524
-39
8,7
26
25
.1%
Non
-exe
cuti
ve D
irec
tors
Bri
an G
ilber
tson
Ch
airm
an
; In
dep
end
ent
2021
13
2,5
00
--
--
-1
32
,50
0-
2020
13
2,5
00
--
--
-1
32
,50
0-
Pau
l Mu
rray
Dire
ctor
; In
dep
end
ent
2021
66
,00
0-
--
--
66
,00
0-
2020
66
,00
0-
--
--
66
,00
0-
An
dre
w B
ell
Dire
ctor
; In
dep
end
ent
2021
60
,00
0-
--
--
60
,00
0-
2020
60
,00
0-
--
--
60
,00
0-
Yeon
gjin
Heo
Dire
ctor
; Non
-ind
epen
den
t
2021
57,
50
0-
--
--
57,
50
0-
2020
57,
50
0-
--
--
57,
50
0-
Han
s-Jü
rgen
Men
de
Dire
ctor
; Non
-ind
epen
den
t
2021
55
,00
0-
--
--
55
,00
0-
2020
21
,64
0-
--
--
21
,64
0-
Bri
an B
eem
Dire
ctor
; Non
-ind
epen
den
t
2021
--
--
--
--
2020
--
--
--
--
2021
Tot
al1
,35
8,7
63
712
,69
721
,51
94
5,4
03
4,2
64
-2
,14
2,6
46
33
.3%
2020
Tot
al1
,34
9,7
40
1,0
30
,521
17,3
65
41
,50
73
0,5
24
-2
,46
9,6
574
1.7
%
Ple
ase
refe
r to
sec
tion
(e) f
or d
etai
ls o
n e
ach
bon
us.
1 B
onu
s re
lati
ng
to F
Y20
21; a
pp
rove
d s
ub
seq
uen
t to
yea
r en
d.
26 Jupiter Mines Limited
Rem
un
erat
ion
Rep
ort
(A
ud
ited
)
The relative proportions of remuneration that are linked to performance and those that are fixed are as follows:
Executive Directors Fixed RemunerationAt risk: Short-term
incentives (STI)
Priyank Thapliyal 57.4% 42.6%
Melissa North 68.2% 31.8%
c. Service agreements Remuneration and other terms of employment for the Executive Directors and other key management personnel are formalised in a Service Agreement. The major provisions of the agreements relating to remuneration are set out below and have not changed since the prior financial year:
Priyank Thapliyal – Chief Executive Officer
Subject Provision
Base salary The Executive is entitled to receive an annual salary of £400,000 (with no pension or superannuation contributions).
Annual Bonus
The Executive will be entitled to receive a bonus (Annual Bonus) equal to 1% of the value of amounts paid by way of: (i) a dividend; (ii) a distribution, payment or return of capital; or (iii) the acceptance of equal access buy-back offers made to all Shareholders, paid or made by the Company to its Shareholders at any time after the listing date until the date of termination of the Executive’s employment. The Annual Bonus is payable in cash.
Confidentiality The Executive must keep the Company’s confidential information confidential, except in certain circumstances, including where the disclosure is required by law or the Company provides prior written consent.
Termination
The Company may terminate the Executive’s employment by giving 6 months’ written notice and payment of an amount equal to 6 months’ salary and the amount of Annual Bonus paid in the 12 months prior to termination.
The Company may make payment in lieu of notice, comprising an amount of up to 12 months’ salary and the amount of Annual Bonus paid in the 12 months prior to termination.
The Company may otherwise terminate the employment immediately for misconduct or other matters that are usual grounds for summary dismissal.
The Executive may terminate the Executive’s employment by giving 6 months’ written notice.
In the event of a change of control (within the meaning of section 50AA of the Corporations Act) and diminution in the duties and responsibilities of the Executive as a chief executive officer of a public listed company, the Executive may elect to terminate the employment and become entitled to receive a payment equal to 12 months’ salary and the amount of Annual Bonus paid in the 12 months prior to termination.
Restrictive covenants
The Executive is subject to post-employment restraints on engaging in a business for the production, purchase, sale or marketing of manganese ore, and soliciting the employees, suppliers or clients of the Company or Tshipi é Ntle. The restraint has potential effect globally for up to 6 months following termination of employment.
/ Annual Report 2021 27
Rem
un
erat
ion
Rep
ort
(A
ud
ited
)
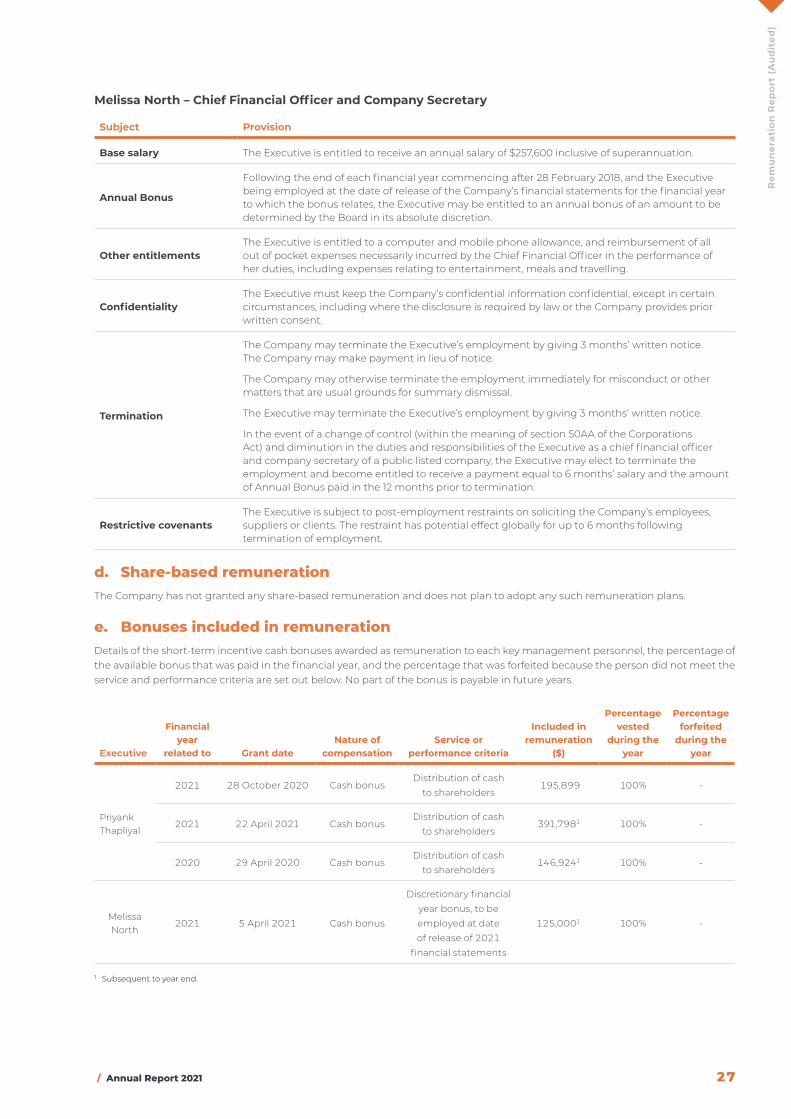
Melissa North – Chief Financial Officer and Company Secretary
Subject Provision
Base salary The Executive is entitled to receive an annual salary of $257,600 inclusive of superannuation.
Annual Bonus
Following the end of each financial year commencing after 28 February 2018, and the Executive being employed at the date of release of the Company’s financial statements for the financial year to which the bonus relates, the Executive may be entitled to an annual bonus of an amount to be determined by the Board in its absolute discretion.
Other entitlementsThe Executive is entitled to a computer and mobile phone allowance, and reimbursement of all out of pocket expenses necessarily incurred by the Chief Financial Officer in the performance of her duties, including expenses relating to entertainment, meals and travelling.
Confidentiality The Executive must keep the Company’s confidential information confidential, except in certain circumstances, including where the disclosure is required by law or the Company provides prior written consent.
Termination
The Company may terminate the Executive’s employment by giving 3 months’ written notice. The Company may make payment in lieu of notice.
The Company may otherwise terminate the employment immediately for misconduct or other matters that are usual grounds for summary dismissal.
The Executive may terminate the Executive’s employment by giving 3 months’ written notice.
In the event of a change of control (within the meaning of section 50AA of the Corporations Act) and diminution in the duties and responsibilities of the Executive as a chief financial officer and company secretary of a public listed company, the Executive may elect to terminate the employment and become entitled to receive a payment equal to 6 months’ salary and the amount of Annual Bonus paid in the 12 months prior to termination.
Restrictive covenantsThe Executive is subject to post-employment restraints on soliciting the Company’s employees, suppliers or clients. The restraint has potential effect globally for up to 6 months following termination of employment.
d. Share-based remunerationThe Company has not granted any share-based remuneration and does not plan to adopt any such remuneration plans.
e. Bonuses included in remunerationDetails of the short-term incentive cash bonuses awarded as remuneration to each key management personnel, the percentage of the available bonus that was paid in the financial year, and the percentage that was forfeited because the person did not meet the service and performance criteria are set out below. No part of the bonus is payable in future years.
Executive
Financial year
related to Grant dateNature of
compensationService or
performance criteria
Included in remuneration
($)
Percentage vested
during the year
Percentage forfeited
during the year
Priyank Thapliyal
2021 28 October 2020 Cash bonusDistribution of cash
to shareholders195,899 100% -
2021 22 April 2021 Cash bonusDistribution of cash
to shareholders391,7981 100% -
2020 29 April 2020 Cash bonusDistribution of cash
to shareholders146,9241 100% -
Melissa North
2021 5 April 2021 Cash bonus
Discretionary financial year bonus, to be employed at date of release of 2021
financial statements
125,0001 100% -
1 Subsequent to year end.
28 Jupiter Mines Limited
Rem
un
erat
ion
Rep
ort
(A
ud
ited
)
f. Other informationShares held by directors and key management personnel
The number of ordinary shares in the Company during the 2021 reporting period held by each of the Group’s key management personnel, including their related parties, are set out below:
DirectorBalance at
start of yearGranted as
remuneration Other changesHeld at the end of
reporting period
Brian Gilbertson 200,000 - 21,283,226 21,483,226
Andrew Bell 1 17,024,914 - (12,300,000) 4,724,914
Paul Murray 1,190,000 - - 1,190,000
Priyank Thapliyal 57,437,584 - 2,000,000 59,437,584
Yeongjin Heo 2 134,992,472 - - 134,992,472
Hans-Jürgen Mende 3 252,958,802 - 3,000,000 255,958,802
Brian Beem 176,950 - (176,950) -
1 Andrew Bell as the Chairman and Director of Red Rock Resources plc has a relevant interest in RRR Coal plc (RRR). RRR is the beneficial owner of 4,724,914 Ordinary Shares in the Company at balance date.
2 Yeongjin Heo as Managing Director of POSCO Australia Pty Ltd, has a relevant interest in POSCO Australia Pty Ltd (POSCO) and POSCO Australia GP PTY LTD (POSA GP). POSCO is the registered owner of 22,948,152 Ordinary Shares and POSA GP is the registered owner of 112,044,320 Ordinary Shares in the Company at balance date.
3 Hans-Jürgen Mende as Executive Chairman of the AMCI Group, which has a relevant interest in AMCI Group LLC. This entity is the registered owner of 145,845,372 Ordinary Shares in the Company at balance. Mr Mende also has a relevant interest in HJM Jupiter L.P, which is the beneficial owner of 110,113,430 Ordinary Shares in the Company at balance date.
None of the shares included in the table above are held nominally by key management personnel.
Other transactions with key management personnelThere were no other material transactions with key management personnel for 2021 or 2020.
End of Audited Remuneration Report
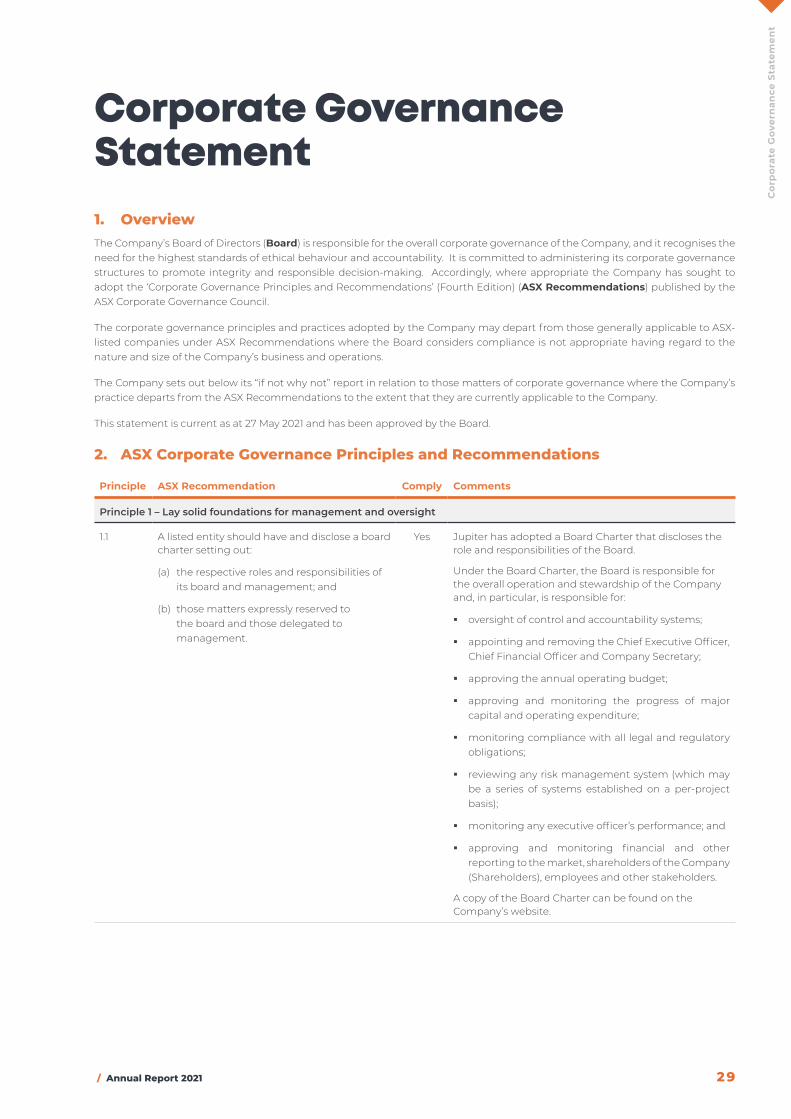
/ Annual Report 2021 29
Co
rpo
rate
Gov
ern
ance
Sta
tem
ent
Corporate Governance Statement1. OverviewThe Company’s Board of Directors (Board) is responsible for the overall corporate governance of the Company, and it recognises the need for the highest standards of ethical behaviour and accountability. It is committed to administering its corporate governance structures to promote integrity and responsible decision-making. Accordingly, where appropriate the Company has sought to adopt the ‘Corporate Governance Principles and Recommendations’ (Fourth Edition) (ASX Recommendations) published by the ASX Corporate Governance Council.
The corporate governance principles and practices adopted by the Company may depart from those generally applicable to ASX-listed companies under ASX Recommendations where the Board considers compliance is not appropriate having regard to the nature and size of the Company’s business and operations.
The Company sets out below its “if not why not” report in relation to those matters of corporate governance where the Company’s practice departs from the ASX Recommendations to the extent that they are currently applicable to the Company.
This statement is current as at 27 May 2021 and has been approved by the Board.
2. ASX corporate governance principles and Recommendations
Principle ASX Recommendation Comply Comments
Principle 1 – Lay solid foundations for management and oversight
1.1 A listed entity should have and disclose a board charter setting out:
(a) the respective roles and responsibilities of its board and management; and
(b) those matters expressly reserved to the board and those delegated to management.
Yes Jupiter has adopted a Board Charter that discloses the role and responsibilities of the Board.
Under the Board Charter, the Board is responsible for the overall operation and stewardship of the Company and, in particular, is responsible for:
� oversight of control and accountability systems;
� appointing and removing the Chief Executive Officer, Chief Financial Officer and Company Secretary;
� approving the annual operating budget;
� approving and monitoring the progress of major capital and operating expenditure;
� monitoring compliance with all legal and regulatory obligations;
� reviewing any risk management system (which may be a series of systems established on a per-project basis);
� monitoring any executive officer’s performance; and
� approving and monitoring financial and other reporting to the market, shareholders of the Company (Shareholders), employees and other stakeholders.
A copy of the Board Charter can be found on the Company’s website.

30 Jupiter Mines Limited
Co
rpo
rate
Gov
ern
ance
Sta
tem
ent
Principle ASX Recommendation Comply Comments
1.2 A listed entity should:
(a) undertake appropriate checks before appointing a person, or putting forward to security holders a candidate for election, as a director; and
(b) provide security holders with all material information in its possession relevant to a decision on whether or not to elect or re-elect a director.
Yes Jupiter conducts background checks of candidates for the position of director of the Company (Director) prior to their appointment or nomination for election by Shareholders, including checks as to good character, experience, education, qualifications, criminal history and bankruptcy.
The Company does not propose to conduct specific checks prior to nominating an existing Director for re-election by Shareholders at a general meeting on the basis that each incumbent Director is required to submit to the ASX ‘good fame and character’ assessment during the Company’s admission to the official list of ASX.
As a matter of practice, Jupiter includes in its notices of meeting a brief biography and other material information in relation to each Director who stands for election or re-election, including relevant qualifications and professional experience of the nominated Director for consideration by Shareholders.
1.3 A listed entity should have a written agreement with each director and senior executive setting out the terms of their appointment.
Yes The Company has entered into an employment contract with Priyank Thapliyal, the Company’s Chief Executive Officer, and Melissa North, the Company’s Chief Financial Officer, who are engaged on a full-time basis. The Company has entered into letters of engagement with each of its non-executive Directors setting out the key terms and conditions of their engagement.
1.4 The company secretary of a listed entity should be accountable directly to the board, through the chair, on all matters to do with the proper functioning of the board.
Yes The Company Secretary reports directly, and is accountable, to the Board through the Chairman of the Board (Chairman) in relation to all governance matters.
The Company Secretary also advises and supports the Board to implement adopted governance procedures and co-ordinates the circulation of meeting agendas and papers.
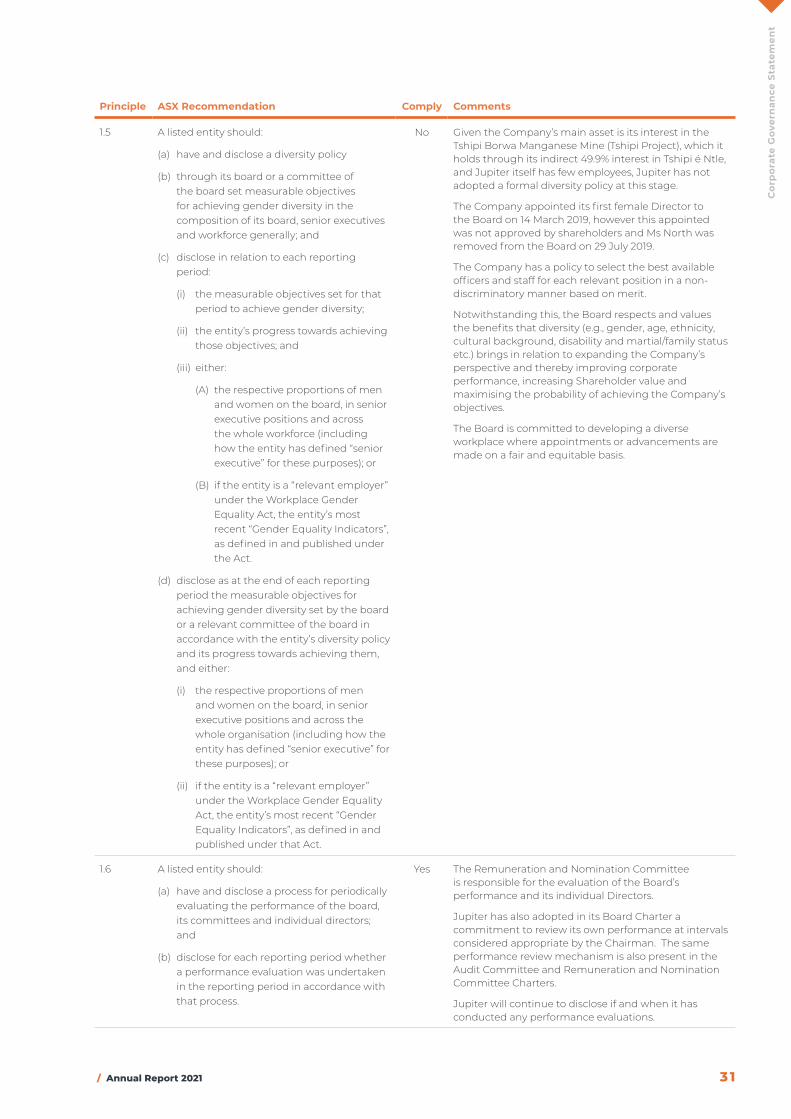
/ Annual Report 2021 31
Co
rpo
rate
Gov
ern
ance
Sta
tem
ent
Principle ASX Recommendation Comply Comments
1.5 A listed entity should:
(a) have and disclose a diversity policy
(b) through its board or a committee of the board set measurable objectives for achieving gender diversity in the composition of its board, senior executives and workforce generally; and
(c) disclose in relation to each reporting period:
(i) the measurable objectives set for that period to achieve gender diversity;
(ii) the entity’s progress towards achieving those objectives; and
(iii) either:
(A) the respective proportions of men and women on the board, in senior executive positions and across the whole workforce (including how the entity has defined “senior executive” for these purposes); or
(B) if the entity is a “relevant employer” under the Workplace Gender Equality Act, the entity’s most recent “Gender Equality Indicators”, as defined in and published under the Act.
(d) disclose as at the end of each reporting period the measurable objectives for achieving gender diversity set by the board or a relevant committee of the board in accordance with the entity’s diversity policy and its progress towards achieving them, and either:
(i) the respective proportions of men and women on the board, in senior executive positions and across the whole organisation (including how the entity has defined “senior executive” for these purposes); or
(ii) if the entity is a “relevant employer” under the Workplace Gender Equality Act, the entity’s most recent “Gender Equality Indicators”, as defined in and published under that Act.
No Given the Company’s main asset is its interest in the Tshipi Borwa Manganese Mine (Tshipi Project), which it holds through its indirect 49.9% interest in Tshipi é Ntle, and Jupiter itself has few employees, Jupiter has not adopted a formal diversity policy at this stage.
The Company appointed its first female Director to the Board on 14 March 2019, however this appointed was not approved by shareholders and Ms North was removed from the Board on 29 July 2019.
The Company has a policy to select the best available officers and staff for each relevant position in a non-discriminatory manner based on merit.
Notwithstanding this, the Board respects and values the benefits that diversity (e.g., gender, age, ethnicity, cultural background, disability and martial/family status etc.) brings in relation to expanding the Company’s perspective and thereby improving corporate performance, increasing Shareholder value and maximising the probability of achieving the Company’s objectives.
The Board is committed to developing a diverse workplace where appointments or advancements are made on a fair and equitable basis.
1.6 A listed entity should:
(a) have and disclose a process for periodically evaluating the performance of the board, its committees and individual directors; and
(b) disclose for each reporting period whether a performance evaluation was undertaken in the reporting period in accordance with that process.
Yes The Remuneration and Nomination Committee is responsible for the evaluation of the Board’s performance and its individual Directors.
Jupiter has also adopted in its Board Charter a commitment to review its own performance at intervals considered appropriate by the Chairman. The same performance review mechanism is also present in the Audit Committee and Remuneration and Nomination Committee Charters.
Jupiter will continue to disclose if and when it has conducted any performance evaluations.
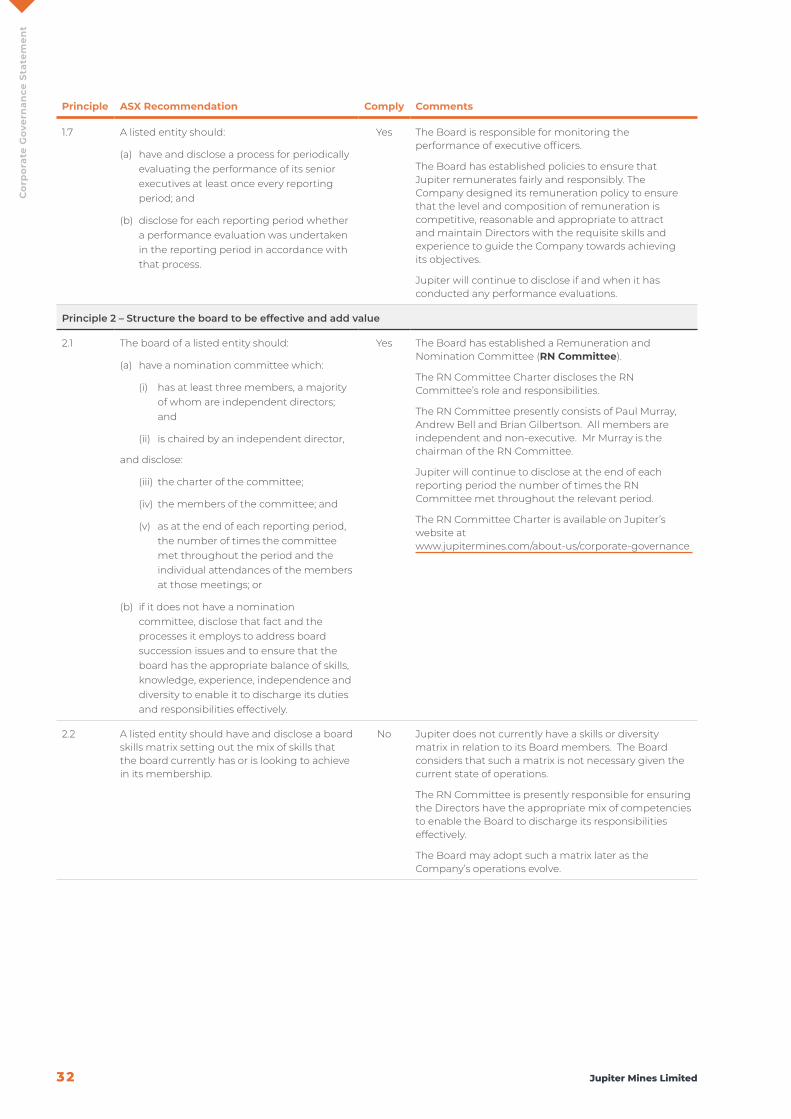
32 Jupiter Mines Limited
Co
rpo
rate
Gov
ern
ance
Sta
tem
ent
Principle ASX Recommendation Comply Comments
1.7 A listed entity should:
(a) have and disclose a process for periodically evaluating the performance of its senior executives at least once every reporting period; and
(b) disclose for each reporting period whether a performance evaluation was undertaken in the reporting period in accordance with that process.
Yes The Board is responsible for monitoring the performance of executive officers.
The Board has established policies to ensure that Jupiter remunerates fairly and responsibly. The Company designed its remuneration policy to ensure that the level and composition of remuneration is competitive, reasonable and appropriate to attract and maintain Directors with the requisite skills and experience to guide the Company towards achieving its objectives.
Jupiter will continue to disclose if and when it has conducted any performance evaluations.
Principle 2 – Structure the board to be effective and add value
2.1 The board of a listed entity should:
(a) have a nomination committee which:
(i) has at least three members, a majority of whom are independent directors; and
(ii) is chaired by an independent director,
and disclose:
(iii) the charter of the committee;
(iv) the members of the committee; and
(v) as at the end of each reporting period, the number of times the committee met throughout the period and the individual attendances of the members at those meetings; or
(b) if it does not have a nomination committee, disclose that fact and the processes it employs to address board succession issues and to ensure that the board has the appropriate balance of skills, knowledge, experience, independence and diversity to enable it to discharge its duties and responsibilities effectively.
Yes The Board has established a Remuneration and Nomination Committee (RN Committee).
The RN Committee Charter discloses the RN Committee’s role and responsibilities.
The RN Committee presently consists of Paul Murray, Andrew Bell and Brian Gilbertson. All members are independent and non-executive. Mr Murray is the chairman of the RN Committee.
Jupiter will continue to disclose at the end of each reporting period the number of times the RN Committee met throughout the relevant period.
The RN Committee Charter is available on Jupiter’s website at www.jupitermines.com/about-us/corporate-governance
2.2 A listed entity should have and disclose a board skills matrix setting out the mix of skills that the board currently has or is looking to achieve in its membership.
No Jupiter does not currently have a skills or diversity matrix in relation to its Board members. The Board considers that such a matrix is not necessary given the current state of operations.
The RN Committee is presently responsible for ensuring the Directors have the appropriate mix of competencies to enable the Board to discharge its responsibilities effectively.
The Board may adopt such a matrix later as the Company’s operations evolve.
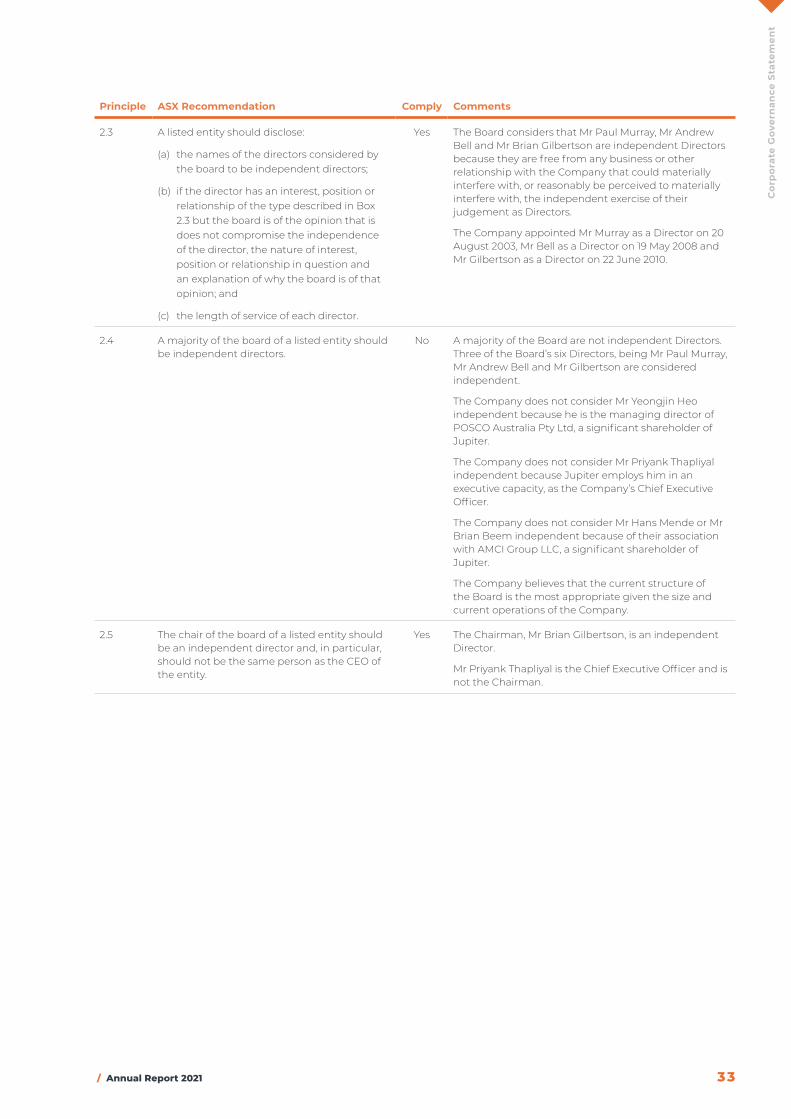
/ Annual Report 2021 33
Co
rpo
rate
Gov
ern
ance
Sta
tem
ent
Principle ASX Recommendation Comply Comments
2.3 A listed entity should disclose:
(a) the names of the directors considered by the board to be independent directors;
(b) if the director has an interest, position or relationship of the type described in Box 2.3 but the board is of the opinion that is does not compromise the independence of the director, the nature of interest, position or relationship in question and an explanation of why the board is of that opinion; and
(c) the length of service of each director.
Yes The Board considers that Mr Paul Murray, Mr Andrew Bell and Mr Brian Gilbertson are independent Directors because they are free from any business or other relationship with the Company that could materially interfere with, or reasonably be perceived to materially interfere with, the independent exercise of their judgement as Directors.
The Company appointed Mr Murray as a Director on 20 August 2003, Mr Bell as a Director on 19 May 2008 and Mr Gilbertson as a Director on 22 June 2010.
2.4 A majority of the board of a listed entity should be independent directors.
No A majority of the Board are not independent Directors. Three of the Board’s six Directors, being Mr Paul Murray, Mr Andrew Bell and Mr Gilbertson are considered independent.
The Company does not consider Mr Yeongjin Heo independent because he is the managing director of POSCO Australia Pty Ltd, a significant shareholder of Jupiter.
The Company does not consider Mr Priyank Thapliyal independent because Jupiter employs him in an executive capacity, as the Company’s Chief Executive Officer.
The Company does not consider Mr Hans Mende or Mr Brian Beem independent because of their association with AMCI Group LLC, a significant shareholder of Jupiter.
The Company believes that the current structure of the Board is the most appropriate given the size and current operations of the Company.
2.5 The chair of the board of a listed entity should be an independent director and, in particular, should not be the same person as the CEO of the entity.
Yes The Chairman, Mr Brian Gilbertson, is an independent Director.
Mr Priyank Thapliyal is the Chief Executive Officer and is not the Chairman.

34 Jupiter Mines Limited
Co
rpo
rate
Gov
ern
ance
Sta
tem
ent
Principle ASX Recommendation Comply Comments
2.6 A listed entity should have a program for inducting new directors and for periodically reviewing whether there is a need for existing directors to undertake professional development to maintain the skills and knowledge needed to perform their role as directors effectively.
Yes Induction program
When a Director is appointed, they receive with their appointment letter a copy of the Company’s constitution, corporate governance policies and charters. The contents of this due diligence pack contain sufficient information to allow the new Director to gain an understanding of the rights, duties, responsibilities and role of the Board, Board committees and the executive team.
The Company Secretary arranges for new Directors to undertake an induction program to enable them to gain an understanding of:
� the Company’s operations and the industry sectors in which it operates;
� the Company’s financial, strategic, operational and risk management position;
� their rights, duties and responsibilities; and
� any other relevant information.
As part of this induction program, a new Director will meet with all incumbent Directors (if this has not already taken place).
Director development
In order to achieve continuing improvement in Board performance, all Directors are encouraged to undergo continual professional development.
Principle 3 – Instil a Culture of Acting Lawfully, Ethically and Responsibly
3.1 A listed entity should articulate and disclose its values.
Yes Jupiter Mines instils the below values:
To be bold in its industry area, act with integrity, be honest and respectful to our people, stakeholders and the environment.
3.2 A listed entity should:
(a) have a code of conduct for its directors, senior executives and employees; and
(b) ensure that the board or a committee of the board is informed of any material breaches of that code.
Yes The Board believes that the success of Jupiter has been, and will continue to be, enhanced by a strong ethical culture within the organisation.
Jupiter has a Code of Conduct and Ethics (Code) which sets the standards that all Directors, officers, employees, consultants and contractors and all other people representing the Company are expected to comply with in relation to all commercial operations.
The Code also outlines the procedure for reporting any breaches of the Code and the possible disciplinary action the Company may take in respect of any breaches.
In addition to their obligations under the Corporations Act 2001 (Cth) (Corporations Act) in relation to inside information, all Directors, employees and consultants have a duty of confidentiality to Jupiter in relation to confidential information they possess.
In fulfilling their duties, each Director dealing with corporate governance matters may obtain independent professional advice at Jupiter’s expense after consultation with the Chairman.
The Company ensures that all incumbent and new personnel have a copy of the Code. It is also available on the Company’s website.
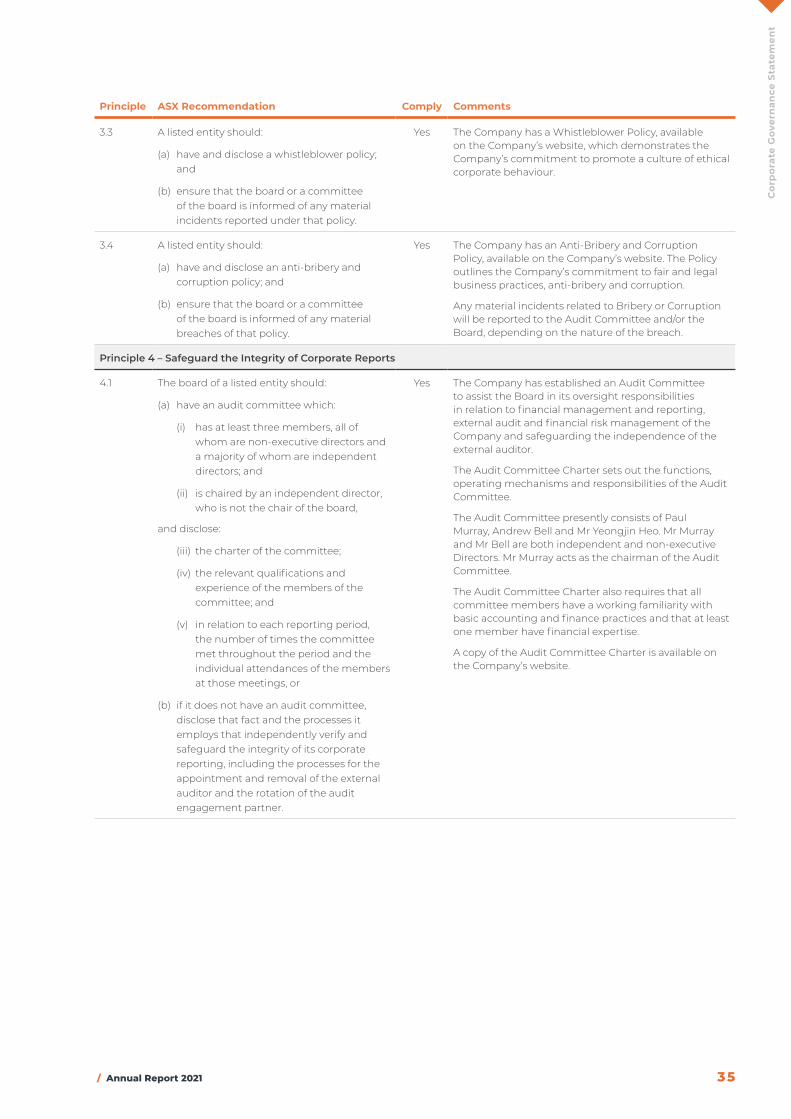
/ Annual Report 2021 35
Co
rpo
rate
Gov
ern
ance
Sta
tem
ent
Principle ASX Recommendation Comply Comments
3.3 A listed entity should:
(a) have and disclose a whistleblower policy; and
(b) ensure that the board or a committee of the board is informed of any material incidents reported under that policy.
Yes The Company has a Whistleblower Policy, available on the Company’s website, which demonstrates the Company’s commitment to promote a culture of ethical corporate behaviour.
3.4 A listed entity should:
(a) have and disclose an anti-bribery and corruption policy; and
(b) ensure that the board or a committee of the board is informed of any material breaches of that policy.
Yes The Company has an Anti-Bribery and Corruption Policy, available on the Company’s website. The Policy outlines the Company’s commitment to fair and legal business practices, anti-bribery and corruption.
Any material incidents related to Bribery or Corruption will be reported to the Audit Committee and/or the Board, depending on the nature of the breach.
Principle 4 – Safeguard the Integrity of Corporate Reports
4.1 The board of a listed entity should:
(a) have an audit committee which:
(i) has at least three members, all of whom are non-executive directors and a majority of whom are independent directors; and
(ii) is chaired by an independent director, who is not the chair of the board,
and disclose:
(iii) the charter of the committee;
(iv) the relevant qualifications and experience of the members of the committee; and
(v) in relation to each reporting period, the number of times the committee met throughout the period and the individual attendances of the members at those meetings, or
(b) if it does not have an audit committee, disclose that fact and the processes it employs that independently verify and safeguard the integrity of its corporate reporting, including the processes for the appointment and removal of the external auditor and the rotation of the audit engagement partner.
Yes The Company has established an Audit Committee to assist the Board in its oversight responsibilities in relation to financial management and reporting, external audit and financial risk management of the Company and safeguarding the independence of the external auditor.
The Audit Committee Charter sets out the functions, operating mechanisms and responsibilities of the Audit Committee.
The Audit Committee presently consists of Paul Murray, Andrew Bell and Mr Yeongjin Heo. Mr Murray and Mr Bell are both independent and non-executive Directors. Mr Murray acts as the chairman of the Audit Committee.
The Audit Committee Charter also requires that all committee members have a working familiarity with basic accounting and finance practices and that at least one member have financial expertise.
A copy of the Audit Committee Charter is available on the Company’s website.
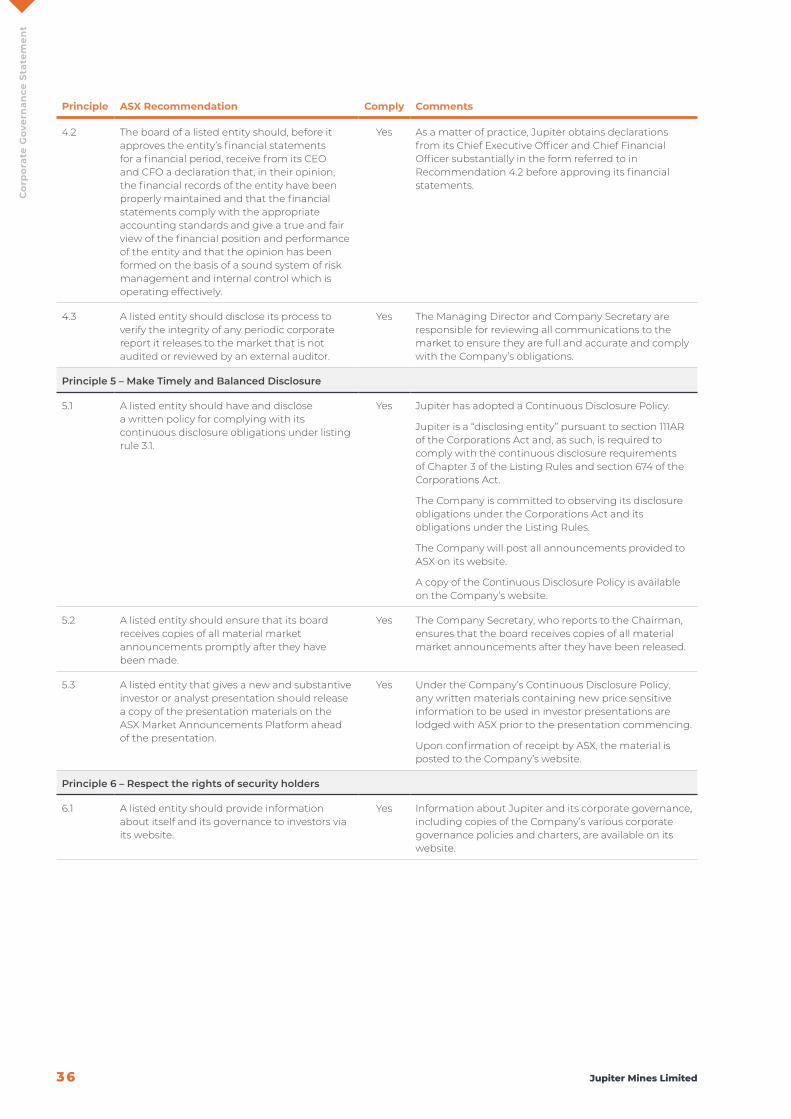
36 Jupiter Mines Limited
Co
rpo
rate
Gov
ern
ance
Sta
tem
ent
Principle ASX Recommendation Comply Comments
4.2 The board of a listed entity should, before it approves the entity’s financial statements for a financial period, receive from its CEO and CFO a declaration that, in their opinion, the financial records of the entity have been properly maintained and that the financial statements comply with the appropriate accounting standards and give a true and fair view of the financial position and performance of the entity and that the opinion has been formed on the basis of a sound system of risk management and internal control which is operating effectively.
Yes As a matter of practice, Jupiter obtains declarations from its Chief Executive Officer and Chief Financial Officer substantially in the form referred to in Recommendation 4.2 before approving its financial statements.
4.3 A listed entity should disclose its process to verify the integrity of any periodic corporate report it releases to the market that is not audited or reviewed by an external auditor.
Yes The Managing Director and Company Secretary are responsible for reviewing all communications to the market to ensure they are full and accurate and comply with the Company’s obligations.
Principle 5 – Make Timely and Balanced Disclosure
5.1 A listed entity should have and disclose a written policy for complying with its continuous disclosure obligations under listing rule 3.1.
Yes Jupiter has adopted a Continuous Disclosure Policy.
Jupiter is a “disclosing entity” pursuant to section 111AR of the Corporations Act and, as such, is required to comply with the continuous disclosure requirements of Chapter 3 of the Listing Rules and section 674 of the Corporations Act.
The Company is committed to observing its disclosure obligations under the Corporations Act and its obligations under the Listing Rules.
The Company will post all announcements provided to ASX on its website.
A copy of the Continuous Disclosure Policy is available on the Company’s website.
5.2 A listed entity should ensure that its board receives copies of all material market announcements promptly after they have been made.
Yes The Company Secretary, who reports to the Chairman, ensures that the board receives copies of all material market announcements after they have been released.
5.3 A listed entity that gives a new and substantive investor or analyst presentation should release a copy of the presentation materials on the ASX Market Announcements Platform ahead of the presentation.
Yes Under the Company’s Continuous Disclosure Policy, any written materials containing new price sensitive information to be used in investor presentations are lodged with ASX prior to the presentation commencing.
Upon confirmation of receipt by ASX, the material is posted to the Company’s website.
Principle 6 – Respect the rights of security holders
6.1 A listed entity should provide information about itself and its governance to investors via its website.
Yes Information about Jupiter and its corporate governance, including copies of the Company’s various corporate governance policies and charters, are available on its website.

/ Annual Report 2021 37
Co
rpo
rate
Gov
ern
ance
Sta
tem
ent
Principle ASX Recommendation Comply Comments
6.2 A listed entity should have an investor relations program that facilitates effective two-way communication with investors.
Yes The Shareholder Communications Policy, which is available on the Company’s website, recognises the value of providing current and relevant information to its shareholders. The Chairman, Managing Director and Company Secretary have primary responsibility for communications with shareholders.
The Company is committed to the promotion of investor confidence through the below information:
� continuous disclosure of all material information
� periodic disclosures through annual, half-year and quarterly reports; and
� briefings with the domestic and international investment community.
6.3 A listed entity should disclose how it facilitates and encourages participation at meetings of security holders.
Yes Jupiter supports Shareholder participation in general meetings and seeks to provide appropriate mechanisms for such participation, including by ensuring that meetings are held at convenient times and places to encourage Shareholder participation.
In preparing for general meetings, Jupiter drafts the notice of meeting and related explanatory information so that they provide all of the information that is relevant to Shareholders in making decisions on matters to be voted on by them at the meeting. This information is presented clearly and concisely so that it is easy to understand and not ambiguous.
Jupiter uses general meetings as a tool to effectively communicate with Shareholders and allow Shareholders a reasonable opportunity to ask questions of the Board of Directors and to participate in the meeting.
Mechanisms for encouraging and facilitating Shareholder participation are reviewed regularly to encourage the highest level of Shareholder participation.
6.4 A listed entity should ensure that all substantive resolutions at a meeting of security holders are decided by a poll rather than by a show of hands.
Yes Shareholders are able to vote on resolutions via the Share Registry Platform, or by submitting proxy forms as outlined in the Notice of Meeting.
Voting on all resolutions at meetings of shareholders are decided by a poll.
6.5 A listed entity should give security holders the option to receive communications from, and send communications to, the entity and its security registry electronically.
Yes Jupiter considers that communicating with Shareholders by electronic means is an efficient way to distribute information in a timely and convenient manner.
Jupiter provides new Shareholders with the option to receive communications from Jupiter electronically and encourages them to do so. Existing Shareholders are also encouraged to request communications electronically.
Jupiter will provide all Shareholders that have opted to receive communications electronically with notifications when it uploads an announcement or other communication (including annual reports and notice of meeting) to the ASX announcements platform.
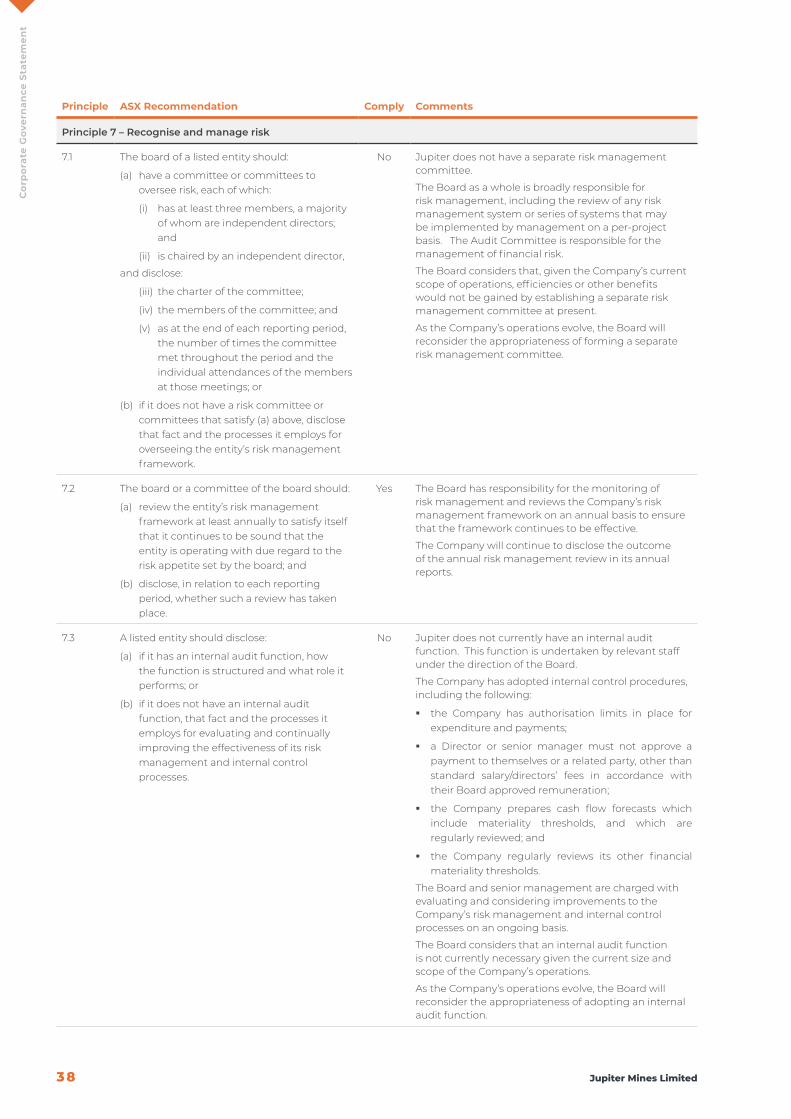
38 Jupiter Mines Limited
Co
rpo
rate
Gov
ern
ance
Sta
tem
ent
Principle ASX Recommendation Comply Comments
Principle 7 – Recognise and manage risk
7.1 The board of a listed entity should:
(a) have a committee or committees to oversee risk, each of which:
(i) has at least three members, a majority of whom are independent directors; and
(ii) is chaired by an independent director,
and disclose:
(iii) the charter of the committee;
(iv) the members of the committee; and
(v) as at the end of each reporting period, the number of times the committee met throughout the period and the individual attendances of the members at those meetings; or
(b) if it does not have a risk committee or committees that satisfy (a) above, disclose that fact and the processes it employs for overseeing the entity’s risk management framework.
No Jupiter does not have a separate risk management committee.
The Board as a whole is broadly responsible for risk management, including the review of any risk management system or series of systems that may be implemented by management on a per-project basis. The Audit Committee is responsible for the management of financial risk.
The Board considers that, given the Company’s current scope of operations, efficiencies or other benefits would not be gained by establishing a separate risk management committee at present.
As the Company’s operations evolve, the Board will reconsider the appropriateness of forming a separate risk management committee.
7.2 The board or a committee of the board should:
(a) review the entity’s risk management framework at least annually to satisfy itself that it continues to be sound that the entity is operating with due regard to the risk appetite set by the board; and
(b) disclose, in relation to each reporting period, whether such a review has taken place.
Yes The Board has responsibility for the monitoring of risk management and reviews the Company’s risk management framework on an annual basis to ensure that the framework continues to be effective.
The Company will continue to disclose the outcome of the annual risk management review in its annual reports.
7.3 A listed entity should disclose:
(a) if it has an internal audit function, how the function is structured and what role it performs; or
(b) if it does not have an internal audit function, that fact and the processes it employs for evaluating and continually improving the effectiveness of its risk management and internal control processes.
No Jupiter does not currently have an internal audit function. This function is undertaken by relevant staff under the direction of the Board.
The Company has adopted internal control procedures, including the following:
� the Company has authorisation limits in place for expenditure and payments;
� a Director or senior manager must not approve a payment to themselves or a related party, other than standard salary/directors’ fees in accordance with their Board approved remuneration;
� the Company prepares cash flow forecasts which include materiality thresholds, and which are regularly reviewed; and
� the Company regularly reviews its other financial materiality thresholds.
The Board and senior management are charged with evaluating and considering improvements to the Company’s risk management and internal control processes on an ongoing basis.
The Board considers that an internal audit function is not currently necessary given the current size and scope of the Company’s operations.
As the Company’s operations evolve, the Board will reconsider the appropriateness of adopting an internal audit function.
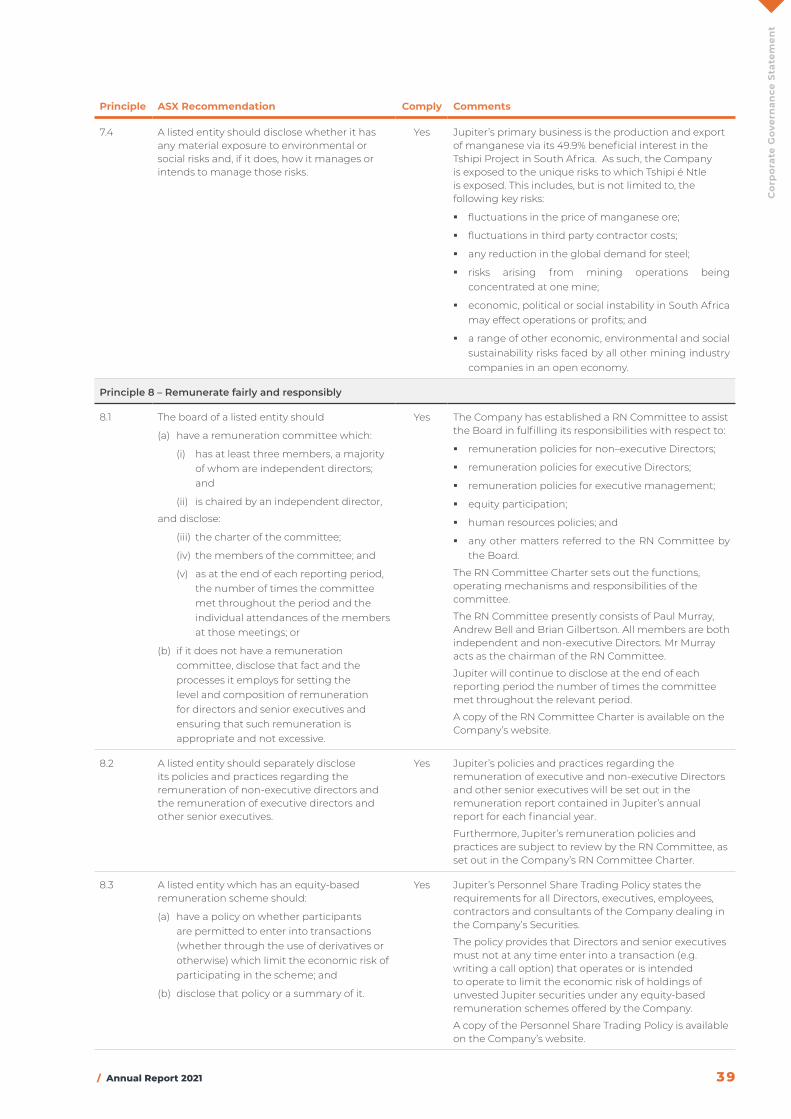
/ Annual Report 2021 39
Co
rpo
rate
Gov
ern
ance
Sta
tem
ent
Principle ASX Recommendation Comply Comments
7.4 A listed entity should disclose whether it has any material exposure to environmental or social risks and, if it does, how it manages or intends to manage those risks.
Yes Jupiter’s primary business is the production and export of manganese via its 49.9% beneficial interest in the Tshipi Project in South Africa. As such, the Company is exposed to the unique risks to which Tshipi é Ntle is exposed. This includes, but is not limited to, the following key risks:
� fluctuations in the price of manganese ore;
� fluctuations in third party contractor costs;
� any reduction in the global demand for steel;
� risks arising from mining operations being concentrated at one mine;
� economic, political or social instability in South Africa may effect operations or profits; and
� a range of other economic, environmental and social sustainability risks faced by all other mining industry companies in an open economy.
Principle 8 – Remunerate fairly and responsibly
8.1 The board of a listed entity should
(a) have a remuneration committee which:
(i) has at least three members, a majority of whom are independent directors; and
(ii) is chaired by an independent director,
and disclose:
(iii) the charter of the committee;
(iv) the members of the committee; and
(v) as at the end of each reporting period, the number of times the committee met throughout the period and the individual attendances of the members at those meetings; or
(b) if it does not have a remuneration committee, disclose that fact and the processes it employs for setting the level and composition of remuneration for directors and senior executives and ensuring that such remuneration is appropriate and not excessive.
Yes The Company has established a RN Committee to assist the Board in fulfilling its responsibilities with respect to:
� remuneration policies for non–executive Directors;
� remuneration policies for executive Directors;
� remuneration policies for executive management;
� equity participation;
� human resources policies; and
� any other matters referred to the RN Committee by the Board.
The RN Committee Charter sets out the functions, operating mechanisms and responsibilities of the committee.
The RN Committee presently consists of Paul Murray, Andrew Bell and Brian Gilbertson. All members are both independent and non-executive Directors. Mr Murray acts as the chairman of the RN Committee.
Jupiter will continue to disclose at the end of each reporting period the number of times the committee met throughout the relevant period.
A copy of the RN Committee Charter is available on the Company’s website.
8.2 A listed entity should separately disclose its policies and practices regarding the remuneration of non-executive directors and the remuneration of executive directors and other senior executives.
Yes Jupiter’s policies and practices regarding the remuneration of executive and non-executive Directors and other senior executives will be set out in the remuneration report contained in Jupiter’s annual report for each financial year.
Furthermore, Jupiter’s remuneration policies and practices are subject to review by the RN Committee, as set out in the Company’s RN Committee Charter.
8.3 A listed entity which has an equity-based remuneration scheme should:
(a) have a policy on whether participants are permitted to enter into transactions (whether through the use of derivatives or otherwise) which limit the economic risk of participating in the scheme; and
(b) disclose that policy or a summary of it.
Yes Jupiter’s Personnel Share Trading Policy states the requirements for all Directors, executives, employees, contractors and consultants of the Company dealing in the Company’s Securities.
The policy provides that Directors and senior executives must not at any time enter into a transaction (e.g. writing a call option) that operates or is intended to operate to limit the economic risk of holdings of unvested Jupiter securities under any equity-based remuneration schemes offered by the Company.
A copy of the Personnel Share Trading Policy is available on the Company’s website.

40 Jupiter Mines Limited
Co
rpo
rate
Gov
ern
ance
Sta
tem
ent
REPORT
ABN 51 105 991 740 CONSOLIDATED ENTITY
FOR THE YEAR ENDED
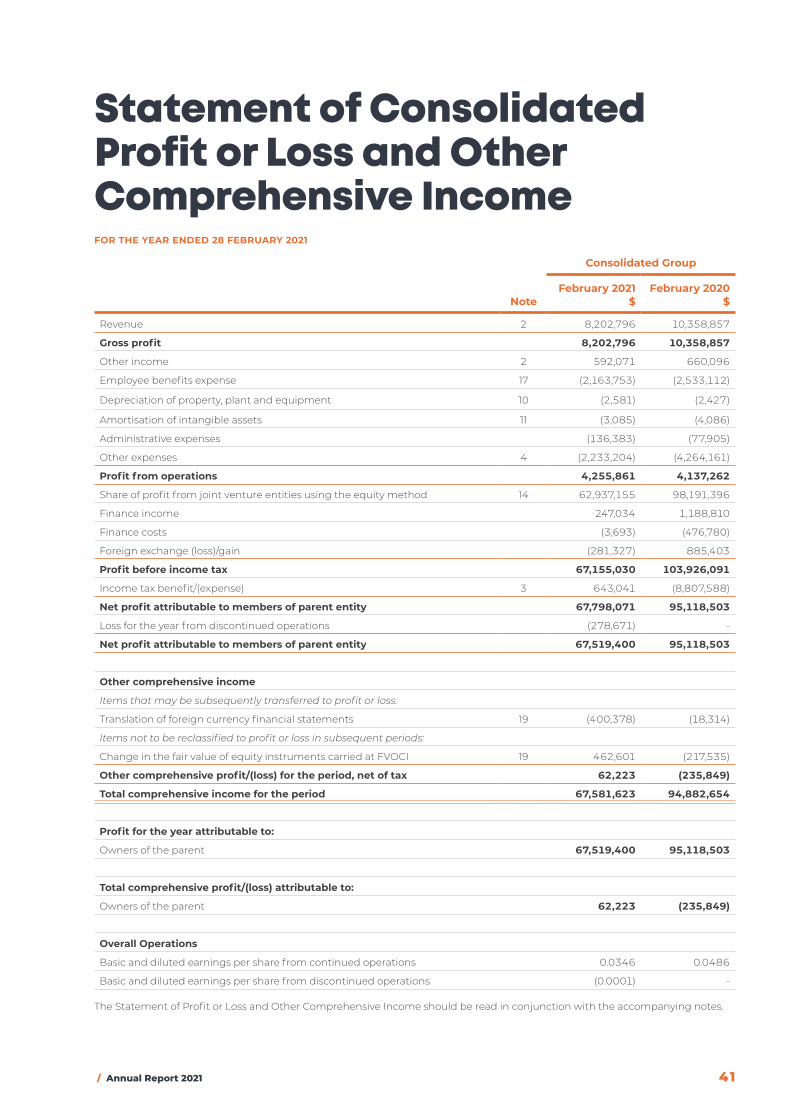
/ Annual Report 2021 41
Statement of Consolidated Profit or Loss and Other Comprehensive IncomeFOR THE YEAR ENDED 28 FEBRUARY 2021
Consolidated Group
NoteFebruary 2021
$February 2020
$
Revenue 2 8,202,796 10,358,857
Gross profit 8,202,796 10,358,857
Other income 2 592,071 660,096
Employee benefits expense 17 (2,163,753) (2,533,112)
Depreciation of property, plant and equipment 10 (2,581) (2,427)
Amortisation of intangible assets 11 (3,085) (4,086)
Administrative expenses (136,383) (77,905)
Other expenses 4 (2,233,204) (4,264,161)
Profit from operations 4,255,861 4,137,262
Share of profit from joint venture entities using the equity method 14 62,937,155 98,191,396
Finance income 247,034 1,188,810
Finance costs (3,693) (476,780)
Foreign exchange (loss)/gain (281,327) 885,403
Profit before income tax 67,155,030 103,926,091
Income tax benefit/(expense) 3 643,041 (8,807,588)
Net profit attributable to members of parent entity 67,798,071 95,118,503
Loss for the year from discontinued operations (278,671) -
Net profit attributable to members of parent entity 67,519,400 95,118,503
Other comprehensive income
Items that may be subsequently transferred to profit or loss:
Translation of foreign currency financial statements 19 (400,378) (18,314)
Items not to be reclassified to profit or loss in subsequent periods:
Change in the fair value of equity instruments carried at FVOCI 19 462,601 (217,535)
Other comprehensive profit/(loss) for the period, net of tax 62,223 (235,849)
Total comprehensive income for the period 67,581,623 94,882,654
Profit for the year attributable to:
Owners of the parent 67,519,400 95,118,503
Total comprehensive profit/(loss) attributable to:
Owners of the parent 62,223 (235,849)
Overall Operations
Basic and diluted earnings per share from continued operations 0.0346 0.0486
Basic and diluted earnings per share from discontinued operations (0.0001) -
The Statement of Profit or Loss and Other Comprehensive Income should be read in conjunction with the accompanying notes.
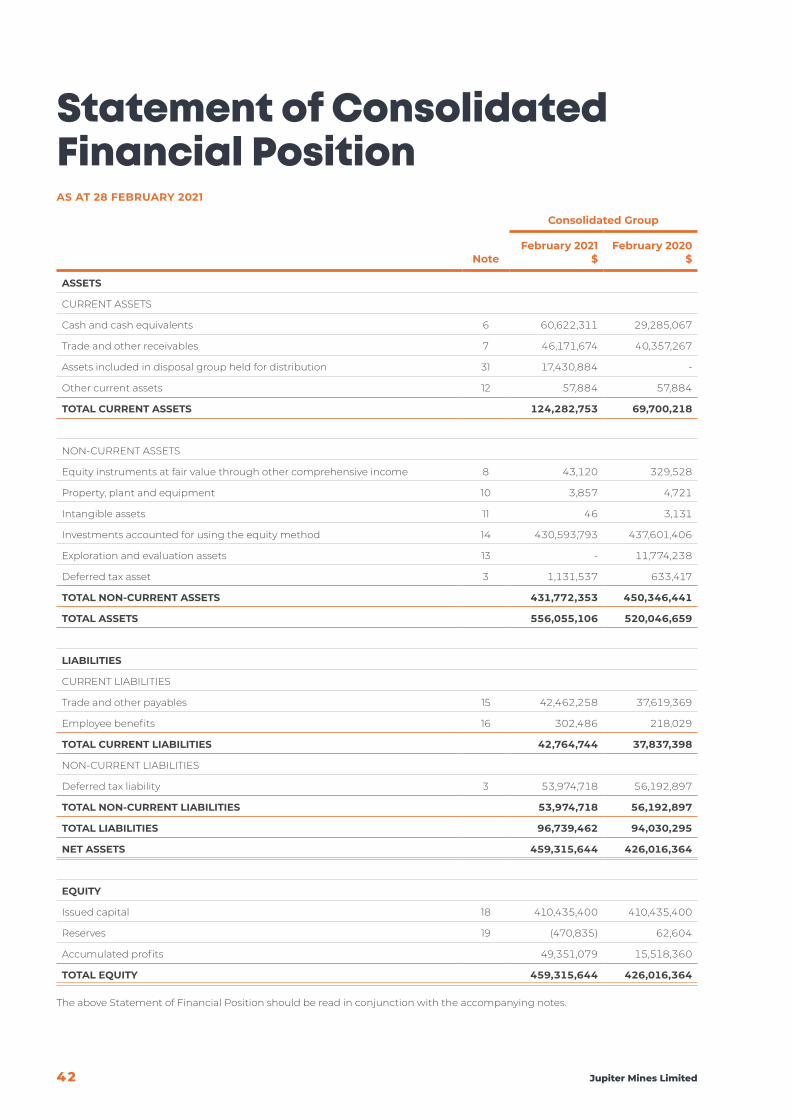
42 Jupiter Mines Limited
Statement of Consolidated Financial PositionAS AT 28 FEBRUARY 2021
Consolidated Group
NoteFebruary 2021
$February 2020
$
ASSETS
CURRENT ASSETS
Cash and cash equivalents 6 60,622,311 29,285,067
Trade and other receivables 7 46,171,674 40,357,267
Assets included in disposal group held for distribution 31 17,430,884 -
Other current assets 12 57,884 57,884
TOTAL CURRENT ASSETS 124,282,753 69,700,218
NON-CURRENT ASSETS
Equity instruments at fair value through other comprehensive income 8 43,120 329,528
Property, plant and equipment 10 3,857 4,721
Intangible assets 11 46 3,131
Investments accounted for using the equity method 14 430,593,793 437,601,406
Exploration and evaluation assets 13 - 11,774,238
Deferred tax asset 3 1,131,537 633,417
TOTAL NON-CURRENT ASSETS 431,772,353 450,346,441
TOTAL ASSETS 556,055,106 520,046,659
LIABILITIES
CURRENT LIABILITIES
Trade and other payables 15 42,462,258 37,619,369
Employee benefits 16 302,486 218,029
TOTAL CURRENT LIABILITIES 42,764,744 37,837,398
NON-CURRENT LIABILITIES
Deferred tax liability 3 53,974,718 56,192,897
TOTAL NON-CURRENT LIABILITIES 53,974,718 56,192,897
TOTAL LIABILITIES 96,739,462 94,030,295
NET ASSETS 459,315,644 426,016,364
EQUITY
Issued capital 18 410,435,400 410,435,400
Reserves 19 (470,835) 62,604
Accumulated profits 49,351,079 15,518,360
TOTAL EQUITY 459,315,644 426,016,364
The above Statement of Financial Position should be read in conjunction with the accompanying notes.

/ Annual Report 2021 43
Statement of Consolidated Changes in EquityFOR THE YEAR ENDED 28 FEBRUARY 2021
Ordinary Issued Capital
$
Foreign Currency
Translation Reserve
$
Equity Instruments at FVOCI Reserve
$
Accumulated Profits/(Losses)
$Total
$
Balance at 1 March 2019 410,435,400 (41,804) 340,257 (1,240,502) 409,493,351
Profit attributable to members of parent entity
- - - 95,118,503 95,118,503
Total other comprehensive income/(loss) for the year
- (18,314) (217,535) - (235,849)
Total comprehensive income for the year - (18,314) (217,535) 95,118,503 94,882,654
Dividends paid/declared - - - (78,359,641) (78,359,641)
Balance as at 29 February 2020 410,435,400 (60,118) 122,722 15,518,360 426,016,364
Profit attributable to members of parent entity
- - - 67,519,400 67,519,400
Total other comprehensive income/(loss) for the year
- (400,378) 462,601 - 62,223
Total comprehensive income for the year - (400,378) 462,601 67,519,400 67,581,623
Dividends paid/declared - - - (34,282,343) (34,282,343)
Transfer of fair value reserve of equity instruments designated at FVOCI
- - (595,662) 595,662 -
Balance as at 28 February 2021 410,435,400 (460,496) (10,339) 49,351,079 459,315,644
During FY2021, the Group sold its equity interest in GWR Group Limited. The fair value on the date of sale is $749,008 and the accumulated gain recognised in OCI of $595,662 was transferred to retained earnings.
The Statement of Changes in Equity should be read in conjunction with the accompanying notes.

44 Jupiter Mines Limited
Statement of Consolidated Cash FlowsFOR THE YEAR ENDED 28 FEBRUARY 2021
Consolidated Group
NoteFebruary 2021
$February 2020
$
CASH FLOWS FROM OPERATING ACTIVITIES
Payments to suppliers and employees (3,068,629) (12,825,698)
Receipts from customers 8,500,819 14,190,076
Income taxes paid (2,230,436) (2,692,358)
Net cash used in discontinued operations (5,698) -
Net cash generated from / (used in) operating activities 23 3,196,056 (1,327,980)
CASH FLOWS FROM INVESTING ACTIVITIES
Purchase of property, plant and equipment 10 (1,717) (2,183)
Payments for exploration and evaluation of mining reserves - (974,238)
Proceeds from sale of financial assets 749,008 -
Dividend received from investments 14 69,944,768 83,431,732
Interest received 297,548 1,158,122
Net cash used in discontinued operations (941,783) -
Net cash from investing activities 70,047,824 83,613,433
CASH FLOWS FROM FINANCING ACTIVITIES
Dividend paid 29 (34,282,345) (127,334,417)
Net cash used in discontinued operations (65,948) -
Net cash used in financing activities (34,348,293) (127,334,417)
Net increase/(decrease) in cash and cash equivalents held 38,895,587 (45,048,964)
Cash and cash equivalents at beginning of financial period 6 29,285,067 72,848,680
Effect of exchange rates on cash holdings in foreign currencies (2,558,342) 1,485,351
Cash and cash equivalents at the end of the financial period 6 65,622,312 29,285,067
The Statement of Cash Flows should be read in conjunction with the accompanying notes.
/ Annual Report 2021 45
No
tes
to t
he
Co
nso
lidat
ed F
inan
cial
Sta
tem
ents
Notes to the Consolidated Financial StatementsFOR THE YEAR ENDED 28 FEBRUARY 2021
nOte 1: SUMMARY OF SigniFicAnt AccOUnting pOLicieSThese consolidated financial statements and notes represent those of Jupiter Mines Limited (“Jupiter”) and its Controlled Entities (the “Consolidated Group” or “Group”).
The principal activities of Jupiter during the year have been investment in the operating Tshipi Borwa Manganese Mine in South Africa and the sale of manganese ore.
The separate financial statements of the parent entity, Jupiter Mines Limited, have not been presented within this financial report as permitted by the Corporations Act 2001.
The financial statements were authorised and issued by the Board of Directors on 27 May 2021.
Foreign Currency Translation(i) Functional and presentation currency
The functional and presentation currency of Jupiter and its subsidiaries is Australian dollars ($). The presentation and functional currency for the interest in Tshipi is the South African Rand.
The results are translated into Australian dollars for disclosure in Jupiter’s consolidated accounts.
Non-monetary items that are measured in terms of historical cost in a foreign currency are translated using the exchange rate as at the initial transaction. Non-monetary items measured at fair value in a foreign currency are translated using the exchange rates at the date when the fair value was determined.
(ii) Translation of interest in Joint Venture functional currency to presentation currency
The results of the South African Joint Venture interest are translated into Australian dollars using an average rate over the period of the transactions. Assets and liabilities are translated at exchange rates prevailing at reporting dates.
Basis of PreparationThese general purpose financial statements have been prepared in accordance with Australian Accounting Standards, Australian Accounting Interpretations, other authoritative pronouncements of the Australian Accounting Standards Board (AASB) and the Corporations Act 2001.
Australian Accounting Standards set out accounting policies that the AASB has concluded would result in a financial report containing relevant and reliable information about transactions, events and conditions. Compliance with Australian Accounting Standards ensures that the financial statements and notes also comply with International Financial Reporting Standards. Material accounting policies adopted in the preparation of this financial report are presented below and have been consistently applied unless otherwise stated.
The financial report has been prepared on an accruals basis and is based on historical costs, modified, where applicable, by the measurement at fair value of selected non-current assets, financial assets and financial liabilities. All amounts in the financial report have been rounded to the nearest dollar. Tables may not cast in all instances due to rounding.
Jupiter Mines Limited is a for-profit entity for the purpose of preparing the financial statements.
a. principles of consolidationThe Group financial statements consolidate those of the Parent Company and all its subsidiaries as of 28 February 2021. The parent controls a subsidiary if it is exposed, or has rights, to variable returns from its involvement with the subsidiary and has the ability to affect those returns through its power over the subsidiary. All subsidiaries have a reporting date of 28 February. A list of controlled entities is contained in Note 9 to the financial statements.
In preparing the consolidated financial statements, all inter-Group balances and transactions between entities in the Consolidated Group have been eliminated on consolidation. Accounting policies of subsidiaries have been changed where necessary to ensure consistency with those adopted by the parent entity.
Business CombinationsThe Group applies the acquisition method in accounting for business combinations. The consideration transferred by the Group to obtain control of a subsidiary is calculated as the sum of the acquisition-date fair values of assets transferred, liabilities incurred, and the equity interests issued by the Group, which includes the fair value of any asset or liability arising from a contingent consideration arrangement. Acquisition costs are expensed as incurred.
The Group recognises identifiable assets acquired and liabilities assumed in a business combination regardless of whether they have been previously recognised in the acquiree’s financial statements prior to the acquisition. Assets acquired and liabilities assumed are generally measured at their acquisition-date fair values.
46 Jupiter Mines Limited
No
tes
to t
he
Co
nso
lidat
ed F
inan
cial
Sta
tem
ents
Goodwill is stated after separate recognition of identifiable intangible assets. It is calculated as the excess of the sum of: (a) fair value of consideration transferred, (b) the recognised amount of any non-controlling interest in the acquiree, and (c) acquisition-date fair value of any existing equity interest in the acquiree, over the acquisition-date fair values of identifiable net assets. If the fair values of identifiable net assets exceed the sum calculated above, the excess amount (i.e. gain on a bargain purchase) is recognised in profit or loss immediately.
b. interests in Joint venturesThe Group acquired an interest in Tshipi é Ntle Manganese Mining Proprietary Limited (“Tshipi”), a joint venture entity, in October 2010. The Group’s accounting policy for joint ventures was considered by the Directors as part of the deliberation on the Tshipi acquisition, and had not been formally considered or articulated previously.
A joint venture is an arrangement that the Group controls jointly with one or more other investors, and over which the Group has rights to a share of the arrangement’s net assets rather than direct rights to underlying assets and obligations for underlying liabilities.
Investments in joint ventures are accounted for using the equity method.
Any goodwill or fair value adjustment attributable to the Group’s share in the associate or joint venture is not recognised separately and is included in the amount recognised as investment.
The carrying amount of the investment in associates and joint ventures is increased or decreased to recognise the Group’s share of the profit or loss and other comprehensive income of the associate and joint venture, adjusted where necessary to ensure consistency with the accounting policies of the Group.
Unrealised gains and losses on transactions between the Group and its associates and joint ventures are eliminated to the extent of the Group’s interest in those entities. Where unrealised losses are eliminated, the underlying asset is also tested for impairment.
c. income taxThe income tax expense (revenue) for the year comprises current income tax expense (income) and deferred tax expense (income).
Current income tax expense charged to profit or loss is the tax payable on taxable income. Current tax liabilities (assets) are measured at the amounts expected to be paid to (recovered from) the relevant taxation authority.
Deferred income tax expense reflects movements in deferred tax asset and deferred tax liability balances during the year as well as unused tax losses.
Current and deferred income tax expense (income) is charged or credited outside profit or loss when the tax relates to items that are recognised outside profit or loss.
Except for business combinations, no deferred income tax is recognised from the initial recognition of an asset or liability, where there is no effect on accounting or taxable profit or loss.
Deferred tax assets and liabilities are calculated at the tax rates that are expected to apply to the year when the asset is realised, or the liability is settled, and their measurement also reflects the manner in which management expects to recover or settle the carrying amount of the related asset or liability.
Deferred tax assets relating to temporary differences and unused tax losses are recognised only to the extent that it is probable that future taxable profit will be available against which the benefits of the deferred tax asset can be utilised.
Where temporary differences exist in relation to investments in subsidiaries, branches, associates, and joint ventures, deferred tax assets and liabilities are not recognised where the timing of the reversal of the temporary difference can be controlled and it is not probable that the reversal will occur in the foreseeable future.
Current tax assets and liabilities are offset where a legally enforceable right of set-off exists and it is intended that net settlement or simultaneous realisation and settlement of the respective asset and liability will occur. Deferred tax assets and liabilities are offset where: (a) a legally enforceable right of set-off exists; and (b) the deferred tax assets and liabilities relate to income taxes levied by the same taxation authority on either the same taxable entity or different taxable entities where it is intended that net settlement or simultaneous realisation and settlement of the respective asset and liability will occur in future years in which significant amounts of deferred tax assts or liabilities are expected to be recovered or settled.
d. property, plant and equipmentEach class of property, plant and equipment is carried at cost as indicated less, where applicable, any accumulated depreciation and impairment losses.
Plant and equipmentPlant and equipment are measured on the cost basis.
The carrying amount of plant and equipment is reviewed annually by directors to ensure it is not in excess of the recoverable amount from these assets. The recoverable amount is assessed on the basis of the expected net cash flows that will be received from the asset’s employment and subsequent disposal. The expected net cash flows have been discounted to their present values in determining recoverable amounts.
The cost of fixed assets constructed within the Consolidated Group includes the cost of materials, direct labour, borrowing costs and an appropriate proportion of fixed and variable overheads.
Subsequent costs are included in the asset’s carrying amount or recognised as a separate asset, as appropriate, only when it is probable that future economic benefits associated with the item will flow to the Group and the cost of the item can be measured reliably. All other repairs and maintenance are charged to the Statement of Profit or Loss and Other Comprehensive Income during the financial year in which they are incurred.
/ Annual Report 2021 47
No
tes
to t
he
Co
nso
lidat
ed F
inan
cial
Sta
tem
ents
DepreciationThe depreciable amount of all fixed assets is depreciated on a straight-line basis over their useful lives to the Consolidated Group commencing from the time the asset is held ready for use.
The depreciation rates used for each class of depreciable assets are:
Class of Fixed Asset Depreciation Rate
Leasehold improvements 20.00%
Furniture & fittings 33.33%
Plant & equipment:
Motor vehicles 12.50%
Site equipment 33.33%
The assets’ residual values and useful lives are reviewed, and adjusted if appropriate, at each reporting date.
An asset’s carrying amount is written down immediately to its recoverable amount if the asset’s carrying amount is greater than its estimated recoverable amount.
Gains and losses on disposals are determined by comparing proceeds with the carrying amount. These gains and losses are included in the Statement of Profit or Loss and Other Comprehensive Income.
e. exploration and evaluation expenditure
The application of the Group’s accounting policy for exploration and evaluation expenditure requires judgment in determining whether it is likely that future economic benefits are likely either from future exploitation or sale or where activities have not reached a stage that permits a reasonable assessment of the existence of reserves. The determination of a Joint Ore Reserves Committee (JORC) resource is itself an estimation process that requires varying degrees of uncertainty depending on sub-classification and these estimates directly impact the point of deferral of exploration and evaluation expenditure. The deferral policy requires management to make certain estimates and assumptions about future events or circumstances, in particular, whether an economically viable extraction operation can be established. Estimates and assumptions made may change if new information becomes available. If, after expenditure is capitalised, information becomes available suggesting that the recovery of expenditure is unlikely, the amount capitalised is written off in the Statement of Profit or Loss and Other Comprehensive Income in the year when the new information becomes available.
f. Financial instrumentsFinancial assets and financial liabilities are recognised when the Group becomes a party to the contractual provisions of the financial instrument.
Financial assets are derecognised when the contractual rights to the cash flows from the financial asset expire, or when the financial asset and substantially all the risks and rewards are transferred. A financial liability is derecognised when it is extinguished, discharged, cancelled or expires.
Classification and initial measurement of financial assets
Financial assets are classified according to their business model and the characteristics of their contractual cash flows. Except for those trade receivables that do not contain a significant financing component and are measured at the transaction price in accordance with AASB 15, all financial assets are initially measured at fair value adjusted for transaction costs (where applicable).
Subsequent measurement of financial assets
For the purpose of subsequent measurement, financial assets, other than those designated and effective as hedging instruments, are classified into the following two categories:
� Financial assets at amortised cost
� Equity instruments at fair value through other comprehensive income (“Equity FVTOCI”)
All income and expenses relating to financial assets that are recognised in profit or loss are presented within finance costs, finance income or other financial items, except for impairment of trade receivables which is presented within other expenses.
Financial assets at amortised cost
Financial assets with contractual cash flows representing solely payments of principal and interest and held within a business model of ‘hold to collect’ contractual cash flows are accounted for at amortised cost using the effective interest method. The Group’s trade and most other receivables fall into this category of financial instruments as well as bonds that were previously classified as held-to-maturity under AASB 139.
Equity instruments at fair value through other comprehensive income (“Equity FVTOCI”)
Investments in equity instruments that are not held for trading are eligible for an irrevocable election at inception to be measured at FVTOCI. Under this category, subsequent movements in fair value are recognised in other comprehensive income and are never reclassified to profit or loss. Dividend income is taken to profit or loss unless the dividend clearly represents return of capital.
Trade and other receivables
The Group makes use of a simplified approach in accounting for trade and other receivables and records the loss allowance at the amount equal to the expected lifetime credit losses. In using this practical expedient, the Group uses its historical experience, external indicators and forward-looking information to calculate the expected credit losses using a provision matrix. The Group allows 1% for amounts that are 30 to 60 days past due, 1.5% for amounts that are between 60 and 90 days past due and writes off fully any amounts that are more than 90 days past due.
Financial assets at fair value through other comprehensive income
The Group recognises 12 months expected credit losses for financial assets at FVTOCI. As most of these instruments have a high credit rating, the likelihood of default is deemed to be small. However, at each reporting date the Group assesses whether there has been a significant increase in the credit risk of the instrument.
4 8 Jupiter Mines Limited
No
tes
to t
he
Co
nso
lidat
ed F
inan
cial
Sta
tem
ents
In assessing these risks, the Group relies on readily available information such as the credit ratings issued by the major credit rating agencies for the respective asset. The Group only holds simple financial instruments for which specific credit ratings are usually available. In the unlikely event that there is no or only little information on factors influencing the ratings of the asset available, the Group would aggregate similar instruments into a portfolio to assess on this basis whether there has been a significant increase in credit risk.
In addition, the Group considers other indicators such as adverse changes in business, economic or financial conditions that could affect the borrower’s ability to meet its debt obligation or unexpected changes in the borrowers operating results.
Should any of these indicators imply a significant increase in the instrument’s credit risk, the Group recognises for this instrument or class of instruments the lifetime expected credit losses.
Classification and measurement of financial liabilities
The Group’s financial liabilities include only trade and other payables.
Financial liabilities are initially measured at fair value, and, where applicable, adjusted for transaction costs unless the Group designated a financial liability at fair value through profit or loss.
Subsequently, financial liabilities are measured at amortised cost using the effective interest method.
All interest-related charges and, if applicable, changes in an instrument’s fair value that are reported in profit or loss are included within finance costs or finance income.
g. impairment of non-Financial Assets
At each reporting date, the Group reviews the carrying values of its tangible and intangible assets to determine whether there is any indication that those assets have been impaired. If such an indication exists, the recoverable amount of the asset, being the higher of the asset’s fair value less costs to sell and value in use, is compared to the asset’s carrying value. Any excess of the asset’s carrying value over its recoverable amount is expensed to the Statement of Profit or Loss and Other Comprehensive Income.
Where it is not possible to estimate the recoverable amount of an individual asset, the Group estimates the recoverable amount of the cash-generating unit to which the asset belongs.
Impairment testing is performed annually for goodwill and intangible assets with indefinite lives.
h. employee BenefitsProvisions are made for the Company’s liability for employee benefits arising from services rendered by employees to reporting date. Employee benefits that are expected to be settled wholly within one year have been measured at the amounts expected to be paid when the liability is settled. Employee benefits payable later than one year have been measured at the present value of the estimated future cash outflows to be made for those benefits. Those cash flows are
discounted using market yields on high quality corporate bonds with terms to maturity that match the expected timing of cash flows.
i. provisionsProvisions are recognised when the Group has a legal or constructive obligation, as a result of past events, for which it is probable that an outflow of economic benefits will result and that outflow can be reliably measured.
j. cash and cash equivalentsCash and cash equivalents include cash on hand, deposits held at call with banks, other short-term highly liquid investments with original maturities of three months or less, less credit card facilities used. Bank overdrafts are shown as short-term borrowings in liabilities.
k. trade and Other ReceivablesTrade receivables are initially measured at their transaction price. Subsequent to initial recognition, they are measured at amortised cost using the effective interest method.
The Group makes use of the simplified approach in accounting for trade and other receivables and records the loss allowance at the amount equal to the expected lifetime credit losses.
At each reporting date, the Branch recognises the change in lifetime expected credit losses in profit or loss as an impairment gain or loss.
l. Revenue and Other incomeAASB 15 Revenue from Contracts with Customers outlines a single comprehensive model of accounting for revenue arising from contracts with customers. The core principle is that an entity recognises revenue based on a five-step model to reflect the transfer of goods or services, measured at the amount to which the Branch expects to be entitled to in exchange for those goods or services.
The application of the five-step model in AASB 15 requires the exercise of judgement, considering all facts and circumstances relevant to each contract - the relevant judgements have been disclosed in note 1(q). The standard also provides guidance on the accounting treatment of costs attributable to fulfilling the contract, as well as the incremental costs of obtaining the contract.
In terms of AASB 15, the Branch identifies each separate performance obligation contained in the contract and allocates a portion of the contract revenue to each performance obligation. Revenue is then only recognised on the satisfaction of each of the relevant performance obligations. Revenue from contracts with customers is recognised when control is transferred to the customer.
Interest revenue is recognised using the effective interest rate method, which, for floating rate financial assets, is the rate inherent in the instrument.
Full details are provided at Note 2.
All revenue is stated net of the amount of goods and services tax (GST).
/ Annual Report 2021 49
No
tes
to t
he
Co
nso
lidat
ed F
inan
cial
Sta
tem
ents
m. Borrowing costsBorrowing costs directly attributable to the acquisition, construction or production of assets that necessarily take a substantial period of time to prepare for their intended use or sale, are added to the cost of those assets, until such time as the assets are substantially ready for their intended use or sale.
All other borrowing costs are recognised in the Statement of Profit or Loss and Other Comprehensive Income in the period in which they are incurred.
n. goods and Services tax (gSt)Revenues, expenses and assets are recognised net of the amount of GST, except where the amount of GST incurred is not recoverable from the Australian Taxation Office (ATO).
Receivables and payables are stated inclusive of the amount of GST receivable or payable. The net amount of GST recoverable from, or payable to, the ATO is included with other receivables or payables in the statement of financial position.
Cash flows are presented on a gross basis. The GST components of cash flows arising from investing or financing activities that are recoverable from, or payable to, the ATO are presented as operating cash flows included in receipts from customers or payments to suppliers.
o. trade and Other payablesTrade and other payables are carried at cost and, due to their short term nature, are not discounted. They represent liabilities for goods and services provided to the Group prior to the end of the financial period that are unpaid and arise when Jupiter becomes obliged to make future payments in respect of the purchase of these goods and services. The amounts are unsecured and are usually paid within 30 days of recognition.
p. comparative FiguresWhen required by Accounting Standards, comparative figures have been adjusted to conform to changes in presentation for the current financial period.
q. critical Accounting estimates and Judgements
The Directors evaluate estimates and judgements incorporated into the financial report based on historical knowledge and best available current information. Estimates assume a reasonable expectation of future events and are based on current trends and economic data, obtained both externally and within the Group.
Key estimates – Impairment of non-financial assets
The Group assesses impairment at each reporting date by evaluating conditions specific to the Group that may lead to impairment of assets. Where an impairment trigger exists, the recoverable amount of the asset is determined.
Key judgements – Exploration and evaluation expenditure
The Group’s accounting policy for exploration and evaluation expenditure results in certain items of expenditure being capitalised for an area of interest where it is considered likely
to be recoverable by future exploitation or sale or where the activities have not reached a stage that permits a reasonable assessment of the existence of reserves. This policy requires management to make certain estimates and assumptions as to future events and circumstances, in particular, whether an economically viable extraction operation can be established. Any such estimates and assumptions may change as new information becomes available. If, after having capitalised the expenditure under the policy, a judgement is made that recovery of the expenditure is unlikely, the relevant capitalised amount will be written off to the Statement of Profit or Loss and Other Comprehensive Income.
Key judgements – revenue from contracts with customers
The Jupiter Mines Limited (External Profit Company) (“SA Branch”) acted as an agent, as opposed to a principal, for all sales contracts entered into during the financial year. In determining whether the SA Branch acted as an agent, management considered elements of control and risks assumed by the SA Branch. The SA Branch earned a fixed percentage marketing fee for the sales contracts, assumed limited risks (inventory, pricing) and although the SA Branch obtained legal title of the goods this was only obtained momentarily and did not demonstrate that the SA Branch controlled the goods. Based on these factors, the Branch considered it was acting in an agency relationship.
The revenue and associated trade receivables and trade payables balances are calculated based on management’s best estimate of the metal and moisture content of the ore shipped to customers. Extensive sampling and surveying is performed prior to shipment in an effort to ensure the accuracy of these estimations. Due to the inherent limitations of sampling and the method of transport, variances in the metal and moisture content measured on arrival at the discharge port may be different from those estimated by management on the date of the sale. Variances in the metal and moisture content of the shipped ore on arrival at the discharge port will have an impact on the profitability of the SA Branch.
r. non-current assets held for distribution and discontinued operations
The Group classifies non-current assets and disposal groups as held for distribution if their carrying amounts will be recovered principally through a sale transaction rather than through continuing use. Non-current assets and disposal groups classified as held for distribution are measured at the lower of their carrying amount and fair value less costs to sell. Costs to sell are the incremental costs directly attributable to the disposal of an asset (disposal group), excluding finance costs and income tax expense.
The criteria for held for distribution classification is regarded as met only when the sale is highly probable and the asset or disposal group is available for immediate sale in its present condition. Actions required to complete the sale should indicate that it is unlikely that significant changes to the sale will be made or that the decision to sell will be withdrawn. Management must be committed to the plan to sell the asset and the sale expected to be completed within one year from the date of the classification.

50 Jupiter Mines Limited
No
tes
to t
he
Co
nso
lidat
ed F
inan
cial
Sta
tem
ents
Assets and liabilities classified as held for distribution are presented separately as current items in the statement of financial position.
A disposal group qualifies as discontinued operation if it is a component of an entity that either has been disposed of, or is classified as held for sale, and:
� Represents a separate major line of business or geographical area of operations
� Is part of a single coordinated plan to dispose of a separate major line of business or geographical area of operations, or;
� Is a subsidiary acquired exclusively with a view to resale.
Discontinued operations are excluded from the results of continuing operations and are presented as a single amount as profit or loss after tax from discontinued operations in the statement of profit or loss.
Additional disclosures are provided in note 31. All other notes to the financial statements include amounts for continuing operations, unless indicated otherwise.
New and amended Accounting Standards and Interpretations for current yearA number of new Standards, amendment of Standards and interpretations which have become effective for the year ended 28 February 2021 have been adopted and do not have a significant impact on the Group’s financial results or position.
New accounting standards not yet effectiveThere are no forthcoming standards and amendments that are expected to have a material impact on the group in the current or future reporting periods, or on foreseeable future transactions.
nOte 2: RevenUe
Consolidated Group
February 2021$
February 2020$
Marketing fee revenue 8,202,796 10,358,857
Gross profit 8,202,796 10,358,857
Other income 592,071 660,096
Other income 592,071 660,096
The “SA Branch” is registered in South Africa for the purpose of the sale and export of Jupiter’s share of Tshipi manganese ore.
AASB 15 Revenue from Contracts with Customers outlines a single comprehensive model of accounting for revenue arising from contracts with customers. The core principle is that an entity recognises revenue based on a five-step model to reflect the transfer of goods or services, measured at the amount to which the SA Branch expects to be entitled to in exchange for those goods or services.
The application of the five-step model in AASB 15 requires the exercise of judgement, considering all facts and circumstances relevant to each contract - the relevant judgements have been disclosed in note 1. The standard also provides guidance on the accounting treatment of costs attributable to fulfilling the contract, as well as the incremental costs of obtaining the contract.
In terms of AASB 15, the SA Branch identifies each separate performance obligation contained in the contract and allocates a portion of the contract revenue to each performance obligation. Revenue is then only recognised on the satisfaction of each of the relevant performance obligations. Revenue from contracts with customers is recognised when control is transferred to the customer.
Tshipi joint venture records the sale of manganese ore as revenue and Jupiter records its share of the Tshipi profits by equity accounting.
Sale of Manganese OreGiven the Branch only takes control of the goods momentarily before control passes to the customer as well as the limited risks which the Branch assumes the Branch is considered to be acting in an agency capacity.
The nature of the SA Branch’s contracts are to arrange for the goods (manganese ore) to be provided by another party (Tshipi) and therefore the SA Branch is acting in an agency capacity, facilitating the sale between Tshipi and the customer. Under the previous accounting standard, AASB 118, all sales contracts entered into, where the purchase price of the manganese ore was equal to the selling price, the SA Branch was also considered to have been acting in an agency capacity.
/ Annual Report 2021 51
No
tes
to t
he
Co
nso
lidat
ed F
inan
cial
Sta
tem
ents
Marketing Fee IncomeThe SA Branch receives a fixed commission on each sale based on the FOB selling price. The amount and timing of revenue to be recognised from marketing fee income under AASB 15 was considered below against the five step model:
� There is a contract with Tshipi, for each parcel sold, which entitles the SA Branch to receive the commission. The contract has commercial substance and both parties are committed to performing their obligations;
� The performance obligation for the SA Branch in respect to each sale is that the SA Branch needs to facilitate the sale between the customer and Tshipi;
� The transaction price can be determined as it is calculated as a fixed percentage of the FOB selling price;
� There is only one performance obligation in the contract and therefore the whole transaction price has been allocated to this performance obligation;
� Revenue is recognised when the performance obligation is satisfied. The performance obligation of the SA Branch is considered to be satisfied when control passes from Tshipi to the customer. Control passes to the customer when the ore passes over the rail of the vessel (bill of lading date), this is when the customer has the obligation to pay for the goods transferred and when risk and rewards of ownership are transferred to the customer.
Marketing fee income is determined based on the final metal and moisture content at the discharge port. On the bill of lading date, the provisional marketing fee income is recognised based on the load port metal and moisture content which is considered to be the best estimate. Once the final metal and moisture content is determined on finalisation of the sales transaction, typically between 2 and 3 months later, the marketing fee income initially recognised is adjusted subsequently. At the reporting period, the fair value of the original marketing fee income and associated receivable is adjusted by reference to the best estimate of the actual metal and moisture content. The changes in fair value are recorded as an adjustment to marketing fee income.
On the bill of lading date, there is no uncertainty regarding Jupiter’s entitlement to the marketing fee as their responsibilities under the marketing fee arrangement have been performed and they have an unconditional right to the marketing fee on this date. The marketing fee amount receivable will only be adjusted for the final metal and moisture content, as stated above. Jupiter invoices Tshipi for the marketing fee once the final metal and moisture content can be determined and the customer has paid Tshipi for the final invoice. The payment is typically three months after the marketing fee income was first recognised and the contract is therefore considered to be short term in nature.
Under AASB 15, the accounting for marketing fee income will remain unchanged in that marketing fee income will be recognised when control passes to the customer, which will continue to be the date of delivery when risks and rewards passed to the customer.
nOte 3: incOMe tAX eXpenSe And deFeRRed tAXeSThe major components of tax expense and the reconciliation of the expected tax expense based on the domestic effective tax rate of Jupiter Mines at 30% (2020: 30%) and the reported tax expense in the profit or loss are as follows:
Consolidated Group
February 2021$
February 2020$
Tax expense comprises:
(a) Current tax 2,073,305 2,291,414
Add:
Deferred income tax relating to origination and reversal of temporary differences
Current tax in respect of prior years - 758,253
� Origination and reversal of timing differences (1,984,776) 4,447,465
� Recognition of deferred tax asset losses (735,720) -
� Under provision in respect of prior years 4,150 1,310,456
Tax (benefit)/expense (643,041) 8,807,588
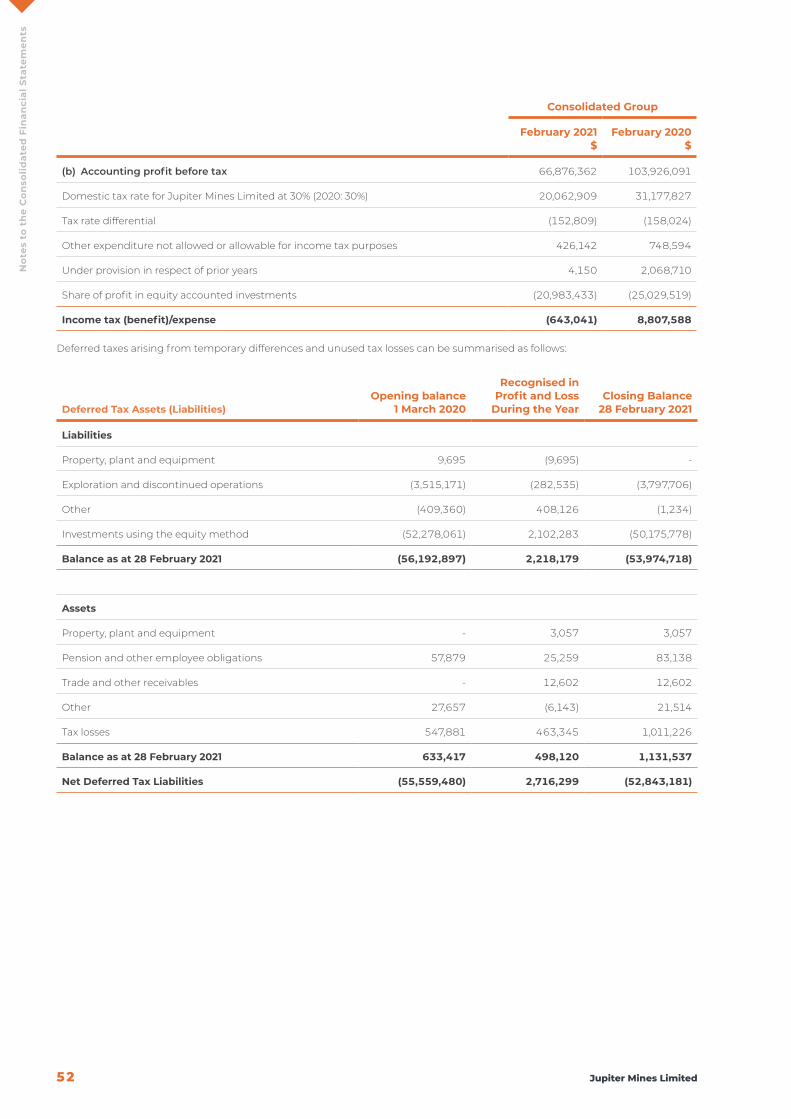
52 Jupiter Mines Limited
No
tes
to t
he
Co
nso
lidat
ed F
inan
cial
Sta
tem
ents
Consolidated Group
February 2021$
February 2020$
(b) Accounting profit before tax 66,876,362 103,926,091
Domestic tax rate for Jupiter Mines Limited at 30% (2020: 30%) 20,062,909 31,177,827
Tax rate differential (152,809) (158,024)
Other expenditure not allowed or allowable for income tax purposes 426,142 748,594
Under provision in respect of prior years 4,150 2,068,710
Share of profit in equity accounted investments (20,983,433) (25,029,519)
Income tax (benefit)/expense (643,041) 8,807,588
Deferred taxes arising from temporary differences and unused tax losses can be summarised as follows:
Deferred Tax Assets (Liabilities)Opening balance
1 March 2020
Recognised in Profit and Loss
During the YearClosing Balance
28 February 2021
Liabilities
Property, plant and equipment 9,695 (9,695) -
Exploration and discontinued operations (3,515,171) (282,535) (3,797,706)
Other (409,360) 408,126 (1,234)
Investments using the equity method (52,278,061) 2,102,283 (50,175,778)
Balance as at 28 February 2021 (56,192,897) 2,218,179 (53,974,718)
Assets
Property, plant and equipment - 3,057 3,057
Pension and other employee obligations 57,879 25,259 83,138
Trade and other receivables - 12,602 12,602
Other 27,657 (6,143) 21,514
Tax losses 547,881 463,345 1,011,226
Balance as at 28 February 2021 633,417 498,120 1,131,537
Net Deferred Tax Liabilities (55,559,480) 2,716,299 (52,843,181)
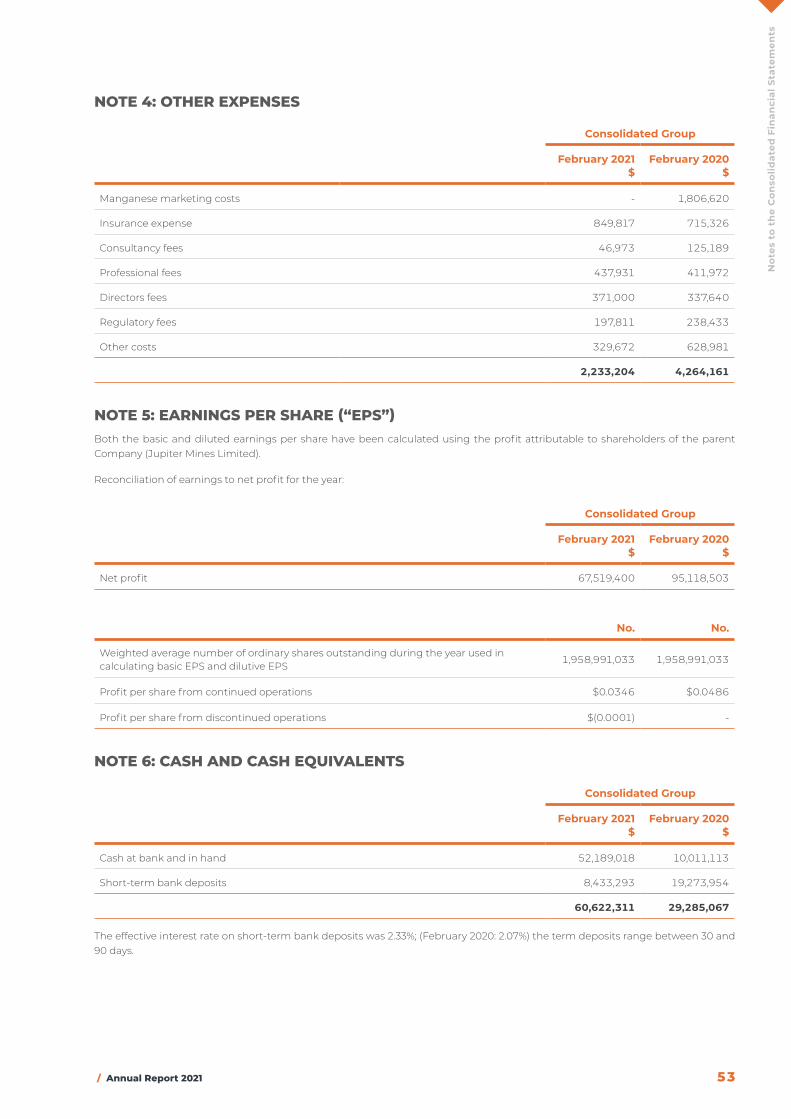
/ Annual Report 2021 53
No
tes
to t
he
Co
nso
lidat
ed F
inan
cial
Sta
tem
ents
nOte 4: OtHeR eXpenSeS
Consolidated Group
February 2021$
February 2020$
Manganese marketing costs - 1,806,620
Insurance expense 849,817 715,326
Consultancy fees 46,973 125,189
Professional fees 437,931 411,972
Directors fees 371,000 337,640
Regulatory fees 197,811 238,433
Other costs 329,672 628,981
2,233,204 4,264,161
nOte 5: eARningS peR SHARe (“epS”)Both the basic and diluted earnings per share have been calculated using the profit attributable to shareholders of the parent Company (Jupiter Mines Limited).
Reconciliation of earnings to net profit for the year:
Consolidated Group
February 2021$
February 2020$
Net profit 67,519,400 95,118,503
No. No.
Weighted average number of ordinary shares outstanding during the year used in calculating basic EPS and dilutive EPS
1,958,991,033 1,958,991,033
Profit per share from continued operations $0.0346 $0.0486
Profit per share from discontinued operations $(0.0001) -
nOte 6: cASH And cASH eQUivALentS
Consolidated Group
February 2021$
February 2020$
Cash at bank and in hand 52,189,018 10,011,113
Short-term bank deposits 8,433,293 19,273,954
60,622,311 29,285,067
The effective interest rate on short-term bank deposits was 2.33%; (February 2020: 2.07%) the term deposits range between 30 and 90 days.
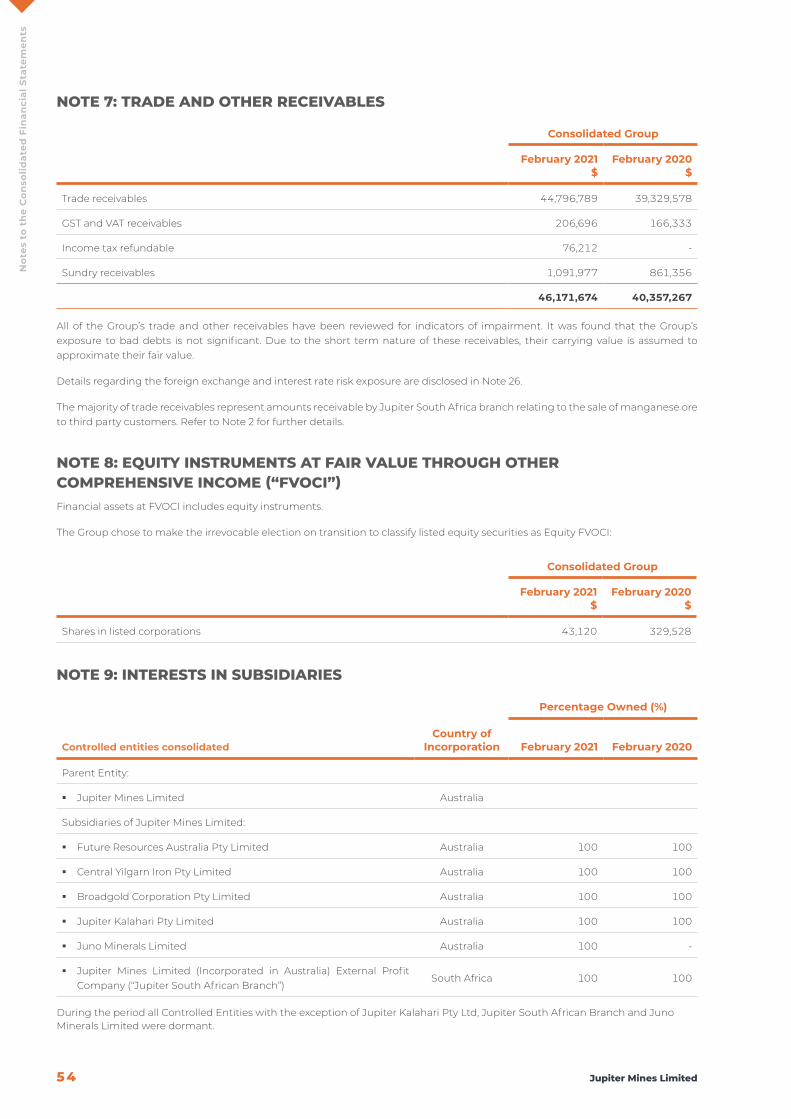
54 Jupiter Mines Limited
No
tes
to t
he
Co
nso
lidat
ed F
inan
cial
Sta
tem
ents
nOte 7: tRAde And OtHeR ReceivABLeS
Consolidated Group
February 2021$
February 2020$
Trade receivables 44,796,789 39,329,578
GST and VAT receivables 206,696 166,333
Income tax refundable 76,212 -
Sundry receivables 1,091,977 861,356
46,171,674 40,357,267
All of the Group’s trade and other receivables have been reviewed for indicators of impairment. It was found that the Group’s exposure to bad debts is not significant. Due to the short term nature of these receivables, their carrying value is assumed to approximate their fair value.
Details regarding the foreign exchange and interest rate risk exposure are disclosed in Note 26.
The majority of trade receivables represent amounts receivable by Jupiter South Africa branch relating to the sale of manganese ore to third party customers. Refer to Note 2 for further details.
nOte 8: eQUitY inStRUMentS At FAiR vALUe tHROUgH OtHeR cOMpReHenSive incOMe (“FvOci”)Financial assets at FVOCI includes equity instruments.
The Group chose to make the irrevocable election on transition to classify listed equity securities as Equity FVOCI:
Consolidated Group
February 2021$
February 2020$
Shares in listed corporations 43,120 329,528
nOte 9: inteReStS in SUBSidiARieS
Percentage Owned (%)
Controlled entities consolidatedCountry of
Incorporation February 2021 February 2020
Parent Entity:
� Jupiter Mines Limited Australia
Subsidiaries of Jupiter Mines Limited:
� Future Resources Australia Pty Limited Australia 100 100
� Central Yilgarn Iron Pty Limited Australia 100 100
� Broadgold Corporation Pty Limited Australia 100 100
� Jupiter Kalahari Pty Limited Australia 100 100
� Juno Minerals Limited Australia 100 -
� Jupiter Mines Limited (Incorporated in Australia) External Profit Company (“Jupiter South African Branch”)
South Africa 100 100
During the period all Controlled Entities with the exception of Jupiter Kalahari Pty Ltd, Jupiter South African Branch and Juno Minerals Limited were dormant.

/ Annual Report 2021 55
No
tes
to t
he
Co
nso
lidat
ed F
inan
cial
Sta
tem
ents
nOte 10: pROpeRtY, pLAnt And eQUipMentDetails of the Group’s property, plant and equipment and their carrying amounts are as follows:
Gross carrying amount
Leasehold Improvements
$
Plant and Equipment
$
Furniture and Fittings
$Total
$
Balance as at 1 March 2020 110,923 3,739,993 195,740 4,046,656
Additions - 1,717 - 1,717
Disposals - (48,657) - (48,657)
Balance as at 28 February 2021 110,923 3,693,053 195,740 3,999,716
Depreciation and impairment
Balance as at 1 March 2020 (110,923) (3,735,272) (195,740) (4,041,935)
Disposal - 48,657 - 48,657
Depreciation - (2,581) - (2,581)
Balance as at 28 February 2021 (110,923) (3,689,196) (195,740) (3,995,859)
Carrying amount as at 28 February 2021 - 3,857 - 3,857
Gross carrying amount
Leasehold Improvements
$
Plant and Equipment
$
Furniture and Fittings
$Total
$
Balance as at 1 March 2019 110,923 3,737,810 195,740 4,044,473
Additions - 2,183 - 2,183
Balance as at 29 February 2020 110,923 3,739,993 195,740 4,046,656
Depreciation and impairment
Balance as at 1 March 2019 (110,923) (3,732,845) (195,740) (4,039,508)
Depreciation - (2,427) - (2,427)
Balance as at 29 February 2020 (110,923) (3,735,272) (195,740) (4,041,935)
Carrying amount as at 29 February 2020 - 4,721 - 4,721
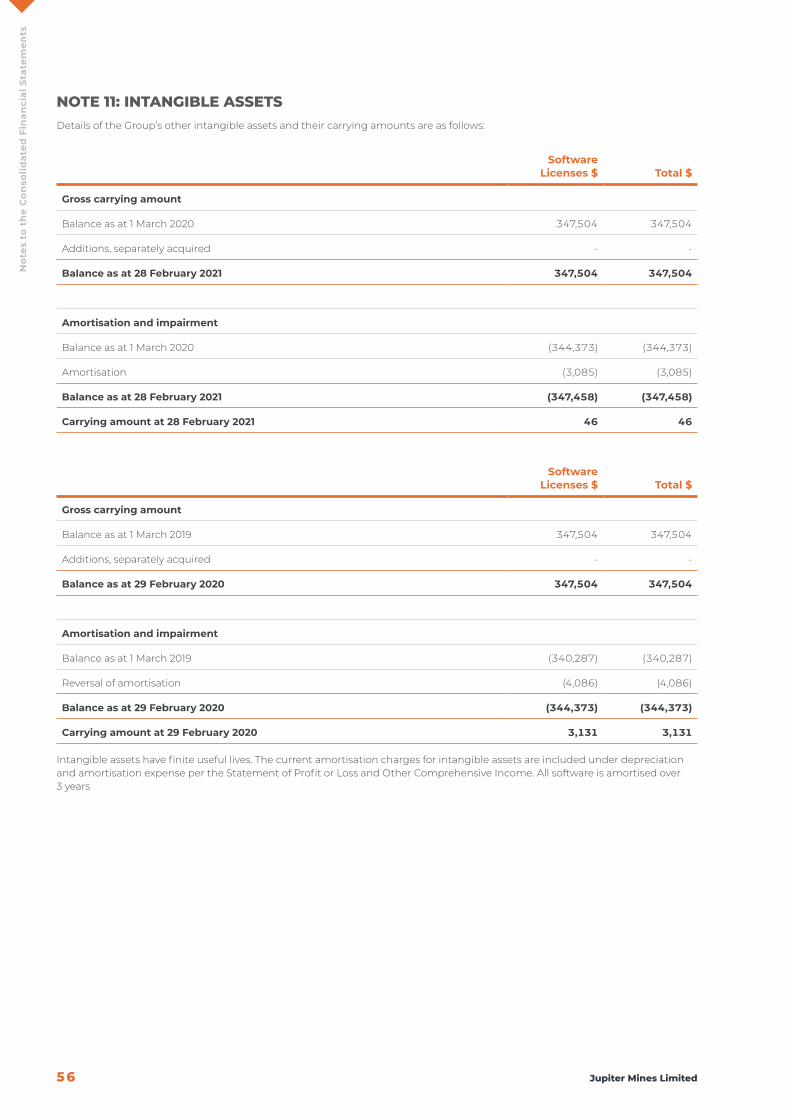
56 Jupiter Mines Limited
No
tes
to t
he
Co
nso
lidat
ed F
inan
cial
Sta
tem
ents
nOte 11: intAngiBLe ASSetSDetails of the Group’s other intangible assets and their carrying amounts are as follows:
Software Licenses $ Total $
Gross carrying amount
Balance as at 1 March 2020 347,504 347,504
Additions, separately acquired - -
Balance as at 28 February 2021 347,504 347,504
Amortisation and impairment
Balance as at 1 March 2020 (344,373) (344,373)
Amortisation (3,085) (3,085)
Balance as at 28 February 2021 (347,458) (347,458)
Carrying amount at 28 February 2021 46 46
Software Licenses $ Total $
Gross carrying amount
Balance as at 1 March 2019 347,504 347,504
Additions, separately acquired - -
Balance as at 29 February 2020 347,504 347,504
Amortisation and impairment
Balance as at 1 March 2019 (340,287) (340,287)
Reversal of amortisation (4,086) (4,086)
Balance as at 29 February 2020 (344,373) (344,373)
Carrying amount at 29 February 2020 3,131 3,131
Intangible assets have finite useful lives. The current amortisation charges for intangible assets are included under depreciation and amortisation expense per the Statement of Profit or Loss and Other Comprehensive Income. All software is amortised over 3 years
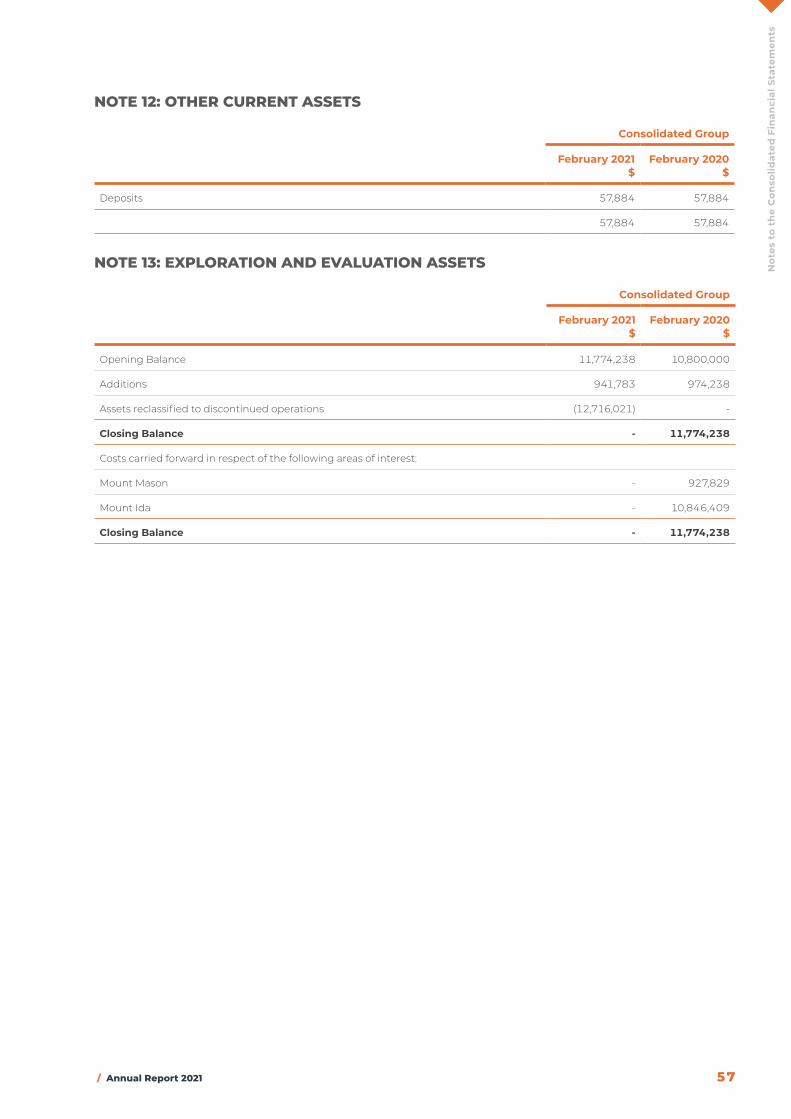
/ Annual Report 2021 57
No
tes
to t
he
Co
nso
lidat
ed F
inan
cial
Sta
tem
ents
nOte 12: OtHeR cURRent ASSetS
Consolidated Group
February 2021$
February 2020$
Deposits 57,884 57,884
57,884 57,884
nOte 13: eXpLORAtiOn And evALUAtiOn ASSetS
Consolidated Group
February 2021$
February 2020$
Opening Balance 11,774,238 10,800,000
Additions 941,783 974,238
Assets reclassified to discontinued operations (12,716,021) -
Closing Balance - 11,774,238
Costs carried forward in respect of the following areas of interest:
Mount Mason - 927,829
Mount Ida - 10,846,409
Closing Balance - 11,774,238
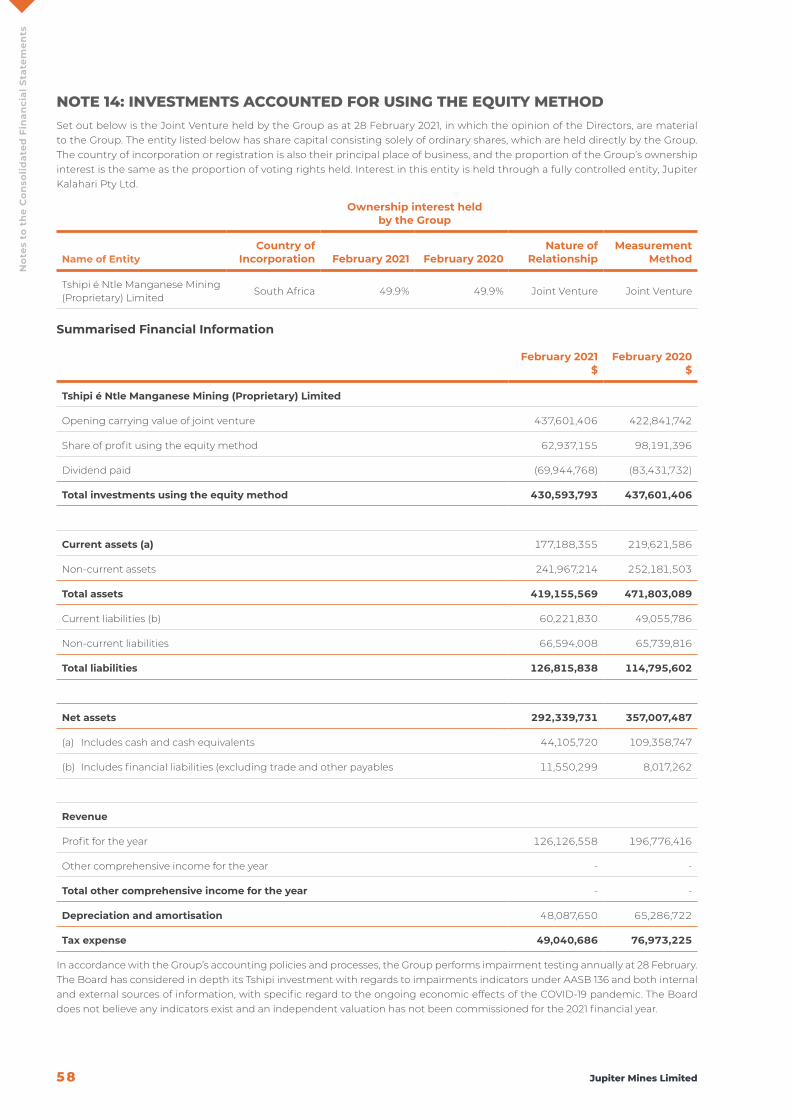
58 Jupiter Mines Limited
No
tes
to t
he
Co
nso
lidat
ed F
inan
cial
Sta
tem
ents
nOte 14: inveStMentS AccOUnted FOR USing tHe eQUitY MetHOdSet out below is the Joint Venture held by the Group as at 28 February 2021, in which the opinion of the Directors, are material to the Group. The entity listed below has share capital consisting solely of ordinary shares, which are held directly by the Group. The country of incorporation or registration is also their principal place of business, and the proportion of the Group’s ownership interest is the same as the proportion of voting rights held. Interest in this entity is held through a fully controlled entity, Jupiter Kalahari Pty Ltd.
Ownership interest held by the Group
Name of EntityCountry of
Incorporation February 2021 February 2020Nature of
RelationshipMeasurement
Method
Tshipi é Ntle Manganese Mining (Proprietary) Limited
South Africa 49.9% 49.9% Joint Venture Joint Venture
Summarised Financial Information
February 2021$
February 2020$
Tshipi é Ntle Manganese Mining (Proprietary) Limited
Opening carrying value of joint venture 437,601,406 422,841,742
Share of profit using the equity method 62,937,155 98,191,396
Dividend paid (69,944,768) (83,431,732)
Total investments using the equity method 430,593,793 437,601,406
Current assets (a) 177,188,355 219,621,586
Non-current assets 241,967,214 252,181,503
Total assets 419,155,569 471,803,089
Current liabilities (b) 60,221,830 49,055,786
Non-current liabilities 66,594,008 65,739,816
Total liabilities 126,815,838 114,795,602
Net assets 292,339,731 357,007,487
(a) Includes cash and cash equivalents 44,105,720 109,358,747
(b) Includes financial liabilities (excluding trade and other payables 11,550,299 8,017,262
Revenue
Profit for the year 126,126,558 196,776,416
Other comprehensive income for the year - -
Total other comprehensive income for the year - -
Depreciation and amortisation 48,087,650 65,286,722
Tax expense 49,040,686 76,973,225
In accordance with the Group’s accounting policies and processes, the Group performs impairment testing annually at 28 February. The Board has considered in depth its Tshipi investment with regards to impairments indicators under AASB 136 and both internal and external sources of information, with specific regard to the ongoing economic effects of the COVID-19 pandemic. The Board does not believe any indicators exist and an independent valuation has not been commissioned for the 2021 financial year.

/ Annual Report 2021 59
No
tes
to t
he
Co
nso
lidat
ed F
inan
cial
Sta
tem
ents
nOte 15: tRAde And OtHeR pAYABLeSConsolidated Group
February 2021$
February 2020$
Trade payables 41,679,440 36,501,106
Income tax payable - 80,967
Sundry payables and accrued expenses 782,818 1,037,296
42,462,258 37,619,369
Due to the short term nature of these payables, their carrying value is assumed to approximate to their fair value.
The majority of trade payables represent amounts payable to Tshipi relating to the purchase of manganese ore. Refer to Note 2 for further information.
nOte 16: cURRent pROviSiOnSAll provisions are considered current. The carrying amounts and movements in the provisions account are as follows:
February 2021$
Carrying amount 1 March 2020 – employee benefits 218,029
Additional provisions 107,898
Amount utilised (23,441)
Carrying amount 28 February 2021 302,486
February 2020$
Carrying amount 1 March 2019 – employee benefits 125,078
Additional provisions 147,157
Amount utilised (54,206)
Carrying amount 29 February 2020 218,029
nOte 17: eMpLOYee ReMUneRAtiOnExpenses recognised for employee benefits are analysed below:
Consolidated Group
February 2021$
February 2020$
Employee benefits - expense
Salary and wages 1,504,232 1,614,632
Superannuation costs 38,136 38,544
Payroll and other taxes 18,562 16,920
Bonuses paid/payable 602,823 863,016
Employee benefits expense 2,163,753 2,533,112
Bonuses relate to payments paid or accrued to the Chief Executive Officer and Chief Financial Officer. Refer to Remuneration Report for further details.

60 Jupiter Mines Limited
No
tes
to t
he
Co
nso
lidat
ed F
inan
cial
Sta
tem
ents
nOte 18: eQUitYThe share capital of Jupiter Mines consists only of fully paid ordinary shares; the shares do not have a par value. All shares are equally eligible to receive dividends and the repayment of capital and represent one vote at the shareholders’ meeting of Jupiter Mines.
2021 No. Shares
2020 No. Shares
February 2021$
February 2020$
Shares issued and fully paid:
Beginning of the year 1,958,991,033 1,958,991,033 410,435,400 410,435,400
Total contributed equity 1,958,991,033 1,958,991,033 410,435,400 410,435,400
nOte 19: ReSeRveS
Foreign Currency
Translation Reserve $
Equity Instruments at FVOCI Reserve
$Total
$
Balance at 1 March 2019 (41,804) 340,257 298,453
Current year movement, net of tax (18,314) (217,535) (235,849)
Balance as at 29 February 2020 (60,118) 122,722 62,604
Current year movement, net of tax (400,378) (133,061) (533,439)
Balance as at 28 February 2021 (460,496) (10,339) (470,835)
nOte 20: cApitAL And LeASing cOMMitMentSThe Group leases an office under an operating lease. The future minimum lease payments are as follows:
Consolidated Group
February 2021$
February 2020$
Non-cancellable operating leases contracted for but not capitalised in financial statements:
Minimum lease payments
� Not later than 12 months 38,396 38,892
� Between 12 months and 5 years - -
38,396 38,892
This is made up of a non-cancellable lease of 2 years however it can be subleased (with prior consent of Lessor), which expired on 31 May 2020. The lease was subsequently extended to 30 November 2021. Amounts include rent, outgoings and cleaning with 4.5% annual rent review increase. It does not take into account reduced guarantees or returned deposits or incentives. Figures based on 9 months (1 March 2021 to 30 November 2021) which is the end of the lease. The expense recognised for the operating lease was $51,194 (2020: $53,177). The property lease is non-cancellable for six months, with rent payable monthly in advance.
Expenditure CommitmentsIn order to maintain current rights of tenure to mining tenements, the Company and Group are required to perform minimum work to meet the requirements specified by various State governments. These obligations can be reduced by selective relinquishment of exploration tenure or application for expenditure exemptions. Due to the nature of the Company and Group’s operations in exploring and evaluating areas of interest, it is very difficult to forecast the nature and amount of future expenditure. It is anticipated that expenditure commitments for the next twelve months will be tenement rentals of $547,156 (2020: $535,207) and exploration expenditure of $676,100 (2020: $676,100).
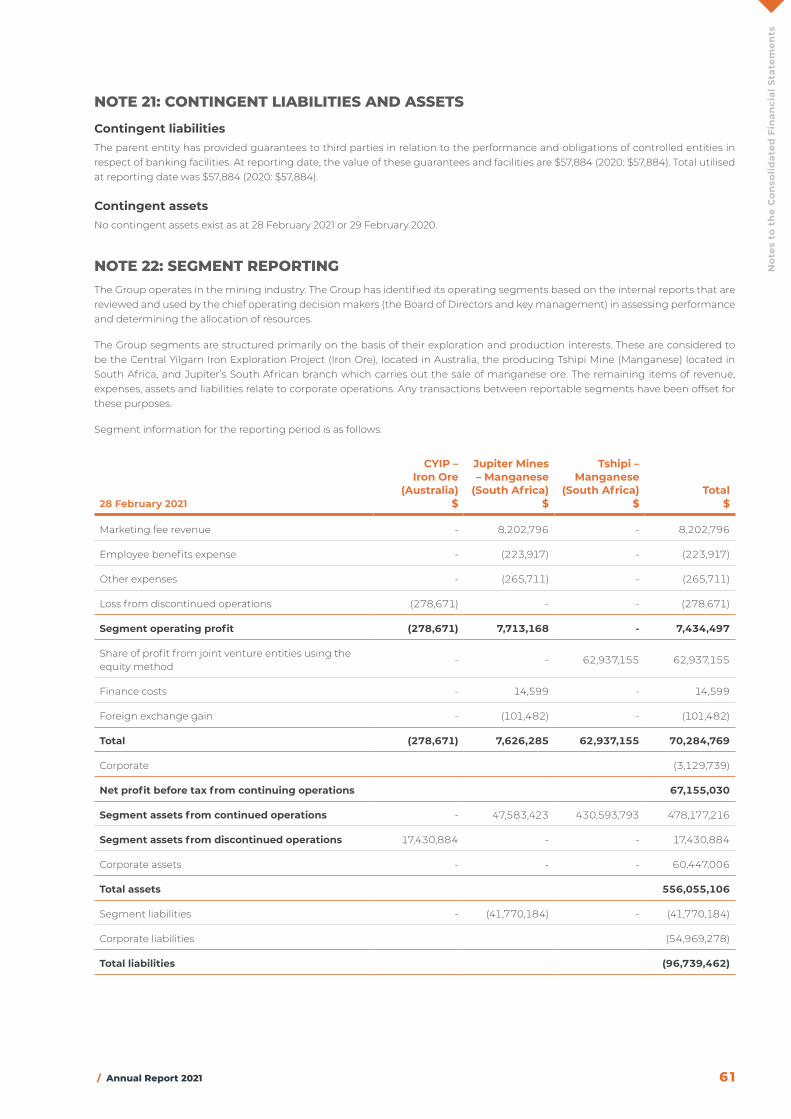
/ Annual Report 2021 61
No
tes
to t
he
Co
nso
lidat
ed F
inan
cial
Sta
tem
ents
nOte 21: cOntingent LiABiLitieS And ASSetS
Contingent liabilitiesThe parent entity has provided guarantees to third parties in relation to the performance and obligations of controlled entities in respect of banking facilities. At reporting date, the value of these guarantees and facilities are $57,884 (2020: $57,884). Total utilised at reporting date was $57,884 (2020: $57,884).
Contingent assetsNo contingent assets exist as at 28 February 2021 or 29 February 2020.
nOte 22: SegMent RepORting The Group operates in the mining industry. The Group has identified its operating segments based on the internal reports that are reviewed and used by the chief operating decision makers (the Board of Directors and key management) in assessing performance and determining the allocation of resources.
The Group segments are structured primarily on the basis of their exploration and production interests. These are considered to be the Central Yilgarn Iron Exploration Project (Iron Ore), located in Australia, the producing Tshipi Mine (Manganese) located in South Africa, and Jupiter’s South African branch which carries out the sale of manganese ore. The remaining items of revenue, expenses, assets and liabilities relate to corporate operations. Any transactions between reportable segments have been offset for these purposes.
Segment information for the reporting period is as follows:
28 February 2021
CYIP – Iron Ore
(Australia)$
Jupiter Mines – Manganese
(South Africa) $
Tshipi – Manganese
(South Africa)$
Total$
Marketing fee revenue - 8,202,796 - 8,202,796
Employee benefits expense - (223,917) - (223,917)
Other expenses - (265,711) - (265,711)
Loss from discontinued operations (278,671) - - (278,671)
Segment operating profit (278,671) 7,713,168 - 7,434,497
Share of profit from joint venture entities using the equity method
- - 62,937,155 62,937,155
Finance costs - 14,599 - 14,599
Foreign exchange gain - (101,482) - (101,482)
Total (278,671) 7,626,285 62,937,155 70,284,769
Corporate (3,129,739)
Net profit before tax from continuing operations 67,155,030
Segment assets from continued operations - 47,583,423 430,593,793 478,177,216
Segment assets from discontinued operations 17,430,884 - - 17,430,884
Corporate assets - - - 60,447,006
Total assets 556,055,106
Segment liabilities - (41,770,184) - (41,770,184)
Corporate liabilities (54,969,278)
Total liabilities (96,739,462)
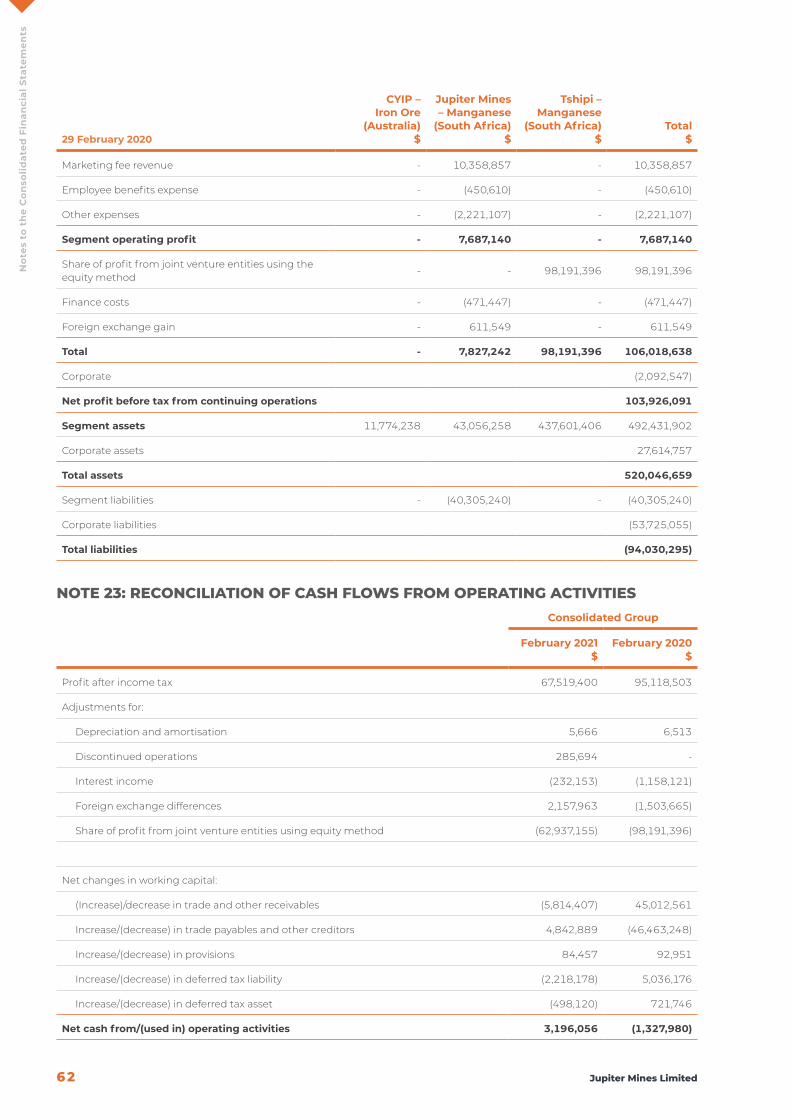
62 Jupiter Mines Limited
No
tes
to t
he
Co
nso
lidat
ed F
inan
cial
Sta
tem
ents
29 February 2020
CYIP – Iron Ore
(Australia)$
Jupiter Mines – Manganese
(South Africa) $
Tshipi – Manganese
(South Africa)$
Total$
Marketing fee revenue - 10,358,857 - 10,358,857
Employee benefits expense - (450,610) - (450,610)
Other expenses - (2,221,107) - (2,221,107)
Segment operating profit - 7,687,140 - 7,687,140
Share of profit from joint venture entities using the equity method
- - 98,191,396 98,191,396
Finance costs - (471,447) - (471,447)
Foreign exchange gain - 611,549 - 611,549
Total - 7,827,242 98,191,396 106,018,638
Corporate (2,092,547)
Net profit before tax from continuing operations 103,926,091
Segment assets 11,774,238 43,056,258 437,601,406 492,431,902
Corporate assets 27,614,757
Total assets 520,046,659
Segment liabilities - (40,305,240) - (40,305,240)
Corporate liabilities (53,725,055)
Total liabilities (94,030,295)
nOte 23: RecOnciLiAtiOn OF cASH FLOwS FROM OpeRAting ActivitieSConsolidated Group
February 2021$
February 2020$
Profit after income tax 67,519,400 95,118,503
Adjustments for:
Depreciation and amortisation 5,666 6,513
Discontinued operations 285,694 -
Interest income (232,153) (1,158,121)
Foreign exchange differences 2,157,963 (1,503,665)
Share of profit from joint venture entities using equity method (62,937,155) (98,191,396)
Net changes in working capital:
(Increase)/decrease in trade and other receivables (5,814,407) 45,012,561
Increase/(decrease) in trade payables and other creditors 4,842,889 (46,463,248)
Increase/(decrease) in provisions 84,457 92,951
Increase/(decrease) in deferred tax liability (2,218,178) 5,036,176
Increase/(decrease) in deferred tax asset (498,120) 721,746
Net cash from/(used in) operating activities 3,196,056 (1,327,980)
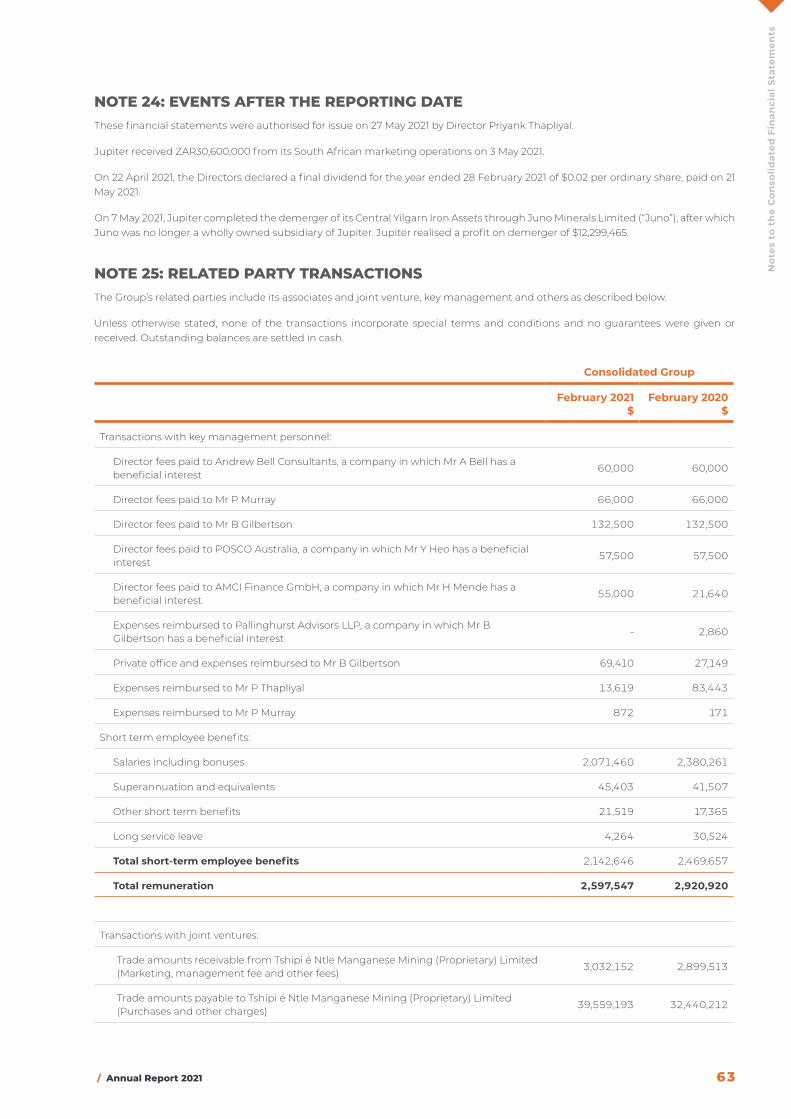
/ Annual Report 2021 63
No
tes
to t
he
Co
nso
lidat
ed F
inan
cial
Sta
tem
ents
nOte 24: eventS AFteR tHe RepORting dAteThese financial statements were authorised for issue on 27 May 2021 by Director Priyank Thapliyal.
Jupiter received ZAR30,600,000 from its South African marketing operations on 3 May 2021.
On 22 April 2021, the Directors declared a final dividend for the year ended 28 February 2021 of $0.02 per ordinary share, paid on 21 May 2021.
On 7 May 2021, Jupiter completed the demerger of its Central Yilgarn Iron Assets through Juno Minerals Limited (“Juno”), after which Juno was no longer a wholly owned subsidiary of Jupiter. Jupiter realised a profit on demerger of $12,299,465.
nOte 25: ReLAted pARtY tRAnSActiOnSThe Group’s related parties include its associates and joint venture, key management and others as described below.
Unless otherwise stated, none of the transactions incorporate special terms and conditions and no guarantees were given or received. Outstanding balances are settled in cash.
Consolidated Group
February 2021$
February 2020$
Transactions with key management personnel:
Director fees paid to Andrew Bell Consultants, a company in which Mr A Bell has a beneficial interest
60,000 60,000
Director fees paid to Mr P Murray 66,000 66,000
Director fees paid to Mr B Gilbertson 132,500 132,500
Director fees paid to POSCO Australia, a company in which Mr Y Heo has a beneficial interest
57,500 57,500
Director fees paid to AMCI Finance GmbH, a company in which Mr H Mende has a beneficial interest
55,000 21,640
Expenses reimbursed to Pallinghurst Advisors LLP, a company in which Mr B Gilbertson has a beneficial interest
- 2,860
Private office and expenses reimbursed to Mr B Gilbertson 69,410 27,149
Expenses reimbursed to Mr P Thapliyal 13,619 83,443
Expenses reimbursed to Mr P Murray 872 171
Short term employee benefits:
Salaries including bonuses 2,071,460 2,380,261
Superannuation and equivalents 45,403 41,507
Other short term benefits 21,519 17,365
Long service leave 4,264 30,524
Total short-term employee benefits 2,142,646 2,469,657
Total remuneration 2,597,547 2,920,920
Transactions with joint ventures:
Trade amounts receivable from Tshipi é Ntle Manganese Mining (Proprietary) Limited (Marketing, management fee and other fees)
3,032,152 2,899,513
Trade amounts payable to Tshipi é Ntle Manganese Mining (Proprietary) Limited (Purchases and other charges)
39,559,193 32,440,212
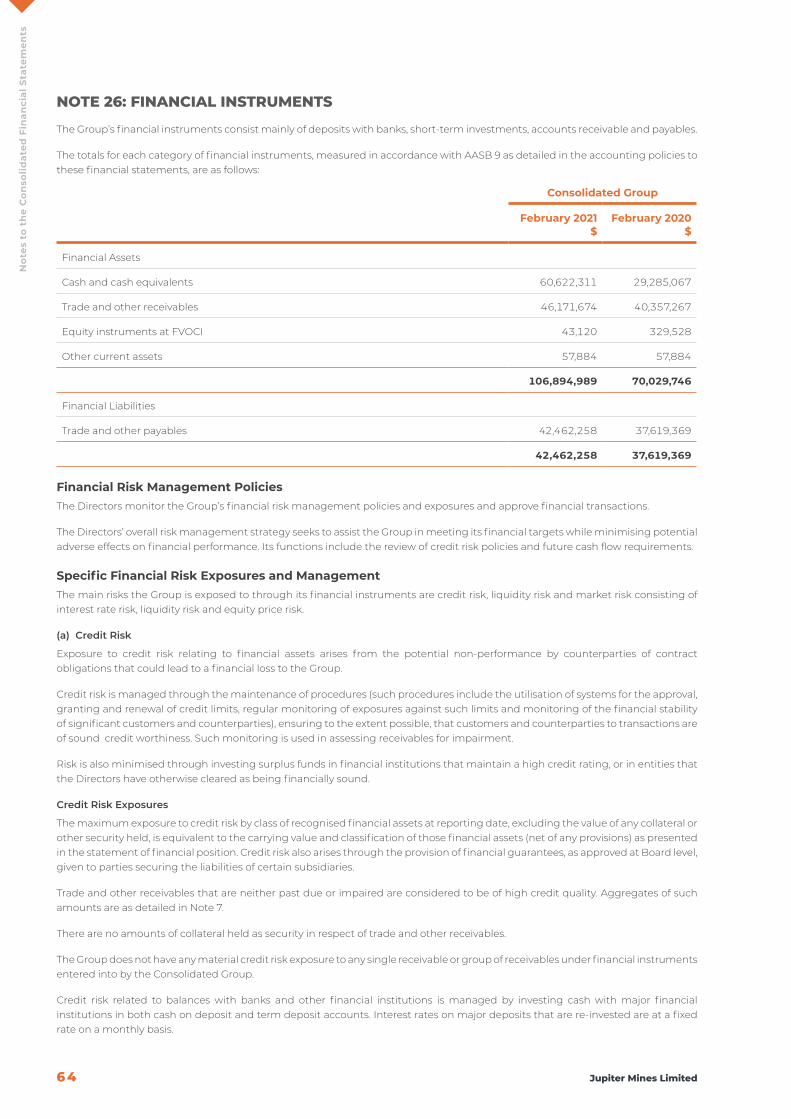
64 Jupiter Mines Limited
No
tes
to t
he
Co
nso
lidat
ed F
inan
cial
Sta
tem
ents
nOte 26: FinAnciAL inStRUMentS
The Group’s financial instruments consist mainly of deposits with banks, short-term investments, accounts receivable and payables.
The totals for each category of financial instruments, measured in accordance with AASB 9 as detailed in the accounting policies to these financial statements, are as follows:
Consolidated Group
February 2021$
February 2020$
Financial Assets
Cash and cash equivalents 60,622,311 29,285,067
Trade and other receivables 46,171,674 40,357,267
Equity instruments at FVOCI 43,120 329,528
Other current assets 57,884 57,884
106,894,989 70,029,746
Financial Liabilities
Trade and other payables 42,462,258 37,619,369
42,462,258 37,619,369
Financial Risk Management PoliciesThe Directors monitor the Group’s financial risk management policies and exposures and approve financial transactions.
The Directors’ overall risk management strategy seeks to assist the Group in meeting its financial targets while minimising potential adverse effects on financial performance. Its functions include the review of credit risk policies and future cash flow requirements.
Specific Financial Risk Exposures and ManagementThe main risks the Group is exposed to through its financial instruments are credit risk, liquidity risk and market risk consisting of interest rate risk, liquidity risk and equity price risk.
(a) Credit Risk
Exposure to credit risk relating to financial assets arises from the potential non-performance by counterparties of contract obligations that could lead to a financial loss to the Group.
Credit risk is managed through the maintenance of procedures (such procedures include the utilisation of systems for the approval, granting and renewal of credit limits, regular monitoring of exposures against such limits and monitoring of the financial stability of significant customers and counterparties), ensuring to the extent possible, that customers and counterparties to transactions are of sound credit worthiness. Such monitoring is used in assessing receivables for impairment.
Risk is also minimised through investing surplus funds in financial institutions that maintain a high credit rating, or in entities that the Directors have otherwise cleared as being financially sound.
Credit Risk Exposures
The maximum exposure to credit risk by class of recognised financial assets at reporting date, excluding the value of any collateral or other security held, is equivalent to the carrying value and classification of those financial assets (net of any provisions) as presented in the statement of financial position. Credit risk also arises through the provision of financial guarantees, as approved at Board level, given to parties securing the liabilities of certain subsidiaries.
Trade and other receivables that are neither past due or impaired are considered to be of high credit quality. Aggregates of such amounts are as detailed in Note 7.
There are no amounts of collateral held as security in respect of trade and other receivables.
The Group does not have any material credit risk exposure to any single receivable or group of receivables under financial instruments entered into by the Consolidated Group.
Credit risk related to balances with banks and other financial institutions is managed by investing cash with major financial institutions in both cash on deposit and term deposit accounts. Interest rates on major deposits that are re-invested are at a fixed rate on a monthly basis.
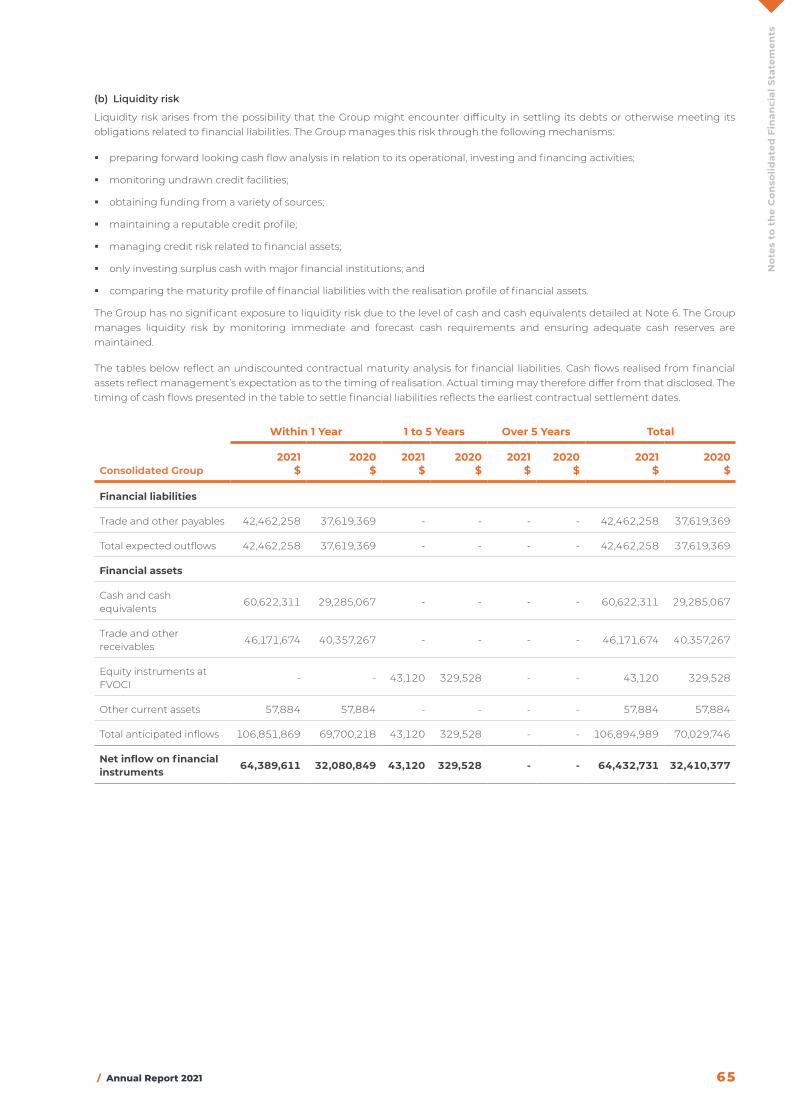
/ Annual Report 2021 65
No
tes
to t
he
Co
nso
lidat
ed F
inan
cial
Sta
tem
ents
(b) Liquidity risk
Liquidity risk arises from the possibility that the Group might encounter difficulty in settling its debts or otherwise meeting its obligations related to financial liabilities. The Group manages this risk through the following mechanisms:
� preparing forward looking cash flow analysis in relation to its operational, investing and financing activities;
� monitoring undrawn credit facilities;
� obtaining funding from a variety of sources;
� maintaining a reputable credit profile;
� managing credit risk related to financial assets;
� only investing surplus cash with major financial institutions; and
� comparing the maturity profile of financial liabilities with the realisation profile of financial assets.
The Group has no significant exposure to liquidity risk due to the level of cash and cash equivalents detailed at Note 6. The Group manages liquidity risk by monitoring immediate and forecast cash requirements and ensuring adequate cash reserves are maintained.
The tables below reflect an undiscounted contractual maturity analysis for financial liabilities. Cash flows realised from financial assets reflect management’s expectation as to the timing of realisation. Actual timing may therefore differ from that disclosed. The timing of cash flows presented in the table to settle financial liabilities reflects the earliest contractual settlement dates.
Within 1 Year 1 to 5 Years Over 5 Years Total
Consolidated Group2021
$2020
$2021
$2020
$2021
$2020
$2021
$2020
$
Financial liabilities
Trade and other payables 42,462,258 37,619,369 - - - - 42,462,258 37,619,369
Total expected outflows 42,462,258 37,619,369 - - - - 42,462,258 37,619,369
Financial assets
Cash and cash equivalents
60,622,311 29,285,067 - - - - 60,622,311 29,285,067
Trade and other receivables
46,171,674 40,357,267 - - - - 46,171,674 40,357,267
Equity instruments at FVOCI
- - 43,120 329,528 - - 43,120 329,528
Other current assets 57,884 57,884 - - - - 57,884 57,884
Total anticipated inflows 106,851,869 69,700,218 43,120 329,528 - - 106,894,989 70,029,746
Net inflow on financial instruments 64,389,611 32,080,849 43,120 329,528 - - 64,432,731 32,410,377
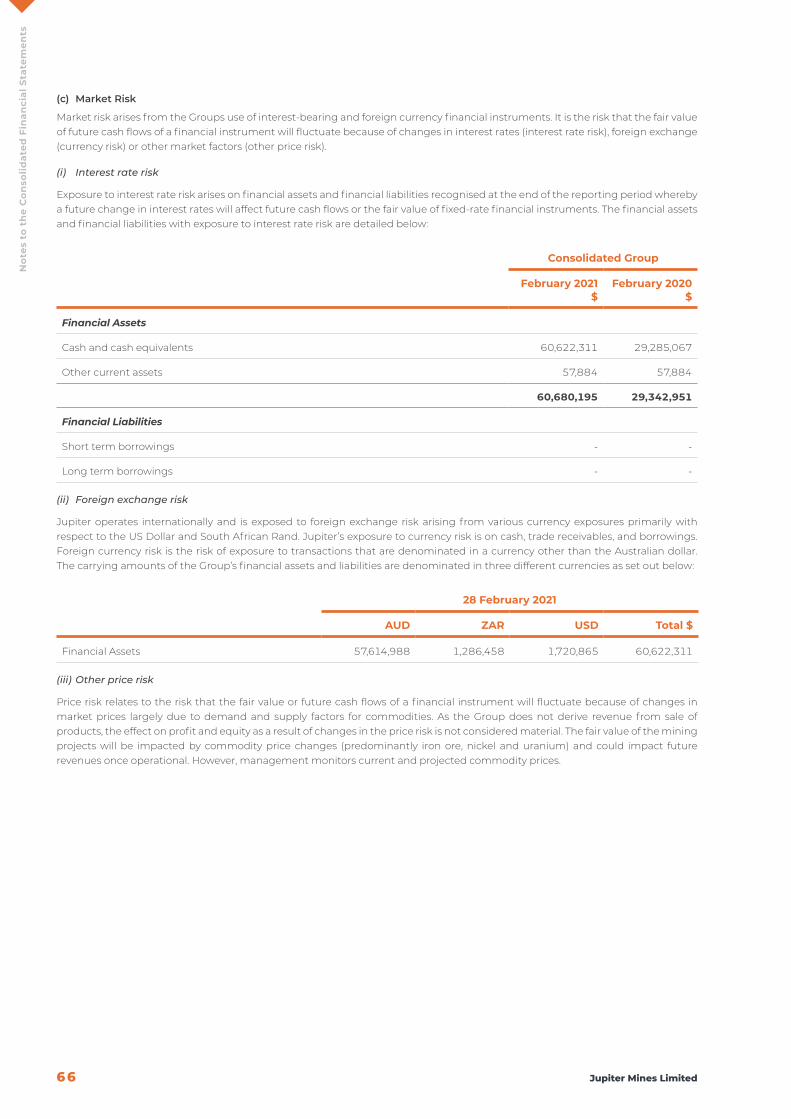
66 Jupiter Mines Limited
No
tes
to t
he
Co
nso
lidat
ed F
inan
cial
Sta
tem
ents
(c) Market Risk
Market risk arises from the Groups use of interest-bearing and foreign currency financial instruments. It is the risk that the fair value of future cash flows of a financial instrument will fluctuate because of changes in interest rates (interest rate risk), foreign exchange (currency risk) or other market factors (other price risk).
(i) Interest rate risk
Exposure to interest rate risk arises on financial assets and financial liabilities recognised at the end of the reporting period whereby a future change in interest rates will affect future cash flows or the fair value of fixed-rate financial instruments. The financial assets and financial liabilities with exposure to interest rate risk are detailed below:
Consolidated Group
February 2021$
February 2020$
Financial Assets
Cash and cash equivalents 60,622,311 29,285,067
Other current assets 57,884 57,884
60,680,195 29,342,951
Financial Liabilities
Short term borrowings - -
Long term borrowings - -
(ii) Foreign exchange risk
Jupiter operates internationally and is exposed to foreign exchange risk arising from various currency exposures primarily with respect to the US Dollar and South African Rand. Jupiter’s exposure to currency risk is on cash, trade receivables, and borrowings. Foreign currency risk is the risk of exposure to transactions that are denominated in a currency other than the Australian dollar. The carrying amounts of the Group’s financial assets and liabilities are denominated in three different currencies as set out below:
28 February 2021
AUD ZAR USD Total $
Financial Assets 57,614,988 1,286,458 1,720,865 60,622,311
(iii) Other price risk
Price risk relates to the risk that the fair value or future cash flows of a financial instrument will fluctuate because of changes in market prices largely due to demand and supply factors for commodities. As the Group does not derive revenue from sale of products, the effect on profit and equity as a result of changes in the price risk is not considered material. The fair value of the mining projects will be impacted by commodity price changes (predominantly iron ore, nickel and uranium) and could impact future revenues once operational. However, management monitors current and projected commodity prices.
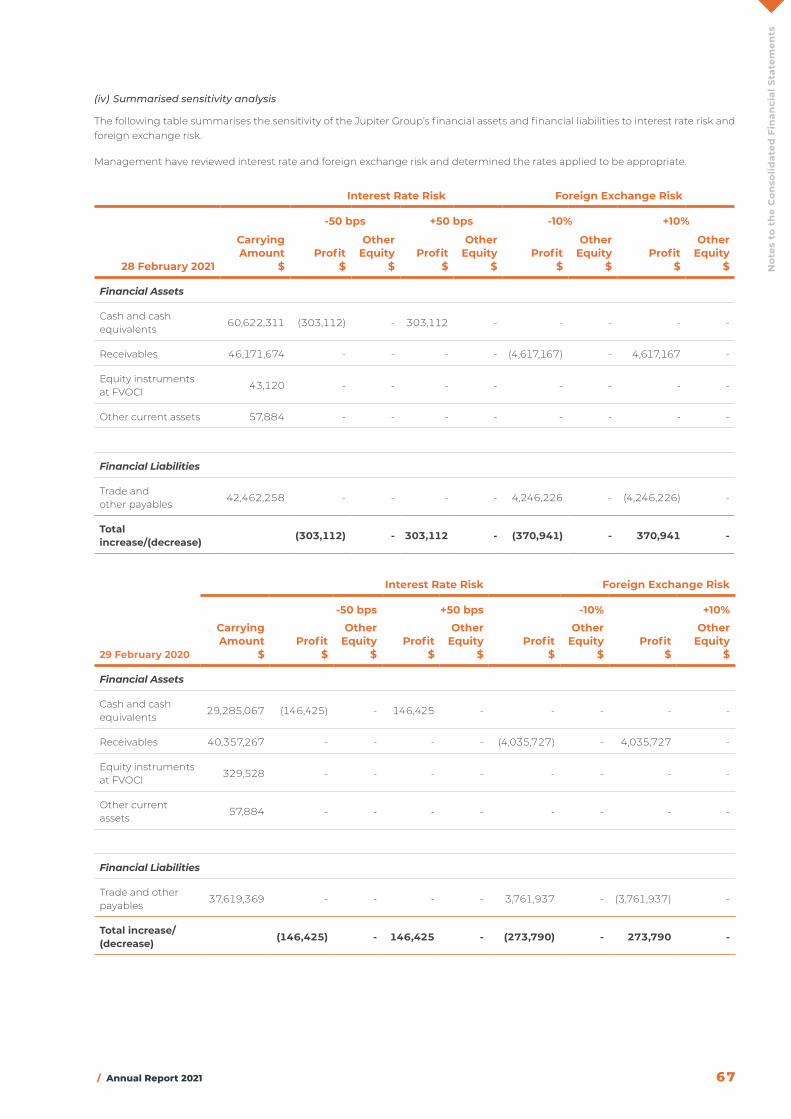
/ Annual Report 2021 67
No
tes
to t
he
Co
nso
lidat
ed F
inan
cial
Sta
tem
ents
(iv) Summarised sensitivity analysis
The following table summarises the sensitivity of the Jupiter Group’s financial assets and financial liabilities to interest rate risk and foreign exchange risk.
Management have reviewed interest rate and foreign exchange risk and determined the rates applied to be appropriate.
Interest Rate Risk Foreign Exchange Risk
-50 bps +50 bps -10% +10%
28 February 2021
Carrying Amount
$Profit
$
Other Equity
$Profit
$
Other Equity
$Profit
$
Other Equity
$Profit
$
Other Equity
$
Financial Assets
Cash and cash equivalents
60,622,311 (303,112) - 303,112 - - - - -
Receivables 46,171,674 - - - - (4,617,167) - 4,617,167 -
Equity instruments at FVOCI
43,120 - - - - - - - -
Other current assets 57,884 - - - - - - - -
Financial Liabilities
Trade and other payables
42,462,258 - - - - 4,246,226 - (4,246,226) -
Total increase/(decrease) (303,112) - 303,112 - (370,941) - 370,941 -
Interest Rate Risk Foreign Exchange Risk
-50 bps +50 bps -10% +10%
29 February 2020
Carrying Amount
$Profit
$
Other Equity
$Profit
$
Other Equity
$Profit
$
Other Equity
$Profit
$
Other Equity
$
Financial Assets
Cash and cash equivalents
29,285,067 (146,425) - 146,425 - - - - -
Receivables 40,357,267 - - - - (4,035,727) - 4,035,727 -
Equity instruments at FVOCI
329,528 - - - - - - - -
Other current assets
57,884 - - - - - - - -
Financial Liabilities
Trade and other payables
37,619,369 - - - - 3,761,937 - (3,761,937) -
Total increase/(decrease) (146,425) - 146,425 - (273,790) - 273,790 -
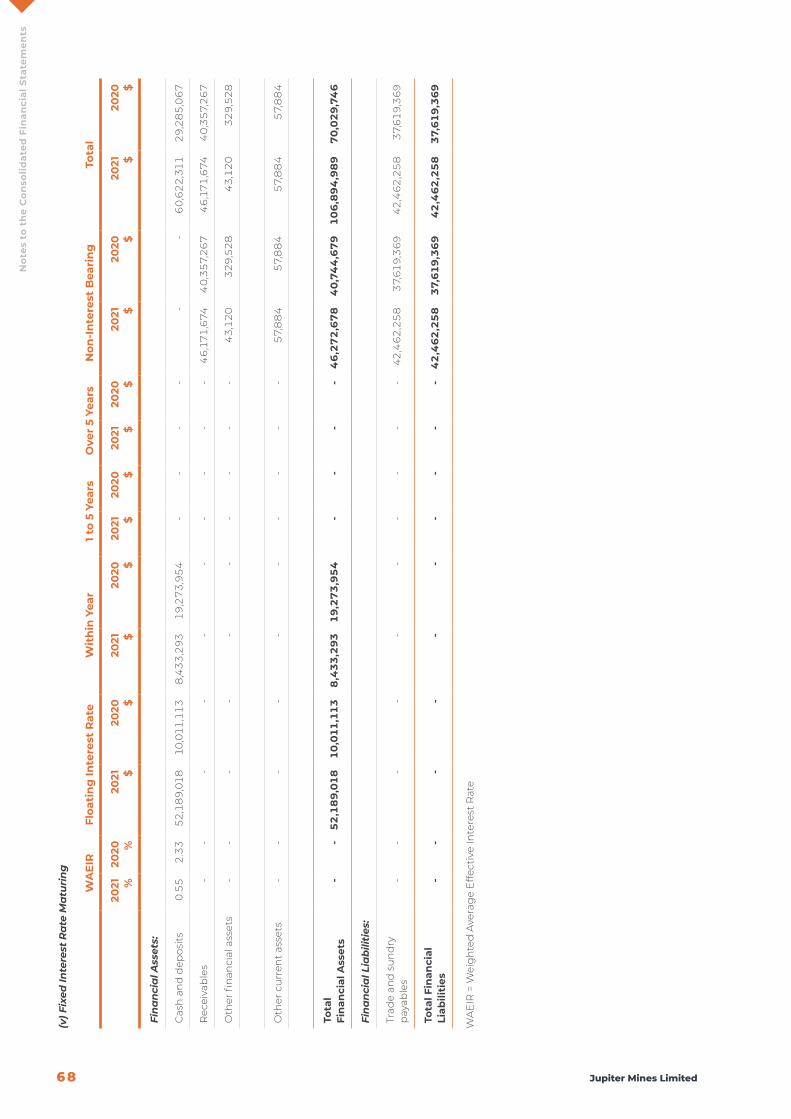
68 Jupiter Mines Limited
No
tes
to t
he
Co
nso
lidat
ed F
inan
cial
Sta
tem
ents
(v) F
ixed
Inte
rest
Ra
te M
atu
rin
g
WA
EIR
Floa
tin
g In
tere
st R
ate
Wit
hin
Yea
r1
to 5
Yea
rsO
ver
5 Ye
ars
Non
-In
tere
st B
eari
ng
Tota
l
2021 %
2020 %
2021
$20
20 $
2021
$20
20 $
2021
$20
20 $
2021
$20
20 $
2021
$20
20 $
2021
$20
20 $
Fin
an
cia
l Ass
ets:
Cas
h a
nd
dep
osit
s0
.55
2.3
35
2,1
89
,01
810
,011
,11
38
,43
3,2
93
19
,27
3,9
54
--
--
--
60
,62
2,3
112
9,2
85
,06
7
Rec
eiva
ble
s-
--
--
--
--
-4
6,1
71
,674
40
,35
7,2
67
46
,17
1,6
744
0,3
57,
26
7
Oth
er fi
nan
cial
ass
ets
--
--
--
--
--
43
,12
03
29
,52
84
3,1
20
32
9,5
28
Oth
er c
urr
ent
asse
ts-
--
--
--
--
-5
7,8
84
57,
88
45
7,8
84
57,
88
4
Tota
l Fi
nan
cial
Ass
ets
--
52
,18
9,0
18
10,0
11,1
13
8,4
33
,29
31
9,2
73
,95
4-
--
-4
6,2
72
,67
84
0,7
44
,67
910
6,8
94
,98
97
0,0
29
,74
6
Fin
an
cia
l Lia
bili
ties
:
Trad
e an
d s
un
dry
p
ayab
les
--
--
--
--
--
42,4
62
,25
83
7,61
9,3
69
42,4
62
,25
83
7,61
9,3
69
Tota
l Fin
anci
al
Liab
iliti
es-
--
--
--
--
-4
2,4
62
,25
83
7,61
9,3
69
42
,46
2,2
58
37,
619
,36
9
WA
EIR
= W
eig
hte
d A
vera
ge
Effe
ctiv
e In
tere
st R
ate
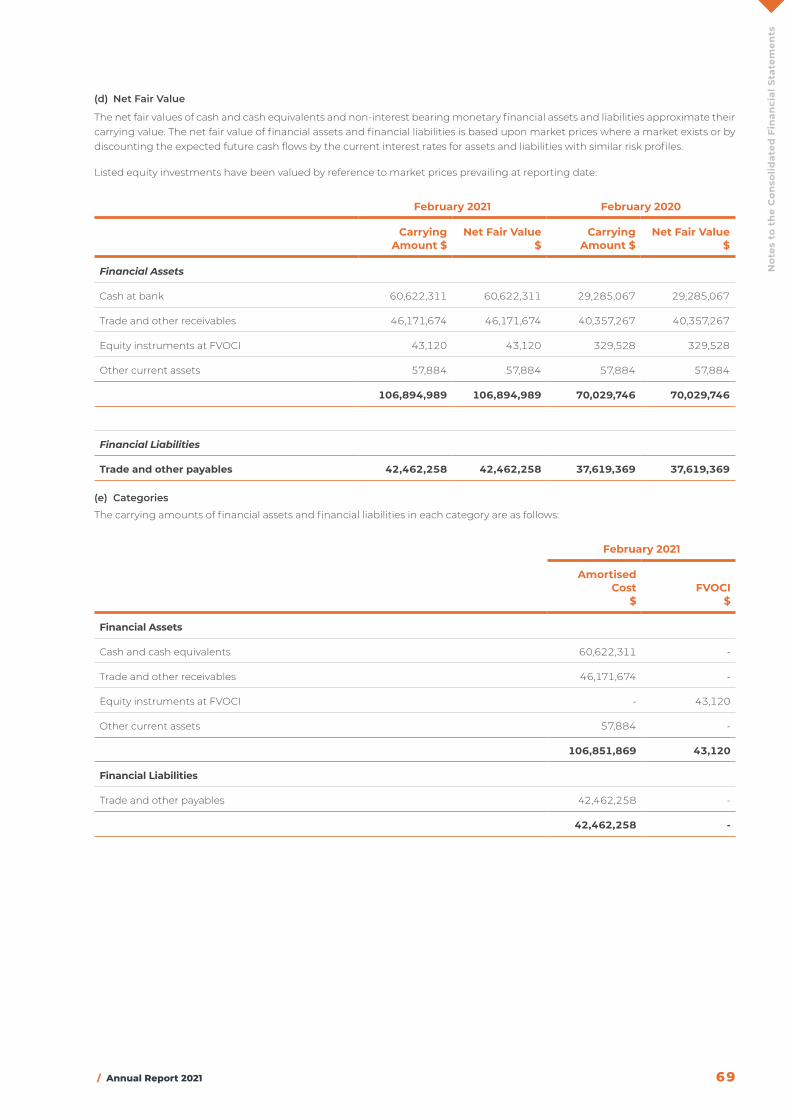
/ Annual Report 2021 69
No
tes
to t
he
Co
nso
lidat
ed F
inan
cial
Sta
tem
ents
(d) Net Fair Value
The net fair values of cash and cash equivalents and non-interest bearing monetary financial assets and liabilities approximate their carrying value. The net fair value of financial assets and financial liabilities is based upon market prices where a market exists or by discounting the expected future cash flows by the current interest rates for assets and liabilities with similar risk profiles.
Listed equity investments have been valued by reference to market prices prevailing at reporting date.
February 2021 February 2020
CarryingAmount $
Net Fair Value $
CarryingAmount $
Net Fair Value $
Financial Assets
Cash at bank 60,622,311 60,622,311 29,285,067 29,285,067
Trade and other receivables 46,171,674 46,171,674 40,357,267 40,357,267
Equity instruments at FVOCI 43,120 43,120 329,528 329,528
Other current assets 57,884 57,884 57,884 57,884
106,894,989 106,894,989 70,029,746 70,029,746
Financial Liabilities
Trade and other payables 42,462,258 42,462,258 37,619,369 37,619,369
(e) Categories
The carrying amounts of financial assets and financial liabilities in each category are as follows:
February 2021
Amortised Cost
$FVOCI
$
Financial Assets
Cash and cash equivalents 60,622,311 -
Trade and other receivables 46,171,674 -
Equity instruments at FVOCI - 43,120
Other current assets 57,884 -
106,851,869 43,120
Financial Liabilities
Trade and other payables 42,462,258 -
42,462,258 -
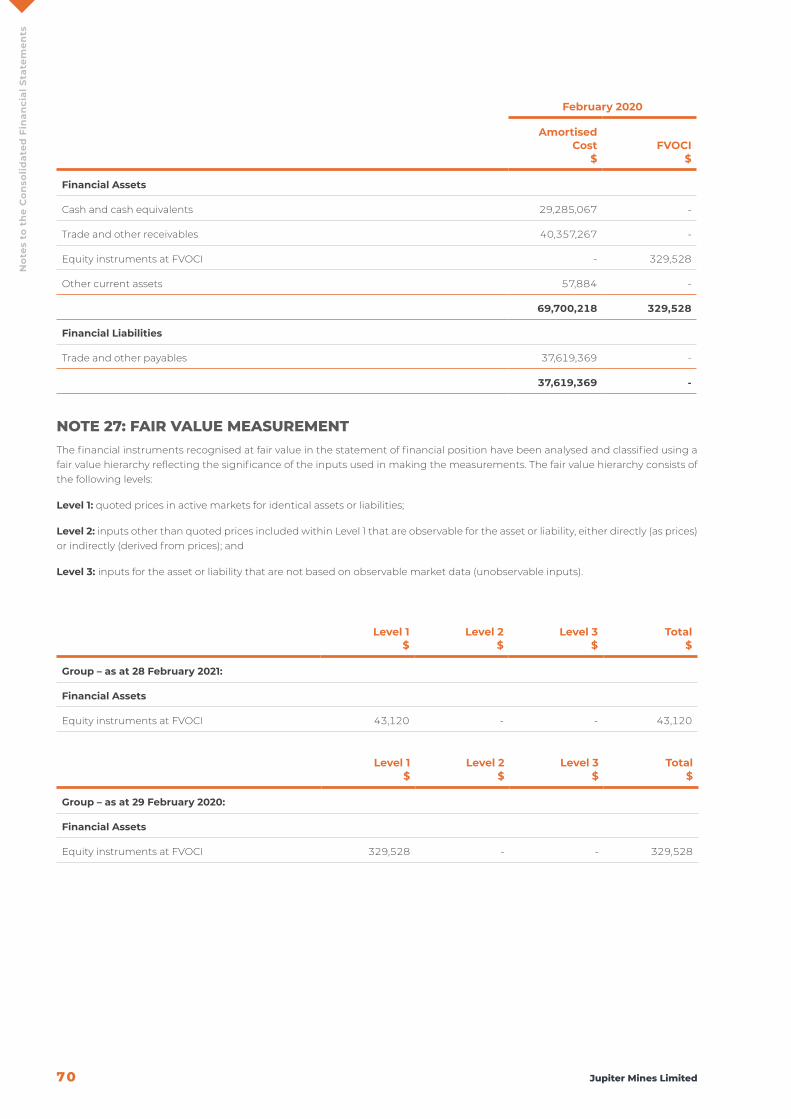
70 Jupiter Mines Limited
No
tes
to t
he
Co
nso
lidat
ed F
inan
cial
Sta
tem
ents
February 2020
Amortised Cost
$FVOCI
$
Financial Assets
Cash and cash equivalents 29,285,067 -
Trade and other receivables 40,357,267 -
Equity instruments at FVOCI - 329,528
Other current assets 57,884 -
69,700,218 329,528
Financial Liabilities
Trade and other payables 37,619,369 -
37,619,369 -
nOte 27: FAiR vALUe MeASUReMentThe financial instruments recognised at fair value in the statement of financial position have been analysed and classified using a fair value hierarchy reflecting the significance of the inputs used in making the measurements. The fair value hierarchy consists of the following levels:
Level 1: quoted prices in active markets for identical assets or liabilities;
Level 2: inputs other than quoted prices included within Level 1 that are observable for the asset or liability, either directly (as prices) or indirectly (derived from prices); and
Level 3: inputs for the asset or liability that are not based on observable market data (unobservable inputs).
Level 1 $
Level 2 $
Level 3$
Total$
Group – as at 28 February 2021:
Financial Assets
Equity instruments at FVOCI 43,120 - - 43,120
Level 1 $
Level 2 $
Level 3 $
Total$
Group – as at 29 February 2020:
Financial Assets
Equity instruments at FVOCI 329,528 - - 329,528
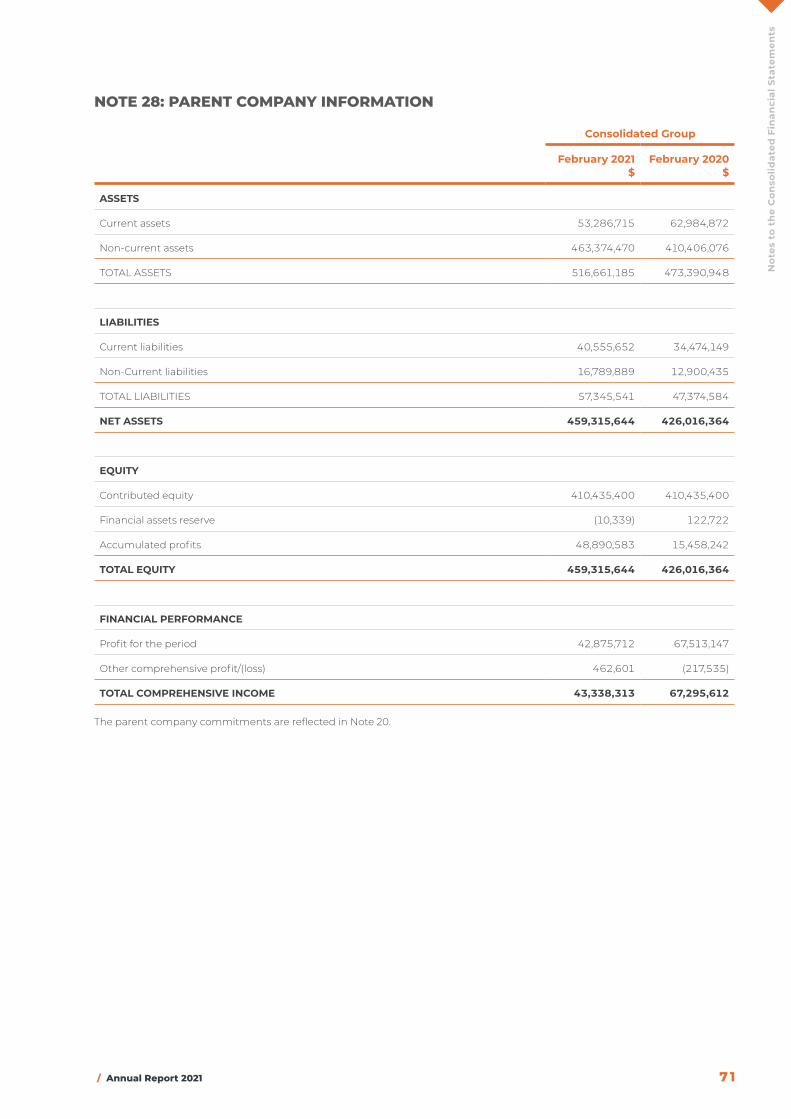
/ Annual Report 2021 7 1
No
tes
to t
he
Co
nso
lidat
ed F
inan
cial
Sta
tem
ents
nOte 28: pARent cOMpAnY inFORMAtiOn
Consolidated Group
February 2021$
February 2020$
ASSETS
Current assets 53,286,715 62,984,872
Non-current assets 463,374,470 410,406,076
TOTAL ASSETS 516,661,185 473,390,948
LIABILITIES
Current liabilities 40,555,652 34,474,149
Non-Current liabilities 16,789,889 12,900,435
TOTAL LIABILITIES 57,345,541 47,374,584
NET ASSETS 459,315,644 426,016,364
EQUITY
Contributed equity 410,435,400 410,435,400
Financial assets reserve (10,339) 122,722
Accumulated profits 48,890,583 15,458,242
TOTAL EQUITY 459,315,644 426,016,364
FINANCIAL PERFORMANCE
Profit for the period 42,875,712 67,513,147
Other comprehensive profit/(loss) 462,601 (217,535)
TOTAL COMPREHENSIVE INCOME 43,338,313 67,295,612
The parent company commitments are reflected in Note 20.
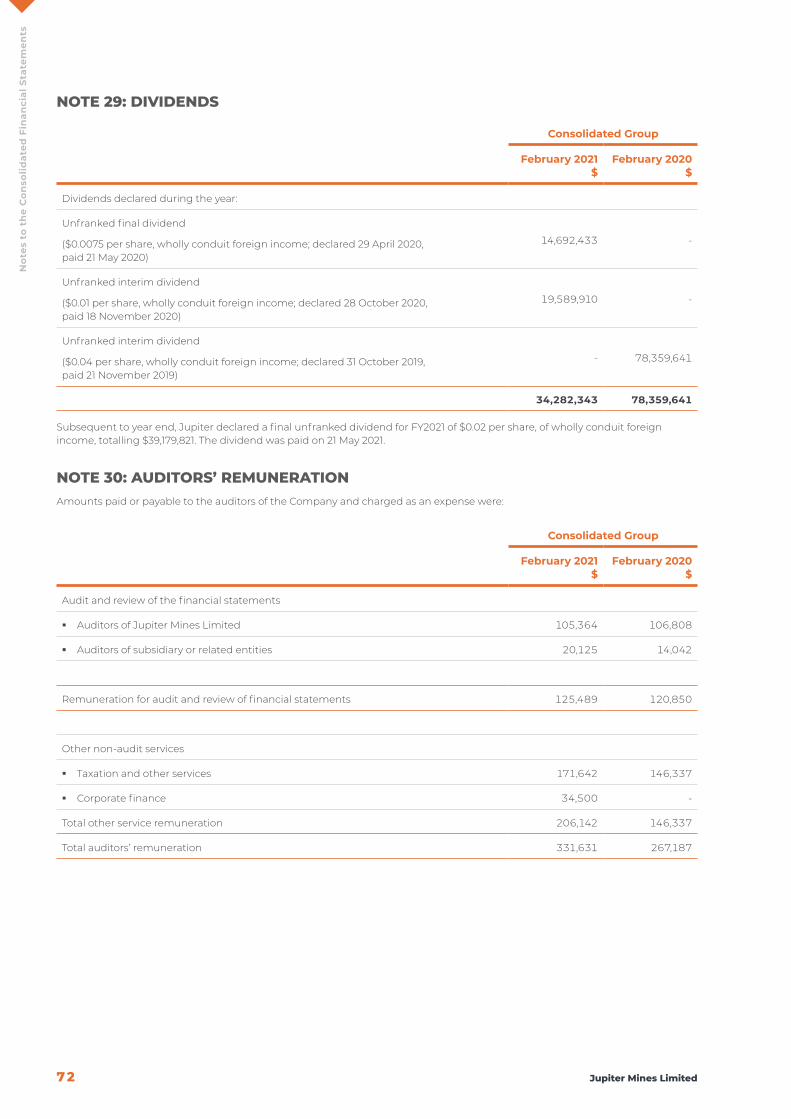
72 Jupiter Mines Limited
No
tes
to t
he
Co
nso
lidat
ed F
inan
cial
Sta
tem
ents
nOte 29: dividendS
Consolidated Group
February 2021$
February 2020$
Dividends declared during the year:
Unfranked final dividend
($0.0075 per share, wholly conduit foreign income; declared 29 April 2020, paid 21 May 2020)
14,692,433 -
Unfranked interim dividend
($0.01 per share, wholly conduit foreign income; declared 28 October 2020, paid 18 November 2020)
19,589,910 -
Unfranked interim dividend
($0.04 per share, wholly conduit foreign income; declared 31 October 2019, paid 21 November 2019)
- 78,359,641
34,282,343 78,359,641
Subsequent to year end, Jupiter declared a final unfranked dividend for FY2021 of $0.02 per share, of wholly conduit foreign income, totalling $39,179,821. The dividend was paid on 21 May 2021.
nOte 30: AUditORS’ ReMUneRAtiOnAmounts paid or payable to the auditors of the Company and charged as an expense were:
Consolidated Group
February 2021$
February 2020$
Audit and review of the financial statements
� Auditors of Jupiter Mines Limited 105,364 106,808
� Auditors of subsidiary or related entities 20,125 14,042
Remuneration for audit and review of financial statements 125,489 120,850
Other non-audit services
� Taxation and other services 171,642 146,337
� Corporate finance 34,500 -
Total other service remuneration 206,142 146,337
Total auditors’ remuneration 331,631 267,187
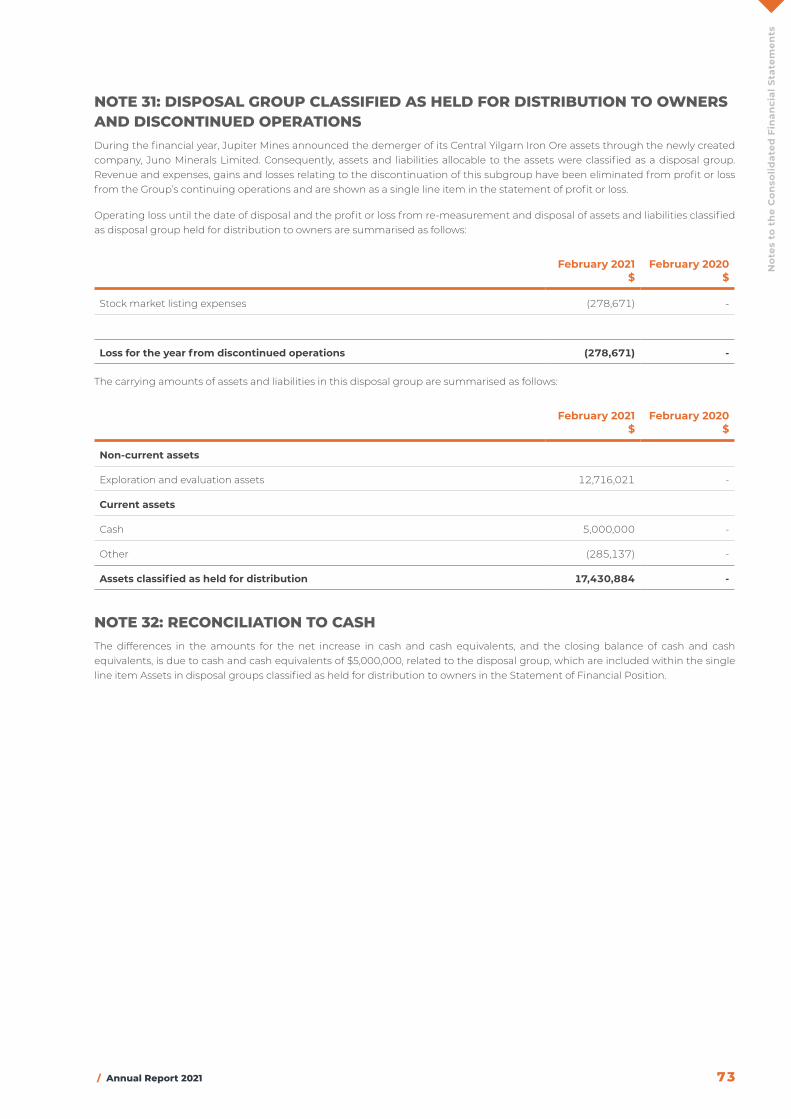
/ Annual Report 2021 73
No
tes
to t
he
Co
nso
lidat
ed F
inan
cial
Sta
tem
ents
nOte 31: diSpOSAL gROUp cLASSiFied AS HeLd FOR diStRiBUtiOn tO OwneRS And diScOntinUed OpeRAtiOnSDuring the financial year, Jupiter Mines announced the demerger of its Central Yilgarn Iron Ore assets through the newly created company, Juno Minerals Limited. Consequently, assets and liabilities allocable to the assets were classified as a disposal group. Revenue and expenses, gains and losses relating to the discontinuation of this subgroup have been eliminated from profit or loss from the Group’s continuing operations and are shown as a single line item in the statement of profit or loss.
Operating loss until the date of disposal and the profit or loss from re-measurement and disposal of assets and liabilities classified as disposal group held for distribution to owners are summarised as follows:
February 2021 $
February 2020 $
Stock market listing expenses (278,671) -
Loss for the year from discontinued operations (278,671) -
The carrying amounts of assets and liabilities in this disposal group are summarised as follows:
February 2021 $
February 2020 $
Non-current assets
Exploration and evaluation assets 12,716,021 -
Current assets
Cash 5,000,000 -
Other (285,137) -
Assets classified as held for distribution 17,430,884 -
nOte 32: RecOnciLiAtiOn tO cASHThe differences in the amounts for the net increase in cash and cash equivalents, and the closing balance of cash and cash equivalents, is due to cash and cash equivalents of $5,000,000, related to the disposal group, which are included within the single line item Assets in disposal groups classified as held for distribution to owners in the Statement of Financial Position.

74 Jupiter Mines Limited
Dir
ecto
rs’ D
ecla
rati
on
Directors’ DeclarationThe Directors of Jupiter Mines Limited declare that:
1. the financial statements, notes and the additional disclosures included in the Directors Report designated as audited, of the consolidated entity are in accordance with the Corporations Act 2001 including:
(a) complying with Accounting Standards (including the Australian Accounting Interpretations) and the Corporations Regulations 2001; and
(b) give a true and fair view of the financial position as at 28 February 2021 and of the performance for the year ended on that date of the company and consolidated entity.
2. The financial statements and notes also comply with International Financial Reporting Standards as disclosed in Note 1.
3. There are reasonable grounds to believe that Jupiter Mines Limited will be able to pay its debts as and when they become due and payable.
4. This declaration has been made after receiving the declarations required to be made to the Directors in accordance with section 295A of the Corporations Act 2001 for the financial year ended 28 February 2021.
Signed on behalf of the Board of Directors
Priyank ThapliyalGuernsey27 May 2021

/ Annual Report 2021 75
Au
dit
or’
s In
dep
end
ence
Dec
lara
tio
n
Auditor’s Independence Declaration
Grant Thornton Audit Pty Ltd ACN 130 913 594 a subsidiary or related entity of Grant Thornton Australia Ltd ABN 41 127 556 389 ‘Grant Thornton’ refers to the brand under which the Grant Thornton member firms provide assurance, tax and advisory services to their clients and/or refers to one or more member firms, as the context requires. Grant Thornton Australia Ltd is a member firm of Grant Thornton International Ltd (GTIL). GTIL and the member firms are not a worldwide partnership. GTIL and each member firm is a separate legal entity. Services are delivered by the member firms. GTIL does not provide services to clients. GTIL and its member firms are not agents of, and do not obligate one another and are not liable for one another’s acts or omissions. In the Australian context only, the use of the term ‘Grant Thornton’ may refer to Grant Thornton Australia Limited ABN 41 127 556 389 and its Australian subsidiaries and related entities. GTIL is not an Australian related entity to Grant Thornton Australia Limited. Liability limited by a scheme approved under Professional Standards Legislation.
www.grantthornton.com.au
Central Park, Level 43 152-158 St Georges Terrace Perth WA 6000 Correspondence to: PO Box 7757 Cloisters Square Perth WA 6000 T +61 8 9480 2000 F +61 8 9480 2050 E [email protected] W www.grantthornton.com.au
Auditor’s Independence Declaration To the Directors of Jupiter Mines Limited
In accordance with the requirements of section 307C of the Corporations Act 2001, as lead auditor for the audit of Jupiter Mines Limited for the year ended 28 February 2021, I declare that, to the best of my knowledge and belief, there have been:
a no contraventions of the auditor independence requirements of the Corporations Act 2001 in relation to the audit; and
b no contraventions of any applicable code of professional conduct in relation to the audit.
GRANT THORNTON AUDIT PTY LTD Chartered Accountants
B S Steedman Partner – Audit & Assurance Perth, 27 May 2021
76 Jupiter Mines Limited
Ind
epen
den
t A
ud
ito
r’s
Rep
ort
Independent Auditor’s Report
Grant Thornton Audit Pty Ltd ACN 130 913 594 a subsidiary or related entity of Grant Thornton Australia Ltd ABN 41 127 556 389 ‘Grant Thornton’ refers to the brand under which the Grant Thornton member firms provide assurance, tax and advisory services to their clients and/or refers to one or more member firms, as the context requires. Grant Thornton Australia Ltd is a member firm of Grant Thornton International Ltd (GTIL). GTIL and the member firms are not a worldwide partnership. GTIL and each member firm is a separate legal entity. Services are delivered by the member firms. GTIL does not provide services to clients. GTIL and its member firms are not agents of, and do not obligate one another and are not liable for one another’s acts or omissions. In the Australian context only, the use of the term ‘Grant Thornton’ may refer to Grant Thornton Australia Limited ABN 41 127 556 389 and its Australian subsidiaries and related entities. GTIL is not an Australian related entity to Grant Thornton Australia Limited. Liability limited by a scheme approved under Professional Standards Legislation.
www.grantthornton.com.au
Central Park, Level 43 152-158 St Georges Terrace Perth WA 6000 Correspondence to: PO Box 7757 Cloisters Square Perth WA 6000 T +61 8 9480 2000 F +61 8 9480 2050 E [email protected] W www.grantthornton.com.au
Independent Auditor’s Report To the Members of Jupiter Mines Limited Report on the audit of the financial report
Opinion We have audited the financial report of Jupiter Mines Limited (the Company) and its subsidiaries (the Group), which comprises the consolidated statement of financial position as at 28 February 2021, the consolidated statement of profit or loss and other comprehensive income, consolidated statement of changes in equity and consolidated statement of cash flows for the year then ended, and notes to the consolidated financial statements, including a summary of significant accounting policies, and the Directors’ declaration. In our opinion, the accompanying financial report of the Group is in accordance with the Corporations Act 2001, including: a giving a true and fair view of the Group’s financial position as at 28 February 2021 and of its performance for the year
ended on that date; and b complying with Australian Accounting Standards and the Corporations Regulations 2001.
Basis for opinion We conducted our audit in accordance with Australian Auditing Standards. Our responsibilities under those standards are further described in the Auditor’s Responsibilities for the Audit of the Financial Report section of our report. We are independent of the Group in accordance with the auditor independence requirements of the Corporations Act 2001 and the ethical requirements of the Accounting Professional and Ethical Standards Board’s APES 110 Code of Ethics for Professional Accountants (including Independence Standards) (the Code) that are relevant to our audit of the financial report in Australia. We have also fulfilled our other ethical responsibilities in accordance with the Code. We believe that the audit evidence we have obtained is sufficient and appropriate to provide a basis for our opinion.
Key audit matters Key audit matters are those matters that, in our professional judgement, were of most significance in our audit of the financial report of the current period. These matters were addressed in the context of our audit of the financial report as a whole, and in forming our opinion thereon, and we do not provide a separate opinion on these matters.
/ Annual Report 2021 77
Ind
epen
den
t A
ud
ito
r’s
Rep
ort
Independent Auditor’s Report
Key audit matter How our audit addressed the key audit matter Impairment on Investments accounted for using the equity method Note 1(b) and Note 14
The Group recorded an investment accounted for under the equity method totalling $430,593,793 (2020: $437,601,406) at 28 February 2021 in relation to its 49.9% ownership in Tshipi é Ntle Manganese Mining Proprietary Limited. The Group recognises this investment as a joint venture using the equity method in accordance with AASB 128 Investment in Associates and Joint Ventures, and is considered for impairment in the event of significant or prolong decline in value. Management assesses impairment indicators on an annual basis in accordance with AASB 136 Impairment of Assets. This area is a key audit matter due to the significant balance carried by the Group that management have assessed using estimates and judgements that required specific valuation expertise and analysis.
Our procedures included, amongst others: Evaluating the appropriateness of managements use of the
equity method to account for the investment in Tshipi é Ntle Manganese Mining Proprietary Limited in accordance with AASB 128;
Evaluating management’s assessment of internal and external impairment indicators detailed in AASB 136 “Impairment of Assets”; and
Assessing the adequacy of related disclosures in Note 1(b) and Note 14.
Valuation and disclosure of disposal group held for distribution - Note 1(r) & Note 31
In October 2020, the Group announced that the Director’s unanimously approved a demerger of its Central Yilgarn Iron Ore assets (“CYIP”) and subsequent initial public offering (“IPO”), subject to all statutory approvals. The demerger will create an ASX listed company, Juno Minerals Ltd. The associated assets and liabilities have been classified as a disposal group and recorded at the lower of its carrying value and estimated fair value less costs to distribute. Included within the disposal group’s carrying value is exploration and evaluation assets at 28 February 2021 of $12,716,021. This area is a key audit matter due to the significant balance carried by the Group that management have assessed using estimates and judgements to determine the fair value less costs to distribute.
Our procedures included, amongst others: Considering the appropriateness of the method applied by
the Group to determine fair value less costs to distribute in accordance with the requirements of the accounting standards;
Procedures included obtaining the key valuation inputs, including the manganese price, ore reserves and critically assessing the inputs and assumptions;
Obtaining the management reconciliation of capitalised exploration and evaluation expenditure and agreeing to the general ledger;
Testing projects to statutory registers, exploration licenses and third party confirmations to determine whether a right of tenure existed; and
Assessing the adequacy of related disclosures in Note 1(r) and Note 31.
Information other than the financial report and auditor’s report thereon The Directors are responsible for the other information. The other information comprises the information included in the Group’s annual report for the year ended 28 February 2021, but does not include the financial report and our auditor’s report thereon. Our opinion on the financial report does not cover the other information and we do not express any form of assurance conclusion thereon. In connection with our audit of the financial report, our responsibility is to read the other information and, in doing so, consider whether the other information is materially inconsistent with the financial report or our knowledge obtained in the audit or otherwise appears to be materially misstated.
78 Jupiter Mines Limited
Ind
epen
den
t A
ud
ito
r’s
Rep
ort
Independent Auditor’s Report
If, based on the work we have performed, we conclude that there is a material misstatement of this other information, we are required to report that fact. We have nothing to report in this regard. Responsibilities of the Directors for the financial report The Directors of the Company are responsible for the preparation of the financial report that gives a true and fair view in accordance with Australian Accounting Standards and the Corporations Act 2001 and for such internal control as the Directors determine is necessary to enable the preparation of the financial report that gives a true and fair view and is free from material misstatement, whether due to fraud or error. In preparing the financial report, the Directors are responsible for assessing the Group’s ability to continue as a going concern, disclosing, as applicable, matters related to going concern and using the going concern basis of accounting unless the Directors either intend to liquidate the Group or to cease operations, or have no realistic alternative but to do so. Auditor’s responsibilities for the audit of the financial report Our objectives are to obtain reasonable assurance about whether the financial report as a whole is free from material misstatement, whether due to fraud or error, and to issue an auditor’s report that includes our opinion. Reasonable assurance is a high level of assurance, but is not a guarantee that an audit conducted in accordance with the Australian Auditing Standards will always detect a material misstatement when it exists. Misstatements can arise from fraud or error and are considered material if, individually or in the aggregate, they could reasonably be expected to influence the economic decisions of users taken on the basis of this financial report. A further description of our responsibilities for the audit of the financial report is located at the Auditing and Assurance Standards Board website at: https://www.auasb.gov.au/auditors_responsibilites/ar1_2020.pdf. This description forms part of our auditor’s report. Report on the remuneration report
Opinion on the remuneration report We have audited the Remuneration Report included in pages 24 to 28 of the Directors’ report for the year ended 28 February 2021. In our opinion, the Remuneration Report of Jupiter Mines Limited, for the year ended 28 February 2021 complies with section 300A of the Corporations Act 2001.
Responsibilities The Directors of the Company are responsible for the preparation and presentation of the Remuneration Report in accordance with section 300A of the Corporations Act 2001. Our responsibility is to express an opinion on the Remuneration Report, based on our audit conducted in accordance with Australian Auditing Standards. GRANT THORNTON AUDIT PTY LTD Chartered Accountants B P Steedman Partner – Audit & Assurance Perth, 27 May 2021
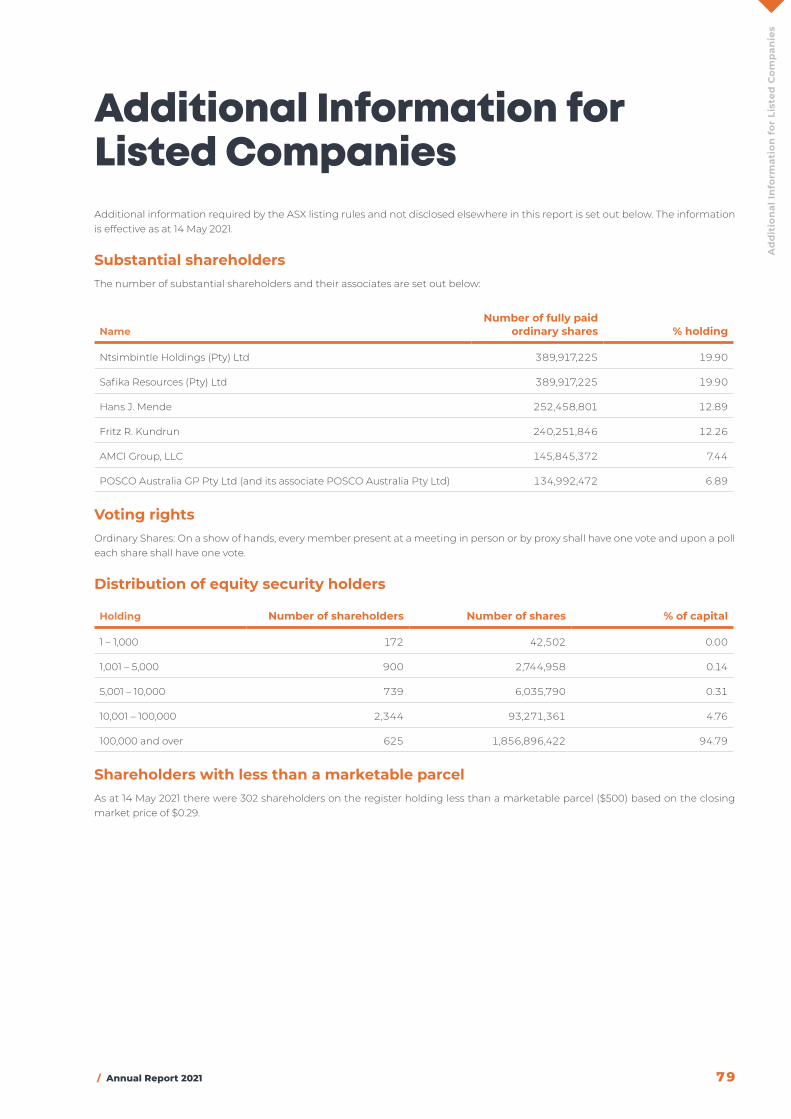
/ Annual Report 2021 79
Ad
dit
ion
al In
form
atio
n f
or
List
ed C
om
pan
ies
Additional Information for Listed CompaniesAdditional information required by the ASX listing rules and not disclosed elsewhere in this report is set out below. The information is effective as at 14 May 2021.
Substantial shareholdersThe number of substantial shareholders and their associates are set out below:
NameNumber of fully paid
ordinary shares % holding
Ntsimbintle Holdings (Pty) Ltd 389,917,225 19.90
Safika Resources (Pty) Ltd 389,917,225 19.90
Hans J. Mende 252,458,801 12.89
Fritz R. Kundrun 240,251,846 12.26
AMCI Group, LLC 145,845,372 7.44
POSCO Australia GP Pty Ltd (and its associate POSCO Australia Pty Ltd) 134,992,472 6.89
Voting rightsOrdinary Shares: On a show of hands, every member present at a meeting in person or by proxy shall have one vote and upon a poll each share shall have one vote.
Distribution of equity security holders
Holding Number of shareholders Number of shares % of capital
1 – 1,000 172 42,502 0.00
1,001 – 5,000 900 2,744,958 0.14
5,001 – 10,000 739 6,035,790 0.31
10,001 – 100,000 2,344 93,271,361 4.76
100,000 and over 625 1,856,896,422 94.79
Shareholders with less than a marketable parcelAs at 14 May 2021 there were 302 shareholders on the register holding less than a marketable parcel ($500) based on the closing market price of $0.29.
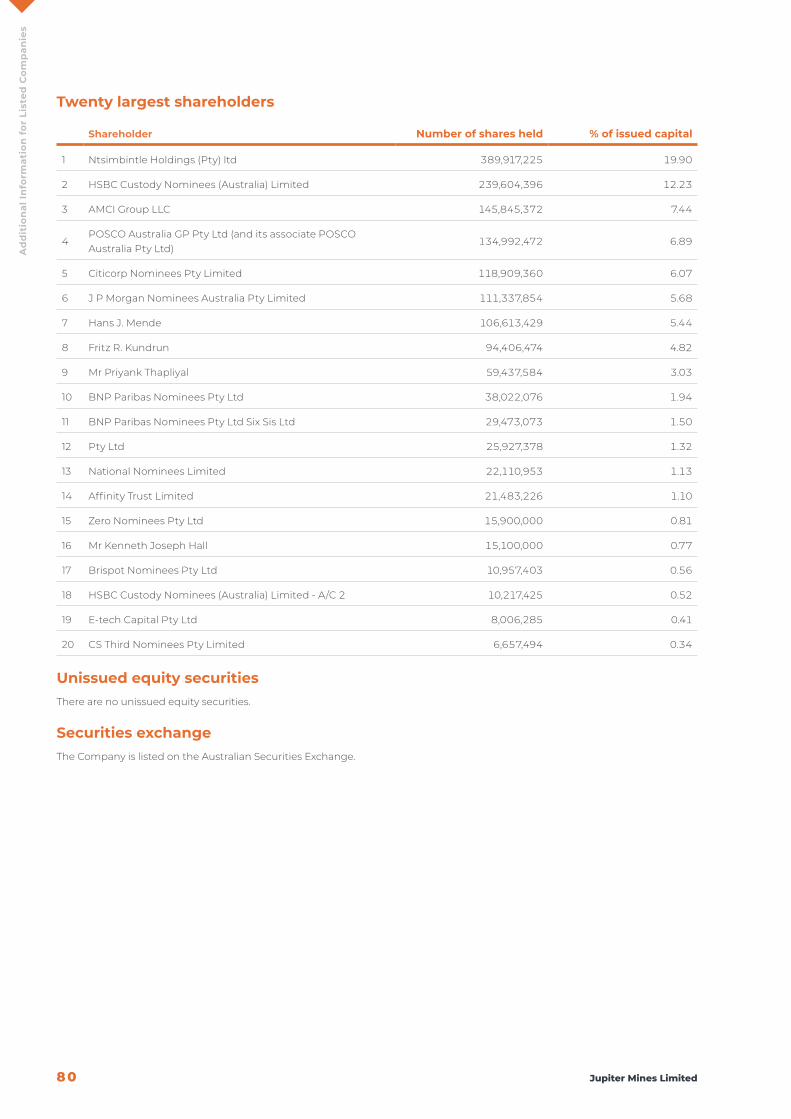
80 Jupiter Mines Limited
Ad
dit
ion
al In
form
atio
n f
or
List
ed C
om
pan
ies
Twenty largest shareholders
Shareholder Number of shares held % of issued capital
1 Ntsimbintle Holdings (Pty) ltd 389,917,225 19.90
2 HSBC Custody Nominees (Australia) Limited 239,604,396 12.23
3 AMCI Group LLC 145,845,372 7.44
4POSCO Australia GP Pty Ltd (and its associate POSCO Australia Pty Ltd)
134,992,472 6.89
5 Citicorp Nominees Pty Limited 118,909,360 6.07
6 J P Morgan Nominees Australia Pty Limited 111,337,854 5.68
7 Hans J. Mende 106,613,429 5.44
8 Fritz R. Kundrun 94,406,474 4.82
9 Mr Priyank Thapliyal 59,437,584 3.03
10 BNP Paribas Nominees Pty Ltd 38,022,076 1.94
11 BNP Paribas Nominees Pty Ltd Six Sis Ltd 29,473,073 1.50
12 Pty Ltd 25,927,378 1.32
13 National Nominees Limited 22,110,953 1.13
14 Affinity Trust Limited 21,483,226 1.10
15 Zero Nominees Pty Ltd 15,900,000 0.81
16 Mr Kenneth Joseph Hall 15,100,000 0.77
17 Brispot Nominees Pty Ltd 10,957,403 0.56
18 HSBC Custody Nominees (Australia) Limited - A/C 2 10,217,425 0.52
19 E-tech Capital Pty Ltd 8,006,285 0.41
20 CS Third Nominees Pty Limited 6,657,494 0.34
Unissued equity securitiesThere are no unissued equity securities.
Securities exchangeThe Company is listed on the Australian Securities Exchange.

/ Annual Report 2021 81

82 Jupiter Mines Limited

/ Annual Report 2021 83

84 Jupiter Mines Limited

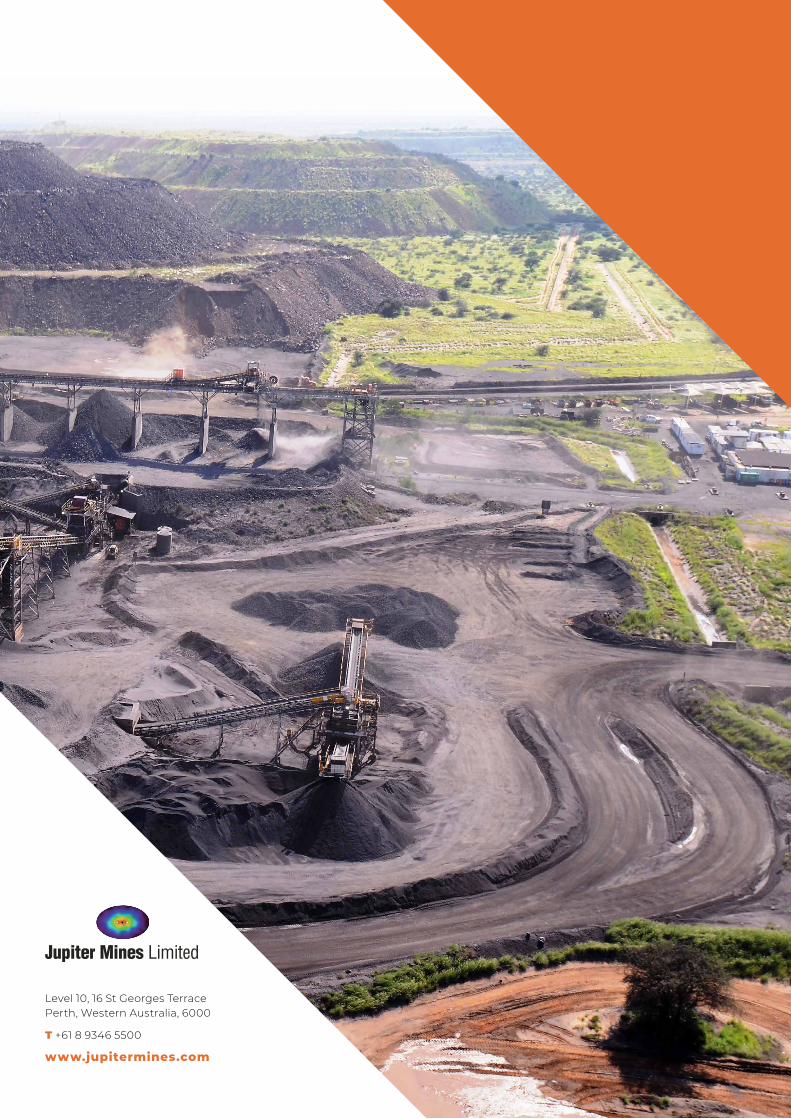
Level 10, 16 St Georges TerracePerth, Western Australia, 6000
T +61 8 9346 5500
www.jupitermines.com
Jup
iter Min
es Limited
| An
nu
al Rep
ort 2021