jurisdiction report 13 - virginia department of … report daily traffic volume estimates including...
TRANSCRIPT
Virginia Department of Transportation
Jurisdiction Report
Daily Traffic Volume Estimates
Including Vehicle Classification Estimates
Town of Grundy
where available
Buchanan County
2015
Prepared By
Virginia Department of Transportation
Traffic Engineering Division
In Cooperation With
U.S. Department of Transportation
Federal Highway Administration
13
Virginia Department of Transportation
Traffic Engineering Division
Traffic Monitoring Section
The Virginia Department of Transportation (VDOT) conducts a program where traffic
count data are gathered from sensors in or along streets and highways and other sources.
From these data, estimates of the average number of vehicles that traveled each segment
of road are calculated. VDOT periodically publishes booklets listing these estimates.
One of these booklets, titled “Average Daily Traffic Volumes with Vehicle Classification
Data, on Interstate, Arterial and Primary Routes” includes a list of each Interstate and
Primary highway segment with the estimated Annual Average Daily Traffic (AADT) for
that segment. AADT is the total annual traffic estimate divided by the number of days in
the year. This booklet also includes information such as estimates of the percentage of
the AADT made up by 6 different vehicle types, ranging from cars to double trailer
trucks; estimated Annual Average Weekday Traffic (AAWDT), which is the number of
vehicles estimated to have traveled the segment of highway during a 24 hour weekday
averaged over the year; as well as Peak Hour and Peak Direction factors used by planners
to formulate design criteria.
In addition to the Primary and Interstate publication, one hundred books are published
periodically, one for each of 100 areas across the state defined by VDOT for record-
keeping purposes. These books include traffic volume estimates for roads within the
county, cities, and towns within the area. These books are titled “Daily Traffic Volumes
Including Vehicle Classification Estimates, where available; Jurisdiction Report numbers
00 through 99”.
Also available are a number of reports summarizing the average Vehicle Miles Traveled
(VMT) in selected jurisdictions and other categories of highways. There are many
different ways to present traffic volume summary information. Because the user
determines the value of each presentation, the reports have been redesigned based on user
requests and feedback. The people of the VDOT Traffic Engineering Division Traffic
Monitoring Section who produce these books welcome requests for other helpful ways of
presenting the summary information.
A compact disc (CD) is available that includes files in the Adobe® Portable Document
Format (PDF) that can be displayed, searched, and printed using common desktop
computer equipment. The CD includes the publications described above as well as a
number of other reports, including specialized VMT summaries and smaller AADT
reports for each city and town separately.
Publication Notes
Parallel Roads
For road inventory and management purposes, some roadways are counted separately by
direction and have separately published traffic estimates for each direction of travel.
Examples of such roadways are the interstate system and routes with separated facilities
and (usually) one-way traffic facilities in urban areas. In these publications, they are
referred to as parallel roads. As a convenience for the users of the publication, the listing
for segments of roads with parallel segments are published with both the traffic estimates
for their own direction of travel (e.g. I-95 Northbound) as well as the estimate of the total
of all traffic on the same route including parallel roadways (all directions of I-95). The
publication will have a “Combined Traffic Estimates for Parallel Roadways on this
Route” or “Combined Traffic” identifiers for the combined direction of travel estimates.
Roadways such as I-395 with a North segment, a South segment and a separate
Reversible lane segment will have the estimate for more than two parallel roadways
included in the entire combined traffic estimate.
Some routes have very complicated paths through cities and towns. These parallel paths
may be too complex to allow a relationship between nearby sections of the opposite
direction on the same route. In this case, to indicate that the traffic estimates for such a
road segment may not include all directions of traffic on that route, the line that would
list the combined values will indicate “NA” for not available.
VDOT’s traffic monitoring program includes more than 100,000 segments of roads and
highways ranging from several mile sections of Interstate highways to very short sections
of city streets. Due to problems experienced obtaining some traffic count data, and the
level of quality necessary to maintain confidence in the data, no estimate is currently
available for some segments of roadway. These segments are included in the
publications indicating “NA” for not available. It is the intention of the VDOT Traffic
Engineering Division Traffic Monitoring group to obtain the data necessary and to report
traffic volume estimates on all road segments included in these publications.
Many of the road segments in this program are local secondary roads. The amount and
detail of data collected on these roads are not as great as the data collected on higher
volume roads. The vehicle classification, average weekday traffic volumes, and the
theoretical design hour traffic volumes are not calculated for these roads. The
publications indicate “NA” for the information that is not available.
This publication is based on a traffic monitoring program initiated in 1997. Because the
data collection techniques and statistical evaluation processes are different than those
used in previous years, comparison with previous publications may be misleading.
Glossary of Terms:
Route: The Route Number assigned to this segment of roadway with the master
inventory route number if this is an overlapping route, with official street or highway
name if available.
Length: Length of the traffic segment in miles.
AADT: Annual Average Daily Traffic. The estimate of typical daily traffic on a road
segment for all days of the week, Sunday through Saturday, over the period of one year.
QA: Quality of AADT:
A Average of Complete Continuous Count Data
B Average of Selected Continuous Count Data
F Factored Short Term Traffic Count Data
G Factored Short Term Traffic Count Data with Growth Element
H Historical Estimate
M Manual Uncounted Estimate
N AADT of Similar Neighboring Traffic Link
O Provided By External Source
R Raw Traffic Count, Unfactored
4Tire: Percentage of the traffic volume made up of motorcycles, passenger cars, vans and
pickup trucks.
Bus: Percentage of the traffic volume made up of busses.
2Axle Truck: Percentage of the traffic volume made up of 2 axle single unit trucks (not
including pickups and vans).
3+Axle Truck: Percentage of the traffic volume made up of single unit trucks with three
or more axles.
1Trail Truck: Percentage of the traffic volume made up of units with a single trailer.
2Trail Truck: Percentage of the traffic volume made up of units with more than one
trailer.
QC: Quality of Classification Data:
A Average of Complete Continuous Count Data
B Average of Selected Continuous Count Data
C Short Term Classified Traffic Count Data
F Factored Short Term Traffic Count Data
H Historical Estimate
M Mass Collective Average
N Classification Estimates of Similar Neighboring Traffic Link

K Factor: The estimate of the portion of the traffic volume traveling during the peak hour
or design hour.
QK: Quality of the K Factor estimate:
A Factor based on 30th Highest Hour Observed During at least 250 days of
Continuous Traffic Data
B Factor based on other Hour Observed During Less than 250 days of
Continuous Traffic Data
F Factor based on Highest Hour Collected at in a 48 Hour Weekday Period
M Factor based on Manual Estimate of design hour
N Design Hour Factor (K Factor) of Similar Neighboring Traffic Link
O Provided by External Source
Dir Factor: The estimate of the portion of the traffic volume traveling in the peak direction during the peak hour..
AAWDT: Average Annual Weekday Traffic. The estimate of typical traffic over the
period of one year for the days between Monday through Thursday inclusive.
QW: Quality of AAWDT:
A Average of Complete Continuous Count Data
B Average of Selected Continuous Count Data
F Factored Short Term Traffic Count Data
G Factored Short Term Traffic Count Data with Growth Element
M Manual Uncounted Estimate
N AAWDT of Similar Neighboring Traffic Link
O Provided by External Source
Year: Year for which the published values are appropriate. If the Quality of AADT
(QA) is “R”, the year is the year that the raw traffic count was collected, and if available,

Bus
29
600
7
29
North
81
154600
Interstate Route
US Route
Virginia State Route
ALT - Alternate Route
Bus - Business Route
Bypas - Bypass Route
Truck - Truck Route
Wye - Wye Route connector
Secondary Route
The VDOT Maintainenance Jurisdiction number is displayed below the Secondary Route Number if the Maintenance Jurisdiction is different than the jurisdiction in the title of the report.
P - Parallel Route; Southbound or Westbound direction lanes of a numbered route where they are on a different road facility than the other direction.
ALT
220
11P
Traffic volume data for Interstate Routes and some other routes are reported separately by direction, as well as combined.
Route Shield Legend
Route Systems
Special Routes
Frontage Road (F precedes frontage route number)F241

Virginia Department of TransportationTraffic Engineering Division
2015Annual Average Daily Traffic Volume Estimates By Section of Route
Buchanan Maintenance Area
Route Jurisdiction AADT1Trail 2Trail
4TireK
QA2Axle 3+Axle
QC QKBusLength---------------Truck---------------
FactorAAWDT QW
Dir
Factor
Red Bud Hwy 1600 1% 1% 0.103 1700G 1% 1% C G
Russell County Line
Dickenson County Line
95%
From:To:
From:
Buchanan County 9.92 0%80 0.549
Breaks Park Rd 730 0% 1% 0.113 770G 2% 1% F G
Kentucky State Line
95%To:
Buchanan County 1.60 0%80 0.632
3000 0% 1% 0.102 3100G 1% 1% F G
Dickenson County Line
13-604 Sunset Hollow Rd
97%
From:
To:
From:
Buchanan County 2.47 0%83
13-604 Sunset Hollow
0.721
2900 0% 1% 0.106 3100G 1% 1% C G
13-619 Lee Master Dr
97%
From:To:
Buchanan County 5.96 0%83 0.661
Dickenson Hwy 4700 0% 1% 0.094 4900G 1% 1% F G
US 460
97%
From:
To:
Buchanan County 1.95 0%83 0.682
10000 0% 1% 0.096 11000G 1% 2% F G
SCL Grundy
96%
From:
To:
Buchanan County460 1.99 0%83 0.532
9700 0% 1% 0.102 11000G 1% 2% F G
US 460 WEST
96%
From:
To:
Town of Grundy (Maint: 13)460 1.96 0%83
US 460 E
0.528
Edgewater Dr 7000 1% 1% 0.1 7400G 1% 3% F G
ECL Grundy
94%
From:
To:
Town of Grundy (Maint: 13) 1.49 0%83 0.557
State Creek Rd 5400 1% 1% 0.093 5700G 1% 3% F G
13-642 Elkins Br.
94%
From:
To:
Buchanan County 2.93 0%83 0.614
2900 1% 1% 0.099 3100G 1% 3% C G
13-643 Hurley Rd
94%
From:To:
Buchanan County 4.24 0%83 0.531
1800 1% 1% 0.107 1900G 1% 3% F G
13-640 Hale Cr.
94%
From:To:
Buchanan County 2.47 0%83 0.566
830 1% 1% 0.098 870G 1% 3% F G
West Virginia State Line
94%To:
Buchanan County 4.67 0%83 0.740
3200 0% 1% 0.096 3500G 1% 2% F G
Kentucky State Line
13-645
96%
From:To:
From:
Buchanan County 2.61 0%460 0.511
3200 0% 1% 0.091 3600G 1% 2% F G
13-700 Thomas Mtn Rd
96%
From:
To:
Buchanan County 2.09 0%460 0.506
3900 0% 1% 0.089 4300G 1% 2% F G
13-609 Ball Creek
96%
From:
To:
Buchanan County 2.36 0%460
13-609 Bull Creek Rd
0.674
5600 0% 1% 0.106 6200G 1% 2% F G
13-656 Looneys Creek
96%
From:
To:
Buchanan County 2.59 0%460 0.622
5800 0% 1% 0.098 6400G 1% 2% F G
WCL Grundy
96%To:
Buchanan County 1.56 0%460 0.639
75/2/2016

Virginia Department of TransportationTraffic Engineering Division
2015Annual Average Daily Traffic Volume Estimates By Section of Route
Buchanan Maintenance Area
Route Jurisdiction AADT1Trail 2Trail
4TireK
QA2Axle 3+Axle
QC QKBusLength---------------Truck---------------
FactorAAWDT QW
Dir
Factor
5800 0% 1% 0.098 6400N 1% 2% N N
WCL Grundy
US 460 Par; 13-1006 NORTH
96%
From:
To:
From:
Town of Grundy (Maint: 13) 1.62 0%460
US 460 Par; 13-1006 South
0.639
9700 0% 1% 0.102 11000G 1% 2% F G
SCL Grundy
96%
From:To:
Town of Grundy (Maint: 13)83 1.96 0%460 0.528
10000 0% 1% 0.096 11000G 1% 2% F G
SR 83 South Intersection
96%
From:To:
Buchanan County83 1.99 0%460 0.532
8100 0% 1% 0.088 8900G 1% 2% F G
13-638 Dismal River Rd
96%
From:To:
Buchanan County 3.59 0%460 0.536
7100 0% 1% 0.091 7800G 1% 2% F G
13-1101 Keen Mtn Camp
96%
From:
To:
Buchanan County 5.25 0%460
13-1101 Keen Mtn. Camp
0.525
7200 0% 1% 0.093 7900G 1% 2% F G
13-680 Contrary Creek Rd
96%
From:
To:
Buchanan County 2.21 0%460 0.541
6700 0% 1% 0.082 7300G 1% 2% F G
Tazewell County Line
96%To:
Buchanan County 6.30 0%460 0.609
85/2/2016

Virginia Department of TransportationTraffic Engineering Division
2015Annual Average Daily Traffic Volume Estimates By Section of Route
Buchanan Maintenance Area
Route AADT1Trail 2Trail
4TireK
QA2Axle 3+Axle
QC QKBusLength---------------Truck---------------
FactorAAWDT QW Year
Dir
Factor
Hurricane 1000 1% 2% 0.121 1100G 2% 0% C G
SR 80
13-720 Sunland Rd
96%
From:To:
From:
0.10 0%
Buchanan County
2015600 0.584
Hurricane Creek Rd 950 1% 2% 0.116 1000G 2% 0% F G
13-657 Boyds Ridge Rd
96%
From:
To:
0.90 0% 2015600 0.601
Hurricane Creek Rd 170 1% 2% 0.116 180G 2% 0% F G
13-620 Indian Gap Rd
96%To:
7.00 0% 2015600 0.558
Convict Hwy 350 NA NAR
Dead End
13-609 Bull Creek RdTo:
From:
2.20 10/02/2015601
Indian Creek 450 0% 4% 0.13 470G 8% 0% F G
Dickenson County Line
25-688 Sullivan Branch
87%
From:
To:
From:
0.55 0% 2015602
25-688 Sullivan
0.603
Indian Creek Rd 350 0% 4% 0.143 370G 8% 0% C G
25-601 Indian Creek Rd
87%
From:To:
1.41 0% 2015602 0.635
510 NA NAR
13-672 CopperheadFrom:
To:
3.67 08/13/2015602
100 NA NAR
3.06 MS 13-672 CopperheadFrom:
To:
3.06 08/27/2015602
80 NA NAR
13-692 Combs RidgeFrom:
To:
1.01 08/27/2015602
440 NA NAR
SR 80To:
1.52 08/27/2015602
20 NA NAR
Dead End
13-679 Jakes BranchFrom:
To:
From:
0.90 08/18/2015603
60 NA NAR
13-657 S, Back HurricaneFrom:
To:
0.70 08/18/2015603
13-657 N, Back Hurricane
50 NA NAR
Dead EndTo:
1.50 08/18/2015603
Poplar Gap Rd 700 NA NAR
SR 83
2.04 MN SR 83From:
To:
From:
2.04 09/24/2015604
Poplar Gap Rd 690 NA NAR
5.00 MN SR 83From:
To:
2.96 09/24/2015604
Poplar Gap Rd 490 NA NAR
13-614From:
To:
1.40 09/24/2015604
Poplar Gap Rd 610 NA NAR
13-615 Hoot Owl StFrom:
To:
1.00 09/24/2015604
Poplar Gap Rd 920 NA NAR
US 460To:
2.52 09/11/2015604
Russell Fork 530 NA NAR
SR 80
13-705 Little FoxFrom:
To:
From:
3.22 08/18/2015605
Russell Fork 1000 NA NAR
13-619 Lee Master DrFrom:
To:
1.10 08/18/2015605
Russell Fork 190 NA NAR
13-658; 25-605To:
2.20 08/18/2015605
Rakes Ridge 670 NA NAR
Dickenson County Line
SR 83To:
From:
1.30 08/18/2015606
95/2/2016

Virginia Department of TransportationTraffic Engineering Division
2015Annual Average Daily Traffic Volume Estimates By Section of Route
Buchanan Maintenance Area
Route AADT1Trail 2Trail
4TireK
QA2Axle 3+Axle
QC QKBusLength---------------Truck---------------
FactorAAWDT QW Year
Dir
Factor
Fletchers Hwy 70 NA NAR
13-600 Hurricane
Dead EndTo:
From:
0.90
Buchanan County
08/13/2015607
Right Fork Greenbrier 1200 NA NAR
13-611 Greenbrier
2.30 ME 13-611 GreenbrierFrom:
To:
From:
2.30 08/18/2015608
Right Fork Greenbrier 490 NA NAR
Dead EndTo:
1.30 08/18/2015608
King Solomon Colley Rd 580 1% 1% 0.102 610G 3% 2% F G
Dickenson County Line
13-664 Deel Fork
94%
From:
To:
From:
4.64 0% 2015609 0.612
King Solomon Colley Rd 1100 1% 1% 0.094 1200G 3% 2% F G
13-614 Belchers Fork Rd
94%
From:
To:
0.94 0% 2015609 0.612
Bull Creek Rd 1700 1% 1% 0.094 1800G 3% 2% F G
13-601 Convict Hollow Rd
94%
From:To:
1.76 0% 2015609 0.72
Bull Creek Rd 2200 1% 1% 0.085 2300G 3% 2% C G
US 460
94%To:
0.92 0% 2015609 0.730
Conaway/Cow Fork 650 NA NAR
SR 80
3.79 MN SR 80From:
To:
From:
3.79 09/24/2015610
Conaway/Cow Fork 700 NA NAR
6.30 MN SR 80From:
To:
2.51 09/24/2015610
Conaway/Cow Fork 850 NA NAR
US 460To:
2.72 09/24/2015610
Greenbrier 1600 NA NAR
SR 83
13-714 Little GreenbrierFrom:
To:
From:
1.56 08/18/2015611
Greenbrier 1200 NA NAR
Dead EndTo:
1.20 08/18/2015611
Looneys Fork 140 NA NAR
13-619 Lee Master Dr
Dead EndTo:
From:
0.70 08/18/2015612
790 NA NAR
13-636
3.40 MN 13-636From:
To:
From:
3.40 09/09/2015613
310 NA NAR
13-616To:
3.40 09/09/2015613
220 NA NAR
13-604 Poplar Gap Rd
4.00 MN 13-604From:
To:
From:
4.00 09/24/2015614
470 NA NAR
13-609 Bull Creek RdTo:
1.00 09/24/2015614
Hoot Owl St 740 0% 2% 0.165 740G 0% 0% C G
13-604 Poplar Gap Rd
WCL Grundy
98%To:
From:
2.70 0% 2015615 0.785
Hoot Owl St 590 NA NAR
WCL Grundy
13-1009 Levisa StFrom:
To:
From:
0.49
Town of Grundy
09/11/2015615
Hoot Owl St 840 NA NAR
US 460, SR 83To:
0.06 09/11/2015615
320 NA NAR
92-622 Reynolds Ridge Rd
Tazewell County Line ; 92-612To:
From:
0.60
Buchanan County
09/09/2015616
105/2/2016

Virginia Department of TransportationTraffic Engineering Division
2015Annual Average Daily Traffic Volume Estimates By Section of Route
Buchanan Maintenance Area
Route AADT1Trail 2Trail
4TireK
QA2Axle 3+Axle
QC QKBusLength---------------Truck---------------
FactorAAWDT QW Year
Dir
Factor
260 NA NAR
Tazewell County Line ; 92-612
1.60 MN 92-612From:
To:
From:
1.60
Buchanan County
09/09/2015616
210 NA NAR
13-637 BearwallowFrom:
To:
2.40 09/09/2015616
210 NA NAR
13-613From:
To:
1.50 09/09/2015616
70 NA NAR
13-719 Mitchell RdFrom:
To:
4.60 09/17/2015616
40 NA NAR
0.60 MS 13-719 Mitchell RdFrom:
To:
0.60 09/17/2015616
70 NA NAR
13-636From:
To:
1.00 09/17/2015616
220 NA NAR
13-704 PeapatchFrom:
To:
0.70 09/09/2015616
310 NA NAR
13-635 Wimmer Gap RdFrom:
To:
1.00 09/09/2015616
490 NA NAR
1.00 MN 13-635From:
To:
1.00 09/17/2015616
190 NA NAR
13-639 Compton Mtn RdTo:
0.60 09/17/2015616
Little Prater 610 NA NAR
Dead End
13-695 Cripple BridgeFrom:
To:
From:
1.90 09/11/2015617
Little Prater 1600 1% 0% 0.096 1600G 6% 1% C G
US 460
92%To:
0.30 0% 2015617 0.572
Fox Ridge Dr 140 NA NAR
Tazewell County Line
1.40 MW of CLFrom:
To:
From:
1.39 08/25/2015618
Fox Ridge Dr 230 NA NAR
13-634 Pistol BridgeFrom:
To:
1.01 08/25/2015618
Fox Ridge Dr 470 NA NAR
US 460To:
2.22 08/25/2015618
Lee Master Dr 500 NA NAR
13-605 Russell Fork
3.82 MN 13-605 Russell ForkFrom:
To:
From:
3.82 08/18/2015619
Lee Master Dr 180 NA NAR
13-612 Looneys ForkFrom:
To:
2.96 08/18/2015619
Lee Master Dr 1500 NA NAR
SR 83To:
2.00 08/18/2015619
430 NA NAR
SR 83
13-622 N, Ball CircleFrom:
To:
From:
1.56 08/13/2015620
270 NA NAR
13-623 Council MtnFrom:
To:
3.21 08/20/2015620
190 NA NAR
13-625From:
To:
0.98 08/20/2015620
150 NA NAR
13-600 HurricaneFrom:
To:
2.75 08/20/2015620
Indian Gap Rd 310 0% 1% 0.115 320G 8% 2% F G
13-662 Robinsons Fork Rd
89%
From:
To:
1.35 0% 2015620 0.649
Deskins Rd 360 0% 1% 0.129 380G 8% 2% F G
13-657 Boyds Ridge Rd
89%To:
2.82 0% 2015620 0.824
115/2/2016

Virginia Department of TransportationTraffic Engineering Division
2015Annual Average Daily Traffic Volume Estimates By Section of Route
Buchanan Maintenance Area
Route AADT1Trail 2Trail
4TireK
QA2Axle 3+Axle
QC QKBusLength---------------Truck---------------
FactorAAWDT QW Year
Dir
Factor
1100 0% 1% 0.097 1200G 8% 2% C G
13-657 Boyds Ridge Rd
SR 83 Dickenson Hwy
89%To:
From:
3.42 0%
Buchanan County
2015620 0.806
Brown Mtn 160 NA NAR
Dead End
13-635From:
To:
From:
2.00 09/09/2015621
Brown Mtn 580 NA NAR
Tazewell County LineTo:
2.20 09/09/2015621
Ball Creek 180 NA NAR
13-620
2.40 MN 13-620From:
To:
From:
2.40 08/13/2015622
Ball Creek 150 NA NAR
13-625To:
1.70 08/13/2015622
Council Mtn 80 NA NAR
SR 80
0.10 MN SR 80From:
To:
From:
0.10 08/20/2015623
Council Mtn 40 NA NAR
1.60 MN SR 80From:
To:
1.50 08/20/2015623
Council Mtn 40 NA NAR
2.09 MN SR 80From:
To:
0.49 08/20/2015623
Council Mtn 50 NA NAR
3.09 MN SR 80From:
To:
1.00 08/20/2015623
Council Mtn 70 NA NAR
13-681 RockhouseFrom:
To:
0.26 08/20/2015623
Council Mtn 180 NA NAR
13-620To:
0.25 08/20/2015623
Garden Creek Rd 1400 0% 1% 0.095 1400G 1% 2% F G
Russell County Line
13-665 Rosin Camp
95%
From:To:
From:
2.23 0% 2015624 0.651
Garden Creek Rd 1700 0% 1% 0.1 1700G 1% 2% F G
13-662 Robinson Fork Rd
95%
From:
To:
1.28 0% 2015624 0.673
Garden Creek Rd 1800 0% 1% 0.096 1900G 1% 2% F G
13-683 Breeden Branch Rd
95%
From:
To:
0.92 0% 2015624
13-683 Horn Branch
0.626
1800 0% 1% 0.094 1900G 1% 2% F G
13-627 Dry Fork
95%
From:
To:
2.57 0% 2015624
13-627 Youngs Branch Rd
0.678
Garden Creek Rd 2300 0% 1% 0.094 2400G 1% 2% F G
13-632 Page Dr
95%
From:
To:
0.59 0% 2015624 0.643
Garden Creek Rd 2600 0% 1% 0.095 2800G 1% 2% F G
13-698 Hobby House Rd
95%
From:
To:
0.25 0% 2015624 0.653
Garden Creek Rd 3000 0% 1% 0.098 3200G 1% 2% C G
13-669 Popular Grove Rd
95%
From:
To:
1.40 0% 2015624
13-669 Poplar Grove Rd
0.627
Garden Creek Rd 3300 0% 1% 0.096 3400G 1% 2% F G
US 460 WEST
95%
From:
To:
0.18 0% 2015624
US 460 EAST
0.641
Kennel Gap Rd 220 NA NAR
SR 330 Keen Mountain Correctional Ctr Rd SysTo:
2.35 08/25/2015624
50 NA NAR
Dead End
13-620From:
To:
From:
0.35 03/17/2008625
100 NA NAR
1.70 ME 13-620To:
1.70 08/20/2015625
125/2/2016

Virginia Department of TransportationTraffic Engineering Division
2015Annual Average Daily Traffic Volume Estimates By Section of Route
Buchanan Maintenance Area
Route AADT1Trail 2Trail
4TireK
QA2Axle 3+Axle
QC QKBusLength---------------Truck---------------
FactorAAWDT QW Year
Dir
Factor
80 NA NAR
1.70 ME 13-620
3.75 ME 13-620From:
To:
From:
2.05
Buchanan County
08/20/2015625
80 NA NAR
Russell County LineTo:
0.35 08/20/2015625
Trace Branch 320 NA NAR
13-632 Page
US 460To:
From:
2.90 08/25/2015626
Dry Fork 1000 NA NAR
SR 83
3.50 ME SR 83From:
To:
From:
3.50 09/11/2015627
Dry Fork 210 NA NAR
13-624To:
5.10 09/01/2015627
Horn Mtn Rd 130 NA NAR
13-629
13-633 Horn MtnFrom:
To:
From:
3.91 09/01/2015628
Horn Mtn Rd 80 NA NAR
2.43 MN 13-633 Horn MtnFrom:
To:
2.43 09/01/2015628
Horn Mtn Rd 210 NA NAR
13-638 WESTFrom:
To:
0.17 09/01/2015628
13-638 EAST
Horn Mtn Rd 160 NA NAR
2.50 MN 13-628From:
To:
2.50 09/03/2015628
Horn Mtn Rd 150 NA NAR
3.50 MN 13-638From:
To:
1.00 09/03/2015628
Horn Mtn Rd 130 NA NAR
13-639 Compton Mtn RdTo:
0.50 09/03/2015628
240 NA NAR
US 460
92-617 Red Root Ridge RdFrom:
To:
From:
0.80 09/01/2015629
200 NA NAR
13-628 Horn Mtn RdFrom:
To:
4.00 09/01/2015629
100 NA NAR
1.50 MW 05-628 Horn Mtn RdFrom:
To:
1.50 09/01/2015629
1200 NA NAR
13-680 MIDFrom:
To:
2.50 10/02/2015629
13-680 SOUTH
2100 NA NAR
1.97 MN 13-680From:
To:
1.97 09/01/2015629
70 NA NAR
13-715 Upper Big BranchFrom:
To:
0.76 09/01/2015629
Big Branch Rd 180 NA NAR
13-680 NORTHTo:
2.54 09/01/2015629
Drill 48 NA NAR
Dead End
Russell County LineTo:
From:
0.50 08/13/2015630
Middle Fork 290 NA NAR
Dickenson County Line; 05-768
13-693 Crow Pass RdFrom:
To:
From:
0.01 09/24/2015631
Middle Fork 160 NA NAR
1.50 ME 13-693 Crow Pass RdFrom:
To:
1.50 09/24/2015631
Middle Fork 80 NA NAR
Dead EndTo:
0.99 09/24/2015631
135/2/2016
Virginia Department of TransportationTraffic Engineering Division
2015Annual Average Daily Traffic Volume Estimates By Section of Route
Buchanan Maintenance Area
Route AADT1Trail 2Trail
4TireK
QA2Axle 3+Axle
QC QKBusLength---------------Truck---------------
FactorAAWDT QW Year
Dir
Factor
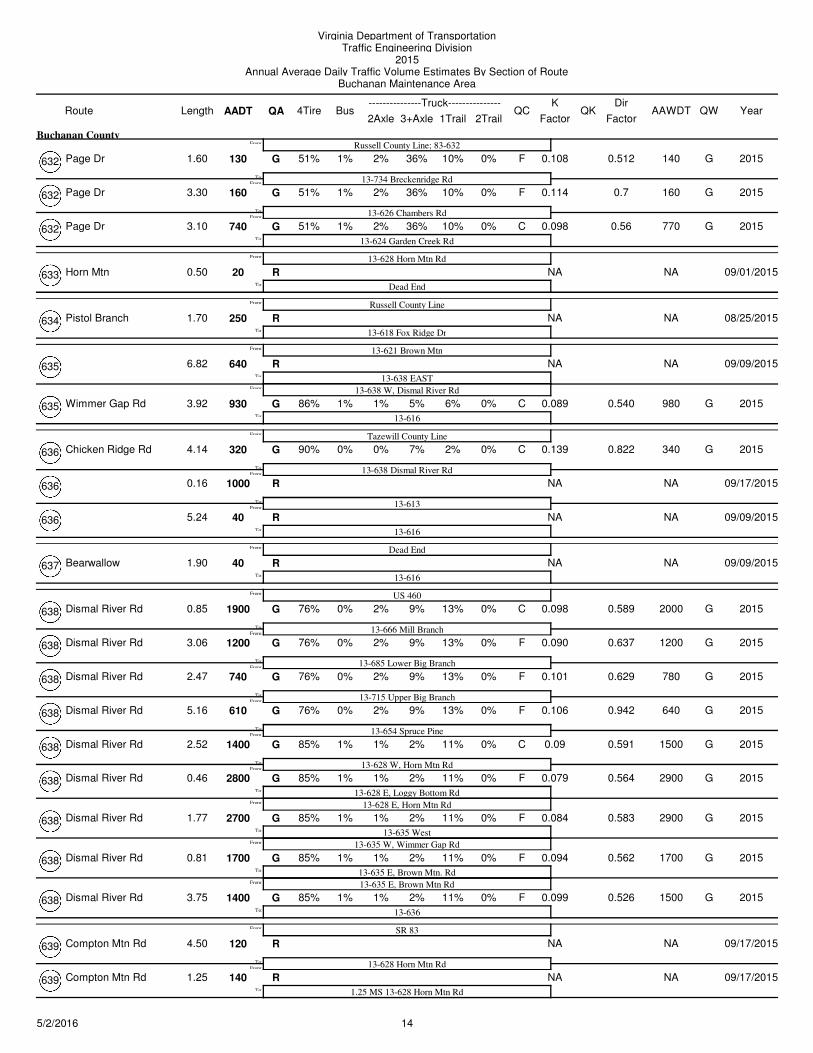
Page Dr 130 1% 2% 0.108 140G 36% 10% F G
Russell County Line; 83-632
13-734 Breckenridge Rd
51%
From:To:
From:
1.60 0%
Buchanan County
2015632 0.512
Page Dr 160 1% 2% 0.114 160G 36% 10% F G
13-626 Chambers Rd
51%
From:
To:
3.30 0% 2015632 0.7
Page Dr 740 1% 2% 0.098 770G 36% 10% C G
13-624 Garden Creek Rd
51%To:
3.10 0% 2015632 0.56
Horn Mtn 20 NA NAR
13-628 Horn Mtn Rd
Dead EndTo:
From:
0.50 09/01/2015633
Pistol Branch 250 NA NAR
Russell County Line
13-618 Fox Ridge DrTo:
From:
1.70 08/25/2015634
640 NA NAR
13-621 Brown Mtn
13-638 EASTFrom:
To:
From:
6.82 09/09/2015635
13-638 W, Dismal River Rd
Wimmer Gap Rd 930 1% 1% 0.089 980G 5% 6% C G
13-616
86%To:
3.92 0% 2015635 0.540
Chicken Ridge Rd 320 0% 0% 0.139 340G 7% 2% C G
Tazewill County Line
13-638 Dismal River Rd
90%
From:To:
From:
4.14 0% 2015636 0.822
1000 NA NAR
13-613From:
To:
0.16 09/17/2015636
40 NA NAR
13-616To:
5.24 09/09/2015636
Bearwallow 40 NA NAR
Dead End
13-616To:
From:
1.90 09/09/2015637
Dismal River Rd 1900 0% 2% 0.098 2000G 9% 13% C G
US 460
13-666 Mill Branch
76%
From:
To:
From:
0.85 0% 2015638 0.589
Dismal River Rd 1200 0% 2% 0.090 1200G 9% 13% F G
13-685 Lower Big Branch
76%
From:
To:
3.06 0% 2015638 0.637
Dismal River Rd 740 0% 2% 0.101 780G 9% 13% F G
13-715 Upper Big Branch
76%
From:To:
2.47 0% 2015638 0.629
Dismal River Rd 610 0% 2% 0.106 640G 9% 13% F G
13-654 Spruce Pine
76%
From:To:
5.16 0% 2015638 0.942
Dismal River Rd 1400 1% 1% 0.09 1500G 2% 11% C G
13-628 W, Horn Mtn Rd
85%
From:
To:
2.52 0% 2015638 0.591
Dismal River Rd 2800 1% 1% 0.079 2900G 2% 11% F G
13-628 E, Loggy Bottom Rd
85%
From:
To:
0.46 0% 2015638
13-628 E, Horn Mtn Rd
0.564
Dismal River Rd 2700 1% 1% 0.084 2900G 2% 11% F G
13-635 West
85%
From:
To:
1.77 0% 2015638
13-635 W, Wimmer Gap Rd
0.583
Dismal River Rd 1700 1% 1% 0.094 1700G 2% 11% F G
13-635 E, Brown Mtn. Rd
85%
From:
To:
0.81 0% 2015638
13-635 E, Brown Mtn Rd
0.562
Dismal River Rd 1400 1% 1% 0.099 1500G 2% 11% F G
13-636
85%To:
3.75 0% 2015638 0.526
Compton Mtn Rd 120 NA NAR
SR 83
13-628 Horn Mtn RdFrom:
To:
From:
4.50 09/17/2015639
Compton Mtn Rd 140 NA NAR
1.25 MS 13-628 Horn Mtn RdTo:
1.25 09/17/2015639
145/2/2016
Virginia Department of TransportationTraffic Engineering Division
2015Annual Average Daily Traffic Volume Estimates By Section of Route
Buchanan Maintenance Area
Route AADT1Trail 2Trail
4TireK
QA2Axle 3+Axle
QC QKBusLength---------------Truck---------------
FactorAAWDT QW Year
Dir
Factor
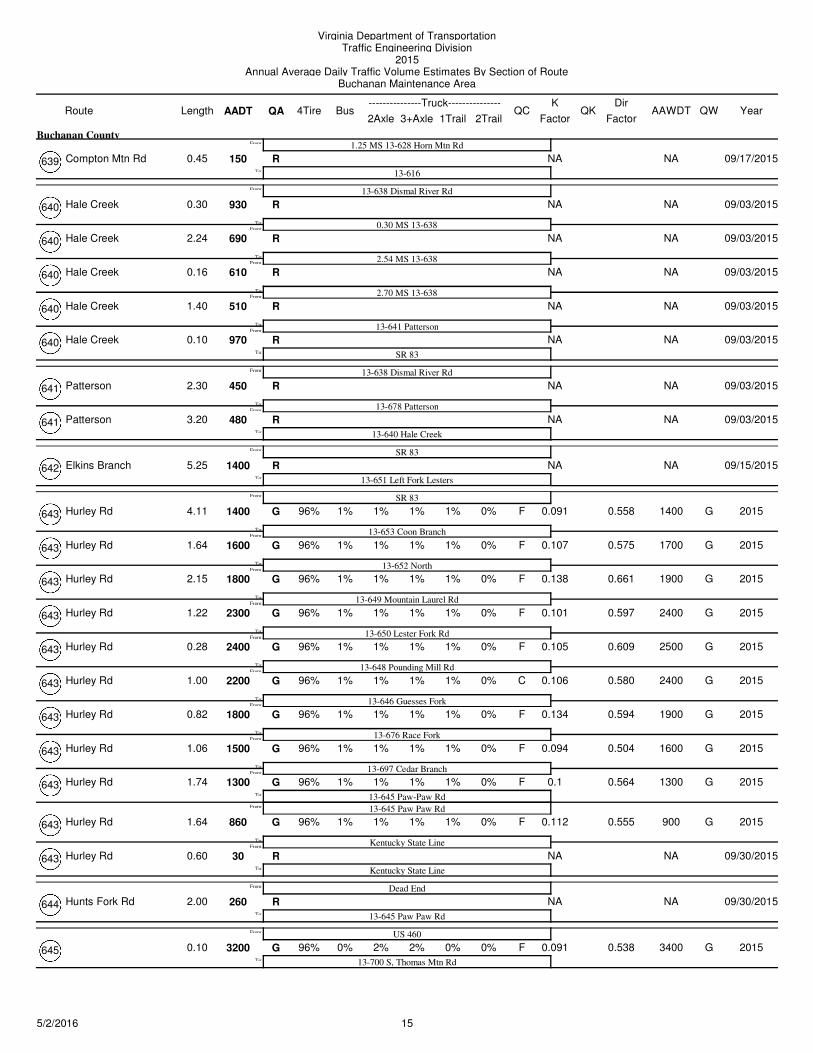
Compton Mtn Rd 150 NA NAR
1.25 MS 13-628 Horn Mtn Rd
13-616To:
From:
0.45
Buchanan County
09/17/2015639
Hale Creek 930 NA NAR
13-638 Dismal River Rd
0.30 MS 13-638From:
To:
From:
0.30 09/03/2015640
Hale Creek 690 NA NAR
2.54 MS 13-638From:
To:
2.24 09/03/2015640
Hale Creek 610 NA NAR
2.70 MS 13-638From:
To:
0.16 09/03/2015640
Hale Creek 510 NA NAR
13-641 PattersonFrom:
To:
1.40 09/03/2015640
Hale Creek 970 NA NAR
SR 83To:
0.10 09/03/2015640
Patterson 450 NA NAR
13-638 Dismal River Rd
13-678 PattersonFrom:
To:
From:
2.30 09/03/2015641
Patterson 480 NA NAR
13-640 Hale CreekTo:
3.20 09/03/2015641
Elkins Branch 1400 NA NAR
SR 83
13-651 Left Fork LestersTo:
From:
5.25 09/15/2015642
Hurley Rd 1400 1% 1% 0.091 1400G 1% 1% F G
SR 83
13-653 Coon Branch
96%
From:
To:
From:
4.11 0% 2015643 0.558
Hurley Rd 1600 1% 1% 0.107 1700G 1% 1% F G
13-652 North
96%
From:
To:
1.64 0% 2015643 0.575
Hurley Rd 1800 1% 1% 0.138 1900G 1% 1% F G
13-649 Mountain Laurel Rd
96%
From:To:
2.15 0% 2015643 0.661
Hurley Rd 2300 1% 1% 0.101 2400G 1% 1% F G
13-650 Lester Fork Rd
96%
From:
To:
1.22 0% 2015643 0.597
Hurley Rd 2400 1% 1% 0.105 2500G 1% 1% F G
13-648 Pounding Mill Rd
96%
From:
To:
0.28 0% 2015643 0.609
Hurley Rd 2200 1% 1% 0.106 2400G 1% 1% C G
13-646 Guesses Fork
96%
From:To:
1.00 0% 2015643 0.580
Hurley Rd 1800 1% 1% 0.134 1900G 1% 1% F G
13-676 Race Fork
96%
From:To:
0.82 0% 2015643 0.594
Hurley Rd 1500 1% 1% 0.094 1600G 1% 1% F G
13-697 Cedar Branch
96%
From:
To:
1.06 0% 2015643 0.504
Hurley Rd 1300 1% 1% 0.1 1300G 1% 1% F G
13-645 Paw-Paw Rd
96%
From:
To:
1.74 0% 2015643
13-645 Paw Paw Rd
0.564
Hurley Rd 860 1% 1% 0.112 900G 1% 1% F G
Kentucky State Line
96%
From:To:
1.64 0% 2015643 0.555
Hurley Rd 30 NA NAR
Kentucky State LineTo:
0.60 09/30/2015643
Hunts Fork Rd 260 NA NAR
Dead End
13-645 Paw Paw RdTo:
From:
2.00 09/30/2015644
3200 0% 2% 0.091 3400G 2% 0% F G
US 460
13-700 S, Thomas Mtn Rd
96%To:
From:
0.10 0% 2015645 0.538
155/2/2016

Virginia Department of TransportationTraffic Engineering Division
2015Annual Average Daily Traffic Volume Estimates By Section of Route
Buchanan Maintenance Area
Route AADT1Trail 2Trail
4TireK
QA2Axle 3+Axle
QC QKBusLength---------------Truck---------------
FactorAAWDT QW Year
Dir
Factor
1700 0% 2% 0.099 1800G 2% 0% F G
13-700 N, Thomas Mtn Rd
13-699 Happy Grace Ln
96%
From:To:
From:
0.21 0%
Buchanan County
2015645 0.627
790 0% 2% 0.12 830G 2% 0% C G
13-644 Hunts Fork Rd
96%
From:
To:
6.98 0% 2015645 0.537
Paw Paw Rd 1000 0% 2% 0.098 1100G 2% 0% F G
13-643 Hurley Rd
96%To:
2.46 0% 2015645 0.507
Guesses Fork 960 1% 2% 0.1 1000G 1% 1% C G
13-643 Hurley Rd
13-647 Old Guesses Fork Rd
96%
From:To:
From:
2.88 0% 2015646 0.531
620 1% 2% 0.104 650G 1% 1% F G
West Virginia State Line
96%To:
3.03 0% 2015646 0.539
170 NA NAR
Dead End
1.50 MN Dead EndFrom:
To:
From:
1.50 09/22/2015647
210 NA NAR
2.00 MN Dead EndFrom:
To:
0.50 09/22/2015647
360 NA NAR
3.00 MN Dead EndFrom:
To:
1.00 09/22/2015647
510 NA NAR
13-646 Guesses ForkTo:
2.00 09/22/2015647
Pounding Mill Branch 80 NA NAR
Dead End
0.80 ME Dead EndFrom:
To:
From:
0.80 09/22/2015648
Pounding Mill Branch 130 NA NAR
13-643 Hurley RdTo:
1.10 09/22/2015648
Laurel Fork 210 NA NAR
13-643 Hurley Rd
0.37 ME 13-643From:
To:
From:
0.37 09/22/2015649
Laurel Fork 49 NA NAR
Dead EndTo:
1.63 09/22/2015649
Home Creek Rd 830 1% 2% 0.1 880G 3% 1% C G
13-700 Thomas Mtn Rd
13-659 Left Fork Home Creek
93%
From:
To:
From:
2.34 0% 2015650
13-659 Old Home Creek Rd
0.533
Home Creek Rd 480 1% 2% 0.098 500G 3% 1% F G
13-651 S, Left Fork Lesters
93%
From:To:
6.09 0% 2015650 0.587
Lesters Fork Rd 990 1% 2% 0.094 1000G 3% 1% F G
13-643 Hurley Rd
93%To:
5.71 0% 2015650 0.515
Left Fork Lesters 890 NA NAR
13-650 Lesters Fork Rd
13-642 Elkins BranchFrom:
To:
From:
0.80 09/30/2015651
Left Fork Lesters 690 NA NAR
1.57 MN 13-642From:
To:
1.57 09/30/2015651
Left Fork Lesters 360 NA NAR
13-675 Brushey ForkFrom:
To:
0.13 09/30/2015651
Lt. Fk. Lesters 300 NA NAR
0.93 MN 13-675 Brushey ForkFrom:
To:
0.93 09/30/2015651
Lt. Fk. Lesters 310 NA NAR
13-650 Lesters Fork RdTo:
2.07 09/30/2015651
350 NA NAR
Dead End
13-643 SOUTHTo:
From:
1.25 09/15/2015652
165/2/2016

Virginia Department of TransportationTraffic Engineering Division
2015Annual Average Daily Traffic Volume Estimates By Section of Route
Buchanan Maintenance Area
Route AADT1Trail 2Trail
4TireK
QA2Axle 3+Axle
QC QKBusLength---------------Truck---------------
FactorAAWDT QW Year
Dir
Factor
610 NA NAR
13-643 NORTH
13-706 Lick CreekFrom:
To:
From:
0.90
Buchanan County
09/15/2015652
470 NA NAR
1.10 ME 13-706 Lick CreekFrom:
To:
1.10 09/22/2015652
310 NA NAR
2.09 ME 13-706 Lick CreekFrom:
To:
0.99 09/22/2015652
220 NA NAR
2.59 ME 13-706 Lick CreekFrom:
To:
0.50 09/22/2015652
190 NA NAR
West Virginia State LineTo:
4.01 09/22/2015652
Coon Branch 430 NA NAR
13-643 Hurley Rd
0.50 ME 13-643 Hurley RdFrom:
To:
From:
0.50 09/15/2015653
Coon Branch 340 NA NAR
13-709 Blacky ForkFrom:
To:
0.20 09/15/2015653
Coon Branch 120 NA NAR
Dead EndTo:
1.30 09/15/2015653
Spruce Pine 200 NA NAR
13-638 Dismal River Rd
1.00 MN 13-638From:
To:
From:
1.00 09/03/2015654
Spruce Pine 70 NA NAR
Dead EndTo:
1.10 09/03/2015654
Lynn Camp 420 NA NAR
US 460
4.55 ME US 460From:
To:
From:
4.55 09/24/2015655
Lynn Camp 46 NA NAR
Dead EndTo:
0.35 11/05/2007655
Looney Creek 110 NA NAR
US 460
13-677 WolfpenFrom:
To:
From:
3.00 09/11/2015656
Looney Creek 80 NA NAR
Dead EndTo:
0.90 09/11/2015656
Back Hurricane 680 NA NAR
13-600 Hurricane
0.85 MN 13-600 HurricaneFrom:
To:
From:
0.85 08/13/2015657
Back Hurricane 590 NA NAR
13-603 SOUTHFrom:
To:
0.45 08/18/2015657
Back Hurricane 470 NA NAR
13-603 NORTHFrom:
To:
0.50 08/18/2015657
Back Hurricane 420 NA NAR
13-620 Deskins RdTo:
5.30 08/18/2015657
Little Paw Paw 220 NA NAR
13-605 Russell Fork
3.09 MN 13-605 Russell ForkFrom:
To:
From:
3.09 08/18/2015658
Little Paw Paw 540 NA NAR
SR 83To:
0.91 08/18/2015658
Left Fork Home Creek 220 NA NAR
13-650 Home Creek Rd
0.80 MN 13-650 Home Creek RdFrom:
To:
From:
0.80 10/02/2015659
Left Fork Home Creek 160 NA NAR
Dead EndTo:
1.10 10/02/2015659
175/2/2016

Virginia Department of TransportationTraffic Engineering Division
2015Annual Average Daily Traffic Volume Estimates By Section of Route
Buchanan Maintenance Area
Route AADT1Trail 2Trail
4TireK
QA2Axle 3+Axle
QC QKBusLength---------------Truck---------------
FactorAAWDT QW Year
Dir
Factor
Long Branch 220 NA NAR
Dead End
13-624 Garden Creek RdTo:
From:
1.10
Buchanan County
08/13/2015660
Watkins Branch 220 NA NAR
Dead End
13-1010 Holland StFrom:
To:
From:
0.36
Town of Grundy
09/11/2015661
Watkins Branch 810 NA NAR
US 460To:
0.20 09/11/2015661
90 NA NAR
Dead End
0.30 MS Dead EndFrom:
To:
From:
0.30
Buchanan County
08/13/2015662
130 NA NAR
13-620 SOUTHFrom:
To:
0.90 08/13/2015662
13-620 N, Deskins Rd; Indian Gap Rd
Robinson Fork Rd 470 1% 0% 0.112 500G 3% 0% C G
13-624 Garden Creek Rd
95%To:
2.00 0% 2015662 0.519
Laurel Branch 140 NA NAR
13-605 Russell Fork
1.10 MS 13-605 Russell ForkFrom:
To:
From:
1.10 08/27/2015663
Laurel Branch 80 NA NAR
Dead EndTo:
0.75 08/27/2015663
Deel Fork 190 NA NAR
Dead End
13-609 King Solomon Colley RdTo:
From:
0.90 09/24/2015664
Rosin Camp 110 NA NAR
13-624 Garden Creek Rd
0.30 MN 13-624From:
To:
From:
0.30 08/13/2015665
Rosin Camp 60 NA NAR
Dead EndTo:
1.20 08/13/2015665
Mill Branch 1300 NA NAR
13-638 Dismal River Rd
Dead EndTo:
From:
2.10 09/03/2015666
Whitts Branch 140 NA NAR
Dead End
13-660 Long BranchTo:
From:
0.50 02/06/2008667
Little Garden 80 NA NAR
Dead End
13-624To:
From:
0.98 08/25/2015668
Garden School 80 NA NAR
13-624 Garden Creek Rd
Dead EndTo:
From:
0.10 12/18/2007669
Abners Fork Rd 60 NA NAR
Dead End
0.34 MN Dead EndFrom:
To:
From:
0.34 11/15/2007670
Abners Fork Rd 130 NA NAR
13-645To:
0.51 11/15/2007670
Davis Mtn 110 NA NAR
13-618 Fox Ridge Dr
13-671 Davis MtnFrom:
To:
From:
1.50 08/25/2015671
Davis Mtn 120 NA NAR
US 460To:
0.07 08/25/2015671
Copperhead 130 NA NAR
13-602
0.80 ME 13-602To:
From:
0.80 08/27/2015672
185/2/2016

Virginia Department of TransportationTraffic Engineering Division
2015Annual Average Daily Traffic Volume Estimates By Section of Route
Buchanan Maintenance Area
Route AADT1Trail 2Trail
4TireK
QA2Axle 3+Axle
QC QKBusLength---------------Truck---------------
FactorAAWDT QW Year
Dir
Factor
Copperhead 280 NA NAR
0.80 ME 13-602
SR 80To:
From:
1.25
Buchanan County
08/27/2015672
War Fork 110 NA NAR
SR 83
0.77 MS SR 83From:
To:
From:
0.77 08/27/2015673
War Fork 80 NA NAR
1.00 MS SR 83From:
To:
0.23 08/27/2015673
War Fork 20 NA NAR
Dead EndTo:
0.29 08/27/2015673
Upper Mill Branch 120 NA NAR
SR 83
Dead EndTo:
From:
1.70 09/15/2015674
Brushey Fork 90 NA NAR
Dead End
13-740 Davis ForkFrom:
To:
From:
0.50 11/15/2007675
Brushey Fork 140 NA NAR
0.70 MS 13-740 Davis ForkFrom:
To:
0.69 09/30/2015675
Brushey Fk 270 NA NAR
13-651 Left Fork LestersTo:
0.51 09/30/2015675
Race Fork 940 NA NAR
Dead End
1.37 MN Dead EndFrom:
To:
From:
1.37 09/22/2015676
Race Fork 370 NA NAR
13-643 Hurley RdTo:
0.69 09/22/2015676
Wolfpen 30 NA NAR
13-656 Looneys Creek
Dead EndTo:
From:
1.00 09/11/2015677
Patterson 50 NA NAR
13-641 Patterson
Dead EndTo:
From:
0.10 1986678
Jakes Branch 10 NA NAR
13-603
Dead EndTo:
From:
0.50 08/18/2015679
Contrary Creek Rd 5000 1% 1% 0.089 5300G 4% 7% C G
US 460
13-629 S, Aus Keen Rd
87%
From:To:
From:
0.65 0% 2015680 0.542
Contrary Creek Rd 4300 1% 1% 0.09 4500G 4% 7% F G
13-629 N, Aus Keen Rd
87%
From:
To:
2.48 0% 2015680 0.503
Contrary Creek Rd 3200 1% 1% 0.096 3400G 4% 7% F G
13-638 Dismail River Rd
87%To:
1.67 0% 2015680 0.558
Rockhouse 140 NA NAR
13-600 Hurricane
13-623 Council MtnTo:
From:
1.60 08/13/2015681
Mavisdale Hill Rd 190 NA NAR
Dead End
13-624 NORTHFrom:
To:
From:
0.10 12/18/2007682
13-624 SOUTH
Mavisdale Hill Rd 130 NA NAR
0.20 ME Dead EndTo:
0.20 03/05/2008682
Horn Branch 110 NA NAR
13-624
1.00 MN 13-624From:
To:
From:
1.00 08/20/2015683
Horn Branch 48 NA NAR
Dead EndTo:
0.25 02/06/2008683
195/2/2016

Virginia Department of TransportationTraffic Engineering Division
2015Annual Average Daily Traffic Volume Estimates By Section of Route
Buchanan Maintenance Area
Route AADT1Trail 2Trail
4TireK
QA2Axle 3+Axle
QC QKBusLength---------------Truck---------------
FactorAAWDT QW Year
Dir
Factor
Webb Branch 900 NA NAR
Dead End
US 460To:
From:
0.15
Buchanan County
04/07/2008684
Lower Big Branch 70 NA NAR
13-638 Dismal River Rd
0.10 MN 13-638From:
To:
From:
0.10 09/03/2015685
Lower Big Branch 70 NA NAR
Dead EndTo:
2.40 09/03/2015685
Booth Branch 260 NA NAR
SR 83
SR 83To:
From:
0.23 09/17/2015686
Yates St 270 NA NAR
13-688 Russell Hill
US 460To:
From:
0.03
Town of Grundy
09/11/2015687
Yates St 150 NA NAR
Dead End
13-687 Russell HillFrom:
To:
From:
0.25 01/14/2008688
Yates St 90 NA NAR
Dead EndTo:
0.16 01/14/2008688
Mimosa St 70 NA NAR
SR 83 Edgewater Dr
SR 83 Edgewater DrTo:
From:
0.15 09/17/2015689
Harrys Branch 150 NA NAR
13-638 Dismal River Rd
0.50 MW 13-638From:
To:
From:
0.50
Buchanan County
09/09/2015690
Harrys Branch 130 NA NAR
Dead EndTo:
1.00 09/09/2015690
350 NA NAR
13-645
13-699From:
To:
From:
0.35 10/02/2015691
280 NA NAR
Dead EndTo:
2.15 10/02/2015691
Combs Ridge 150 NA NAR
Dead End
13-602To:
From:
0.90 08/27/2015692
Crow Pass Rd 290 NA NAR
13-631 Middle Fork
Dead EndTo:
From:
1.35 09/24/2015693
Mill Creek 180 NA NAR
Dead End
13-697 Knox Creek; Cedar BranchTo:
From:
1.00 09/30/2015694
Cripple Bridge 150 NA NAR
Dead End
13-617 Little PraterTo:
From:
0.01 04/03/2008695
Funeral Home 70 NA NAR
13-730 Funeral Home
US 460To:
From:
0.35 08/25/2015696
Cedar Branch 720 1% 1% 0.11 760G 1% 0% F G
13-643 Hurley Rd
13-694 Mill Creek
97%
From:To:
From:
0.10 0% 2015697 0.513
Knox Creek 520 1% 1% 0.13 550G 1% 0% C G
Kentucky State Line
97%To:
2.50 0% 2015697 0.516
205/2/2016

Virginia Department of TransportationTraffic Engineering Division
2015Annual Average Daily Traffic Volume Estimates By Section of Route
Buchanan Maintenance Area
Route AADT1Trail 2Trail
4TireK
QA2Axle 3+Axle
QC QKBusLength---------------Truck---------------
FactorAAWDT QW Year
Dir
Factor
Garden Creek 80 NA NAR
13-624
Dead EndTo:
From:
0.02
Buchanan County
12/18/2007698
140 NA NAR
13-645
13-691To:
From:
0.50 10/02/2015699
1000 NA NAR
US 460
13-650 Home Creek RdFrom:
To:
From:
1.13 12/20/2007700
Thomas Mtn Rd 470 1% 3% 0.122 490G 2% 5% C G
13-645 Old Rocklick Rd
89%
From:
To:
1.34 0% 2015700
13-645
0.509
3700 NA NAR
13-733 State Line EstFrom:
To:
2.32 1992700
2100 NA NAR
Kentucky State LineTo:
0.45 1992700
Smith Branch 270 NA NAR
SR 83
1.00 MN SR 83From:
To:
From:
1.00 09/15/2015701
Smith Branch 190 NA NAR
Dead EndTo:
0.30 09/15/2015701
70 NA NAR
Dead End
13-624To:
From:
0.84 08/20/2015702
Davis Ridge 70 NA NAR
13-671 Davis Mtn
Dead EndTo:
From:
0.75 08/25/2015703
Peapatch 40 NA NAR
Dead End
13-616To:
From:
0.75 09/09/2015704
Little Fox 190 NA NAR
13-605 Russell Fork
2.00 ME 13-605 Russell ForkFrom:
To:
From:
2.00 08/18/2015705
Little Fox 130 NA NAR
Dead EndTo:
0.05 08/18/2015705
Lick Creek 30 NA NAR
13-652
Dead EndTo:
From:
1.00 09/15/2015706
Bear Branch 160 NA NAR
SR 83
Dead EndTo:
From:
1.45 08/27/2015707
Harman Junction 10 NA NAR
Dead End
0.30 ME Dead EndFrom:
To:
From:
0.30 12/10/2007708
Harman Junction 40 NA NAR
US 460To:
0.10 12/10/2007708
Blacky Fork 60 NA NAR
Dead End
13-653 Coon BranchTo:
From:
0.50 11/13/2007709
Loop Rd 70 NA NAR
Begin Loop
13-638 Dismal River RdTo:
From:
0.41 09/01/2015710
Upper Elk Creek 350 NA NAR
Kentucky State Line
2.75 ME of State LineTo:
From:
2.75 09/30/2015711
215/2/2016

Virginia Department of TransportationTraffic Engineering Division
2015Annual Average Daily Traffic Volume Estimates By Section of Route
Buchanan Maintenance Area
Route AADT1Trail 2Trail
4TireK
QA2Axle 3+Axle
QC QKBusLength---------------Truck---------------
FactorAAWDT QW Year
Dir
Factor
Upper Elk Creek 250 NA NAR
2.75 ME Of State Line
Dead EndTo:
From:
0.55
Buchanan County
09/30/2015711
Hollow Poplar 90 NA NAR
SR 80
Dead EndTo:
From:
0.72 08/13/2015712
Horn Mtn 30 NA NAR
13-628 Horn Mtn Rd
Dead EndTo:
From:
0.50 09/01/2015713
Little Greenbrier 90 NA NAR
Dead End
13-611 GreenbrierTo:
From:
0.04 12/12/2007714
Upper Big Branch 210 NA NAR
13-629 Big Branch Rd
13-638 Dismal River RdTo:
From:
4.30 09/03/2015715
Stone Coal Branch 260 NA NAR
SR 83
Dead EndTo:
From:
0.30 12/05/2007716
Vocational School 1500 NA NAR
SR 83
13-728 Hobbs BranchFrom:
To:
From:
0.03 09/15/2015717
Vocational School 670 NA NAR
Dead EndTo:
0.25 09/15/2015717
Airport Rd 660 NA NAR
SR 83
Dead EndTo:
From:
1.90 08/27/2015718
Mitchell Rd 47 NA NAR
Dead End
13-616To:
From:
0.90 09/17/2015719
Worm Branch 60 NA NAR
13-600 Hurricane
Dead EndTo:
From:
0.41 08/13/2015720
Needmore 80 NA NAR
US 460
13-723 Short GapFrom:
To:
From:
0.05 08/25/2015721
Needmore 40 NA NAR
Dead EndTo:
0.30 01/14/2008721
Mullins Rd 90 NA NAR
Dead End
13-680 Contrary Creek RdTo:
From:
0.27 02/21/2008722
Short Gap 20 NA NAR
Dead End
13-721 NeedmoreTo:
From:
0.05 01/14/2008723
20 NA NAR
Dead End
13-629To:
From:
0.07 02/21/2008724
Tookland 120 NA NAR
US 460
Dead EndTo:
From:
0.02 04/03/2008725
Grassy Creek 49 NA NAR
Dead End
US 460To:
From:
0.07 04/07/2008726
Grimsleyville 10 NA NAR
US 460
US 460To:
From:
0.23 09/01/2015727
225/2/2016

Virginia Department of TransportationTraffic Engineering Division
2015Annual Average Daily Traffic Volume Estimates By Section of Route
Buchanan Maintenance Area
Route AADT1Trail 2Trail
4TireK
QA2Axle 3+Axle
QC QKBusLength---------------Truck---------------
FactorAAWDT QW Year
Dir
Factor
Hobbs Branch 70 NA NAR
Dead End
1.30 MN Dead EndFrom:
To:
From:
1.30
Buchanan County
09/15/2015728
Hobbs Branch 860 NA NAR
13-717 Vocational SchoolTo:
0.66 09/15/2015728
Laurel Branch 120 NA NAR
SR 83
Dead EndTo:
From:
0.35 12/12/2007729
Funeral Home 180 NA NAR
Dead End
13-696 Funeral HomeFrom:
To:
From:
0.30 01/14/2008730
Funeral Home 190 NA NAR
US 460To:
0.10 08/25/2015730
Bill Young 30 NA NAR
Dead End
13-680 Contrary Creek RdTo:
From:
0.10 1992731
Vansant 200 NA NAR
Dead End
US 460To:
From:
0.08 04/07/2008732
State Line Est 40 NA NAR
US 460
13-700To:
From:
0.11 10/02/2015733
Hale Branch 270 NA NAR
Dead End
13-632 PageTo:
From:
0.15 04/07/2008734
Honaker Branch 120 NA NAR
13-680 Contrary Creek Rd
Dead EndTo:
From:
0.50 09/01/2015736
90 NA NAR
Cul-de-Sac
13-718 Airport Rd.To:
From:
0.67 10/02/2015737
Fowler Rd 90 NA NAR
13-728 Hobbs Branch
Dead EndTo:
From:
0.10 02/25/2008738
Davis Fork 80 NA NAR
13-675 Brushey Fork
Dead EndTo:
From:
0.25 11/15/2007740
Puncheon Camp 130 NA NAR
Dead End
0.15 MN Dead EndFrom:
To:
From:
0.15 09/30/2015745
Puncheon Camp 210 NA NAR
13-645To:
0.90 09/30/2015745
80 NA NAR
13-609
Dead EndTo:
From:
0.23 09/24/2015748
Strip Bench Rd 150 NA NAR
Dead End
13-718 Airport RdTo:
From:
0.60 08/27/2015750
Childress Branch 48 NA NAR
Dead End
US 460To:
From:
0.04 12/20/2007755
Childress Branch 40 NA NAR
US 460
Dead EndTo:
From:
0.12 04/07/2008759
235/2/2016

Virginia Department of TransportationTraffic Engineering Division
2015Annual Average Daily Traffic Volume Estimates By Section of Route
Buchanan Maintenance Area
Route AADT1Trail 2Trail
4TireK
QA2Axle 3+Axle
QC QKBusLength---------------Truck---------------
FactorAAWDT QW Year
Dir
Factor
Dicks Branch 30 NA NAR
13-619 Lee Master Dr
Dead EndTo:
From:
0.20
Buchanan County
01/16/2008760
Spruce Pine 100 NA NAR
13-608 Right Fork Greenbrier
Dead EndTo:
From:
1.06 10/02/2015765
Keen Mtn 380 NA NAR
SR 330 Keen Mountain Correctional Ctr Rd Sys
13-629To:
From:
1.85 09/01/2015800
45 NA NAR
Dead End
13-800 Keen Mtn.To:
From:
1.00 09/01/2015801
Stateline Ridge Rd 200 NA NAR
13-639 Compton Mtn Rd
Dead EndTo:
From:
2.23 09/03/2015838
Long Bottom 690 NA NAR
SR 83 Edgewater Dr
13-1002 W, Long BottomFrom:
To:
From:
0.01
Town of Grundy
09/17/20151001
Long Bottom 40 NA NAR
13-1008 Long BottomFrom:
To:
0.11 09/17/20151001
Long Bottom 46 NA NAR
13-1002 E, Long BottomTo:
0.08 09/17/20151001
Long Bottom 50 NA NAR
Dead End
13-1001 Long BottomFrom:
To:
From:
0.03 07/23/20011002
Long Bottom 300 NA NAR
13-1008 Long BottomFrom:
To:
0.06 09/17/20151002
Long Bottom 170 NA NAR
13-1001 Long BottomFrom:
To:
0.06 09/17/20151002
Long Bottom 130 NA NAR
Dead EndTo:
0.18 07/23/20011002
Walnut St 730 NA NAR
SR 83 Edgewater Dr
13-1004 Newhouse BranchFrom:
To:
From:
0.21 09/11/20151003
Walnut St 680 NA NAR
SR 83 Edgewater DrTo:
0.30 09/11/20151003
Newhouse Branch 290 NA NAR
13-1003 Walnut St
13-1011 McGlothlin StFrom:
To:
From:
0.14 09/11/20151004
13-1011 McGothlin St
Newhouse Branch 240 NA NAR
Dead EndTo:
0.76 09/11/20151004
Poetown Rd 620 NA NAR
US 460
US 460To:
From:
0.27 09/11/20151005
Grundy 860 NA NAR
13-1006 Riverside Dr
Dead EndTo:
From:
0.12 07/23/20011007
Long Bottom 48 NA NAR
13-1001 Long Bottom
13-1002 Long BottomTo:
From:
0.03 09/17/20151008
Levisa St 180 NA NAR
Dead End
13-615 Hoot Owl StTo:
From:
0.16 01/07/20081009
245/2/2016

Virginia Department of TransportationTraffic Engineering Division
2015Annual Average Daily Traffic Volume Estimates By Section of Route
Buchanan Maintenance Area
Route AADT1Trail 2Trail
4TireK
QA2Axle 3+Axle
QC QKBusLength---------------Truck---------------
FactorAAWDT QW Year
Dir
Factor
Holland St 30 NA NAR
13-661 Watkins Branch
Dead EndTo:
From:
0.04
Town of Grundy
01/14/20081010
McGlothlin St 70 NA NAR
Dead End
13-1004 Newhouse BranchTo:
From:
0.15 07/23/20011011
Depot Rd 200 NA NAR
US 460
Dead EndTo:
From:
0.04 19941012
Carter Rd 130 NA NAR
US 460
Dead EndTo:
From:
0.09
Buchanan County
04/07/20081013
Deel 150 NA NAR
Dead End
US 460To:
From:
0.04 04/03/20081020
20 NA NAR
Dead End
US 460To:
From:
0.04 02/25/20081025
Council Park 70 NA NAR
Dead End
SR 80To:
From:
0.38 08/25/20151030
Keen Mtn Camp 10 NA NAR
Dead End
13-1106 Keen Mtn CampFrom:
To:
From:
0.17 12/18/20071101
Keen Mtn Camp 90 NA NAR
13-1105 Keen Mtn CampFrom:
To:
0.04 08/25/20151101
Keen Mtn Camp 190 NA NAR
13-1104 Keen Mtn CampFrom:
To:
0.03 08/25/20151101
Keen Mtn Camp 200 NA NAR
13-1103 Keen Mtn CampFrom:
To:
0.04 08/25/20151101
Keen Mtn Camp 220 NA NAR
13-1102 Keen Mtn CampFrom:
To:
0.04 08/25/20151101
Keen Mtn Camp 400 NA NAR
US 460To:
0.06 08/25/20151101
Keen Mtn. Camp 120 NA NAR
Dead End
13-1101 Keen Mtn CampTo:
From:
0.04 12/18/20071102
Keen Mtn. Camp 100 NA NAR
Dead End
13-1101 Keen Mtn CampTo:
From:
0.06 12/18/20071103
Keen Mtn. Camp 40 NA NAR
Dead End
13-1101 Keen Mtn CampTo:
From:
0.06 12/18/20071104
Keen Mtn. Camp 20 NA NAR
Dead End
13-1101 Keen Mtn CampTo:
From:
0.07 12/18/20071105
Keen Mtn. Camp 60 NA NAR
Dead End
13-1101 Keen Mtn CampTo:
From:
0.06 12/18/20071106
Grundy High 1100 NA NAR
Cul-de-Sac
SR 83 Edgewater DrTo:
From:
0.41 09/30/20159000
820 NA NAN
Dickenson County Line
Buchanan CL; 13-606To:
From:
250.30 08/26/2003607
255/2/2016