just the facts data on teen pregnancy, childbearing, sexual activity, and contraceptive use a report...
TRANSCRIPT

Just the FactsData on Teen Pregnancy, Childbearing, Sexual Activity, and
Contraceptive Use
A Report from the National Campaign to Prevent Teen Pregnancy

Campaign Director
Sarah Brown
Alexine Clement Jackson
National President, YMCA of the USA
Judith E. Jones
Clinical Professor, Columbia University
School of Public Health
Leslie Kantor
Vice President of Education,
Planned Parenthood of New York City, Inc.
Nancy Kassebaum Baker
Former U.S. Senator
Douglas Kirby
Senior Research Scientist,
ETR Associates
John D. Macomber
Principal, JDM Investment Group
Sister Mary Rose McGeady
President and Chief Executive Officer,
Covenant House
Jody Greenstone Miller
Venture Partner, MAVERON, LLC
Chairman
Thomas H. Kean
Former Governor of New Jersey and
President, Drew University
Carol Mendez Cassell
Director, Community Coalition Partnership Program
for the Prevention of Teen Pregnancy, CDC
Linda Chavez
President, Center for Equal Opportunity
Annette Cumming
Executive Director and
Vice President, The Cumming Foundation
William Galston
Professor
School of Public Affairs, University of Maryland
David Gergen
Editor-at-Large, U.S. News & World Report
Whoopi Goldberg
Actress
Katharine Graham
Chairman of the Executive Committee,
The Washington Post Company
David A. Hamburg, M.D.
President Emeritus,
Carnegie Corporation of New York
President
Isabel V. Sawhill
Senior Fellow,
The Brookings Institution
John E. Pepper
Chairman, Board of Directors,
Procter & Gamble Company
Bruce Rosenblum
Executive Vice President, Television,
Warner Brothers
Stephen W. Sanger
Chairman and Chief Executive Officer,
General Mills, Inc.
Victoria P. Sant
President, The Summit Foundation
Kurt L. Schmoke
Former Mayor of Baltimore
and Partner, Wilmer, Cutler and Pickering
Judy Woodruff
Prime Anchor and Senior Correspondent, CNN
Andrew Young
Former Ambassador to the U.N. and
Co-Chairman, GoodWorks International
Trustees EmeritiCharlotte Beers
Chairman, J. Walter Thompson
Irving B. Harris
Chairman, The Harris Foundation
Barbara Huberman
Director of Training, Advocates for Youth
Sheila Johnson
Executive Vice President of
Corporate Affairs, BET, Inc.
C. Everett Koop, M.D.
Former U.S. Surgeon General
Judy McGrath
President, MTV
Kristin Moore
President, Child Trends, Inc.
Hugh Price
President, National Urban League, Inc.
Warren B. Rudman
Former U.S. Senator and Partner,
Paul, Weiss, Rifkind, Wharton & Garrison
Isabel Stewart
National Executive Director, Girls Inc.
National Campaign Board of Directors

The National Campaign gratefully acknowledges its many funders, particularly the Charles Stewart Mott Foundation for its
support of the Campaign’s research program. Special thanks also go to the David and Lucile Packard Foundation, the Robert
Wood Johnson Foundation, the Summit Foundation, and the William and Flora Hewlett Foundation for generously supporting
all of the Campaign’s activities, and to the Turner Foundation for its support of National Campaign publications.
© 2000 by the National Campaign to Prevent Teen Pregnancy. All rights reserved.
ISBN 1-58671-031-1
Acknowledgments
Part I: Teen Pregnancy
Statistics

Definition of Terms
• Pregnancy Rate – number of pregnancies ÷ population, usually multiplied by 1,000. Example – pregnancy rate for teens 15-19, 1996 (from the Alan Guttmacher Institute):
• Proportion of Pregnancies Ending in Birth, Abortion, or Miscarriage – number of births, abortions, or miscarriages ÷ number of pregnancies, multiplied by 100. Example – proportion of pregnancies to teens 15-19, 1996 (from the Alan Guttmacher Institute), that ended in birth:
880,170 pregnancies
9,043,000 girls aged 15-19
= 0.0973 × 1,000 = 97.3 per 1,000
491,577 births
880,170 pregnancies
= 0.56 × 100 = 56 percent
(This statistic can also be calculated using rates instead of numbers.)
Just the Facts (October 2000) – Page 5

Data Sources
• The Alan Guttmacher Institute (AGI), usually through special reports or its journal Family Planning Perspectives;
• The National Center for Health Statistics (NCHS), Centers for Disease Control and Prevention (CDC), U.S. Department of Health and Human Services (DHHS), usually through its periodical Vital and Health Statistics; and
• The National Center for Chronic Disease Prevention and Health Promotion (NCCDPHP), CDC, DHHS, usually through CDC’s periodical Morbidity and Mortality Weekly Reports.
Teen pregnancy data are released by three national groups:
Just the Facts (October 2000) – Page 6
80
85
90
95
100
105
110
115
120
1990 1991 1992 1993 1994 1995 1996 1997
NCHS, 2000
AGI, 1999
NCCDPHP, 2000
NCCDPHP, 1998
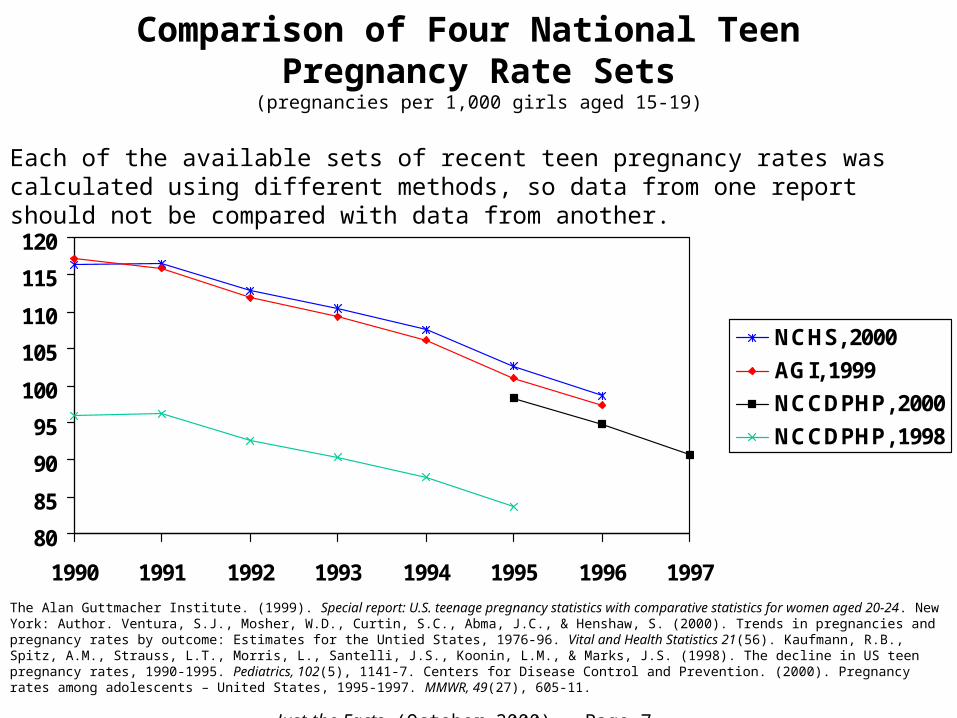
The Alan Guttmacher Institute. (1999). Special report: U.S. teenage pregnancy statistics with comparative statistics for women aged 20-24. New York: Author. Ventura, S.J., Mosher, W.D., Curtin, S.C., Abma, J.C., & Henshaw, S. (2000). Trends in pregnancies and pregnancy rates by outcome: Estimates for the Untied States, 1976-96. Vital and Health Statistics 21(56). Kaufmann, R.B., Spitz, A.M., Strauss, L.T., Morris, L., Santelli, J.S., Koonin, L.M., & Marks, J.S. (1998). The decline in US teen pregnancy rates, 1990-1995. Pediatrics, 102(5), 1141-7. Centers for Disease Control and Prevention. (2000). Pregnancy rates among adolescents – United States, 1995-1997. MMWR, 49(27), 605-11.
Each of the available sets of recent teen pregnancy rates was calculated using different methods, so data from one report should not be compared with data from another.
Just the Facts (October 2000) – Page 7
Comparison of Four National Teen Pregnancy Rate Sets
(pregnancies per 1,000 girls aged 15-19)

Calculation Methods for Four Pregnancy Rate Sets
Estimated based on the NSFG*
Reported by states to CDC, national rates include estimate for states that don’t report, state rates are by occurrence
NCHS birth data
NCCDPHP, 2000
Not includedReported by states to CDC, national rates include estimate for states that don’t report, report does not provide state rates
NCHS birth data
NCCDPHP, 1998
Estimated based on the NSFG*
AGI abortion provider surveys, report does not provide state rates
NCHS birth data
NCHS, 2000
20% of births + 10% of abortions
AGI abortion provider surveys, state rates are by residence
NCHS birth data
AGI, 1999
MiscarriageAbortionBirth
* - not the same method. The Alan Guttmacher Institute. (1999). Teenage pregnancy: Overall trends and state-by-state information. New York: Author. The Alan Guttmacher Institute. (1999). Special report: U.S. teenage pregnancy statistics with comparative statistics for women aged 20-24. New York: Author. Ventura, S.J., Mosher, W.D., Curtin, S.C., Abma, J.C., & Henshaw, S. (2000). Trends in pregnancies and pregnancy rates by outcome: Estimates for the Untied States, 1976-96. Vital and Health Statistics 21(56). Kaufmann, R.B., Spitz, A.M., Strauss, L.T., Morris, L., Santelli, J.S., Koonin, L.M., & Marks, J.S. (1998). The decline in US teen pregnancy rates, 1990-1995. Pediatrics, 102(5), 1141-7. Centers for Disease Control and Prevention. (2000). Pregnancy rates among adolescents – United States, 1995-1997. MMWR, 49(27), 605-11.
Just the Facts (October 2000) – Page 8

Data Availability
---------------- - Asian- and Native American girls aged 15-19
------------1986-96 - married and unmarried teens aged 15-19
----1990-951995---- - sexually experienced teens aged 15-17 and 18-19
----1990-9519951986-96 - sexually experienced teens aged 15-19
--------1990-96---- - White, Black, and Hispanic girls aged 10-14, 15-17, and
18-19
--------1990-961990-96 - White, Black, and Hispanic girls aged 15-19
1995-97----1976-961973-96 - girls aged 14 and younger
1995-971990-951976-961972-96 - girls aged 15-19, 15-17, and 18-19
National pregnancy rates:
CDC, 2000
CDC, 1998
NCHS, 2000
AGI, 1999
The following table summarizes which data are available from each data set.
Just the Facts (October 2000) – Page 9

Data Availability, Continued
---------------- - Asian- and Native American girls aged 15-19
---------------- - married and unmarried teens aged 15-19
---------------- - sexually experienced teens aged 15-17 and 18-19
---------------- - sexually experienced teens aged 15-19
--------1996---- - White, Black, and Hispanic girls aged 10-14, 15-17, and
18-19
--------1996---- - White, Black, and Hispanic girls aged 15-19
1995-97----1976-961973-96 - girls aged 14 and younger
1995-971990-951976-961972-96 - girls aged 15-19, 15-17, and 18-19
National counts of pregnancies:
CDC, 2000
CDC, 1998
NCHS, 2000
AGI, 1999
Just the Facts (October 2000) – Page 10

Data Availability, Continued
1995-97*
--------1996 - girls aged 15-17 and 18-19
State counts of pregnancies:
------------1996 - girls aged 15-19, 15-17, and 18-19
1995-97*
------------ - White and Black girls aged 15-19
1995-97*
------------ - girls aged 14 and younger
1995-97*
--------1985, 88, 92, 96
- girls aged 15-19
State pregnancy rates:
CDC, 2000
CDC, 1998
NCHS, 2000
AGI, 1999
* - data are not available for every state.
Just the Facts (October 2000) – Page 11

Data from State Health Departments
• Birth data collected by the state health department, which can be slightly different than state birth data reported by the U.S. Department of Health and Human Services;
• Abortion data collected by the state health department, usually for residents only; and
• “Fetal loss” data – late-term miscarriages.
Approximately one-half of state health departments also release pregnancy rates. Generally,
these rates are not comparable to any of the available national rates, nor are they comparable to
each other since each state uses its own calculation method. These state-level teen pregnancy
rates typically include:
Also, many states use age brackets not available in any national pregnancy rate set, such as girls
aged 10-17 or 13-19.
Just the Facts (October 2000) – Page 12

When are teen pregnancy data released?
• Unlike birth rates, pregnancy rates are not released on any set schedule.
• Rates often lag several years behind: for example, AGI released 1992 rates in 1997, and NCHS released 1996 rates in 2000.
• All rates are dependent on CDC abortion data (AGI uses the age distribution of abortions reported to CDC in its calculations). For the past few years, preliminary data on abortions for a given year have been released by CDC two full years after – i.e., preliminary abortion data for 1996 were released in December 1998, and preliminary data for 1997 were released in January 2000. For the previous three years, final data were released in July or August of the following year (i.e., final 1996 data were released in July 1999), but this was not the case in 2000 – as of October 2000, final 1997 abortion data have not yet been released.
• In addition, rate sets that use the National Survey of Family Growth (NSFG) to estimate miscarriages are presumably reliant on current NSFG data. The next NSFG is scheduled to take place in 2002.
Just the Facts (October 2000) – Page 13

Teen Pregnancy Statistics from The Alan Guttmacher Institute

Number of Teen Pregnancies, 1996 (AGI)
Nearly 1 million teen pregnancies occurred in 1996. To put it another way, more than 100 U.S. teens become pregnant each hour. Forty percent of these pregnancies were to girls under age 18, and 60 percent were to girls aged 18-19.
The Alan Guttmacher Institute. (1999). Special report: U.S. teenage pregnancy statistics with comparative statistics for women aged 20-24. New York: Author.
under 153%
15-1737%
18-1960%542,640
337,530 24,830
Total: 905,000
Just the Facts (October 2000) – Page 15

Teen Pregnancy Rates, Girls Aged 15-19 (AGI)(number of pregnancies per 1,000 girls)
117.1
97.3
106.6
111.0
95.1
80
85
90
95
100
105
110
115
120
1972 1974 1976 1978 1980 1982 1984 1986 1988 1990 1992 1994 1996
After increasing 23 percent between 1972 and 1990 (including 10 percent between 1987 and 1990), the teen pregnancy rate for girls aged 15-19 decreased 17 percent between 1990 and 1996.
The Alan Guttmacher Institute. (1999). Special report: U.S. teenage pregnancy statistics with comparative statistics for women aged 20-24. New York: Author.
Just the Facts (October 2000) – Page 16

117.1
97.395.1
62.4 61.574.3
145.8172.6
152.6
40
60
80
100
120
140
160
180
1972 1974 1976 1978 1980 1982 1984 1986 1988 1990 1992 1994 1996
Older teens (aged 18-19) have a teen pregnancy rate that is more than twice as high as the rate for younger teens (aged 15-17). While the teen pregnancy rate for girls aged 15-19 decreased 17 percent between 1990 and 1996, the rate for older teens declined 12 percent and the rate for younger teens declined 17 percent.
The Alan Guttmacher Institute. (1999). Special report: U.S. teenage pregnancy statistics with comparative statistics for women aged 20-24. New York: Author.
Girls Aged 18-19
Girls Aged 15-19
Girls Aged 15-17
Just the Facts (October 2000) – Page 17
Teen Pregnancy Rates, Age Subgroups (AGI)(number of pregnancies per 1,000 girls)

Teen Pregnancy Rates, Girls Aged 15-17 (AGI)(number of pregnancies per 1,000 girls)
74.4
69.6
61.5
72.5
62.4
50
55
60
65
70
75
80
1972 1974 1976 1978 1980 1982 1984 1986 1988 1990 1992 1994 1996
After increasing 19 percent between 1972 and 1989 (including 7 percent between 1986 and 1989), the teen pregnancy rate for girls aged 15-17 decreased 17 percent between 1989 and 1996 to its lowest rate ever recorded.
The Alan Guttmacher Institute. (1999). Special report: U.S. teenage pregnancy statistics with comparative statistics for women aged 20-24. New York: Author.
Just the Facts (October 2000) – Page 18

Teen Pregnancy Rates, Girls Aged 18-19 (AGI)(number of pregnancies per 1,000 girls)
165.7
174.8
152.6
160.0
145.8
130
135
140
145
150
155
160
165
170
175
180
1972 1974 1976 1978 1980 1982 1984 1986 1988 1990 1992 1994 1996
After increasing 20 percent between 1972 and 1991 (including 9 percent between 1987 and 1991), the teen pregnancy rate for girls aged 18-19 decreased 13 percent between 1991 and 1996.
The Alan Guttmacher Institute. (1999). Special report: U.S. teenage pregnancy statistics with comparative statistics for women aged 20-24. New York: Author.
Just the Facts (October 2000) – Page 19

Teen Pregnancy Rates, Girls Under 15 (AGI)(number of pregnancies per 1,000 girls)
13.3
17.6
13.5
10
11
12
13
14
15
16
17
18
1973 1975 1977 1979 1981 1983 1985 1987 1989 1991 1993 1995
After increasing 30 percent between 1973 and 1988, the teen pregnancy rate for girls aged 14 or younger decreased 24 percent between 1988 and 1996 to the lowest rate ever recorded.
Note: denominator used is the population of girls aged 14. The Alan Guttmacher Institute. (1999). Special report: U.S. teenage pregnancy statistics with comparative statistics for women aged 20-24. New York: Author.
Just the Facts (October 2000) – Page 20

87.3
66.1
224.3178.9175.1
163.4 164.6
0
40
80
120
160
200
240
1990 1991 1992 1993 1994 1995 1996
Teen pregnancy rates vary substantially among the three largest racial/ethnic subgroups. Between 1990 and 1996, the rate for African-American teens declined 20 percent and the rate for non-Hispanic White teens declined 24 percent. The teen pregnancy rate for Hispanics increased between 1990 and 1994, but then declined 6 percent between 1994 and 1996.
Darroch, J.E., & Singh, S. (1999). Why is teenage pregnancy declining? The roles of abstinence, sexual activity and contraceptive use. Occasional Report 1. New York: The Alan Guttmacher Institute.
Non-Hispanic Black
Hispanic (any race)
Non-Hispanic White
Just the Facts (October 2000) – Page 21
Teen Pregnancy Rates, Racial/Ethnic Subgroups (AGI)
(number of pregnancies per 1,000 girls aged 15-19)

189.5
224.3210.7
97.3106.7
117.1
80
110
140
170
200
230
260
1986 1987 1988 1989 1990 1991 1992 1993 1994 1995 1996
Teen Pregnancy Rates, Sexually Experienced Teens (AGI)
(number of pregnancies per 1,000 sexually experienced girls aged 15-19)
Sexually Experienced Teens
All Teens
The pregnancy rate for sexually experienced teens is higher than the overall teen pregnancy rate because it is calculated by dividing the same number of pregnancies by the number of teens who are sexually experienced (about one-half of all teen girls). While the teen pregnancy rate for all girls aged 15-19 decreased 17 percent between 1990 and 1996, the rate for sexually experienced teens declined 16 percent.
Just the Facts (December 2000) – Page 22
The Alan Guttmacher Institute. (1999). Teenage pregnancy: Overall trends and state-by-state information. New York: Author.

432.5
534.7
454.2
350
380
410
440
470
500
530
560
1986 1987 1988 1989 1990 1991 1992 1993 1994 1995 1996
Teen Pregnancy Rates, Married Teens (AGI)(number of pregnancies per 1,000 married girls aged 15-19)
Note: Marital status used is status at outcome, not status at conception. Darroch, J.E., & Singh, S. (1999). Why is teenage pregnancy declining? The roles of abstinence, sexual activity and contraceptive use. Occasional Report 1. New York: The Alan Guttmacher Institute.
After increasing 18 percent between 1986 and 1990, the teen pregnancy rate for married girls aged 15-19 (as measured at pregnancy outcome) decreased 19 percent between 1990 and 1996.
Just the Facts (October 2000) – Page 23

86.1
96.4
84.1
50
60
70
80
90
100
1986 1987 1988 1989 1990 1991 1992 1993 1994 1995 1996Note: Marital status used is status at outcome, not status at conception. Darroch, J.E., & Singh, S. (1999). Why is teenage pregnancy declining? The roles of abstinence, sexual activity and contraceptive use. Occasional Report 1. New York: The Alan Guttmacher Institute.
After increasing 12 percent between 1986 and 1990, the teen pregnancy rate for unmarried girls aged 15-19 (as measured at pregnancy outcome) decreased 12 percent between 1990 and 1996.
Just the Facts (October 2000) – Page 24
Teen Pregnancy Rates, Unmarried Teens (AGI)
(number of pregnancies per 1,000 unmarried girls aged 15-19)

miscarriage14%
birth56%
abortion30%
In 1996, just over one-half of teen pregnancies ended in birth, about one-third ended in abortion, and 14 percent ended in miscarriage.
The Alan Guttmacher Institute. (1999). Special report: U.S. teenage pregnancy statistics with comparative statistics for women aged 20-24. New York: Author.
491,577
124,700
263,890
Just the Facts (December 2000) – Page 25
Pregnancy Outcomes, Teens 15-19, 1996 (AGI)

0%
10%
20%
30%
40%
50%
60%
70%
80%
90%
100%
1972 1974 1976 1978 1980 1982 1984 1986 1988 1990 1992 1994 1996
birth miscarriage abortion
The proportion of pregnancies ending in birth decreased in the 1970s, remained at just below 50 percent through the early- to mid-1980s, then began increasing in the late 1980s so that throughout the 1990s the majority of teen pregnancies ended in birth.
The Alan Guttmacher Institute. (1999). Special report: U.S. teenage pregnancy statistics with comparative statistics for women aged 20-24. New York: Author.
Just the Facts (October 2000) – Page 26
Pregnancy Outcomes, Teens 15-19 (AGI)

491,577
305,856
185,721
11,148
124,700
77,130
47,570
3,270
263,890
159,650
104,240
10,410
0% 20% 40% 60% 80% 100%
15-19
18-19
15-17
under 15
birth miscarriage abortion
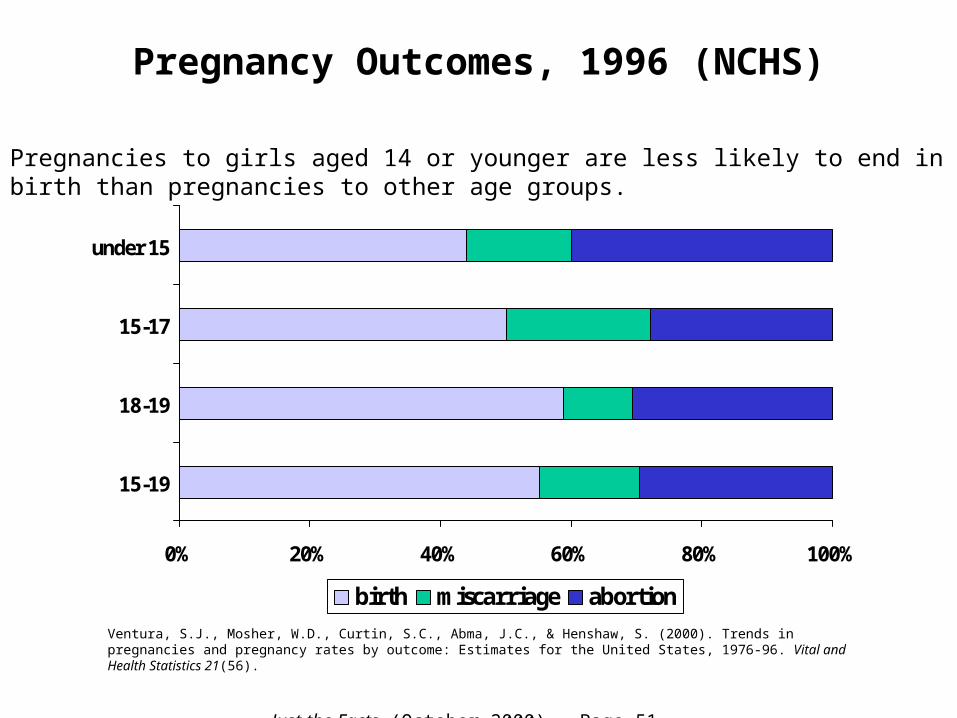
Pregnancies to girls aged 14 or younger are less likely to end in birth than pregnancies to other age groups.
The Alan Guttmacher Institute. (1999). Special report: U.S. teenage pregnancy statistics with comparative statistics for women aged 20-24. New York: Author.
Just the Facts (October 2000) – Page 27
Pregnancy Outcomes, 1996 (AGI)

0%
10%
20%
30%
40%
50%
60%
70%
80%
90%
100%
1973 1975 1977 1979 1981 1983 1985 1987 1989 1991 1993 1995
birth miscarriage abortion
The proportion of pregnancies (to girls under age 15) ending in birth decreased in the 1970s, remained at about one-third through the early 1980s, then began increasing in the mid-1980s so that throughout the 1990s over 40 percent of pregnancies to girls under 15 ended in birth.
The Alan Guttmacher Institute. (1999). Special report: U.S. teenage pregnancy statistics with comparative statistics for women aged 20-24. New York: Author.
Just the Facts (October 2000) – Page 28
Pregnancy Outcomes, Girls under Age 15 (AGI)

0%
20%
40%
60%
80%
100%
1972 1974 1976 1978 1980 1982 1984 1986 1988 1990 1992 1994 1996
birth miscarriage abortion
The proportion of pregnancies (to teens aged 15-17) ending in birth decreased in the 1970s, remained at just below 50 percent through the early- to mid-1980s, then began increasing in the late 1980s so that throughout the 1990s the majority of pregnancies to teens 15-17 ended in birth.
The Alan Guttmacher Institute. (1999). Special report: U.S. teenage pregnancy statistics with comparative statistics for women aged 20-24. New York: Author.
Just the Facts (October 2000) – Page 29
Pregnancy Outcomes, Teens Aged 15-17 (AGI)

0%
20%
40%
60%
80%
100%
1972 1974 1976 1978 1980 1982 1984 1986 1988 1990 1992 1994 1996
birth miscarriage abortion
The proportion of pregnancies (to teens 18-19) ending in birth decreased in the 1970s, remained at about 50 percent through early- to mid-1980s, then began increasing in the late 1980s so that throughout the 1990s the majority of pregnancies to teens 18-19 ended in birth.
The Alan Guttmacher Institute. (1999). Special report: U.S. teenage pregnancy statistics with comparative statistics for women aged 20-24. New York: Author.
Just the Facts (October 2000) – Page 30
Pregnancy Outcomes, Teens Aged 18-19 (AGI)

101.8
91.4
37.6
24.2
24.6
9.4
38.6
62.9
19.1
0% 20% 40% 60% 80% 100%
Hispanic
Non-Hispanic Black
Non-Hispanic White
birth miscarriage abortion
Hispanic teens are most likely, and non-Hispanic Black teens least likely, to have a pregnancy that ends in a birth.
Darroch, J.E., & Singh, S. (1999). Why is teenage pregnancy declining? The roles of abstinence, sexual activity and contraceptive use. Occasional Report 1. New York: The Alan Guttmacher Institute.
Just the Facts (October 2000) – Page 31
Pregnancy Outcomes, Teens Aged 15-19, 1996 (AGI)
(number of pregnancies per 1,000 girls aged 15-19)

108-140 per 1,000
65-85 per 1,000
95-106 per 1,000
86-90 per 1,000
50-62 per 1,000
The Alan Guttmacher Institute. (1999). Teenage pregnancy: Overall trends and state-by-state information. New York: Author.
Teen pregnancy rates vary widely by state, ranging from 50 per 1,000 in North Dakota to 140 per 1,000 in Nevada.
Just the Facts (October 2000) – Page 32
State Teen Pregnancy Rates, 1996 (AGI)(pregnancies per 1,000 girls aged 15-19)
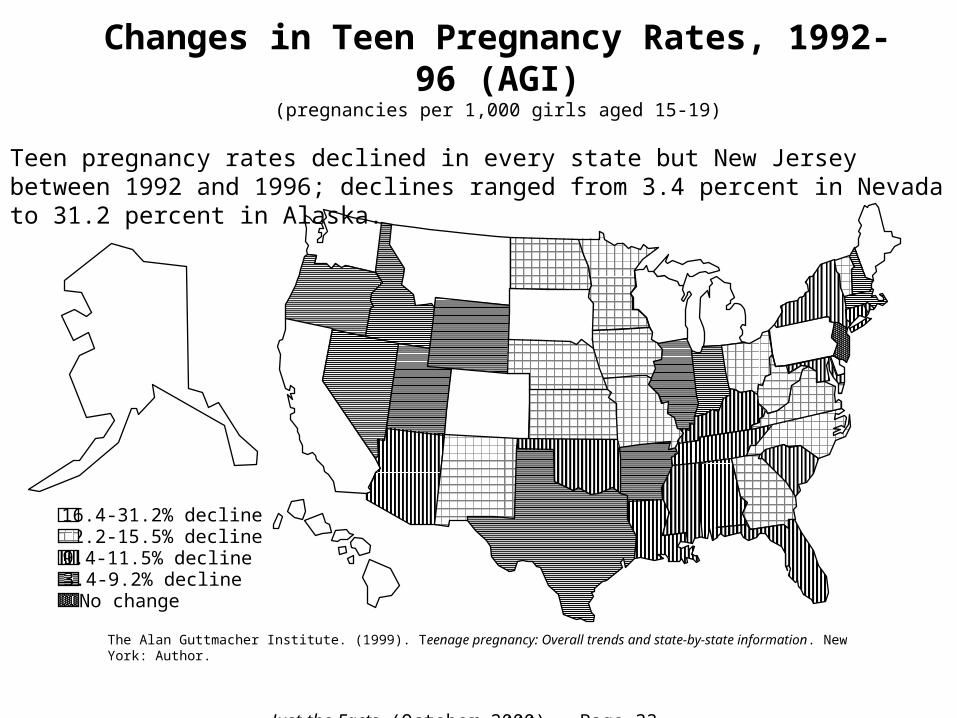
Teen pregnancy rates declined in every state but New Jersey between 1992 and 1996; declines ranged from 3.4 percent in Nevada to 31.2 percent in Alaska.
The Alan Guttmacher Institute. (1999). Teenage pregnancy: Overall trends and state-by-state information. New York: Author.
12.2-15.5% decline16.4-31.2% decline
9.4-11.5% decline
No change3.4-9.2% decline
Just the Facts (October 2000) – Page 33
Changes in Teen Pregnancy Rates, 1992-96 (AGI)
(pregnancies per 1,000 girls aged 15-19)
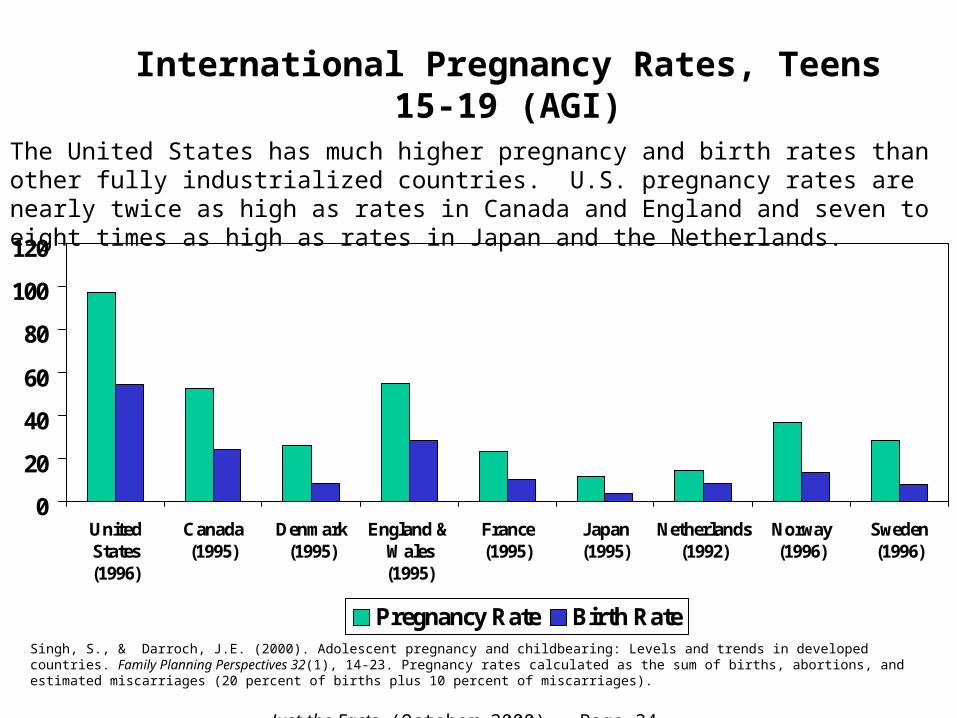
International Pregnancy Rates, Teens 15-19 (AGI)
0
20
40
60
80
100
120
UnitedStates(1996)
Canada(1995)
Denmark(1995)
England &Wales(1995)
France(1995)
Japan(1995)
Netherlands(1992)
Norway(1996)
Sweden(1996)
Pregnancy Rate Birth RateSingh, S., & Darroch, J.E. (2000). Adolescent pregnancy and childbearing: Levels and trends in developed countries. Family Planning Perspectives 32(1), 14-23. Pregnancy rates calculated as the sum of births, abortions, and estimated miscarriages (20 percent of births plus 10 percent of miscarriages).
The United States has much higher pregnancy and birth rates than other fully industrialized countries. U.S. pregnancy rates are nearly twice as high as rates in Canada and England and seven to eight times as high as rates in Japan and the Netherlands.
Just the Facts (October 2000) – Page 34

Alternate Teen Pregnancy Statistics from the National Center for Health Statistics
(NCHS), Centers for Disease Control and Prevention, U.S.
Department of Health and Human Services

Nearly 1 million teen pregnancies occurred in 1996. To put it another way, more than 100 U.S. teens become pregnant each hour. Forty-three percent of these pregnancies were to girls under age 18, and 57 percent were to girls aged 18-19.
Ventura, S.J., Mosher, W.D., Curtin, S.C., Abma, J.C., & Henshaw, S. (2000). Trends in pregnancies and pregnancy rates by outcome: Estimates for the United States, 1976-96. Vital and Health Statistics 21(56).
under 153%
15-1740%
18-1957%521,000
372,000 26,000
Total: 919,000
Just the Facts (October 2000) – Page 36
Number of Teen Pregnancies, 1996 (NCHS)

Among teens aged 15-19, more pregnancies occur to non-Hispanic White teens than to any other racial/ethnic group. Non-Hispanic White teens account for almost one-half of all teen pregnancies, non-Hispanic Black teens for just over one-quarter, Hispanic teens for 20 percent, and teens of other origins account for the final six percent of all teen pregnancies.
Other (non-Hispanic)
6%
Hispanic20%
non-Hispanic Black27%
non-Hispanic White47%
416,000
183,00052,000
Total: 919,000
242,000
Ventura, S.J., Mosher, W.D., Curtin, S.C., Abma, J.C., & Henshaw, S. (2000). Trends in pregnancies and pregnancy rates by outcome: Estimates for the United States, 1976-96. Vital and Health Statistics 21(56).
Just the Facts (October 2000) – Page 37
Number of Teen Pregnancies, 1996 (NCHS)(Girls Aged 15-19)

Among girls under 15, non-Hispanic Black teens account for 46 percent, non-Hispanic White teens for 27 percent, Hispanic teens for 19 percent, and teens of other backgrounds 8 percent of all pregnancies. Among teens aged 15-17 and 18-19, non-Hispanic White teens account for about one-half of all pregnancies, non-Hispanic Black teens for just over one-quarter, Hispanic teens for approximately 20 percent, and teens of other backgrounds 4 to 8 percent of all teen pregnancies.
253,000
163,000
7,000
136,000
106,000
12,000
110,000
74,000
5,0002,000
29,000
22,000
0% 20% 40% 60% 80% 100%
18-19
15-17
under 15
non-Hispanic White non-Hispanic Black other (non-Hispanic) Hispanic
Ventura, S.J., Mosher, W.D., Curtin, S.C., Abma, J.C., & Henshaw, S. (2000). Trends in pregnancies and pregnancy rates by outcome: Estimates for the United States, 1976-96. Vital and Health Statistics 21(56).
Just the Facts (October 2000) – Page 38
Number of Teen Pregnancies, 1996 (NCHS)

110.0
104.7
98.7
116.5
101.4
80
85
90
95
100
105
110
115
120
1976 1978 1980 1982 1984 1986 1988 1990 1992 1994 1996
After increasing 15 percent between 1976 and 1991 (including 11 percent between 1986 and 1991), the teen pregnancy rate for girls aged 15-19 decreased 15 percent between 1991 and 1996.
Ventura, S.J., Mosher, W.D., Curtin, S.C., Abma, J.C., & Henshaw, S. (2000). Trends in pregnancies and pregnancy rates by outcome: Estimates for the United States, 1976-96. Vital and Health Statistics 21(56).
Just the Facts (October 2000) – Page 39
Teen Pregnancy Rates, Girls Aged 15-19 (NCHS)
(number of pregnancies per 1,000 girls)

116.5
101.4 98.7
67.8
79.8
69.4
167.2
148.9 146.4
50
70
90
110
130
150
170
1976 1978 1980 1982 1984 1986 1988 1990 1992 1994 1996
Older teens (aged 18-19) have a teen pregnancy rate that is more than twice as high as the rate for younger teens (aged 15-17). While the teen pregnancy rate for girls aged 15-19 decreased 15 percent between 1991 and 1996, the rate for older teens declined 12 percent and the rate for younger teens declined 15 percent.
Girls Aged 18-19
Girls Aged 15-19
Girls Aged 15-17
Ventura, S.J., Mosher, W.D., Curtin, S.C., Abma, J.C., & Henshaw, S. (2000). Trends in pregnancies and pregnancy rates by outcome: Estimates for the United States, 1976-96. Vital and Health Statistics 21(56).
Just the Facts (December 2000) – Page 40
Teen Pregnancy Rates, Age Subgroups (NCHS)
(number of pregnancies per 1,000 girls)

69.4
80.3
67.869.873.2
50
55
60
65
70
75
80
85
1976 1978 1980 1982 1984 1986 1988 1990 1992 1994 1996
After increasing 16 percent between 1976 and 1990 (including 15 percent between 1986 and 1990), the teen pregnancy rate for girls aged 15-17 decreased 16 percent between 1990 and 1996 to its lowest rate ever recorded.
Ventura, S.J., Mosher, W.D., Curtin, S.C., Abma, J.C., & Henshaw, S. (2000). Trends in pregnancies and pregnancy rates by outcome: Estimates for the United States, 1976-96. Vital and Health Statistics 21(56).
Just the Facts (October 2000) – Page 41
Teen Pregnancy Rates, Girls Aged 15-17 (NCHS)
(number of pregnancies per 1,000 girls)

154.8
162.2
153.5
150.8
167.2
148.9
130
135
140
145
150
155
160
165
170
1976 1978 1980 1982 1984 1986 1988 1990 1992 1994 1996
After increasing 13 percent between 1976 and 1991 (including 8 percent between 1987 and 1991), the teen pregnancy rate for girls aged 18-19 decreased 10 percent between 1991 and 1996.
Ventura, S.J., Mosher, W.D., Curtin, S.C., Abma, J.C., & Henshaw, S. (2000). Trends in pregnancies and pregnancy rates by outcome: Estimates for the United States, 1976-96. Vital and Health Statistics 21(56).
Just the Facts (October 2000) – Page 42
Teen Pregnancy Rates, Girls Aged 18-19 (NCHS)
(number of pregnancies per 1,000 girls)

3.6
3.1
2.8
3.2
2.00
2.25
2.50
2.75
3.00
3.25
3.50
3.75
1976 1978 1980 1982 1984 1986 1988 1990 1992 1994 1996
After increasing 16 percent between 1982 and 1985 and remaining constant between 1985 and 1986, the teen pregnancy rate for girls aged 14 or younger decreased 22 percent between 1986 and 1996 to the lowest rate ever recorded.
Note: denominator used is the population of girls aged 10-14. Ventura, S.J., Mosher, W.D., Curtin, S.C., Abma, J.C., & Henshaw, S. (2000). Trends in pregnancies and pregnancy rates by outcome: Estimates for the United States, 1976-96. Vital and Health Statistics 21(56).
Just the Facts (October 2000) – Page 43
Teen Pregnancy Rates, Girls Under 15 (NCHS)
(number of pregnancies per 1,000 girls)
87.4
68.1
221.3177.8
167.8
155.8 157.1
0
40
80
120
160
200
240
1990 1991 1992 1993 1994 1995 1996
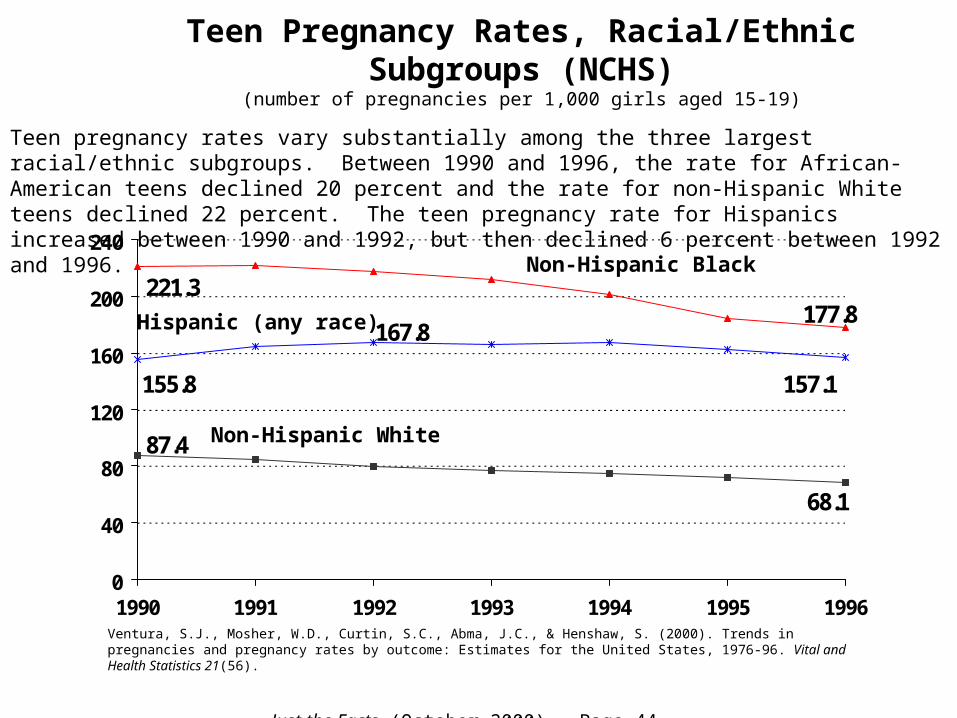
Teen pregnancy rates vary substantially among the three largest racial/ethnic subgroups. Between 1990 and 1996, the rate for African-American teens declined 20 percent and the rate for non-Hispanic White teens declined 22 percent. The teen pregnancy rate for Hispanics increased between 1990 and 1992, but then declined 6 percent between 1992 and 1996.
Non-Hispanic Black
Hispanic (any race)
Non-Hispanic White
Ventura, S.J., Mosher, W.D., Curtin, S.C., Abma, J.C., & Henshaw, S. (2000). Trends in pregnancies and pregnancy rates by outcome: Estimates for the United States, 1976-96. Vital and Health Statistics 21(56).
Just the Facts (October 2000) – Page 44
Teen Pregnancy Rates, Racial/Ethnic Subgroups (NCHS)
(number of pregnancies per 1,000 girls aged 15-19)

56.343.9
165.0128.1
113.9101.0 105.0
0
40
80
120
160
200
1990 1991 1992 1993 1994 1995 1996
Teen pregnancy rates vary substantially among the three largest racial/ethnic subgroups. Between 1990 and 1996, the rate for African-American and non-Hispanic White teens both declined 22 percent. The teen pregnancy rate for Hispanics was 4 percent higher in 1996 than it was in 1990 because it increased between 1990 and 1994 and only then began to decrease (8 percent between 1994 and 1996).
Non-Hispanic Black
Hispanic (any race)
Non-Hispanic White
Ventura, S.J., Mosher, W.D., Curtin, S.C., Abma, J.C., & Henshaw, S. (2000). Trends in pregnancies and pregnancy rates by outcome: Estimates for the United States, 1976-96. Vital and Health Statistics 21(56).
Just the Facts (October 2000) – Page 45
Teen Pregnancy Rates, Girls Aged 15-17, Racial/Ethnic Subgroups (NCHS)
(number of pregnancies per 1,000 girls)
126.4
105.6
295.3
254.4251.6
231.4 235.4
80
120
160
200
240
280
320
1990 1991 1992 1993 1994 1995 1996
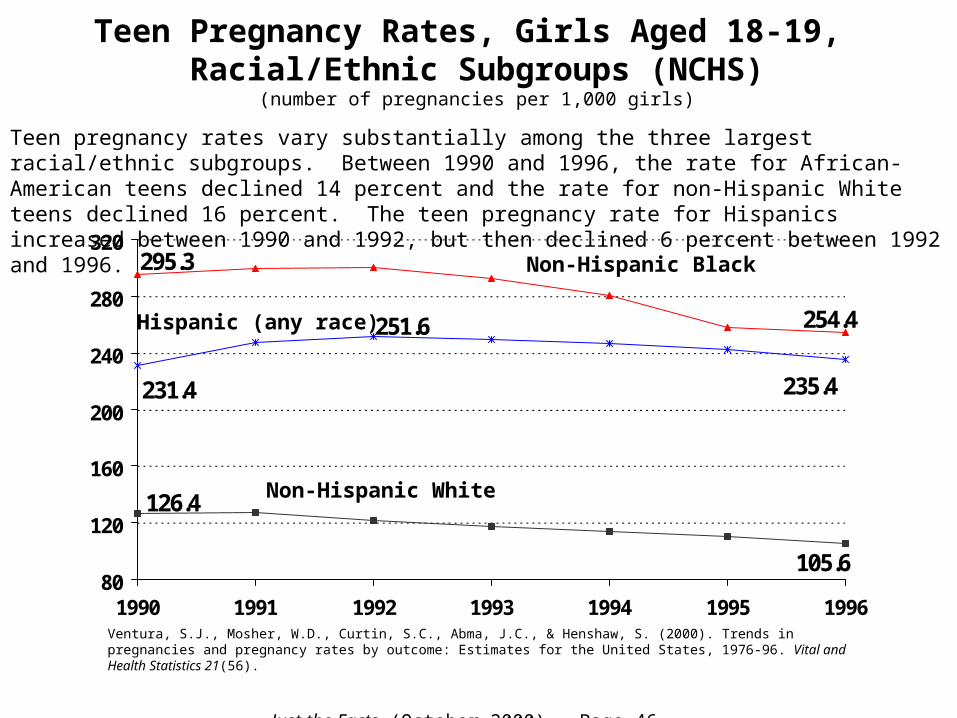
Teen pregnancy rates vary substantially among the three largest racial/ethnic subgroups. Between 1990 and 1996, the rate for African-American teens declined 14 percent and the rate for non-Hispanic White teens declined 16 percent. The teen pregnancy rate for Hispanics increased between 1990 and 1992, but then declined 6 percent between 1992 and 1996.
Non-Hispanic Black
Hispanic (any race)
Non-Hispanic White
Ventura, S.J., Mosher, W.D., Curtin, S.C., Abma, J.C., & Henshaw, S. (2000). Trends in pregnancies and pregnancy rates by outcome: Estimates for the United States, 1976-96. Vital and Health Statistics 21(56).
Just the Facts (October 2000) – Page 46
Teen Pregnancy Rates, Girls Aged 18-19, Racial/Ethnic Subgroups (NCHS)
(number of pregnancies per 1,000 girls)

1.5
1.1
11.8
8.7
4.5
4.0 4.3
0
2
4
6
8
10
12
14
1990 1991 1992 1993 1994 1995 1996
Teen pregnancy rates vary substantially among the three largest racial/ethnic subgroups. Between 1990 and 1996, the rate for African-American teens declined 20 percent and the rate for non-Hispanic White teens declined 22 percent. The teen pregnancy rate for Hispanics increased between 1990 and 1992, but then declined 6 percent between 1993 and 1996.
Non-Hispanic Black
Hispanic (any race)
Non-Hispanic White
Note: denominator used is the population of girls aged 10-14. Ventura, S.J., Mosher, W.D., Curtin, S.C., Abma, J.C., & Henshaw, S. (2000). Trends in pregnancies and pregnancy rates by outcome: Estimates for the United States, 1976-96. Vital and Health Statistics 21(56).
Just the Facts (October 2000) – Page 47
Teen Pregnancy Rates, Girls Aged 10-14, Racial/Ethnic Subgroups (NCHS)
(number of pregnancies per 1,000 girls)
184163
305 291
156
314
72142
326
0
90
180
270
360
non-Hispanic White non-Hispanic Black Hispanic
all teens aged 15-19
sexually experienced teens aged 15-19
teens aged 15-19 sexually active in the past year
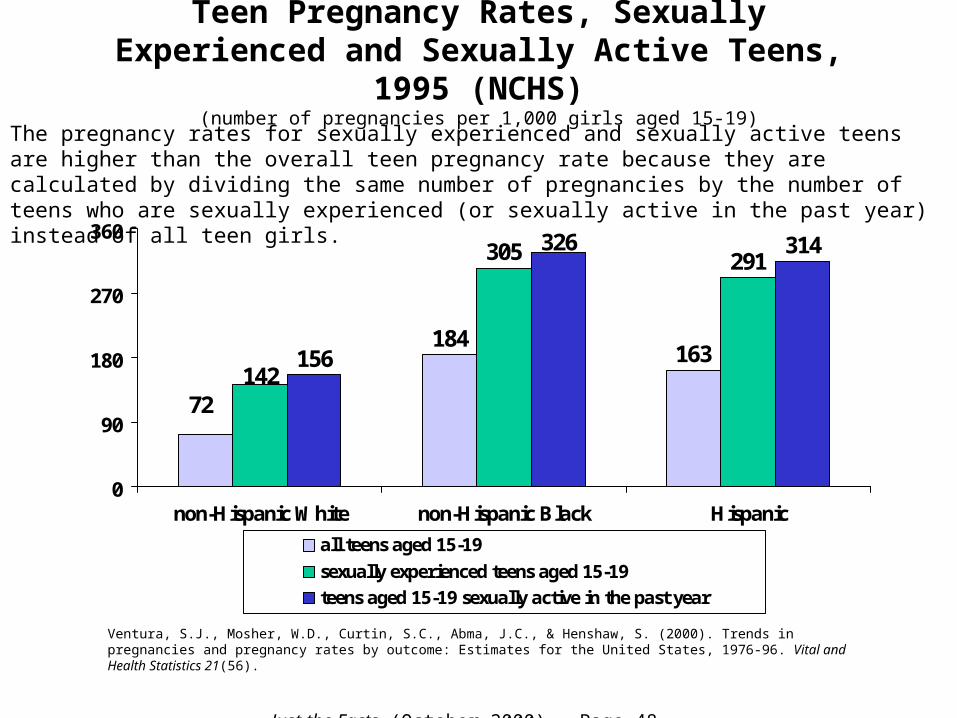
The pregnancy rates for sexually experienced and sexually active teens are higher than the overall teen pregnancy rate because they are calculated by dividing the same number of pregnancies by the number of teens who are sexually experienced (or sexually active in the past year) instead of all teen girls.
Ventura, S.J., Mosher, W.D., Curtin, S.C., Abma, J.C., & Henshaw, S. (2000). Trends in pregnancies and pregnancy rates by outcome: Estimates for the United States, 1976-96. Vital and Health Statistics 21(56).
Just the Facts (October 2000) – Page 48
Teen Pregnancy Rates, Sexually Experienced and Sexually Active Teens,
1995 (NCHS)(number of pregnancies per 1,000 girls aged 15-19)
miscarriage15%
birth55%
abortion30%
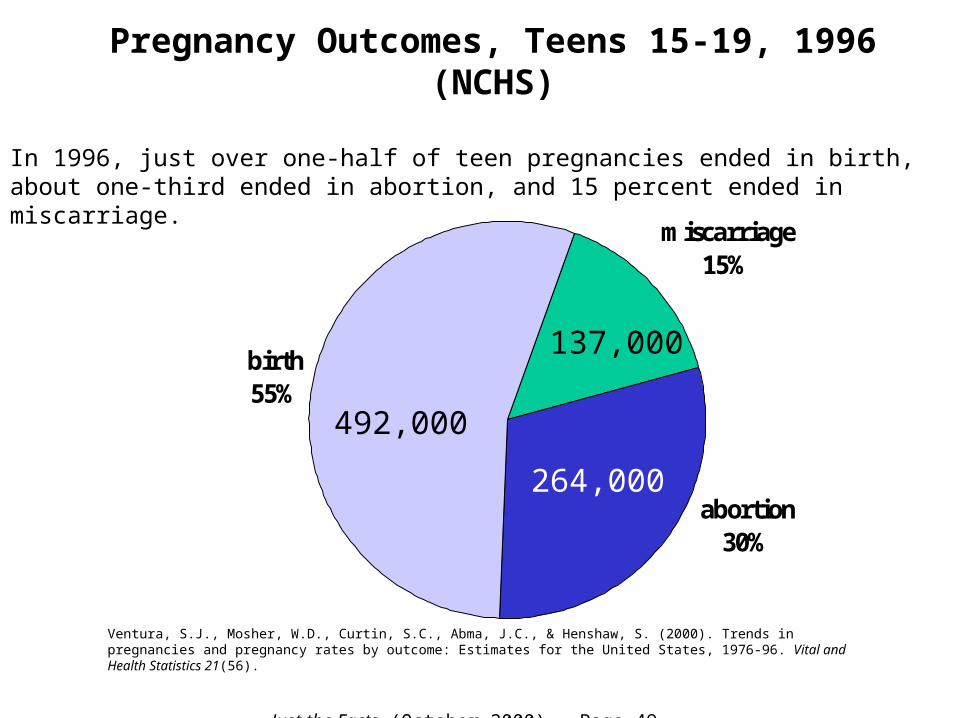
In 1996, just over one-half of teen pregnancies ended in birth, about one-third ended in abortion, and 15 percent ended in miscarriage.
Ventura, S.J., Mosher, W.D., Curtin, S.C., Abma, J.C., & Henshaw, S. (2000). Trends in pregnancies and pregnancy rates by outcome: Estimates for the United States, 1976-96. Vital and Health Statistics 21(56).
137,000
492,000
264,000
Just the Facts (October 2000) – Page 49
Pregnancy Outcomes, Teens 15-19, 1996 (NCHS)

0%10%20%30%40%50%60%70%80%90%
100%
1976 1980 1982 1984 1986 1988 1990 1992 1994 1996
abortionmiscarriagebirth
The proportion of teen pregnancies ending in birth was just under one-half for most of the 1980s, but increased slightly in the late 80s and early 90s so that the majority of pregnancies ended in birth.
Ventura, S.J., Mosher, W.D., Curtin, S.C., Abma, J.C., & Henshaw, S. (2000). Trends in pregnancies and pregnancy rates by outcome: Estimates for the United States, 1976-96. Vital and Health Statistics 21(56).
Just the Facts (October 2000) – Page 50
Pregnancy Outcomes, Teens 15-19 (NCHS)
0% 20% 40% 60% 80% 100%
15-19
18-19
15-17
under 15
birth miscarriage abortion
Pregnancies to girls aged 14 or younger are less likely to end in birth than pregnancies to other age groups.
Ventura, S.J., Mosher, W.D., Curtin, S.C., Abma, J.C., & Henshaw, S. (2000). Trends in pregnancies and pregnancy rates by outcome: Estimates for the United States, 1976-96. Vital and Health Statistics 21(56).
Just the Facts (October 2000) – Page 51
Pregnancy Outcomes, 1996 (NCHS)
0% 20% 40% 60% 80% 100%
Hispanic
Non-Hispanic Black
Non-Hispanic White
birth miscarriage abortion
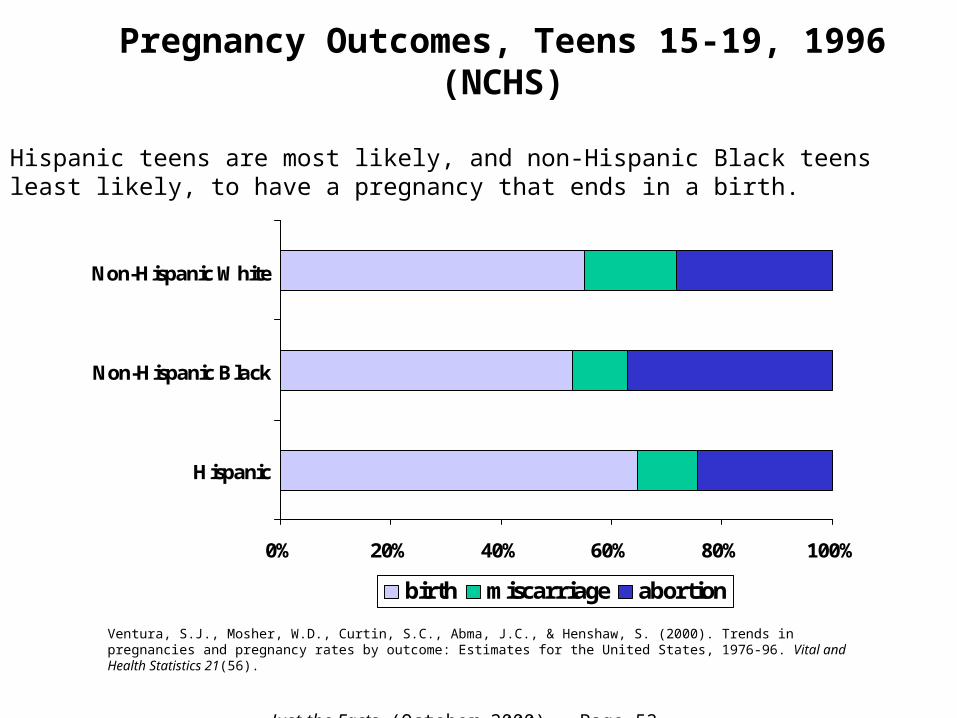
Hispanic teens are most likely, and non-Hispanic Black teens least likely, to have a pregnancy that ends in a birth.
Ventura, S.J., Mosher, W.D., Curtin, S.C., Abma, J.C., & Henshaw, S. (2000). Trends in pregnancies and pregnancy rates by outcome: Estimates for the United States, 1976-96. Vital and Health Statistics 21(56).
Just the Facts (October 2000) – Page 52
Pregnancy Outcomes, Teens 15-19, 1996 (NCHS)

Alternate Teen Pregnancy Statistics from the National Center for Chronic Disease
Prevention and Health Promotion (NCCDPHP), Centers for
Disease Control and Prevention, U.S. Department of Health and
Human Services

Number of Teen Pregnancies, 1997 (NCCDPHP)
Over eight-hundred-thousand teen pregnancies occurred in 1997. To put it another way, more than 95 U.S. teens become pregnant each hour. Forty percent of these pregnancies were to girls under age 18, and 60 percent were to girls aged 18-19.
Centers for Disease Control and Prevention. (2000). National and state-specific pregnancy rates among adolescents – United States, 1995-1997. MMWR, 49(27), 605-11.
under 153%
15-1737%
18-1960%518,800
321,300 23,700
Total: 840,000
Just the Facts (October 2000) – Page 54

94.3 90.798.3
60.5 57.163.9
142.7147.8151.4
40
70
100
130
160
190
1995 1996 1997
Older teens (aged 18-19) have a teen pregnancy rate that is more than twice as high as the rate for younger teens (aged 15-17). While the teen pregnancy rate for girls aged 15-19 decreased 8 percent between 1995 and 1997, the rate for older teens declined 6 percent and the rate for younger teens declined 11 percent.
Girls Aged 18-19
Girls Aged 15-19
Girls Aged 15-17
Centers for Disease Control and Prevention. (2000). National and state-specific pregnancy rates among adolescents – United States, 1995-1997. MMWR, 49(27), 605-11.
Just the Facts (October 2000) – Page 55
Teen Pregnancy Rates, Age Subgroups (NCCDPHP)
(number of pregnancies per 1,000 girls)

Teen Pregnancy Rates, Girls Under 15 (NCCDPHP)
(number of pregnancies per 1,000 girls)
6.46.8
7.2
0
2
4
6
8
10
1995 1996 1997
The teen pregnancy rate for girls aged 14 or younger decreased 11 percent between 1995 and 1997.
Note: denominator used is the population of girls aged 13-14. Centers for Disease Control and Prevention. (2000). National and state-specific pregnancy rates among adolescents – United States, 1995-1997. MMWR, 49(27), 605-11.
Just the Facts (October 2000) – Page 56

State Teen Pregnancy Rates, 1997 (NCCDPHP)
(pregnancies per 1,000 girls aged 15-19)
Centers for Disease Control and Prevention. (2000). National and state-specific pregnancy rates among adolescents – United States, 1995-1997. MMWR, 49(27), 605-11.
Teen pregnancy rates vary widely by state, ranging from 48 per 1,000 in North Dakota to 128 per 1,000 in Delaware.
98-128 per 1,00082-96 per 1,00065-79 per 1,000
data not reported48-64 per 1,000
Just the Facts (October 2000) – Page 57

Centers for Disease Control and Prevention. (2000). National and state-specific pregnancy rates among adolescents – United States, 1995-1997. MMWR, 49(27), 605-11.
0.3-1.8% increase0.8-5.8% decrease5.9-7.5% decrease
data not available7.7-19.8% decrease
Changes in Teen Pregnancy Rates, 1995-97 (NCCDPHP)
(pregnancies per 1,000 girls aged 15-19)
Teen pregnancy rates declined in every state but Connecticut and Utah between 1995 and 1997; declines ranged from 0.8 percent in Minnesota to 19.8 percent in Maryland.
Just the Facts (October 2000) – Page 58

Number of Teen Pregnancies, 1995 (NCCDPHP)
Kaufmann, R.B., Spitz, A.M., Strauss, L.T., Morris, L., Santelli, J.S., Koonin, L.M., & Marks, J.S. (1998). The decline in US teen pregnancy rates, 1990-1995. Pediatrics, 102(5), 1141-7.
18-1961%
15-1739%
542,640
337,530
Total:735,751
Over seven hundred thousand teen pregnancies occurred in 1995. Thirty-nine percent of these pregnancies were to girls aged 15-17 and 60 percent were to girls aged 18-19.
Just the Facts (October 2000) – Page 59

96.2
83.6
95.9
54.362.8
144.7
129.2
138.3
50
70
90
110
130
150
1990 1991 1992 1993 1994 1995
Older teens (aged 18-19) have a teen pregnancy rate that is more than twice as high as the rate for younger teens (aged 15-17). While the teen pregnancy rate for girls aged 15-19 decreased 13 percent between 1990 and 1995, the rate for older teens declined 7 percent and the rate for younger teens declined 14 percent.
Girls Aged 18-19
Girls Aged 15-19
Girls Aged 15-17
Kaufmann, R.B., Spitz, A.M., Strauss, L.T., Morris, L., Santelli, J.S., Koonin, L.M., & Marks, J.S. (1998). The decline in US teen pregnancy rates, 1990-1995. Pediatrics, 102(5), 1141-7.
Just the Facts (October 2000) – Page 60
Teen Pregnancy Rates, Age Subgroups (NCCDPHP)
(number of pregnancies per 1,000 girls)

164.6
174.6
83.6
95.9
60
90
120
150
180
210
1990 1991 1992 1993 1994 1995
Sexually Experienced Teens
All Teens
The pregnancy rate for sexually experienced teens is higher than the overall teen pregnancy rate because it is calculated by dividing the same number of pregnancies by the number of teens who are sexually experienced (about one-half of all teen girls). While the teen pregnancy rate for all girls aged 15-19 decreased 13 percent between 1990 and 1995, the rate for sexually experienced teens declined 6 percent.
Kaufmann, R.B., Spitz, A.M., Strauss, L.T., Morris, L., Santelli, J.S., Koonin, L.M., & Marks, J.S. (1998). The decline in US teen pregnancy rates, 1990-1995. Pediatrics, 102(5), 1141-7.
Just the Facts (October 2000) – Page 61
Teen Pregnancy Rates, Sexually Experienced Teens (NCCDPHP)
(number of pregnancies per 1,000 sexually experienced girls aged 15-19)

83.6
164.6
199.1 210.6
129.2
54.3
182.6142.9
219.1
0
50
100
150
200
250
15-17 18-19 15-19
all teens
sexually experienced teens
teens sexually active in the past three months
The pregnancy rates for sexually experienced and sexually active teens are higher than the overall teen pregnancy rate because they are calculated by dividing the same number of pregnancies by the number of teens who are sexually experienced (or sexually active in the past three months) instead of all teen girls.
Kaufmann, R.B., Spitz, A.M., Strauss, L.T., Morris, L., Santelli, J.S., Koonin, L.M., & Marks, J.S. (1998). The decline in US teen pregnancy rates, 1990-1995. Pediatrics, 102(5), 1141-7.
Just the Facts (October 2000) – Page 62
Teen Pregnancy Rates, Sexually Experienced and Sexually Active Teens, 1995 (NCCDPHP)
(number of pregnancies per 1,000 girls)

0% 20% 40% 60% 80% 100%
15-19
18-19
15-17
birth abortion
Nearly 70 percent of teen pregnancies end in a birth.
Note: these pregnancy rates do not include estimates of miscarriage. Kaufmann, R.B., Spitz, A.M., Strauss, L.T., Morris, L., Santelli, J.S., Koonin, L.M., & Marks, J.S. (1998). The decline in US teen pregnancy rates, 1990-1995. Pediatrics, 102(5), 1141-7.
Just the Facts (October 2000) – Page 63
Pregnancy Outcomes, 1995 (NCCDPHP)
0%10%20%30%40%50%60%70%80%90%
100%
1990 1992 1994
abortionbirth
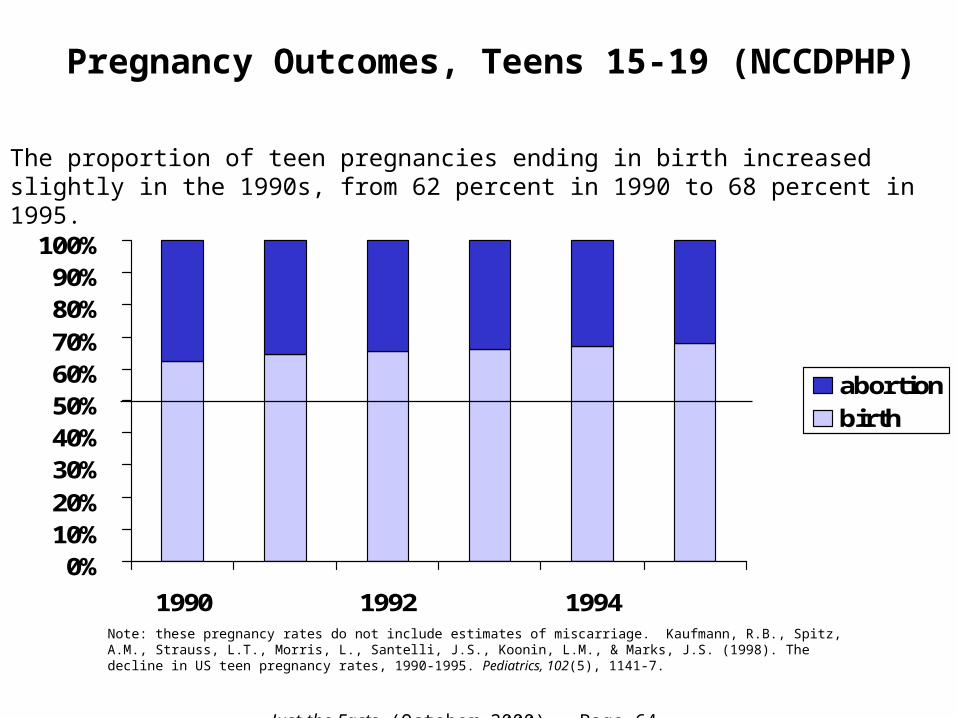
The proportion of teen pregnancies ending in birth increased slightly in the 1990s, from 62 percent in 1990 to 68 percent in 1995.
Note: these pregnancy rates do not include estimates of miscarriage. Kaufmann, R.B., Spitz, A.M., Strauss, L.T., Morris, L., Santelli, J.S., Koonin, L.M., & Marks, J.S. (1998). The decline in US teen pregnancy rates, 1990-1995. Pediatrics, 102(5), 1141-7.
Just the Facts (October 2000) – Page 64
Pregnancy Outcomes, Teens 15-19 (NCCDPHP)

Part II: Teen Birth Statistics

Definition of Terms
• Birth Rate – number of births ÷ population, usually multiplied by 1,000. Example – birth rate for teens 15-19, 1998:
• Proportion of Teen Births to Unmarried Teens – number of births to unmarried teens ÷ total number of births in the same age group, multiplied by 100. Example – proportion of births to teens 15-19, 1998, that were to unmarried teens:
• Proportion of All Births that are to Teens – number of teen births ÷ total number of births to women of all ages. Example – proportion of all births in 1998 that were to girls under 20:
484,895 births
9,493,761 girls aged 15-19
= 0.0511 × 1,000 = 51.1 per 1,000
380,868 births to unmarried teens
484,895 births to teens
= 0.785 × 100 = 78.5 percent
Just the Facts (October 2000) – Page 66
494,357 births to girls under 20
3,941,553 total births
= 0.125 × 100 = 12.5 percent
Data Sources
• Teen birth data are usually released by the National Center for Health Statistics (NCHS), Centers for Disease Control and Prevention (CDC), U.S. Department of Health and Human Services (DHHS).
• For the past few years, birth data have been released in two waves. Preliminary data for the previous year are released in the Fall (so preliminary data for 1998 were released in October 1999, for example). Final data are released the next Spring (final 1998 birth data were released in March 2000). The preliminary report is based on a subset of birth records (97.6 percent in 1999) and contains less detail than the final report. Both preliminary and final reports have typically been released through NCHS’s monthly periodical, National Vital Statistics Reports.
Just the Facts (October 2000) – Page 67

Data Sources, Continued
• Some data, such as state-level rates for racial/ethnic subgroups, are not included in the standard final report. These data are published through special reports, released sporadically through NCHS’s National Vital Statistics Reports. Recent titles of interest include “Nonmarital Childbearing in the United States, 1940-99” and “Variations in Teenage Birth Rates, 1991-98: National and State Trends.”
• Another source of data from NCHS is its report, Vital Statistics of the United States.
• Finally, depending on what data has been released by NCHS in special reports, Child Trends’ “Facts at a Glance” may be the best source for certain information, such as the proportion of teen births that are out-of-wedlock, by race and state.
Just the Facts (October 2000) – Page 68

Data Sources, Continued
• Many states also release birth data. Some states use age groups that aren’t used by the federal government, such as ages 10-17 or 13-19. For these states, rates from the state should not be compared with federal rates.
• Even among states that use the same age ranges as the federal government, slight variations may exist. For example, the California Department of Health Services published a 1997 birth rate for California teens aged 15-19 of 56.7 per 1,000, while NCHS published a rate of 57.3. It is unclear whether such differences are due to different population estimates or different counts of births (either due to different treatment of birth certificates with missing data or different policies on births to out-of-state residents).
Just the Facts (October 2000) – Page 69

Number of Teen Births, 1999*
Nearly one-half million teen births occurred in 1999. To put it another way, more than 55 U.S. teens give birth each hour. Thirty-six percent of these births were to girls under age 18, and 64 percent were to girls aged 18-19.
* Data for 1999 are preliminary. Curtin, S.C., & Martin, J.A. (2000). Births: Preliminary data for 1999. National Vital Statistics Reports 48(14).
under 152%
15-1734%
18-1964%
312,186
163,559 9,049
Total: 484,794
Just the Facts (October 2000) – Page 70
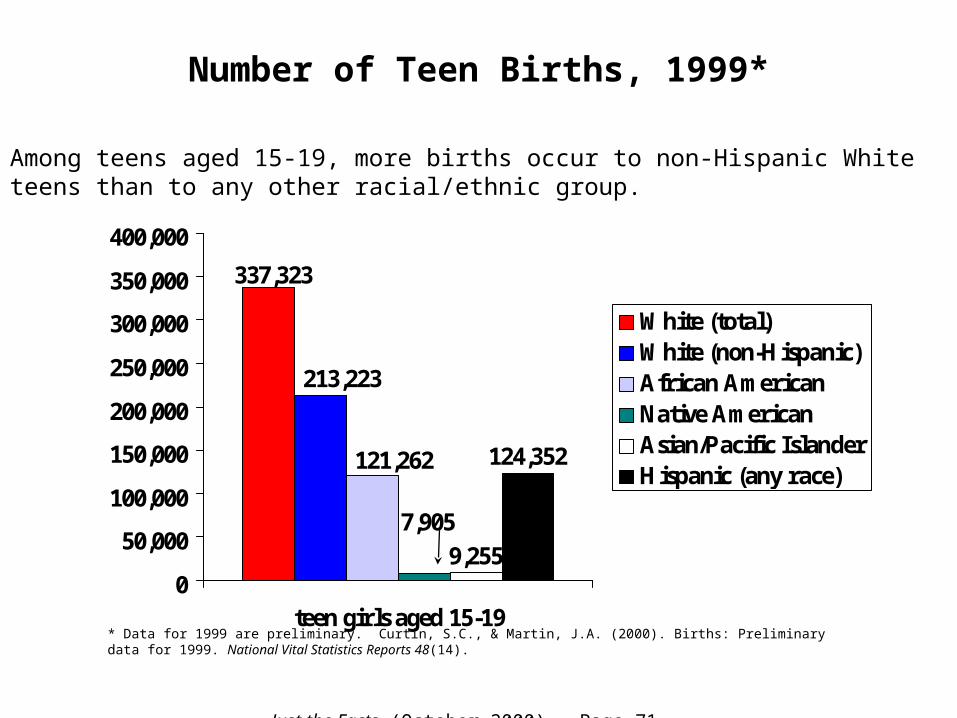
Number of Teen Births, 1999*
Among teens aged 15-19, more births occur to non-Hispanic White teens than to any other racial/ethnic group.
9,255
124,352
337,323
213,223
121,262
7,905
0
50,000
100,000
150,000
200,000
250,000
300,000
350,000
400,000
teen girls aged 15-19
White (total)White (non-Hispanic)African AmericanNative AmericanAsian/Pacific IslanderHispanic (any race)
Just the Facts (October 2000) – Page 71
* Data for 1999 are preliminary. Curtin, S.C., & Martin, J.A. (2000). Births: Preliminary data for 1999. National Vital Statistics Reports 48(14).

Number of Teen Births, 1999*
The proportion of all teen births that are to girls under 18 ranges from 31 percent for non-Hispanic White teens to 40 percent for Hispanic and African-American teens.
111,481
63,659
45,979
2,980
3,119
48,127
149,564
75,283
4,925
6,135
76,2262,721142
203
3,981
4,723
2,046
225,842
0% 20% 40% 60% 80% 100%
White (total)
White (non-Hispanic)
African American
Native American
Asian/Pacific Islander
Hispanic (any race)
aged 15-17 aged 10-14 aged 18-19
Just the Facts (October 2000) – Page 72
* Data for 1999 are preliminary. Curtin, S.C., & Martin, J.A. (2000). Births: Preliminary data for 1999. National Vital Statistics Reports 48(14).
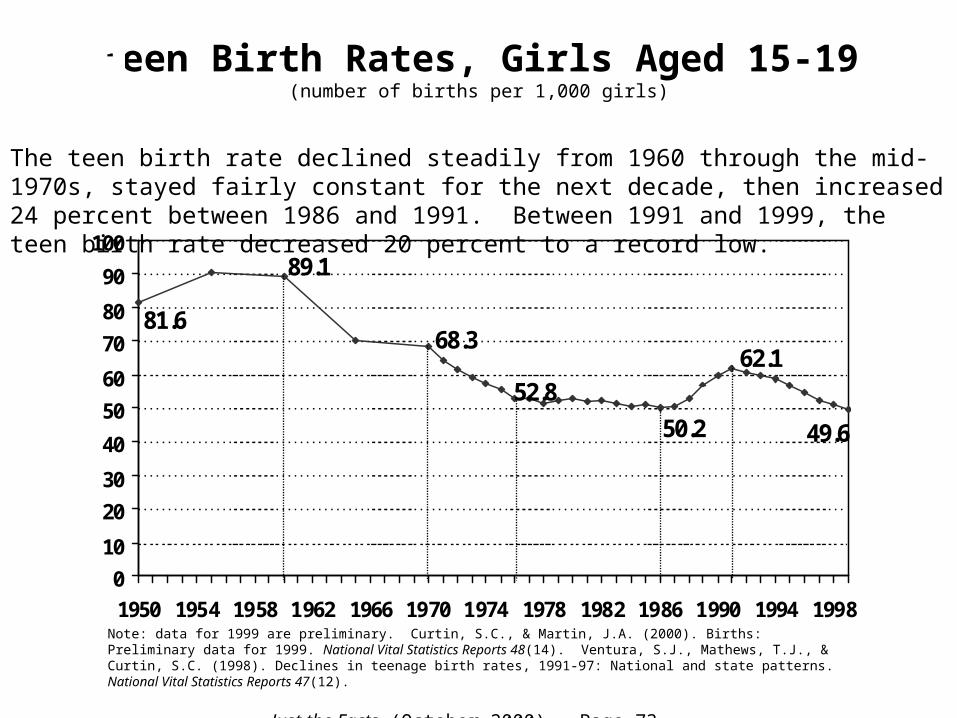
Teen Birth Rates, Girls Aged 15-19(number of births per 1,000 girls)
49.6
52.8
89.1
50.2
62.168.3
81.6
0
10
20
30
40
50
60
70
80
90
100
1950 1954 1958 1962 1966 1970 1974 1978 1982 1986 1990 1994 1998
The teen birth rate declined steadily from 1960 through the mid-1970s, stayed fairly constant for the next decade, then increased 24 percent between 1986 and 1991. Between 1991 and 1999, the teen birth rate decreased 20 percent to a record low.
Note: data for 1999 are preliminary. Curtin, S.C., & Martin, J.A. (2000). Births: Preliminary data for 1999. National Vital Statistics Reports 48(14). Ventura, S.J., Mathews, T.J., & Curtin, S.C. (1998). Declines in teenage birth rates, 1991-97: National and state patterns. National Vital Statistics Reports 47(12).
Just the Facts (October 2000) – Page 73

Teen Birth Rates(number of births per 1,000 girls)
49.662.181.6
166.7
94.4 80.2
43.9
38.728.7
0
30
60
90
120
150
180
1950 1954 1958 1962 1966 1970 1974 1978 1982 1986 1990 1994 1998
Just the Facts (October 2000) – Page 74
Older teens (aged 18-19) have a teen birth rate that is more than twice as high as the rate for younger teens (aged 15-17). While the teen birth rate for girls aged 15-19 decreased 20 percent between 1991 and 1999, the rate for older teens declined 15 percent and the rate for younger teens declined 26 percent.
Girls Aged 15-19
Girls Aged 15-17
Girls Aged 18-19
Note: data for 1999 are preliminary. Curtin, S.C., & Martin, J.A. (2000). Births: Preliminary data for 1999. National Vital Statistics Reports 48(14). Ventura, S.J., Mathews, T.J., & Curtin, S.C. (1998). Declines in teenage birth rates, 1991-97: National and state patterns. National Vital Statistics Reports 47(12).

Teen Birth Rates, Girls Aged 15-17(number of births per 1,000 girls)
32.239.0
43.9
30.5
38.7
28.7
0
10
20
30
40
50
1960 1963 1966 1969 1972 1975 1978 1981 1984 1987 1990 1993 1996 1999*
Just the Facts (October 2000) – Page 75
After decreasing 31 percent between 1960 and 1986, the teen birth rate for girls aged 15-17 increased 27 percent between 1986 and 1991, and then decreased 26 percent between 1991 and 1999 to its lowest rate ever recorded.
* Data for 1999 are preliminary. Curtin, S.C., & Martin, J.A. (2000). Births: Preliminary data for 1999. National Vital Statistics Reports 48(14). Ventura, S.J., Mathews, T.J., & Curtin, S.C. (1998). Declines in teenage birth rates, 1991-97: National and state patterns. National Vital Statistics Reports 47(12).

Teen Birth Rates, Girls Aged 18-19(number of births per 1,000 girls)
78.5
94.5
80.5
166.7
80.2
114.7
60
90
120
150
180
1960 1963 1966 1969 1972 1975 1978 1981 1984 1987 1990 1993 1996 1999*
Just the Facts (October 2000) – Page 76
After decreasing 53 percent between 1960 and 1987, the teen birth rate for girls aged 18-19 increased 20 percent between 1987 and 1992, and then decreased 15 percent between 1992 and 1999 to a near-record low.
* Data for 1999 are preliminary. Curtin, S.C., & Martin, J.A. (2000). Births: Preliminary data for 1999. National Vital Statistics Reports 48(14). Ventura, S.J., Mathews, T.J., & Curtin, S.C. (1998). Declines in teenage birth rates, 1991-97: National and state patterns. National Vital Statistics Reports 47(12).

Teen Birth Rates, Girls Aged 10-14(number of births per 1,000 girls)
1.41.2 1.4
0.9
1.1
0.0
0.2
0.4
0.6
0.8
1.0
1.2
1.4
1.6
1970 1973 1976 1979 1982 1985 1988 1991 1994 1997
Just the Facts (October 2000) – Page 77
After increasing 27 percent between 1983 and 1989, the teen birth rate for girls aged 10-14 remained constant between 1989 and 1994 and then decreased 36 percent between 1994 and 1999 to its lowest rate ever recorded.
Note: data for 1999 are preliminary. Curtin, S.C., & Martin, J.A. (2000). Births: Preliminary data for 1999. National Vital Statistics Reports 48(14). Ventura, S.J., Martin, J.A., Curtin, S.C., Mathews, T.J., & Park, M.M. (2000). Birth: Final data for 1998. National Vital Statistics Reports 48(3).

Teen Birth Rates by Race/Ethnicity,Girls Aged 15-19
(number of births per 1,000 girls)
49.6
62.153.0
44.552.8
45.434.1
43.4
81.1
115.5
97.8
67.7
85.0
82.2
22.827.426.2
93.1106.7
0
20
40
60
80
100
120
1980 1982 1984 1986 1988 1990 1992 1994 1996 1998
Just the Facts (October 2000) – Page 78
Teen birth rates vary substantially among the largest racial/ethnic subgroups. Between 1991 and 1999, the rate for African-American teens declined 30 percent, the rate for all White teens declined 16 percent and the rate for non-Hispanic White teens declined 21 percent, the rate for Hispanics decreased 13 percent, the rate for Native Americans declined 20 percent, and the rate for Asian/Pacific Islanders declined 17 percent.
Hispanic (any race)
African American
White (total)
Non-Hispanic WhiteAsian/Pacific Islander
Native American
TOTAL
Note: data for 1999 are preliminary. Curtin, S.C., & Martin, J.A. (2000). Births: Preliminary data for 1999. National Vital Statistics Reports 48(14). Ventura, S.J., Martin, J.A., Curtin, S.C., Mathews, T.J., & Park, M.M. (2000). Birth: Final data for 1998. National Vital Statistics Reports 48(3).

African-American Teen Birth Rates(number of births per 1,000 girls)
81.1
115.597.8
135.1
122.9
158.6
72.5
52.1
84.1
0
30
60
90
120
150
180
1980 1982 1984 1986 1988 1990 1992 1994 1996 1998
Just the Facts (October 2000) – Page 79
While the teen birth rate for African-American girls aged 15-19 decreased 30 percent between 1991 and 1999, the rate for older teens (aged 18-19) declined 23 percent and the rate for younger teens (aged 15-17) declined 38 percent.
Girls Aged 15-19
Girls Aged 15-17
Girls Aged 18-19
Note: data for 1999 are preliminary. Curtin, S.C., & Martin, J.A. (2000). Births: Preliminary data for 1999. National Vital Statistics Reports 48(14). Ventura, S.J., Martin, J.A., Curtin, S.C., Mathews, T.J., & Park, M.M. (2000). Birth: Final data for 1998. National Vital Statistics Reports 48(3).
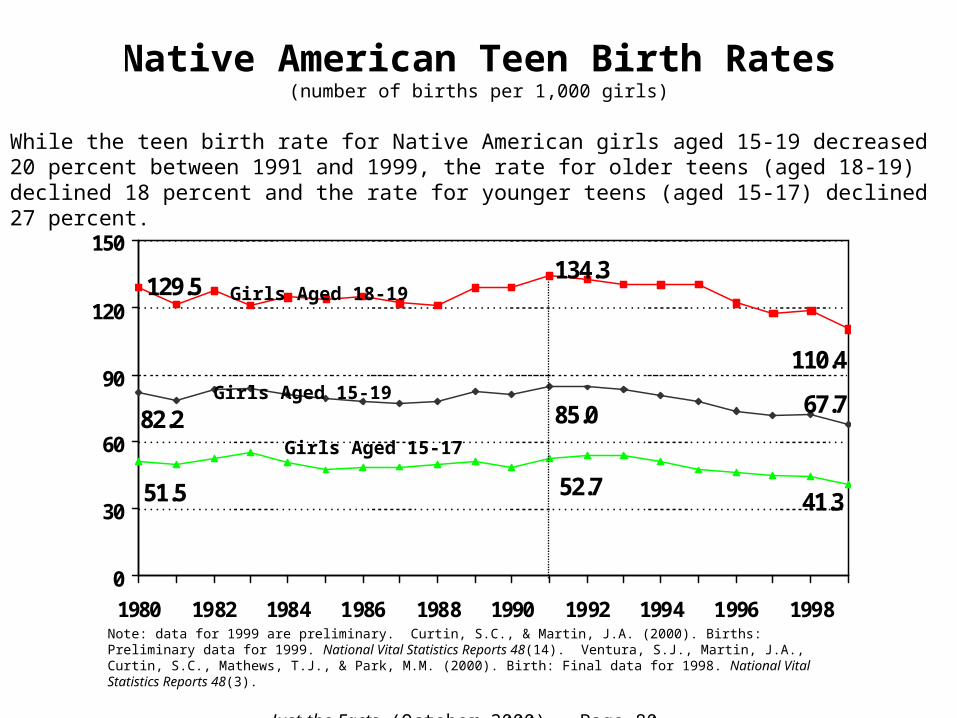
Native American Teen Birth Rates(number of births per 1,000 girls)
67.785.082.2
129.5
110.4
134.3
51.5 41.352.7
0
30
60
90
120
150
1980 1982 1984 1986 1988 1990 1992 1994 1996 1998
Just the Facts (October 2000) – Page 80
While the teen birth rate for Native American girls aged 15-19 decreased 20 percent between 1991 and 1999, the rate for older teens (aged 18-19) declined 18 percent and the rate for younger teens (aged 15-17) declined 27 percent.
Girls Aged 15-19
Girls Aged 15-17
Girls Aged 18-19
Note: data for 1999 are preliminary. Curtin, S.C., & Martin, J.A. (2000). Births: Preliminary data for 1999. National Vital Statistics Reports 48(14). Ventura, S.J., Martin, J.A., Curtin, S.C., Mathews, T.J., & Park, M.M. (2000). Birth: Final data for 1998. National Vital Statistics Reports 48(3).

Asian/Pacific Islander Teen Birth Rates(number of births per 1,000 girls)
22.827.426.2
46.2
38.8
43.1
12.0 12.616.1
0
20
40
60
1980 1982 1984 1986 1988 1990 1992 1994 1996 1998
Just the Facts (October 2000) – Page 81
While the teen birth rate for Asian/Pacific Islander girls aged 15-19 decreased 17 percent between 1991 and 1999, the rate for older teens (aged 18-19) declined 10 percent and the rate for younger teens (aged 15-17) declined 22 percent.
Girls Aged 15-19
Girls Aged 15-17
Girls Aged 18-19
Note: data for 1999 are preliminary. Curtin, S.C., & Martin, J.A. (2000). Births: Preliminary data for 1999. National Vital Statistics Reports 48(14). Ventura, S.J., Martin, J.A., Curtin, S.C., Mathews, T.J., & Park, M.M. (2000). Birth: Final data for 1998. National Vital Statistics Reports 48(3).

Non-Hispanic White Teen Birth Rates(number of births per 1,000 girls)
43.4
34.139.9
70.5
59.0
23.6
17.1
0
20
40
60
80
1989 1990 1991 1992 1993 1994 1995 1996 1997 1998 1999*
Just the Facts (October 2000) – Page 82
While the teen birth rate for non-Hispanic White girls aged 15-19 decreased 21 percent between 1991 and 1999, the rate for older teens (aged 18-19) declined 16 percent and the rate for younger teens (aged 15-17) declined 28 percent.
Girls Aged 15-19
Girls Aged 15-17
Girls Aged 18-19
* Data for 1999 are preliminary. Curtin, S.C., & Martin, J.A. (2000). Births: Preliminary data for 1999. National Vital Statistics Reports 48(14).

Hispanic Teen Birth Rates(number of births per 1,000 girls)
107.793.1
100.8
147.7
158.0
139.0
74.065.961.2
0
30
60
90
120
150
180
1989 1990 1991 1992 1993 1994 1995 1996 1997 1998 1999*
Just the Facts (October 2000) – Page 83
While the teen birth rate for Hispanic girls aged 15-19 decreased 14 percent between 1991 and 1999, the rate for older teens (aged 18-19) declined 12 percent and the rate for younger teens (aged 15-17) declined 13 percent.
Girls Aged 15-19
Girls Aged 15-17
Girls Aged 18-19
* Data for 1999 are preliminary. Curtin, S.C., & Martin, J.A. (2000). Births: Preliminary data for 1999. National Vital Statistics Reports 48(14).
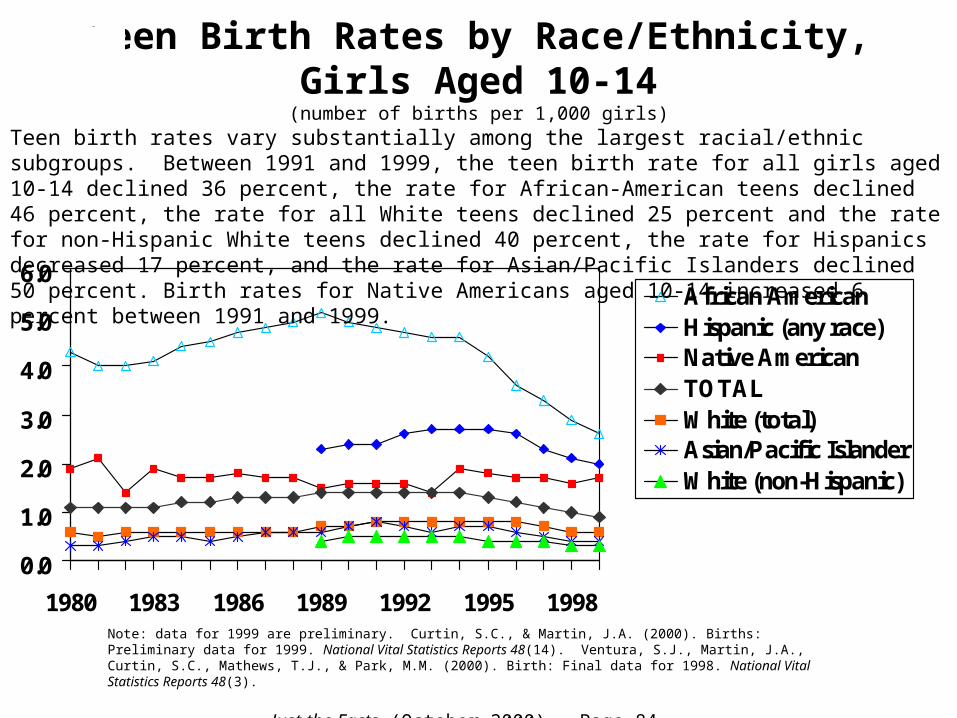
Teen Birth Rates by Race/Ethnicity,Girls Aged 10-14
(number of births per 1,000 girls)
0.0
1.0
2.0
3.0
4.0
5.0
6.0
1980 1983 1986 1989 1992 1995 1998
African AmericanHispanic (any race)Native AmericanTOTALWhite (total)Asian/Pacific IslanderWhite (non-Hispanic)
Just the Facts (October 2000) – Page 84
Teen birth rates vary substantially among the largest racial/ethnic subgroups. Between 1991 and 1999, the teen birth rate for all girls aged 10-14 declined 36 percent, the rate for African-American teens declined 46 percent, the rate for all White teens declined 25 percent and the rate for non-Hispanic White teens declined 40 percent, the rate for Hispanics decreased 17 percent, and the rate for Asian/Pacific Islanders declined 50 percent. Birth rates for Native Americans aged 10-14 increased 6 percent between 1991 and 1999.
Note: data for 1999 are preliminary. Curtin, S.C., & Martin, J.A. (2000). Births: Preliminary data for 1999. National Vital Statistics Reports 48(14). Ventura, S.J., Martin, J.A., Curtin, S.C., Mathews, T.J., & Park, M.M. (2000). Birth: Final data for 1998. National Vital Statistics Reports 48(3).

Number of Hispanic Teen Births, 1998(births to girls aged 15-19)
Nearly three-quarters of all births to Hispanic teens (ages 15-19) were to Mexican-American girls. Teens of Puerto Rican descent accounted for 10 percent, Cuban-Americans for one percent, and teens of Central/South American and other Hispanic descent each accounted for 8 percent of teen births.
Ventura, S.J., Martin, J.A., Curtin, S.C., Mathews, T.J., & Park, M.M. (2000). Birth: Final data for 1998. National Vital Statistics Reports 48(3).
Central/South American Descent
8%Other
Hispanic8%
Cuban Descent1%
Puerto Rican Descent
10%Mexican Descent
73%
(88,484)
(9,911)Total: 121,388
Just the Facts (October 2000) – Page 85
(12,286)
(9,821)
(886)
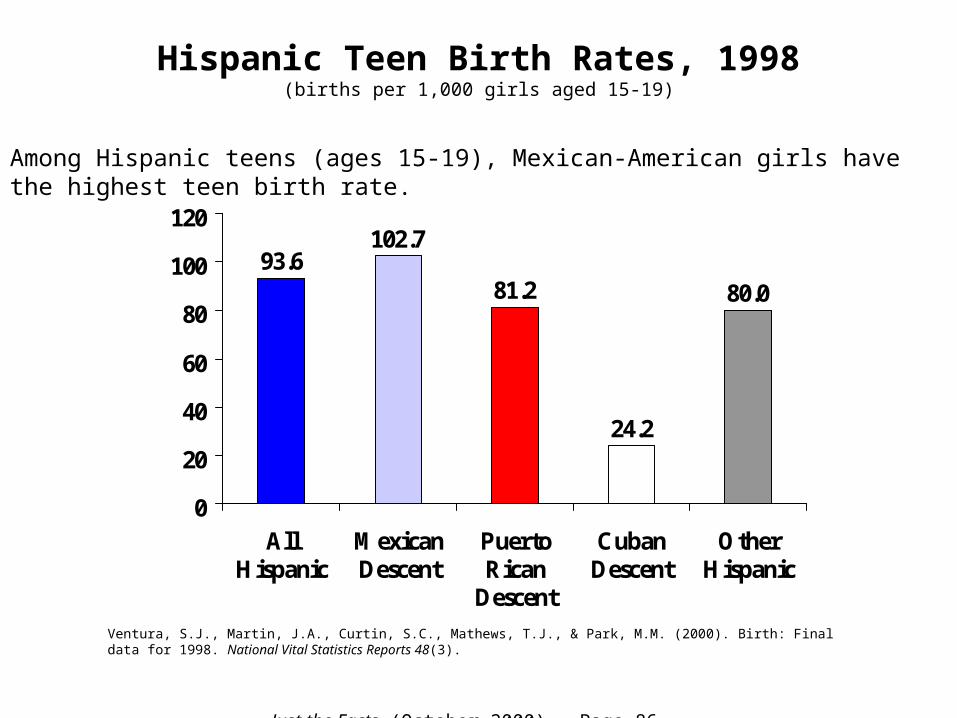
Hispanic Teen Birth Rates, 1998(births per 1,000 girls aged 15-19)
Among Hispanic teens (ages 15-19), Mexican-American girls have the highest teen birth rate.
93.6102.7
81.2
24.2
80.0
0
20
40
60
80
100
120
AllHispanic
MexicanDescent
PuertoRican
Descent
CubanDescent
OtherHispanic
Just the Facts (October 2000) – Page 86
Ventura, S.J., Martin, J.A., Curtin, S.C., Mathews, T.J., & Park, M.M. (2000). Birth: Final data for 1998. National Vital Statistics Reports 48(3).

Hispanic Teen Birth Rates, Girls Aged 15-19
(number of births per 1,000 girls)
107.7106.7
93.6
116.2117.3102.7
81.2106.0102.7
40.227.7
24.2
87.9
88.180.0
0
20
40
60
80
100
120
140
1989 1990 1991 1992 1993 1994 1995 1996 1997 1998 1999*
Hispanic (all)
Mexican Descent
Puerto RicanDescent
Cuban Descent
Other Hispanic
Just the Facts (October 2000) – Page 87
Trends in teen birth rates for Hispanic subgroups differ from each other. Between 1994, when the Hispanic teen birth rate peaked, and 1998, the overall Hispanic teen birth rate declined 13 percent. Declines for Hispanic teens of Mexican, Puerto Rican, and Cuban descent were 12, 23, and 40 percent, respectively. Teen birth rates for other Hispanic teens decreased 9 percent.
* Data for 1999 are preliminary. Curtin, S.C., & Martin, J.A. (2000). Births: Preliminary data for 1999. National Vital Statistics Reports 48(14). Ventura, S.J., Martin, J.A., Curtin, S.C., Mathews, T.J., & Park, M.M. (2000). Birth: Final data for 1998. National Vital Statistics Reports 48(3).

Mexican-American Teen Birth Rates(number of births per 1,000 girls)
185.3159.1
124.6 102.7
84.467.0
0
40
80
120
160
200
1989 1990 1991 1992 1993 1994 1995 1996 1997 1998
Just the Facts (October 2000) – Page 88
Trends in teen birth rates for Hispanic teens of Mexican descent decreased between 1991 and 1993, but then increased between 1993 and 1995. From this 1995 peak, rates for 15- to 19-year-olds have decreased 18 percent, rates for girls aged 15-17 have decreased 21 percent, and rates for girls aged 18-19 have decreased 14 percent.
Girls aged 18-19
Girls aged 15-19
Girls aged 15-17
Ventura, S.J., Martin, J.A., Curtin, S.C., Mathews, T.J., & Park, M.M. (2000). Birth: Final data for 1998. National Vital Statistics Reports 48(3).

Cuban-American Teen Birth Rates(number of births per 1,000 girls)
53.4
38.838.3
24.225.3
15.6
0
10
20
30
40
50
60
70
80
90
1989 1990 1991 1992 1993 1994 1995 1996 1997 1998
Just the Facts (October 2000) – Page 89
Generally speaking, Cuban-American teen birth rates were increasing between 1991 and 1997. Between 1997 and 1998, rates for 15- to 19-year-olds decreased 37 percent, rates for girls aged 15-17 decreased 38 percent, and rates for girls aged 18-19 decreased 27 percent.
Girls aged 18-19
Girls aged 15-19
Girls aged 15-17
Ventura, S.J., Martin, J.A., Curtin, S.C., Mathews, T.J., & Park, M.M. (2000). Birth: Final data for 1998. National Vital Statistics Reports 48(3).
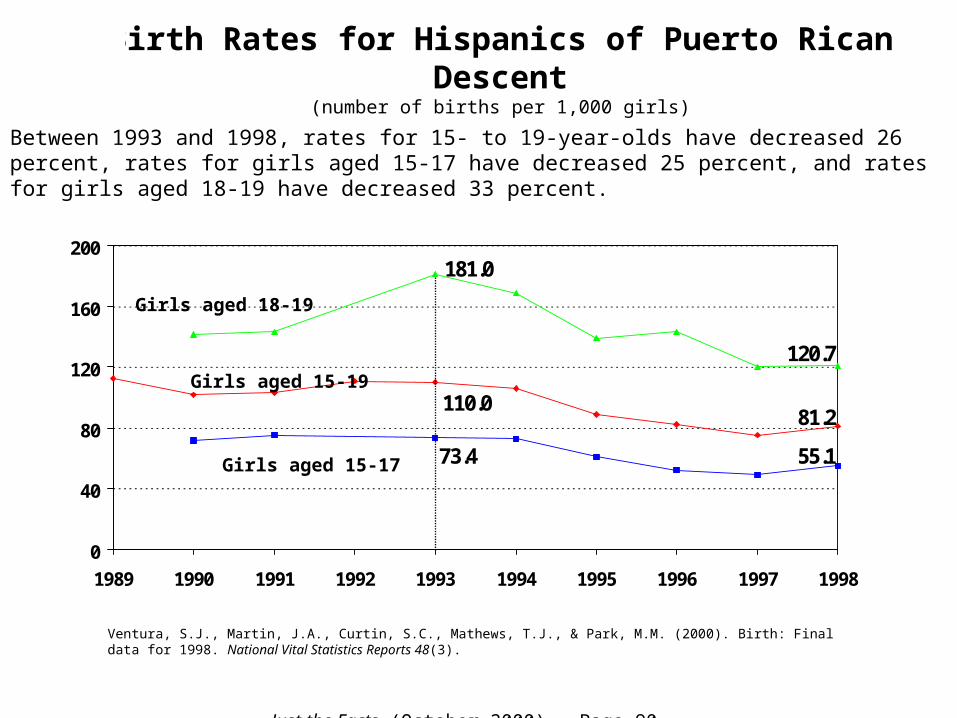
Birth Rates for Hispanics of Puerto Rican Descent(number of births per 1,000 girls)
181.0
120.7
110.081.2
73.4 55.1
0
40
80
120
160
200
1989 1990 1991 1992 1993 1994 1995 1996 1997 1998
Just the Facts (October 2000) – Page 90
Between 1993 and 1998, rates for 15- to 19-year-olds have decreased 26 percent, rates for girls aged 15-17 have decreased 25 percent, and rates for girls aged 18-19 have decreased 33 percent.
Girls aged 18-19
Girls aged 15-19
Girls aged 15-17
Ventura, S.J., Martin, J.A., Curtin, S.C., Mathews, T.J., & Park, M.M. (2000). Birth: Final data for 1998. National Vital Statistics Reports 48(3).

103.1
106.9
141.7
69.8
80.0
106.9
46.656.7
78.2
0
40
80
120
160
1989 1990 1991 1992 1993 1994 1995 1996 1997 1998
Just the Facts (October 2000) – Page 91
Between 1993 and 1996, rates for “other” Hispanic teens aged 15-19, 15-17, and 18-19 decreased 35, 40, and 39 percent, respectively. However, between 1996 and 1998 rates for all three age groups increased: 15 percent for girls aged 15-19, 23 percent for girls aged 15-17, and 4 percent for girls aged 18-19. Possible changes in the composition of this “other” Hispanic group make interpreting rate changes difficult, however.
Girls aged 18-19
Girls aged 15-19
Girls aged 15-17
Birth Rates for Hispanics of “Other” Descent (not Mexican, Puerto Rican, or Cuban)
(number of births per 1,000 girls)
Ventura, S.J., Martin, J.A., Curtin, S.C., Mathews, T.J., & Park, M.M. (2000). Birth: Final data for 1998. National Vital Statistics Reports 48(3).

Teen Birth Rates, Hispanic Girls Aged 10-14
(number of births per 1,000 girls)
0.0
0.5
1.0
1.5
2.0
2.5
3.0
3.5
4.0
1989 1991 1993 1995 1997 1999*
Mexican Descent
Hispanic (Total)
Puerto RicanDescentCuban Descent
Other Hispanic
Just the Facts (October 2000) – Page 92
Between 1994, when the Hispanic teen birth rate peaked, and 1998, the overall Hispanic teen birth rate for girls aged 10-14 declined 22 percent. Declines for Hispanic teens of Mexican and Puerto Rican descent were 21 and 41 percent, respectively. Birth rates for Cuban-American teens aged 10-14 increased 33 percent in the same time period, while teen birth rates for other Hispanic teens decreased 27 percent.
* Data for 1999 are preliminary. Curtin, S.C., & Martin, J.A. (2000). Births: Preliminary data for 1999. National Vital Statistics Reports 48(14). Ventura, S.J., Martin, J.A., Curtin, S.C., Mathews, T.J., & Park, M.M. (2000). Birth: Final data for 1998. National Vital Statistics Reports 48(3).

Ventura, S.J., Curtin, S.C., & Mathews, T.J. (2000). Variations in teenage birth rates, 1991-98: National and state trends. National Vital Statistics Reports 48(6).
Teen birth rates vary widely by state, ranging from 24.4 per 1,000 in Vermont to 73.0 per 1,000 in Mississippi.
Just the Facts (October 2000) – Page 93
24.4-35.8 per 1,000
36.9-42.6 per 1,000
43.1-49.2 per 1,000
51.2-61.6 per 1,000
64.3-73.0 per 1,000
State Teen Birth Rates, 1998(births per 1,000 girls aged 15-19)

Changes in Teen Birth Rates, 1991-98(births per 1,000 girls aged 15-19)
Teen birth rates declined in all 50 state between 1991 and 1998; declines ranged from 9.7 percent in Rhode Island to 37.8 percent in Vermont.
Just the Facts (October 2000) – Page 94
20.6-37.8% decline
17.9-20.5% decline
14.9-17.4% decline
12.7-14.7% decline
9.7-12.6% declineVentura, S.J., Curtin, S.C., & Mathews, T.J. (2000). Variations in teenage birth rates, 1991-98: National and state trends. National Vital Statistics Reports 48(6).

Teen Birth Rates, Fathers Aged 15-19(number of births per 1,000 boys)
17.918.8
21.625.0
0
5
10
15
20
25
30
1980 1982 1984 1986 1988 1990 1992 1994 1996 1998
Just the Facts (October 2000) – Page 95
After increasing 40 percent between 1986 and 1994, the teen birth rate for fathers aged 15-19 remained constant between 1989 and 1994 and then decreased 14 percent between 1994 and 1998.
Note: age of father is often missing for teen births (approximately 40 percent of teen births in 1997, for example). Cases with missing data are distributed according the proportions of births by age of father where this information is known. Ventura, S.J., Martin, J.A., Curtin, S.C., Mathews, T.J., & Park, M.M. (2000). Birth: Final data for 1998. National Vital Statistics Reports 48(3).
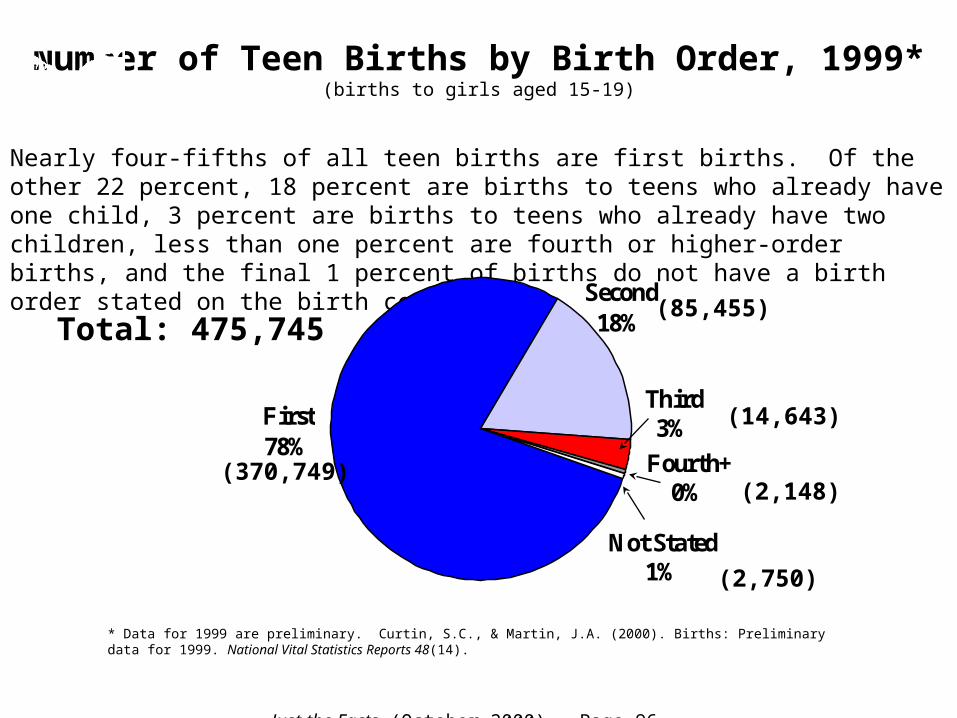
Number of Teen Births by Birth Order, 1999*(births to girls aged 15-19)
Nearly four-fifths of all teen births are first births. Of the other 22 percent, 18 percent are births to teens who already have one child, 3 percent are births to teens who already have two children, less than one percent are fourth or higher-order births, and the final 1 percent of births do not have a birth order stated on the birth certificate.
Fourth+0%
Not Stated1%
Third3%
Second18%
First78%
(370,749)(2,148)
Total: 475,745
Just the Facts (October 2000) – Page 96
(85,455)
(14,643)
(2,750)
* Data for 1999 are preliminary. Curtin, S.C., & Martin, J.A. (2000). Births: Preliminary data for 1999. National Vital Statistics Reports 48(14).

375,216
223,096
152,120
9,181
105,327
85,900
19,427
170111
1,684
2,668
4,352
0% 20% 40% 60% 80% 100%
15-19
18-19
15-17
under 15
First births Subsequent births Order not stated
Older teens are more likely to have repeat births: only 72 percent of births to teens aged 18-19 are first births, vs. 88 percent of births to teens aged 15-17 and 97 percent of births to teens 14 or younger.
Just the Facts (October 2000) – Page 97
Ventura, S.J., Martin, J.A., Curtin, S.C., Mathews, T.J., & Park, M.M. (2000). Birth: Final data for 1998. National Vital Statistics Reports 48(3).
Number of Teen Births by Birth Order, 1998

Number of Teen Births by Birth Order, 1998(births to girls aged 15-19)
The proportion of all teen births that are first births ranges from 72 percent for African-American teens to 82 percent for non-Hispanic White teens.
270,096
178,863
91,718
6,152
7,250
91,153 28,871
1,761
1,889
34,320
67,357
38,578
1,364
52
160
899
1,728
3,241
0% 20% 40% 60% 80% 100%
White (total)
White (non-Hispanic)
African American
Native American
Asian/Pacific Islander
Hispanic (any race)
First births Subsequent births Order not stated
Just the Facts (October 2000) – Page 98
Ventura, S.J., Martin, J.A., Curtin, S.C., Mathews, T.J., & Park, M.M. (2000). Birth: Final data for 1998. National Vital Statistics Reports 48(3).
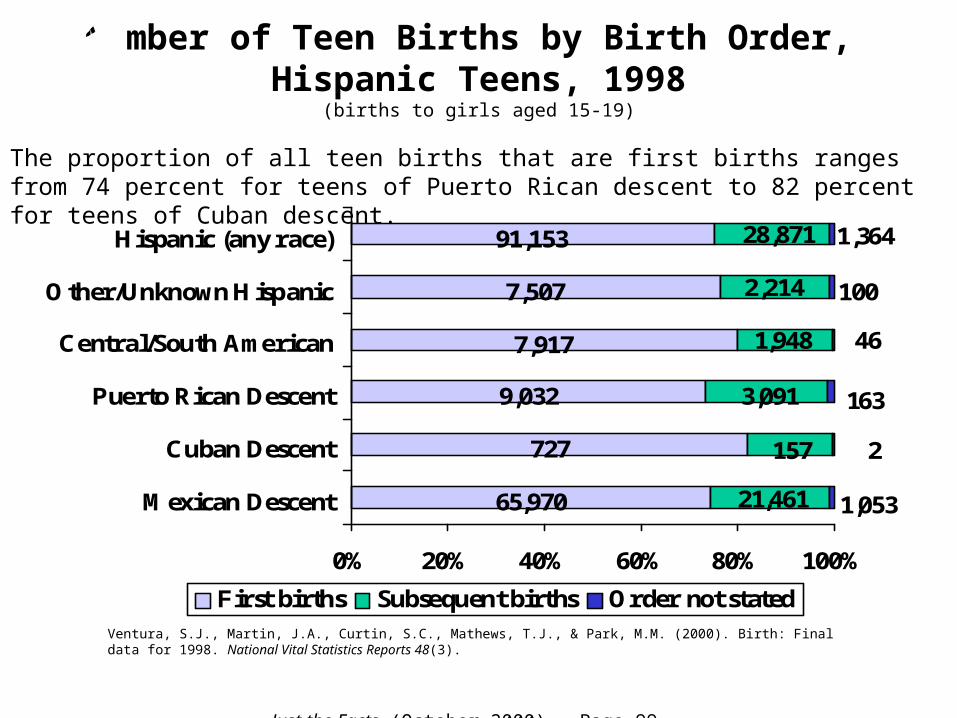
Number of Teen Births by Birth Order, Hispanic Teens, 1998
(births to girls aged 15-19)
The proportion of all teen births that are first births ranges from 74 percent for teens of Puerto Rican descent to 82 percent for teens of Cuban descent.
65,970
727
9,032
7,917
7,507
91,153 28,871
2,214
1,948
3,091
21,461
157
1,364
100
46
163
2
1,053
0% 20% 40% 60% 80% 100%
Mexican Descent
Cuban Descent
Puerto Rican Descent
Central/South American
Other/Unknown Hispanic
Hispanic (any race)
First births Subsequent births Order not stated
Just the Facts (October 2000) – Page 99
Ventura, S.J., Martin, J.A., Curtin, S.C., Mathews, T.J., & Park, M.M. (2000). Birth: Final data for 1998. National Vital Statistics Reports 48(3).

46.7
42.1
50.0
41.8
49.6
36
38
40
42
44
46
48
50
52
1985 1987 1989 1991 1993 1995
Ventura, S.J., Mathews, T.J., & Curtin, S.C. (1998). Declines in teenage birth rates, 1991-97: National and state patterns. National Vital Statistics Reports 47(12).
Just the Facts (October 2000) – Page 100
First birth rates for childless teens aged 15-19 decreased 7 percent between 1994 and 1996, after increasing 20 percent between 1987 and 1994.
First Birth Rates for Childless Teens(number of births per 1,000 childless girls aged 15-19)

174.6173.5
220.9
192.1
100
120
140
160
180
200
220
240
1985 1987 1989 1991 1993 1995 1997
Just the Facts (October 2000) – Page 101
After increasing 15 percent between 1985 and 1991, the second birth rate for teens aged 15-19 who have had one child decreased 21 percent between 1991 and 1996, but then increased 0.6 percent between 1996 and 1998.
Second Birth Rates for Teens With One Child(number of births per 1,000 girls aged 15-19)
Ventura, S.J., & Bachrach, C.A. (2000). Nonmarital childbearing in the United States, 1940-99. National Vital Statistics Reports 48(16).
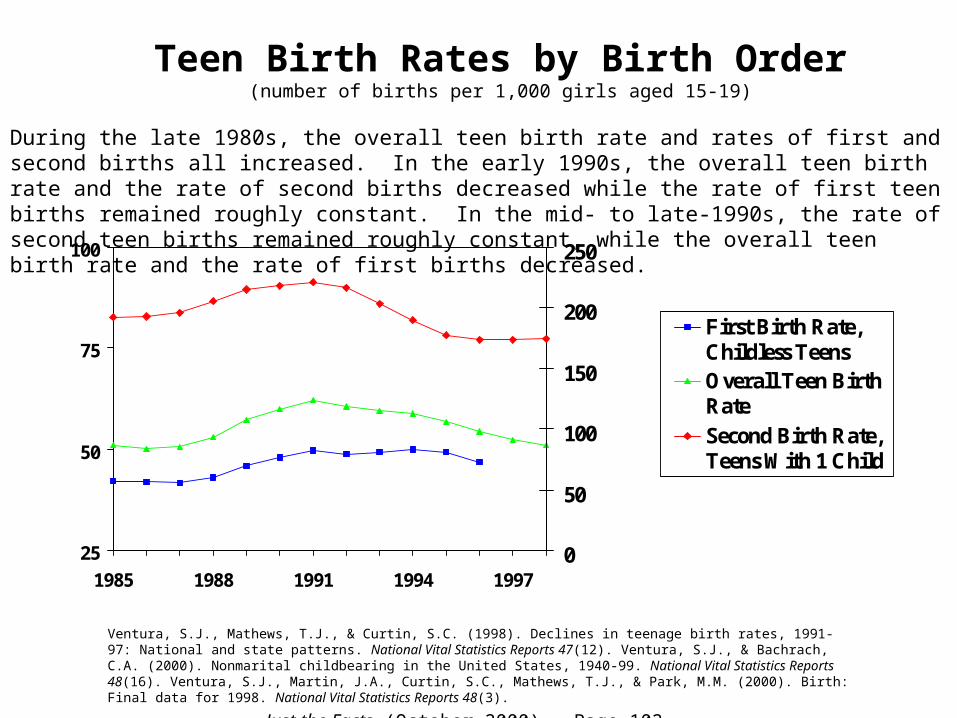
25
50
75
100
1985 1988 1991 1994 19970
50
100
150
200
250
First Birth Rate,Childless TeensOverall Teen BirthRateSecond Birth Rate,Teens With 1 Child
Just the Facts (October 2000) – Page 102
During the late 1980s, the overall teen birth rate and rates of first and second births all increased. In the early 1990s, the overall teen birth rate and the rate of second births decreased while the rate of first teen births remained roughly constant. In the mid- to late-1990s, the rate of second teen births remained roughly constant, while the overall teen birth rate and the rate of first births decreased.
Teen Birth Rates by Birth Order(number of births per 1,000 girls aged 15-19)
Ventura, S.J., Mathews, T.J., & Curtin, S.C. (1998). Declines in teenage birth rates, 1991-97: National and state patterns. National Vital Statistics Reports 47(12). Ventura, S.J., & Bachrach, C.A. (2000). Nonmarital childbearing in the United States, 1940-99. National Vital Statistics Reports 48(16). Ventura, S.J., Martin, J.A., Curtin, S.C., Mathews, T.J., & Park, M.M. (2000). Birth: Final data for 1998. National Vital Statistics Reports 48(3).

Proportion of Teen Births to Unmarried Teens, 1999*
(births to teens aged 15-19)
Of the one-half million births to teens aged 15-19 in 1999, 78.6 percent were to unmarried teens.
Married21.4%
Unmarried78.6%
Just the Facts (October 2000) – Page 103
* Data for 1999 are preliminary. Ventura, S.J., & Bachrach, C.A. (2000). Nonmarital childbearing in the United States, 1940-99. National Vital Statistics Reports 48(16). Curtin, S.C., & Martin, J.A. (2000). Births: Preliminary data for 1999. National Vital Statistics Reports 48(14).
101,814
373,931

382,655
373,931
230,613
143,318
8,724325
20,241
81,573
101,814
102,139
0% 20% 40% 60% 80% 100%
Under 20
15-19
18-19
15-17
under 15
Unmarried Married
Younger teens are more likely to have an out-of-wedlock birth: 96 percent of girls under 15 giving birth are unmarried, vs. 88 percent of girls aged 15-17 and 74 percent of girls aged 18-19.
Just the Facts (October 2000) – Page 104
* Data for 1999 are preliminary. Ventura, S.J., & Bachrach, C.A. (2000). Nonmarital childbearing in the United States, 1940-99. National Vital Statistics Reports 48(16). Curtin, S.C., & Martin, J.A. (2000). Births: Preliminary data for 1999. National Vital Statistics Reports 48(14).
Proportion of Teen Births to Unmarried Teens, 1999*

The proportion of all teen births that are out-of-wedlock ranges from 70.9 percent for Hispanic teens to 95.7 percent for African-American teens.
240,353
84,594
122,986
6,591
6,187
155,795 64,062
2,412
1,2195,553
33,528
97,919
0% 20% 40% 60% 80% 100%
White (total)
White (non-Hispanic)
African American
Native American
Asian/Pacific Islander
Hispanic (any race)
Unmarried Married
Just the Facts (October 2000) – Page 105
National Center for Health Statistics. (2000). Vital statistics of the United States, 1997, Volume I, Natality. [Online]. Available: www.cdc.gov/nchs/datawh/statb/unpubd/natality/natab97.htm.
Proportion of Teen Births to Unmarried Teens, 1997 (births to teens aged 15-19)

Proportion of Teen Births to Unmarried Teens
78.6%
13.4%
87.6%
22.6%
73.9%
9.4%
96.4%
63.7%
0%
20%
40%
60%
80%
100%
1950 1954 1958 1962 1966 1970 1974 1978 1982 1986 1990 1994 1998Note: before 1980, marital status is estimated based on data from areas in which marital status of mother was reported. Also, data for 1999 are preliminary. Ventura, S.J., & Bachrach, C.A. (2000). Nonmarital childbearing in the United States, 1940-99. National Vital Statistics Reports 48(16). Ventura, S.J., Martin, J.A., Curtin, S.C., Mathews, T.J., & Park, M.M. (2000). Birth: Final data for 1998. National Vital Statistics Reports 48(3). Ventura, S.J., Martin, J.A., Curtin, S.C., & Mathews, T.J. (1999). Births: Final data for 1997. National Vital Statistics Reports 47(18). Ventura, S.J., Mathews, T.J., & Curtin, S.C. (1998). Declines in teenage birth rates, 1991-97: National and state patterns. National Vital Statistics Reports 47(12).
Just the Facts (October 2000) – Page 106
The proportion of teen births that occur to unmarried teens increased steadily between 1950 and 1999 for all age groups.
Girls Aged 15-19
Girls Aged 15-17
Girls Aged 18-19
Girls Under 15

Proportion of Teen Births to Unmarried Teens,
White Teens
78.6%
6.2%
83.2%
10.2%
67.3%
4.8%
93.9%
41.9%
0%
20%
40%
60%
80%
100%
1950 1954 1958 1962 1966 1970 1974 1978 1982 1986 1990 1994 1998
Just the Facts (October 2000) – Page 107
The proportion of White teen births that occur to unmarried teens increased steadily between 1950 and 1999 for all age groups.
Girls Aged 15-19
Girls Aged 15-17
Girls Aged 18-19
Girls Under 15
Note: before 1980, marital status is estimated based on data from areas in which marital status of mother was reported. Also, data for 1999 are preliminary. Ventura, S.J., & Bachrach, C.A. (2000). Nonmarital childbearing in the United States, 1940-99. National Vital Statistics Reports 48(16). Ventura, S.J., Martin, J.A., Curtin, S.C., Mathews, T.J., & Park, M.M. (2000). Birth: Final data for 1998. National Vital Statistics Reports 48(3). Ventura, S.J., Martin, J.A., Curtin, S.C., & Mathews, T.J. (1999). Births: Final data for 1997. National Vital Statistics Reports 47(18). Ventura, S.J., Mathews, T.J., & Curtin, S.C. (1998). Declines in teenage birth rates, 1991-97: National and state patterns. National Vital Statistics Reports 47(12).

Proportion of Teen Births to Unmarried Teens,
African-American Teens
95.5%
62.7%
98.3%
76.0%
93.7%
52.1%
99.5%
93.5%
50%
60%
70%
80%
90%
100%
1970 1974 1978 1982 1986 1990 1994 1998
Just the Facts (October 2000) – Page 108
The proportion of African-American teen births that occur to unmarried teens increased steadily between 1970 and 1999 for all age groups.
Girls Aged 15-19
Girls Aged 15-17
Girls Aged 18-19
Girls Under 15
Note: before 1980, marital status is estimated based on data from areas in which marital status of mother was reported. Also, data for 1999 are preliminary. Ventura, S.J., & Bachrach, C.A. (2000). Nonmarital childbearing in the United States, 1940-99. National Vital Statistics Reports 48(16). Ventura, S.J., Martin, J.A., Curtin, S.C., Mathews, T.J., & Park, M.M. (2000). Birth: Final data for 1998. National Vital Statistics Reports 48(3). Ventura, S.J., Martin, J.A., Curtin, S.C., & Mathews, T.J. (1999). Births: Final data for 1997. National Vital Statistics Reports 47(18). Ventura, S.J., Mathews, T.J., & Curtin, S.C. (1998). Declines in teenage birth rates, 1991-97: National and state patterns. National Vital Statistics Reports 47(12).
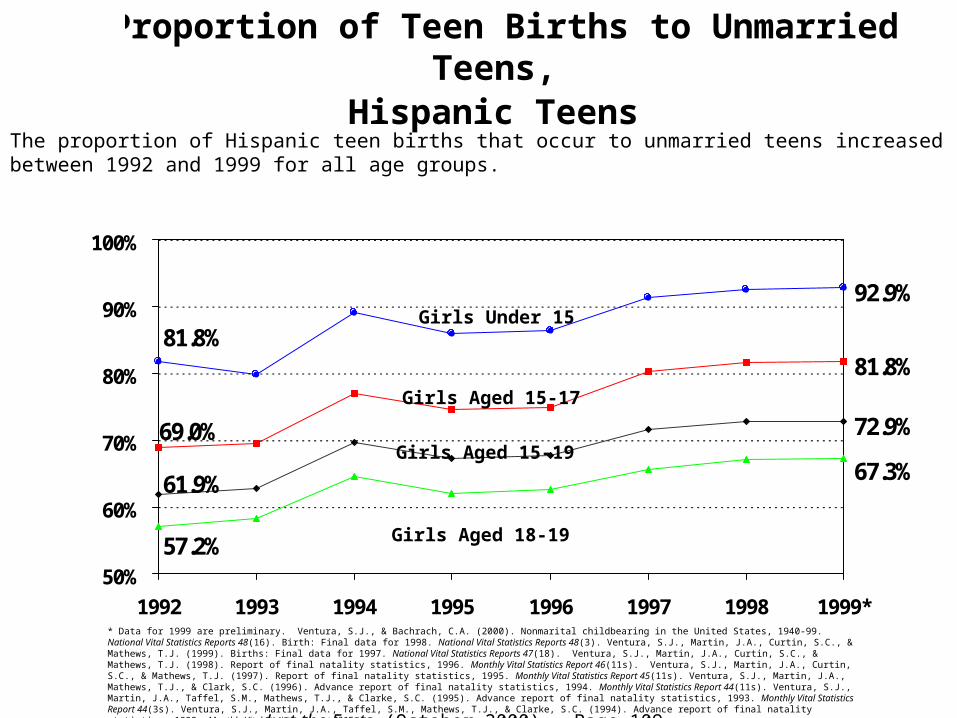
Proportion of Teen Births to Unmarried Teens,
Hispanic Teens
72.9%
61.9%
81.8%
69.0%
67.3%
57.2%
92.9%
81.8%
50%
60%
70%
80%
90%
100%
1992 1993 1994 1995 1996 1997 1998 1999** Data for 1999 are preliminary. Ventura, S.J., & Bachrach, C.A. (2000). Nonmarital childbearing in the United States, 1940-99. National Vital Statistics Reports 48(16). Birth: Final data for 1998. National Vital Statistics Reports 48(3). Ventura, S.J., Martin, J.A., Curtin, S.C., & Mathews, T.J. (1999). Births: Final data for 1997. National Vital Statistics Reports 47(18). Ventura, S.J., Martin, J.A., Curtin, S.C., & Mathews, T.J. (1998). Report of final natality statistics, 1996. Monthly Vital Statistics Report 46(11s). Ventura, S.J., Martin, J.A., Curtin, S.C., & Mathews, T.J. (1997). Report of final natality statistics, 1995. Monthly Vital Statistics Report 45(11s). Ventura, S.J., Martin, J.A., Mathews, T.J., & Clark, S.C. (1996). Advance report of final natality statistics, 1994. Monthly Vital Statistics Report 44(11s). Ventura, S.J., Martin, J.A., Taffel, S.M., Mathews, T.J., & Clarke, S.C. (1995). Advance report of final natality statistics, 1993. Monthly Vital Statistics Report 44(3s). Ventura, S.J., Martin, J.A., Taffel, S.M., Mathews, T.J., & Clarke, S.C. (1994). Advance report of final natality statistics, 1992. Monthly Vital Statistics Report 43(5s).
Just the Facts (October 2000) – Page 109
The proportion of Hispanic teen births that occur to unmarried teens increased between 1992 and 1999 for all age groups.
Girls Aged 15-19
Girls Aged 15-17
Girls Aged 18-19
Girls Under 15

Proportion of Teen Births to Unmarried Teens,
Non-Hispanic White Teens
95.5%
88.1% 84.5%
71.6%
67.5%
54.0%
72.6%
59.7%
50%
60%
70%
80%
90%
100%
1992 1993 1994 1995 1996 1997 1998 1999*
Just the Facts (October 2000) – Page 110
The proportion of teen births that occur to unmarried teens increased steadily between 1992 and 1999 for all age groups.
Girls Aged 15-19
Girls Aged
15-17
Girls Aged 18-19
Girls Under 15
* Data for 1999 are preliminary. Ventura, S.J., & Bachrach, C.A. (2000). Nonmarital childbearing in the United States, 1940-99. National Vital Statistics Reports 48(16). Birth: Final data for 1998. National Vital Statistics Reports 48(3). Ventura, S.J., Martin, J.A., Curtin, S.C., & Mathews, T.J. (1999). Births: Final data for 1997. National Vital Statistics Reports 47(18). Ventura, S.J., Martin, J.A., Curtin, S.C., & Mathews, T.J. (1998). Report of final natality statistics, 1996. Monthly Vital Statistics Report 46(11s). Ventura, S.J., Martin, J.A., Curtin, S.C., & Mathews, T.J. (1997). Report of final natality statistics, 1995. Monthly Vital Statistics Report 45(11s). Ventura, S.J., Martin, J.A., Mathews, T.J., & Clark, S.C. (1996). Advance report of final natality statistics, 1994. Monthly Vital Statistics Report 44(11s). Ventura, S.J., Martin, J.A., Taffel, S.M., Mathews, T.J., & Clarke, S.C. (1995). Advance report of final natality statistics, 1993. Monthly Vital Statistics Report 44(3s). Ventura, S.J., Martin, J.A., Taffel, S.M., Mathews, T.J., & Clarke, S.C. (1994). Advance report of final natality statistics, 1992. Monthly Vital Statistics Report 43(5s).

Unmarried Teen Birth Rates(number of births per 1,000 unmarried girls)
17.5
46.4
7.4
41.532.0
13.1
27.0
70.1
64.5
25.6
0
20
40
60
80
1940 1945 1950 1955 1960 1965 1970 1975 1980 1985 1990 1995Note: before 1980, marital status is estimated based on data from areas in which marital status of mother was reported. Ventura, S.J., & Bachrach, C.A. (2000). Nonmarital childbearing in the United States, 1940-99. National Vital Statistics Reports 48(16).
Just the Facts (October 2000) – Page 111
The unmarried teen birth rate for girls aged 15-19 increased 527 percent between 1940 and 1994. Between 1966 and 1994, rates for older teens (aged 18-19) increased 174 percent, rates for younger teens (aged 15-17) increased 144 percent, and the overall rate increased 165 percent. Between 1994 and 1998, the overall unmarried teen birth rate decreased 11 percent, while rates for older and younger teens declined 8 and 16 percent, respectively.
Girls Aged 15-19 Girls Aged 15-17
Girls Aged 18-19

Unmarried Teen Birth Rates, White Teens(number of births per 1,000 unmarried girls)
8.5
36.2
3.3
34.024.1
5.4
21.8
56.453.5
14.1
0
20
40
60
1940 1945 1950 1955 1960 1965 1970 1975 1980 1985 1990 1995
Just the Facts (October 2000) – Page 112
The unmarried teen birth rate for White girls aged 15-19 increased 997 percent between 1940 and 1994. Between 1966 and 1994, rates for older teens (aged 18-19) increased 300 percent, rates for younger teens (aged 15-17) increased 346 percent, and the overall rate increased 326 percent. Between 1994 and 1998, the overall unmarried teen birth rate decreased 6 percent, while rates for older and younger teens declined 5 and 10 percent, respectively.
Girls Aged 15-19
Girls Aged 15-17
Girls Aged 18-19
Note: before 1980, marital status is estimated based on data from areas in which marital status of mother was reported, and race is measured as race of child. Ventura, S.J., & Bachrach, C.A. (2000). Nonmarital childbearing in the United States, 1940-99. National Vital Statistics Reports 48(16).
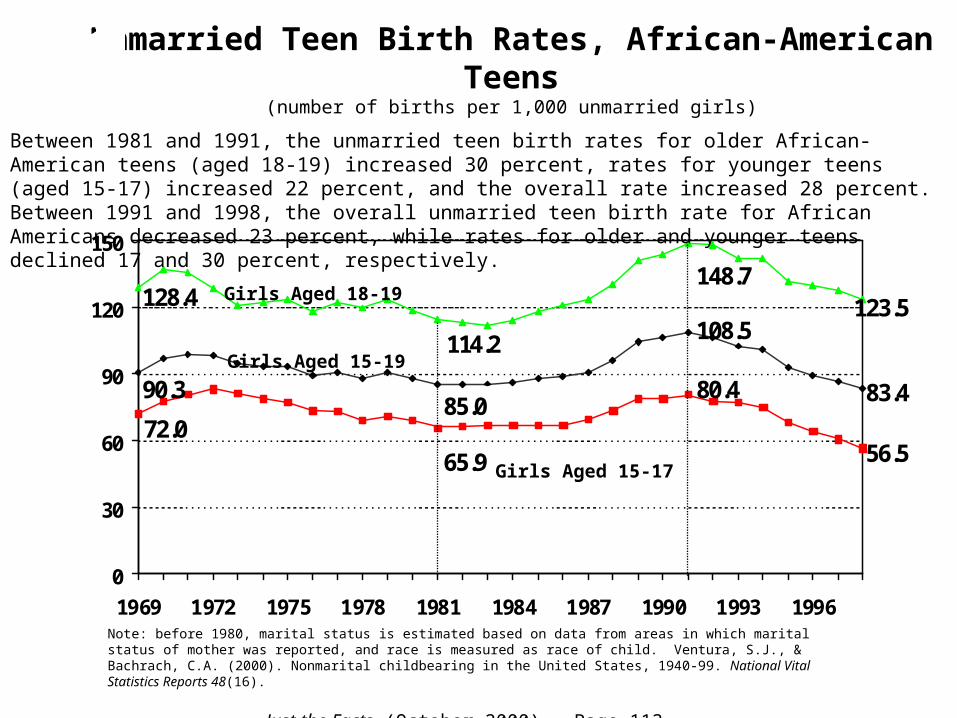
Unmarried Teen Birth Rates, African-American Teens
(number of births per 1,000 unmarried girls)
85.083.4
108.5
90.3
65.9 56.572.0
80.4
114.2
123.5128.4148.7
0
30
60
90
120
150
1969 1972 1975 1978 1981 1984 1987 1990 1993 1996
Just the Facts (October 2000) – Page 113
Between 1981 and 1991, the unmarried teen birth rates for older African-American teens (aged 18-19) increased 30 percent, rates for younger teens (aged 15-17) increased 22 percent, and the overall rate increased 28 percent. Between 1991 and 1998, the overall unmarried teen birth rate for African Americans decreased 23 percent, while rates for older and younger teens declined 17 and 30 percent, respectively.
Girls Aged 15-19
Girls Aged 15-17
Girls Aged 18-19
Note: before 1980, marital status is estimated based on data from areas in which marital status of mother was reported, and race is measured as race of child. Ventura, S.J., & Bachrach, C.A. (2000). Nonmarital childbearing in the United States, 1940-99. National Vital Statistics Reports 48(16).

Unmarried Teen Birth Rates, Hispanic Teens
(number of births per 1,000 unmarried girls)
73.982.665.9
45.959.0 53.0
98.9 123.6107.8
0
20
40
60
80
100
120
140
1990 1991 1992 1993 1994 1995 1996 1997 1998
Just the Facts (October 2000) – Page 114
Between 1990 and 1994, the unmarried teen birth rate for Hispanic teens aged 15-19 and 18-19 both increased 25 percent, while rates for teens aged 15-17 increased 29 percent. Between 1994 and 1998, the unmarried teen birth rates for Hispanic teens aged 15-19, 15-17, and 18-19 decreased 11, 11, and 13 percent, respectively.
Girls Aged 15-19
Girls Aged 15-17
Girls Aged 18-19
Ventura, S.J., & Bachrach, C.A. (2000). Nonmarital childbearing in the United States, 1940-99. National Vital Statistics Reports 48(16).
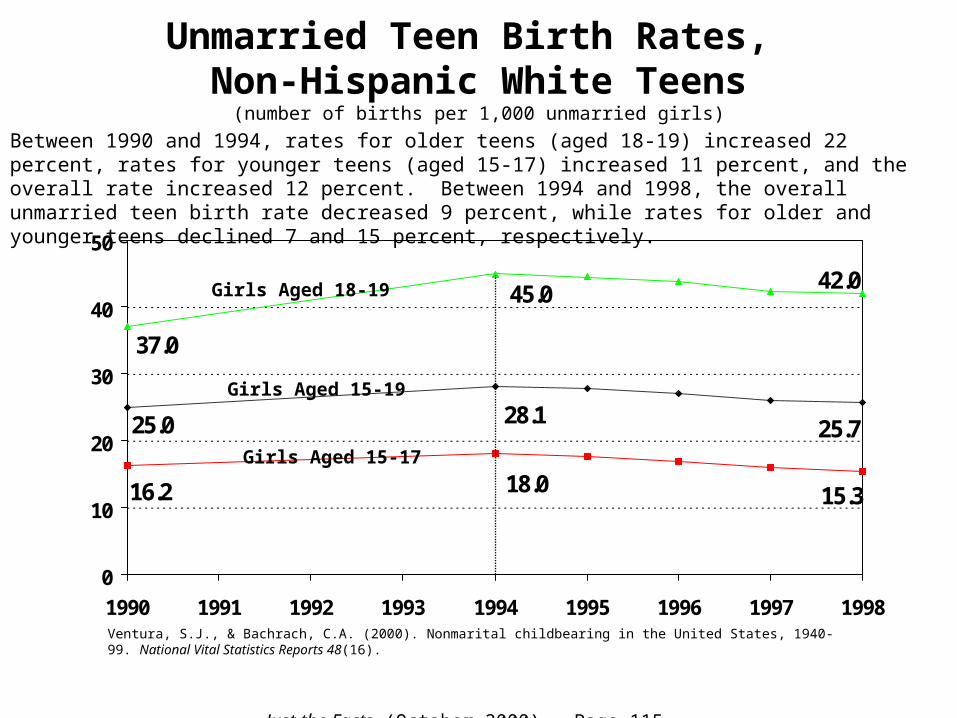
Unmarried Teen Birth Rates, Non-Hispanic White Teens
(number of births per 1,000 unmarried girls)
25.728.125.0
18.0 15.316.2
37.0
42.045.0
0
10
20
30
40
50
1990 1991 1992 1993 1994 1995 1996 1997 1998
Just the Facts (October 2000) – Page 115
Between 1990 and 1994, rates for older teens (aged 18-19) increased 22 percent, rates for younger teens (aged 15-17) increased 11 percent, and the overall rate increased 12 percent. Between 1994 and 1998, the overall unmarried teen birth rate decreased 9 percent, while rates for older and younger teens declined 7 and 15 percent, respectively.
Girls Aged 15-19
Girls Aged 15-17
Girls Aged 18-19
Ventura, S.J., & Bachrach, C.A. (2000). Nonmarital childbearing in the United States, 1940-99. National Vital Statistics Reports 48(16).
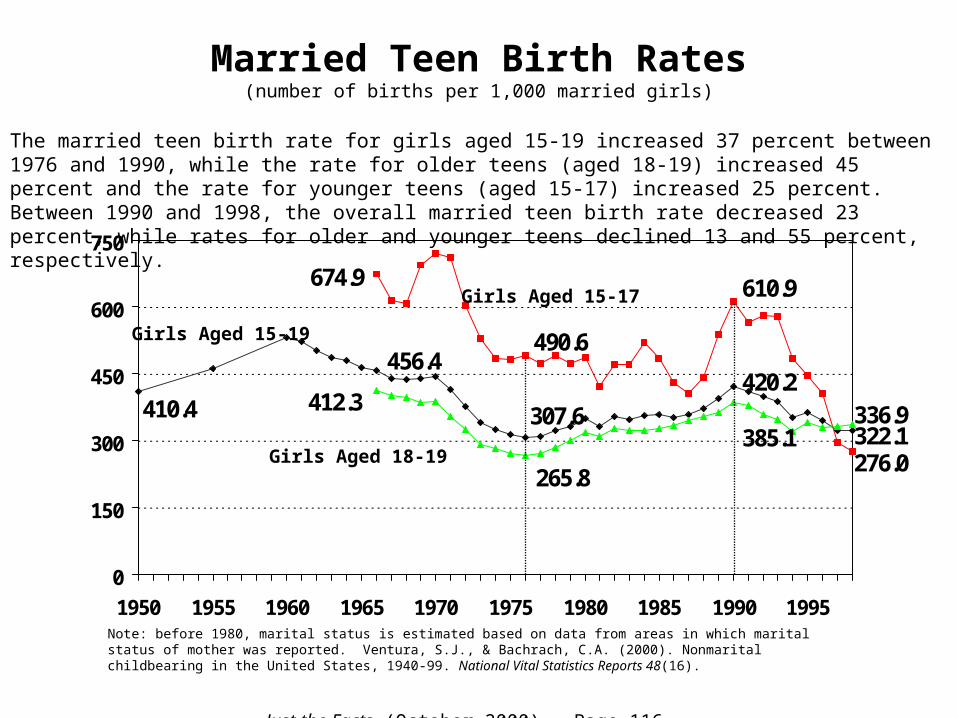
Married Teen Birth Rates(number of births per 1,000 married girls)
456.4420.2
322.1307.6410.4
674.9 610.9
276.0
490.6
336.9385.1
412.3
265.8
0
150
300
450
600
750
1950 1955 1960 1965 1970 1975 1980 1985 1990 1995Note: before 1980, marital status is estimated based on data from areas in which marital status of mother was reported. Ventura, S.J., & Bachrach, C.A. (2000). Nonmarital childbearing in the United States, 1940-99. National Vital Statistics Reports 48(16).
Just the Facts (October 2000) – Page 116
The married teen birth rate for girls aged 15-19 increased 37 percent between 1976 and 1990, while the rate for older teens (aged 18-19) increased 45 percent and the rate for younger teens (aged 15-17) increased 25 percent. Between 1990 and 1998, the overall married teen birth rate decreased 23 percent, while rates for older and younger teens declined 13 and 55 percent, respectively.
Girls Aged 15-19
Girls Aged 15-17
Girls Aged 18-19
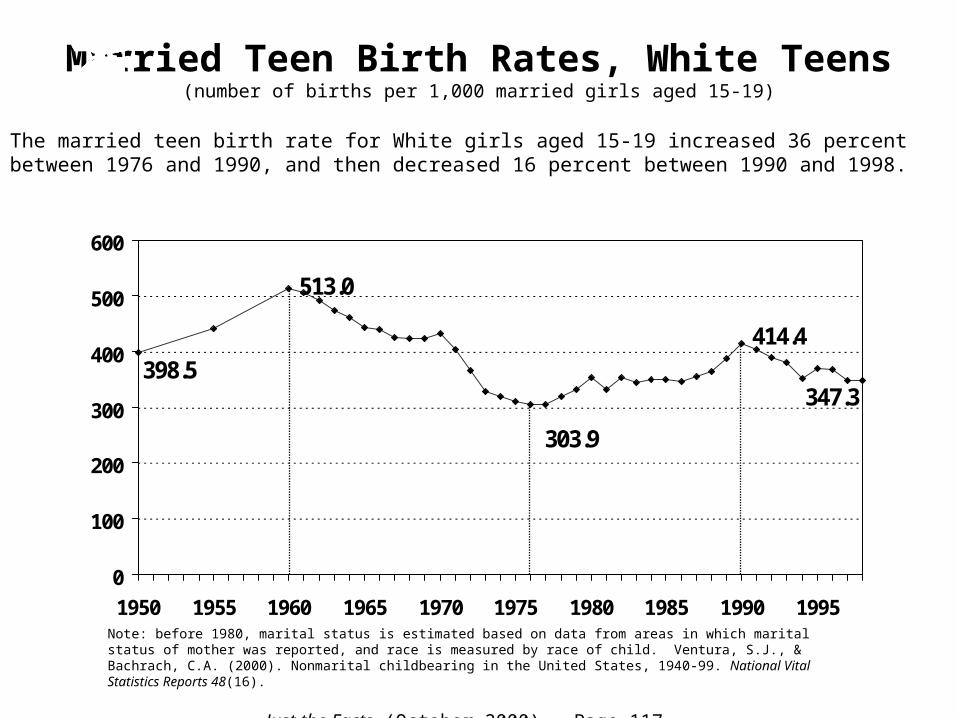
Married Teen Birth Rates, White Teens(number of births per 1,000 married girls aged 15-19)
513.0
347.3
414.4
398.5
303.9
0
100
200
300
400
500
600
1950 1955 1960 1965 1970 1975 1980 1985 1990 1995Note: before 1980, marital status is estimated based on data from areas in which marital status of mother was reported, and race is measured by race of child. Ventura, S.J., & Bachrach, C.A. (2000). Nonmarital childbearing in the United States, 1940-99. National Vital Statistics Reports 48(16).
Just the Facts (October 2000) – Page 117
The married teen birth rate for White girls aged 15-19 increased 36 percent between 1976 and 1990, and then decreased 16 percent between 1990 and 1998.

Married Teen Birth Rates, African-American Teens
(number of births per 1,000 married girls aged 15-19)
514.6
315.3
548.9
161.0182.6
0
100
200
300
400
500
600
1969 1972 1975 1978 1981 1984 1987 1990 1993 1996
Just the Facts (October 2000) – Page 118
Note: before 1980, marital status is estimated based on data from areas in which marital status of mother was reported, and race is measured by race of child. Ventura, S.J., & Bachrach, C.A. (2000). Nonmarital childbearing in the United States, 1940-99. National Vital Statistics Reports 48(16).
The married teen birth rate for African-American girls aged 15-19 increased 74 percent between 1979 and 1993, decreased 71 percent between 1993 and 1997, but then increased 13 percent between 1997 and 1998.

Married Teen Birth Rates, Hispanic Teens(number of births per 1,000 married girls aged 15-19)
335.1
439.4
360.4
447.7414.6
0
100
200
300
400
500
1990 1991 1992 1993 1994 1995 1996 1997 1998
Just the Facts (October 2000) – Page 119
The married teen birth rate for Hispanic girls aged 15-19 decreased 19 percent between 1990 and 1998.
Ventura, S.J., & Bachrach, C.A. (2000). Nonmarital childbearing in the United States, 1940-99. National Vital Statistics Reports 48(16).
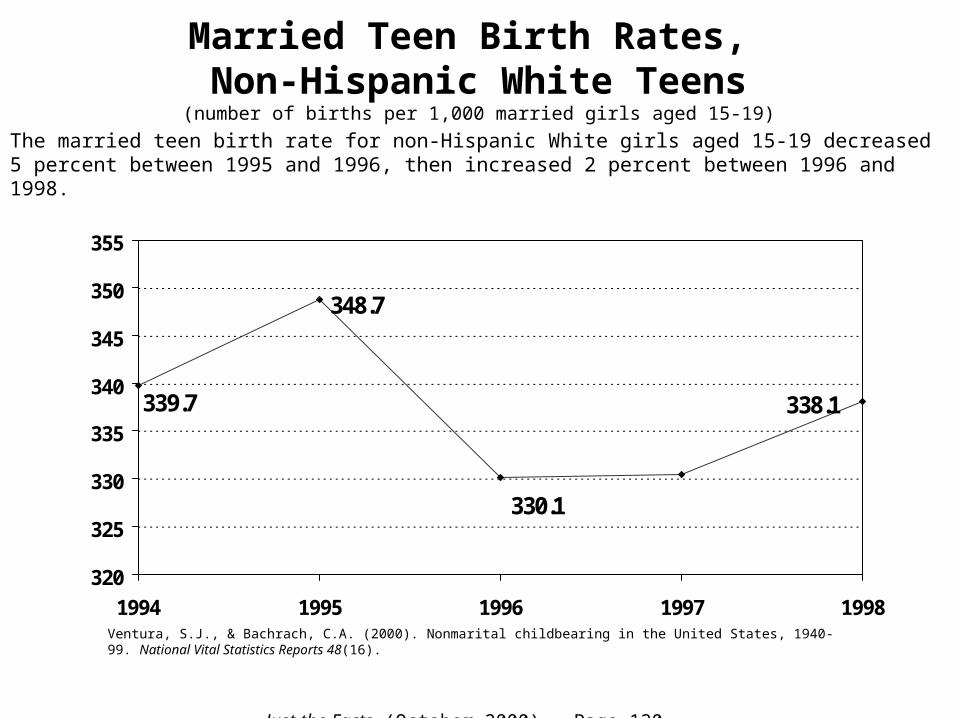
Married Teen Birth Rates, Non-Hispanic White Teens
(number of births per 1,000 married girls aged 15-19)
338.1
330.1
348.7
339.7
320
325
330
335
340
345
350
355
1994 1995 1996 1997 1998
Just the Facts (October 2000) – Page 120
The married teen birth rate for non-Hispanic White girls aged 15-19 decreased 5 percent between 1995 and 1996, then increased 2 percent between 1996 and 1998.
Ventura, S.J., & Bachrach, C.A. (2000). Nonmarital childbearing in the United States, 1940-99. National Vital Statistics Reports 48(16).
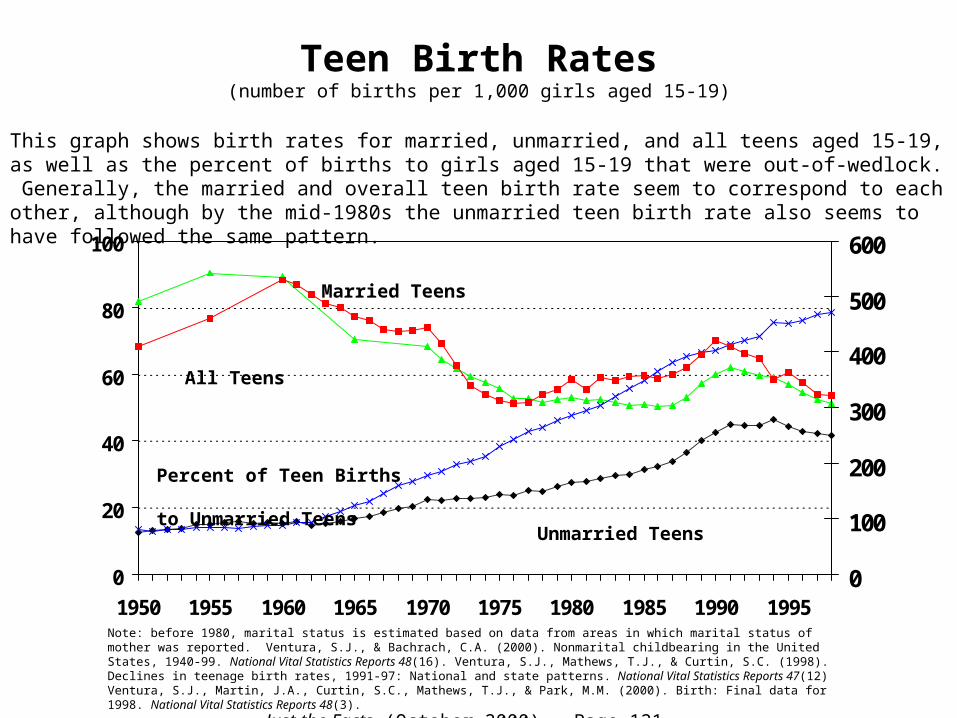
Teen Birth Rates(number of births per 1,000 girls aged 15-19)
0
20
40
60
80
100
1950 1955 1960 1965 1970 1975 1980 1985 1990 19950
100
200
300
400
500
600
Just the Facts (October 2000) – Page 121
This graph shows birth rates for married, unmarried, and all teens aged 15-19, as well as the percent of births to girls aged 15-19 that were out-of-wedlock. Generally, the married and overall teen birth rate seem to correspond to each other, although by the mid-1980s the unmarried teen birth rate also seems to have followed the same pattern.
Percent of Teen Births to
Unmarried TeensUnmarried Teens
All Teens
Married Teens
Note: before 1980, marital status is estimated based on data from areas in which marital status of mother was reported. Ventura, S.J., & Bachrach, C.A. (2000). Nonmarital childbearing in the United States, 1940-99. National Vital Statistics Reports 48(16). Ventura, S.J., Mathews, T.J., & Curtin, S.C. (1998). Declines in teenage birth rates, 1991-97: National and state patterns. National Vital Statistics Reports 47(12) Ventura, S.J., Martin, J.A., Curtin, S.C., Mathews, T.J., & Park, M.M. (2000). Birth: Final data for 1998. National Vital Statistics Reports 48(3).

Teen Birth Rates(number of births per 1,000 girls aged 15-19)
41.544.8 46.4
51.162.158.9
78.568.875.5
410.4
350.5322.1
10
30
50
70
90
110
1991 1992 1993 1994 1995 1996 1997 19980
50
100
150
200
250
300
350
400
450
Note: before 1980, marital status is estimated based on data from areas in which marital status of mother was reported. Ventura, S.J., & Bachrach, C.A. (2000). Nonmarital childbearing in the United States, 1940-99. National Vital Statistics Reports 48(16). Ventura, S.J., Mathews, T.J., & Curtin, S.C. (1998). Declines in teenage birth rates, 1991-97: National and state patterns. National Vital Statistics Reports 47(12) Ventura, S.J., Martin, J.A., Curtin, S.C., Mathews, T.J., & Park, M.M. (2000). Birth: Final data for 1998. National Vital Statistics Reports 48(3).
Just the Facts (October 2000) – Page 122
Between 1991 (when the overall teen birth rate peaked) and 1998, the rate for married and unmarried teens decreased 22 and 7 percent, respectively, the percent of teen births that were out-of-wedlock increased 14 percent, and the overall teen birth rate decreased 18 percent. Between 1994 (when the unmarried teen birth rate peaked) and 1998, rates for married, unmarried, and all teens decreased 8, 11, and 13 percent, respectively, while the percent of teens births that were out-of-wedlock increased 4 percent.
Percent of Teen Births to
Unmarried Teens
Unmarried Teens
All Teens
Married Teens

Marital Status at First Birth, Teens Aged 15-19
0% 20% 40% 60% 80% 100%
1930-341935-391940-441945-491950-541955-591960-641965-691970-741975-791980-841985-891990-94
Out-of-Wedlock Birth Legitimated Birth Marital Birth
Bachu, A. (1999). Trends in premarital childbearing: 1930-1994. Current Population Reports P23-197.
Just the Facts (October 2000) – Page 123
Between the time periods of 1930-34 and 1990-94, first births to teens aged 15-19 becane much more likely to occur to an unmarried teen. The proportion of all premaritally conceived births that were “legitimated” (born to a married teen) decreased from 49 percent in 1930-34 to 16 percent in 1990-94. Or, to put it another way, 16 percent of first births to married teens in 1930-34 were conceived premaritally, compared to 56 percent in 1990-94.

Marital Status at First Birth, White Teens Aged 15-19
0% 20% 40% 60% 80% 100%
1930-341935-391940-441945-491950-541955-591960-641965-691970-741975-791980-841985-891990-94
Out-of-Wedlock Birth Legitimated Birth Marital Birth
Bachu, A. (1999). Trends in premarital childbearing: 1930-1994. Current Population Reports P23-197.
Just the Facts (October 2000) – Page 124
Between the time periods of 1930-34 and 1990-94, first births to White teens aged 15-19 became much more likely to occur to an unmarried teen. The proportion of all premaritally conceived births that were legitimated decreased from 60 percent in 1930-34 to 19 percent in 1990-94. Or, to put it another way, 16 percent of first births to married teens in 1930-34 were conceived premaritally, compared to 53 percent in 1990-94.

Marital Status at First Birth, African American Teens Aged 15-19
0% 20% 40% 60% 80% 100%
1930-341935-391940-441945-491950-541955-591960-641965-691970-741975-791980-841985-891990-94
Out-of-Wedlock Birth Legitimated Birth Marital Birth
Bachu, A. (1999). Trends in premarital childbearing: 1930-1994. Current Population Reports P23-197.
Just the Facts (October 2000) – Page 125
Between the time periods of 1930-34 and 1990-94, first births to African American teens aged 15-19 became much more likely to occur to an unmarried teen. The proportion of all premaritally conceived births that were legitimated decreased from 22 percent in 1930-34 to 7 percent in 1990-94. Or, to put it another way, 16 percent of first births to married teens in 1930-34 were conceived premaritally, compared to 80 percent in 1990-94.

Marital Status at First Birth, Hispanic Teens Aged 15-19
0% 20% 40% 60% 80% 100%
1965-69
1970-74
1975-79
1980-84
1985-89
1990-94
Out-of-Wedlock Birth Legitimated Birth Marital Birth
Bachu, A. (1999). Trends in premarital childbearing: 1930-1994. Current Population Reports P23-197.
Just the Facts (October 2000) – Page 126
Between the time periods of 1965-69 and 1990-94, first births to Hispanic teens aged 15-19 became much more likely to occur to an unmarried teen. The proportion of all premaritally conceived births that were legitimated decreased from 24 percent in 1965-69 to 15 percent in 1990-94. Or, to put it another way, 11 percent of first births to married teens in 1965-69 were conceived premaritally, compared to 43 percent in 1990-94.

The Proportion of All Out-of-Wedlock BirthsThat Are to Teens, Women in Their 20s, and Women
Aged 30 Or Older, 1970 and 1999*
In 1970, teens accounted for one-half of all births to unmarried women. By 1999, this proportion decreased to 29 percent, with the majority of out-of-wedlock births now occurring among women aged 20-29.
Just the Facts (October 2000) – Page 127
* Data for 1999 are preliminary. Curtin, S.C., & Martin, J.A. (2000). Births: Preliminary data for 1999. National Vital Statistics Reports 48(14).
19 or Younger
50%
Aged 20-2942%
30 or Older8% 19 or
Younger29%
30 or Older15%
Aged 20-2956%
1970 1999*

Teen Births as a Proportion of All Births, 1999*
Of the 4 million births occurring in the U.S. in 1999, 12.2 percent were to girls under age 20.
Girls Under 2012.2%
Women 20 and Older87.8%
Just the Facts (October 2000) – Page 128
* Data for 1999 are preliminary. Curtin, S.C., & Martin, J.A. (2000). Births: Preliminary data for 1999. National Vital Statistics Reports 48(14).

Teen Births as a Proportion of All Births, by Race/Ethnicity, 1998
The proportion of all births that are to teens ranges from 5.4 percent for Asian/Pacific Islanders to 21.5 percent for African Americans.
21.5%
20.9%
16.9%5.4%
9.4%
11.1%
83.1%
94.6%
79.1%
78.5%
90.6%
88.9%
0% 20% 40% 60% 80% 100%
White (total)
White (non-Hispanic)
African American
Native American
Asian/Pacific Islander
Hispanic (any race)
Girls Aged 15-19 Women Aged 20 or Older
Just the Facts (October 2000) – Page 129
Ventura, S.J., Martin, J.A., Curtin, S.C., Mathews, T.J., & Park, M.M. (2000). Birth: Final data for 1998. National Vital Statistics Reports 48(3).

Teen Births as a Proportion of All Births, Hispanics, 1998
The proportion of all Hispanic births that are to teens ranges from 6.9 percent for Hispanics of Cuban descent to 21.9 percent for Hispanics of Puerto Rican descent.
17.5%
21.9%
20.2%
16.9%
10.3%
6.9%
83.1%
79.8%
89.7%
78.1%
93.1%
82.5%
0% 20% 40% 60% 80% 100%
Mexican Descent
Cuban Descent
Puerto Rican Descent
Central/South American
Other/Unknown Hispanic
Hispanic (total)
Girls Aged 15-19 Women Aged 20 or Older
Just the Facts (October 2000) – Page 130
Ventura, S.J., Martin, J.A., Curtin, S.C., Mathews, T.J., & Park, M.M. (2000). Birth: Final data for 1998. National Vital Statistics Reports 48(3).

Teen Births as a Proportion of All Births, Asian/Pacific Islanders, 1998
18.8%
5.8%
6.2%
2.4%
0.9%
5.4%94.6%
99.1%
97.6%
81.2%
93.8%
94.2%
0% 20% 40% 60% 80% 100%
Other Asian/Pacific Islander
Filipino Descent
Hawaiian Descent
Japanese Descent
Chinese Descent
Asian/Pacific Islander (total)
Girls Aged 15-19 Women Aged 20 or Older
Just the Facts (October 2000) – Page 131
The proportion of all Asian/Pacific Islander births that are to teens ranges from 0.9 percent for Asian/Pacific Islanders of Chinese descent to 18.8 percent for Asian/Pacific Islanders of Hawaiian descent.
Ventura, S.J., Martin, J.A., Curtin, S.C., Mathews, T.J., & Park, M.M. (2000). Birth: Final data for 1998. National Vital Statistics Reports 48(3).

Number of Teen Births by Race/Ethnicity, 1998
(births to teen girls aged 15-19)
Looking at teen births by race, 70 percent occurred to White teens. Looking at teen births by Hispanic ethnicity, one-quarter occurred to Hispanic teens. Combining race and ethnicity, non-Hispanic White teens account for the most births.
Just the Facts (December 2000) – Page 132
White70%
Native American
2%
Black26%
Asian/Pacific Islander
2%
By Race By Ethnicity By Race/Ethnicity
Hispanic25%
Ethnicity Not Reported
1%
Non-Hispanic74%
Ventura, S.J., Martin, J.A., Curtin, S.C., Mathews, T.J., & Park, M.M. (2000). Birth: Final data for 1998. National Vital Statistics Reports 48(3).
Non-Hispanic Other
3%
Non-Hispanic Black26%
Hispanic25%
Ethnicity Not Reported
1%Non-Hispanic
White45%
121,388
359,028
126,937
124,076
(15,783)
219,169
121,388
340,694
(8,201)
(9,063)
(4,479)
(4,479)

Just the Facts is a work in progress!
• Sexual activity,
• Contraceptive use,
• The teen population, and
• Consequences of teen childbearing.
Sections to be added will include data on:

The mission of the National Campaign to Prevent Teen Pregnancy is to improve the life
prospects of this generation and the next – and, in particular, to reduce child poverty – by
influencing cultural values and building a more effective grassroots movement. The
Campaign’s goal is to reduce the teen pregnancy rate by one-third between 1996 and
2005.
The National Campaign to Prevent Teen Pregnancy
1776 Massachusetts Avenue, NW, Suite 200
Washington, DC 20036
(202) 478-8500
(202) 478-8588 fax
www.teenpregnancy.org