k-core decomposition of internet graphs: …barrat/nhm.pdf · k-core decomposition of internet...
TRANSCRIPT

NETWORKS AND HETEROGENEOUS MEDIA Website: http://aimSciences.orgc©American Institute of Mathematical SciencesVolume 3, Number 2, June 2008 pp. 371–393
K-CORE DECOMPOSITION OF INTERNET GRAPHS:
HIERARCHIES, SELF-SIMILARITY AND MEASUREMENT
BIASES
Jose Ignacio Alvarez-Hamelin
CONICET and Facultad de Ingenierıa, Universidad de Buenos AiresPaseo Colon 850, C1063ACV Ciudad de Buenos Aires, Argentina
Luca Dall’Asta
Abdus Salam International Center for Theoretical PhysicsStrada Costiera 11, 34014 Trieste, Italy
Alain Barrat
LPT (UMR du CNRS 8627), Universite de Paris-Sud, France, andComplex Networks Lagrange Laboratory, ISI, Torino 10133, Italy
Alessandro Vespignani
School of Informatics, Indiana University, Bloomington, IN 47408, USA, andComplex Networks Lagrange Laboratory, ISI, Torino 10133, Italy
Abstract. We consider the k-core decomposition of network models and In-ternet graphs at the autonomous system (AS) level. The k-core analysis allowsto characterize networks beyond the degree distribution and uncover structuralproperties and hierarchies due to the specific architecture of the system. Wecompare the k-core structure obtained for AS graphs with those of several net-work models and discuss the differences and similarities with the real Internetarchitecture. The presence of biases and the incompleteness of the real mapsare discussed and their effect on the k-core analysis is assessed with numericalexperiments simulating biased exploration on a wide range of network mod-els. We find that the k-core analysis provides an interesting characterizationof the fluctuations and incompleteness of maps as well as information helpingto discriminate the original underlying structure.
1. Introduction. In recent times, mapping projects of the World WideWeb (WWW) and the physical Internet have offered the first chance to study topol-ogy and traffic of large-scale networks. The study of large scale networks, however,faces us with an array of new challenges. The definitions of centrality, hierarchiesand structural organizations are in particular hindered by the large size of the sys-tems and the complex interplay of engineering, traffic, geographical, and economicalattributes characterizing their construction.
In this paper we propose the k-core decomposition as a graph analysis tool ableto highlight interesting structural properties that are not captured by the degreedistribution or other simple topological measures.The k-core decomposition [43,8, 5] consists in identifying particular subsets of the network, called k-cores, each
2000 Mathematics Subject Classification. 68R10, 05C90, 68M07.Key words and phrases. k-core decomposition, Internet maps.
371
372 J. I. ALVAREZ-HAMELIN, L. DALL’ASTA, A. BARRAT AND A. VESPIGNANI
one obtained by a recursive pruning strategy. The k-core decomposition thereforeprovides a probe to study the hierarchical properties of large scale networks, focusingon the network’s regions of increasing centrality and connectedness properties. Morecentral cores are indeed more strongly connected, with larger number of possibledistinct paths between vertices: this allows to obtain not only more robust routingproperties but also a better opportunity to find a path with specific Quality ofService (QoS).
Here we study a set of basic network models and the AS level Internet mapsobtained in two large scale measurement projects using very different techniques.We first characterize the k-core structure of real Internet maps and compare withthe structure obtained in the various models. We find that the k-core structure isextremely different in light tailed and heavy-tailed networks and is able to clearlydiscriminate among various models presented in the literature. In this perspectivethe k-core analysis represents a useful tool in the model validation process. More-over, any result concerning Internet maps has to consider their incompleteness andthe presence of measurements biases. For this reason we also present a study ofthe stability of the k-core analysis in the presence of biases and incomplete sam-pling in all the network models considered. Our findings indicate that the k-coredecomposition’s fingerprints allow the discrimination between heterogeneous andhomogeneous topologies even after an incomplete sampling: this shows that thesignatures observed in the AS Internet maps are qualitatively reliable, even if somebiases are unavoidable at a detailed quantitative level.
2. Related work. In the last years, a wealth of studies have focused on the largescale structure and heterogeneities of networked structure of practical interest insocial science, critical infrastructures and epidemiology [1, 17, 40]. The Internet hasbeen readily considered as a prototypical example of complex network by the sci-entific community and starting with the seminal paper by Faloutsos, Faloutsos andFaloutsos [21] an impressive number of papers has dealt with the characterizationof its large scale properties and hierarchies [46, 42, 40, 45, 31, 29]. While the initialinterest has been focused on the general principles leading to the basic organizationfeatures of complex networks, the research activity is now diving into system spe-cific features that distinguish and highlight the various forces and/or engineeringat work in each class of networks. This is a particular pressing need in the Internetwhere even at the Autonomous System (AS) level the large scale self-organizationprinciples are working along with economical and technical constraints, optimiza-tion principles and so on [29, 19]. In addition actual Internet maps are not free fromerrors and measurement biases. For this reason, recent works have been devoted toa better understanding of the possible sources of errors and biases presented by theexperimental data [27, 41, 15, 16, 26, 13, 47]. Since Internet maps are typically basedon a sampling of routes between sources and destinations (obtained by tools suchas traceroute), these studies have dealt with simplified models of traceroute-likesampling, applied to graphs with various topological properties. They have shownthat, except in some peculiar cases [13], the sampling process allows to distinguishqualitatively between networks with strongly different properties (homogeneous vs.heterogeneous), while a quantitative and detailed view of the network may sufferimportant biases.
Here, we consider the use of the k-core decomposition as a probe for the structureof Internet maps. The k-core decomposition has mostly been used in biologically
K-CORE DECOMPOSITION OF INTERNET GRAPHS 373
related contexts, where it was applied to the analysis of protein interaction net-works or in the prediction of protein functions [3, 50]. An interesting applicationin the area of networking has been provided by Gkantsidis et al. [24] and Gaertleret al. [23], where the k-core decomposition is used for filtering out peripheral Au-tonomous Systems (ASes) in the case of Internet maps. The k-core decompositionhas also recently been used as a basis for the visualization of large networks, in par-ticular for AS maps [7, 2, 28]. Finally, recent works using the k-core analysis havefocused on the analysis of the Internet maps obtained by the DIMES project [32].In Ref.s [11, 12], an approach based on the k-core decomposition has been used toprovide a conceptual and structural model of the Internet, the so-called Medusamodel for the Internet. Up to now, no study has however considered the k-coredecomposition of the various commonly used models for complex networks, norcompared it to the one of real-world networks. Subramanian et al. [45] have pro-posed to classify ASes in five different levels or “tiers”, and given a method toextract this classification from the AS directed graph. This method can howeverlead to some biases when the knowledge of the all peer-to-peer relationships is notcomplete. The k-core decomposition studied in this paper considers on the otherhand undirected networks, and yields a finer hierarchy, not based on the commercialrelations between vertices, and in which the number of levels is not fixed a prioribut depends on the characteristics of the network. It is moreover not restricted toAS maps but can be applied as well for example to Internet router maps or moregenerally to any real or computer generated graph.
3. k-core decomposition. Let us consider a graph G = (V, E) of |V | = n verticesand |E| = e edges, the definition from [5] of k-cores is the followingDefinition 1: A subgraph H = (C, E|C) induced by the set C ⊆ V is a k-core or acore of order k if and only if the degree of every node v ∈ C induced in H is greateror equal than k (in symbolic form, this reads ∀v ∈ C : degreeH(v) ≥ k), and H isthe maximum subgraph with this property.
A k-core of G can therefore be obtained by recursively removing all the verticesof degree less than k, until all vertices in the remaining graph have degree at leastk. It is worth remarking that this process is not equivalent to prune vertices of acertain degree. Indeed, a star-like subgraph formed by a vertex with a high degreethat connects many vertices with degree one, and connected only with a single edgeto the rest of the graph, is going to belong to the first shell no matter how high isthe degree of the vertex. We will also use the following definitionsDefinition 2: A vertex i has shell index k if it belongs to the k-core but not to(k + 1)-core.Definition 3: A k-shell Sk is composed by all the vertices whose shell index is k.The maximum value k such that Sk is not empty is denoted kmax. The k-core isthus the union of all shells Sc with c ≥ k.Definition 4: Each connected set of vertices having the same shell index c isa cluster Qc, where the corresponding set of edges are those connecting verticesof the cluster. Each shell Sc is thus composed by clusters Qc
m, such that Sc =∪1≤m≤qc
max
Qcm, where qc
max is the number of clusters in Sc.The k-core decomposition therefore identifies progressively internal cores and
decomposes the networks layer by layer, revealing the structure of the differentk-shells from the outmost one to the most internal one, as sketched in Fig. 1.
374 J. I. ALVAREZ-HAMELIN, L. DALL’ASTA, A. BARRAT AND A. VESPIGNANI
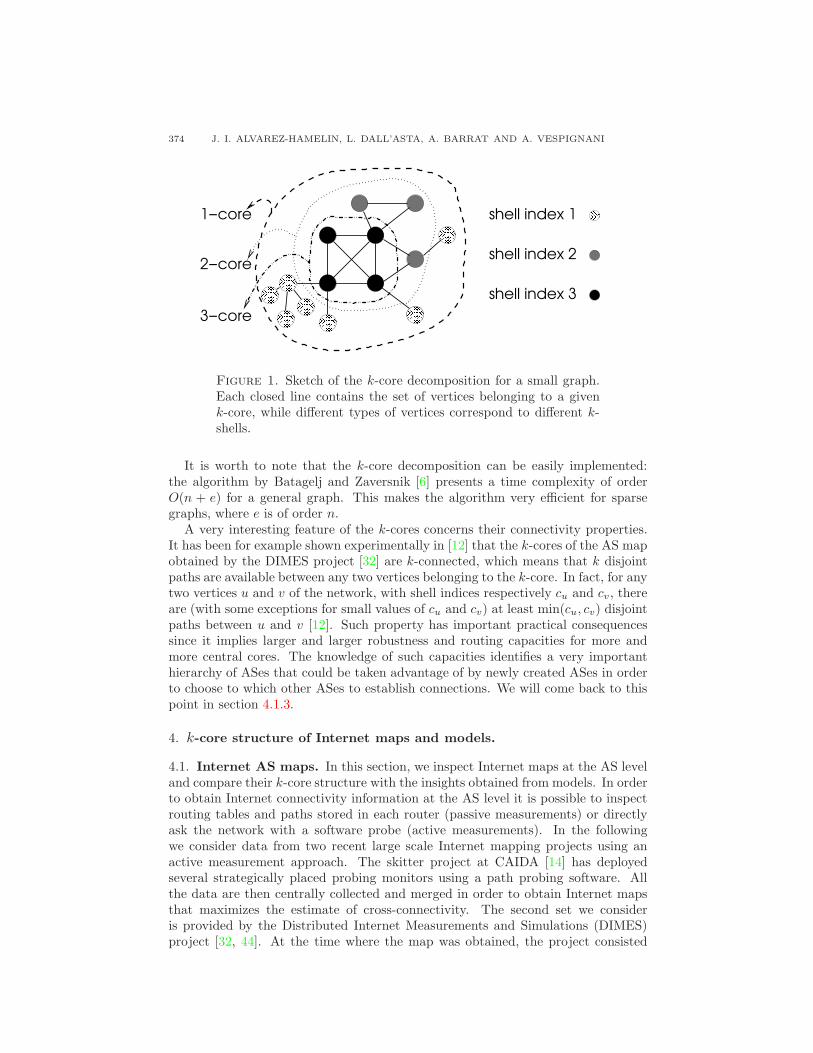
Figure 1. Sketch of the k-core decomposition for a small graph.Each closed line contains the set of vertices belonging to a givenk-core, while different types of vertices correspond to different k-shells.
It is worth to note that the k-core decomposition can be easily implemented:the algorithm by Batagelj and Zaversnik [6] presents a time complexity of orderO(n + e) for a general graph. This makes the algorithm very efficient for sparsegraphs, where e is of order n.
A very interesting feature of the k-cores concerns their connectivity properties.It has been for example shown experimentally in [12] that the k-cores of the AS mapobtained by the DIMES project [32] are k-connected, which means that k disjointpaths are available between any two vertices belonging to the k-core. In fact, for anytwo vertices u and v of the network, with shell indices respectively cu and cv, thereare (with some exceptions for small values of cu and cv) at least min(cu, cv) disjointpaths between u and v [12]. Such property has important practical consequencessince it implies larger and larger robustness and routing capacities for more andmore central cores. The knowledge of such capacities identifies a very importanthierarchy of ASes that could be taken advantage of by newly created ASes in orderto choose to which other ASes to establish connections. We will come back to thispoint in section 4.1.3.
4. k-core structure of Internet maps and models.
4.1. Internet AS maps. In this section, we inspect Internet maps at the AS leveland compare their k-core structure with the insights obtained from models. In orderto obtain Internet connectivity information at the AS level it is possible to inspectrouting tables and paths stored in each router (passive measurements) or directlyask the network with a software probe (active measurements). In the followingwe consider data from two recent large scale Internet mapping projects using anactive measurement approach. The skitter project at CAIDA [14] has deployedseveral strategically placed probing monitors using a path probing software. Allthe data are then centrally collected and merged in order to obtain Internet mapsthat maximizes the estimate of cross-connectivity. The second set we consideris provided by the Distributed Internet Measurements and Simulations (DIMES)project [32, 44]. At the time where the map was obtained, the project consisted
K-CORE DECOMPOSITION OF INTERNET GRAPHS 375
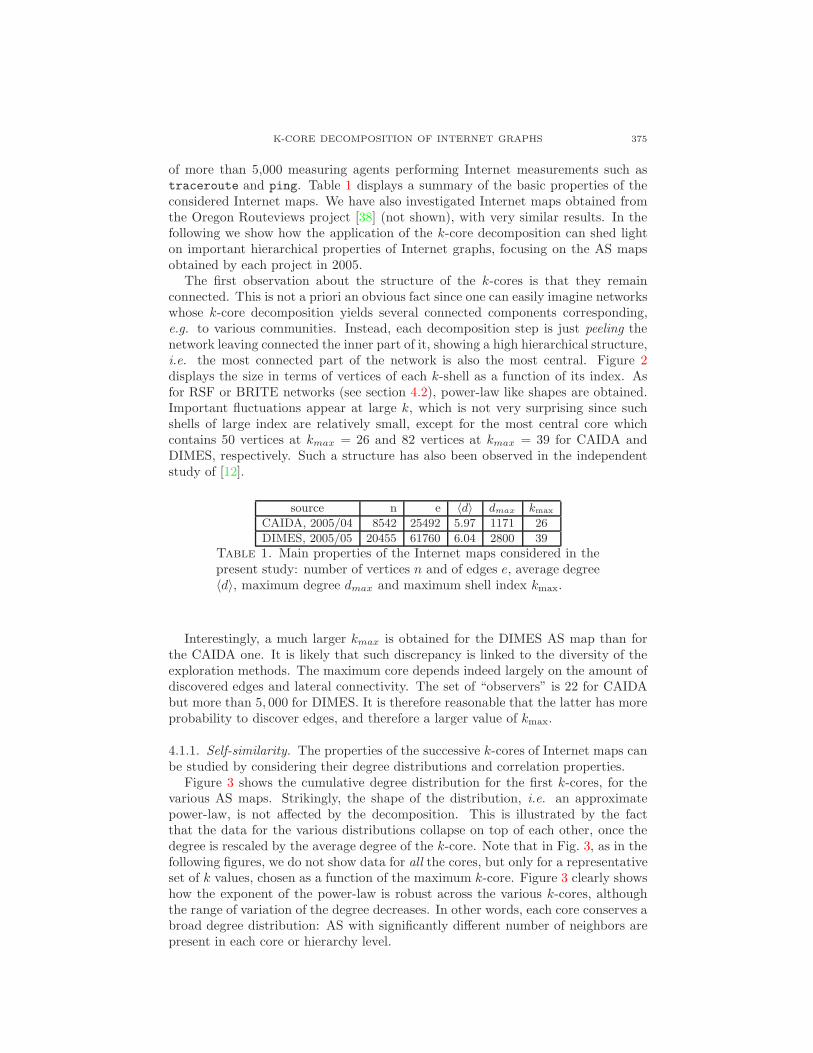
of more than 5,000 measuring agents performing Internet measurements such astraceroute and ping. Table 1 displays a summary of the basic properties of theconsidered Internet maps. We have also investigated Internet maps obtained fromthe Oregon Routeviews project [38] (not shown), with very similar results. In thefollowing we show how the application of the k-core decomposition can shed lighton important hierarchical properties of Internet graphs, focusing on the AS mapsobtained by each project in 2005.
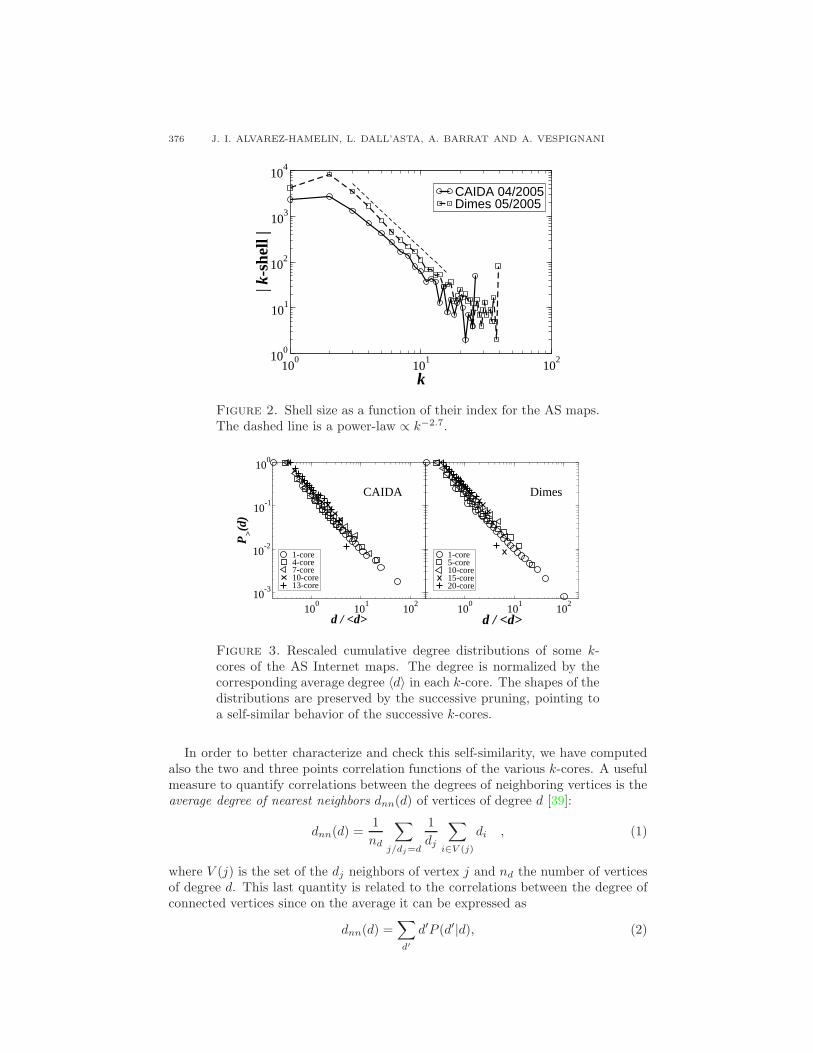
The first observation about the structure of the k-cores is that they remainconnected. This is not a priori an obvious fact since one can easily imagine networkswhose k-core decomposition yields several connected components corresponding,e.g. to various communities. Instead, each decomposition step is just peeling thenetwork leaving connected the inner part of it, showing a high hierarchical structure,i.e. the most connected part of the network is also the most central. Figure 2displays the size in terms of vertices of each k-shell as a function of its index. Asfor RSF or BRITE networks (see section 4.2), power-law like shapes are obtained.Important fluctuations appear at large k, which is not very surprising since suchshells of large index are relatively small, except for the most central core whichcontains 50 vertices at kmax = 26 and 82 vertices at kmax = 39 for CAIDA andDIMES, respectively. Such a structure has also been observed in the independentstudy of [12].
source n e 〈d〉 dmax kmax
CAIDA, 2005/04 8542 25492 5.97 1171 26
DIMES, 2005/05 20455 61760 6.04 2800 39
Table 1. Main properties of the Internet maps considered in thepresent study: number of vertices n and of edges e, average degree〈d〉, maximum degree dmax and maximum shell index kmax.
Interestingly, a much larger kmax is obtained for the DIMES AS map than forthe CAIDA one. It is likely that such discrepancy is linked to the diversity of theexploration methods. The maximum core depends indeed largely on the amount ofdiscovered edges and lateral connectivity. The set of “observers” is 22 for CAIDAbut more than 5, 000 for DIMES. It is therefore reasonable that the latter has moreprobability to discover edges, and therefore a larger value of kmax.
4.1.1. Self-similarity. The properties of the successive k-cores of Internet maps canbe studied by considering their degree distributions and correlation properties.
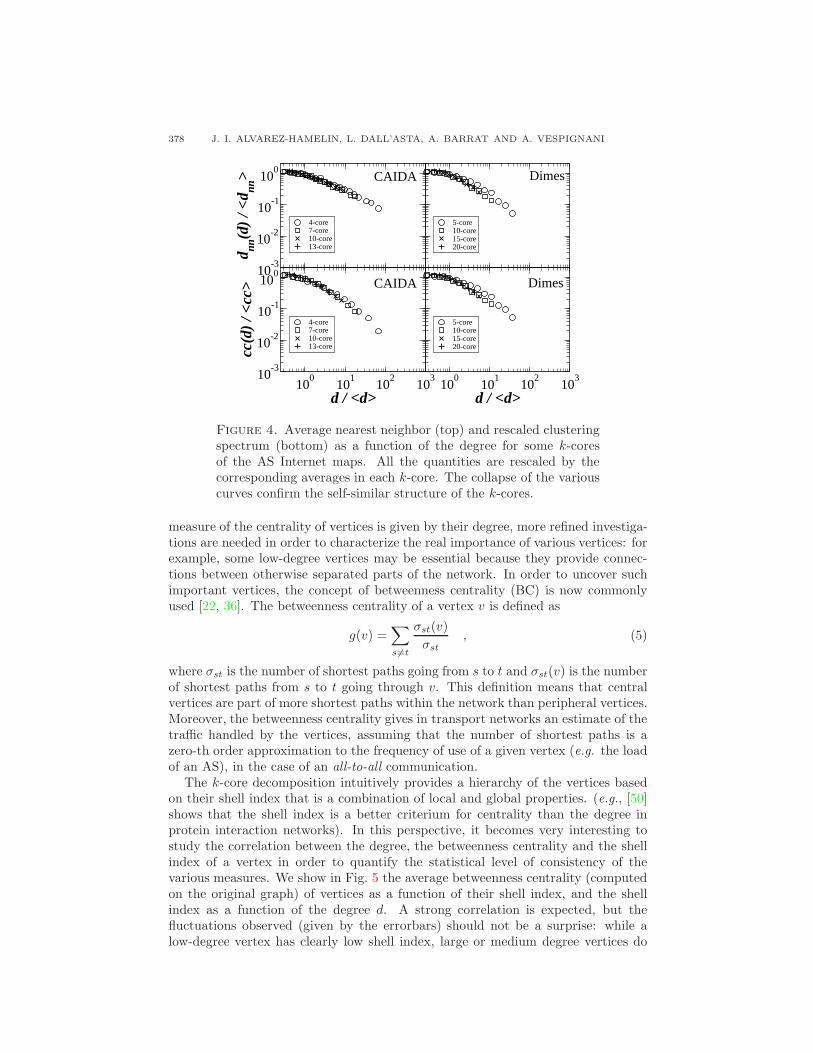
Figure 3 shows the cumulative degree distribution for the first k-cores, for thevarious AS maps. Strikingly, the shape of the distribution, i.e. an approximatepower-law, is not affected by the decomposition. This is illustrated by the factthat the data for the various distributions collapse on top of each other, once thedegree is rescaled by the average degree of the k-core. Note that in Fig. 3, as in thefollowing figures, we do not show data for all the cores, but only for a representativeset of k values, chosen as a function of the maximum k-core. Figure 3 clearly showshow the exponent of the power-law is robust across the various k-cores, althoughthe range of variation of the degree decreases. In other words, each core conserves abroad degree distribution: AS with significantly different number of neighbors arepresent in each core or hierarchy level.
376 J. I. ALVAREZ-HAMELIN, L. DALL’ASTA, A. BARRAT AND A. VESPIGNANI
100
101
102
k
100
101
102
103
104
| k-s
hell
|
CAIDA 04/2005Dimes 05/2005
Figure 2. Shell size as a function of their index for the AS maps.The dashed line is a power-law ∝ k−2.7.
100
101
102
d / <d>
10-3
10-2
10-1
100
P>(d
)
1-core4-core7-core10-core13-core
100
101
102
d / <d>
1-core5-core10-core15-core20-core
DimesCAIDA
Figure 3. Rescaled cumulative degree distributions of some k-cores of the AS Internet maps. The degree is normalized by thecorresponding average degree 〈d〉 in each k-core. The shapes of thedistributions are preserved by the successive pruning, pointing toa self-similar behavior of the successive k-cores.
In order to better characterize and check this self-similarity, we have computedalso the two and three points correlation functions of the various k-cores. A usefulmeasure to quantify correlations between the degrees of neighboring vertices is theaverage degree of nearest neighbors dnn(d) of vertices of degree d [39]:
dnn(d) =1
nd
∑
j/dj=d
1
dj
∑
i∈V (j)
di , (1)
where V (j) is the set of the dj neighbors of vertex j and nd the number of verticesof degree d. This last quantity is related to the correlations between the degree ofconnected vertices since on the average it can be expressed as
dnn(d) =∑
d′
d′P (d′|d), (2)

K-CORE DECOMPOSITION OF INTERNET GRAPHS 377
where P (d′|d) is the conditional probability that a vertex with degree d is connectedto a vertex with degree d′. If degrees of neighboring vertices are uncorrelated,P (d′|d) depends only on d′ and thus dnn(d) is a constant. When correlations arepresent, two main classes of possible correlations have been identified: assortative
behavior if dnn(d) increases with d, which indicates that large degree vertices arepreferentially connected with other large degree vertices, and disassortative if dnn(d)decreases with d [37]. From a routing point of view, a disassortative behavior cor-responds to a network structure where vertices with small degree are preferentiallyconnected to the hubs (i.e., large degree vertices). A second, and often studied,relevant quantity is the clustering coefficient [48] that measures the local group co-hesiveness and is defined for any vertex j as the fraction of connected neighborsof j
ccj = 2 · nlink/(dj(dj − 1)) , (3)
where nlink is the number of links between the dj neighbors of j. The study of theclustering spectrum cc(d) of vertices of degree d, defined as
cc(d) =1
nd
∑
j/dj=d
ccj , (4)
allows, e.g. to uncover hierarchies in which low degree vertices belong generally towell interconnected communities (high clustering coefficient), while hubs connectmany vertices that are not directly connected (small clustering coefficient). Largeclustering has a clear relevance for routing purposes since it indicates the presenceof alternative paths thanks to the presence of many triangles: if a link from a vertexu to a neighbor v goes down, the message can be sent from u to v through a commonneighbor.
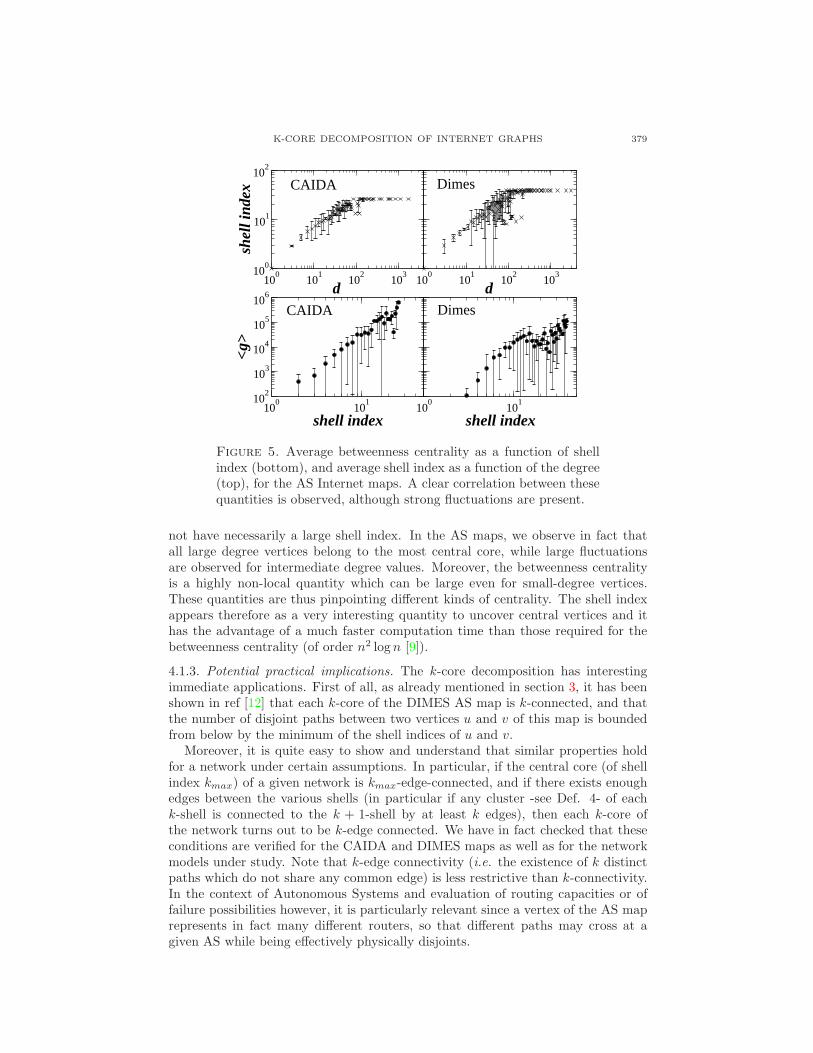
Figure 4 shows that not only the degree distribution but also the clustering andcorrelations structures of the Internet maps are essentially preserved as the moreand more external parts of the network are pruned. We note however that, as alsoshown in [12], the largest k-cores are no more scale-free: since they are very denselyconnected, their degree distribution is rather peaked around an average value andtheir topology is closer to that of a random graph with large average degree.
In summary, the AS networks exhibit a statistical scale invariance with respect tothe pruning obtained with the k-cores decomposition for a wide range of k. Indeed,while this decomposition identifies subgraphs that progressively correspond to themost central regions of the network, the statistical properties of these subgraphsare preserved at many levels of pruning. This hints to a sort of global self-similarityfor regions of increasing centrality of the network, and to a structure in which eachregion of the Internet as defined in terms of network centrality has the same prop-erties than the whole network. This is particularly interesting since the propertiesof the Internet (heterogeneous degree distributions, correlations, clustering...) havebeen up to now studied at the level of the whole map, while one can be interestedto restrict the analysis to some particular regions of the map, focusing for exampleon parts of the network with certain routing capabilities (QoS, failure support).At a general level, the k-core decomposition appears therefore as a suitable way todefine a pruning procedure equivalent to a scale-change preserving the statisticalproperties of graphs while focusing on their more and more connected parts.
4.1.2. Shell index and centrality. The identification of the most central vertices is amajor issue in networks characterization [22]. While a first intuitive and immediate
378 J. I. ALVAREZ-HAMELIN, L. DALL’ASTA, A. BARRAT AND A. VESPIGNANI
10-3
10-2
10-1
100
d nn(d
) / <
d nn>
4-core7-core10-core13-core
5-core10-core15-core20-core
100
101
102
103
d / <d>
10-3
10-2
10-1
100
cc(d
) / <
cc>
4-core7-core10-core13-core
100
101
102
103
d / <d>
5-core10-core15-core20-core
CAIDA
CAIDA
Dimes
Dimes
Figure 4. Average nearest neighbor (top) and rescaled clusteringspectrum (bottom) as a function of the degree for some k-coresof the AS Internet maps. All the quantities are rescaled by thecorresponding averages in each k-core. The collapse of the variouscurves confirm the self-similar structure of the k-cores.
measure of the centrality of vertices is given by their degree, more refined investiga-tions are needed in order to characterize the real importance of various vertices: forexample, some low-degree vertices may be essential because they provide connec-tions between otherwise separated parts of the network. In order to uncover suchimportant vertices, the concept of betweenness centrality (BC) is now commonlyused [22, 36]. The betweenness centrality of a vertex v is defined as
g(v) =∑
s6=t
σst(v)
σst, (5)
where σst is the number of shortest paths going from s to t and σst(v) is the numberof shortest paths from s to t going through v. This definition means that centralvertices are part of more shortest paths within the network than peripheral vertices.Moreover, the betweenness centrality gives in transport networks an estimate of thetraffic handled by the vertices, assuming that the number of shortest paths is azero-th order approximation to the frequency of use of a given vertex (e.g. the loadof an AS), in the case of an all-to-all communication.
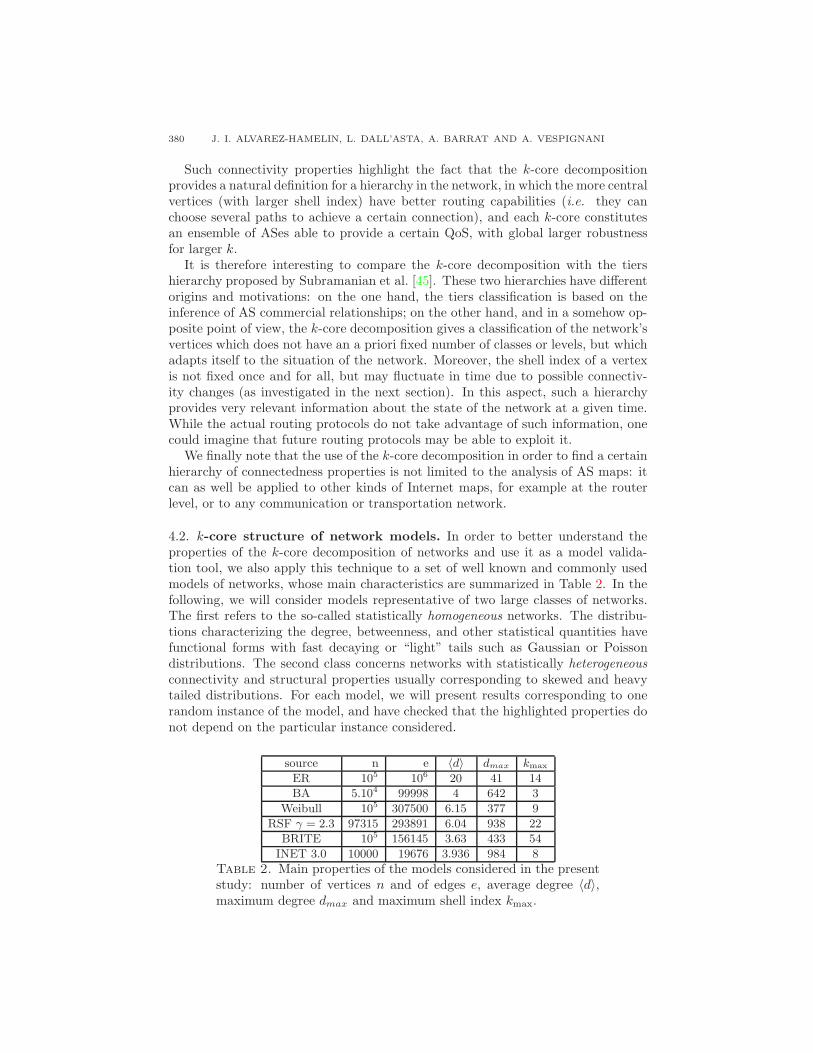
The k-core decomposition intuitively provides a hierarchy of the vertices basedon their shell index that is a combination of local and global properties. (e.g., [50]shows that the shell index is a better criterium for centrality than the degree inprotein interaction networks). In this perspective, it becomes very interesting tostudy the correlation between the degree, the betweenness centrality and the shellindex of a vertex in order to quantify the statistical level of consistency of thevarious measures. We show in Fig. 5 the average betweenness centrality (computedon the original graph) of vertices as a function of their shell index, and the shellindex as a function of the degree d. A strong correlation is expected, but thefluctuations observed (given by the errorbars) should not be a surprise: while alow-degree vertex has clearly low shell index, large or medium degree vertices do
K-CORE DECOMPOSITION OF INTERNET GRAPHS 379
100
101
102
103
d10
0
101
102
shel
l ind
ex
100
101
102
103
d
100
101
shell index
102
103
104
105
106
<g>
100
101
shell index
CAIDA Dimes
CAIDA Dimes
Figure 5. Average betweenness centrality as a function of shellindex (bottom), and average shell index as a function of the degree(top), for the AS Internet maps. A clear correlation between thesequantities is observed, although strong fluctuations are present.
not have necessarily a large shell index. In the AS maps, we observe in fact thatall large degree vertices belong to the most central core, while large fluctuationsare observed for intermediate degree values. Moreover, the betweenness centralityis a highly non-local quantity which can be large even for small-degree vertices.These quantities are thus pinpointing different kinds of centrality. The shell indexappears therefore as a very interesting quantity to uncover central vertices and ithas the advantage of a much faster computation time than those required for thebetweenness centrality (of order n2 log n [9]).
4.1.3. Potential practical implications. The k-core decomposition has interestingimmediate applications. First of all, as already mentioned in section 3, it has beenshown in ref [12] that each k-core of the DIMES AS map is k-connected, and thatthe number of disjoint paths between two vertices u and v of this map is boundedfrom below by the minimum of the shell indices of u and v.
Moreover, it is quite easy to show and understand that similar properties holdfor a network under certain assumptions. In particular, if the central core (of shellindex kmax) of a given network is kmax-edge-connected, and if there exists enoughedges between the various shells (in particular if any cluster -see Def. 4- of eachk-shell is connected to the k + 1-shell by at least k edges), then each k-core ofthe network turns out to be k-edge connected. We have in fact checked that theseconditions are verified for the CAIDA and DIMES maps as well as for the networkmodels under study. Note that k-edge connectivity (i.e. the existence of k distinctpaths which do not share any common edge) is less restrictive than k-connectivity.In the context of Autonomous Systems and evaluation of routing capacities or offailure possibilities however, it is particularly relevant since a vertex of the AS maprepresents in fact many different routers, so that different paths may cross at agiven AS while being effectively physically disjoints.
380 J. I. ALVAREZ-HAMELIN, L. DALL’ASTA, A. BARRAT AND A. VESPIGNANI
Such connectivity properties highlight the fact that the k-core decompositionprovides a natural definition for a hierarchy in the network, in which the more centralvertices (with larger shell index) have better routing capabilities (i.e. they canchoose several paths to achieve a certain connection), and each k-core constitutesan ensemble of ASes able to provide a certain QoS, with global larger robustnessfor larger k.
It is therefore interesting to compare the k-core decomposition with the tiershierarchy proposed by Subramanian et al. [45]. These two hierarchies have differentorigins and motivations: on the one hand, the tiers classification is based on theinference of AS commercial relationships; on the other hand, and in a somehow op-posite point of view, the k-core decomposition gives a classification of the network’svertices which does not have an a priori fixed number of classes or levels, but whichadapts itself to the situation of the network. Moreover, the shell index of a vertexis not fixed once and for all, but may fluctuate in time due to possible connectiv-ity changes (as investigated in the next section). In this aspect, such a hierarchyprovides very relevant information about the state of the network at a given time.While the actual routing protocols do not take advantage of such information, onecould imagine that future routing protocols may be able to exploit it.
We finally note that the use of the k-core decomposition in order to find a certainhierarchy of connectedness properties is not limited to the analysis of AS maps: itcan as well be applied to other kinds of Internet maps, for example at the routerlevel, or to any communication or transportation network.
4.2. k-core structure of network models. In order to better understand theproperties of the k-core decomposition of networks and use it as a model valida-tion tool, we also apply this technique to a set of well known and commonly usedmodels of networks, whose main characteristics are summarized in Table 2. In thefollowing, we will consider models representative of two large classes of networks.The first refers to the so-called statistically homogeneous networks. The distribu-tions characterizing the degree, betweenness, and other statistical quantities havefunctional forms with fast decaying or “light” tails such as Gaussian or Poissondistributions. The second class concerns networks with statistically heterogeneous
connectivity and structural properties usually corresponding to skewed and heavytailed distributions. For each model, we will present results corresponding to onerandom instance of the model, and have checked that the highlighted properties donot depend on the particular instance considered.
source n e 〈d〉 dmax kmax
ER 105 106 20 41 14
BA 5.104 99998 4 642 3
Weibull 105 307500 6.15 377 9
RSF γ = 2.3 97315 293891 6.04 938 22
BRITE 105 156145 3.63 433 54
INET 3.0 10000 19676 3.936 984 8
Table 2. Main properties of the models considered in the presentstudy: number of vertices n and of edges e, average degree 〈d〉,maximum degree dmax and maximum shell index kmax.
K-CORE DECOMPOSITION OF INTERNET GRAPHS 381
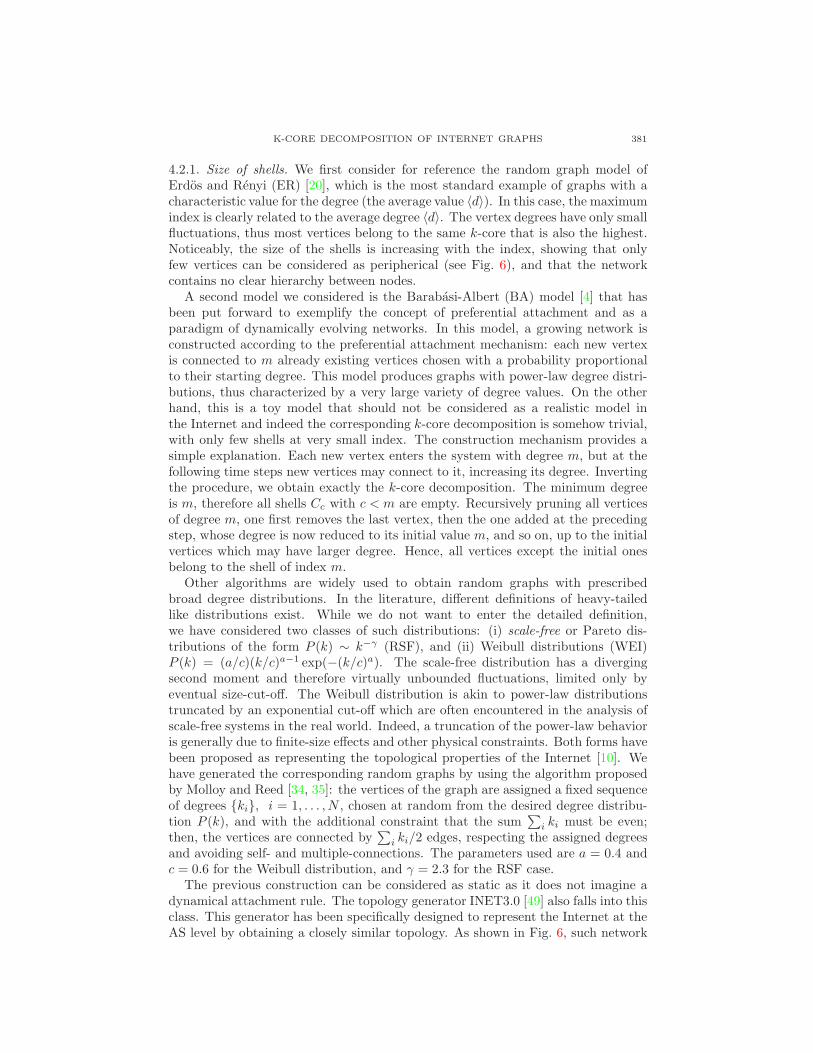
4.2.1. Size of shells. We first consider for reference the random graph model ofErdos and Renyi (ER) [20], which is the most standard example of graphs with acharacteristic value for the degree (the average value 〈d〉). In this case, the maximumindex is clearly related to the average degree 〈d〉. The vertex degrees have only smallfluctuations, thus most vertices belong to the same k-core that is also the highest.Noticeably, the size of the shells is increasing with the index, showing that onlyfew vertices can be considered as peripherical (see Fig. 6), and that the networkcontains no clear hierarchy between nodes.
A second model we considered is the Barabasi-Albert (BA) model [4] that hasbeen put forward to exemplify the concept of preferential attachment and as aparadigm of dynamically evolving networks. In this model, a growing network isconstructed according to the preferential attachment mechanism: each new vertexis connected to m already existing vertices chosen with a probability proportionalto their starting degree. This model produces graphs with power-law degree distri-butions, thus characterized by a very large variety of degree values. On the otherhand, this is a toy model that should not be considered as a realistic model inthe Internet and indeed the corresponding k-core decomposition is somehow trivial,with only few shells at very small index. The construction mechanism provides asimple explanation. Each new vertex enters the system with degree m, but at thefollowing time steps new vertices may connect to it, increasing its degree. Invertingthe procedure, we obtain exactly the k-core decomposition. The minimum degreeis m, therefore all shells Cc with c < m are empty. Recursively pruning all verticesof degree m, one first removes the last vertex, then the one added at the precedingstep, whose degree is now reduced to its initial value m, and so on, up to the initialvertices which may have larger degree. Hence, all vertices except the initial onesbelong to the shell of index m.
Other algorithms are widely used to obtain random graphs with prescribedbroad degree distributions. In the literature, different definitions of heavy-tailedlike distributions exist. While we do not want to enter the detailed definition,we have considered two classes of such distributions: (i) scale-free or Pareto dis-tributions of the form P (k) ∼ k−γ (RSF), and (ii) Weibull distributions (WEI)P (k) = (a/c)(k/c)a−1 exp(−(k/c)a). The scale-free distribution has a divergingsecond moment and therefore virtually unbounded fluctuations, limited only byeventual size-cut-off. The Weibull distribution is akin to power-law distributionstruncated by an exponential cut-off which are often encountered in the analysis ofscale-free systems in the real world. Indeed, a truncation of the power-law behavioris generally due to finite-size effects and other physical constraints. Both forms havebeen proposed as representing the topological properties of the Internet [10]. Wehave generated the corresponding random graphs by using the algorithm proposedby Molloy and Reed [34, 35]: the vertices of the graph are assigned a fixed sequenceof degrees {ki}, i = 1, . . . , N , chosen at random from the desired degree distribu-tion P (k), and with the additional constraint that the sum
∑i ki must be even;
then, the vertices are connected by∑
i ki/2 edges, respecting the assigned degreesand avoiding self- and multiple-connections. The parameters used are a = 0.4 andc = 0.6 for the Weibull distribution, and γ = 2.3 for the RSF case.
The previous construction can be considered as static as it does not imagine adynamical attachment rule. The topology generator INET3.0 [49] also falls into thisclass. This generator has been specifically designed to represent the Internet at theAS level by obtaining a closely similar topology. As shown in Fig. 6, such network
382 J. I. ALVAREZ-HAMELIN, L. DALL’ASTA, A. BARRAT AND A. VESPIGNANI
100
101
102
k
100
101
102
103
104
105
| k-s
hell
|
ERRSF,γ=2.3WeibullBRITEInetBA
Figure 6. Shell size as a function of their index for the variousmodels considered. The various models yield very different shapes,indicating the k-core decomposition as an interesting additionaltool for network characterization.
presents a small number of k-cores, with a shell size behavior that is exponentiallydecreasing for increasing shell index.
Another Internet topology generator often discussed in the literature is theBRITE generator [33], which proposes a growth mechanism combining the addi-tion of vertices with m new links according to the preferential attachment with theaddition of new links between already existing vertices, also through a preferentialattachment mechanism. In this case, a non-trivial structure of shells is obtained,with a largest shell index kmax much larger than the average degree, and a shell sizedecreasing as a power-law function of the index. This implies a similar power-lawrelation between the size of each k-core and its index, as observed in real Internetmaps. At large k, large fluctuations are observed, with a relatively large centralcore (see Fig. 6). The difference between BRITE and BA networks highlights thestructural relevance of the addition of new links between already existing verticesin a growing heterogeneous network model.
In general, as shown for an example in Fig. 6 (and with the exception of theBA model), random networks with heavy-tailed degree distributions present sys-tematically a large number of shells (we have also checked that kmax increases if γdecreases), and much larger than the average degree 〈d〉. The shell size is decreasingas a power-law of the index [18, 25], with a quite large central core of index kmax, asfor BRITE. On the contrary, Weibull distributed networks have relatively few shellswith a much smaller kmax. It is interesting that networks with relatively similar de-gree distributions can present in fact strongly different k-core decompositions. Thispoints to the k-core decomposition as a supplementary valuable tool for networkinvestigation.
4.2.2. Core statistics and structure. In this paragraph, we compare the character-istics of the different cores, i.e. of more and more central parts of the network. Inthe following we will focus only on the models that have a core structure resembling
K-CORE DECOMPOSITION OF INTERNET GRAPHS 383
10-3
10-2
10-1
100
P>(d
/ <
d>)
1-core5-core9-core13-core17-core
1-core8-core12-core19-core25-core
100
101
102
103
d / <d>
10-3
10-2
10-1
100
P>(d
/ <
d>) 1-core
2-core3-core4-core5-core
100
101
102
103
d / <d>
1-core2-core3-core4-core5-core
RSF, γ=2.3 Brite
Weibull Inet
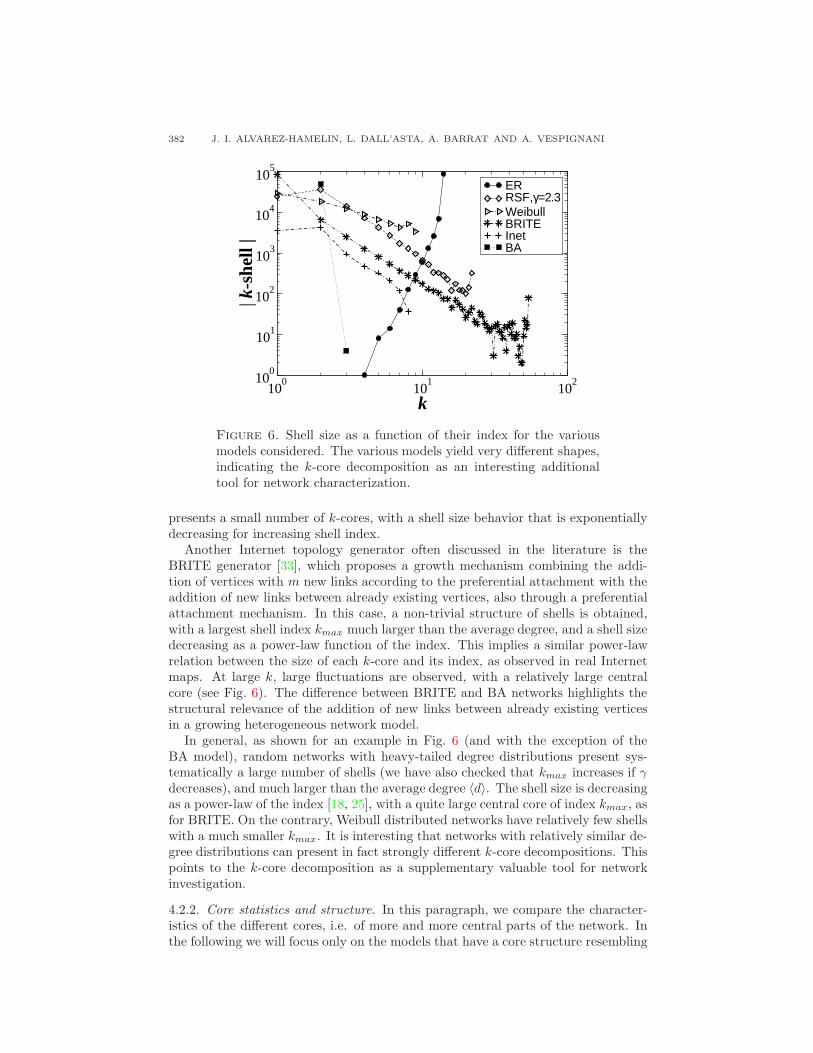
Figure 7. Cumulative degree distribution of some k-cores forsome model networks. For each k-core, the degree is normalizedby the average degree of the core. For these various models, thecollapse of the various distributions shows a striking property ofstatistical self-similarity of the successive k-cores.
that of the Internet as the ER and the BA models are readily ruled out as possiblecandidates to represent the Internet.
Figure 7 shows the cumulative degree distribution for some k-cores, for some ofthe studied models; namely, the probability P>(d) that any vertex in the networkshas a degree larger than d. Strikingly, the shape of the distribution (power-lawsor Weibull) is not affected by the decomposition. This feature, already noted in[18] for uncorrelated scale-free networks, points to a striking property of statisticalself-similarity of the generated k-cores, which resemble one with each other underthe opportune rescaling of the average degree.
As in the case of Internet maps, we characterize further this self-similarity bycomputing the 2 and 3 point correlations as defined by the average degree of nearestneighbors dnn(d) of vertices of degree d, and the clustering spectrum cc(d) of verticesof degree d. These quantities are reported in Fig.s 8 and 9 for the various k-cores.Strikingly, the behavior of the two quantities is preserved in all cases as the networkis recursively pruned of its low-degree vertices. In other words, the overall networktopology is invariant for k-cores of increasing centrality.
4.2.3. Summary. In summary, the k-core decomposition allows to uncover very dif-ferent structural properties for different models which may otherwise share e.g.very similar degree distributions. The k-core decomposition is therefore a usefultool in the context of the model validation process. For example, a growing net-work obtained with the linear preferential attachment rule may have a scale-freedistribution of degrees P (k) ∼ k−γ but will have a trivial shell structure becauseof its construction mechanism. On the other hand, randomly constructed scale-free networks, which may have weak correlation properties and small clustering,can present a rich hierarchical decomposition with a large central core of high shell

384 J. I. ALVAREZ-HAMELIN, L. DALL’ASTA, A. BARRAT AND A. VESPIGNANI
10-1
100
d nn /
<d nn
>5-core9-core13-core17-core
8-core12-core19-core25-core
100
101
102
103
d / <d>
10-1
100
d nn /
<d nn
>
2-core3-core4-core5-core
100
101
102
103
d / <d>
2-core3-core4-core5-core
RSF, γ=2.3 Brite
Weibull Inet
Figure 8. Nearest neighbors degree distribution of some k-cores,rescaled by the corresponding average values, for some model net-works. The degree of each node is normalized by the average de-gree of each k-core. The data collapse confirms the statistical self-similarity of the cores.
10-1
100
cc (
d) /
<cc
>
5-core9-core13-core17-core
8-core12-core19-core25-core
100
101
102
103
d / <d>
10-1
100
cc (
d) /
<cc
>
2-core3-core4-core5-core
100
101
102
103
d / <d>
2-core3-core4-core5-core
RSF, γ=2.3
Brite
Weibull Inet
Figure 9. Clustering coefficient spectrum of some k-cores for somemodel networks. The degree of each node is normalized by the av-erage degree of each k-core, and the clustering coefficient is rescaledby the average clustering of each k-core. Once again, a collapse isobserved, confirming the self-similarity of the k-cores.
index. This appears in agreement with the results of Ref. [30] where structural cor-relations and constraints appear to be sufficient to determine most of the observedstatistical properties observed in large scale graphs.
K-CORE DECOMPOSITION OF INTERNET GRAPHS 385
date # n e 〈d〉 dmax kmax
2001/05 7400 24791 6.700 1820 282002/03 8489 28871 6.802 2007 322003/05 8755 27300 6.236 1560 262004/04 9238 28016 6.065 1406 262005/04 8542 25492 5.969 1171 26
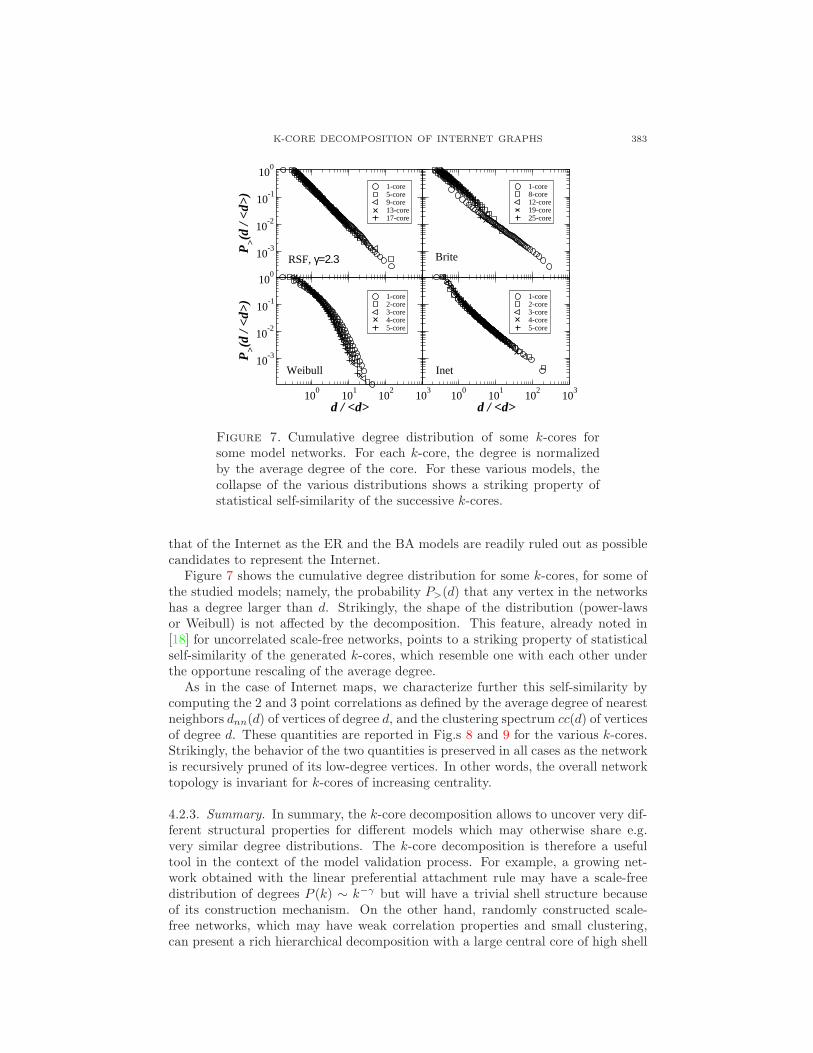
Table 3. Characteristics of the CAIDA AS maps considered forthe time analysis: number of vertices n and of edges e, averagedegree 〈d〉, maximum degree dmax and maximum shell index kmax.
5. k-cores, dynamics and sampling biases.
5.1. Temporal variations of the k-core structure. The availability of dataobtained by the various projects makes it possible to study the temporal evolutionof the Internet maps. We have considered the maps obtained by the CAIDA projectat various times between 2001 and 2005. Table 3 shows the main characteristics ofthe analyzed maps, each of which was obtained from the archives of one completemonth.
While statistical signatures such as degree distribution, disassortative behaviorand clustering spectrum are typically very stable over time, the k-core structureanalysis reveals some finer variations. For example, the number of vertices andedges and the maximal shell index fluctuate in the CAIDA maps. This can betracked down to the fact that the number of sources used by CAIDA changes (14for the 2001/05 map, 21 for 2002/03, 24 for 2003/05 and 2004/04, and 22 for2005/04), and that the locations of some of these sources also change.
Interesting informations also arise from the study of the change in the composi-tion of the various k-shells: we show as an example in Fig. 10 the probability for agiven AS to change from a shell of index x in a map obtained at a given time to ashell of index y in the successive map. While most vertices do not change their shellindex, as shown by the dark area around the diagonal, some suffer an importantchange of status, from a highly central shell to a peripherical one or vice-versa. Thishighlights the presence of strong structural fluctuations in the evolution of CAIDAAS maps.
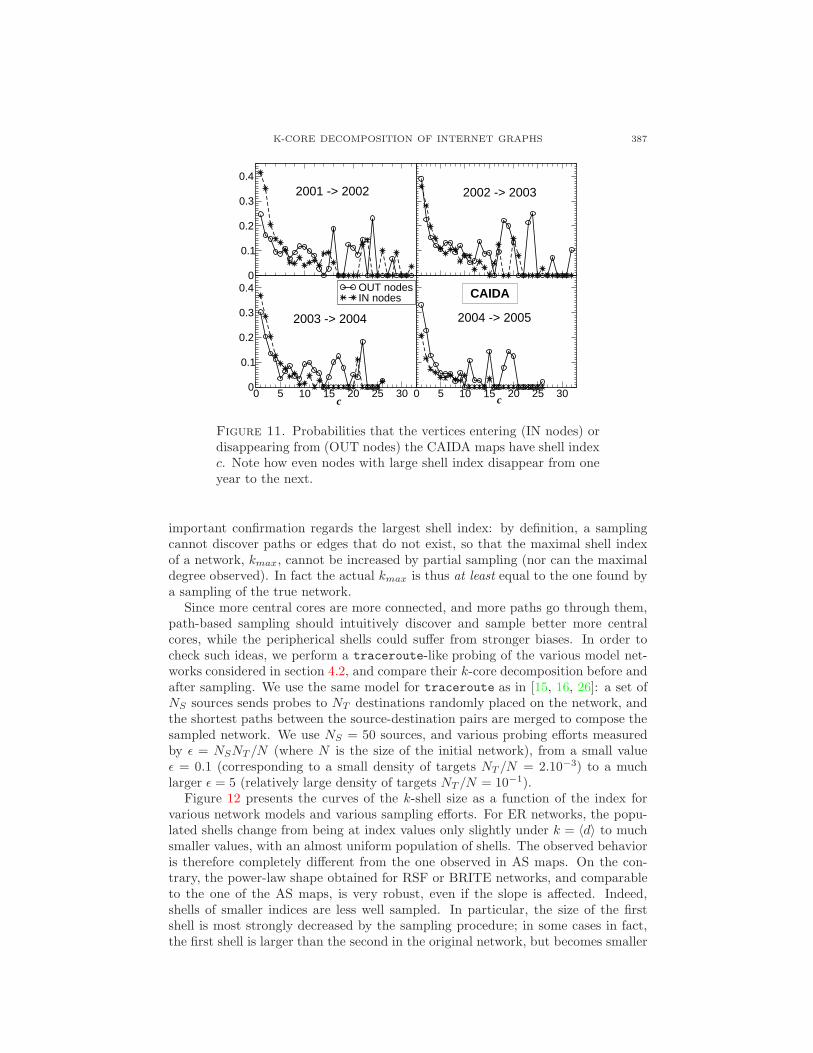
A further fingerprint of such structural changes is provided by the analysis of theshell index of vertices that appear in or disappear from the maps between one snap-shot and the other, as shown in Fig.11: vertices in all shells, even central ones, disap-pear from the CAIDA maps even in the most recent maps, between 2004 and 2005.The fluctuations observed in the shell index of ASes may be related to three factors.A first one is the natural evolution of the Internet structure. A second factor is there-numbering of the ASes for administrative reasons (see http://www.iana.org).A third factor is the uncertainty and bias in the data collection. In this respect,CAIDA maps seem to exhibit a high level of instability, indicative of a mappingprocess less stable in time. In this context, the k-core analysis appears as an inter-esting tool to highlight the temporal changes of the Internet structure as well as themeasurement reliability in each particular experimental set-up, at an intermediatelevel between global quantities and local ones such as the degree. It will certainlybe of interest in the future to study similar data for evolving DIMES maps, whichare obtained with a much larger set of sources.

386 J. I. ALVAREZ-HAMELIN, L. DALL’ASTA, A. BARRAT AND A. VESPIGNANI
Figure 10. The grayscale code gives the probability of a changein shell index, from the CAIDA map of 2004/04 (x axis) to the oneof 2005/04 (y axis). The points in line 0 correspond to ASes thatare present in 2004 but not in 2005, and the column 0 correspondsto the reverse situation. Most nodes do not change shell index,as the dark area around the diagonal shows, but some importantchanges occur, with central nodes becoming peripherical, or vice-versa.
5.2. Sampling biases. In this paragraph, we perform a sensitivity analysis of thek-core decomposition with respect to potential sampling biases. In particular wewant to assess the effect of incompleteness and sampling biases on the resultingstructure of sampled graphs. For this reason we will produce incomplete syntheticsampling processes of network models and compare the k-core structure of thesampled graph with that of the original one.
Internet maps are currently obtained through sampling methods of the real In-ternet, which are based on a merging of paths between sources and destinations,obtained either through Border Gateway Protocol routing tables or through ac-tive traceroute measurements. Such sampling processes present possible sourcesof errors and biases whose effect has been up to now studied essentially for thedegree distributions [27, 41, 15, 16, 13, 26]. The analysis of idealized samplingprocesses on networks with various topologies has in particular revealed that thebroadness of the degree distributions observed in Internet maps is a genuine feature,although important biases can remain on the exact form of the distribution, due toan undersampling of vertices with small degree. Moreover, although a path-basedsampling process can produce a heterogeneous graph out of an homogeneous initialnetwork (such as an ER graph), as rigorously shown in [13], this is restricted tothe case of a single source probing. It is therefore interesting to note that a singlesource traceroute-like probing of any network yields essentially a tree, whose k-core decomposition is by definition trivial (with kmax = 1). Another obvious but
K-CORE DECOMPOSITION OF INTERNET GRAPHS 387
0
0.1
0.2
0.3
0.4
0 5 10 15 20 25 30c
0
0.1
0.2
0.3
0.4 OUT nodesIN nodes
0 5 10 15 20 25 30c
2001 -> 2002 2002 -> 2003
2003 -> 2004 2004 -> 2005
CAIDA
Figure 11. Probabilities that the vertices entering (IN nodes) ordisappearing from (OUT nodes) the CAIDA maps have shell indexc. Note how even nodes with large shell index disappear from oneyear to the next.
important confirmation regards the largest shell index: by definition, a samplingcannot discover paths or edges that do not exist, so that the maximal shell indexof a network, kmax, cannot be increased by partial sampling (nor can the maximaldegree observed). In fact the actual kmax is thus at least equal to the one found bya sampling of the true network.
Since more central cores are more connected, and more paths go through them,path-based sampling should intuitively discover and sample better more centralcores, while the peripherical shells could suffer from stronger biases. In order tocheck such ideas, we perform a traceroute-like probing of the various model net-works considered in section 4.2, and compare their k-core decomposition before andafter sampling. We use the same model for traceroute as in [15, 16, 26]: a set ofNS sources sends probes to NT destinations randomly placed on the network, andthe shortest paths between the source-destination pairs are merged to compose thesampled network. We use NS = 50 sources, and various probing efforts measuredby ǫ = NSNT /N (where N is the size of the initial network), from a small valueǫ = 0.1 (corresponding to a small density of targets NT /N = 2.10−3) to a muchlarger ǫ = 5 (relatively large density of targets NT /N = 10−1).
Figure 12 presents the curves of the k-shell size as a function of the index forvarious network models and various sampling efforts. For ER networks, the popu-lated shells change from being at index values only slightly under k = 〈d〉 to muchsmaller values, with an almost uniform population of shells. The observed behavioris therefore completely different from the one observed in AS maps. On the con-trary, the power-law shape obtained for RSF or BRITE networks, and comparableto the one of the AS maps, is very robust, even if the slope is affected. Indeed,shells of smaller indices are less well sampled. In particular, the size of the firstshell is most strongly decreased by the sampling procedure; in some cases in fact,the first shell is larger than the second in the original network, but becomes smaller

388 J. I. ALVAREZ-HAMELIN, L. DALL’ASTA, A. BARRAT AND A. VESPIGNANI
101
102
103
104
105
| k-s
hell
|
101
102
103
104
105
origε=5ε=1
origε=5ε=1ε=0.1
100
101
k
101
102
103
104
| k-s
hell
|
100
101
101
102
103
104 orig
ε=5ε=1ε=0.1
100
101
k10
010
1
origε=5ε=1ε=0.1
ER
INET
RSF, γ=2.3 BRITE
Figure 12. Plot of the size of the k-shells vs. k for various models,before and after traceroute-like sampling, with different probingefforts ǫ. The qualitative shapes are preserved by sampling.
in the sampled network. We note that in the available AS maps, the first shell isindeed typically smaller than the second, and that the true AS network thus veryprobably exhibits a much larger shell of index k = 1. Similarly, one can expect thatthe exponent close to 2.7 of the power-law behavior of the shell size vs. its index(see [12] and Fig. 2) is a lower bound and that such value might be reconsideredin the future thanks to more and more extensive sampling efforts. On the otherhand, the fact that the shell of largest index is substantially larger than the oneswith immediately lower indices is well preserved, even if its index is substantiallydecreased by the fact that many edges are ignored during the sampling process.
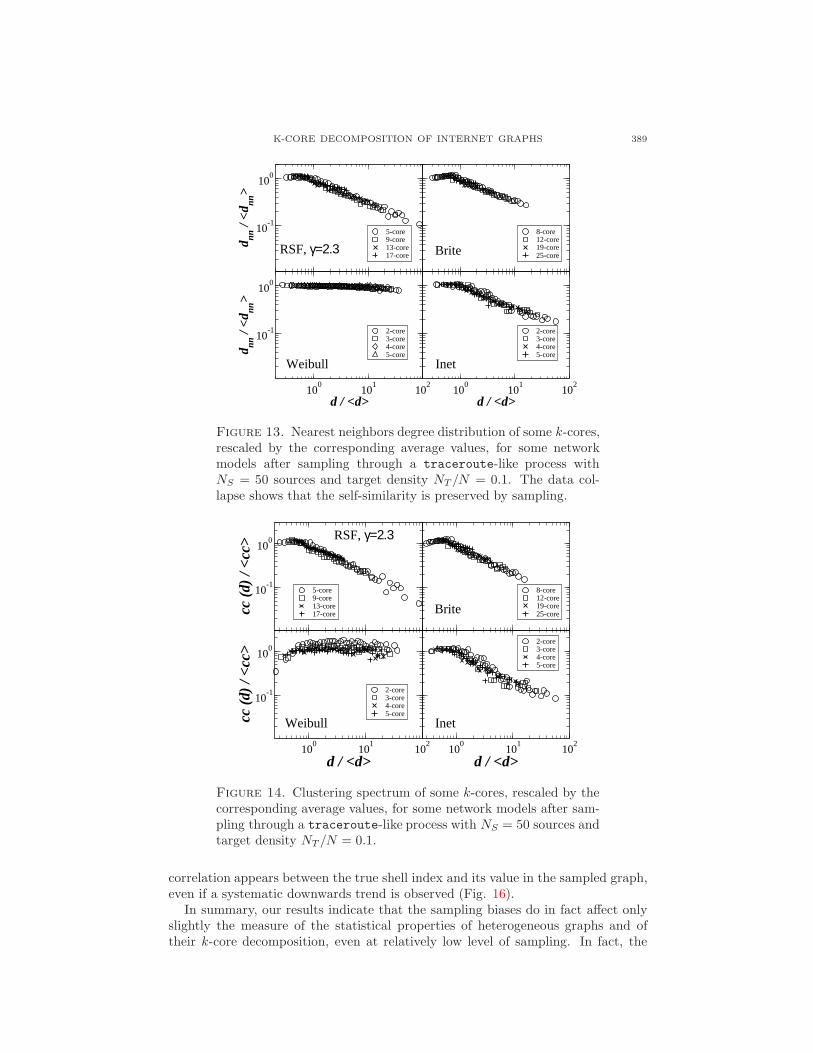
Figures 13 and 14 moreover show that the self-similar properties of the k-coredecomposition are preserved by the sampling process. Although the precise form ofthe degree distribution of the whole network is slightly altered, the basic correlationproperties are conserved by the sampling. Moreover, the self-similar structure ofthe k-core decomposition is also preserved, as a comparison of Fig.s 13 and 14 withFig.s 8 and 9 clearly shows.
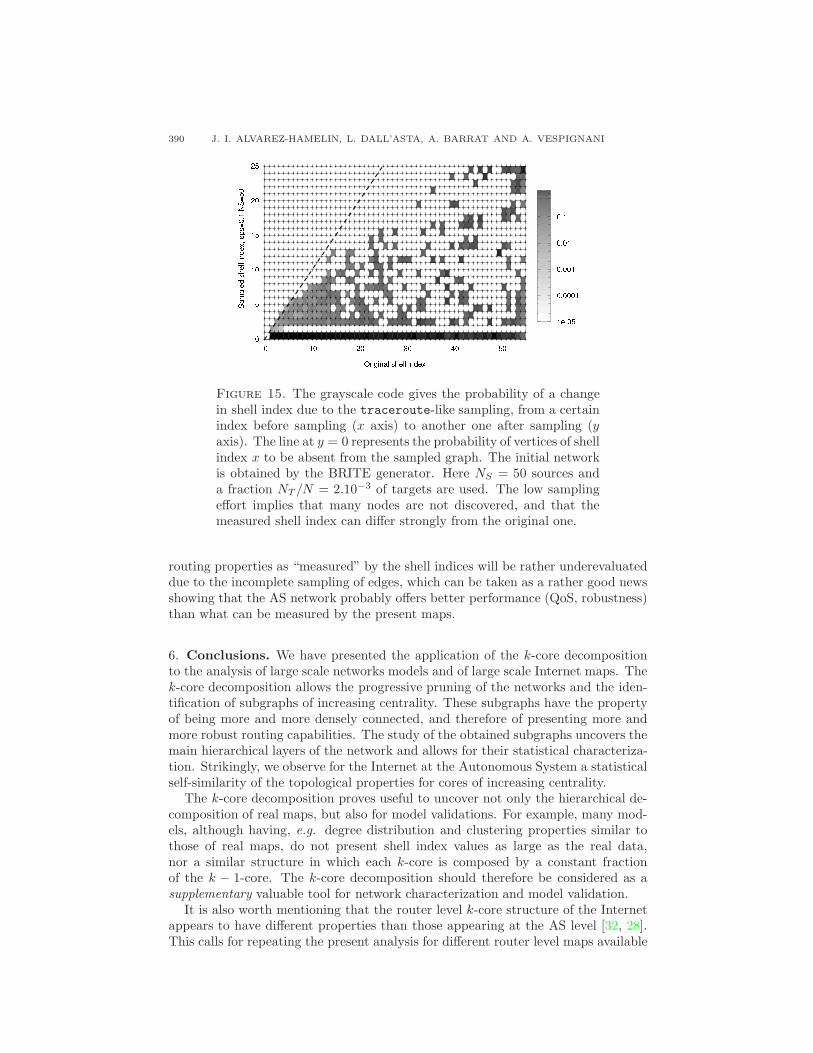
While the main statistical properties of the k-core decomposition are thereforelargely conserved by the sampling process, allowing to distinguish between networkswith different topological structures, important quantitative biases can appear andcompromise the accuracy of the measurements, as we now investigate. In orderto understand such effects in more details, we indeed show in Fig.s 15 and 16 theprobability for a vertex of given shell index in the original network to have anothershell index in the sampled network, in the case of an original network obtainedby the BRITE generator. At low sampling effort, many vertices are simply leftundiscovered, and the shell index properties can be strongly affected in a seeminglyerratic way, as shown by the important scattering of data in Fig. 15. As soonhowever as the sampling effort is increased to a more reasonable level, a strong
K-CORE DECOMPOSITION OF INTERNET GRAPHS 389
10-1
100
d nn /
<d nn
>5-core9-core13-core17-core
8-core12-core19-core25-core
100
101
102
d / <d>
10-1
100
d nn /
<d nn
>
2-core3-core4-core5-core
100
101
102
d / <d>
2-core3-core4-core5-core
RSF, γ=2.3 Brite
Weibull Inet
Figure 13. Nearest neighbors degree distribution of some k-cores,rescaled by the corresponding average values, for some networkmodels after sampling through a traceroute-like process withNS = 50 sources and target density NT /N = 0.1. The data col-lapse shows that the self-similarity is preserved by sampling.
10-1
100
cc (
d) /
<cc
>
5-core9-core13-core17-core
8-core12-core19-core25-core
100
101
102
d / <d>
10-1
100
cc (
d) /
<cc
>
2-core3-core4-core5-core
100
101
102
d / <d>
2-core3-core4-core5-core
RSF, γ=2.3
Brite
Weibull Inet
Figure 14. Clustering spectrum of some k-cores, rescaled by thecorresponding average values, for some network models after sam-pling through a traceroute-like process with NS = 50 sources andtarget density NT /N = 0.1.
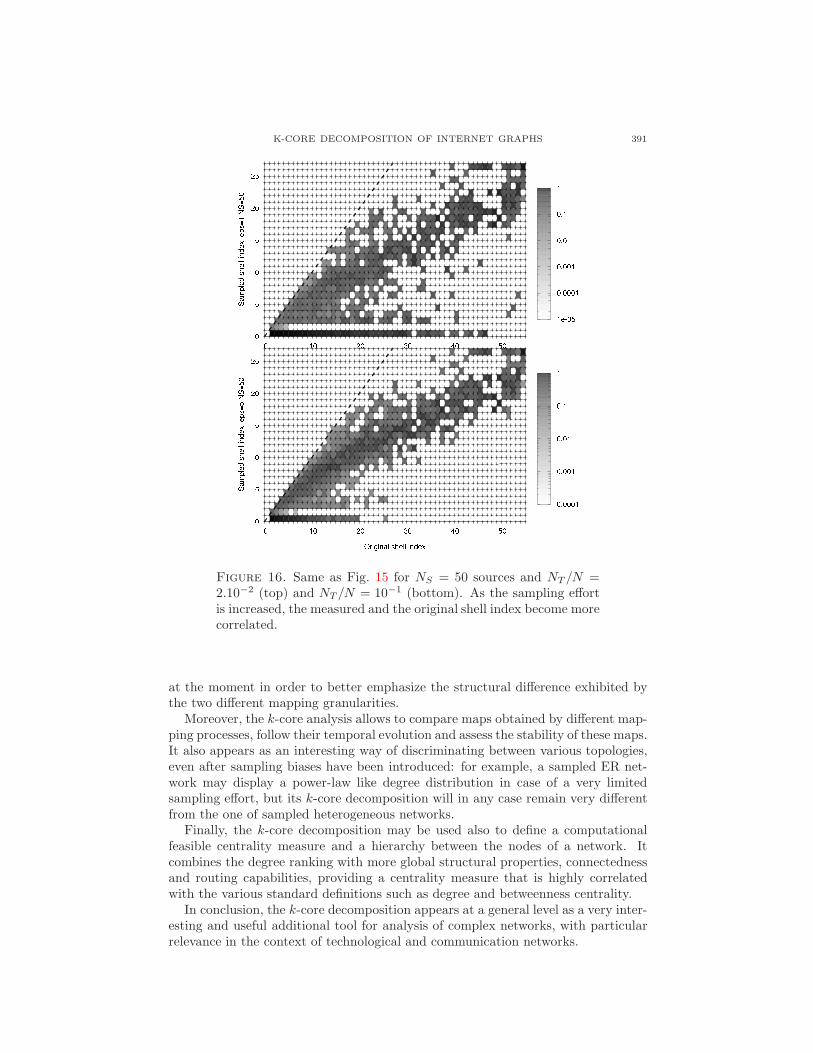
correlation appears between the true shell index and its value in the sampled graph,even if a systematic downwards trend is observed (Fig. 16).
In summary, our results indicate that the sampling biases do in fact affect onlyslightly the measure of the statistical properties of heterogeneous graphs and oftheir k-core decomposition, even at relatively low level of sampling. In fact, the
390 J. I. ALVAREZ-HAMELIN, L. DALL’ASTA, A. BARRAT AND A. VESPIGNANI
Figure 15. The grayscale code gives the probability of a changein shell index due to the traceroute-like sampling, from a certainindex before sampling (x axis) to another one after sampling (yaxis). The line at y = 0 represents the probability of vertices of shellindex x to be absent from the sampled graph. The initial networkis obtained by the BRITE generator. Here NS = 50 sources anda fraction NT /N = 2.10−3 of targets are used. The low samplingeffort implies that many nodes are not discovered, and that themeasured shell index can differ strongly from the original one.
routing properties as “measured” by the shell indices will be rather underevaluateddue to the incomplete sampling of edges, which can be taken as a rather good newsshowing that the AS network probably offers better performance (QoS, robustness)than what can be measured by the present maps.
6. Conclusions. We have presented the application of the k-core decompositionto the analysis of large scale networks models and of large scale Internet maps. Thek-core decomposition allows the progressive pruning of the networks and the iden-tification of subgraphs of increasing centrality. These subgraphs have the propertyof being more and more densely connected, and therefore of presenting more andmore robust routing capabilities. The study of the obtained subgraphs uncovers themain hierarchical layers of the network and allows for their statistical characteriza-tion. Strikingly, we observe for the Internet at the Autonomous System a statisticalself-similarity of the topological properties for cores of increasing centrality.
The k-core decomposition proves useful to uncover not only the hierarchical de-composition of real maps, but also for model validations. For example, many mod-els, although having, e.g. degree distribution and clustering properties similar tothose of real maps, do not present shell index values as large as the real data,nor a similar structure in which each k-core is composed by a constant fractionof the k − 1-core. The k-core decomposition should therefore be considered as asupplementary valuable tool for network characterization and model validation.
It is also worth mentioning that the router level k-core structure of the Internetappears to have different properties than those appearing at the AS level [32, 28].This calls for repeating the present analysis for different router level maps available
K-CORE DECOMPOSITION OF INTERNET GRAPHS 391
Figure 16. Same as Fig. 15 for NS = 50 sources and NT /N =2.10−2 (top) and NT /N = 10−1 (bottom). As the sampling effortis increased, the measured and the original shell index become morecorrelated.
at the moment in order to better emphasize the structural difference exhibited bythe two different mapping granularities.
Moreover, the k-core analysis allows to compare maps obtained by different map-ping processes, follow their temporal evolution and assess the stability of these maps.It also appears as an interesting way of discriminating between various topologies,even after sampling biases have been introduced: for example, a sampled ER net-work may display a power-law like degree distribution in case of a very limitedsampling effort, but its k-core decomposition will in any case remain very differentfrom the one of sampled heterogeneous networks.
Finally, the k-core decomposition may be used also to define a computationalfeasible centrality measure and a hierarchy between the nodes of a network. Itcombines the degree ranking with more global structural properties, connectednessand routing capabilities, providing a centrality measure that is highly correlatedwith the various standard definitions such as degree and betweenness centrality.
In conclusion, the k-core decomposition appears at a general level as a very inter-esting and useful additional tool for analysis of complex networks, with particularrelevance in the context of technological and communication networks.
392 J. I. ALVAREZ-HAMELIN, L. DALL’ASTA, A. BARRAT AND A. VESPIGNANI
Acknowledgments. This work has been partially supported by the EU withinthe 6th Framework Program under contract 001907 (DELIS). We acknowledge alsointeresting discussions with Pierre Fraigniaud. A.V. is partially funded by the NSFIIS-0513650 award.
REFERENCES
[1] R. Albert and A.-L. Barabasi, Statistical mechanics of complex networks, Rev. Mod. Phys.,74 (2002), 47–97.
[2] J. Ignacio Alvarez-Hamelin, L. Dall’Asta, A. Barrat and A. Vespignani, Large scale networksfingerprinting and visualization using the k-core decomposition, in “Advances in Neural In-formation Processing Systems 18” (Y. Weiss, B. Scholkopf and J. Platt, editors), 41–50,Cambridge, MA, MIT Press, 2006.
[3] G. D. Bader and C. W. V. Hogue, An automated method for finding molecular complexes inlarge protein interaction networks, BMC Bioinformatics, 4 (1993).
[4] A.-L. Barabasi and R. Albert, Emergence of scaling in random networks, Science, 286 (1999),509–512.
[5] V. Batagelj and M. Zaversnik, Generalized cores, CoRR, cs.DS/0202039, 2002.[6] V. Batagelj and M. Zaversnik, An O(m) algorithm for cores decomposition of networks,
cs.DS/0310049, 2003.[7] M. Baur, U. Brandes, M. Gaertler and D. Wagner, Drawing the AS graph in 2.5 dimensions,
In “12th International Symposium on Graph Drawing, Springer-Verlag editor,” 43–48, 2004.[8] B. Bollobas and A. Thomason, Random graphs of small order, In “Random graphs 83,” 47–97,
M. Karonski and A. Rucinski, eds, 1985.[9] U. Brandes, A faster algorithm for betweenness centrality, Journal of Mathematical Sociology,
25 (2001), 163–177.[10] A. Broido and K. C. Claffy, Internet topology: connectivity of IP graphs, In “San Diego
Proceedings of SPIE International symposium on Convergence of IT and Communication.Denver, CO.,” 2001.
[11] S. Carmi, S. Havlin, S. Kirkpatrick, Y. Shavitt and E. Shir,http://www.cs.huji.ac.il/~kirk/Jellyfish_Dimes.ppt .
[12] S. Carmi, S. Havlin, S. Kirkpatrick, Y. Shavitt and E. Shir, A model of internet topologyusing k-shell decomposition, Proc. Natl. Acad. Sci. (USA), 104 (2007), 11150–11154.
[13] A. Clauset and C. Moore, Accuracy and scaling phenomena in the internet, Phys. Rev. Lett.,94 (2005), 018701.
[14] Router-Level Topology Measurements, Cooperative Association for Internet Data Analysis,http://www.caida.org/tools/measurement/skitter/router_topology/ .
[15] L. Dall’Asta, I. Alvarez Hamelin, A. Barrat, A. Vazquez and A. Vespignani, Traceroute-like exploration of unknown networks: A statistical analysis, LNCS, Springer, Berlin, 3405
(2005), 140–153.[16] L. Dall’Asta, I. Alvarez Hamelin, A. Barrat, A. Vazquez and A. Vespignani, Exploring net-
works with traceroute-like probes: theory and simulations, TCS, 355 (2006), 6–24.[17] S. N. Dorogovtsev and J. F. F. Mendes, “Evolution of Networks: From Biological Nets to the
Internet and WWW,” Oxford University Press, 2003.[18] S. N. Dorogovtsev, A. V. Goltsev and J. F. F. Mendes, K-core organization of complex
networks, Phys. Rev. Lett., 96 (2006), 040601.[19] J. C. Doyle, D. L. Alderson, L. Li, S. Low, M. Roughan, S. Shalunov, R. Tanaka and W. Will-
inger, The robust yet fragile nature of the Internet, Proc. Natl. Acad. Sci. (USA), 102 (2005),14497–14502.
[20] P. Erdos and A. Renyi, On random graphs I, Publ. Math. Debrecen, 6 (1959), 290–297.[21] M. Faloutsos, P. Faloutsos and C. Faloutsos, On power-law relationship of the Internet topol-
ogy, Comput. Commun. Rev., 29 (1999), 251–263.[22] L. C. Freeman, A set of measures of centrality based on betweenness, Sociometry, 40 (1977),
35–41.[23] M. Gaertler and M. Patrignani, Dynamic analysis of the autonomous system graph, In “IPS
2004, International Workshop on Inter-domain Performance and Simulation, Budapest, Hun-gary,” 13–24, 2004.
[24] C. Gkantsidis, M. Mihail and E. Zegura. Spectral analysis of internet topologies, In “Proceed-ings of INFOCOM 2003,” 2003.
K-CORE DECOMPOSITION OF INTERNET GRAPHS 393
[25] A. V. Goltsev, S. N. Dorogovtsev and J. F. F. Mendes. K-core (bootstrap) percolation oncomplex networks, Phys. Rev. E, 73 (2006), 056101.
[26] J.-L. Guillaume and M. Latapy. Relevance of massively distributed explorations of the Internettopology: Qualitative results, In “24-th IEEE Infocom’05,” 2005.
[27] A. Lakhina, J. W. Byers, M. Crovella and P. Xie. Sampling biases in IP topology mea-surements, Technical report BUCS-TR-2002-021, Department of Computer Sciences, BostonUniversity.
[28] LArge NETwork VIsualization tool. http://xavier.informatics.indiana.edu/lanet-vi/ .[29] L. Li, D. Alderson, W. Willinger and J. Doyle. A first-principles approach to understanding
the internet’s router-level topology, In “SIGCOMM ’04: Proceedings of the 2004 Conferenceon Applications, Technologies, Architectures, and Protocols for Computer Communications,”3–14, New York, NY, USA, ACM Press, 2004.
[30] P. Mahadevan, D. Krioukov, K. Fall and A. Vahdat. Systematic topology analysis and gener-ation using degree correlations, In “Proceedings of SIGCOMM 2006,” 2006.
[31] P. Mahadevan, D. Krioukov, M. Fomenkov, B. Huffaker, X. Dimitripoulos, Kc. Claffy andA. Vahdat. Lessons from three views of the Internet topology, Preprint, cs.NI/0508033, 2005.
[32] “Distributed Internet MEasurements and Simulations,” http://www.netdimes.org .[33] A. Medina, A. Lakhina, I. Matta and J. Byers. Brite: An approach to universal topology
generation, In “Proceedings of the International Workshop on Modeling, Analysis and Sim-ulation of Computer and Telecommunications Systems- MASCOTS ’01, Cincinnati, Ohio,”2001.
[34] M. Molloy and B. Reed, A critical point for random graphs with a given degree sequence,Random Struct. Algorithms, 6 (1995), 161–179.
[35] M. Molloy and B. Reed, The size of the giant component of a random graph with a givendegree distribution, Combinatorics, Probab. Comput., 7 (1998), 295–305.
[36] M. E. J. Newman, Scientific collaboration networks. II. Shortest paths, weighted networks,and centrality, Phys. Rev. E, 64 (2001), 016132.
[37] M. E. J. Newman, Assortative mixing in networks, Phys. Rev. Lett., 89 (2002), 208701.[38] University of Oregon Route Views Project, http://www.routeviews.org/ .[39] R. Pastor-Satorras, A. Vazquez and A. Vespignani, Dynamical and correlation properties of
the internet, Phys. Rev. Lett., 87 (2001), 258701.
[40] R. Pastor-Satorras and A. Vespignani, “Evolution and Structure of the Internet: A StatisticalPhysics Approach,” Cambridge University Press, 2004.
[41] T. Petermann and P. De Los Rios, Exploration of scale free networks, Eur. Phys.J. B, 38
(2004), 201–204[42] C. Qian, H. Chang, R. Govindan, S. Jamin, S. J. Shenker and W. Willinger, The origin
of power laws in Internet topologies revisited, In “INFOCOM 2002. Twenty-First AnnualJoint Conference of the IEEE Computer and Communications Societies. Proceedings IEEE ,Volume 2,” pages 608–617. IEEE Computer Society Press, 2002.
[43] S. B. Seidman, Network structure and minimum degree, Social Networks, 5 (1983), 269–287.[44] Y. Shavitt and E. Shir, Dimes: Let the internet measure itself, Preprint, cs.NI/0506099, 2005.[45] L. Subramanian, S. Agarwal, J. Rexford and R. H. Katz, Characterizing the Internet hierarchy
from multiple vantage points, In “IEEE INFOCOM 2002,” page 618, 2002.[46] H. Tangmunarunkit, R Govindan, S. Jamin, S. Shenker and W. Willinger, Network topologies,
power laws, and hierarchy, Comput. Commun. Rev., 32 (2002), 76–76.[47] F. Viger, A. Barrat, L. Dall’Asta, C.-H. Zhang and E. Kolaczyk, What is the real size of a
sampled network? the case of the Internet, Phys. Rev. E, 75 (2007), 056111.[48] D. J. Watts and S. H. Strogatz, Collective dynamics of small-world networks, Nature, 393
(1998), 440–442.[49] J. Winick and S. Jamin, Inet-3.0: Internet topology generator, Technical Report UM-CSE-
TR-456-02, Department of EECS, University of Michigan, 2002.[50] S. Wuchty and E. Almaas, Peeling the Yeast protein network, Proteomics., 5 (2005), 444–449.
Received February 2008; revised March 2008.
E-mail address: [email protected]
E-mail address: [email protected]
E-mail address: [email protected]
E-mail address: [email protected]