kalman filter with sensitivity tuning for improved noise ... · kalman filter with sensitivity...
TRANSCRIPT
Circuits Syst Signal Process (2017) 36:1476–1492DOI 10.1007/s00034-016-0363-y
Kalman Filter with Sensitivity Tuning for ImprovedNoise Reduction in Speech
Stephen So1 · Aidan E. W. George1 ·Ratna Ghosh2 · Kuldip K. Paliwal1
Received: 7 August 2015 / Revised: 4 July 2016 / Accepted: 5 July 2016 / Published online: 18 July 2016© Springer Science+Business Media New York 2016
Abstract In this paper, wewill present a Kalman filtering algorithm that achieves bet-ter noise reduction in a single-channel speech enhancement application. The proposedmethod aims to tune the Kalman filter gain in order to offset the bias that is inherentwhen estimating speech parameters from noise-corrupted speech. After analysing theKalman recursion equations and the filter gain, the sensitivity metric was shown to beuseful in tuning the Kalman filter to achieve better noise reduction. Speech enhance-ment experiments were performed on the commonly available NOIZEUS databasecorrupted with white Gaussian noise, and the proposed method was evaluated andcompared with recent speech enhancement methods, such as the STSA estimator withwavelet thresholding on multi-tapered spectra (or STSA-WT) and generalised sub-space method. The proposed method was shown to produce better quality speechthan the STSA-WT estimator, while being competitive with the generalised subspacemethod. Spectrogram analysis demonstrated that the proposed method could achievesimilar levels of noise reduction to the Kalman filter in the oracle case.
B Stephen [email protected]
Aidan E. W. [email protected]
Ratna [email protected]
Kuldip K. [email protected]
1 Signal Processing Laboratory, Griffith School of Engineering, Griffith University, Brisbane,QLD 4111, Australia
2 Department of Instrumentation and Electronics Engineering, Jadavpur University,Kolkata 700084, India
Circuits Syst Signal Process (2017) 36:1476–1492 1477
Keywords Kalman filter · Speech enhancement · Noise reduction · Sensitivity metric
1 Introduction
In the field of speech enhancement, the aim is to reduce the level of undesirablebackground noise in digital speech in order to improve its quality and intelligibility.The most common scenario is the additive noise model:
y(n) = x(n) + v(n) (1)
where y(n) is the noisy speech, x(n) is the clean speech, and v(n) is the corruptingnoise. In single-channel speech enhancement, we wish to estimate the clean signalx(n), when given only the noisy speech y(n) and estimates of the noise signal statistics.These noise estimates are typically obtained during the pauses between spoken words.
Several speech enhancement algorithms have been reported in the literature thathave had varying degrees of success in enhancing speech, but many of them sufferfrom problems with residual noise, such as the musical noise typically present inWiener filtering [20] and spectral subtraction algorithms [1]. The Kalman filter [9]was first applied to speech enhancement by Paliwal and Basu [12] and since then hasbeen investigated in the literature both in the time-domain (e.g. [2,17,19]), subbanddomain [21], and the modulation-domain [16,18].
The Kalman filter (KF) is a unbiased, linearMMSE (minimummean squared error)estimator that dynamically combines estimates from a speech model with the noisyspeech measurements y(n). An all-pole (or, autoregressive) filter H(z) is typicallyused to represent the vocal tract of the human speech production model:
H(z) = 1
1 + ∑pk=1 akz
−k(2)
where p is the order of the filter and {ak} are the AR (autoregressive) coefficients.Speech is produced by driving the all-pole filter by an excitation signalw(n) that has avariance of σ 2
w. Therefore, the KF can rely on predicted speech samples from this ARmodel when the level of noise in the speech measurements is too high, or emphasisethe speech measurements to provide speech information (often termed the innovation[4]) that the AR model cannot predict, such as the harmonic structure of speech [17].The Kalman filter gain vector dynamically controls the amount of innovation signalthat is used to correct the model prediction by using an estimate of the corrupting noisevariance σ 2
v and the mean prediction squared error of the model.In the oracle case, where the AR parameters ({ak} and σ 2
w) are estimated from theclean speech, the KF was shown to perform very well [12]. However, when used inpractice, where only the noisy speech signal is available, the noise reduction ability ofthe KF deteriorates considerably, due to the biased estimates of the AR parameters.In particular, the biased excitation variance was shown to result in an offset in theKalman filter gain and consequently increase the presence of residual noise in theenhanced output [17]. Methods for reducing the effect of biased estimates have beenreported in the literature. Gibson, et al. [2] developed the iterative Kalman filter (which
1478 Circuits Syst Signal Process (2017) 36:1476–1492
is similar to the iterative Wiener filter reported by [10]), where AR parameters werere-estimated from the filtered output, and then, the speech frame was filtered againusing the updated parameters. While the noise reduction was noted to have improvedin the first few iterations, the speech quality was not guaranteed to improve withfurther iterations while the enhanced speech suffered from musical noise and speechdistortion. It was reported in [17] that the use of large-dynamic-range-taperedwindowsduring the AR parameter estimation improved the performance of the KF by reducingthe amount of residual noise in the regions of speech pauses. However, this was astatic approach, where the same Chebyshev window was applied for all frames, andthis tended to suppress the KF gain not only in the silent regions, but also when speechwas present. Furthermore, the best performancewas obtained in an iterative frameworkthat utilised long (80ms) and overlapping frames (with 10ms update). Two iterationswere required to process each frame; hence, the computational requirements werequite high. Recently, a non-iterative KF algorithm using dynamic gain adjustment wasreported in [15] to reduce residual noise, which utilised the robustness performancemetric that was introduced in [14]. The noise reduction achieved by the robustnessmetric method was considerable and approached that of the oracle KF. However,analysis of the KF gain showed that it was rather strongly suppressed in the speechregions, which led to the presence of speech distortion.
In this paper, we present a new non-iterative KF algorithm that offers better noisereduction by dynamically tuning the KF gain. In contrast to the method reported by[15], the proposed method utilises the sensitivity metric of the KF [14] for tuning. Theenhanced speech from the proposed method has reduced residual noise but withoutthe over suppression of the KF gain in the speech regions. We have performed speechenhancement experiments using the commonly used NOIZEUS speech database [8].For this present study, we considered the effects of white Gaussian noise (WGN) atvarying levels of SNR (signal-to-noise ratio). Objectivemeasures, in the form of PESQ(perceptual evaluation of speech quality) [13], were obtained, and the composite mea-sures [7] were used as an indication of the subjective quality of speech produced by theproposed method. We have included in our evaluation the STSA (short-time spectralamplitude) estimator with wavelet thresholding of multi-tapered spectra (STSA-WT)[6] and the generalised subspace method [5] to provide a comparison.1
The structure of this paper is as follows. In Sect. 2, we introduce the reader to themathematical notation that is used to describe the state vector recursion equations usedin the operation of the Kalman filter. In particular, we derive the ‘scalarised’ versionof the equations to aid in analysis. In Sect. 2.2, we discuss the sensitivity characteristicof the Kalman filter as well as how it can be quantified using the sensitivity metric,J1. Also in this section, the tuning of the Kalman filter gain using J1 is described andanalysed. Following from this, in Sect. 3, we describe the set-up used in our speechexperiments that are designed to evaluate the noise reduction ability and speech qualityof the proposedmethod when compared with other speech enhancement methods. Theresults are then presented and discussed in Sect. 4. Finally, we offer our concludingremarks in Sect. 5 as well as details on our future work.
1 The MATLAB code and sample speech output files are available and can be downloaded at http://tiny.cc/speech_enhancement.
Circuits Syst Signal Process (2017) 36:1476–1492 1479
2 Proposed Kalman Filter for Speech Enhancement
2.1 Kalman Filter Recursion Equations
In the Kalman filter that is used for speech enhancement [12], the additive noise modelof Eq. (1) is assumed. The corrupting noise v(n) is assumed to be a zero-mean, whiteGaussian noise that has a variance of σ 2
v and is uncorrelated with the clean speechsignal x(n). The AR speech model in Eq. (2) can be rewritten in terms of a differenceequation:2
x(n) = −p∑
k=1
akx(n − k) + w(n) (3)
By combining this with the additive noise Eq. (1), we can represent the process as astate-space equation:
x(n) = Ax(n − 1) + dw(n) (4)
y(n) = cT x(n) + v(n) (5)
where A is the state transition matrix containing the model parameters, x(n) =[x(n)x(n − 1) . . . x(n − p + 1)]T is the state vector, d = [1 0 . . . 0]T andc = [1 0 . . . 0]T are themeasurement vectors for the excitation noise and observation,respectively.
The Kalman filter recursively computes an unbiased and linear MMSE estimatex(n|n) of the state vector at time n given the noise observation y(n), by using thefollowing equations:
x(n|n − 1) = Ax(n − 1|n − 1) (6)
P(n|n − 1) = AP(n − 1|n − 1)AT + σ 2wdd
T (7)
K(n) = P(n|n − 1)c[σ 2
v + cTP(n|n − 1)c]−1
(8)
x(n|n) = x(n|n − 1) + K(n)[y(n) − cT x(n|n − 1)] (9)
P(n|n) = [I − K(n)cT ]P(n|n − 1) (10)
During the operation of the KF, the noise-corrupted speech y(n) is windowed intonon-overlapped and short (e.g. 20ms) frames and the AR parameters are estimated.These parameters remain constant during the Kalman filtering of speech samples inthe frame, while the Kalman gainK(n), a posteriori error covariance P(n|n), and statevector estimate x(n|n) are continually updated on a sample-per-sample basis [17].
2 Note that we will use the ‘negative sign’ convention, as is commonly used in linear prediction analysis[3].
1480 Circuits Syst Signal Process (2017) 36:1476–1492
In conventional Kalman filtering, the enhanced speech signal at the present time nis given by:3
x(n|n) = cT x(n|n) (11)
This is equivalent to taking the first scalar component of the state vector x(n|n).Therefore, it is possible to rewrite some of the Kalman recursion equations in scalarform. We may rewrite Eq. (9):
x(n|n) = x(n|n − 1) + K (n)[y(n) − x(n|n − 1)] (12)
= [1 − K (n)]x(n|n − 1) + K (n)y(n) (13)
where x(n|n−1) and K (n) are the first scalar components of the a priori state vectorsand KF gain vector, respectively. It can be seen that the KF gain adjusts the relativeproportions of the noisy observation sample y(n) and a priori sample x(n|n−1). Thisallows us to analyse the KF recursion equations in scalar form.
By substituting Eq. (7) into Eq. (8) and pre-multiplying Eq. (8) with the measure-ment vector cT , we obtain an expression for the (scalar) KF gain [15]:
K (n) = α2(n) + σ 2w
α2(n) + σ 2w + σ 2
v
(14)
where α2(n) = cTAP(n−1|n−1)AT c represents the contribution of the a posteriorimean squared error from the previous time step n − 1, to the total a priori meanprediction squared error.
When the speech parameters are estimated from the noisy speech signal, the ARcoefficients {ak} and the excitation noise variance σ 2
w will be biased estimates. In thisstudy, we will focus on correcting the excitation noise variance as its value has a sig-nificant effect on the performance of the KF, through what is commonly known asthe Q/R ratio (system-to-measurement noise ratio) [14]. When assuming the mea-surement noise v(n) is white Gaussian noise that is uncorrelated with the speech, itcan be shown that the excitation variance that is estimated from y(n) can be givenapproximately4 by:
σ 2w = Ryy(0) +
p∑
k=1
ak Ryy(k)
= Rvv(0) + Rxx (0) +p∑
k=1
ak Rxx (k)
≈ σ 2w + σ 2
v (15)
3 We used bold variables to denote matrix/vector quantities, as opposed to unbolded variables for scalarquantities.4 In this study, we are assuming the effects of the white noise on the estimates of ak are negligible, incomparison with the variance of the measurement noise σ 2
v , i.e. ak ≈ ak .
Circuits Syst Signal Process (2017) 36:1476–1492 1481
Time (s)
Frequency(H
z)(a)
0 0.5 1 1.5 2 2.50
1000
2000
3000
4000
Time (s)
Frequency(H
z)
(b)
0 0.5 1 1.5 2 2.50
1000
2000
3000
4000
0 0.5 1 1.5 2 2.50
0.5
1
Time (s)
K0(n )
(c)oraclenoisy
Time (s)
Frequency(H
z)
(d)
0 0.5 1 1.5 2 2.50
1000
2000
3000
4000
Time (s)
Frequency(H
z)
(e)
0 0.5 1 1.5 2 2.50
1000
2000
3000
4000
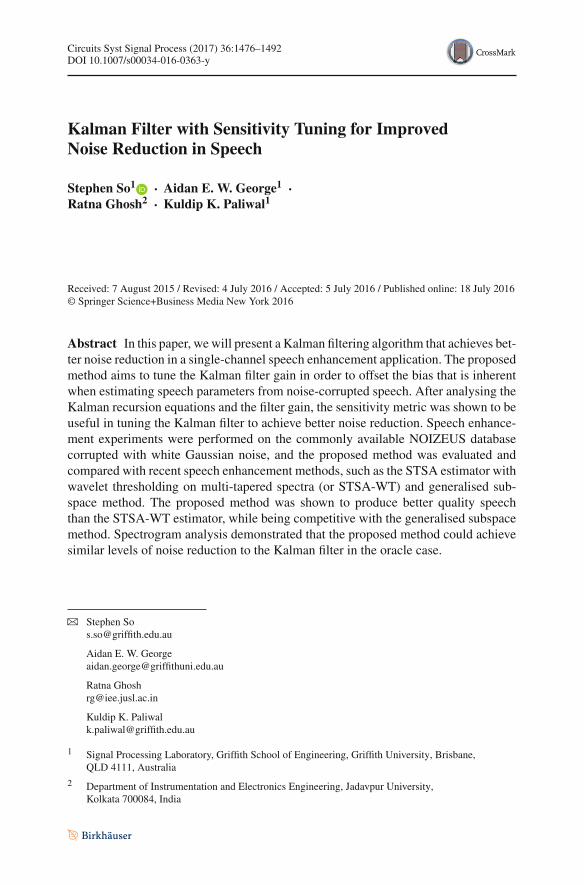
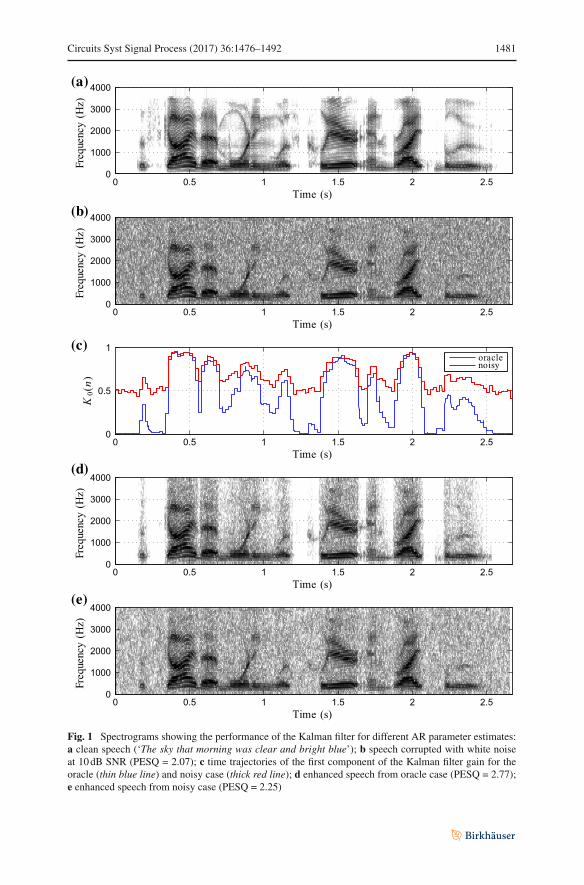
Fig. 1 Spectrograms showing the performance of the Kalman filter for different AR parameter estimates:a clean speech (‘The sky that morning was clear and bright blue’); b speech corrupted with white noiseat 10dB SNR (PESQ = 2.07); c time trajectories of the first component of the Kalman filter gain for theoracle (thin blue line) and noisy case (thick red line); d enhanced speech from oracle case (PESQ = 2.77);e enhanced speech from noisy case (PESQ = 2.25)
1482 Circuits Syst Signal Process (2017) 36:1476–1492
where Ryy(k), Rxx (k), Rvv(k) are the kth autocorrelations of y(n), x(n) and v(n),respectively. By substituting this biased excitation variance into Eq. (14), the biasedKF gain becomes:
K (n) = α2(n) + σ 2w
α2(n) + σ 2w + σ 2
v
(16)
≈ α2(n) + σ 2w + σ 2
v
α2(n) + σ 2w + 2σ 2
v
(17)
Therefore, for the silent regions where speech is not present (i.e. α2(n) = σ 2w = 0),
the biased KF gain will be equal to approximately 0.5 [15], as shown in Fig. 1c. As wecan see from Eq. (13), the biased KF gain increases the proportion of the measurementnoise from y(n) in the estimated speech signal, thereby causing the large amount ofresidual noise in the enhanced output, as shown in Fig. 1e.
2.2 Using the Sensitivity Metric to Reduce Kalman Filter Gain Bias
Sensitivity refers to the ability of the KF to respond to dynamic changes in the inputand accordingly adaptively adjust the speech model parameters in order to mitigatethe effects of measurement noise. In the present case, since the speech parameters {ak}are determined for a limited number of samples, the KF will become more reliant onthe predicted speech samples from its dynamic model whenever the measured speechsamples y(n) are deemed to be too noisy. A sensitive KF can be viewed as the oppositeof a robust KF, where the filter operation is robust to term large dynamic model errorsand hence relies more on the measured speech signal.
A metric for quantifying the level of sensitivity (referred to as J1) in the KF wasdeveloped by [14]. By rewriting the variables in terms of scalar quantities, as we havedone in the previous section, we obtain the sensitivity metric for the KF for speechenhancement:
J1(n) = σ 2v
α2(n) + σ 2w + σ 2
v
(18)
We can see that the sensitivity metric is a ratio of the measurement error to the totalsquared error (measurement + predicted). Therefore, if the measured speech signalis corrupted by noise that is much larger than the model-predicted squared error (i.e.σ 2
v � σ 2w + α2(n)), then J1(n) will approach unity, which indicates an increase in
KF sensitivity. On the other hand, if the measurement noise is much smaller than themodel-predicted squared error, the sensitivity metric will approach zero.
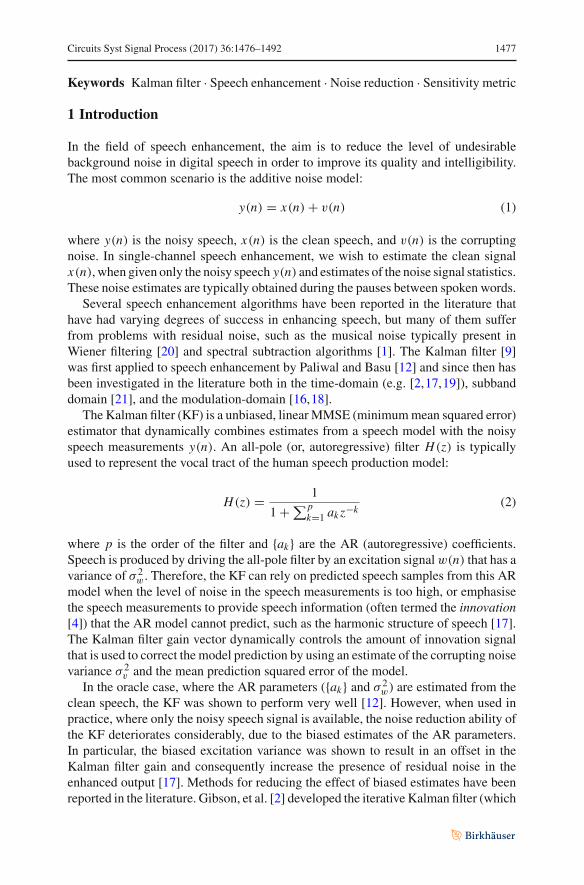
Let us consider the sensitivity metric for the case when the AR parameters areestimated from the noisy speech. When no speech is present, the AR parameters areestimated from the corrupting noise only. Since the noise is white Gaussian noise,α2(n) = 0 and σ 2
w = σ 2v . When substituted into Eq. (18), it can be seen that J1(n) =
0.5. For the case of voiced speech, the values of α2(n) and σ 2w are expected to be large,
due to the wider spectral range (or coloured spectrum) as well as the inadequacy of
Circuits Syst Signal Process (2017) 36:1476–1492 1483
0 0.5 1 1.5 2 2.50
0.2
0.4
0.6
0.8
1
Time [s]
Sensitivity
metric
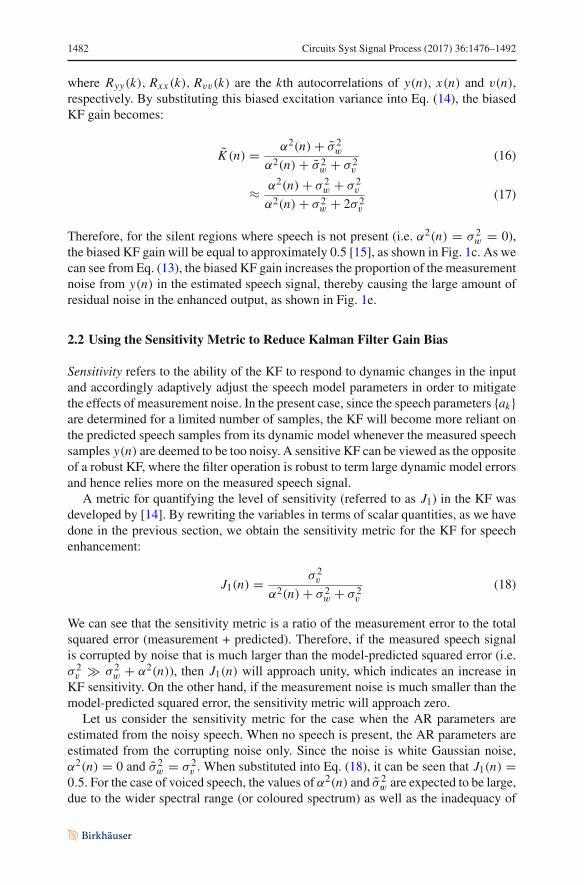
Fig. 2 Plot of the sensitivity metric J1(n) for the Kalman filter at an SNR of 10 dB
0 0.5 1 1.5 2 2.50
0.2
0.4
0.6
0.8
1
Time [s]
Kalman
filterga
inK(n) Proposed
Non-oracleOracle
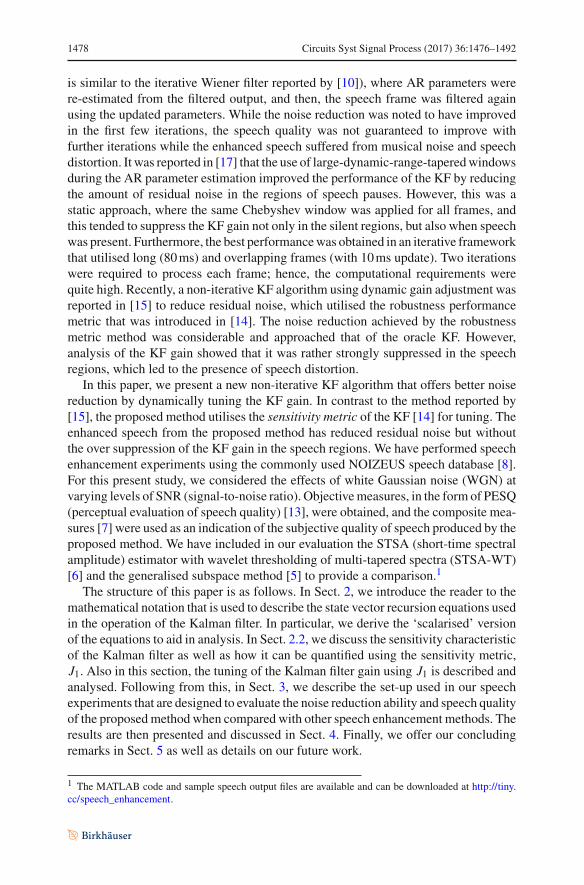
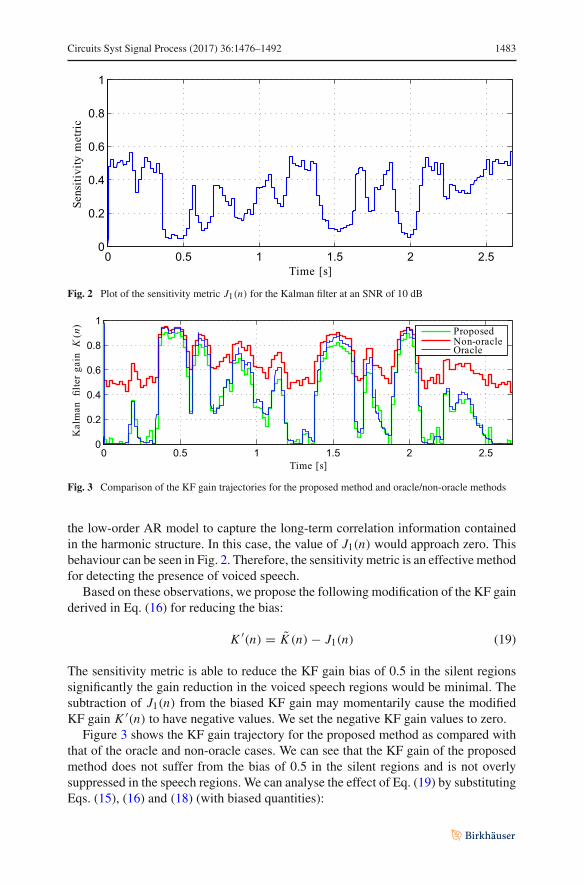
Fig. 3 Comparison of the KF gain trajectories for the proposed method and oracle/non-oracle methods
the low-order AR model to capture the long-term correlation information containedin the harmonic structure. In this case, the value of J1(n) would approach zero. Thisbehaviour can be seen in Fig. 2. Therefore, the sensitivity metric is an effective methodfor detecting the presence of voiced speech.
Based on these observations, we propose the following modification of the KF gainderived in Eq. (16) for reducing the bias:
K ′(n) = K (n) − J1(n) (19)
The sensitivity metric is able to reduce the KF gain bias of 0.5 in the silent regionssignificantly the gain reduction in the voiced speech regions would be minimal. Thesubtraction of J1(n) from the biased KF gain may momentarily cause the modifiedKF gain K ′(n) to have negative values. We set the negative KF gain values to zero.
Figure 3 shows the KF gain trajectory for the proposed method as compared withthat of the oracle and non-oracle cases. We can see that the KF gain of the proposedmethod does not suffer from the bias of 0.5 in the silent regions and is not overlysuppressed in the speech regions. We can analyse the effect of Eq. (19) by substitutingEqs. (15), (16) and (18) (with biased quantities):
1484 Circuits Syst Signal Process (2017) 36:1476–1492
0 0.5 1 1.5 2 2.50
0.2
0.4
0.6
0.8
1
Time [s]
Kalman
filterga
inK(n) J 2-based KF
J 1-based KF (proposed)Oracle KF
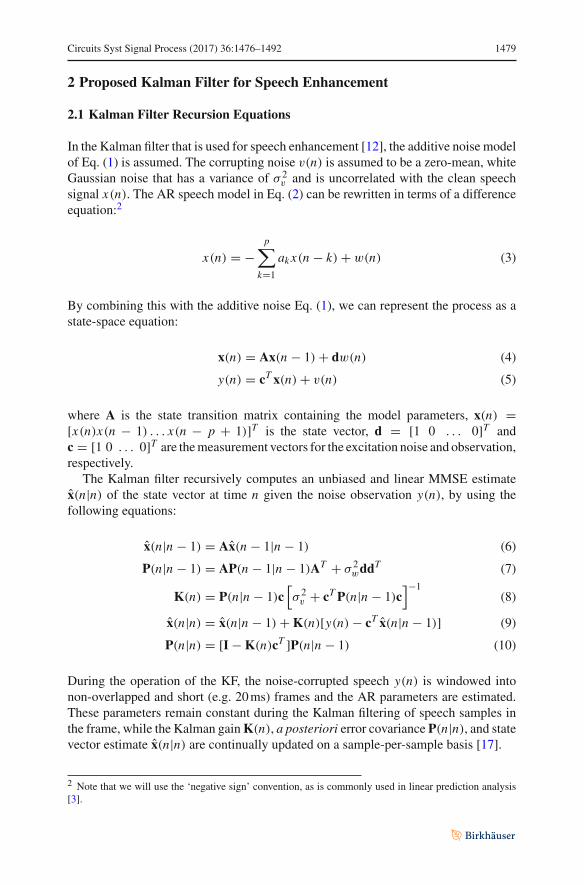
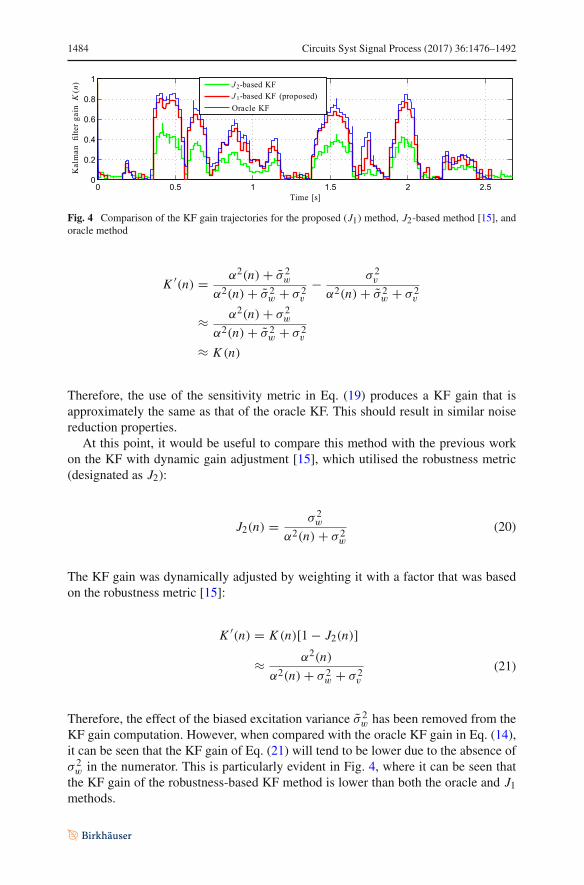
Fig. 4 Comparison of the KF gain trajectories for the proposed (J1) method, J2-based method [15], andoracle method
K ′(n) = α2(n) + σ 2w
α2(n) + σ 2w + σ 2
v
− σ 2v
α2(n) + σ 2w + σ 2
v
≈ α2(n) + σ 2w
α2(n) + σ 2w + σ 2
v
≈ K (n)
Therefore, the use of the sensitivity metric in Eq. (19) produces a KF gain that isapproximately the same as that of the oracle KF. This should result in similar noisereduction properties.
At this point, it would be useful to compare this method with the previous workon the KF with dynamic gain adjustment [15], which utilised the robustness metric(designated as J2):
J2(n) = σ 2w
α2(n) + σ 2w
(20)
The KF gain was dynamically adjusted by weighting it with a factor that was basedon the robustness metric [15]:
K ′(n) = K (n)[1 − J2(n)]
≈ α2(n)
α2(n) + σ 2w + σ 2
v
(21)
Therefore, the effect of the biased excitation variance σ 2w has been removed from the
KF gain computation. However, when compared with the oracle KF gain in Eq. (14),it can be seen that the KF gain of Eq. (21) will tend to be lower due to the absence ofσ 2
w in the numerator. This is particularly evident in Fig. 4, where it can be seen thatthe KF gain of the robustness-based KF method is lower than both the oracle and J1methods.
Circuits Syst Signal Process (2017) 36:1476–1492 1485
3 Experimental Set-up
In our experiments, we used the NOIZEUS speech corpus, which is composed of 30phonetically balanced sentences belonging to six speakers (threemale and three femalespeakers) [8]. The corpus was sampled at 8kHz. For our objective experiments, weinvestigated speech that had been corrupted by additive white Gaussian noise at fourSNR levels (0, 5, 10 and 15 dB). The objective evaluation was carried out using thePESQ (perceptual evaluation of speech quality) measure [13], SNR (signal-to-noiseratio), and segmental SNR.
The composite measures of [7] were developed to provide objective measures thatare highly correlated with the corresponding subjective rating scores of signal dis-tortion (SIG), background/noise distortion (BAK), and overall quality (OVL). Thecomposite measures are computed via a linear combination of objective scores [11]:
1. Itakura–Saito distance (IS);2. PESQ;3. Cepstrum distance (CEP);4. Weighted spectral slope (WSS); and5. Log-likelihood ratio (LLR).
We have computed the composite measures for each enhancement method to providean indication of the subjective quality.
The treatment types used in the evaluations are listed below (where p is the orderof the AR model):5
1. Original clean speech (Clean);2. Speech corrupted with white Gaussian noise (No enhancement);3. Kalman filter with AR parameters estimated from clean speech, 20 ms frames, no
overlap, p = 10 (Kalman oracle);4. Kalman filter with AR parameters estimated from noise-corrupted speech, 20 ms
frames, no overlap, p = 10 (Kalman non-oracle);5. Kalman filter with dynamic gain adjustment, 20 ms frames, no overlap, p = 10
[15] (Kalman DA)6. Proposed Kalman filter with sensitivity metric-based tuning, 20 ms frames, no
overlap, p = 10 (Kalman proposed);7. Generalised subspace-based speech enhancement [5] (Subspace)8. STSA (short-time spectral amplitude) estimator with wavelet thresholding of
multi-tapered spectrum [6] (STSA-WT).
4 Results and Discussion
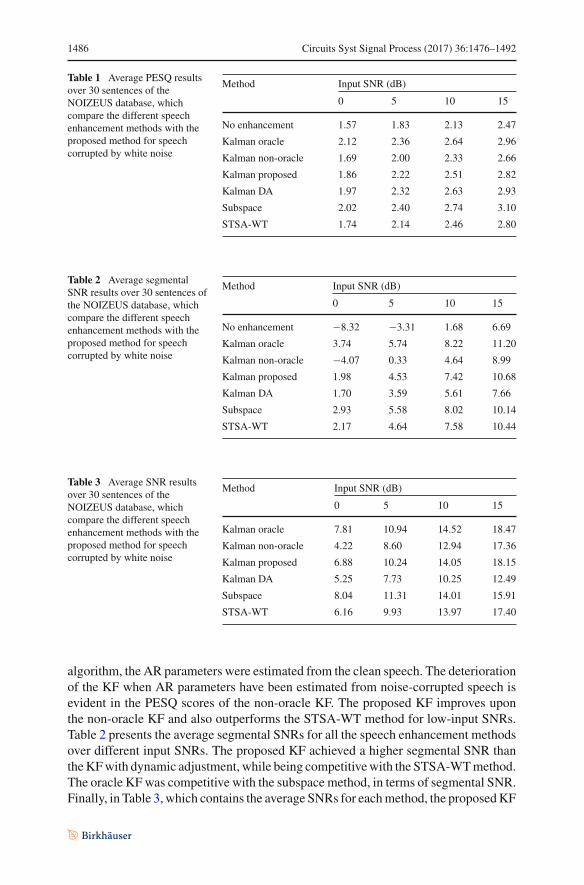
Table 1 shows the average PESQ scores for the different speech enhancement methodsover different input SNRs. The subspace method [5] and oracle-case KF achieved thehighest PESQ scores out of all the methods, which was expected since for the KF
5 The MATLAB code and sample speech output files are available and can be downloaded at http://tiny.cc/speech_enhancement.
1486 Circuits Syst Signal Process (2017) 36:1476–1492
Table 1 Average PESQ resultsover 30 sentences of theNOIZEUS database, whichcompare the different speechenhancement methods with theproposed method for speechcorrupted by white noise
Method Input SNR (dB)
0 5 10 15
No enhancement 1.57 1.83 2.13 2.47
Kalman oracle 2.12 2.36 2.64 2.96
Kalman non-oracle 1.69 2.00 2.33 2.66
Kalman proposed 1.86 2.22 2.51 2.82
Kalman DA 1.97 2.32 2.63 2.93
Subspace 2.02 2.40 2.74 3.10
STSA-WT 1.74 2.14 2.46 2.80
Table 2 Average segmentalSNR results over 30 sentences ofthe NOIZEUS database, whichcompare the different speechenhancement methods with theproposed method for speechcorrupted by white noise
Method Input SNR (dB)
0 5 10 15
No enhancement −8.32 −3.31 1.68 6.69
Kalman oracle 3.74 5.74 8.22 11.20
Kalman non-oracle −4.07 0.33 4.64 8.99
Kalman proposed 1.98 4.53 7.42 10.68
Kalman DA 1.70 3.59 5.61 7.66
Subspace 2.93 5.58 8.02 10.14
STSA-WT 2.17 4.64 7.58 10.44
Table 3 Average SNR resultsover 30 sentences of theNOIZEUS database, whichcompare the different speechenhancement methods with theproposed method for speechcorrupted by white noise
Method Input SNR (dB)
0 5 10 15
Kalman oracle 7.81 10.94 14.52 18.47
Kalman non-oracle 4.22 8.60 12.94 17.36
Kalman proposed 6.88 10.24 14.05 18.15
Kalman DA 5.25 7.73 10.25 12.49
Subspace 8.04 11.31 14.01 15.91
STSA-WT 6.16 9.93 13.97 17.40
algorithm, the AR parameters were estimated from the clean speech. The deteriorationof the KF when AR parameters have been estimated from noise-corrupted speech isevident in the PESQ scores of the non-oracle KF. The proposed KF improves uponthe non-oracle KF and also outperforms the STSA-WT method for low-input SNRs.Table 2 presents the average segmental SNRs for all the speech enhancement methodsover different input SNRs. The proposed KF achieved a higher segmental SNR thantheKFwith dynamic adjustment, while being competitivewith the STSA-WTmethod.The oracle KFwas competitive with the subspace method, in terms of segmental SNR.Finally, in Table 3, which contains the average SNRs for eachmethod, the proposedKF
Circuits Syst Signal Process (2017) 36:1476–1492 1487
Table 4 Average compositemeasures over 30 sentences ofthe NOIZEUS database, whichcompare the different speechenhancement methods with theproposed method for speechcorrupted by white noise at 0 dB
Method SIG BAK OVL
No enhancement 1.50 1.51 1.39
Kalman oracle 2.45 2.11 2.09
Kalman non-oracle 1.69 1.70 1.55
Kalman proposed 1.88 1.96 1.71
Kalman DA 2.03 1.99 1.85
Subspace 1.61 1.98 1.62
STSA-WT 1.05 1.84 1.15
Table 5 Average compositemeasures over 30 sentences ofthe NOIZEUS database, whichcompare the different speechenhancement methods with theproposed method for speechcorrupted by white noise at 5dB
Method SIG BAK OVL
No enhancement 2.03 1.91 1.82
Kalman oracle 2.96 2.52 2.53
Kalman non-oracle 2.27 2.11 2.03
Kalman proposed 2.48 2.37 2.22
Kalman DA 2.64 2.39 2.37
Subspace 2.20 2.42 2.15
STSA-WT 1.47 2.29 1.66
Table 6 Average compositemeasures over 30 sentences ofthe NOIZEUS database, whichcompare the different speechenhancement methods with theproposed method for speechcorrupted by white noise at10 dB
Method SIG BAK OVL
No enhancement 2.59 2.34 2.28
Kalman oracle 3.41 2.91 2.94
Kalman non-oracle 2.84 2.54 2.50
Kalman proposed 3.00 2.77 2.66
Kalman DA 3.14 2.75 2.80
Subspace 2.90 2.85 2.71
STSA-WT 2.14 2.73 2.20
method achieved higher SNRs than all methods except for the oracle KF and subspacemethod. The lower segmental SNR and SNR performance of the Kalman DA methodwhen compared with the proposed method is worth noting and is perhaps a result ofthe more suppressed KF gain, as was shown in Fig. 4.
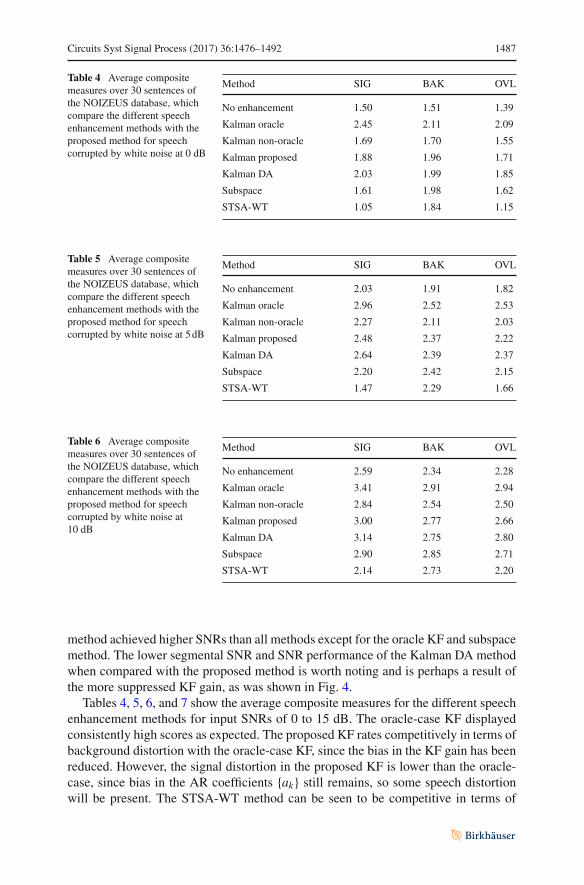
Tables 4, 5, 6, and 7 show the average composite measures for the different speechenhancement methods for input SNRs of 0 to 15 dB. The oracle-case KF displayedconsistently high scores as expected. The proposed KF rates competitively in terms ofbackground distortion with the oracle-case KF, since the bias in the KF gain has beenreduced. However, the signal distortion in the proposed KF is lower than the oracle-case, since bias in the AR coefficients {ak} still remains, so some speech distortionwill be present. The STSA-WT method can be seen to be competitive in terms of
1488 Circuits Syst Signal Process (2017) 36:1476–1492
Table 7 Average compositemeasures over 30 sentences ofthe NOIZEUS database, whichcompare the different speechenhancement methods with theproposed method for speechcorrupted by white noise at15 dB
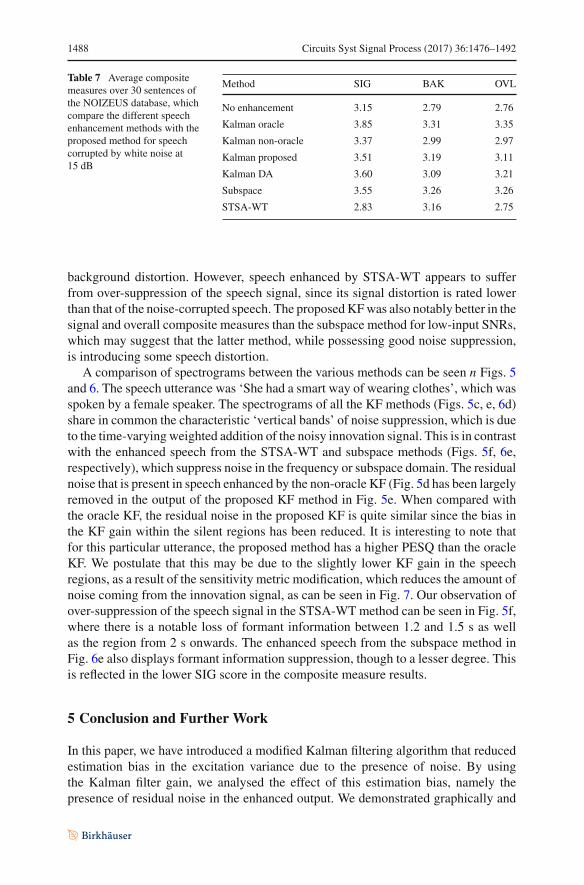
Method SIG BAK OVL
No enhancement 3.15 2.79 2.76
Kalman oracle 3.85 3.31 3.35
Kalman non-oracle 3.37 2.99 2.97
Kalman proposed 3.51 3.19 3.11
Kalman DA 3.60 3.09 3.21
Subspace 3.55 3.26 3.26
STSA-WT 2.83 3.16 2.75
background distortion. However, speech enhanced by STSA-WT appears to sufferfrom over-suppression of the speech signal, since its signal distortion is rated lowerthan that of the noise-corrupted speech. The proposedKFwas also notably better in thesignal and overall composite measures than the subspace method for low-input SNRs,which may suggest that the latter method, while possessing good noise suppression,is introducing some speech distortion.
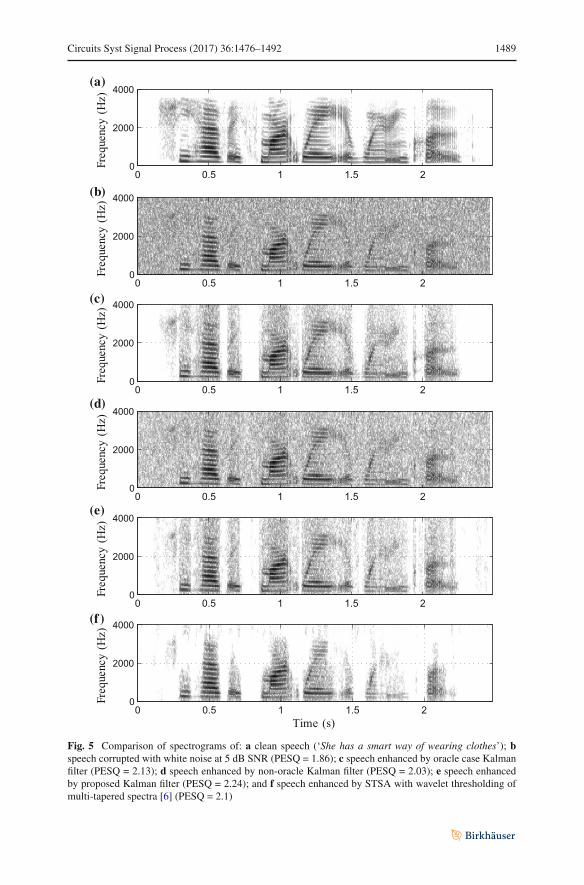
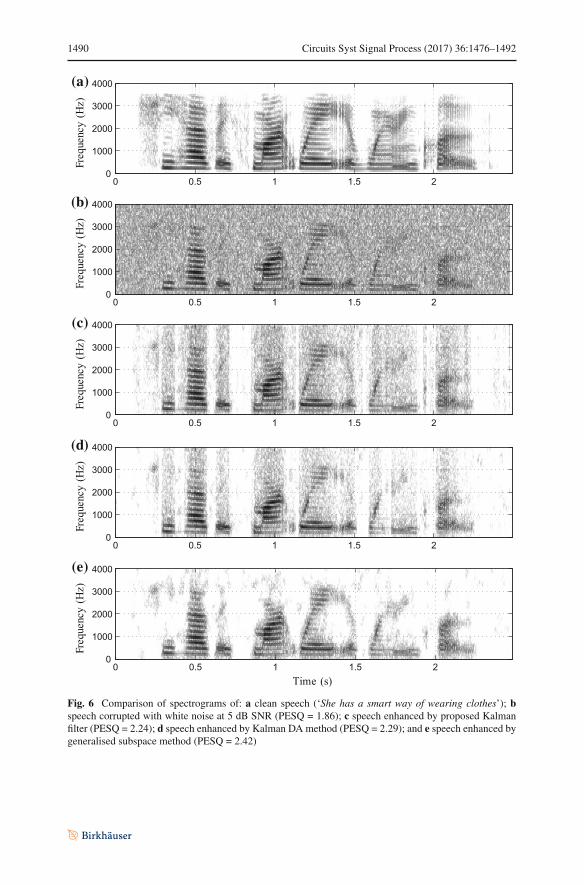
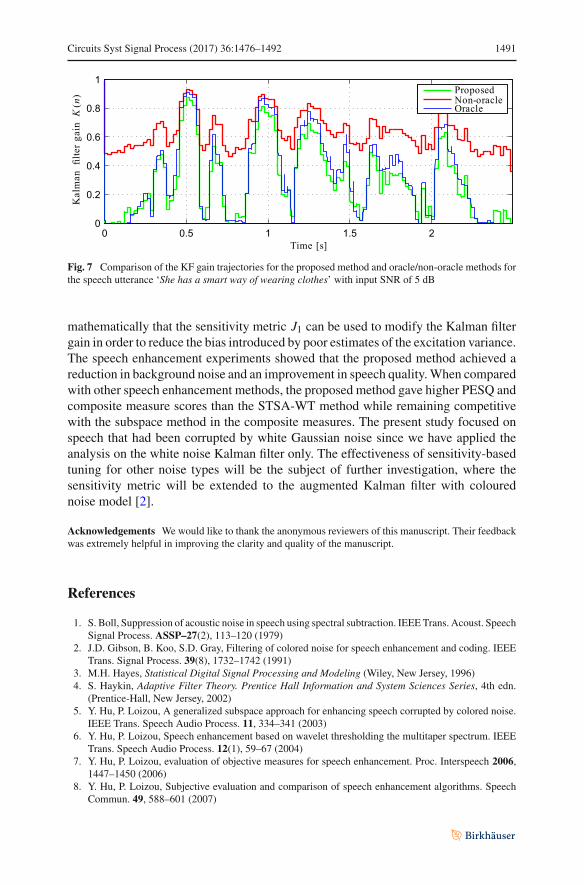
A comparison of spectrograms between the various methods can be seen n Figs. 5and 6. The speech utterance was ‘She had a smart way of wearing clothes’, which wasspoken by a female speaker. The spectrograms of all the KF methods (Figs. 5c, e, 6d)share in common the characteristic ‘vertical bands’ of noise suppression, which is dueto the time-varyingweighted addition of the noisy innovation signal. This is in contrastwith the enhanced speech from the STSA-WT and subspace methods (Figs. 5f, 6e,respectively), which suppress noise in the frequency or subspace domain. The residualnoise that is present in speech enhanced by the non-oracle KF (Fig. 5d has been largelyremoved in the output of the proposed KF method in Fig. 5e. When compared withthe oracle KF, the residual noise in the proposed KF is quite similar since the bias inthe KF gain within the silent regions has been reduced. It is interesting to note thatfor this particular utterance, the proposed method has a higher PESQ than the oracleKF. We postulate that this may be due to the slightly lower KF gain in the speechregions, as a result of the sensitivity metric modification, which reduces the amount ofnoise coming from the innovation signal, as can be seen in Fig. 7. Our observation ofover-suppression of the speech signal in the STSA-WT method can be seen in Fig. 5f,where there is a notable loss of formant information between 1.2 and 1.5 s as wellas the region from 2 s onwards. The enhanced speech from the subspace method inFig. 6e also displays formant information suppression, though to a lesser degree. Thisis reflected in the lower SIG score in the composite measure results.
5 Conclusion and Further Work
In this paper, we have introduced a modified Kalman filtering algorithm that reducedestimation bias in the excitation variance due to the presence of noise. By usingthe Kalman filter gain, we analysed the effect of this estimation bias, namely thepresence of residual noise in the enhanced output. We demonstrated graphically and
Circuits Syst Signal Process (2017) 36:1476–1492 1489
Frequency(H
z)(a)
0 0.5 1 1.5 20
2000
4000Frequency(H
z)
(b)
0 0.5 1 1.5 20
2000
4000
Frequency(H
z)
(c)
0 0.5 1 1.5 20
2000
4000
Frequency(H
z)
(d)
0 0.5 1 1.5 20
2000
4000
Frequency(H
z)
(e)
0 0.5 1 1.5 20
2000
4000
Time (s)
Frequency(H
z)
(f )
0 0.5 1 1.5 20
2000
4000
Fig. 5 Comparison of spectrograms of: a clean speech (‘She has a smart way of wearing clothes’); bspeech corrupted with white noise at 5 dB SNR (PESQ = 1.86); c speech enhanced by oracle case Kalmanfilter (PESQ = 2.13); d speech enhanced by non-oracle Kalman filter (PESQ = 2.03); e speech enhancedby proposed Kalman filter (PESQ = 2.24); and f speech enhanced by STSA with wavelet thresholding ofmulti-tapered spectra [6] (PESQ = 2.1)
1490 Circuits Syst Signal Process (2017) 36:1476–1492
Frequency(H
z)(a)
0 0.5 1 1.5 20
1000
2000
3000
4000Frequency(H
z)
(b)
0 0.5 1 1.5 20
1000
2000
3000
4000
Frequency(H
z)
(c)
0 0.5 1 1.5 20
1000
2000
3000
4000
Frequency(H
z)
(d)
0 0.5 1 1.5 20
1000
2000
3000
4000
Time (s)
Frequency(H
z)
(e)
0 0.5 1 1.5 20
1000
2000
3000
4000
Fig. 6 Comparison of spectrograms of: a clean speech (‘She has a smart way of wearing clothes’); bspeech corrupted with white noise at 5 dB SNR (PESQ = 1.86); c speech enhanced by proposed Kalmanfilter (PESQ = 2.24); d speech enhanced by Kalman DA method (PESQ = 2.29); and e speech enhanced bygeneralised subspace method (PESQ = 2.42)
Circuits Syst Signal Process (2017) 36:1476–1492 1491
0 0.5 1 1.5 20
0.2
0.4
0.6
0.8
1
Time [s]
Kalman
filterga
inK(n) Proposed
Non-oracleOracle
Fig. 7 Comparison of the KF gain trajectories for the proposed method and oracle/non-oracle methods forthe speech utterance ‘She has a smart way of wearing clothes’ with input SNR of 5 dB
mathematically that the sensitivity metric J1 can be used to modify the Kalman filtergain in order to reduce the bias introduced by poor estimates of the excitation variance.The speech enhancement experiments showed that the proposed method achieved areduction in background noise and an improvement in speech quality.When comparedwith other speech enhancement methods, the proposed method gave higher PESQ andcomposite measure scores than the STSA-WT method while remaining competitivewith the subspace method in the composite measures. The present study focused onspeech that had been corrupted by white Gaussian noise since we have applied theanalysis on the white noise Kalman filter only. The effectiveness of sensitivity-basedtuning for other noise types will be the subject of further investigation, where thesensitivity metric will be extended to the augmented Kalman filter with colourednoise model [2].
Acknowledgements We would like to thank the anonymous reviewers of this manuscript. Their feedbackwas extremely helpful in improving the clarity and quality of the manuscript.
References
1. S. Boll, Suppression of acoustic noise in speech using spectral subtraction. IEEETrans. Acoust. SpeechSignal Process. ASSP–27(2), 113–120 (1979)
2. J.D. Gibson, B. Koo, S.D. Gray, Filtering of colored noise for speech enhancement and coding. IEEETrans. Signal Process. 39(8), 1732–1742 (1991)
3. M.H. Hayes, Statistical Digital Signal Processing and Modeling (Wiley, New Jersey, 1996)4. S. Haykin, Adaptive Filter Theory. Prentice Hall Information and System Sciences Series, 4th edn.
(Prentice-Hall, New Jersey, 2002)5. Y. Hu, P. Loizou, A generalized subspace approach for enhancing speech corrupted by colored noise.
IEEE Trans. Speech Audio Process. 11, 334–341 (2003)6. Y. Hu, P. Loizou, Speech enhancement based on wavelet thresholding the multitaper spectrum. IEEE
Trans. Speech Audio Process. 12(1), 59–67 (2004)7. Y. Hu, P. Loizou, evaluation of objective measures for speech enhancement. Proc. Interspeech 2006,
1447–1450 (2006)8. Y. Hu, P. Loizou, Subjective evaluation and comparison of speech enhancement algorithms. Speech
Commun. 49, 588–601 (2007)
1492 Circuits Syst Signal Process (2017) 36:1476–1492
9. R.E. Kalman, A new approach to linear filtering and prediction problems. J. Basic Eng. Trans. ASME82, 35–45 (1960)
10. J.S. Lim, A.V. Oppenheim, All-pole modeling of degraded speech. IEEE Trans. Acoust. Speech SignalProcess. ASSP–26, 197–210 (1978)
11. P. Loizou, Speech Enhancement: Theory and Practice, 1st edn. (CRC Press LLC, Boca Raton, 2007)12. K.K. Paliwal, A. Basu, A speech enhancement method based on Kalman filtering, in Proceedings of
the IEEE International Conference Acoustics, Speech, and Signal Processing, vol. 12, pp. 177–180(1987)
13. A. Rix, J. Beerends, M. Hollier, A. Hekstra, Perceptual evaluation of speech quality (PESQ), anobjective method for end-to-end speech quality assessment of narrowband telephone networks andspeech codecs. ITU-T Recommendation P.862. Technical report, ITU-T (2001)
14. M. Saha, R. Ghosh, B. Goswami, Robustness and sensitivity metrics for tuning the extended Kalmanfilter. IEEE Trans. Instrum. Meas. 63(4), 964–971 (2014)
15. S. So,A.E.W.George,R.Ghosh,K.K.Paliwal,Anon-iterativeKalmanfiltering algorithmwith dynamicgain adjustment for single-channel speech enhancement. Int. J. Signal Process. Syst. 4(4), 263–268(2016)
16. S. So, K.K. Paliwal, Modulation-domain Kalman filtering for single-channel speech enhancement.Speech Commun. 53(6), 818–829 (2011)
17. S. So, K.K. Paliwal, Suppressing the influence of additive noise on the Kalman filter gain for lowresidual noise speech enhancement. Speech Commun. 53(3), 355–378 (2011)
18. S. So, K.K. Wojcicki, K.K. Paliwal, Single-channel speech enhancement using Kalman filtering in themodulation domain, in Proceedings of the Interspeech 2010 (2010)
19. P. Sorqvist, P. Handel, B. Ottersten, Kalman filtering for low distortion speech enhancement in mobilecommunication, in Proceedings of the IEEE International Conference Acoustics, Speech, SignalProcessing, vol. 2, pp. 1219–1222 (1997)
20. N.Wiener,TheExtrapolation, Interpolation, andSmoothingof StationaryTimeSerieswithEngineeringApplications (Wiley, New York, 1949)
21. W.R. Wu, P.C. Chen, Subband Kalman filtering for speech enhancement. IEEE Trans. Circuits Syst.II 45(8), 1072–1083 (1998)