kansallinen resurssiviisaus -foorumi: xaver edelmann
TRANSCRIPT
Resource efficiency and scarce natural resources
X. Edelmann, President World Resources Forum, Switzerland National Resource Wisdom Forum 4.12.2013 Finlandia House, Helsinki
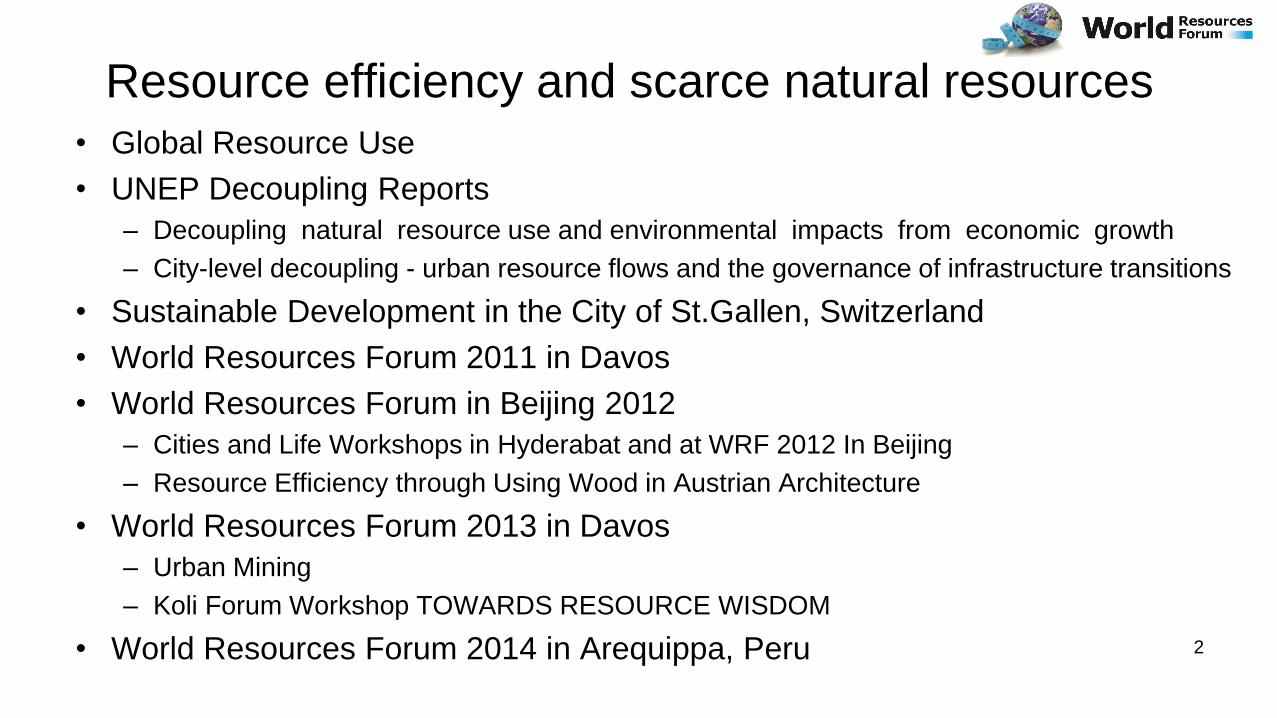
Resource efficiency and scarce natural resources
• Global Resource Use
• UNEP Decoupling Reports
– Decoupling natural resource use and environmental impacts from economic growth
– City-level decoupling - urban resource flows and the governance of infrastructure transitions
• Sustainable Development in the City of St.Gallen, Switzerland
• World Resources Forum 2011 in Davos
• World Resources Forum in Beijing 2012
– Cities and Life Workshops in Hyderabat and at WRF 2012 In Beijing
– Resource Efficiency through Using Wood in Austrian Architecture
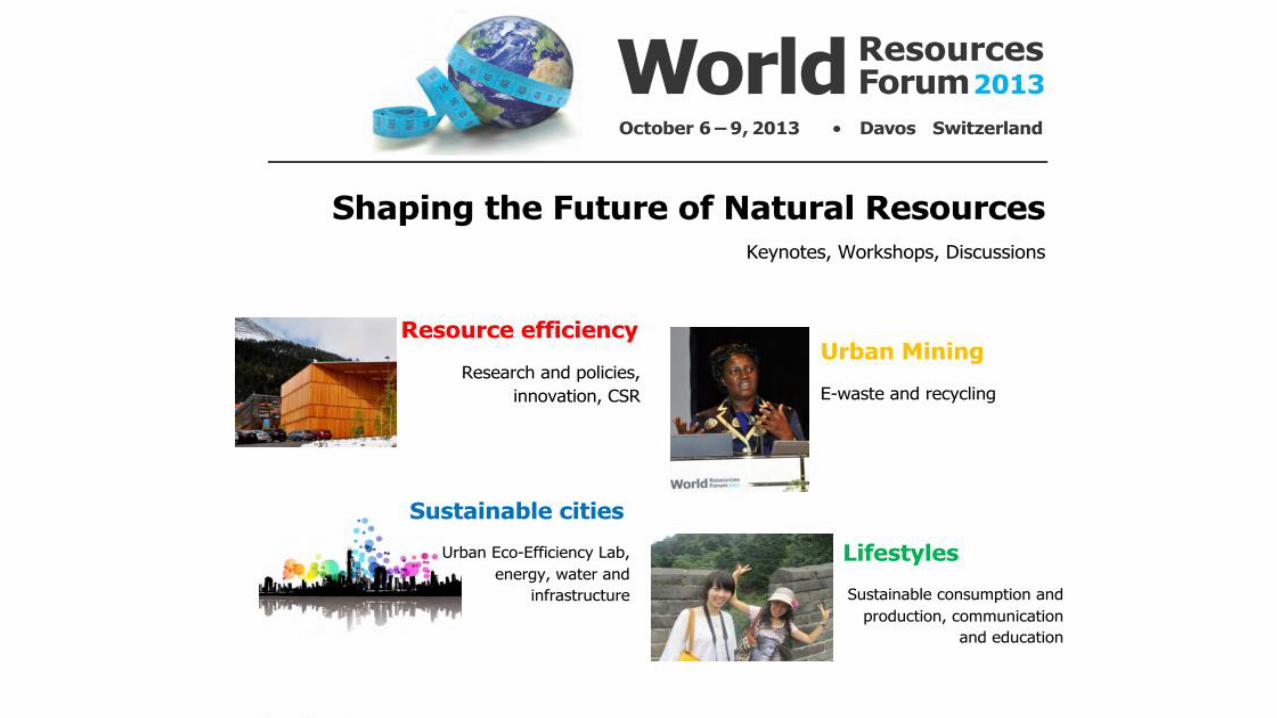
• World Resources Forum 2013 in Davos
– Urban Mining
– Koli Forum Workshop TOWARDS RESOURCE WISDOM
• World Resources Forum 2014 in Arequippa, Peru
2
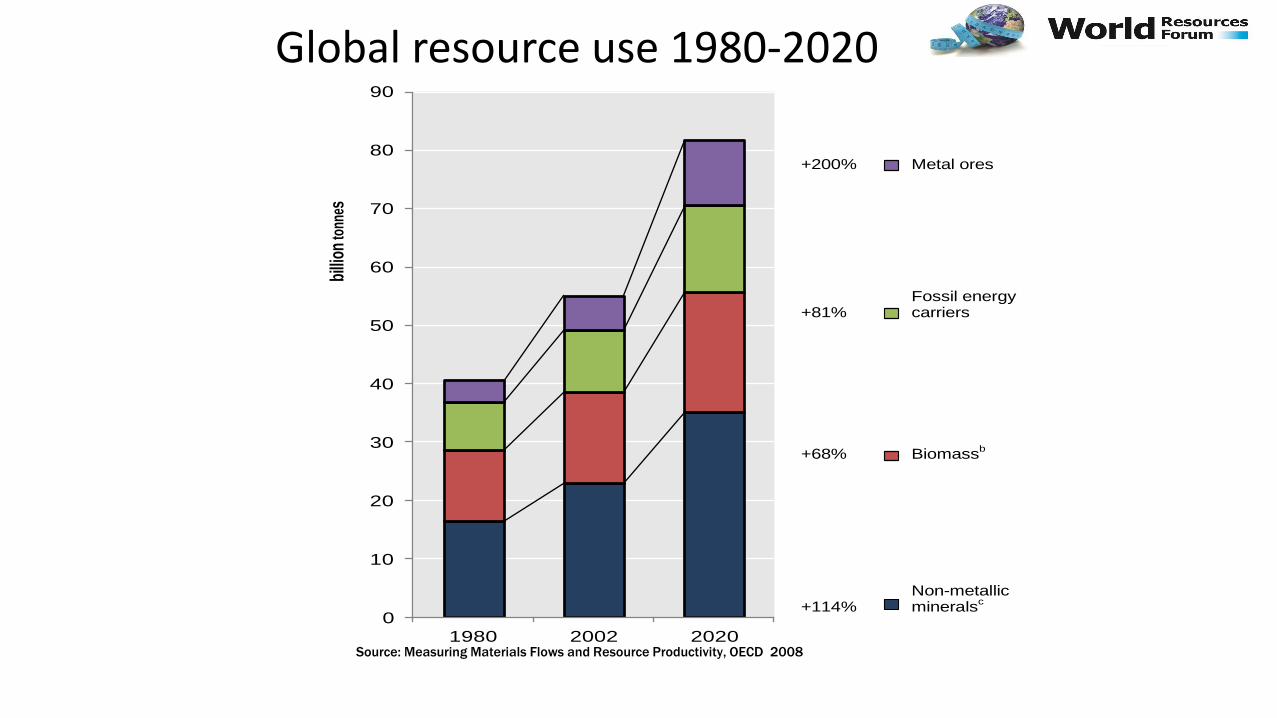
Global resource use 1980-2020
% change, 1980-2020 2002 2020
billi
on to
nnes
0
10
20
30
40
50
60
70
80
90
1980 2002 2020
30%
38%
32%
OECD
BRIICS
RoW
27%
39%
34%OECD
BRIICS
RoW
+200%
Metal ores
16.422.9
35.1
12.2
15.6
20.5
8.2
10.6
14.8
3.7
5.8
11.2
1980 2002 2020
Chart Title
Other minerals
Biomass
Energy carriers
Metal ores 5.8 billion tonnes 11.2 billion tonnes
+81% Fossil energy
carriers
38%
35%
27% OECD
BRIICS
RoW
29%
40%
31%OECD
BRIICS
RoW
16.422.9
35.1
12.2
15.6
20.5
8.2
10.6
14.8
3.7
5.8
11.2
1980 2002 2020
Chart Title
Other minerals
Biomass
Energy carriers
Metal ores
10.6 billion tonnes 14.8 billion tonnes
+68%
Biomassb
29%
38%
33%
OECD
BRIICS
RoW
23%
39%
38%
OECD
BRIICS
RoW
16.422.9
35.1
12.2
15.6
20.5
8.2
10.6
14.8
3.7
5.8
11.2
1980 2002 2020
Chart Title
Other minerals
Biomass
Energy carriers
Metal ores
15.6 billion tonnes 20.5 billion tonnes
+114%
Non-metallic minerals
c
55%26%
19%
OECDBRIICS
RoW
44%
36%
20%
OECD
BRIICS
RoW
16.422.9
35.1
12.2
15.6
20.5
8.2
10.6
14.8
3.7
5.8
11.2
1980 2002 2020
Chart Title
Other minerals
Biomass
Energy carriers
Metal ores
22.9 billion tonnes 35.1 billion tonnes
Notes: (a) Crude oil, coal, natural gas, peat; (b) Harvests from agriculture and forestry, marine catches, grazing; (c) Industrial minerals, construction minerals;
(d) Constant 1995 USD. * BRIICS = Brazil, Russia, India, Indonesia, China and South Africa; RoW = Rest of the world.
Source: OECD, based on SERI (2006), MOSUS MFA database, Sustainable Europe Research Institute, Vienna, http://www.materialflows.net; Giljum, et al. (2007).
Figure 9. Global resource extraction, by major groups of resources and regions
Source: Measuring Materials Flows and Resource Productivity, OECD 2008
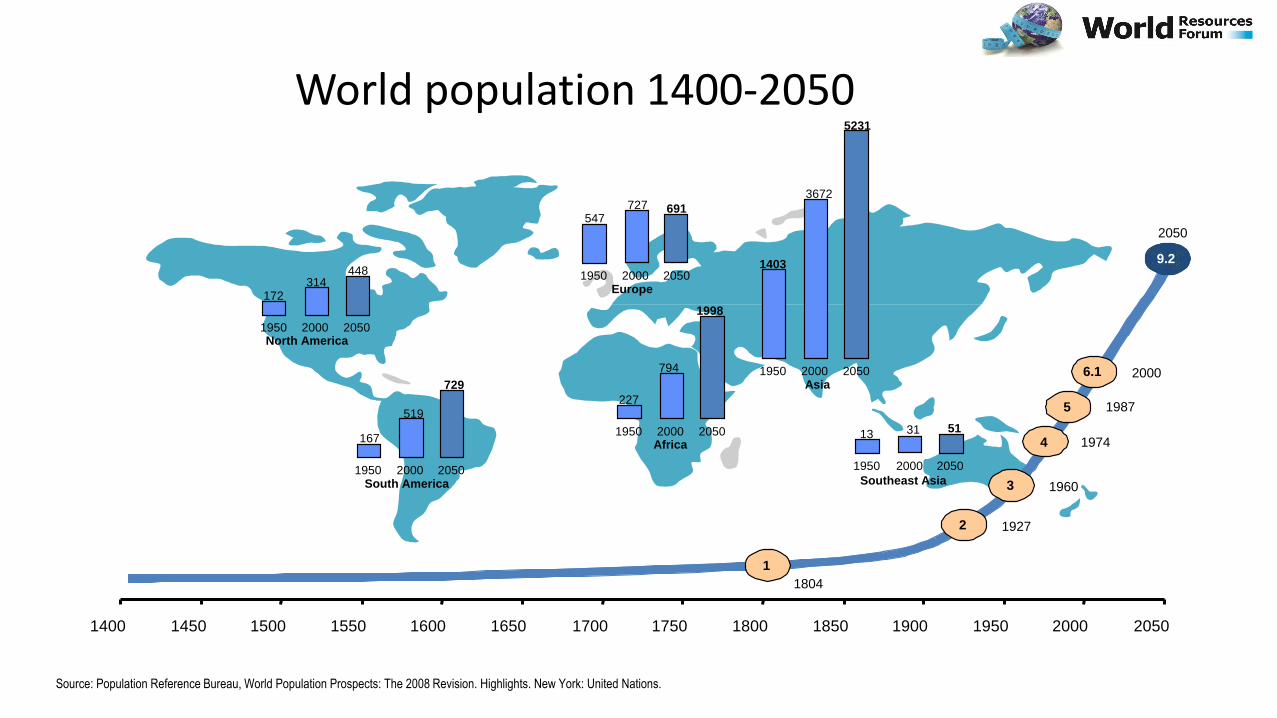
World population 1400-2050
1400 1450 1500 1550 1600 1650 1700 1750 1800 1850 1900 1950 2000 2050
1
2
3
4
5
6.1
9.2
1804
1960
1974
1987
2000
2050
1927
1403
3672
5231
1950 2000 2050 Asia
227
794
1998
1950 2000 2050 Africa
167
519
729
1950 2000 2050 South America
172 314
448
1950 2000 2050 North America
547 727 691
1950 2000 2050 Europe
13 31 51
1950 2050
Southeast Asia
2000
Source: Population Reference Bureau, World Population Prospects: The 2008 Revision. Highlights. New York: United Nations.
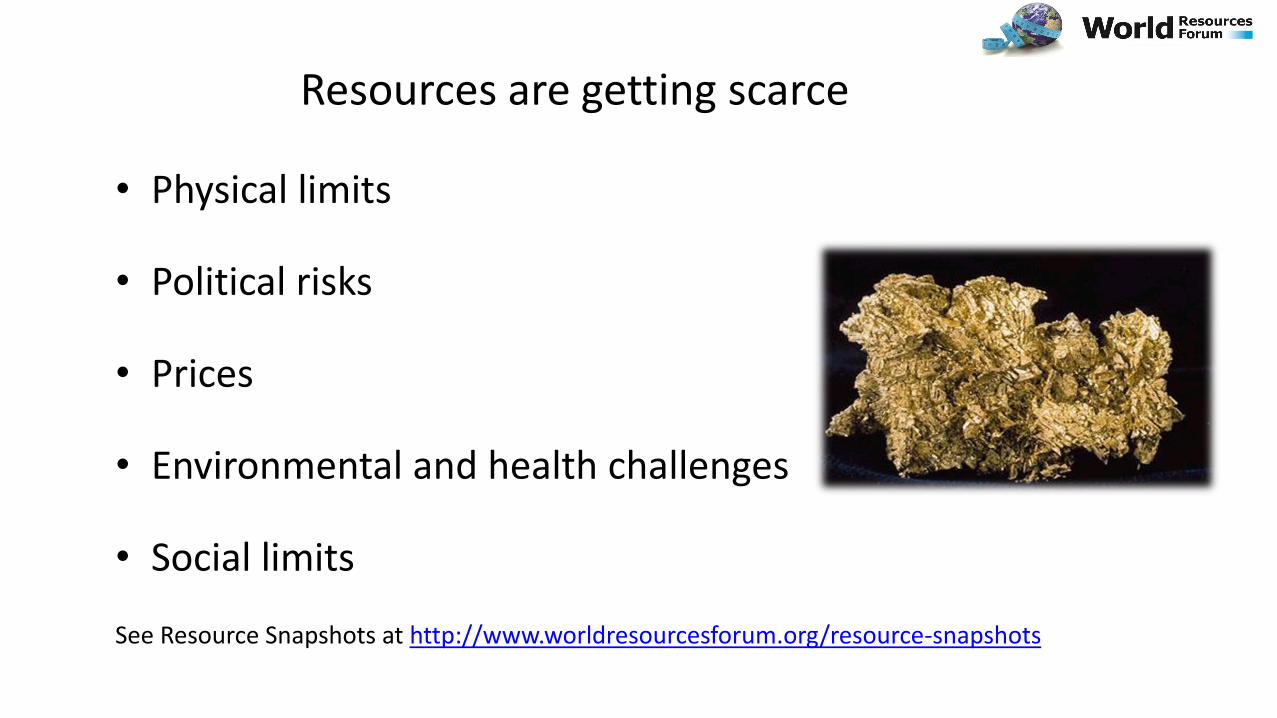
Resources are getting scarce
• Physical limits
• Political risks
• Prices
• Environmental and health challenges
• Social limits
See Resource Snapshots at http://www.worldresourcesforum.org/resource-snapshots
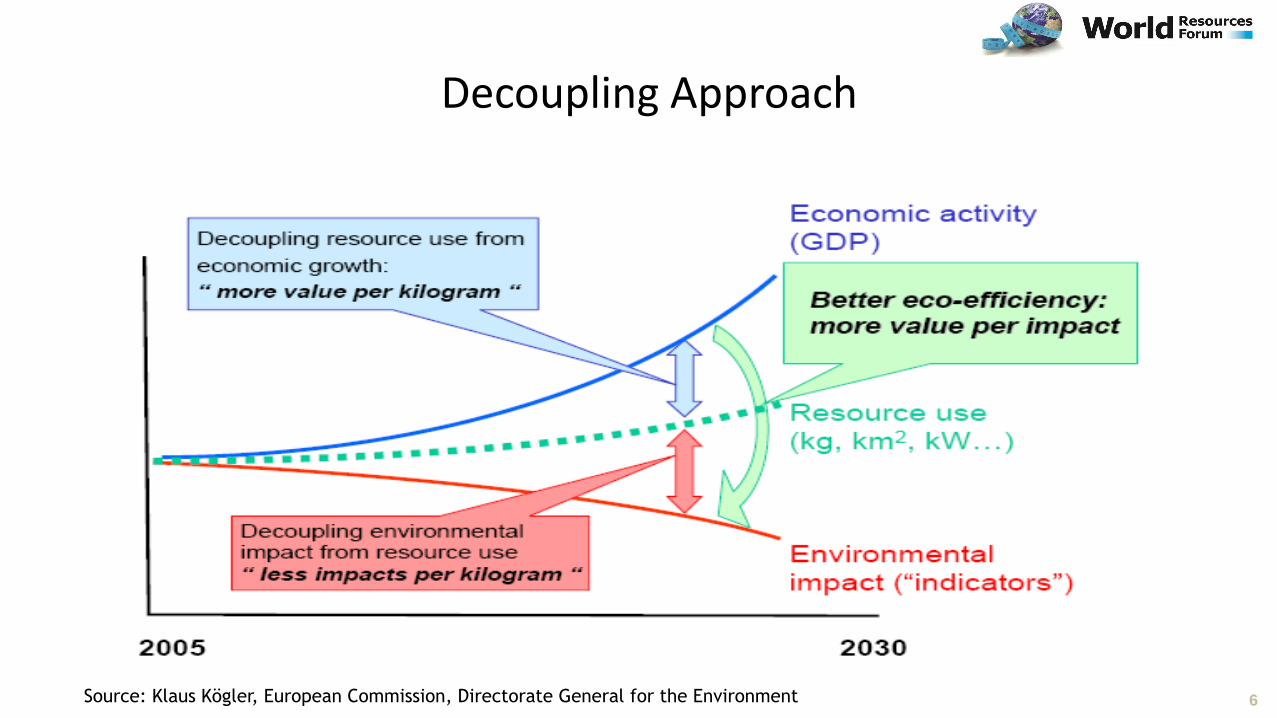
6 Source: Klaus Kögler, European Commission, Directorate General for the Environment
Decoupling Approach
6
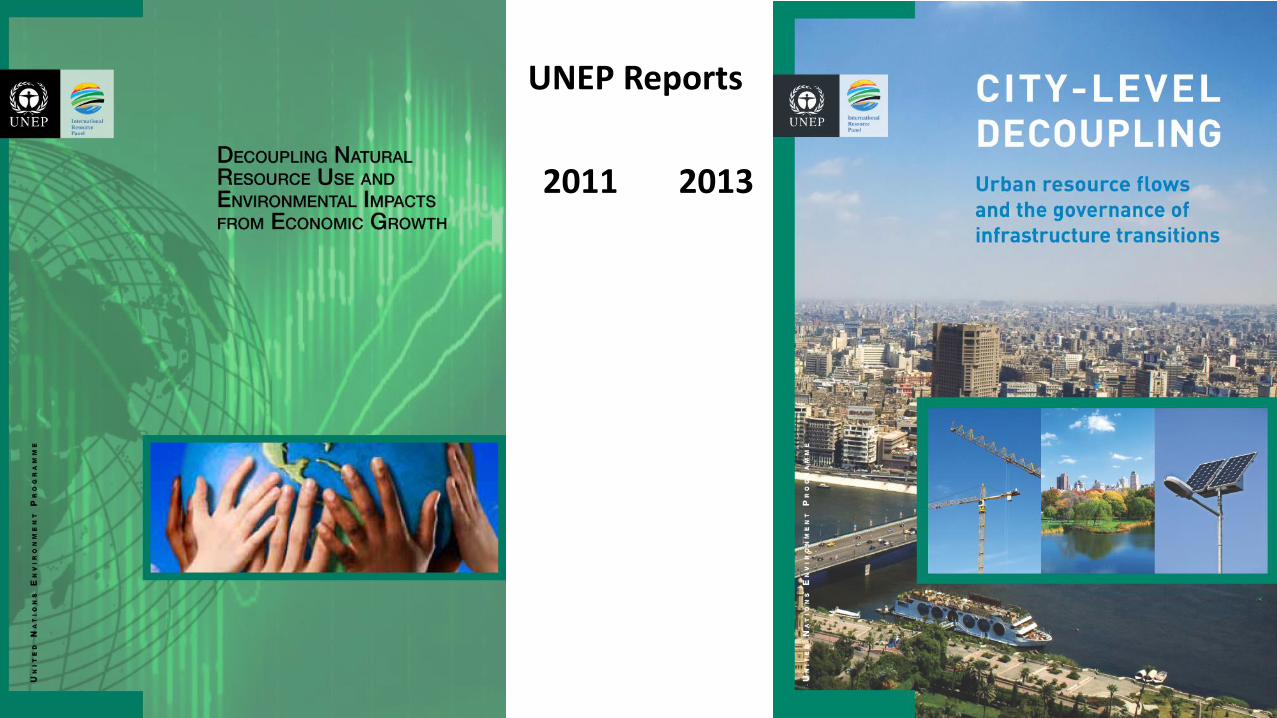
2013 2011
UNEP Reports
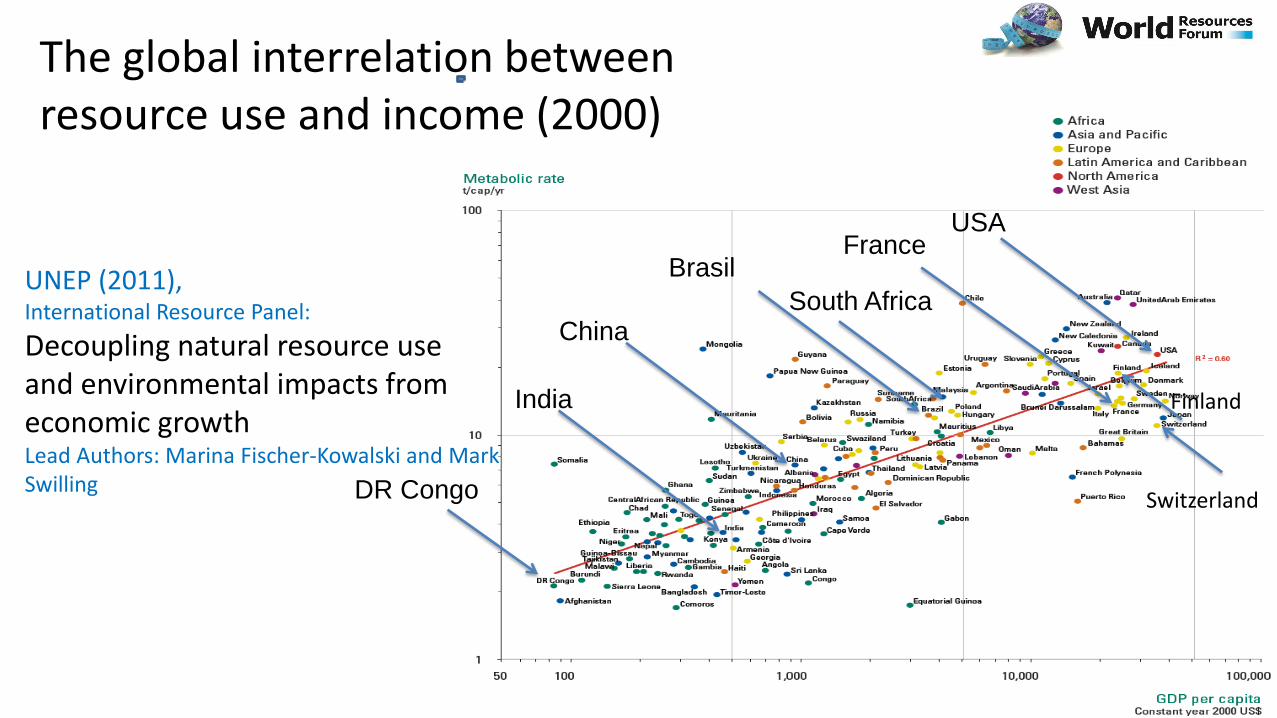
UNEP (2011), International Resource Panel:
Decoupling natural resource use and environmental impacts from economic growth Lead Authors: Marina Fischer-Kowalski and Mark Swilling
USA
South Africa China
DR Congo
France Brasil
India Finland
The global interrelation between resource use and income (2000)
Switzerland
City-level Decoupling:
Urban Resource Flows and Governance
of Infrastructure Transitions.
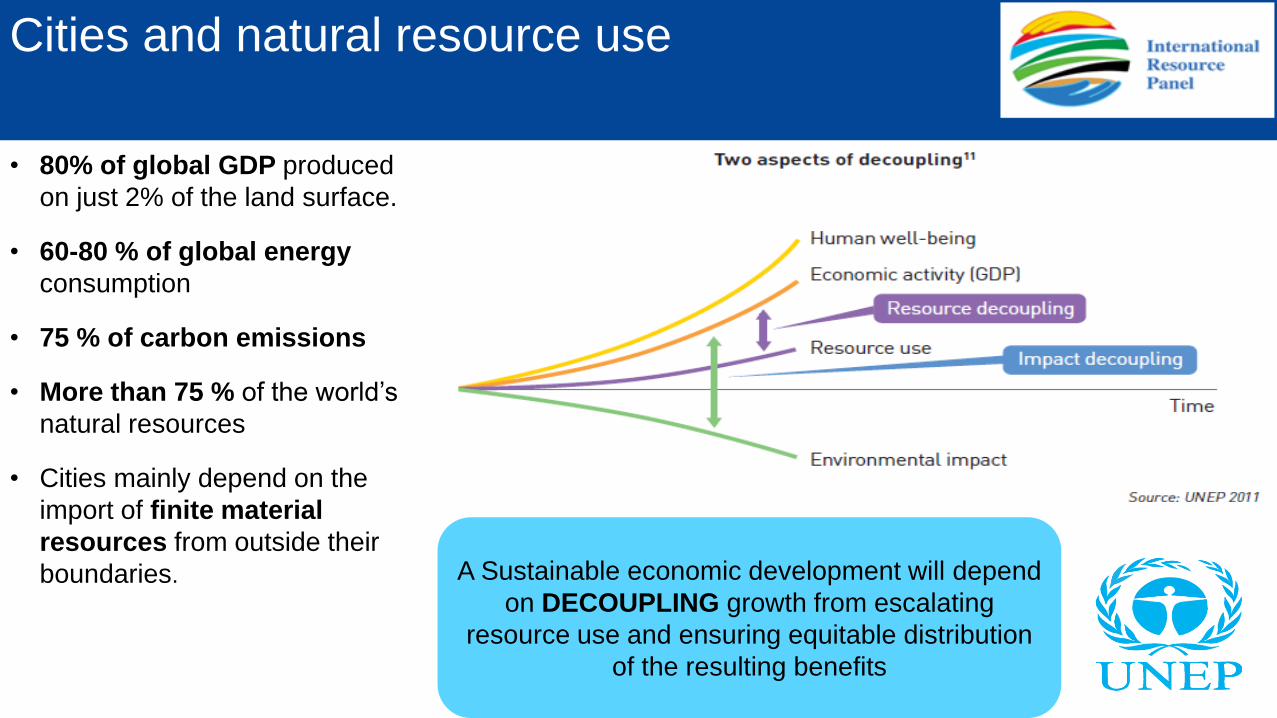
Cities and natural resource use
• 80% of global GDP produced
on just 2% of the land surface.
• 60-80 % of global energy
consumption
• 75 % of carbon emissions
• More than 75 % of the world’s
natural resources
• Cities mainly depend on the
import of finite material
resources from outside their
boundaries.
A Sustainable economic development will depend
on DECOUPLING growth from escalating
resource use and ensuring equitable distribution
of the resulting benefits
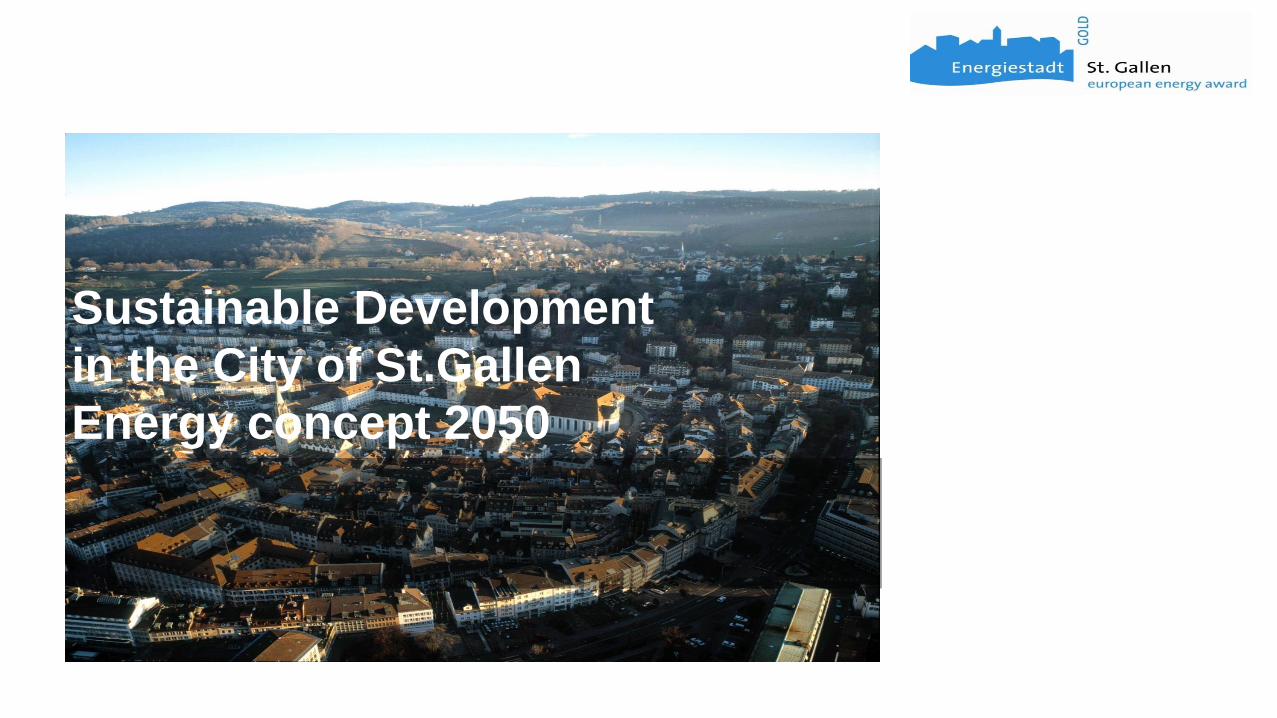
Sustainable Development
in the City of St.Gallen
Energy concept 2050
Energy Future St.Gallen
• What do we have to do to live up to the needs of the
population in the year 2050? How can we satisfy the
needs in the fields electricity, heating and mobility in
a sustainable way?
• Howe do we reach the 2000 Watt society (today we need 6000 Watt/person )?
• Were are the borders of efficiency? Where starts sufficiency?
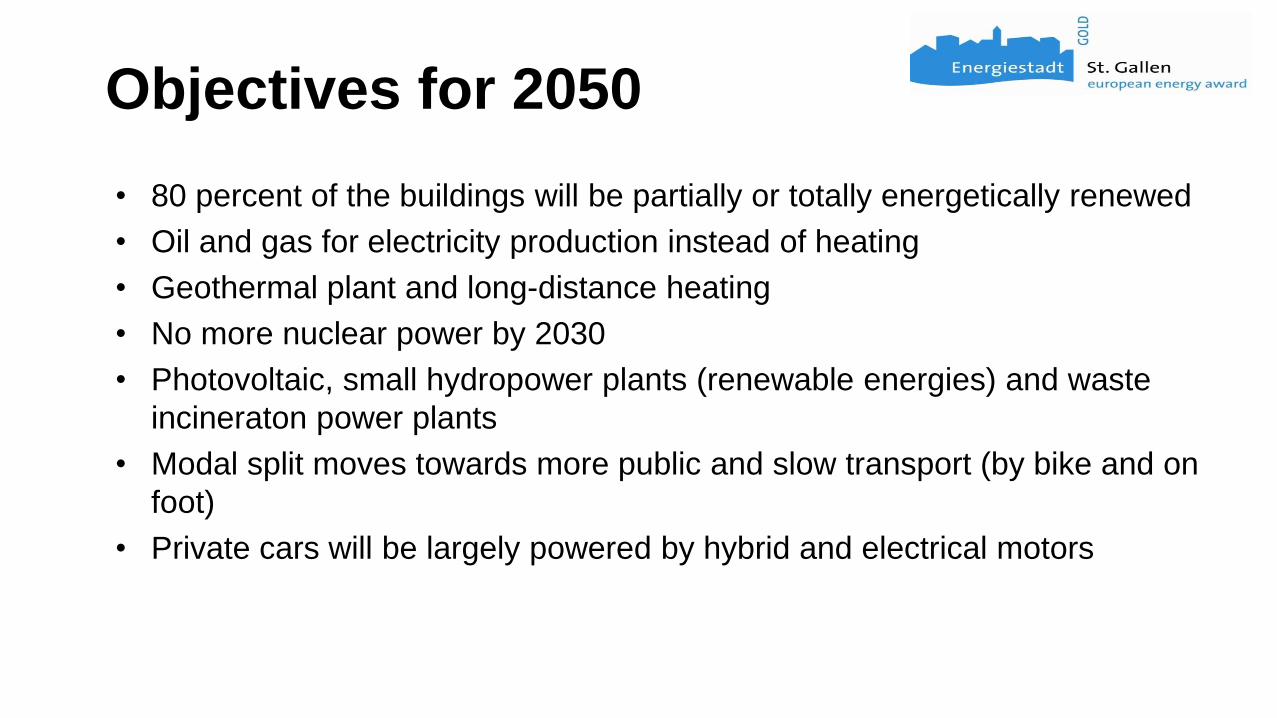
Objectives for 2050
• 80 percent of the buildings will be partially or totally energetically renewed
• Oil and gas for electricity production instead of heating
• Geothermal plant and long-distance heating
• No more nuclear power by 2030
• Photovoltaic, small hydropower plants (renewable energies) and waste
incineraton power plants
• Modal split moves towards more public and slow transport (by bike and on
foot)
• Private cars will be largely powered by hybrid and electrical motors
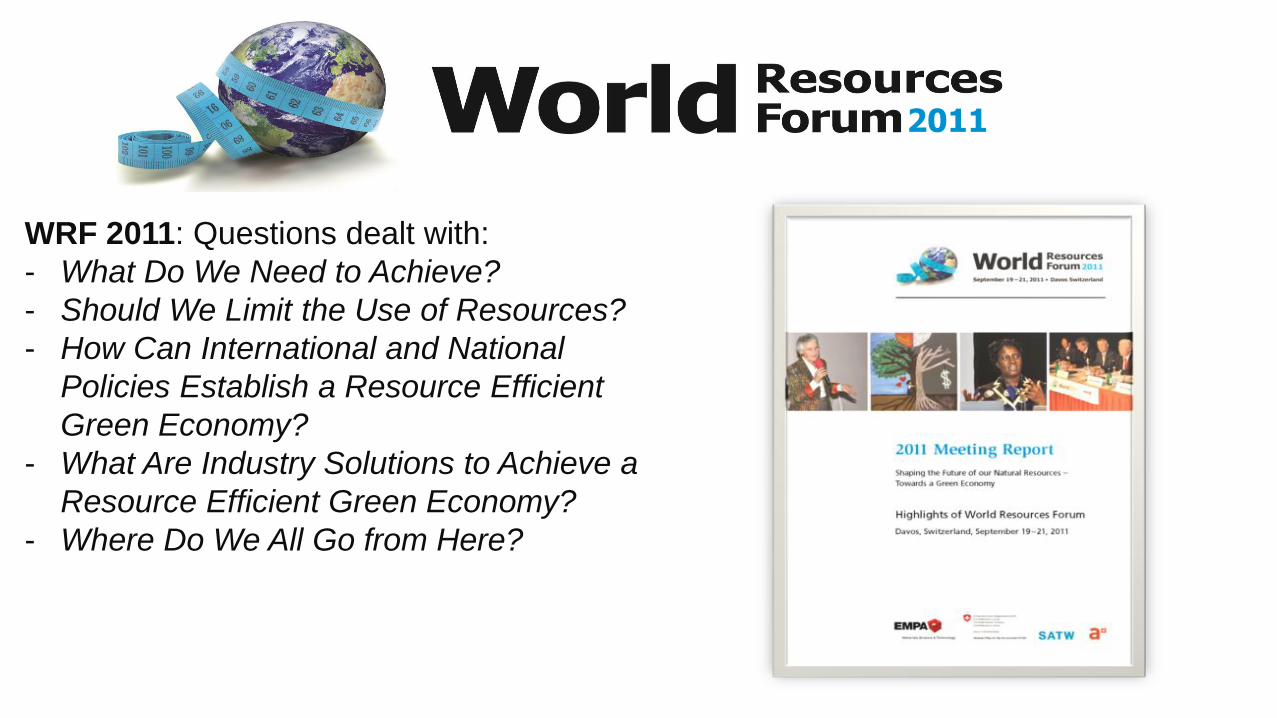
WRF 2011: Questions dealt with:
- What Do We Need to Achieve?
- Should We Limit the Use of Resources?
- How Can International and National
Policies Establish a Resource Efficient
Green Economy?
- What Are Industry Solutions to Achieve a
Resource Efficient Green Economy?
- Where Do We All Go from Here?
2011
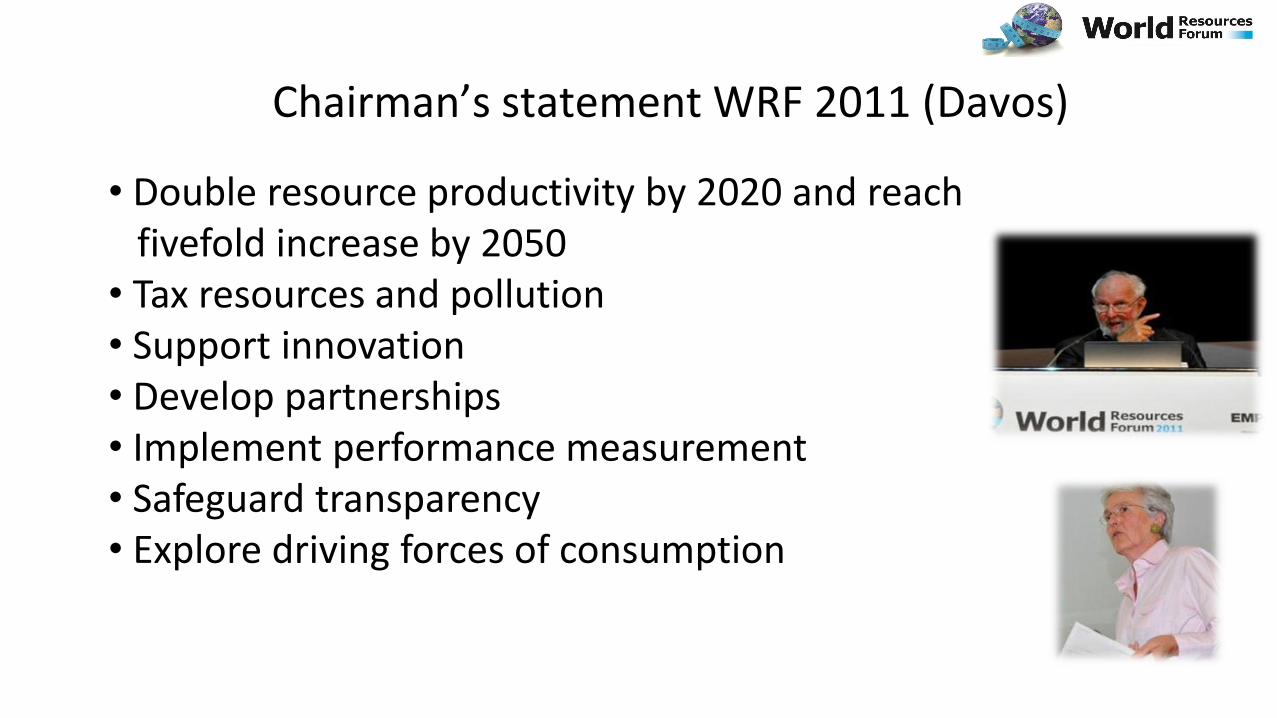
Chairman’s statement WRF 2011 (Davos)
• Double resource productivity by 2020 and reach fivefold increase by 2050 • Tax resources and pollution • Support innovation • Develop partnerships • Implement performance measurement • Safeguard transparency • Explore driving forces of consumption
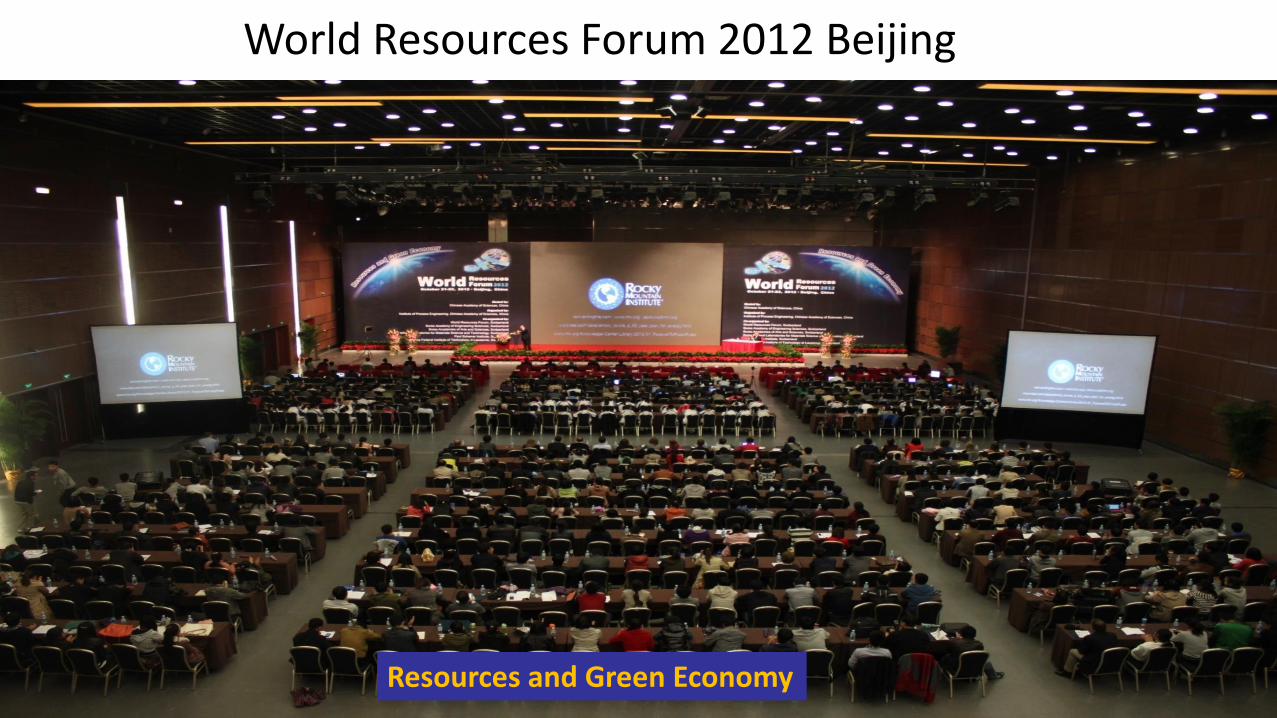
World Resources Forum 2012 Beijing
Resources and Green Economy
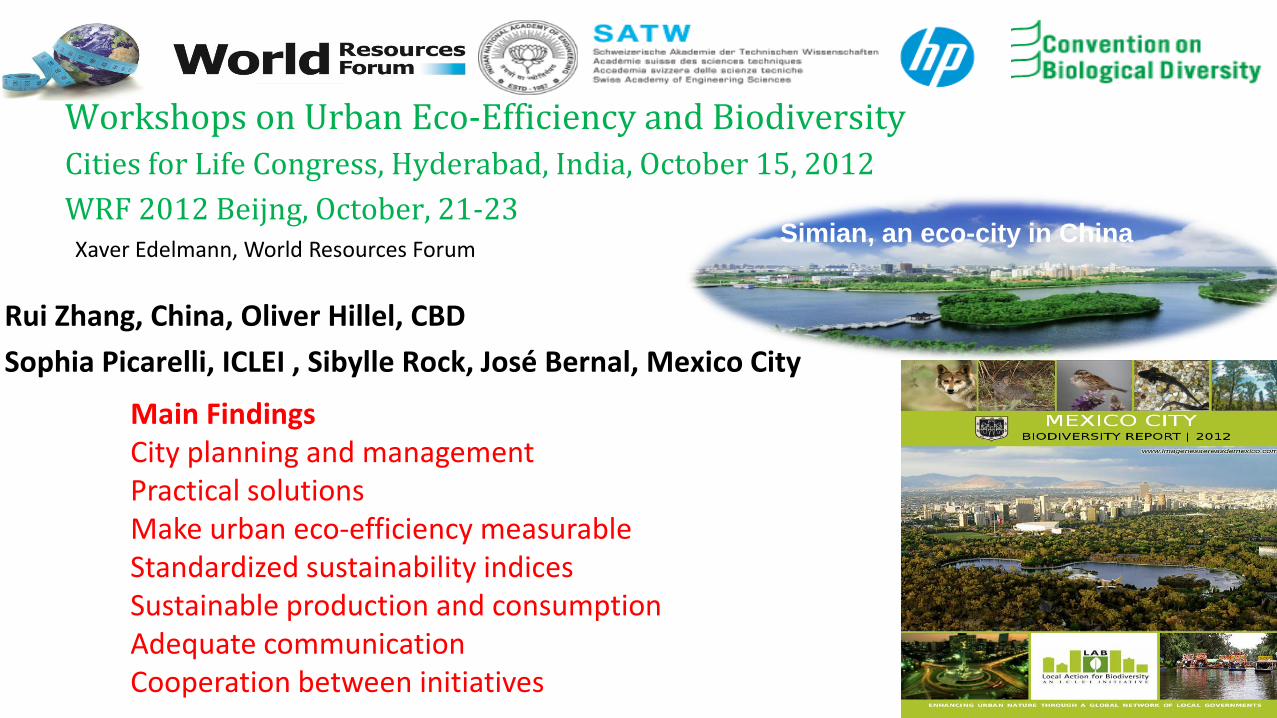
Workshops on Urban Eco-Efficiency and Biodiversity Cities for Life Congress, Hyderabad, India, October 15, 2012
WRF 2012 Beijng, October, 21-23
Rui Zhang, China, Oliver Hillel, CBD
Sophia Picarelli, ICLEI , Sibylle Rock, José Bernal, Mexico City
Simian, an eco-city in China
Main Findings City planning and management Practical solutions Make urban eco-efficiency measurable Standardized sustainability indices Sustainable production and consumption Adequate communication Cooperation between initiatives
Xaver Edelmann, World Resources Forum
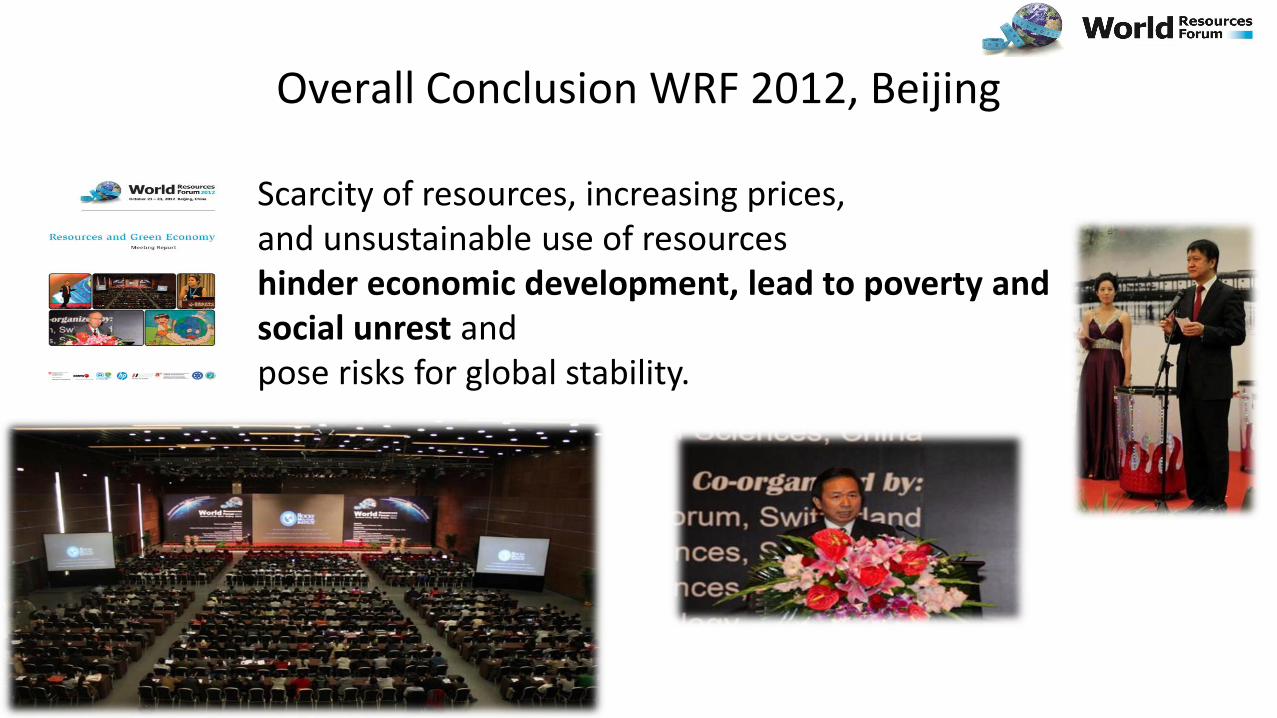
Overall Conclusion WRF 2012, Beijing
Scarcity of resources, increasing prices, and unsustainable use of resources hinder economic development, lead to poverty and social unrest and pose risks for global stability.
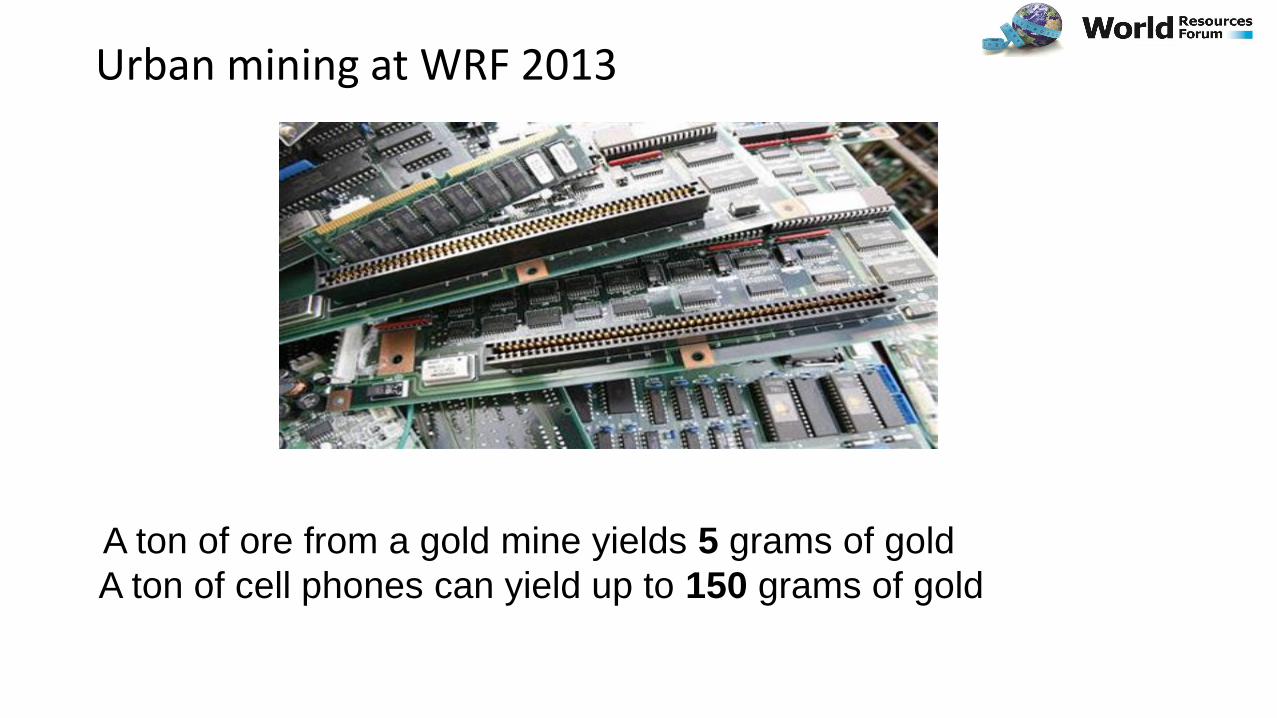
Urban mining at WRF 2013
A ton of ore from a gold mine yields 5 grams of gold
A ton of cell phones can yield up to 150 grams of gold
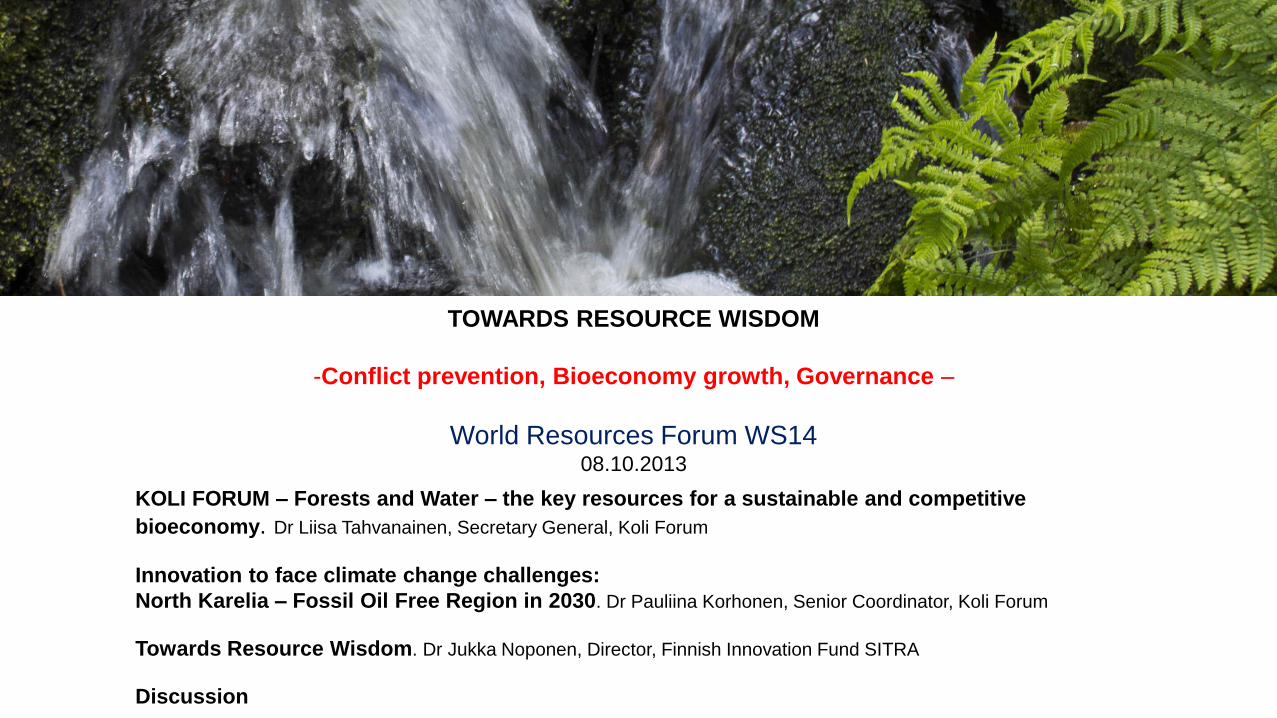
KOLI FORUM – Forests and Water – the key resources for a sustainable and competitive
bioeconomy. Dr Liisa Tahvanainen, Secretary General, Koli Forum
Innovation to face climate change challenges:
North Karelia – Fossil Oil Free Region in 2030. Dr Pauliina Korhonen, Senior Coordinator, Koli Forum
Towards Resource Wisdom. Dr Jukka Noponen, Director, Finnish Innovation Fund SITRA
Discussion
TOWARDS RESOURCE WISDOM
-Conflict prevention, Bioeconomy growth, Governance –
World Resources Forum WS14 08.10.2013
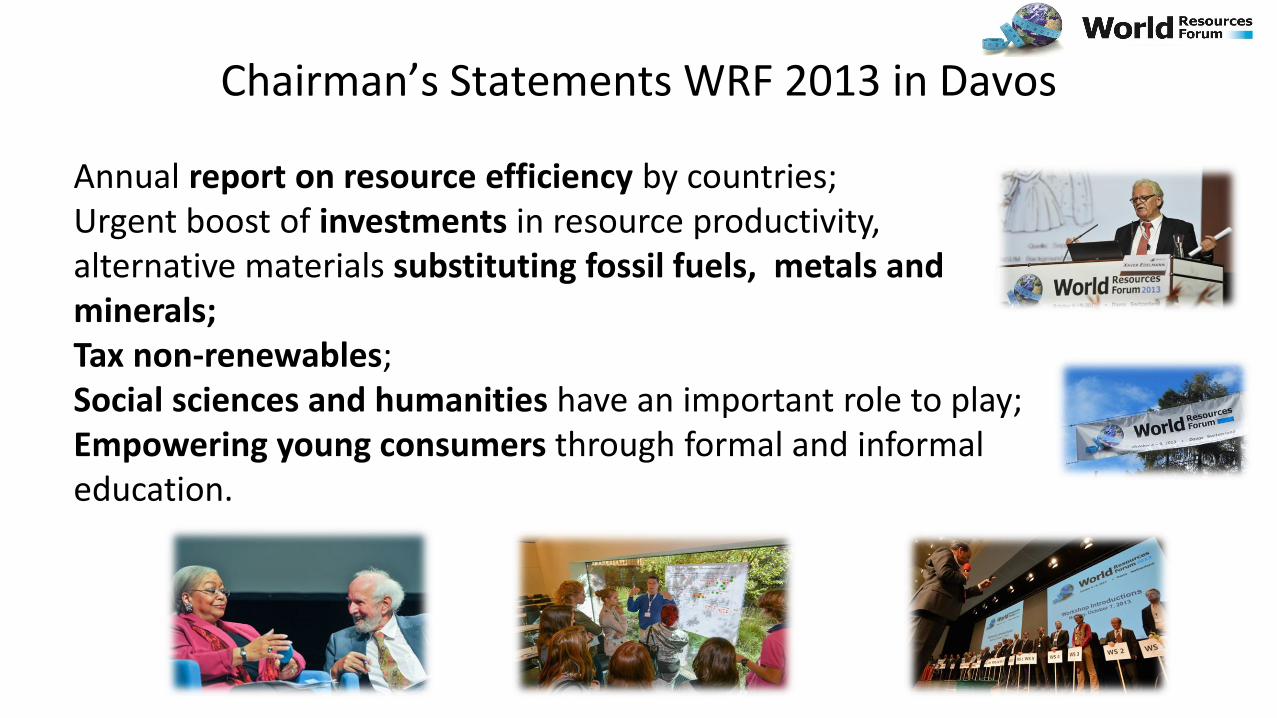
Chairman’s Statements WRF 2013 in Davos
Annual report on resource efficiency by countries; Urgent boost of investments in resource productivity, alternative materials substituting fossil fuels, metals and minerals; Tax non-renewables; Social sciences and humanities have an important role to play; Empowering young consumers through formal and informal education.
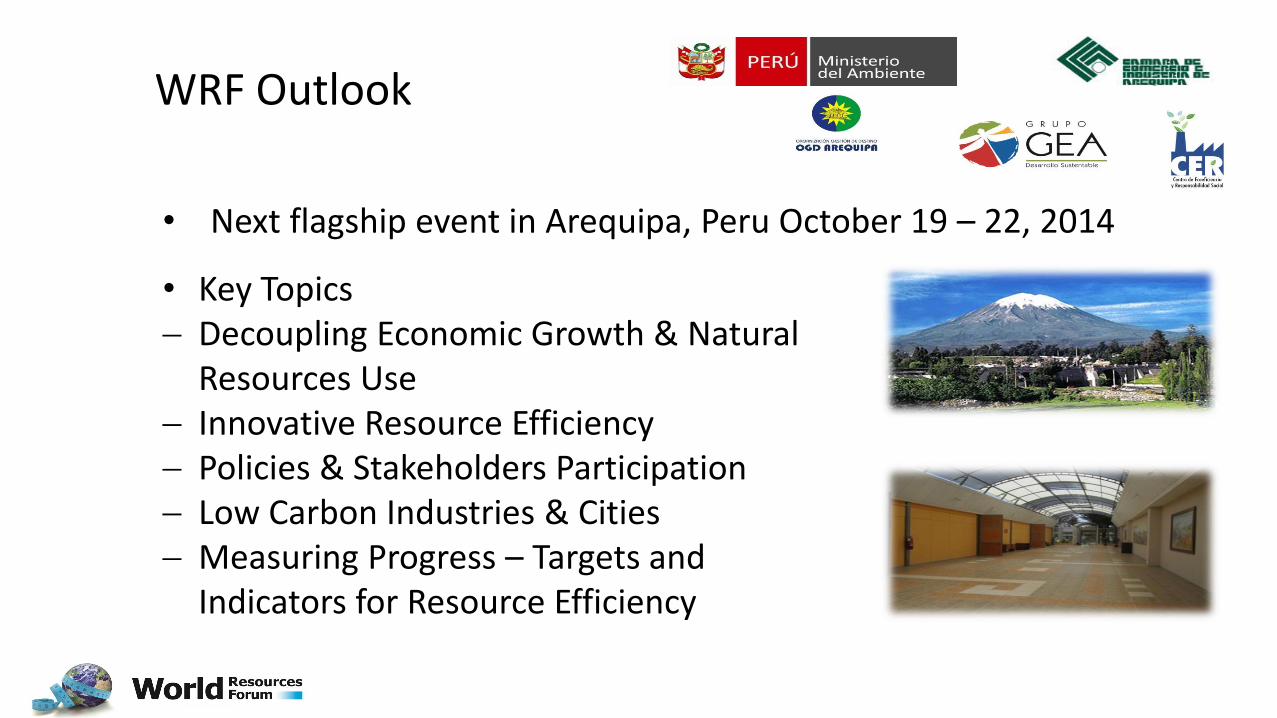
WRF Outlook
• Next flagship event in Arequipa, Peru October 19 – 22, 2014
• Key Topics Decoupling Economic Growth & Natural
Resources Use Innovative Resource Efficiency Policies & Stakeholders Participation Low Carbon Industries & Cities Measuring Progress – Targets and
Indicators for Resource Efficiency
Thank you for your attention
www.worldresourcesforum.org