kansas high plains aquifer: analysis of 2005 water levels geoffrey c. bohling brownie wilson...
Post on 22-Dec-2015
215 views
TRANSCRIPT

Kansas High Plains Aquifer: Kansas High Plains Aquifer: Analysis of 2005 Water Analysis of 2005 Water
LevelsLevels
Geoffrey C. BohlingGeoffrey C. Bohling
Brownie WilsonBrownie Wilson
Geohydrology SectionGeohydrology Section

Annual Measurement ProgramAnnual Measurement Program
High Plains Aquifer water levels measured High Plains Aquifer water levels measured annually by KGS and KDA-DWR since annually by KGS and KDA-DWR since 19971997
Evolved from USGS measurement Evolved from USGS measurement programprogram
Measured in winter (January) to minimize Measured in winter (January) to minimize effects of irrigation on measurementseffects of irrigation on measurements
Designed to monitor changes and identify Designed to monitor changes and identify regional trends in water tableregional trends in water table

Well Locations and HPA ExtentWell Locations and HPA Extent1 well every 16 square miles
Current monitoring network for HPA has 1348 wells
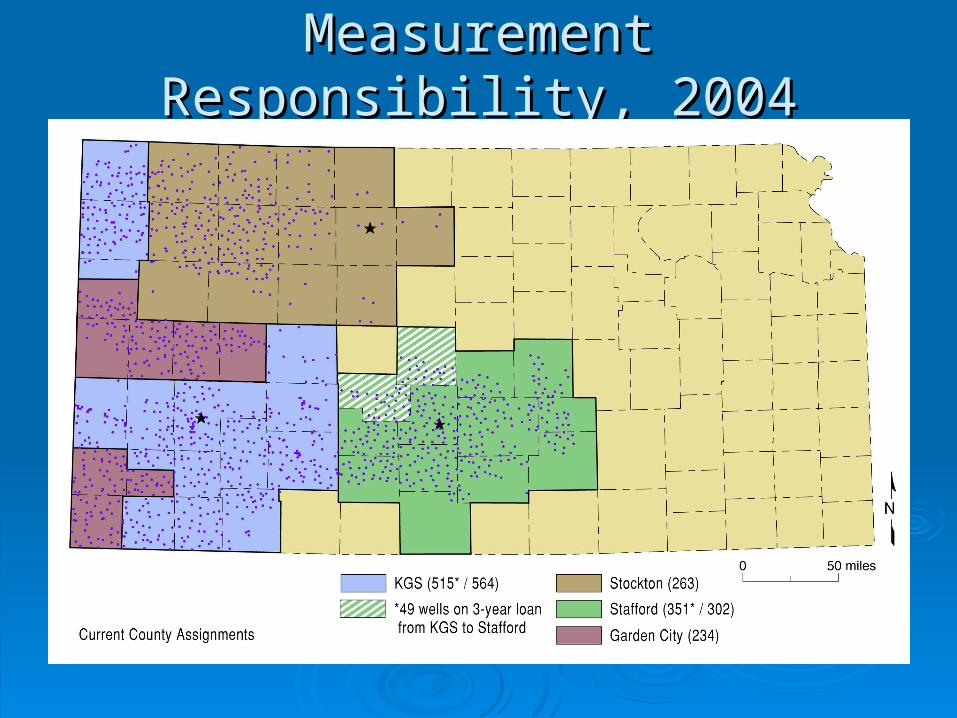
Measurement Responsibility, 2004Measurement Responsibility, 2004
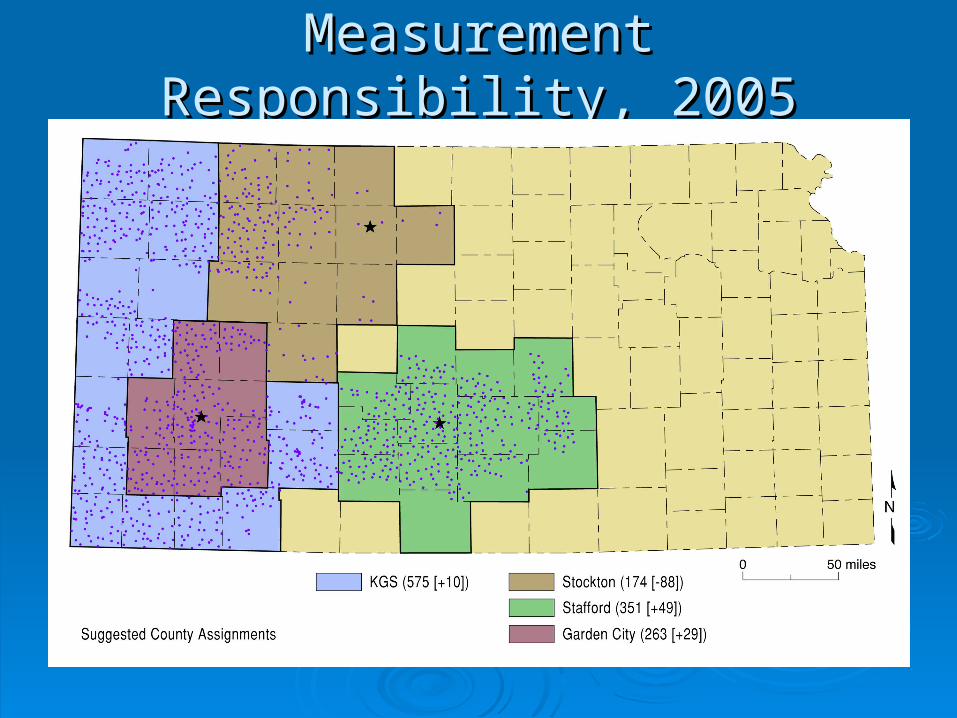
Measurement Responsibility, 2005Measurement Responsibility, 2005

Generalized N-S Cross-sectionGeneralized N-S Cross-section
From High Plains Aquifer Atlas: http://www.kgs.ku.edu/HighPlains/atlas/

Data Collection: WaterWitch/WaterBugData Collection: WaterWitch/WaterBug
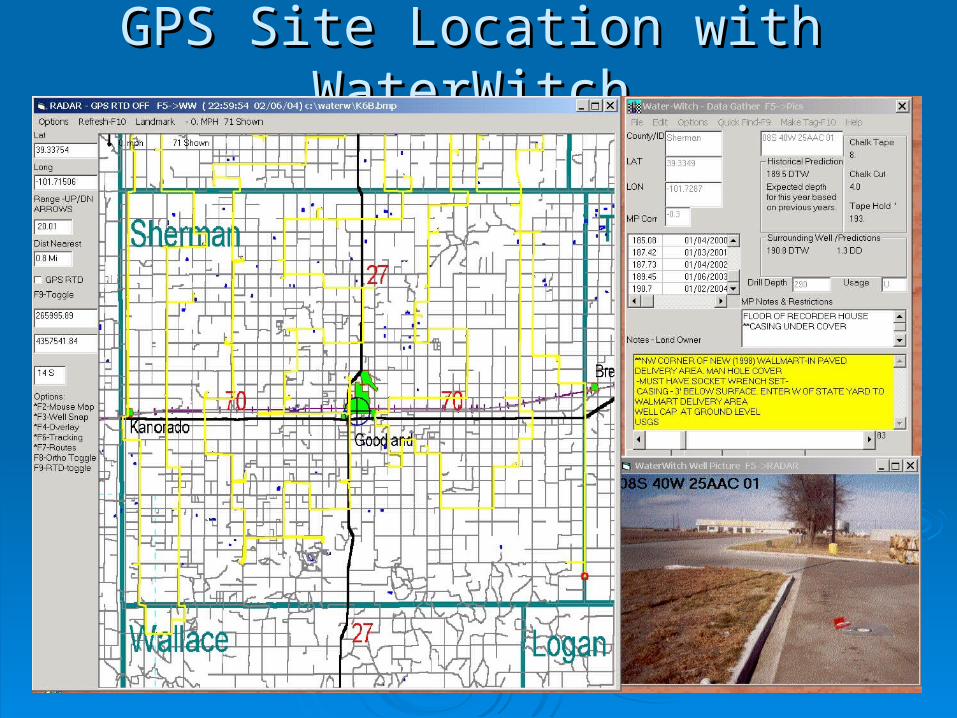
GPS Site Location with WaterWitchGPS Site Location with WaterWitch

On-site Data Entry With WaterBugOn-site Data Entry With WaterBugWater Bug

Wizard DatabaseWizard Database
http://www.kgs.ku.edu/Magellan/WaterLevels/index.html

Winter 2005 MeasurementsWinter 2005 Measurements
1267 wells: 715 DWR, 552 KGS1267 wells: 715 DWR, 552 KGS Most measurements made in Jan. 2005, Most measurements made in Jan. 2005,
but range from Dec. 2004 – Feb. 2005but range from Dec. 2004 – Feb. 2005 Repeat measurements at 53 wells for Repeat measurements at 53 wells for
quality controlquality control 968 irrigation wells, 233 observation wells, 968 irrigation wells, 233 observation wells,
rest other usesrest other uses
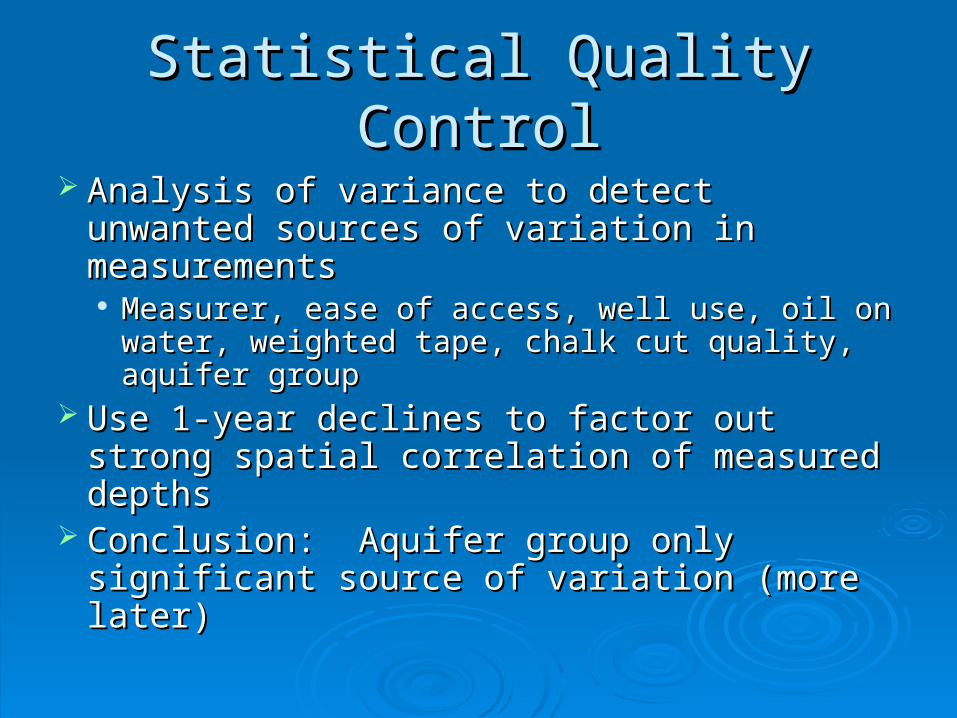
Statistical Quality ControlStatistical Quality Control
Analysis of variance to detect unwanted Analysis of variance to detect unwanted sources of variation in measurementssources of variation in measurements Measurer, ease of access, well use, oil on Measurer, ease of access, well use, oil on
water, weighted tape, chalk cut quality, water, weighted tape, chalk cut quality, aquifer groupaquifer group
Use 1-year declines to factor out strong Use 1-year declines to factor out strong spatial correlation of measured depthsspatial correlation of measured depths
Conclusion: Aquifer group only significant Conclusion: Aquifer group only significant source of variation (more later)source of variation (more later)
FIRN
SUBA
TH
LG
FO
NS
RA
SH
EL
PLCN
BT
CA
SG
GO TR
NT
KE
ME
SD
HM SF
DC
MN
GY
MP
GH
SM
RO
LEGL
WA
HP
KM
HG
SV
PN
STPR
SC
CMMT
RC
RH
EW
KW
ED
WH
HSGT
SW
HV
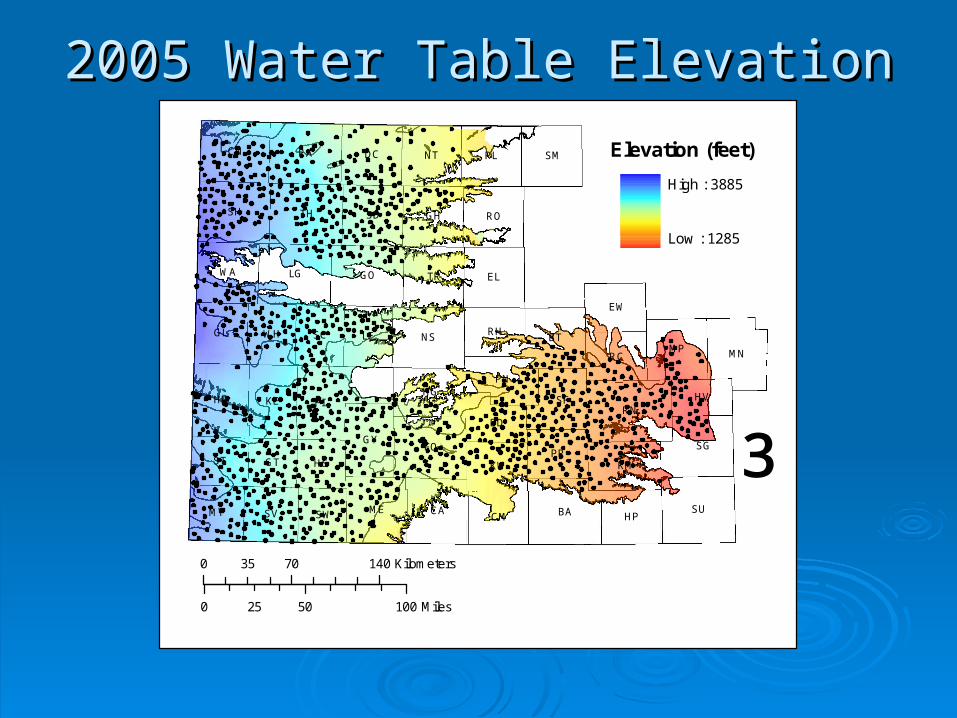
Elevation (feet)
High : 3885
Low : 1285
0 50 10025 Miles
0 70 14035 Kilometers
³
2005 Water Table Elevation2005 Water Table Elevation
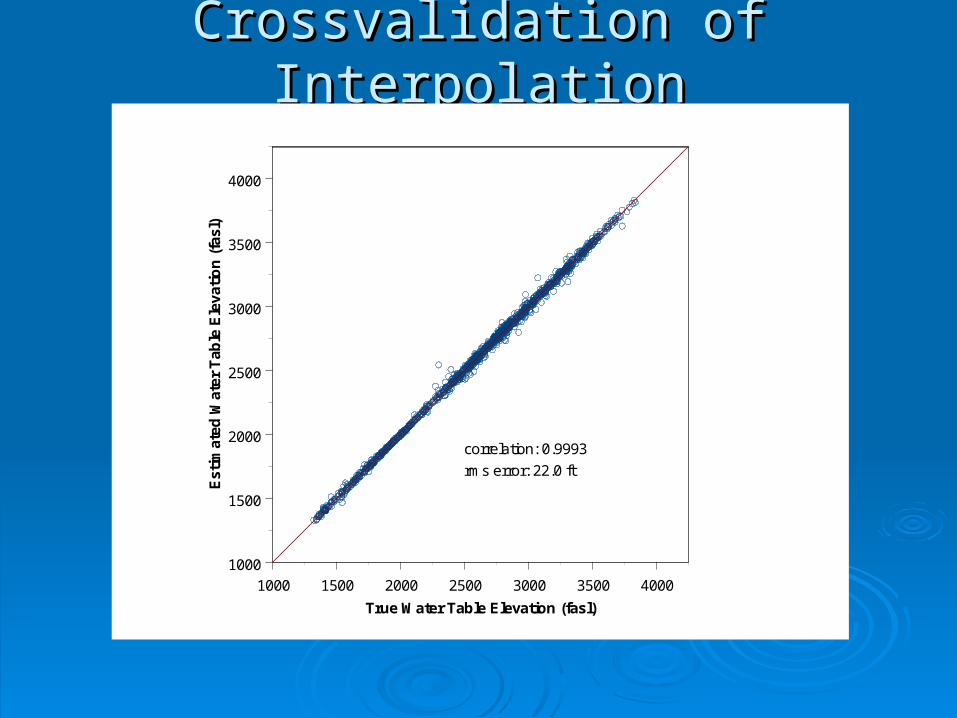
Crossvalidation of InterpolationCrossvalidation of Interpolation
1000 1500 2000 2500 3000 3500 4000
True Water Table Elevation (fasl)
1000
1500
2000
2500
3000
3500
4000
Est
imat
ed W
ater
Tab
le E
leva
tio
n (
fasl
)
correlation: 0.9993
rms error: 22.0 ft

FIRN
SUBA
TH
LG
FO
NS
RA
SH
EL
PLCN
BT
CA
SG
GO TR
NT
KE
ME
SD
HM SF
DC
MN
GY
MP
GH
SM
RO
LEGL
WA
HP
KM
HG
SV
PN
STPR
SC
CMMT
RC
RH
EW
KW
ED
WH
HSGT
SW
HV
StandardDeviation(feet)
< 15.4
15.4 - 18
18 - 20
> 20
0 50 10025 Miles
0 70 14035 Kilometers
³
Interpolation Error Map, 2005 WTEInterpolation Error Map, 2005 WTE

2004 to 2005 Declines2004 to 2005 Declines
-15 -10 -5 0 5 10 15
Water Level Decline, 2004 to 2005 (feet)
0
100
200
300
400
Co
un
t
min: -23.1 ft
mean: 0.15 ft
median: 0.19 ft
max: 18.3 ft

FIRN
SUBA
TH
LG
FO
NS
RA
SH
EL
PLCN
BT
CA
SG
GO TR
NT
KE
ME
SD
HM SF
DC
MN
GY
MP
GH
SM
RO
LEGL
WA
HP
KM
HG
SV
PN
STPR
SC
CMMT
RC
RH
EW
KW
ED
WH
HSGT
SW
HV
Decline (feet)
Under -2
-2 to -1
-1 to 0
0 to 1
1 to 2
2 to 3
3 to 4
Over 4
0 50 10025 Miles
0 70 14035 Kilometers
³
Map of 2004 to 2005 DeclinesMap of 2004 to 2005 Declines

1-Year Declines by Aquifer Group1-Year Declines by Aquifer Group
QA QT TO QK KK
Aquifer Group
-10
-8
-6
-4
-2
0
2
4
6
8
10
2004
to
200
5 D
eclin
e (f
eet)
-0.26 ft 0.53 ft 0.01 ft -0.82 ft0.33 ft

2000 to 2005 Declines2000 to 2005 Declines
-40 -30 -20 -10 0 10 20 30 40
Water Level Decline, 2000 to 2005 (feet)
0
50
100
150
200
250
300
Co
un
t
min: -29.3 ft
mean: 5.47 ft
median: 3.80 ft
max: 42.2 ft
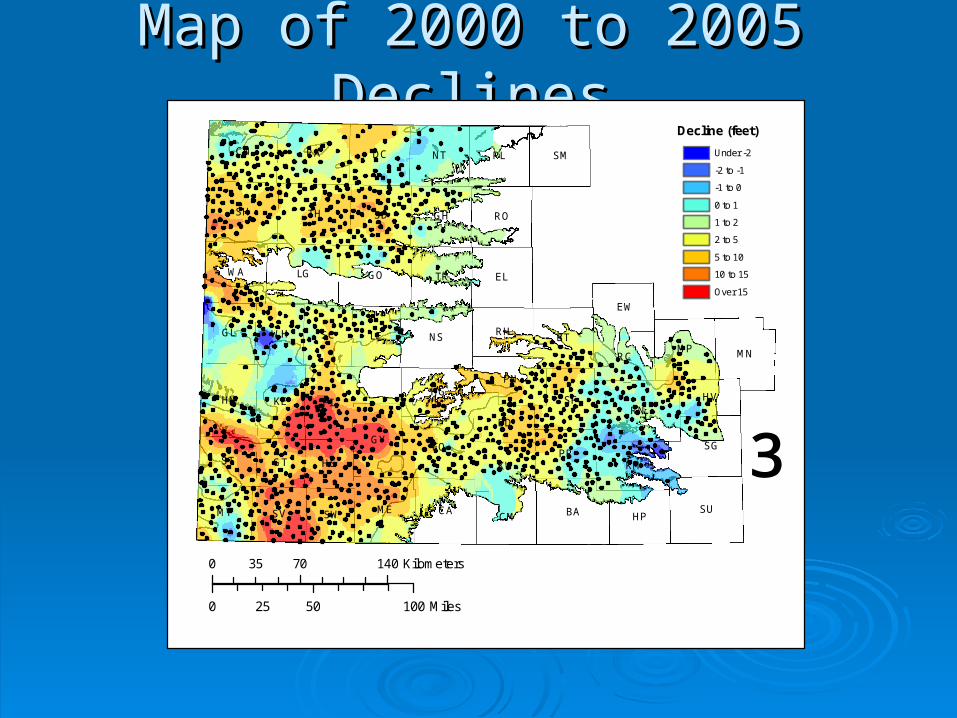
Map of 2000 to 2005 DeclinesMap of 2000 to 2005 Declines
FIRN
SUBA
TH
LG
FO
NS
RA
SH
EL
PLCN
BT
CA
SG
GO TR
NT
KE
ME
SD
HM SF
DC
MN
GY
MP
GH
SM
RO
LEGL
WA
HP
KM
HG
SV
PN
STPR
SC
CMMT
RC
RH
EW
KW
ED
WH
HSGT
SW
HV
Decline (feet)
Under -2
-2 to -1
-1 to 0
0 to 1
1 to 2
2 to 5
5 to 10
10 to 15
Over 15
0 50 10025 Miles
0 70 14035 Kilometers
³

1995 to 2005 Declines1995 to 2005 Declines
-60 -50 -40 -30 -20 -10 0 10 20 30 40 50 60
Water Level Decline, 1995 to 2005 (feet)
0
50
100
150
200
250
Co
un
t
min: -47.3 ft
mean: 5.84 ft
median: 2.97 ft
max: 59.4 ft

Map of 1995 to 2005 DeclinesMap of 1995 to 2005 Declines
FIRN
SUBA
TH
LG
FO
NS
RA
SH
EL
PLCN
BT
CA
SG
GO TR
NT
KE
ME
SD
HM SF
DC
MN
GY
MP
GH
SM
RO
LEGL
WA
HP
KM
HG
SV
PN
STPR
SC
CMMT
RC
RH
EW
KW
ED
WH
HSGT
SW
HV
Decline (feet)
Under -5
-5 to -2
-2 to -1
-1 to 0
0 to 1
1 to 2
2 to 5
5 to 10
10 to 15
15 to 30
Over 30
0 50 10025 Miles
0 70 14035 Kilometers
³

Decline Rate ComparisonDecline Rate Comparison
-7 -6 -5 -4 -3 -2 -1 0 1 2 3 4 5 6 7
Decline Rate (feet/year)
0
10
20
30
40
0
10
20
30
40
0
10
20
30
40
Per
cen
t
2004 to 2005
2000 to 2005
1995 to 2005
min: - 4.73
mean: 0.58
median: 0.30
max: 5.94
min: - 5.87
mean: 1.09
median: 0.76
max: 8.44
min: - 23.09
mean: 0.15
median: 0.19
max: 18.27

Five-Year Average DeclinesFive-Year Average Declines
2000 2001 2002 2003 2004 2005
Measurement Year
1
2
3
4
5
Ave
rag
e D
eclin
e O
ver
Pre
ced
ing
5 Y
ears
(fe
et)
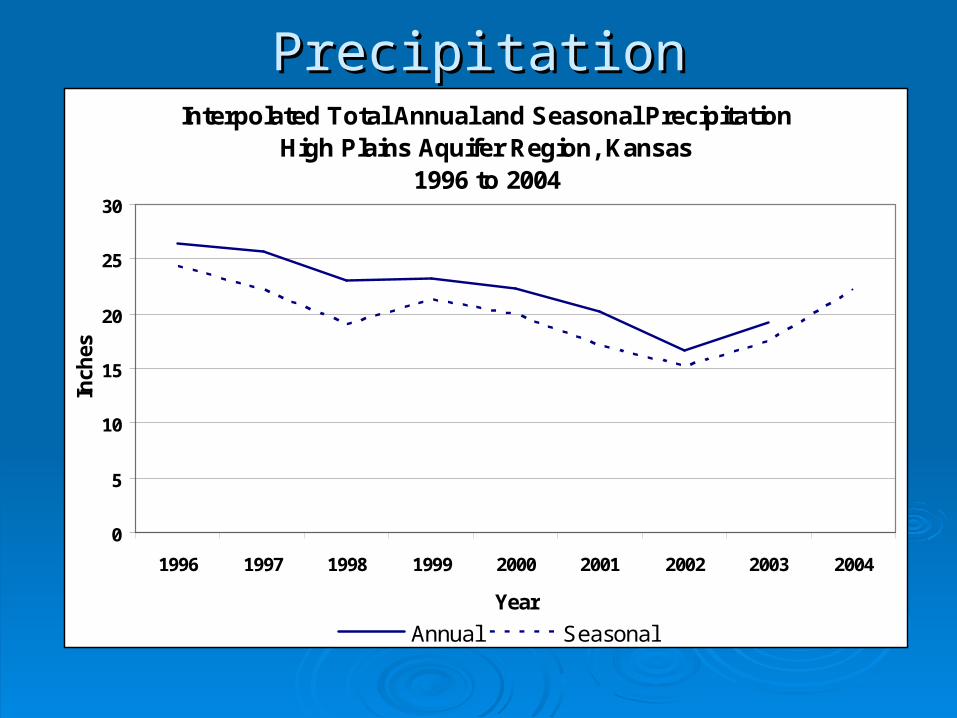
PrecipitationPrecipitationInterpolated Total Annual and Seasonal Precipitation
High Plains Aquifer Region, Kansas1996 to 2004
0
5
10
15
20
25
30
1996 1997 1998 1999 2000 2001 2002 2003 2004
Year
Inch
es
Annual Seasonal
ConclusionsConclusions
Measurement program is very reliableMeasurement program is very reliable Average 2004 to 2005 decline (0.15 feet) Average 2004 to 2005 decline (0.15 feet)
significantly less than average decline rate significantly less than average decline rate over past five (1.09 feet/year) or ten (0.58 over past five (1.09 feet/year) or ten (0.58 feet/year) yearsfeet/year) years
Due at least in part to precipitationDue at least in part to precipitation But declines still persist, still strong in But declines still persist, still strong in
some areassome areas

From High Plains Aquifer Atlas: http://www.kgs.ku.edu/HighPlains/atlas/
The Aquifer Formerly Known as OgallalaThe Aquifer Formerly Known as Ogallala

Responsible Agency, 2004 & 2005Responsible Agency, 2004 & 2005

Measurement ProceduresMeasurement Procedures
Well locations verified with GPSWell locations verified with GPS Depths measured with chalked steel tapeDepths measured with chalked steel tape Measurements, info entered on-site using Measurements, info entered on-site using
WaterWitch/WaterBug softwareWaterWitch/WaterBug software Repeat measurements for quality controlRepeat measurements for quality control Efficient routing of teams for rapid Efficient routing of teams for rapid
completion (Jan. 8-13, 2005 for KGS)completion (Jan. 8-13, 2005 for KGS)