kapitola 11 energetický metabolismus iv přeměna energie na fotosyntetizujících přeměna...
TRANSCRIPT

KAPITOLA 11KAPITOLA 11
Energetický metabolismus IVEnergetický metabolismus IV
• přeměna energie na fotosyntetizujících přeměna energie na fotosyntetizujících membránách membránách
• Calvinův cyklusCalvinův cyklus
• fotorespiracefotorespirace
• koncentrace oxidu uhličitéhokoncentrace oxidu uhličitého
• fotoredukce nitrátů a sulfátů fotoredukce nitrátů a sulfátů

The cycling of carbon dioxide and oxygen The cycling of carbon dioxide and oxygen between the autotrophic (photosynthetic) and between the autotrophic (photosynthetic) and the heterotrophic domains in the biosphere.the heterotrophic domains in the biosphere. The flow of mass through this cycle is enormous; about 4x10¹¹ metric tons of carbon are turned over in the biosphere annually.

Solar energy is the ultimate source of all biological energy. Photosynthetic organisms use the energy of sunlight to manufacture glucose and other organic cell products, which heterotrophic cells use as energy and carbon sources.

Schematic diagram (a) and electron micrograph (b) of a single chloroplast at high magnification.

The light reactions generate energy-rich NADPH and ATP at the expense of solar energy. These products are used in the carbon fixation reactions, which occur in light or darkness, to reduce CO2 to form trioses and more complex compounds (such as glucose) derived from trioses.

Electrondeficiency of Mn center
Mn center ofwater-splitting
enzyme complex
Light
The sequential absorption of four photons, each causing the loss of one electron from the Mn center, produces an oxidizing agent that can take four electrons from two molecules of water, producing O 2. The electrons lost from Mn center pass one at a time to a Tyr residue (Z+) in a reaction-center protein.
The four-step process that produces a four-electron oxidizing agent, believed to be a complex of several Mn ions, in the water-splitting complex of photosystem II.

The integration of photosystems I and II. This "Z scheme" shows the pathway of electron transfer from H2O (lower left) to NADP+ (upper right) in noncyclic photosynthesis. The position on the vertical scale of each electron carrier reflects its standart reduction potential. To raise the energy of electrons derived from H2O to the energy level required to reduce NADP+ to NADPH, each electron must be "lifted" twice (heavy arrows) by photons absorbed in photosystems I and II. One photon is required per electron boosted in each photosystem. After each excitation, the high-energy electrons flow "downhill" via the carrier chains shown. Protons move across the thylakoid membrane during the water-splitting reaction and during electron transfer through the cytochrome bf complex, producing the proton gradient that is central to ATP formation. The dashed arrow is the path of cyclic electron transfer, in which only photosystem I is involved; electrons return via the cyclic pathway to photosystem I, instead of reducing NADP+ to NADPH. Ph, pheophytinQA, plastoquinoneQB, a second quinonePC, plastocyaninAO, electron acceptor chlorophyllA1, phylloquinoneFd, ferredoxinFP, Ferredoxin-NADP+ oxidoreductase

Proton and electron circuits in chloroplast thylakoids. Electron (blue arrows) move from H2O to photosystem II, the intermediate chain of carriers, photosystem I, and finally to NADP+. Protons (red arrows) are pumped into the thylakoid lumen by the flow of electrons through the chain of carriers between photosystem II and photosystem I, and reenter the stroma through proton channels formed by the FO portion of the ATP synthase, designated CFO in the chloroplast enzyme. The F1 subunit (CF1) catalyzes synthesis of ATP.
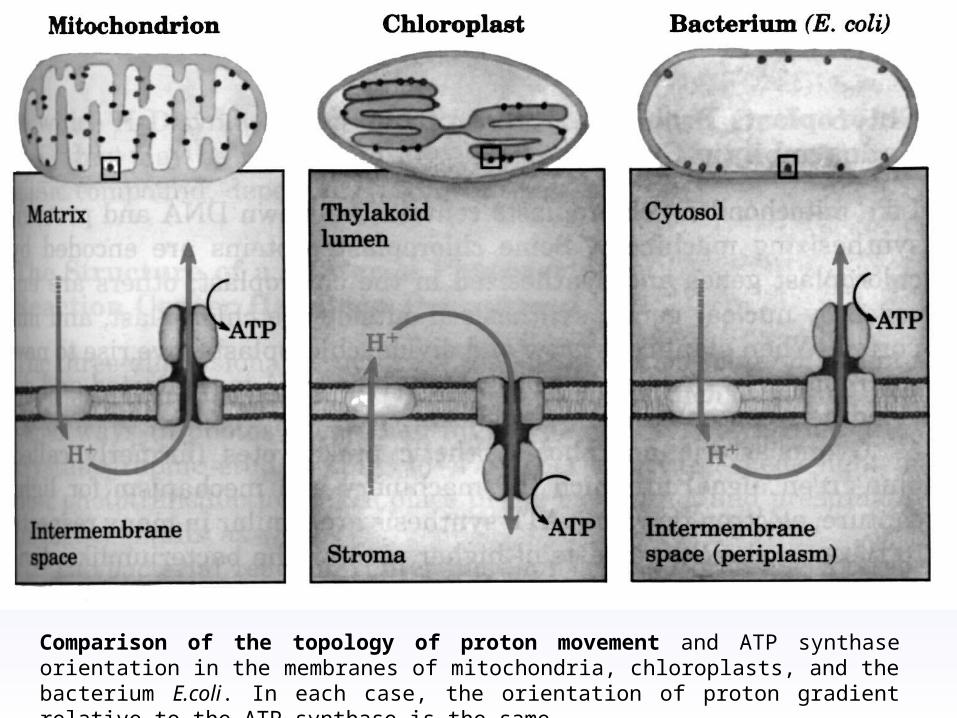
Comparison of the topology of proton movement and ATP synthase orientation in the membranes of mitochondria, chloroplasts, and the bacterium E.coli. In each case, the orientation of proton gradient relative to the ATP synthase is the same.

The three stages of CO2 fixation in photosynthetic organisms.Stoichiometries of three key inter-mediates are shown (numbers in parantheses) so that the fate of carbon atoms entering and leaving the cycle is apparent. As shown here, three CO2 are fixed to permi the net synthesis of one molecule of glyceraldehyde-3-phosphate. This is called the photosynthetic carbon reduction cycle of the Calvin cycle.

The first stage of CO2 fixation is the reaction catalyzed by ribulose-1,5-bisphosphate carboxylase (RUBISCO). The carboxylated reaction intermediate is believed to be the enyzme-bound six-carbon -keto acid shown here, which is hydrolyzed and released from the enzyme surface as two identical three-carbon products, one of which contains the carbon atom from CO2 .
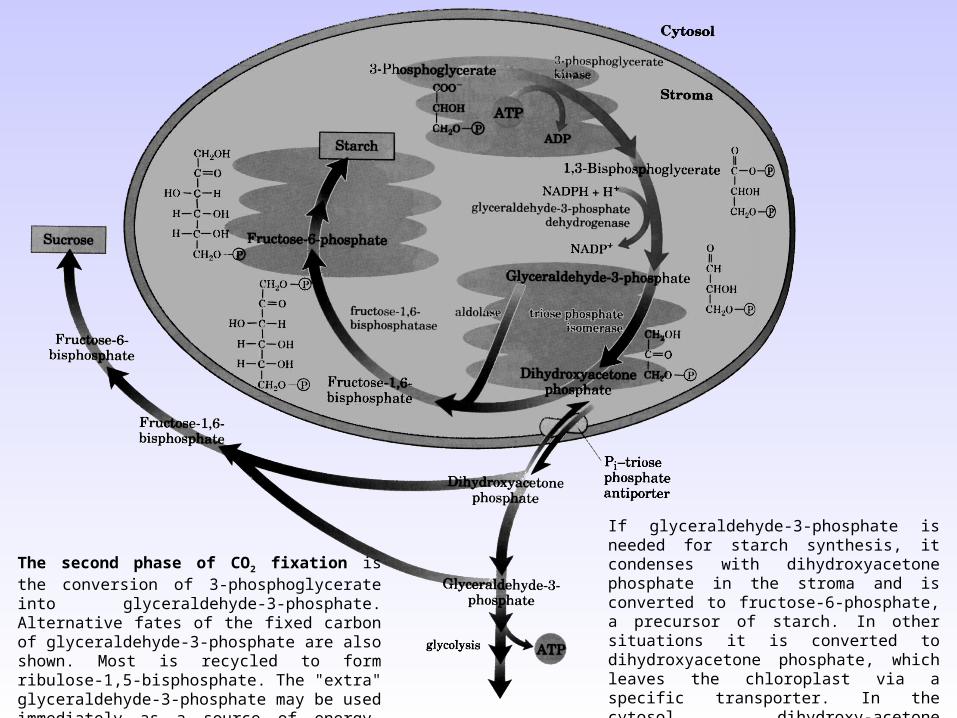
If glyceraldehyde-3-phosphate is needed for starch synthesis, it condenses with dihydroxyacetone phosphate in the stroma and is converted to fructose-6-phosphate, a precursor of starch. In other situations it is converted to dihydroxyacetone phosphate, which leaves the chloroplast via a specific transporter. In the cytosol, dihydroxy-acetone phosphate can be degraded via glycolysis to provide energy, or used to form fructose-6-phosphate and hence sucrose.
The second phase of CO2 fixation is the conversion of 3-phosphoglycerate into glyceraldehyde-3-phosphate. Alternative fates of the fixed carbon of glyceraldehyde-3-phosphate are also shown. Most is recycled to form ribulose-1,5-bisphosphate. The "extra" glyceraldehyde-3-phosphate may be used immediately as a source of energy, converted to sucrose for transport, or stored as starch for future use.

The stoichiometry of CO2 fixation via the Calvin cycle. For every three CO2 molecules fixed, one molecule of triose phosphate (glyceraldehyde-3-phosphate) is produced and nine ATP and six NADPH are consumed.

(a) The third stage of CO2 fixation consists of the remaining set of reactions of the Calvin cycle, in which ribulose-1,5-bisphosphate is regenerated from the triose phosphates. The starting materials are the triose phosphates: glyceral-dehyde-3-phosphate and dihydro-xyacetone phosphate. Reactions catalyzed by aldolase (step 2) and transketolase (steps 1, 4, and 5) produce pentose phosphates, all of which are eventually converted to ribulose-1,5-bisphosphate. The two -carbon group carried by TPP in steps 1 and 4 (TPP-2C) is a ketol group: CH2OH-CO -.
A
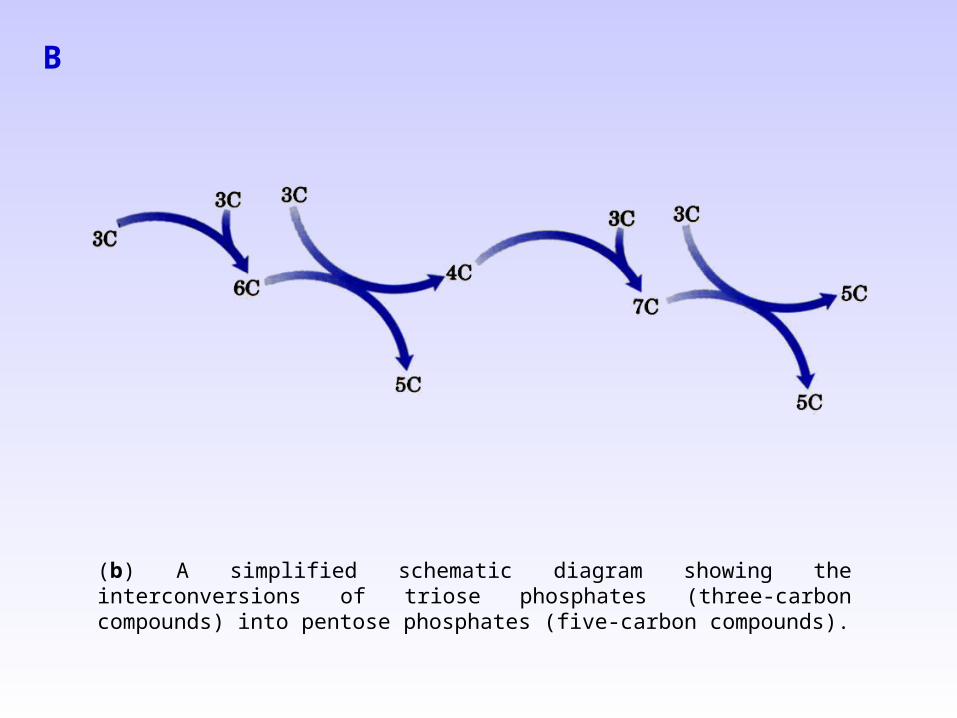
(b) A simplified schematic diagram showing the interconversions of triose phosphates (three-carbon compounds) into pentose phosphates (five-carbon compounds).
B

The pathway by which phosphoglycolate formed during photorespiration is salvaged by conversion into serine and thus 3-phosphoglycerate. This path is long and involves three cellular compartments. Glycolate formed by dephosphorylation of phosphoglycolate in chloroplasts is transaminated to glycine in peroxisomes. In mitochondria, two glycine molecules condense to form serine and the CO2 released during photorespiration. This reaction is catalyzed by glycine decarboxylase, an enzyme present at very high levels in the mitochondria of C3 plants. The serine is converted to glycerate in peroxisomes, then reenters the chloroplasts to be phosphorylated, rejoining the Calvin cycle. Oxygen is consumed during photorespiration, in three steps.

(a) An electron micrograph showing chloro-plasts of connected mesophyll (above) and bundle-sheath (below) cells. The bundle-sheath cell contains starch granu-les. The plasmodesmata linking the two cells are evident.(b) The Hatch-Slack pathway of CO2 fixa-tion, via a four-carbon intermediate. This pathway prevails in plants of tropical origin (C4 plants).

http://www.brookscole.com/chemistry_d/templates/student_resources/shared_resources/animations/oxidative/oxidativephosphorylation.html


Measurement of the standart reduction Measurement of the standart reduction potential (Epotential (E00
´́) of a redox pair. ) of a redox pair. Electrons flow from the test electrode to the reference electrode, or vice versa. The ultimate reference half-cell is the hydrogen electrode. The arbitrary electromotive force (emf) of this electrode is 0,00 V. At pH=7, E0
´ for the hydrogen electrode is -0,414 V. The direction of electron flow depends upon the relative electron "pressure" or potential of the two cells. A salt bridge containing a saturated KCl solution provides a path for counter-ion movement between the test cell and the reference cell. From the observed emf and the known emf of the reference cell, the emf of the test cell containing the redox pair is obtained. The cell that gains electrons has, by convention, the more positive reduction potential.

Data mostly from Loach, P.A. (1976) In Handbook of Biochemistry and Molecular Biology, 3rd edn (Fasman, G.D., ed), Physical and Chemical Data, Vol. I, pp. 122-130, CRC Press, Cleveland, OH.