kathmandu valley intelligent traffic system (kv-its) bikash maharjan (16207) bikram thapa (16208)...
TRANSCRIPT

Kathmandu Valley Intelligent Traffic System
(KV-ITS)
Bikash Maharjan (16207)Bikram Thapa (16208)Roshan Manandhar (16228)Yugesh Shrestha (16246)
SupervisorDr. Arun K. Timalsina
Co-SupervisorMr. Saroj Yadav, EB pearls

Traffic Jam => Problem

System Overview
iPhone Application
Web Interface
Database
Image Processing
Past Data Analysis
Wireless Traffic Data
Generated Traffic Information
System
Display
CCTV Live Video
Input Input

Database
Update Jam
Update Road Condition
Data Visualization
Input
Web Interface
Input
Generated Traffic Data
Web Interface Implementation

Image Processing Overview
Image ProcessingAlgorithms
•Traffic Density •Traffic Flow Rate
CCTV Video Data
Outputs
Extract Frameinput

Traffic Density Traffic Flow Rate
free
Congestion Levels
High
Moderate
slight
DatabaseStore
FuzzyClassifier
inputs
outputs
Image Processing Overview

Traffic Density Estimation
. . .
. .
Consecutive Frame Difference
+ + =
. . . . . . .
Accumulate Differenced Images
Detected Lane Model
D1 D1+D2 Dn-1 + Dn
Lane Detection
Video Frame Sequence

Traffic Density Estimation
(Area=No. of white pixels)lane
vehicle
A
ADensity
Lane Mask Model
. . . .
1.Mask
1.Mask
3. Output after difference at T sec
.
.
Input Video Data
2.Difference
Background Model

Traffic Flow Rate Estimation
N frameN+5 sec frame
Video Sequence
1. Find Feature Points 2. Track Feature PointsMain Processes:

secT
DV
mean
n
dDmean
Traffic Flow Rate Estimation

Results
1 3 5 7 9 11 13 15 17 19 21 23 25 27 29 31 33 35 37 39 41 43 45 47 49 51 53 55 57 59 610
0.2
0.4
0.6
0.8
1
1.2
Optical Flow Rate and Density Vs Time
Optical Flow
Density
Time (5 seconds interval)
1 3 5 7 9 11 13 15 17 19 21 23 25 27 29 31 33 35 37 39 41 43 45 47 49 51 53 55 57 59 610
0.10.20.30.40.50.60.70.80.9
Congestion Level Vs Time
Congestion value
Free
highModerate
At Baneshwore
Time ( 5 sec interval)

Results
1 3 5 7 9 11 13 15 17 19 21 23 25 27 29 31 33 35 37 39 41 43 45 47 49 51 53 55 57 59 610
0.10.20.30.40.50.60.70.80.9
Congestion Level Vs Time At Baneshwore
Congestion value
Free
highModerate
Time ( 5 sec interval)

So Far
Web Interface
Database
Image Processing
Wireless Traffic Data
Generated Traffic Information
System
iPhone Application
Display
CCTV Live Video
Input Input

Information Mapping
Congestion Status
Updated CCTV image
Reason/Details
Live Streaming
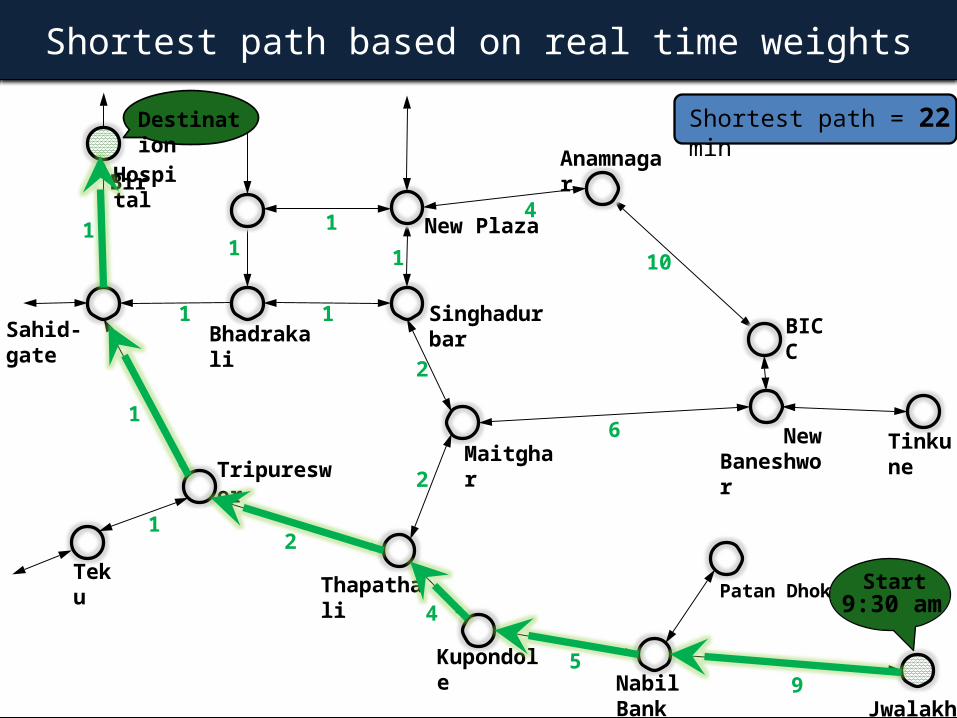
Shortest path based on real time weights
Thapathali
Maitghar
Kupondole
Teku
Tripureswor
Sahid-gate
Patan Dhoka
JwalakhelNabil Bank
BhadrakaliSinghadurbar
New Baneshwor
Tinkune
New Plaza
Anamnagar
BICC
BirHospital
Start
Destination
95
4
2
2
11
2
1
1
1
6
10
411 1
Shortest path = 22 min
9:30 am

Practical scenario
Thapathali
Maitghar
Kupondole
Teku
Tripureswor
Sahid-gate
Patan Dhoka
JwalakhelNabil Bank
BhadrakaliSinghadurbar
New Baneshwor
Tinkune
New Plaza
Anamnagar
BICC
BirHospital
Destination
95
4
2
2
11
2
1
1
1
6
10
411 1
6
5
2
5
6
1 1
3
35
Shortest path = 33 min Next shortest path = 30 min
Start9:30 am
18 mins

Best Path Algorithm
• Successfully designed and developed• It first estimates the time to reach the node
then it uses the predicted weight at that estimated time to update the graph dynamically.
• but it’s level of accuracy completely depends upon the level of prediction analysis.

Best Path AlgorithmDestination
Thapathali
Maitghar
Kupondole
Teku
Tripureswor
Sahid-gate
Patan Dhoka
PulchowkNabil Bank
BhadrakaliSinghadurbar
62
2
1
1 1
1
1
1
5
1
1
9:30 amStart

Best Path Algorithm
Start9:30 am
Destination
9:36
Thapathali
Maitghar
Kupondole
Teku
Tripureswor
Sahid-gate
Patan Dhoka
PulchowkNabil Bank
BhadrakaliSinghadurbar
62
2
1
1 1
1
1
1
5
1
1
3

Best Path Algorithm
Start9:30 am
Destination
9:369:39
Thapathali
Maitghar
Kupondole
Teku
Tripureswor
Sahid-gate
Patan Dhoka
PulchowkNabil Bank
BhadrakaliSinghadurbar
62
2
1
1 1
1
1
1
5
1
1
3
32

Best Path Algorithm
Start9:30 am
Destination
9:369:39
9:41
Thapathali
Maitghar
Kupondole
Teku
Tripureswor
Sahid-gate
Patan Dhoka
PulchowkNabil Bank
BhadrakaliSinghadurbar
62
2
1
1 1
1
1
1
5
1
1
3
2
22
3

Best Path Algorithm
Start9:30 am
9:369:39
9:419:42
Destination
Thapathali
Maitghar
Kupondole
Teku
Tripureswor
Sahid-gate
Patan Dhoka
PulchowkNabil Bank
BhadrakaliSinghadurbar
62
2
1
1 1
1
1
1
5
1
1
3
2
22
3
2

Best Path Algorithm
Start9:30 am
9:369:39
9:419:42
Thapathali
Maitghar
Kupondole
Teku
Tripureswor
Sahid-gate
Patan Dhoka
PulchowkNabil Bank
BhadrakaliSinghadurbar
62
2
1
1 1
1
1
1
5
1
1
3
2
22
3
2
Destination9:44

Best Path Algorithm
Start9:30 am
9:369:39
9:419:42
9:43
9:459:46
Destination9:44
Thapathali
Maitghar
Kupondole
Tripureswor
Sahid-gate
Patan Dhoka
PulchowkNabil Bank
BhadrakaliSinghadurbar
62
2
1
1 1
1
1
1
5
1
1
3
2Teku
22
2
2
11
3

Best Path Algorithm
Teku Start9:30 am
9:369:39
9:419:42
9:43
9:459:46
Thapathali
Maitghar
Kupondole
Tripureswor
Sahid-gate
Patan Dhoka
PulchowkNabil Bank
BhadrakaliSinghadurbar
62
2
1
1 1
1
1
1
5
1
1
Destination9:44
3
2
22
2
2
11
3

Best Path Algorithm
Teku Start9:30 am
9:369:39
9:419:44
9:43
9:459:46Destination
9:47
Thapathali
Maitghar
Kupondole
Tripureswor
Sahid-gate
Patan Dhoka
PulchowkNabil Bank
BhadrakaliSinghadurbar
62
2
1
1 1
1
1
1
5
1
1
3
2
24
6
2
11
5

Kupondole-Thapathali edge
Kupondole
Tripureswor
Maitighar
Thapathali
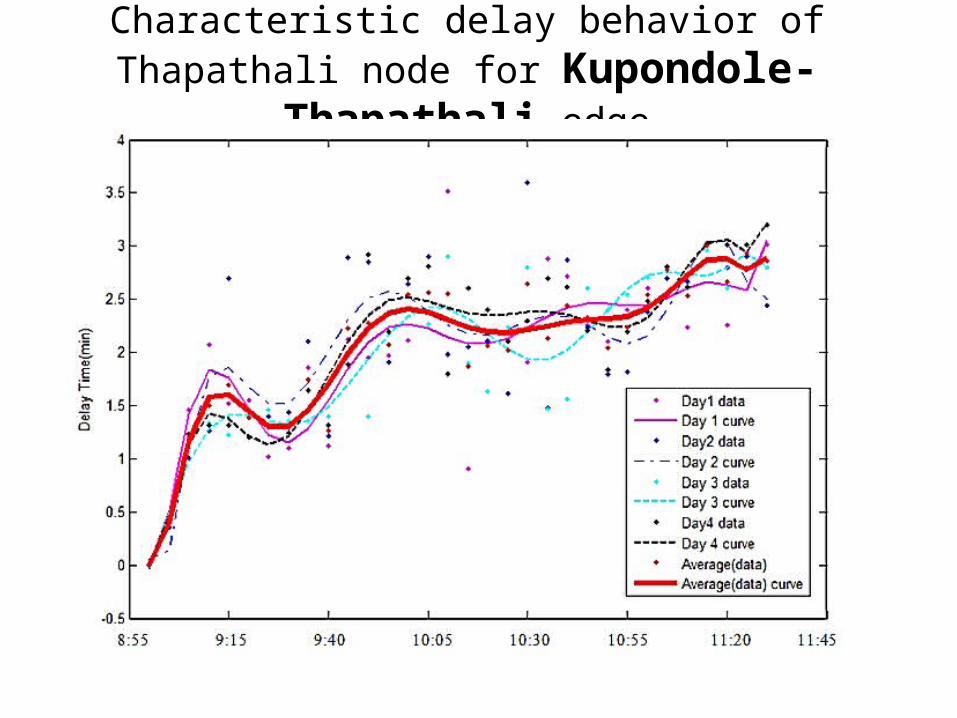
Characteristic delay behavior of Thapathali node for Kupondole-Thapathali edge

Comparison of polynomial equation obtained with the real time test data collected on Bhadra 11
8:55 9:15 9:40 10:05 10:30 10:55 11:20 11:45
Time starting from 8:55 am to 11:45 am
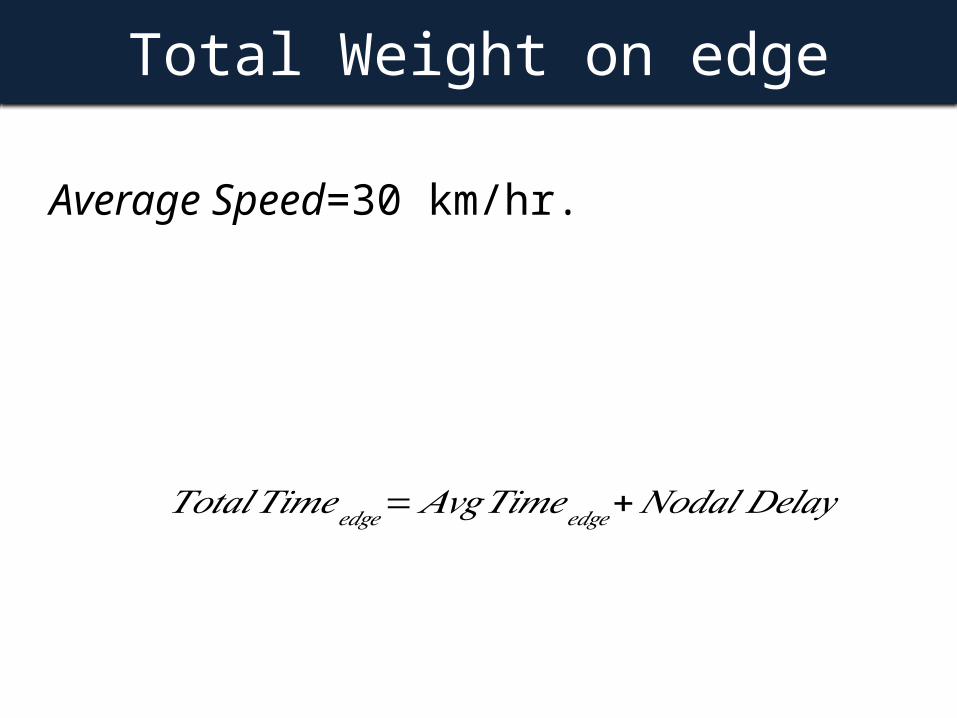
Total Weight on edge
Average Speed=30 km/hr.
𝑇𝑜𝑡𝑎𝑙 𝑇𝑖𝑚𝑒𝑒𝑑𝑔𝑒=𝐴𝑣𝑔𝑇𝑖𝑚𝑒𝑒𝑑𝑔𝑒+𝑁𝑜𝑑𝑎𝑙 𝐷𝑒𝑙𝑎𝑦

Implementation
CCTV Cameras
Web Server
Image Processing
Server
CCTV Video Broadcasting
Server
Web Server

Thank You
