katrijn gielens - unc kenan-flagler business school/media/files/faculty/k-gielens/lidl... ·...
TRANSCRIPT
1
The Competitive Price Effects of Lidl’s Entry in the US Grocery Market
January 10, 2018
Katrijn Gielens1
1 Katrijn Gielens is Associate Professor of Marketing at the University of North Carolina Kenan-Flagler Business
School. This report was commissioned by Lidl. The terms of the agreement granted “full discretion over the content
of the report” to the author.

2
Key Takeaways
Competing retailers set their prices for individual products, including staples,
substantially lower in Lidl markets compared to markets where Lidl is not present.
(See Figure 2 A.) We observed the following price reactions across the product aisles:
o For a half-gallon of milk, retailers in markets where Lidl is present set prices
about 55% lower than in markets where Lidl is not present.
o Price reductions of more than 30% can be found in categories such as avocados
and bread-related products.
o For some frequently purchased goods, such as ice cream, bananas and cheese,
these price reductions amount to more than 15%.
On average, competing retailers near Lidl stores set their prices approximately 9.3%
lower than in markets where Lidl is not present, which is more than three times as much
as was typically reported in other academic work on Walmart’s entry in a new market.
Prices set by retailers in markets where Lidl operates vary considerably among the
different supermarket chains. (See Table 3.)
o Aldi sets their prices up to 19% lower in markets where Lidl operates compared to
where it is not present;
o Food Lion and Kroger set their prices up to 15% and up to 13% lower,
respectively, compared to where it is not present.
This price reaction results, on average, in substantial dollar savings for customers.
(See Figure 2B.) For a broad grocery basket of 48 products, including dairy products,
meats, produce, canned and frozen goods, $17 and $22 can be saved at Food Lion and
Kroger, respectively, and $14 can be saved at Aldi.
Overall, significant cost savings can be obtained for consumers in markets where
Lidl operates, especially when taking into account that prices at Lidl stores are even
lower.

3
INTRODUCTION
On June 15th, Lidl opened ten stores in Virginia, North Carolina, and South Carolina, with
further plans of opening of up to 90 more stores across the US within a year, thereby putting big-
name companies like Walmart, Kroger, and others on high alert.
Unlike conventional supermarkets, which usually carry up to 40,000 mostly branded
products, a typical Lidl store offers a carefully managed assortment of mainly private label
products, perhaps representing a tenth as many items but providing a quick and easy shopping
opportunity (Paglia 2017). Lidl’s US stores are positioned as “low-priced grocery” pledging to
‘rethink grocery’ through a combination of quality, convenience, and value. Or, as Lidl US CEO
Brendan Proctor states it, Lidl offers a model for consumers wanting a good quality product, at a
good price who do not want to spend all day in a store and essentially “want to get back to
living” (Planet Retail 2017).
In an industry marked by cut-throat competition and mounting markdowns, Lidl promises
that prices at its new US stores will be up to 50% lower than those of comparable products at
other grocers (Bhattarai 2017). So far, Lidl has made good on its pricing strategy. According to
the food research firm Hartman Group, prices in a basket of selected goods at new Lidl stores
were as much as 39% lower than at stores of competitors, such as North Carolina-based Food
Lion, as well as Walmarts in Virginia and North Carolina. In addition, Kantar Retail reports that,
on a basket of 15 private-label goods, Lidl is priced up to 23% below Walmart (Paglia 2017).
In addition to this direct price difference between Lidl and its competitors, there has also
been much speculation about the indirect competitive price effects of Lidl’s entry in the US; that
is, will retailers change their prices if they have to compete head-on with Lidl? Anecdotal
evidence gathered in the first few months after Lidl’s entry suggests that a period of fierce price
4
competition followed Lidl’s entry in the market. Scott Mushkin, analyst at Wolfe Research,
reported that Walmart cut its prices by more than 20% in areas where Lidl recently opened
stores, such as Virginia Beach and North Carolina. In other regions where Lidl has not yet
entered the market, he had not seen price-cutting from Walmart. However, Mushkin expects it to
be likely as Lidl continues to expand, forcing Kroger, Target, and others to also cut prices
(Watkins 2017).
The result is significant price pressure on store brands and private labels. According to
Mushkin, “Our store visits and analysis highlighted significant price compression in private-label
pricing, aggressive prices in the all-important customer traffic-driving fresh food areas and even
lower branded prices, too.” In a similar vein, Business Insider reported that grocers near the new
Lidl stores dropped prices to better compete. For example, the Dollar General store in Roebuck,
South Carolina dropped prices by 10% to 30% in response to Lidl entering the market, and Food
Lion also cut prices in markets where it competes directly with Lidl (Peterson 2017).
Price competition is widely believed to further intensify in the coming years as Lidl
expands. Retailers do indeed compete with each other on price. That is, they carefully monitor
prices charged by competitors and will make changes accordingly. However, it is not yet clear
who the retail winners will be as the grocery price wars evolve, but there is little doubt that
consumers will benefit as retailers are forced to continue dropping prices and offer more
convenient shopping services in order to stay competitive.
Less consensus, however, can be found as to the extent of these price cuts. In studies
looking into the effect of Walmart Super Center entries, competitive price reductions in the range
of 1% (Basker and Noel 2009) and 2.5% (Hausman and Leibtag 2007), and 5% at most
(Ailawadi et al. 2010) are typically reported. These estimates mainly cover Walmart’s ongoing

5
expansion across the US market. Lidl’s store openings, however, are part of an entire new launch
into the US market, thereby adding a new powerful and global player to a retail industry already
in turmoil. Stronger competitive price reactions may therefore have materialized in Lidl’s case.
So far, no research has studied the impact of such international entries on retail prices
and, therefore, few benchmarks exist. Whereas some press reports covering Lidl’s entry hinted at
reductions in the 10 to 20% ballpark, these types of anecdotal reports do not really manage to
carefully tweak out the price effect that can be uniquely attributed to the actual entry and many
confounding events and situations are not adequately filtered out.
In this paper, I will present empirical evidence that retailers do indeed systematically
compete with each other on price, and that they drop their prices if necessary to remain price
competitive following Lidl’s entry. Moreover, this paper attempts to demonstrate the causal role
that Lidl plays in regard to its competitors’ prices. To do this, we combine a unique store-
category level panel data set, detailing competitors’ prices in both markets in which Lidl operates
and markets where Lidl is not present. The price data pertain to rival retailers’ private label
products. All selected products are part of a typical household’s grocery basket and cover 48
specific grocery products from several categories, including dairy products, meats, produce,
canned and frozen goods, and miscellaneous items.
We find that the competitive price effect due to Lidl’s entry amounts to approximately
9.3%, meaning that competing supermarkets in vicinity of a Lidl store set their prices lower by
9.3% compared to markets where Lidl is not active. This competitive price effect is substantively
stronger than what is reported in academic studies following Walmart entries.
The strength of the competitive price reaction varies considerably by retailer. Close
competitor Aldi sets prices up to 19% lower in markets where Lidl is present compared to

6
markets where Lidl is not present. Food Lion and Kroger, the national supermarket leader, set
prices up to 15% and up to 13% lower, respectively, in Lidl markets compared to markets where
Lidl is absent. These price reactions imply substantial dollar savings for consumers on a wide
basket of 48 typical grocery products of $17 and $22 in the case of Food Lion and Kroger,
respectively, and $14 for Aldi.
Also, substantial differences in price reactions can be observed across the product aisles.
For staples such as a half-gallon of milk, retailers close to Lidl set prices lower by about 55%
compared to markets where Lidl is not present. For some frequently purchased goods, such as ice
cream, these price differences amount to more than 15%, and for avocados and bread products
prices differences of over 30% can be found. Overall, significant cost savings can be obtained for
consumers in markets where Lidl is present.
BACKGROUND2
Before elaborating on its price effects on competing retailers, it may be worthwhile to reflect on
the nature of Lidl’s business model and why this can alter price competition (see Steenkamp
2017 for a more substantive discussion).
The model, which is also embraced by other retailers such as Aldi, Trader Joe’s, and even
wholesale clubs like Costco, in many ways is aimed at offering basic goods of daily need at the
lowest possible prices – up to 30 to 50% below traditional retailers’ prices – while maintaining
high-quality standards. The concept is not to be confused with discounters like Walmart. Lidl
stores in the US are about 20,000 square feet, about the size of many Trader Joe’s. The stores
2 This discussion is mainly taken from Steenkamp (2017) and Steenkamp and Kumar (2009).

7
offer a limited assortment of consumer packaged goods and perishables – typically less than
2,000 SKUs. In contrast, a typical U.S. supermarket sells 40,000 items, on average, and a
WalMart supercenter sells 100,000.
Lidl stores consist of six aisles, with general merchandise likely featured through the
center of the store. The entire layout is designed to streamline the shopping experience and
reduce search time (Bhattarai 2017). Offering a limited assortment of products enables hard
discounters to provide a high volume of basic goods and helps to streamline efficient operations.
To further reduce costs, hard discounters often display produce in the shelf-ready packaging they
were shipped in rather than stacking them in some intricate formation. This allows staff to easily
and efficiently rearrange boxes as soon as the product sells out while keeping the freshest
produce on top.
As such, costs typically add 13% or 14% to the procurement price – 2% each for
logistics, rental, over-head, and marketing, plus about 5% for staff. In contrast, traditional
supermarkets are twice as costly on each of the cost components, and, therefore, need to add
double that amount (28-30%) to their procurement prices.
Private labels feature prominently in the assortment. Around 90% of Lidl’s SKUs are
private label. The relative emphasis of private labels is the key differentiator between the Lidl-
like discounters and dollar stores, such as Dollar General and Dollar Tree. The former have deep
expertise on how their products are produced, who can produce them, and what trade-offs they
need to make. The large revenues combined with their small number of SKUs mean that the
volume per SKU is very large. Aldi and Lidl, for example, are the biggest sellers of private-label
grocery products worldwide. As a result, they are able to drive out every fractional cent of cost
without compromising on quality and can outcompete other retailers on price. Indeed, most

8
international comparisons of prices across retail stores have designated retailers adhering to this
concept the price winner.
STUDY DESIGN
To attribute any competitive price effects to Lidl and not to other confounding events, we
compare prices at competing retail stores in markets where Lidl operates, i.e. treatment stores,
with prices set by the same retailers in markets in which Lidl is not present, i.e. control stores. By
matching markets and stores and comparing the price levels (while accounting for other
confounding effects), inference can be drawn about Lidl’s causal impact on rival supermarkets’
price levels. Using a control-group study design enables us to rigorously quantify reactions,
separating them from other chain-specific regional factors, as well as alleviating potential bias
due to the endogeneity of Lidl’s entry.
Selection markets and stores. So far, Lidl is present in 23 markets along the US East
Coast. From those 23 markets, we selected markets (1) where both Walmart and Aldi were
already present in close vicinity and (2) for which a matching market could be found that
resembles the focal market in all but the actual presence of Lidl.
By considering markets in which Aldi and Walmart are present, we can establish that any
price effect can be attributed to Lidl, per se, and not to the more generic entry of a hard
discounter or power player. Moreover, we have to make sure that we compare markets in which,
without the presence of Lidl, similar prices would have been set. To do so, the experimental
market, i.e. the market in which Lidl entered, and the control market, i.e. the market in which
Lidl is not yet present, should resemble each other closely with respect to the socio-economic

9
profile and the presence of competing chains. In addition, stores in the control market could not
have a Lidl within a 15-miles radius.
Using Census data on 22 socio-economic characteristics at the ZIP-code level, including
population, income, and household size as well as data on the competitive structure in the
different markets, we could identify six Lidl markets that lived up to these criteria. We
subsequently identified all incumbent stores in the vicinity of the entries. This resulted in 20
"experimental" stores from five chains: Aldi, Food Lion, Kroger, Publix, and Walmart. All
treatment stores are, on average, within a 1.7 miles radius or 4.5 minutes driving time of the
focal Lidl.
We also identified 20 stores belonging to the same retail chains and market areas that are
not exposed to the entry. These control stores were, on average, 41.2 miles or 49.7 minutes
driving distance away from the nearest Lidl store. This data set represents a natural experiment
and enables us to perform treatment-versus-control-group analyses. Table 1 summarizes the key
characteristics of the markets.
The direct price differences between Lidl and its competitors differ notably across the
different markets. Whereas in Henrico, where premium retailers such as Publix are present,
prices at competitors were on average 32% higher than Lidl prices; price differences in
Orangeburg and Shelby, where mostly price fighters are present, were less pronounced.
---Please see TABLE 1 on pages 22 and 23---
The five retailers covered in the analysis differ widely in market positioning. Walmart is
by far the largest national retailer and can be described as a general merchandiser carrying a wide

10
assortment at low prices following a strict Every Day Low Pricing (EDLP) strategy. Kroger and
Publix are full range supermarkets offering full service using a HiLo strategy, meaning that they
resort to more extensive price promotion tactics to attract consumers to the store. Whereas
Kroger is the largest national supermarket player in the US, Publix is an upcoming player in the
Southeast. Food Lion is also a supermarket owned by Ahold-Delhaize but with a narrower
assortment and a more pronounced EDLP price image than Kroger and Publix. Like Lidl and
Trader Joe’s, Aldi could also be considered a hard discounter, with a narrow assortment mainly
concentrating on private-label products.
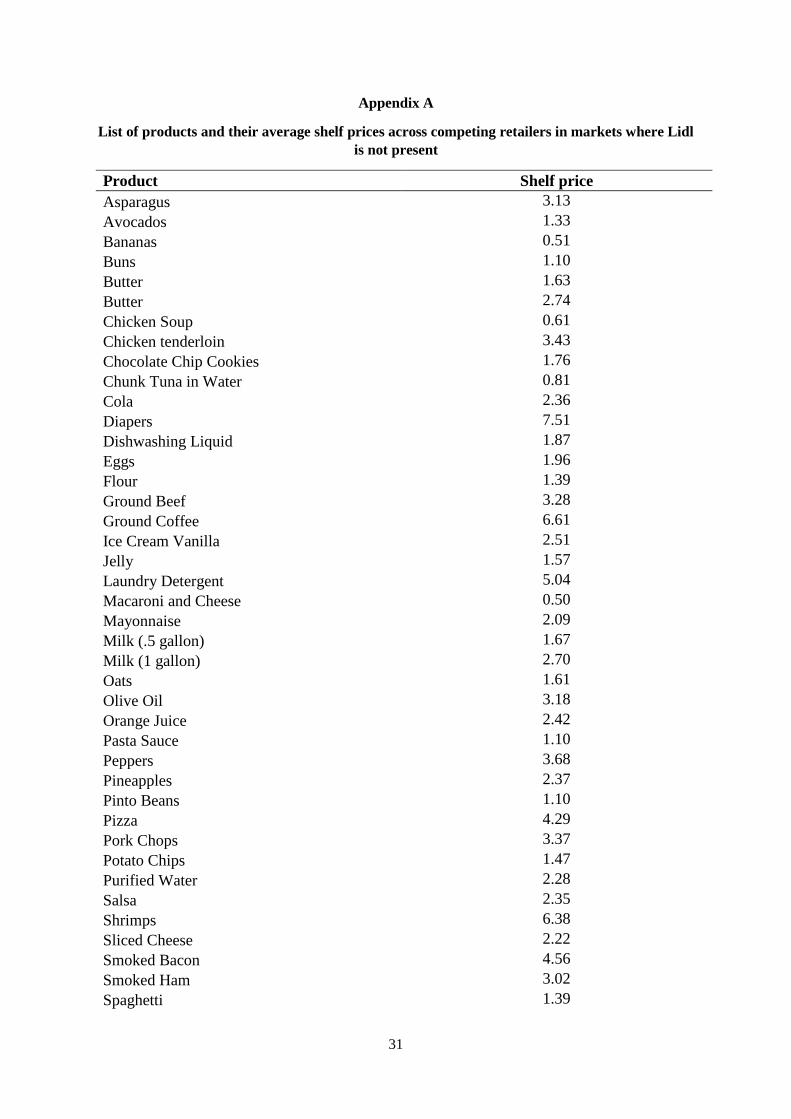
Products. When retailers compete with prices, they typically do so to safeguard their
overall price image. As consumers’ overall price image typically reflects their assessment of the
overall level of prices throughout a store, we select a broad basket of 48 grocery products that
cover all different aisles and offer a fair representation of the store. In Appendices A and B, the
products are listed alongside their average shelf prices and the observed direct price differences
between Lidl and its competitors.
They include dairy products (milk, eggs), meats (beef, pork), produce (bananas, peppers),
canned and frozen goods (canned vegetables, frozen pizza), and miscellaneous items (sugar,
dishwashing detergents). The products differ widely in both price levels and price differences
between Lidl and its competitors. For example, products like white bread, potato chips, and
macaroni and cheese are priced significantly higher at competitor stores than at Lidl, whereas
prices for orange juice and smoked ham are more or less on par. In contrast, for some (six out of
48) products such as salsa and avocados, higher prices can be observed at Lidl.
Products were selected that are part of the Lidl assortment. As the Lidl products are
mostly private-label products, only private labels at the rival stores were included in this study.

11
For each Lidl item, the closest resembling private-label item was identified at the five
competitors. The retailers covered in our dataset differed substantially with respect to the total
price paid for the recorded items in the basket.
Across all markets surveyed, the cheapest overall baskets were found consistently at Lidl.
Next were Aldi and Walmart, followed by Food Lion. Markedly more had to be paid at Kroger
and Publix. On average, in markets surveyed where Lidl is present, retailers set prices 25%
above Lidl prices. More specifically, prices are about 100% higher at Publix, 50% higher at
Kroger, 36% higher at Food Lion, 9% higher at Walmart, and 5% higher at Aldi.
Prices. Data collectors were dispatched to the 12 markets covered in the study. For all
products, prices were collected through store visits on October 30, 2017. In each store, the price
recorded is the lowest price available to all shoppers arriving at the store. So, for example,
discounts that require obtaining coupons in advance are never factored in to prices. Promotions
that do not require coupons or for which coupons are available in the store, and are redeemable
on the spot, are factored in. All prices of products in the same product category were expressed
in the same volume price to allow direct comparison. For example, all ice cream prices refer to
48 fl. ounces.
Using the data we thus collected, we estimate the following model
(1) mr,p,m
M
m
mp
P
p
p
R
r
rmmr,p, MarketProductRetailerLIDL)ln(PRICE r
Whereby PRICE captures the price of product p set by retailer r in market m. LIDL is a dummy
variable that equals one in markets in which Lidl is present and zero otherwise. The parameter
expresses the average percentage difference between prices in markets in which Lidl is present
versus where it is not present. This parameter thus allows us to single out the effect of Lidl’s
12
presence on competing retailers. To control for potential sources of unobserved heterogeneity we
further include product, retailer, and market-pair fixed effects. To account for correlations in the
error term across products within cities, standard errors are clustered by city.
RESULTS
Table 2 summarizes the estimation results.
---Please see TABLE 2 on page 24--
The focal parameter is -0.093 and is significantly different from zero at the 1% level. This
means that, on average, prices set by rival retailers in markets where Lidl operates are
approximately 9.3% below prices encountered at similar stores in markets where Lidl is not
present. To translate this effect to a monetary value, we apply the 9.3% price difference on the
prices for the total basket of goods in markets in which Lidl is not present. As such, we find that
consumers save an average of $13 per basket because they are shopping in a market in which
Lidl is present.
Compared to the estimates found in relation to entries in a new local market by
established US retailers, which typically range between 1% and 2.5% in case of a Walmart
Supercenter (see, e.g., Hausman and Leibtag 2007, Basker and Noel 2009, and Ailawadi et al.
2010), the competitive effect of Lidl’s entry in the US market is thus vastly more substantial,
leading to more substantive consumer savings.
While the average price reduction in response to Lidl’s entry is 9.3%, the impact is likely
to be heterogeneous across (1) competitors of different sizes and types, (2) cities, and (3)
products.
13
In general, we expect supermarkets whose consumers are most similar to Lidl’s to make
the largest price reductions; competitors that are differentiated in selection and other amenities
(service, location, etc.) should react the least (Basker and Noel 2009). Relatedly, we expect the
overall competitive environment in each market to affect the price response: markets in which
prices are already highly competitive should see the smallest additional price reductions in
response to Lidl.
Differences across retailers
Not all retailers necessarily react by changing their prices when faced with a new entry, and
marked differences can be found for different types of retailers. In general, a retailer that is
affected more by the entry should be more motivated to retaliate (Leeflang and Wittink 1996).
Retailers resembling Lidl, in terms of format, assortment, and positioning overlap, should be
more affected (Cleeren et al. 2010; Gielens et al. 2008). In general, a retailer can follow two
possible approaches. It may attempt to reduce prices, either by lowering costs (for example by
increasing efficiency, cutting back on service levels, or reducing the quality of the groceries sold)
or by lowering profit margins, to compete on prices head-on. This may be the only option for a
chain that has firmly positioned itself in the marketplace as a low-end low-price chain targeting
price-sensitive consumers. The other option available to a full-service supermarket is to shift its
focus, at least in part, away from the most price-sensitive consumers (whose “defection” to Lidl
can be assumed to be a lost cause) and position itself more firmly in the higher-end market that
caters to less price-elastic consumers (Ailawadi et al. 2010).
To capture differences in retailers’ responses we alter Eq. (1) as follows:

14
(2)
mr,p,m
M
m
m
p
P
p
p
R
r
rmmr,p,
Market
ProductRetailerRetailer*LIDL)ln(PRICE
rr
R
r
r
Whereby r represents the price difference set by a specific retailer r between markets where
Lidl is present compared to where Lidl is not present.
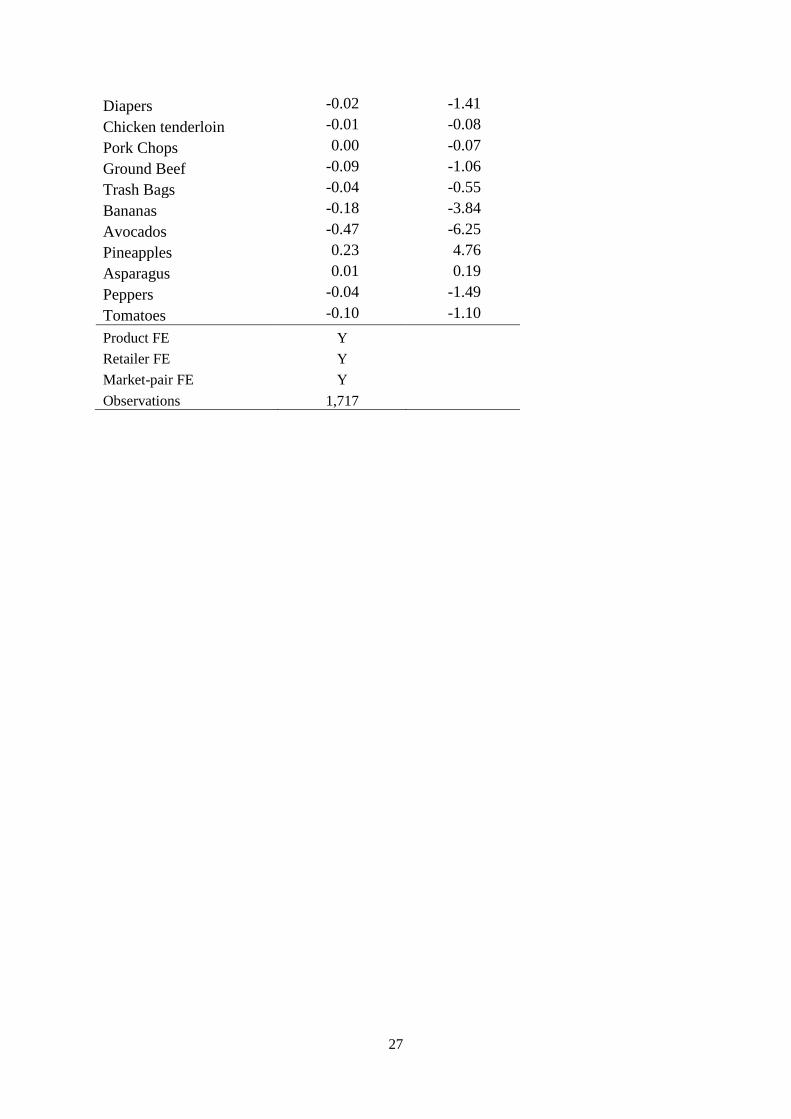
As can be seen in Table 2, and as graphically depicted in Figure 1, the competitive
reactions vary significantly by retailer. For example, whereas the r parameter for Aldi amounts
to -0.14 (p < 0.01), the parameter for Walmart only amounts to -0.03 (p < 0.05).
---Please see FIGURE 1 on page 28---
Translating these parameters to percentage price differences between markets where Lidl is
present and where Lidl is not active, we find the following. When Lidl is present in their
markets, three retailers set their prices at even lower levels than is observed on average. More
specifically, compared to markets where Lidl is not active, Food Lion and Aldi set their prices on
average 13.6% and 13.9%, respectively, lower in Lidl markets. Kroger sets its prices, on average,
10.1% lower. On the other hand, Publix (4%), and Walmart (3%), have markedly smaller price
differences between Lidl and non-Lidl markets. Taking into account the prices paid for a total
basket at the six retailers, these differences would imply $22, $17, and $14 savings at Kroger,
Food Lion, and Aldi in markets where Lidl is present.
Interestingly, the most substantial price reactions do not necessarily follow the dividing
lines of similarity in market positioning and overlap. As expected from a close competitor, Aldi
reacts substantially. Comparing the two HiLo supermarkets we find a stark contrast between
Kroger and Publix. Whereas Kroger has been drifting more to a mixed-EDLP strategy, thereby

15
emphasizing prices more, it may have no other option but to set lower prices. Publix, in contrast,
by explicitly emphasizing its service and assortment strengths, may be less susceptible to losing
its core customers to Lidl and may not have a vast interest in competing up front with the price
fighter. Comparing the two EDLP players, we see that Food Lion’s reaction is markedly more
pronounced than Walmart’s. Food Lion, being a smaller player, may have no other choice than to
follow the new entrants’ price pressure whereas the large scale player may have more power to
withstand price pressure.
Differences across markets
Incumbents are more motivated to protect their position in markets that are attractive and of
strategic importance to them (Shankar 1999). Differences in competitive price reactions may
therefore be expected to vary across different markets. Also, because different markets may be of
different strategic importance to different retailers, the effects may differ along two dimensions:
retailers and markets. To test for these differences, we adapt Eq. (1) as follows:
(3a)
mr,p,m
M
m
m
p
P
p
p
R
r
rmmr,p,
Market
ProductileretaRMarket*LIDL)ln(PRICE
rm
M
m
r
and
(3b)
mr,p,m
M
m
m
p
P
p
p
R
r
rmm,mr,p,
Market
ProductRetailerRetailer*Market*LIDL)ln(PRICE
r
M
m
r
R
r
rm
m
In Eq. (3a) we only allow for differences in reactions across markets, whereas Eq. (3b) allows for
heterogeneity across both markets and retailers.
16
At first glance we do not find statistical differences across markets, despite the fact that
price differences between competitors and Lidl varied significantly between markets. This means
that the market specific price differences between Lidl and non-Lidl stores are all on average
close to 9 to 10%. However, when we allow for retailer-market specific effects, some interesting
insights can be gained (see last columns of Table 2). More specifically, for both Aldi and Kroger
the rm, parameters differ significantly. In Table 3, we use the estimates obtained with Eq. (3b)
and translate them to percentage price differences between Lidl and non-Lidl markets, and dollar
savings in Lidl markets.
---Please see Table 3 on page 25---
For two retailers we find significant differences across markets, i.e. Aldi and Kroger,
although they tend to react quite differently. In Henrico and Shelby, Aldi reacts significantly less
strong (9% and 10% price difference between Lidl and non-Lidl markets versus 14% on
average), whereas in Orangeburg, the market where the lowest price difference between
competitor and Lidl prices were recorded, Aldi sets its prices up to 19% lower when Lidl is
present compared to when Lidl is not present. Interestingly, the markets in which Aldi reacts
stronger seem to have a less affluent consumer profile and thus may represent more of Aldi’s
core markets. Kroger, on the other hand, reacts far stronger in Henrico, the more affluent market
with the highest average price difference relative to Lidl. Once again, this type of market may
represent the more strategically important markets to Kroger, which are deemed more important
to defend through price reactions.
Differences across products

17
Finally, retailers will most likely not react equally strong in all product categories they carry in
their assortment. Most grocery retailers carry a large number of product categories with varying
degrees of vulnerability to Lidl, but little is known about how reactions might vary across these
products. Overall, large, high-growth, and profitable product categories may be more important
to retailers (Ailawadi et al. 2010). It is also likely that incumbents will view staple and traffic-
building categories as more important to defend (Dhar, Hoch, and Kumar 2001). Staple and/or
traffic-building categories are more likely to be emphasized because these categories can drive
where the consumer chooses to purchase his or her entire shopping basket, making incumbents
more vulnerable in these categories. Moreover, because Lidl's value proposition is EDLP, price-
sensitive categories are more likely to be affected. In addition, incumbents may have more
cushioning in large, growing, and profitable categories, so it is not clear if they are more or less
vulnerable. To test for these differences we adapt Eq. (1) as follows.
mr,p,m
M
m
m
p
P
p
p
R
r
rmmr,p,
Market
ProductRetailerProduct*LIDL)ln(PRICE
rp
P
p
p
Whereby p represents the price difference for product p between markets where Lidl is present
or not.
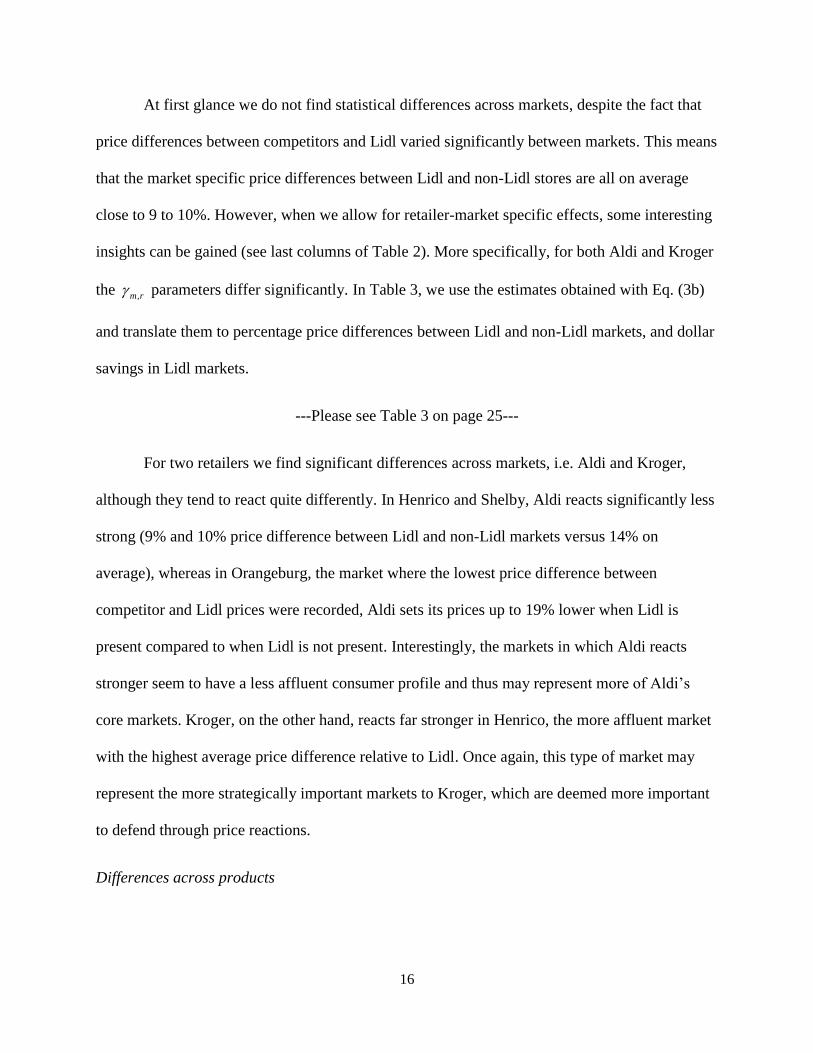
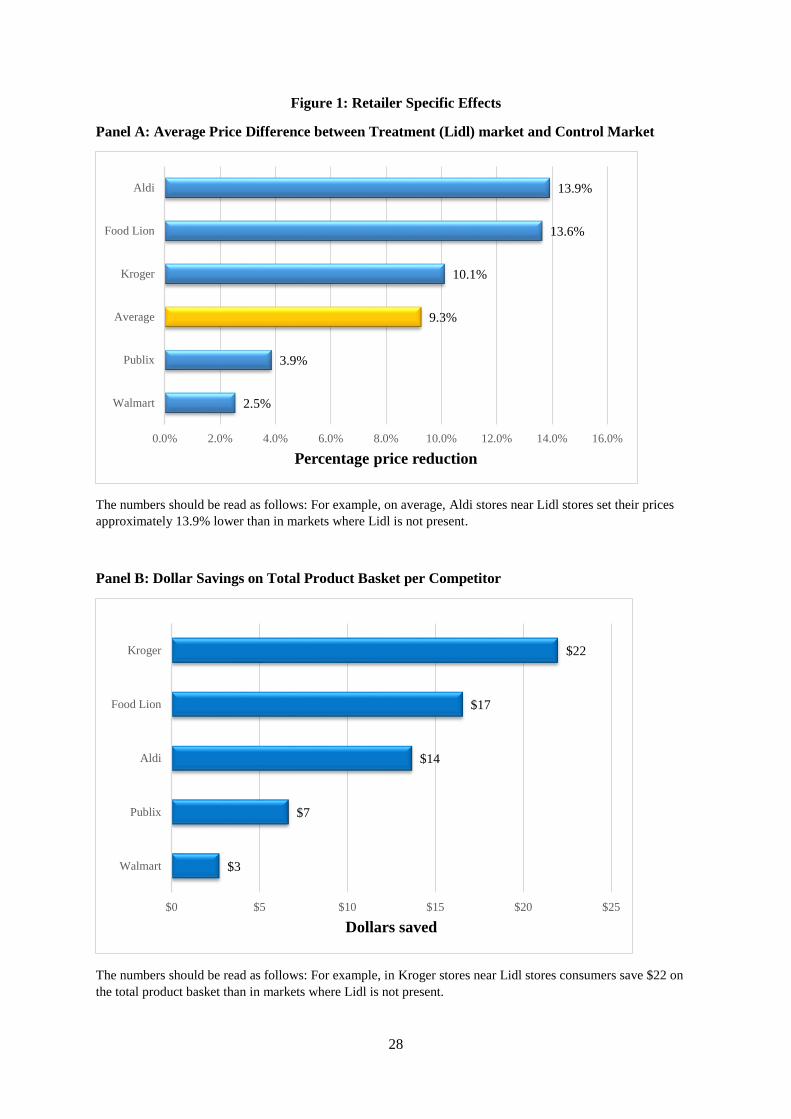
Table 4 summarizes the estimation results, and in Figure 2 we graphically illustrate the
effect sizes for those products for which we find a statistically significant effect. Overall we find
significant effects for 21 out of 48 products.
---Please see TABLE 4 on pages 26 and 27; FIGURE 2 on pages 29-30---
Using the parameter estimates reported in Table 4, we find that price differences between Lidl
and non-Lidl markets of over 50% can be found for an important staple such as milk, which

18
vastly exceeds the average difference of 9.3%. Likewise, for items bought on almost all trips,
such as ice cream and cheese, price differences between Lidl and non-Lidl markets of more than
15 and 20% can be observed. For avocados and bread-related products, price differences even
amount to more than 30%. Substantial savings can thus be realized for consumers. More
specifically, assuming that a household buys half a gallon of milk every two weeks, these
numbers imply an annual saving of $24 on the household’s milk expenditures.
CONCLUSIONS
Over the last couple of months, the business press has reported at great length about Lidl’s entry
in the US market. Various illustrations are given about the substantial price gaps observed
between Lidl’s products and its competitors’. Also, the potential for further price reductions by
these rivals is pointed out, leading to substantial cost savings for consumers, even outside Lidl
stores. Still, very little evidence is around to support such sustained rival price reactions, and
even less is known about whether the observed price effects can truly be attributed to Lidl.
In this study, I aim at identifying the competitive price effect caused by Lidl. To that extent a
quasi-natural experiment was used whereby data for markets in which Lidl is present were
compared with prices observed in similar markets were Lidl is not yet present.
Filtering out all potentially confounding effects, we find that, on average, competitor
retailers set their prices approximately 9.3% lower in markets where Lidl is present compared to
where Lidl is not present. To benchmark the magnitude of this effect, we compare it with similar
competitive price effects following a Walmart entry and find that the competitive price effect due
to Lidl is substantively higher.

19
The magnitude of the competitive price effect varies considerably by retailer: both close
competitor Aldi and Food Lion set prices up to 19 to 15% lower, respectively, in markets where
Lidl is present compared to where Lidl is not present; national supermarket leader Kroger sets its
prices up to 13% lower. In Lidl markets, this price reaction results in substantial dollar savings
on a basket of about 50 products of up to $17 and $22 in the case of Food Lion and Kroger,
respectively, and $14 for Aldi.
Also, substantial differences in competitive reactions can be observed across product
aisles. For a half-gallon of milk, differences between Lidl and non-Lidl markets of about 55%
are found. Price reductions of more than 30% can be found in categories such as avocados and
bread related products. For some frequently purchased goods, such as cheese and ice cream,
these price reductions amount to more than 15%. Overall, combined with the overall lower
basket prices at Lidl, significant cost savings can be obtained for consumers following Lidl’s
entry in their local markets.

20
References
Ailawadi, Kusum L., Jie Zhang, Aradhna Krishna, and Michael W. Kruger (2010), ‘When
Walmart Enters: How Incumbent Retailers React and How This Affects Their Sales
Outcomes’, Journal of Marketing Research, 47 (4), 577-93.
Basker, Emek and Michael Noel (2009), ‘The Evolving Food Chain: Competitive Effects of
Walmart's Entry into the Supermarket Industry’, Journal of Economics & Management
Strategy, 18 (4), 977-1009.
Bhattarai, Abha (2017), “What is Lidl? % Things the German Grocer is Bringing to America,”
The Washington Post, June 15.
Cleeren, Kathleen, Frank Verboven, Marnik Dekimpe, and Katrijn Gielens (2010), “Intra- and
Interformat Competition among Discounters and Supermarkets,” Marketing Science, 29 (3),
456-473.
Dhar, Sanjay, Stephen Hoch, and Nanda Kumar (2001), "Effective Category Management
Depends on the Role of the Category,” Journal of Retailing, 7 (2), 165-184.
Gielens, Katrijn, Linda M. Van de Gucht, Jan-Benedict E.M. Steenkamp, and Marnik G.
Dekimpe (2008), "Dancing with a Giant: The Effect of Wal-Mart's Entry into the United
Kingdom on the Performance of European Retailers,” Journal of Marketing Research, 45
(October), 519-34.
Hausman, J. and E. Leibtag (2007), "Consumer Benefits from Increased Competition in
Shopping Outlets: Measuring the Effect of Wal-Mart," Journal of Applied Econometrics, 22
(7), 1157-77.
Leeflang, Peter S.H. and Dick R. Wittink (1996), "Competitive Reaction Versus Consumer
Response: Do Managers Over React?" International Journal of Research in Marketing, 13
(2), 103-119.
Paglia, Mike (2017), “The Twin Disruptors: How Aldi and Lidl are Poised to Shake Up the US
Retail Landscape,” PLMA 2017 Private Label Trade Show Presentation, November.
Peterson, Hayley (2017), “The Retail Apocalypse is Heading Straight for Kroger, Whole Foods
and Aldi,” Business Insider, August 5. [accessed on October 13 at
http://www.businessinsider.com/retail-apocalypse-coming-for-grocery-stores-2017-8].
Planet Retail (2017), “Previewing Lidl’s US Debut,’ Planetretailgroup.com report, June.
Shankar, Venkatesh (1999), "New Product Introduction and Incumbent Response Strategies:
Their Interrelationship and the Role of Multimarket Contact," Journal of Marketing
Research, 36 (August), 327-44.

21
Steenkamp, Jan-Benedict E.M (2017), “Brand and Retailers under Attack from Hard
Discounters,” in Handbook of Research on Retailing. Katrijn Gielens and Els Gijsbrechts,
eds. Edward-Elgar Publishing, in press.
Steenkamp, Jan-Benedict E. M. and Nirmalya Kumar (2009), “Don’t be Undersold!” Harvard
Business Review. 87 (12), 90-95.
Watkins, Steve (2017), “Lidl, Aldi Could Hurt Walmart more than Kroger,” Bizjournals.com.
July 14. [accessed October 13 at
https://www.bizjournals.com/twincities/bizwomen/news/latest-news/2017/07/lidl-aldi-could-
hurt-walmart-more-than-kroger.html?page=all].

22
Table 1 A
Socio-economic characteristics of treatment and control markets
Market Pair 1 2 3 4 5 6
Treatment Control Treatment Control Treatment Control Treatment Control Treatment Control Treatment Control
Zip Code 23233 27513 27804 28303 29118 29061 29615 29063 28152 27203 28083 28504
State VA NC NC NC SC SC SC SC NC NC NC NC
City Henrico Cary Rocky Mount
Fayettevill
e Orangeburg Hopkins Greenville Irmo Shelby Asheboro Kinston Kannapolis
Population 30131 42637 29381 29197 16027 14802 35642 36266 24361 21602 21538 24270
Median age 38.7 38.2 39.9 36.8 42.2 38.8 40.9 35.5 38.4 35.9 43.8 37.3
% Bachelor's degree 40% 38% 18% 17% 19% 16% 32% 28% 13% 9% 11% 10%
% White 77% 72% 48% 51% 33% 25% 80% 69% 75% 74% 68% 72%
% African American 7% 9% 44% 39% 60% 69% 12% 24% 22% 17% 27% 21%
% Asian 13% 13% 2% 4% 2% 0% 5% 3% 1% 0% 1% 1%
% Non U.S. citizen 9% 9% 3% 2% 2% 3% 7% 2% 2% 10% 4% 6%
% Married 57.5 59.1 41.3 44.9 44.9 45.3 49.8 56.6 49.2 43.5 49.1 47.2
% Unemployed 3.3 4.6 11.5 9.3 10.8 8.6 6.1 5.2 13.9 12.1 9.1 12.1
% Senior Citizen 11% 8% 16% 16% 15% 13% 20% 10% 16% 14% 18% 16%
Household size 2.58 2.55 2.42 2.25 2.49 2.74 2.21 2.87 2.58 2.48 2.47 2.63
% 1-unit structures 74.2 68.9 70.9 69.4 72.1 76.7 56.7 91.1 76.4 64.8 68.3 83.3
% English speaking 94.6 93.7 96.8 96.5 97.5 96.5 95.6 97.8 97.9 89.7 95.2 93.8
% Speak only English 82.7 79.1 92.9 87.3 93.9 93.6 87.9 93.3 94.9 78.7 92.4 86.8
% Food stamps 2% 2% 16% 16% 14% 13% 6% 6% 19% 22% 16% 15%
% children under 18 34% 37% 28% 24% 29% 33% 24% 42% 31% 32% 30% 34%
% Below poverty level 3.4 5.4 14 13.9 14.7 10.2 9.6 7.8 19.3 23.3 12.5 14.1
% Driving to work 93% 88% 93% 92% 98% 94% 92% 92% 95% 96% 95% 94%
% Public Transport 1% 1% 1% 1% 0% 0% 0% 0% 0% 0% 1% 0%
% Availability of car 99% 99% 97% 96% 99% 99% 97% 99% 98% 95% 98% 97%
Mean income 119860 104101 57767 59969 63264 64831 79632 85220 51621 39943 62867 50411
% Owner-occ. houses 66.8 62.3 59 50.4 74.2 78.8 53.9 83.3 67.6 48.1 68.4 63.9

23
Table 1 B
Presence of retailers in treatment and control markets
Pair 1 2 3 4 5 6
Treatment Control Treatment Control Treatment Control Treatment Control Treatment Control Treatment Control
City Henrico Cary Rocky Mount Fayetteville Orangeburg Hopkins Greenville Irmo Shelby Asheboro Kinston Kannapolis
Presence of Lidl Ya Y Y Y Y Y
Presence of Aldi Y Y Y Y Y Y Y Y Y Y Y Y
Presence of Food Lion Y Y Y Y
Y Y Y Y
Presence of Kroger Y Y Y Y
Presence of Publix Y Y
Y Y
Presence of WM Y Y Y Y Y Y Y Y Y Y Y Y
Average direct price
difference between
competitors and Lidl 32%b 26% 1% 35% 9% 12%
a: Y indicates the presence of a retailer in a specific city.
b: The number should be read as follows. On average, prices for the basket of goods surveyed in the study are set 32% above Lidl prices by the competitors in the treatment
market.

24
Table 2: Estimation results
Homogenous Model Heterogonous retailer effects Heterogonous retailer-Market Effects
Parameter Estimate t value Parameter Estimate t value Parameter Estimate t value
Intercept 0.52 10.30 Intercept 0.49 9.00 Intercept 0.49 9.24
Lidl -0.09 -11.05 Lidl*ALDI -0.14 -8.70 Lidl*market 1*ALDI -0.09 -7.84
Lidl*market 2*ALDI -0.14 -6.73
Lidl*market 3*ALDI -0.19 -21.96
Lidl*market 4*ALDI -0.16 -6.93
Lidl*market 5*ALDI -0.10 -11.98
Lidl*market 6*ALDI -0.16 -9.12
Lidl*FOOD LION -0.13 -14.63 Lidl*market 1*FOOD LION -0.15 -12.61
Lidl*market 2*FOOD LION -0.13 -9.87
Lidl*market 5*FOOD LION -0.12 -12.98
Lidl*market 6*FOOD LION -0.14 -7.61
Lidl*Kroger -0.10 -4.54 Lidl*market 1*Kroger -0.13 -11.34
Lidl*market 2* Kroger -0.07 -5.08
Lidl*PUBLIX -0.04 -1.78 Lidl*market 1* PUBLIX -0.04 -1.83
Lidl*market 4* PUBLIX -0.04 -1.83
Lidl*WM -0.03 -2.36 Lidl*market 1* WM -0.03 -3.25
Lidl*market 2* WM -0.01 -0.66
Lidl*market 3* WM -0.02 -2.63
Lidl*market 4* WM -0.03 -1.53
Lidl*market 5* WM -0.02 -1.81
Lidl*market 6* WM -0.04 -3.02
Product FE Y Y Y
Retailer FE Y Y Y
Market-pair
FE Y Y Y
Observations 1,717 1,717 1,717

25
Table 3
Price reductions per retailer and treatment market
Henrico
Rocky
Mount Orangeburg Greenville Shelby Kinston
Aldi % price reduction 9%a 14% 19% 16% 10% 16%
$ saved 7.3b 13.5 17.3 15.0 9.2 14.1
Food Lion % price reduction 15% 13% 12% 14%
$ saved 17.9 16.1 12.3 16.1
Kroger % price reduction 13% 7%
$ saved 21.0 9.4
Publix % price reduction 4% 4%
$ saved 5.9 6.2
WM % price reduction 3% 1% 2% 3% 2% 4%
$ saved 1.9 1.1 2.0 3.0 1.1 3.6
a: The number should be read as follows: In Henrico, where Lidl is present, Aldi sets its prices, on average, 9% lower than in control market, Cary.
b: The number should be read as follows: In Henrico, consumers at Aldi spend $7.3 less on the basket of products surveyed than in the control Aldi store in Cary.

26
Table 4
Product specific price effect estimates
Parameter Estimate t-Value
Intercept 0.63 21.37
Ice Cream -0.15 -3.90
Pizza -0.08 -1.14
Tilapia Fillets 0.07 0.67
Shrimps 0.00 -0.06
Smoked Bacon -0.06 -0.33
Smoked Ham -0.16 -2.72
Sliced Cheese -0.22 -3.57
Salsa A -0.03 -0.33
Orange Juice -0.08 -3.10
Butter -0.10 -2.73
Whole Milk (1 gallon) -0.09 -0.88
Whole Milk (.5 gallon) -0.56 -7.37
Eggs -0.04 -0.17
Tomato Ketchup -0.08 -1.58
Mayonnaise -0.11 -4.31
Pasta Sauce -0.11 -4.28
Olive Oil 0.04 1.03
Ground Coffee -0.10 -1.71
Flour -0.14 -3.38
Granulated Sugar -0.06 -1.35
Oats -0.06 -1.42
Spaghetti -0.04 -0.62
Jelly -0.13 -5.91
Peanut Butter -0.07 -3.18
Macaroni and Cheese -0.10 -1.23
Chunk Light Tuna in
Water
-0.21 -1.64
Chicken Soup -0.13 -1.99
Pinto Beans 0.01 0.26
Water 0.06 0.35
Cola -0.04 -1.08
Chocolate Chip Cookies -0.05 -1.29
Potato Chips -0.11 -2.24
Tortilla Chips -0.18 -4.46
White Bread -0.05 -0.74
Buns -0.33 -6.25
Laundry Detergent -0.05 -0.70
Dishwashing Liquid -0.08 -1.95
27
Diapers -0.02 -1.41
Chicken tenderloin -0.01 -0.08
Pork Chops 0.00 -0.07
Ground Beef -0.09 -1.06
Trash Bags -0.04 -0.55
Bananas -0.18 -3.84
Avocados -0.47 -6.25
Pineapples 0.23 4.76
Asparagus 0.01 0.19
Peppers -0.04 -1.49
Tomatoes -0.10 -1.10
Product FE Y
Retailer FE Y
Market-pair FE Y
Observations 1,717
28
Figure 1: Retailer Specific Effects
Panel A: Average Price Difference between Treatment (Lidl) market and Control Market
The numbers should be read as follows: For example, on average, Aldi stores near Lidl stores set their prices
approximately 13.9% lower than in markets where Lidl is not present.
Panel B: Dollar Savings on Total Product Basket per Competitor
The numbers should be read as follows: For example, in Kroger stores near Lidl stores consumers save $22 on
the total product basket than in markets where Lidl is not present.
2.5%
3.9%
9.3%
10.1%
13.6%
13.9%
0.0% 2.0% 4.0% 6.0% 8.0% 10.0% 12.0% 14.0% 16.0%
Walmart
Publix
Average
Kroger
Food Lion
Aldi
Percentage price reduction
$3
$7
$14
$17
$22
$0 $5 $10 $15 $20 $25
Walmart
Publix
Aldi
Food Lion
Kroger
Dollars saved
29
Figure 2: Products Specific Price Reactions
Panel A: Average % Price Difference between Treatment (Lidl) Markets and Control markets
The numbers should be read as follows: For a half-gallon milk, competitors near Lidl stores, on average, set
there prices 56% lower than in markets where Lidl is not present.
7%
8%
8%
8%
10%
10%
11%
11%
11%
13%
13%
14%
15%
16%
18%
18%
21%
22%
33%
47%
56%
0% 10% 20% 30% 40% 50% 60%
Peanut Butter
Tomato Ketchup
Orange Juice
Dishwashing Liquid
Classic Roast Ground Coffee
Butter Salted
Pasta Sauce
Potato Chips
Mayonnaise
Jelly
Soup
Bleached All Purpose Flour
Ice Cream Vanilla
Smoked Ham
Tortilla Chips
Bananas
Chun Tuna in Water
Sliced Cheese
Buns
Avocados
Whole Milk 3.25% (.5 gallon)
% price differential

30
Panel B: Average Dollar Savings per Product
The numbers should be read as follows: On a half-gallon of milk, consumers in stores near Lidl stores save $.93
compared to stores in markets where Lidl is not present.
$0.08
$0.09
$0.11
$0.12
$0.12
$0.15
$0.16
$0.17
$0.19
$0.19
$0.20
$0.23
$0.26
$0.28
$0.37
$0.38
$0.48
$0.49
$0.62
$0.66
$0.93
0 0.1 0.2 0.3 0.4 0.5 0.6 0.7 0.8 0.9 1
Chicken Soup
Bananas
Peanut Butter
Pasta Sauce
Tomato Ketchup
Dishwashing Liquid
Potato Chips
Chunk Tuna in Water
Flour
Orange Juice
Jelly
Mayonnaise
Tortilla Chips
Butter
Hot Dog Buns
Ice Cream Vanilla
Smoked Ham
Sliced Provolone
Avocados
Ground Coffee
Whole Milk 3.25%
$ savings per product volume
31
Appendix A
List of products and their average shelf prices across competing retailers in markets where Lidl
is not present
Product Shelf price
Asparagus 3.13
Avocados 1.33
Bananas 0.51
Buns 1.10
Butter 1.63
Butter 2.74
Chicken Soup 0.61
Chicken tenderloin 3.43
Chocolate Chip Cookies 1.76
Chunk Tuna in Water 0.81
Cola 2.36
Diapers 7.51
Dishwashing Liquid 1.87
Eggs 1.96
Flour 1.39
Ground Beef 3.28
Ground Coffee 6.61
Ice Cream Vanilla 2.51
Jelly 1.57
Laundry Detergent 5.04
Macaroni and Cheese 0.50
Mayonnaise 2.09
Milk (.5 gallon) 1.67
Milk (1 gallon) 2.70
Oats 1.61
Olive Oil 3.18
Orange Juice 2.42
Pasta Sauce 1.10
Peppers 3.68
Pineapples 2.37
Pinto Beans 1.10
Pizza 4.29
Pork Chops 3.37
Potato Chips 1.47
Purified Water 2.28
Salsa 2.35
Shrimps 6.38
Sliced Cheese 2.22
Smoked Bacon 4.56
Smoked Ham 3.02
Spaghetti 1.39

32
Sugar 1.85
Tilapia Fillets 8.04
Tomato Ketchup 1.50
Tomatoes 1.45
Tortilla Chips 1.45
Trash Bags 5.74
White Bread 1.05

33
Appendix B
The average direct price differences
The numbers below have to be interpreted as follows. The price of bananas, for example, at
competing retailers is 21% more expensive than at a Lidl store in a treatment market.
Product Average % direct price difference between
competitors and Lidl
Asparagus 2%
Avocados -15%
Bananas 21%
Buns 28%
Butter 31%
Chicken Soup 7%
Chicken tenderloin 33%
Chocolate Chip Cookies 10%
Chunk Tuna in Water 39%
Cola 17%
Diapers 24%
Dishwashing Liquid 19%
Eggs -4%
Flour 32%
Ground Beef 6%
Ground Coffee 20%
Ice Cream 25%
Jelly 11%
Laundry Detergent -4%
Macaroni and Cheese 87%
Mayonnaise 36%
Milk (.5 gallon) 32%
Milk (1 gallon) 17%
Oats 5%
Olive Oil 4%
Orange Juice 2%
Pasta Sauce -17%
Peanut Butter 30%
Peppers 9%
Pineapples -6%
Pinto Beans 7%
Pizza 38%
Pork Chops 12%
Potato Chips 58%
Purified Water 33%
Salsa -7%
Shrimps 2%
Sliced Cheese 44%
Smoked Bacon 57%

34
Smoked Ham 3%
Spaghetti 27%
Sugar 50%
Tilapia Fillets 52%
Tomato Ketchup 30%
Tomatoes 10%
Tortilla Chips 32%
Trash Bags 24%
White Bread 56%