kbank investor presentation 4q13 jan2014 final · for further information, please contact the...
TRANSCRIPT

1
KASIKORNBANK
For further information, please contact the Investor Relations Unit or visit our website at www.kasikornbankgroup.com or www.kasikornbank.com
Investor Presentation as of 4Q13
January 2014
2
Consolidated (as of December 2013)Assets Bt2,290bn (USD69.8bn) Ranked #4 with 14.8% market share** Loans* Bt1,439bn (USD43.9bn) Ranked #4 with 14.5% market share** Deposits Bt1,530bn (USD46.6bn) Ranked #4 with 15.0% market share** CAR 15.78% ***ROE 20.45%ROA 1.89%Number of Branches 965Number of ATMs 8,740Number of Employees 19,303
KASIKORNBANK at a Glance
Share InformationSET SymbolShare Capital: Authorized Bt30.5bn (USD0.9bn) Issued and Paid-up Bt23.9bn (USD0.7bn)Number of Shares 2.4bn sharesMarket Capitalization Bt373bn (USD11.4bn) Ranked #2 in Thai banking sector 4Q13 Avg. Share Price: KBANK Bt177.20 (USD5.40) KBANK-F Bt179.52 (USD5.47)EPS Bt17.27 (USD0.53)BVPS Bt91.60 (USD2.79)
KBANK, KBANK-F
Established on June 8, 1945 with registered capital of Bt5mn (USD 0.15mn)Listed on the Stock Exchange of Thailand (SET) since 1976
Notes: * Loans = Loans to customers less Deferred revenue** Assets, loans and deposits market share is based on C.B.1.1 (Monthly statement of assets and liabilities) as of December 2013*** Capital Adequacy Ratio (CAR) has been reported in accordance with Basel III Capital Requirement from 1 January 2013 onwards.
CAR is based on KASIKORNBANK FINANCIAL CONGLOMERATE. KASIKORNBANK FINANCIAL CONGLOMERATE means the company under the Notification of the Bank of Thailand re: Consolidated Supervision, consisted of KBank, K Companies and subsidiaries operating in supporting KBank, Phethai Asset Management Co., Ltd. and other subsidiaries within the permitted scope from the BOT’s to be financial conglomerate
Exchange rate at the end of December 2013 (Mid Rate) was Bt32.81 per USD (Source: Bank of Thailand)

3
Table of ContentsTopic Slide Page
Operating Environment 5 - 6
2014 Financial Targets 7
Composition of Growth 8 - 11
The K-Strategy 12 - 13
Capital and Dividend 14 - 15
Summary 16
Appendix 17 - 125
4
Topic Slide PageKBank
Segment HighlightsStrategyRisk and Credit Management Financial Performance
18-2425-3536-4041-63
• 2013 Highlights• Net Interest Margin• Interest Income - net• Non-interest Income• Net Fee Income• Net Premium Earned - net• Other Operating Expenses• Loan• Asset Quality• Investment in Securities and Funding Structure
42-45464748
49-505152
53-5657-5960-63
The wholly-owned subsidiaries of KBankMuang Thai Life Assurance (MTL)Other Information
64-7172-7980-86
Banking System and Regulation Update 87-94
Government Policy 95-105
Thai Economic Figures 106-123
IR Contact Information and Disclaimer 124-125
Appendix

5
Key Points:
6.52.7 3.0
-5.0-2.01.04.07.0
10.0
2012 2013F 2014F
% Y
oY
Risk Factors:
Source: KResearch (as of January 20, 2014) and **KBank Capital Markets Research (as of January 22, 2014)
Operating Environment: Economic Outlook for 2014 Key GDP Forecasts and Assumptions
Uncertainties in domestic politics
Capital volatility and monetary policy management
Geo-political risks
Due to the current political strife, the 2014 GDP forecast was revised down to 3.0%, with a range of 2.2-3.7%
The ongoing political stalemate will likely shelve a large portion of public investment projects; the private sector is also likely to put its investments on hold
Mounting household debt and eroding confidence may put pressure on private consumption growth in 2014
Nevertheless, recovery in the export sector is expected to be the main economic driving force in 2014, in line with G4 sustained economic improvement
% YoY
Forecast Range
Base Case
GDP 6.5 2.7 2.2-3.7 3.0
Private Consumption 6.7 0.6 0.5-1.8 1.4
Total Investment 13.2 -0.9 1.3-3.3 2.2
Gov't Budget Deficit (% of GDP)* -2.8 -2.4 -1.7 to -2.6 -2.2
Exports 3.1 -0.3 3.0-7.0 5.0
Imports 8.8 -0.9 0.0-4.0 2.0
Current Account (USD bn) -1.5 -4.0 0.4-3.0 1.7
Headline Inflation 3.0 2.2 2.2-2.6 2.4
Policy Interest Rate* 2.75 2.25 2.50-2.75 2.75
2014F2013F2012
6
Government Stimulus Plan (App. pages 95-105)Due to the current political uncertainty, government investment in infrastructure projects, along with other public investment projects, may experience severe delays
Outlook on Europe, the US, China, and ASEAN The global economy is expected to gradually recover and become more stabilized in 2014
Eurozone: already bottomed-out and will modestly recover; structural reforms are yielding positive results, but fragmentation in the Eurozone financial system remains a challengeUS: economic recovery remains resilient. Political settlement regarding the fiscal deal provides optimism toward US economic prospects amid QE taperingChina: substantial economic growth is expected, but may not be as high as during the historic reform period; some uncertainties remainregarding the fragile banking system; however, ongoing reform will likely help sustain the Chinese economy in the longer-term ASEAN economies: recovery will be partly spurred by the regional economic integration. However, QE tapering may pose downside risks to countries with weak external balance, leading to large capital outflows
Outlook on Inflation (App. pages 108 and 110)Headline inflation remains benign in 2014, despite some increased pressure from higher living costs that will be affected by authorities’ plans, such as energy price restructuring
Outlook on Exports and Tourism (App. pages 109 and 111-112)Exports will likely rebound, due to a low base effect and better global economic prospectsRevenue from tourism is likely to cool, in light of a base effect and impacts from domestic political issues
Outlook on CAPEX cycle (App. page 113)A massive investment cycle is not expected until there is a robust recovery in exports; however, there might be new investment in some BOI-promoted industries, i.e. automobile and utility sectors
Impacts from QE tapering (App. page 117-118)Impacts on the Thai economy should be rather modest, given ample domestic liquidity as well as strong external balances e.g. high international reserves and low external debts
Baht (App. page 107)QE tapering began in Jan-14 and will result in a higher premium on the USD and re-pricing of other assets; capital outflows are expected to pick up, pressuring THB sentiment
Operating Environment: Economic Outlook for 2014
Source: KResearch and KBank Capital Markets Research (as of January 22, 2014)

7
Consolidated 2013 Actual 2014 Targets Notes
ROE 20.45% N/A
ROA 1.89% N/A
NIM 3.55% 3.4-3.6% Ranking maintained among large commercial banks (Page 46)
Loan Growth 8.46% YoY 9-11% Decent and sustainable loan growth; in line with economic growth (Page 8 and 53-56)
Non-Interest Income Growth* 18.24% YoY Up to mid-teens Mainly driven by fee income and insurance business (Page 9 and 48-51)
Cost to Income Ratio** 43.74% Mid-40sCost to income ratio continues to range in the mid-40s; seasonally higher in 2H (Page 11)
Credit Cost per year (bps) 85 bps Mid-80s Prudent and aligned with global market environment (Page 10 and 58)
NPL Ratio (Gross)*** 2.11% Below 2.2% Manageable with lingering global economic environment (Page 10 and 57)
2014 Financial Targets
Note: * Non-Interest Income includes Net Premium Earned - net (Net Premium Earned less Underwriting Expenses) from Muang Thai Life Assurance PCL (MTL); KBank has a 38.25% economic interest in MTL; on the
consolidated basis, Bancassurance fees are not included in net fee income, due to the elimination of inter-company transactions (the accounting treatment from the Muangthai Group Holding consolidation); Non-Interest Income = Total operating income – net less Interest income – net
** Cost to Income Ratio = Total Other Operating Expenses to Total Operating Income – net (Total Operating income less Underwriting Expenses)*** NPL Ratio (Gross) = NPL (gross) to total loans; NPL (gross ) used in calculation are loans to general customers and loans to financial institutions of non-performing loans; total loans used in calculation
are loans to general customers and loans to financial institutions
8
31%31%
36%36%
26%26%
7%7%
0
500
1,000
1,500
2012 2013
Other Loans
Retail Loans
SME Loans
Corporate Loans
1,3271,439
Composition of Growth: Loans by Business
Loan Portfolio Loan Portfolio Structure
Note: Since 1Q13, as per the Bank of Thailand’s requirement, the Bank has complied with TFRS 8 (Operating Segments) to present operating results for each key segment in financial reports
(Bt bn)
2013 2014 Outlook
Corporate Loans
Mainly from short-term domestic and trade finance credit with seasonal working capital loan demands with some loan repayment; loans drawn from the real estate, construction, and utilities industries
Growth target on long-term investment and high capacity utilizationindustries with a focus on international trade customers
Focused industries: construction materials, hardware, and automotive & parts
SME
LoansMainly from long-term and short-term credit, and seasonal working capital loan demands, especially from agriculture industry
Growth target reflects demand from domestic consumption andinternational trade benefits from the FTA and AECFocused industries: commerce, construction materials, and hardware
Retail
Loans
Mainly from mortgage loans and credit cards, growth in line withindustry; continued loan growth in all areas, driven by year-end seasonal growth
Conservative growth target, in line with industry
Focus on high yield products (K-Credit Card and K-Express Cash) with effective risk management
Loan growth continues to be decent, sustainable, and in line with economic growth
Loan Definition (more details on loans can be found in App. page 54-55)Corporate Loans: Loans of KBank and KBank’s Subsidiaries in Corporate Segments (Annual sales turnover > Bt400mn)SME Loans: Loans of KBank and KBank’s Subsidiaries in SME Segments (Annual sales turnover ≤ Bt400mn)Retail Loans: Loans of KBank and KBank’s Subsidiaries in Retail SegmentsOther Loans: Loans in Enterprise Risk Management Division (NPL + Performing Restructured Loans), and other loan types
Consolidated %YoY % Yield Loan Growth Dec12 Dec 13 Growth Range Target (Y2014)
2013 2013
Corporate Loans 416 443 6.7% 4-6% 6-8% SME Loans 469 521 10.9% 7-8% 9-11% Retail Loans 347 382 10.3% 6-7% 10-13% Other Loans 95 93 (2.9%) Total Loans 1,327 1,439 8.5% 6.4% 9-11%
Amount (Bt bn)

9
15%
2%0.04%2%
18%16%
60%61%
0
10
20
30
40
50
2010 2011 2012 2013
Other Operating Income
Fee and Service Income - net
Net Premium Earned - net*
Dividend Income
Share of Profit from Investmentson Equity Method
Gain on Investment
Gain on Trading and FXtransactions
4%
2%
64%
0.02%2%
14%
12%
2%
2%
20%
61%
0.4%
16%
2%
14%
3%
2%
0.05%3%
2%
Note:
Non-interest income growth continues to be main driver to help achieving the long-term sustainable profitability; mainly from net fee income and life insurance premiums as a result of customer-centric strategy
2013 non-interest income accounted for 40% of total net operating income and net fee income accounted for 24%; Net fee income in 2013 rose mainly through card business and fees from mutual fund and brokerage businesses
2014 non-interest income growth will be up to mid-teens, mainly driven by net fee income and life insurance premiums
Composition of Growth: Net Fees and Non-interest Income
29.44
20.6418.23
24.47
0
10
20
30
2010 2011 2012 2013
(Bt bn)
60%61%62%
62%
40%
38%38%
39%
0
40
80
120
2010 2011 2012 2013
Net Interest Income Non-interest Income
(Bt bn)40%39%38%38%
24%23%23%24%
0
10
20
30
40
50
2010 2011 2012 2013
Non-interest Income Ratio Net Fee Income Ratio
December 2013 (Consolidated)
Total Operating Income - net
Non-interest Income
(Bt bn)
28.40
34.02
40.72
Net Fee Income
(+13%)
(+19%)
Non-interest Income Ratio and Net Fee Income Ratio
75.1490.51
104.31
(+20%)(+15%)
(+22%)
(+14%)(+31%)
(+20%)
(+20%)
- Non-interest Income Ratio = Non-interest Income/Total Operating Income - net - Net Fee Income Ratio = Net Fee Income / Total Operating Income – net- Net Premium Earned - net = Net Premium Earned less Underwriting Expense
(%)120.95(+16%)
48.15(+18%)
(+20%)
10
December 2013 (Consolidated)
(Bt bn)
Coverage Ratio(%)
Asset Quality and Impairment Loss of Loans and Debt Securities (Provision)
(bps)(%)
Provision
NPL Ratio and Credit Cost
Asset quality remains stable and manageable
2013 NPL was at 2.11% with a coverage ratio of 134.52%
2013 credit cost is 85bps, to reflect a countercyclical provision policy
2014 asset quality is expected to remain stable with credit cost to be in the mid-80s bps
3.75.4 5.9
7.89.4
6.7 7.38.4
11.7
0
4
8
12
2005 2006 2007 2008 2009 2010 2011 2012 2013
131.83 134.52127.12
111.0291.64
88.38
73.9070.9666.60
0
50
100
150
2005 2006 2007 2008 2009 2010 2011 2012 2013
85
6083 82
93 102
66 64 66
6.85
8.88
2.162.453.76
3.09
4.44
2.912.11
0
2
4
6
8
10
2005 2006 2007 2008 2009 2010 2011 2012 2013
0
50
100
150
200
Credit Cost
NPL ratio

11
2.422.472.632.61
0
2
4
6
2010 2011 2012 2013
43.7445.0050.5750.9247.53
0
10
20
30
40
50
60
70
2009 2010 2011 2012 2013
Cost to Income Ratio
(%)
Cost to Income Ratio Cost to Average Assets Ratio
(%)
2009 2010 2011 2012 2013 1Q13 2Q13 3Q13 4Q13Cost to Income Ratio (%) 50.92 50.57 47.53 45.00 43.74 40.02 42.65 43.63 48.40
Cost to Average Assets Ratio (%) n.a. 2.61 2.63 2.47 2.42 2.19 2.41 2.42 2.63
December 2013 (Consolidated)
Cost to income ratio continues to range in the mid-40s; seasonally higher in 2H
2013 cost to income ratio was 43.74% as the Bank carefully monitored spending in response to economic uncertainty
2014 cost to income ratio will be stable in the mid-40s
12
The K-Strategy
Strategic Capabilities
PRODUCT & SOLUTIONInnovate & be responsive
PRODUCT & SOLUTIONInnovate & be responsive
SERVICE QUALITYExcellent customer experience
at all channels
SERVICE QUALITYExcellent customer experience
at all channels
BRANDING & MARKETINGClear & consistent communication
BRANDING & MARKETINGClear & consistent communication
Customer Centricity
Customer Strategy
4 Product Domains8 Customer Segments*
The Way We Work
Long-Term Risk-Adjusted Sustainable Profitability
TO BE CUSTOMER’S MAIN BANK
Innovative & Managing Products
Understanding Customer Needs
Sales & Service Excellence
Proactive Risk Management
KASIKORNBANK, its wholly-owned subsidiaries, and its strategic partner
I N T E G R A T I O N
Note: * The definition of the eight customer segments can be found in App. page 26
+

13
2.82
1.69
2.80
2.15
2.632.78 2.81
2.71
1
2
3
2007 2008 2009 2010 2011 2011(New)
2012(New)
9M13(New)
26%
18%
25%24%
17%23%
24%
27% 27%28% 29%
14%
12%11%10%
5%
10%
15%
20%
25%
30%
2008 2009 2010 2011 2012
Segment Performance Highlights
Average Product Holdings per CustomerMain Bank Status*
** In 2012, the Average Product Holding calculation is adjusted in all eight customer segments to align with our better understanding of customer behavior; 2011 numbers were restated for comparison purposes
Old Definition New Definition**
(Overall)
(By Business Division)
Corporate Business
SME Business
Retail Business
Main Bank Status and Market Penetration increased on track with our customer segment aspirations
Overall Customer Satisfaction
Overall Customer Satisfaction****
*** Customers in Retail Business Division (RBS) account for 97%, SME Business Division (SME) 3%, and Corporate Business Division (CBS) less than 1% of customer portfolio
**** Customer Satisfaction Index are calculated using the weighted average of customer satisfaction index from our eight customer segments; our retail customer satisfaction exceed the World Finance Industry Norm
No. of Customers (mn)***
* Main Bank Status = % of customers in the market who use KBank and its wholly-owned subsidiaries as their main operating bank and/or main saving and investing bank and/or main borrowing bank
Performance improvement driven by the success of our customer-centric strategy and new IT capabilities
Average product holdings per customer increasing as a result of enhanced cross-selling capabilities
Overall average rose to 2.82 in 9M13, from 2.71 in 2011
No. of customers grew 66% since 2007
No. of customers grew 5% YTD in 9M13
Overall Customer Satisfaction was at 85 in 2012
6.9 7.5 8.0 9.0 10.0
10.911.5
83 85 85 86 86 85
0
20
40
60
80
100
0
5
10
15
2007 2008 2009 2010 2011 2012 9M13
No. of Customers (mn) Overall Customer Satisfaction
2.172.66 2.82 2.862.67
3.12 3.11 3.30 3.54
4.55
2.812.722.78
1.71
2.963.05
2.562.142.122.101.831.44
4.41 4.59
0
5
10
2007 2008 2009 2010 2011 2011(New)
2012(New)
9M13(New)
Retail Business SME Business Corporate Business
14
Bank only KASIKORNBANK FINANCIAL CONGLOMERATE*
Capital (Reported Number: Excluding Net Profit of Each Period)
Capital adequacy remains sufficient to support business growth; maintained adequate Tier 1 ratio, as required under the Basel III
December 2013
Under Bank of Thailand regulations, net profit in the first half of the year is to be counted as capital after approval by the Board of Directors as per the Bank’s regulations. Net profit in the second half of the year is also counted as capital after approval of the General Meeting of Shareholders. However, whenever a net loss occurs, the capital must be immediately reduced accordingly.
Note: * KASIKORNBANK FINANCIAL CONGLOMERATE means the company under the Notification of the Bank of Thailand re: Consolidated Supervision, consisted of KBank, K Companies and subsidiaries operating in supporting KBank, Phethai Asset Management Co., Ltd. and other subsidiaries within the permitted scope from the BOT’s to be financial conglomerate.
** The details on Basel III regulations can be found in App. Page 90-91
12.579.13 9.57 10.44
5.20
3.844.27
0
3
6
9
12
15
18
2010 2011 2012 2013Tier1 Tier2
(%)
13.40 13.41
15.6415.78
3.21
12.029.37 9.63 10.43
5.554.184.59
0
3
6
9
12
15
18
2010 2011 2012 2013Tier1 Tier2
(%)
13.96 13.81
15.98
3.23
15.25
Basel II Basel III Basel II Basel III
Basel III2010 2011 2012 2013 1Q13 2Q13 3Q13 4Q13
Bank onlyCAR (%), excluding net profit of each period 13.96 13.81 15.98 15.25 15.44 15.71 16.72 15.25Tier 1 (%), excluding net profit of each period 9.37 9.63 10.43 12.02 11.08 11.44 12.50 12.02
KASIKORNBANK FINANCIAL CONGLOMERATE
CAR (%), excluding net profit of each period 13.40 13.41 15.64 15.78 15.79 16.20 17.31 15.78Tier 1 (%), excluding net profit of each period 9.13 9.57 10.44 12.57 11.47 11.97 13.13 12.57
Basel IIIBasel II

15
Dividend
2004 2005 2006 2007 2008 2009 2010 2011 2012 1H13Dividend Per Share (Bt) 1.00 1.25 1.75 2.00 2.00 2.50 2.50 2.50 3.00 0.50
Dividend Payout Ratio (%) 15.45 21.36 30.55 31.88 32.33 42.49 32.14 27.00 22.12
Dividend policy: both operating results and long-term returns to shareholders are taken into consideration in determining dividend paymentsDividend payout ratio ranges 20-25%, in order to ensure a sustainable and adequate capital level through the changing economic environment and the ongoing adoption of Basel III
22.1227.00
32.14
15.4521.36
30.55 31.88 32.33
42.49
0
10
20
30
40
50
2004 2005 2006 2007 2008 2009 2010 2011 2012
(%)
Dividend Payout RatioDividend Per Share
0.0
0.5
1.0
1.5
2.0
2.5
3.0
2004 2005 2006 2007 2008 2009 2010 2011 2012 1H13
(Bt)
1.001.25
1.752.00 2.00
2.50
Interim Dividend
2.50 2.50
3.00
Interim Dividend
0.50
16
Summary
Customer-centric strategy effectively executed: the data-mining, analytic campaign management, and multi-channel sales and services platform have enhanced our capability to quickly acquire new customers; the result is a top-notch total customer experience and strong market position
Balanced growth: loans to grow carefully in line with economic condition; appropriate liquidity maintained; asset quality sustained; appropriate loan loss reserves; strong non-interest income growth; stable cost to income ratio; strong ROE maintained
Adequate capital: maintained adequate Tier 1 ratio, as required under the Basel III
17
Appendix
18
KBank: Segment Highlights

19
Performance and Market PositionMain Bank Status: maintained #1 ranking
Trusted Partner Bank: aim to be #1 through comprehensive fund raising solutions, integrated cash management solutions, and value chain solutions
Outright Trading Volume of Corporate Bonds: ranked #1 with 27% market share in 2013
Corporate Bond Underwriting: ranked #4 with 11% market share in 2013
Syndicated Loan Arranging: leading position with acclaimed expertise in power and petrochemical sectors
Transaction Services: a top player in transactional banking services
Security Services (MFS): 39% market share in November 2013
Cash Management Services: 24% market share in 2013
Trade Finance: 31% market share in 2013
Industrial Expertise: leverage capability in utility, real estate, transportation, and commerce, etc; in 2012 our executives were invited to speak at seminars
on green business and urbanization
Knowledge-based Organization: strive to be a knowledge-based organization for family business (KFAM Club, and Family Business Open Up)
23%
19%21%
23% 24%
0%
10%
20%
30%
2009 2010 2011 2012 2013
25%23% 24%26% 26%
0%
10%
20%
30%
2009 2010 2011 2012 2013
14%18%
15%17%
11%
0%
10%
20%
30%
2009 2010 2011 2012 2013
Corporate Business: Performance and Market PositionMulti-Corporate
BusinessLarge Corporate
BusinessMedium Business
Small and Micro Business
High Net WorthIndividual
MiddleIncome
Mass
Corporate Bond Underwriting
Affluent
Source: ThaiBMA
Main Bank Status
Source: KBank Customer Survey
Cash Management Services
Source: KBank Customer Survey
Note: Main Bank Status = % of customers in the market who use KBank and its wholly-owned subsidiaries as their main operating bank and/or main savings and investing bank and/or main borrowing bank
(#1) (#1) (#1) (#1)(#2) (#2) (#3) (#2)
(#2) (#2) (#2) (#2)
(#4)
(#1)(#2)
20
30%27% 29%
30%
0%
10%
20%
30%
2009 2010 2011 2012
28%27% 27%29%
0%
10%
20%
30%
2009 2010 2011 2012
Multi-Corporate Business
Large Corporate Business
Medium Business
Small and Micro Business
High Net WorthIndividual
MiddleIncome
MassAffluent
SME Business: Performance and Market Position
Performance and Market PositionMain Bank Status: strengthened #1 position by acquiring new trade credit customers and offering effective cross-selling cash management solutions and packages
Market Share: maintained at 30% in 2012; improved from 29% in 2010 to 30% in 2011
Market Position: strengthened #1 position in SME market – “Bank for SMEs”; targeted to be SME market leader in all areas
Improved capital usage efficiency by increasing total income to loan ratio
Only bank to offer a 2-day credit approval process for small and micro SMEs, with receipt of funds within 5 days
Only bank to offer comprehensive solutions to SMEs through K SME Care program (launched in 2006, with a total of 19 classes and about 10,000 participants so far) and K SME Care Knowledge Center (established in 2009)
#1 in Market Share by Value #1 in Main Bank Status
Source: KBank Customer Survey (updated annually)
(#1)
Source: KBank Customer Survey (updated annually)
(#1)(#1)(#1) (#1)
(#1)(#1)(#1)
Note: - SME Business in Thailand accounts for 37.0% of Thailand’s GDP, or Bt4.2trn; 2.73 million SME customers with 0.66 million registered as legal entities (as of December 2012);supported by the government to become a key factor in economic and social growth (Source: The Office of Small and Medium Enterprises Promotion or OSMEP)
- Market Share by Value = share of revenue (derived from both credit and non-credit products) that each bank gains from the market - Main Bank Status = % of customers in the market who use KBank and its wholly-owned subsidiaries as their main operating bank and/or main savings and investment bank and/or
main borrowing bank

21
9.2%9.4%8.8%
7.7%9.6%
0%
5%
10%
15%
2009 2010 2011 2012 9M13
25.7%23.5%
20.5%15.8%
25.0%23.9%
19.2%
16.1%
22.1% 22.3%
0%
5%
10%
15%
20%
25%
30%
2009 2010 2011 2012 9M13
NewBusiness
TotalPremium
23.1%24.3%23.7%
20.8%
25.5%
0%
10%
20%
30%
2009 2010 2011 2012 2013
#1 in Mutual Fund (KAsset)
Multi-Corporate Business
Large Corporate Business
Medium Business
Small and Micro Business
High Net WorthIndividual
MiddleIncome
Mass
Mortgage Loan
Affluent
Retail Business: Performance and Market Position
(% Market Share) (% Market Share) (% Market Share)
#1 in Bancassurance*(Total Premium and New Business Premium)
Performance and Market PositionMarket Penetration: strong market penetration to affluent customers, with 81% penetration in Nov13 (continual increase from 40% in 2010)Bancassurance: MTL held #1 position in Bancassurance total premium with 23.9% market share, and Bancassurance new business premium with 25.7% market share in 9M13; MTL also held #1 position for new business premium of life insurance industry with 18.7% market share in 9M13Fund Management Service:
Mutual Funds: KAsset maintains #1 position, with Gold Winner Award from Reader’s Digest Most Trusted Brand for 6th consecutive year and two Best Mutual Fund of the Year 2013 Awards by Money & Banking magazineMutual Funds + Private Funds + Provident Funds: maintains #1 position, with highest total AUM for the 5th consecutive year
Mortgage Loans: ranked in top 3, with 9.2% market share in 9M13; conservative growth (in line with industry) and maintaining a good quality portfolioCredit Cards:
Total spending: ranked #1 , with highest spending volume of Bt234bn or 20.8% market share in 11M13Number of cards: ranked #2, with 3.02mn cards in November 2013 Card-accepting merchant services (such as EDC, payment gateway, etc.): ranked #1, with 34.9% market share by volume in 11M13
Debit Cards: Maintain leader position to match customer lifestyles, with the launch of Character Card (latest offering with LINE Sticker Set) and Provincial Debit CardHighest debit card spending in the industry, at Bt7,000/active card/month
Digital Banking: Market leader, with 33% market share of Thailand Digital Banking users (Bank of Thailand report, Sep 2013) #1 Digital Banking top of mind Brand perception rating (Nielsen, 2012)
(#2)
(#1) (#2)(#1)
(#2)(#2)
(#2)
(#2)(#1)(#1)
Ranked # 1 in both total and new business premium
Ranked #1 in Mutual Fund AUM (KAsset)
(#2)
(#1)(#1)(#1) ( #1)
(#3) (#3)(#2) (#3)
(#3)
Maintaining good quality portfolio with lowest %NPL ratio among leading commercial banks
Note: * Total Premium = New Business Premium (NBP) + Renewal Premium; New Business Premium = First Year Premium (FYP) + Single Premium (SP)
22
34
262321 24
0
20
40
2009 2010 2011 2012 2013
145117
9587114
0
50
100
150
200
2009 2010 2011 2012 2013
866
12
8
0
5
10
15
20
2009 2010 2011 2012 2013
63636160 62
0
15
30
45
60
75
90
2009 2010 2011 2012 2013
Corporate & SME Service Centers
Channels: Corporate and SME Business
Corporate Business Centers* SME Business Center**
Cheque Direct Service Office
Customer facilitation in areas with good potential, via the opening of financial service centers and cheque points
* Reduction in the number of centers was a result of consolidation of some centers** Excluding Corporate & SME Service Centers; in one branch, there could be more than one SME Business Centers
Note:

23
8,7407,6037,4716,955 7,366
9,394
0
1,500
3,000
4,500
6,000
7,500
9,000
10,500
2009 2010 2011 2012 2013 2014F
835869 883
3096
262
400
600
800
1,000
1,200
2009 2010 2011 2012 2013 2014F
Branch ATM
(+11)
Channels: Retail Business
(+120) (+23)
(+1,853)(+516)
185
126
9977
103
252
0
40
80
120
160
200
240
280
2009 2010 2011 2012 2013 2014F
K-Lobby ***
(+33)(+22)
(-105**)
* “New Branch Model” is a new modern-lifestyle branch model aiming to provide more convenience to targeted customers. This type of branch is designed to be smaller in size and equipped with an electronic banking machine and a small staff; hence, it is cost efficient to operate
(+4)
(+237)
(+23)
782 805 816865
(+34)
965(+1,137)
(+59)
(+66)
New Branch Model*
*** K-Lobby is an electronic banking service with multiple functions such as K-ATM, K-CDM (Cash Deposit Machines), and K-PUM (Passbook Update Machine). K-Lobby is available to serve customers both outside of branch offices and as stand-alone machines in areas without branches
(+100)
Note:
(+19)
(+30)
2009 2010 2011 2012 2013Branch 782 805 816 865 965 - Bangkok and Metro 46% 46% 46% 45% 42% - Upcountry 54% 54% 54% 55% 58%ATM 6,955 7,471 7,366 7,603 8,740 - Bangkok and Metro 52% 51% 52% 51% 48% - Upcountry 48% 49% 48% 49% 52%xxCDM 973 1,014 1,067 1,398 2,195 - CDM (Deposit) 973 1,014 1,016 1,066 1,138 - CDM (Deposit & Withdraw) 51 332 1,057K-Lobby 77 99 103 126 185
The WISDOM Centers and Corners 31 36 75
** A drop in the number of ATMs reflected a relocation plan
1,145(+180)
(+654)(+67)
(+14)
(+166)(+49)
Key Strategies in Channel ExpansionBranch: provide customer service
Increase number of branches to 1,145 by year-end 2014 (including “new branch model”)
Expand branch and “new branch model” to potential areas for high competitiveness
Expand branch size in high traffic/strategic areas to better serve customers
Relocate low use branches to more convenient areas
E-Channel: provide customer convenience
#1 in number of Cash Deposit Machines (CDMs) in Thailand; utilize duo-function CDMs(deposits & withdrawals) to increase efficiency, enhance service coverage and improve customer convenience
#1 in number of K-Lobby in Thailand; increase number of K-Lobby to 252 in 2014
Relocate ATMs to provide more convenient service to customers
24
Branch
Sample of Channels
K-Lobby
A new modern-lifestyle branch model aiming to provide more convenience to targeted customers. This type of branch is designed to be smaller in size and equipped with an electronic banking machine and a small staff; hence, it is cost efficient to operate
An electronic banking service with multiple functions such as K-ATM, K-CDM (Cash Deposit Machines), and K-PUM (Passbook Update Machine). K-Lobby is available to serve customers both outside of branch offices and as stand-alone machines in areas without branches
New Branch Model
THE WISDOM Center and Corner
An exclusive center providing a full range of services and facilities to the High Net Worth Individual and Affluent segments
Digital Banking
Sample of Digital Banking
• K-Mobile Banking
• K-Cyber Service (K-Cyber Banking, K-Cyber Trade and K-Cyber Invest)
• K-Payment Gateway
• K-PowerP@y (mPOS)
THE WISDOM Lounge @ Sofitel So Bangkok
Branch @ Department Stores Mini Branch @ BTS

25
KBank: Strategy
26
Eight Customer Segments Multi-Corporate Business
Large Corporate Business
Medium Business
Small & Micro Business
High Net Worth Individual
Co
rpo
rate
B
usi
nes
sS
ME
B
usi
nes
sR
etai
l Bu
sin
ess
Ret
ail
Bu
sin
ess
Company with annual sales >Bt5,000mn
Company with annual sales >Bt400mn to Bt5,000mn
Individual or company with annual sales >Bt50mn to Bt400mn
Individual or company with annual sales ≤ Bt50mn, and with commercial credit limit ≤ Bt15mn
Individual wealth with KBank and its wholly-owned subsidiaries* ≥ Bt50mn
Individual wealth with KBank and its wholly-owned subsidiaries* ≥ Bt15,000 to < Bt10mn
Individual wealth with KBank and its wholly-owned subsidiaries* < Bt15,000
Note: * Wealth with KBank and its wholly-owned subsidiaries is defined as savings and investments, such as deposit products with KBank, mutual funds with KAsset; or the monthly income of an individual customer
Affluent
Middle Income
Mass
Individual wealth with KBank and its wholly-owned subsidiaries* ≥ Bt10mn to < Bt50mn
Customer-centric strategy: offering a full array of financial solutions and a satisfying experience to our customers
Synergistic portfolio management by monitoring eight customer segments Offer financial solutions from among KBank, its wholly-owned subsidiaries, and the insurance companyMake significant progress towards long-term aspirations; performance on track

27
Revenue by Eight Customer Segments
Note: Loan portion and loan yield of each customer segment includes loans from the Enterprise Risk Management Division (NPL + Performing Restructured Loans); figures are not comparable with loan data in other pages
Non-interest income *
0.5%
22.7%
3.5%0.3%
18.2%
21.8%
16.9%
16.1%
Loan
Portion
Average
Loan Yield (%)
High Network
4%
Multi-Corporate Business
13%
Small & Micro
Business 15%
Medium Business
12%
Large Corporate Business
9%
Mass10%
Middle Income
28%
Affluent9%
* Non-interest income excludes capital market business, treasury business and others
4.4%
6.5%
7.1%
9.4%
4.5%
9.6%
4.5% 5.5%
Large Corporate Business
Medium Business
Small & Micro Business
High Net Worth Individual
Affluent
Middle Income
Mass
Multi-Corporate Business
December 2013
28
K-Transformation Foundation Capabilities
Information Technology
Capital (ITC)
Financial Information
System (FIS)
Know Our Customers
(KOC)
Multi-channel
Sales And Services
(MSS)
K-Transformation Supporting Solution (KSS)
Innovative & Managing Products
Understanding Customer Needs
Sales & Service Excellence
Strategic Capabilities
Proactive Risk Management
K-Transformation Project
Implementing: completion expected by
2015
Implemented
29
2007 2008 2009 2010 2011 2012
- In 2012, Average Product Holding calculation was adjusted in all eight customer segments to align with customer behavior; 2011 numbers were revised for comparison purposes
- Since January 1, 2011, financial statements have been reclassified per the Bank of Thailand’s requirements; the 2009 and 2010 financial statements were restated and adjusted for comparison purposes
1.692.15
2.71
51.54
2.782.63
47.5350.5750.9253.95
39.0435.23
39.8134.7433.55
Average Product Holdings
Non-interest Income Ratio (%)
Cost to Income Ratio (%)
14.3512.79
15.7315.94 16.72ROE (%)
2.80
37.58
45.00
20.76
Y2007-2008: Old Financial Presentation Y2009 onwards: New Financial Presentation
Note:
37.79
43.74
20.45
2013
Key Highlights
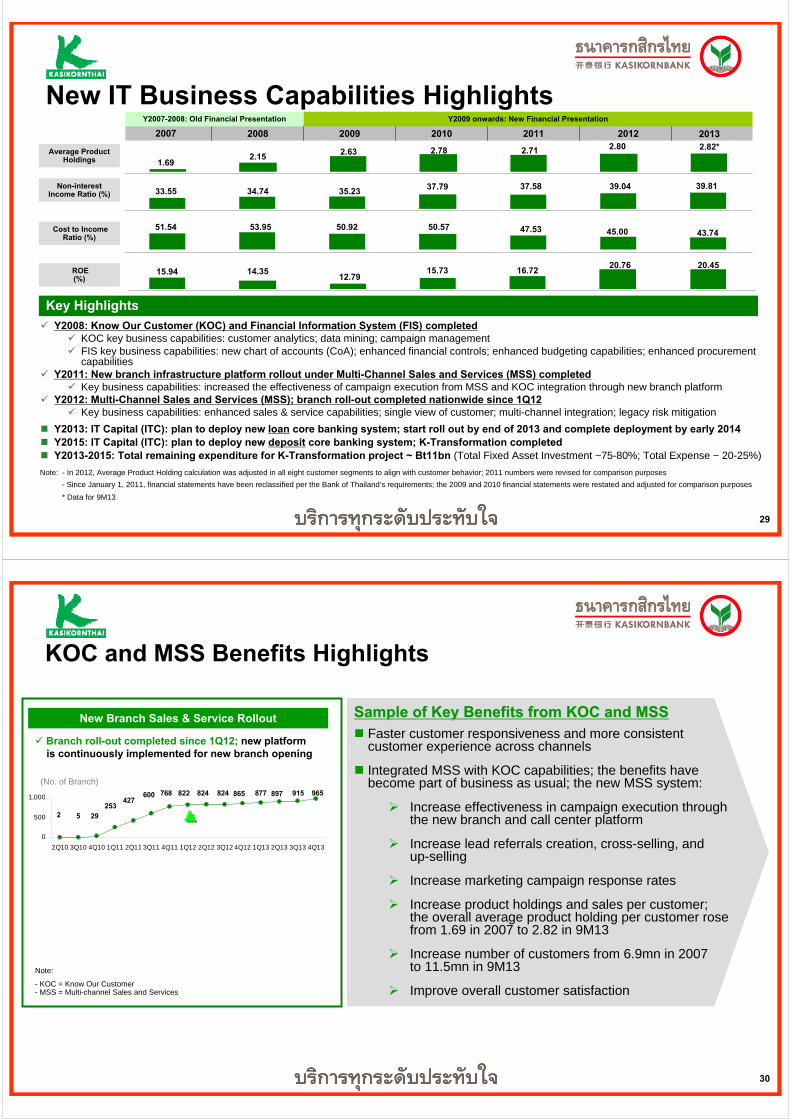
Y2008: Know Our Customer (KOC) and Financial Information System (FIS) completedKOC key business capabilities: customer analytics; data mining; campaign managementFIS key business capabilities: new chart of accounts (CoA); enhanced financial controls; enhanced budgeting capabilities; enhanced procurement capabilities
Y2011: New branch infrastructure platform rollout under Multi-Channel Sales and Services (MSS) completedKey business capabilities: increased the effectiveness of campaign execution from MSS and KOC integration through new branch platform
Y2012: Multi-Channel Sales and Services (MSS); branch roll-out completed nationwide since 1Q12Key business capabilities: enhanced sales & service capabilities; single view of customer; multi-channel integration; legacy risk mitigation
New IT Business Capabilities Highlights
2.82*
* Data for 9M13
Y2013: IT Capital (ITC): plan to deploy new loan core banking system; start roll out by end of 2013 and complete deployment by early 2014Y2015: IT Capital (ITC): plan to deploy new deposit core banking system; K-Transformation completedY2013-2015: Total remaining expenditure for K-Transformation project ~ Bt11bn (Total Fixed Asset Investment ~75-80%; Total Expense ~ 20-25%)
30
KOC and MSS Benefits Highlights
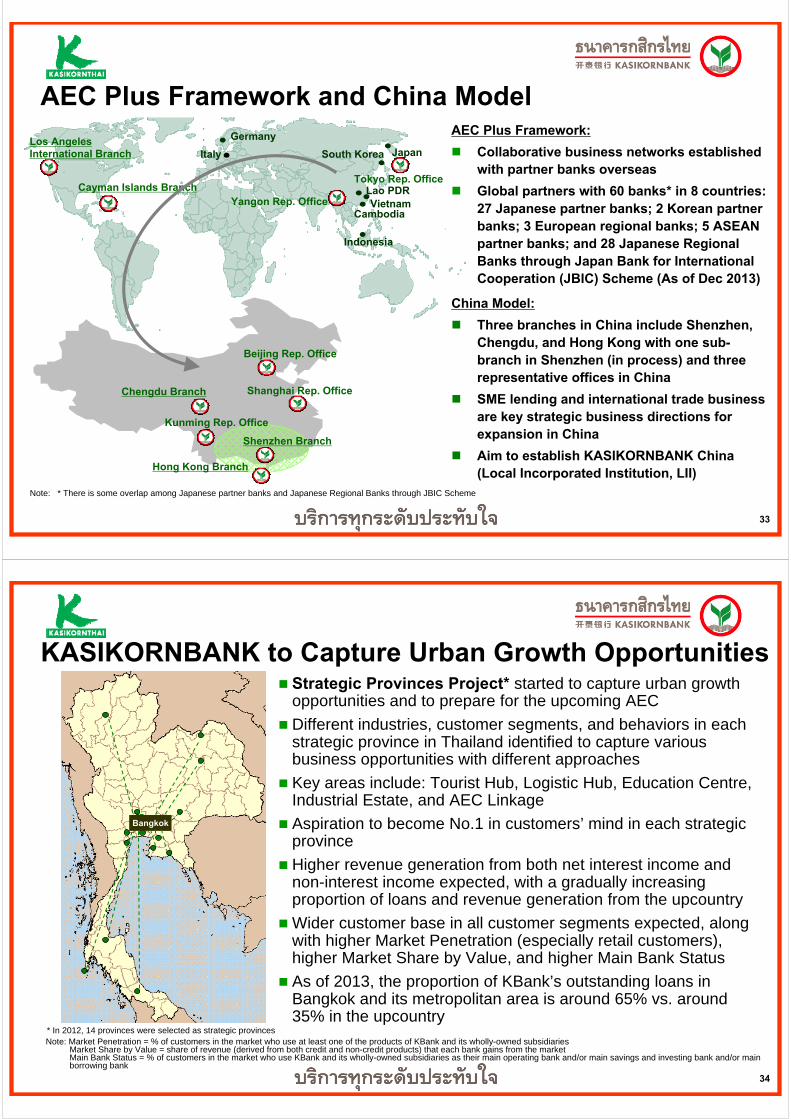
Faster customer responsiveness and more consistent customer experience across channels
Integrated MSS with KOC capabilities; the benefits have become part of business as usual; the new MSS system:
Increase effectiveness in campaign execution through the new branch and call center platform
Increase lead referrals creation, cross-selling, and up-selling
Increase marketing campaign response rates
Increase product holdings and sales per customer; the overall average product holding per customer rose from 1.69 in 2007 to 2.82 in 9M13
Increase number of customers from 6.9mn in 2007 to 11.5mn in 9M13
Improve overall customer satisfaction
Sample of Key Benefits from KOC and MSSSample of Key Benefits from KOC and MSS
965915897824824822768600427
2532952
865 877
0
500
1,000
2Q10 3Q10 4Q10 1Q11 2Q11 3Q11 4Q11 1Q12 2Q12 3Q12 4Q12 1Q13 2Q13 3Q13 4Q13
(No. of Branch)
New Branch Sales & Service Rollout
Branch roll-out completed since 1Q12; new platform is continuously implemented for new branch opening
Note:
- KOC = Know Our Customer- MSS = Multi-channel Sales and Services

31
New IT Business Capabilities
New Core Banking System on Loans- Open possibilities to capture new business
opportunities- Help shorten product development time - Enhance product innovation capability
New Branch Sales & Service and Call Center System Enhancement- Create unique and consistent customer
experience across channels including new infrastructure
- Enhance cross selling capability via diverse sales and service channels
New Core Banking System on Deposits - Start to deploy legacy system in multiple
groups to mitigate risk of big bang deployment
Key Deliverables and Benefits in 2013Key Deliverables and Benefits in 2013--20142014
Develop a constructive and harmonious corporate culture; new IT platform to provide unique tools to support our customer-centric strategy; overcoming IT obstacles makes KBank a leader among peers
LongLong--term Strategic Positioningterm Strategic PositioningThe K-Transformation project is expected to be completed by 2015
A new core banking system, the last capability enhancement under the K-Transformation project, consists of new loan and deposit core banking systems
New capabilities will help enhance new product development capability, shorten product development time, and significantly reduce maintenance costs in the long-term; as well as open possibilities to capture new business opportunities
Gradual deployment of the K-Transformation project will make the project KBank’s new standard business system platform; the project budget will be included as a part of KBank’s regular annual IT budget
KBank’s cost to income ratio will range in the mid-40s
June 2013: changes to some parts of deposit core banking system development
New deposit core banking vendor provides more benefits in the long-term, including faster data processing, mitigated risk concerning for staff competence in maintaining system stability, and reduction in maintenance costs
New capabilities will help enhance new product development capability, shorten product development time, and significantly reduce maintenance cost in the long term
End 2013 to early 2014: Plan to deploy on new loan accounts, with gradual deployment to mitigate new technology system risk; deployment for all loan accounts will be completed by early 2014
End 2015: Plan to deploy new deposit core banking system to complete the K-Transformation project
32
KASIKORNBANK to Capture AEC Opportunities
Note: 1. Size of economy for 2013 from IMF and compiled by KResearch (as of October 15, 2013)2. 2014 GDP forecast is projected by KResearch (as of January 20, 2014) 3. ASEAN economic growth are averaged growth among ASEAN member countries in national currencies4. Greater Bangkok includes Nonthaburi, Samut Prakarn, Nakorn Pathom, Samut Sakhon, and Patumthani
GDP Thailand ASEAN
Size of Economy (GDP) in USD Trillion for 2013 0.38 3.30
2014 GDP Forecast 3.0% 5.5%
Contribution to GDP (by NESDB) 2012 Y2015F
Greater Bangkok : Provinces 44 : 56 42 : 58
KBank has 5 international branches (Los Angeles, Cayman Islands, Hong Kong, Shenzhen, and Chengdu), and 5 representative offices (Beijing, Shanghai, Kunming, Tokyo, and Yangon)
ASEAN Economic Community (AEC): ASEAN member countries to become a single market by 2015; free flow of goods & services and non tariff barrier among 10 member nationsGreater opportunities available through ASEAN + 3 (China, Japan, and South Korea)To capture AEC opportunities, KBank continues to enhance business in
International TradeBorder TradeCross Border Investment Retail Customer (Tourist / Expatriate / Transit)Host Country Business
Higher revenue generation and expansion of customer base“AEC Plus” framework is established to cover ASEAN, China, Japan, and Korea through our presence and collaborative business networks with partner banksChina model developed to ensure KBank’s presence in China
33
AEC Plus Framework and China ModelGermany
Italy
Indonesia
Japan South Korea
VietnamLao PDR
Cambodia
Beijing Rep. Office
Kunming Rep. Office
Shenzhen Branch
Chengdu Branch Shanghai Rep. Office
Hong Kong Branch
Los Angeles International Branch
Yangon Rep. Office
Tokyo Rep. OfficeCayman Islands Branch
Note: * There is some overlap among Japanese partner banks and Japanese Regional Banks through JBIC Scheme
AEC Plus Framework:
Collaborative business networks established with partner banks overseas
Global partners with 60 banks* in 8 countries: 27 Japanese partner banks; 2 Korean partner banks; 3 European regional banks; 5 ASEAN partner banks; and 28 Japanese Regional Banks through Japan Bank for International Cooperation (JBIC) Scheme (As of Dec 2013)
China Model:
Three branches in China include Shenzhen, Chengdu, and Hong Kong with one sub-branch in Shenzhen (in process) and three representative offices in China
SME lending and international trade business are key strategic business directions for expansion in China
Aim to establish KASIKORNBANK China (Local Incorporated Institution, LII)
34
KASIKORNBANK to Capture Urban Growth Opportunities
Bangkok
Note: Market Penetration = % of customers in the market who use at least one of the products of KBank and its wholly-owned subsidiaries Market Share by Value = share of revenue (derived from both credit and non-credit products) that each bank gains from the market Main Bank Status = % of customers in the market who use KBank and its wholly-owned subsidiaries as their main operating bank and/or main savings and investing bank and/or main borrowing bank
* In 2012, 14 provinces were selected as strategic provinces
Strategic Provinces Project* started to capture urban growth opportunities and to prepare for the upcoming AEC
Different industries, customer segments, and behaviors in each strategic province in Thailand identified to capture various business opportunities with different approaches
Key areas include: Tourist Hub, Logistic Hub, Education Centre, Industrial Estate, and AEC Linkage
Aspiration to become No.1 in customers’ mind in each strategic province
Higher revenue generation from both net interest income and non-interest income expected, with a gradually increasing proportion of loans and revenue generation from the upcountry
Wider customer base in all customer segments expected, along with higher Market Penetration (especially retail customers), higher Market Share by Value, and higher Main Bank Status
As of 2013, the proportion of KBank’s outstanding loans in Bangkok and its metropolitan area is around 65% vs. around 35% in the upcountry

35
Strategic Provinces Project: Highlights in 2013*
Corporate Business Total income earned from corporate customers in strategic provinces increased 12% YoY in 10M13Successfully launched events to keep a strong relationship with Big Family (Phuket) Created Marketing Activities for corporate customers such as Professional Family Business Management and Business Matching Activities
SM
E
Bu
sin
ess
SME BusinessTotal income earned from SME customers in strategic provinces increased 9% YoY in 10M13Opened six SME hubs in strategic provincesBuilt K-SME brand awarenessLaunched localized marketing campaigns, including brand selling and retention programs, to serve customer needs in each strategic province
Co
rpo
rate
B
usi
nes
s
KBank, its wholly-owned subsidiaries, and Muang Thai Life Assurance (MTL) aim to offer a full range of financial solutions based on customer-centric strategy to capture business in strategic provinces
Ret
ail
Bu
sin
ess
Note: * In 2013, 15 provinces were selected as strategic provinces for corporate and SME customers; 19 provinces were selected as strategic provinces for retail business
Retail BusinessSince launching the strategic province project, the number of retail customers has grown continuously by a total of 23% in 2013, with significant growth particularly in High Net Worth Individual and Affluent segmentsStrengthen KBank infrastructure through new branches and THE WISDOM lounge opening in strategic provinces Massive acquisition and customer engagement with effective marketing communication by launching localized offerings, events, campaigns, and privileges to match customer lifestyles and needs such as Joyful Festival, Provincial Debit Card, Localized Privileges, and Exclusive Experience Activities for high value customers
36
KBank: Risk and Credit Management

37
KBank Risk Management StructureThe Bank’s organization is structured to facilitate all aspects of risk management; each business unit’s responsibilities and segregation of duties are clearly identified in accordance with good internal-control practices
Board of DirectorsBoard of Directors
Audit CommitteeAudit Committee
Risk Management Committee
Sub-committeeCredit Policy and Risk Management Sub-committee
Credit Process Management Sub-committeeMarket Risk Management Sub-committee
Asset and Liabilities Management Sub-committeeOperational Risk Management Sub-committee
Capital Management Sub-committee
Business FunctionsCBS/ RBS/
SME/ CMB/ CSP
Risk FunctionsERM
Approve risk appetite and all risk management policies and guidelinesEnsure the adequacy and effectiveness of risk management system and internal controls
Approve risk limits according to the risk appetite approved by the Bank’s Board of DirectorsOversee and monitor risk management policies and overall risk profile under the policies and guidelines approved by the Bank’s Board of Directors
Risk functions are responsible for risk management policies, methodologies, and processes in order to effectively measure, monitor, and control all related risks
Business functions are accountable for managing all risks inherent in their day-to-day activities
CBS = Corporate Business Division, RBS = Retail Business Division, SME = SME Business Division, CMB = Capital Market Business Division, CSP = Corporate and SME Products Division, ERM = Enterprise Risk Management Division
38
KBank Credit Risk Management Process
Monitor customer behavior and detect early warning signsEnsure credit condition compliance (e.g. insurance, capital injection, project progress) Take prompt action to prevent credit deterioration
Efficient collection and follow-up of customers with late paymentsRestructure viable customers to prevent NPLsForeclose pledged assets to recover loan loss
Enhance decision making/supporting tools for more efficient return and risk evaluationSetup specific prescreening criteria for potential industriesEnhance customer income validation process
MonitoringMonitoringMonitoring Collection & RecoveryCollection & RecoveryCollection & RecoveryOriginationOriginationOrigination
Portfolio ManagementPortfolio ManagementPortfolio Management
Determine portfolio-by-design i.e., portfolio target setting by key credit concentration dimensions (Country, Industry, Large Customer Group) and other sub portfolio dimensions based on value-based analysis
Manage portfolio according to the Bank’s risk appetite and concentration
Perform stress testing to identify portfolio weaknesses and proactively prepare appropriate management actions
The Bank continues to enhance credit risk management processes to promote risk strategies with justified risk-return tradeoff within the rapidly changing economic environment

39
• Automated collection system• Efficiently utilize available behavior scoring and collection tools i.e. SMS, automated letter
generation, phone
Unsecured Credit Product Operation Dept.
Credit Card/Unsecured Consumer
Housing Loan/ Secured Consumer
SM≤ Bt50mn
MB> Bt5,000mn
ME> Bt50 – 400mn
CB> Bt400 - 5,000mn
Policy Lending
• Sufficiency of cash flow• Growth trends and ability to compete• Management experience and depth• Leverage, Liquidity, and asset quality• Credit Risk Mitigation• Facilities Structure
Formula Lending
Corporate SME Retail
Po
st A
pp
rova
l
• Legal document• Limit set up
Credit Processing Dept.
Bank-wide Risk Asset Review
• Customer Review by Relationship Manager (RM)• Credit Portfolio Monitoring Unit to facilitate RM in
customer monitoring• Credit Clinic
Retail and SME Business Collection and Recovery Dept.
Ap
pro
val P
roce
ssA
nn
ual
Sal
e s
• Legal document• Limit set up
• Application Score• FICO Score• Bureau information/Credit
history• Debt service capacity• LTV
Unsecured Credit Product Operation Dept.
KBank Credit Approval Process
Note: MB = Multi-Corporate Business, CB = Large Corporate Business, ME = Medium Business, SM = Small & Micro Business , FICO = Fair Isaac Corporation
Formula Lending
• Application Score• FICO Score• Bureau information/Credit history• Debt service capacity (except Credit Card)• LTV (only housing loan/secured consumer)
SME Credit and Housing Loan Approval Processing Dept.Credit Underwriting Dept.
40
Credit Bureau Summary
Two Types of Credit Reports Offered by NCB:
Consumer credit report for individuals
Commercial credit report for businesses
Credit report (monthly reported by members)
Customer information (Name, address, identification number, birth date, occupation, etc.)
Credit information (History of application, approval history, loan payment history, etc.)
Data Record of Credit Report
Individuals: Credit report remains on file for 3 years
Businesses: Credit report remains on file for 5 years
Members: Financial institutions including commercial banks, specialized financial institutions (SFIs), non-bank financial institutions, finance companies, securities companies, insurance companies, etc.
KBank PracticeNational Credit Bureau (NCB)*
Note: * The concept of a credit bureau started in 1961 and central credit registration started in 1964. The Central Information Service was established in 1999 and its name was changed to Central Credit Information Service in 2000 and to the National Credit Bureau in 2005
KBank’s customers applying for loans
Corporate Business
Multi-Corporate Business
Large Corporate Business
Required to
4 Customer Segment in Retail (HN, AF, MI and MA)
Retail Business
Reject application
Sign agreement to allow the Bank to get credit report from NCB
Good credit
Small & Micro
Business
Medium Business
SME
Reject application
Required to (Large companies normally have reliable financial statements)
Optional to
Poor credit Good credit Poor credit
KBank’s Policy
Lending
KBank’s Credit
Scoring

41
KBank: Financial Performance
42
Consolidated 2012 1Q13 2Q13 3Q13 4Q13 2013
Net Profit (Bt bn) 35.26 10.11 10.98 10.71 9.53 41.33Profitability
- NIM 3.58% 3.49% 3.52% 3.52% 3.60% 3.55%
- ROE 20.76% 21.23% 22.17% 20.94% 17.80% 20.45%
- ROA 1.86% 1.93% 2.03% 1.92% 1.68% 1.89%
- YTD Loan growth 9.57% 2.19% 4.78% 6.51% 8.46% 8.46%
- YoY Loan growth 9.57% 11.12% 10.67% 9.77% 8.46% 8.46%
- YoY net fee income growth 18.56% 29.52% 23.63% 20.64% 9.67% 20.34%
- YoY non-interest income growth 19.72% 16.72% 21.39% 20.09% 14.61% 18.24%
Cost control
- Cost to income 45.00% 40.02% 42.65% 43.63% 48.40% 43.74%
Asset quality
- NPL ratio 2.16% 2.09% 2.13% 2.13% 2.11% 2.11%
- Coverage ratio 131.83% 138.62% 133.93% 132.85% 134.52% 134.52%
Loans to Deposits 95.35% 94.92% 94.76% 91.03% 94.06% 94.06%
Tier 1 Ratio (Bank Only)** 10.43% 11.08%** 11.44%** 12.51%** 12.02%** 12.02%**
CAR (Bank Only)** 15.98% 15.44%** 15.71%** 16.72%** 15.25%** 15.25%**
2013 Performance Highlights2013 net profit rose 17.20% YoY, driven by both net interest income and non-interest income
Loans grew 8.46% YoY from all business segments: Corporate, SME, and Retail
High NIM maintained; focus on high yield lending markets
Net fee income continued to grow due to customer-centric strategy; growth entails strengthening acquisition, retention, and cross-selling capabilities
2013 cost to income ratio was at 43.74%; cost to income ratio in 2014 will range in the mid-40s
Manageable NPLs, with high coverage ratio maintained
Strong capital base maintained
Note: * Under Bank of Thailand regulations, net profit in the first half of the year is counted as capital after approval by the Board of Directors as per Bank regulations. Net profit in the second half of the year is counted as capital after approval of the GeneralMeeting of Shareholders. However, when a net loss occurs, the capital must be reduced immediately.
** Capital Adequacy Ratio (CAR) has been reported in accordance with Basel III Capital Requirement from 1 January 2013 onwards.For KASIKORNBANK FINANCIAL CONGLOMERATE, as of 2013, Tier 1 = 12.57%, Tier 2 = 3.21%, and CAR = 15.78%.
KASIKORNBANK FINANCIAL CONGLOMERATE means the company under the Notification of the Bank of Thailand re: Consolidated Supervision, consisting of KBank, K Companies and subsidiaries operating in supporting KBank, Phethai Asset Management Co., Ltd. and other subsidiaries within the permitted scope of the BOT’s to be a financial conglomerate

43
Consolidated Financial Statements
KBank acquired additional ordinary shares in MTGH, to hold a 51% stake valued at Bt7,529mn; the MTGH Acquisition was completed on November 30, 2009. As the MTGH acquisition was completed on November 30, 2009, the Bank’s consolidated financial statements from 2010 include the performance of companies in the MTGH Group for the whole year.
Statements of Comprehensiv e Income (Bt mn)
2011* 2012 1Q13 2Q13 3Q13 4Q13 2013
Interest income 83,693 96,174 25,088 26,053 27,158 27,927 106,226
Interest expenses 27,202 32,593 7,883 8,121 8,641 8,783 33,428
Interest income - net 56,491 63,581 17,205 17,931 18,517 19,144 72,797Fee and service income 26,072 31,429 9,037 9,241 9,419 9,549 37,246
Fee and service expenses 5,435 6,961 1,901 1,867 1,899 2,136 7,803
Fee and serv ice income - net 20,637 24,467 7,136 7,374 7,519 7,413 29,443
Total operating income 122,216 144,495 40,575 42,541 43,295 43,224 169,635Underwriting expenses 31,707 40,190 11,872 11,971 12,396 12,446 48,685
Total operating income - net 90,508 104,305 28,703 30,569 30,899 30,779 120,950
Total other operating expenses 43,019 46,934 11,488 13,037 13,482 14,896 52,903Impairment loss of loans and debt securities 7,346 8,390 3,525 2,200 2,983 3,035 11,743
Operating profit before income tax expenses 40,144 48,981 13,690 15,332 14,433 12,848 56,303Income tax expenses 13,962 11,136 2,743 3,335 2,778 2,601 11,457
Net profit attributable:
Equity holders of the Bank 24,226 35,260 10,106 10,979 10,713 9,527 41,325 Non-controlling interest 1,957 2,585 842 1,018 942 720 3,522
Statements of Financial Position (Bt mn)2011 2012 1Q13 2Q13 3Q13 4Q13 2013
Loans to customers (less deferred revenue) 1,210,834 1,326,732 1,355,747 1,390,135 1,413,050 1,438,978 1,438,978Total Assets 1,722,940 2,077,442 2,109,967 2,225,152 2,240,034 2,290,045 2,290,045Deposits 1,242,229 1,391,380 1,428,318 1,467,058 1,552,217 1,529,835 1,529,835Total Liabilities 1,555,974 1,876,621 1,896,632 2,007,654 2,013,315 2,053,038 2,053,038Total Equity attributable to equity holders of the Bank 154,799 184,946 195,877 200,250 209,058 219,232 219,232
Notes:
* In accordance with the corporate income tax rate reduction from 30% of taxable profit to 23% in 2012 and 20% in 2013, KBank recognized a one-time Bt1.9bn impact to the 4Q11 income statement due to deferred tax item adjustments; there was no affect on the business undertakings, profitability, or capital fund of the Bank and its subsidiaries
44
Earnings Before Provision and Tax (EBPT) and Net Profit
37.1430.20
47.49
57.37
68.05
0
10
20
30
40
50
60
70
2009 2010 2011 2012 2013
(Bt bn)
December 2013 (Consolidated)
EBPT Net Profit
2009 2010 2011* 2012 2013 1Q13 2Q13 3Q13 4Q13
EBPT (Bt bn) 30.20 37.14 47.49 57.37 68.05 17.22 17.53 17.42 15.88
EBPT Growth (% YoY) n.a. 22.97% 27.86% 20.81% 18.61% 18.65% 21.32% 16.34% 18.17%
Net Profit (Bt bn) 14.73 20.05 24.23 35.26 41.33 10.11 10.98 10.71 9.53
Net Profit Growth (% YoY) n.a. 36.07% 20.85% 45.55% 17.20% 12.44% 17.21% 16.29% 23.85%
* In accordance with the corporate income tax rate reduction from 30% of taxable profit to 23% in 2012 and 20% in 2013, KBank recognized a one-time Bt1.9bn impact to the 4Q11 income statement due to deferredtax items adjustment; there was no affect on the business undertakings, profitability, or capital fund of the Bank and its subsidiaries
Note:
**
EBPT and net profit in 2013 grew 18.6% and 17.2% YoY, respectively
20.0514.73
24.23
35.26
41.33
0
10
20
30
40
50
2009 2010 2011 2012 2013
(Bt bn)

45
12.7915.73 16.72
20.4520.76
0
4
8
12
16
20
24
2009 2010 2011 2012 2013
(%)
1.101.38 1.48
1.891.86
0.00
0.50
1.00
1.50
2.00
2.50
2009 2010 2011 2012 2013
(%)
2009 2010 2011* 2012 2013 1Q13 2Q13 3Q13 4Q13
ROA (%) 1.10 1.38 1.48 1.86 1.89 1.93 2.03 1.92 1.68
ROE (%) 12.79 15.73 16.72 20.76 20.45 21.23 22.17 20.94 17.80
Note:
ROA and ROE
ROA ROE
December 2013 (Consolidated)
* In accordance with the corporate income tax rate reduction from 30% of taxable profit to 23% in 2012 and 20% in 2013, KBank recognized a one-time Bt1.9bn impact to the 4Q11 income statement due to deferredtax items adjustment; there was no affect on the business undertakings, profitability, or capital fund of the Bank and its subsidiaries
**
46
Net Interest Margin
3.23 3.48 3.553.583.75
0
1
2
3
4
5
2009 2010 2011 2012 2013
(%) (%)
NIM
December 2013 (Consolidated)
Note: * Cost of deposits including contributions to the Financial Institutions Development Fund (FIDF) and Deposit Protection Agency (DPA)
Yield on Loans
Yield on Earnings Assets
Cost of Fund
Cost of Deposit*
Yield on Earnings Assets and Cost of Fund
NIM was 3.55% in 2013, remaining the highest level among large commercial banksNIM position will be maintained, focusing on the high-yield lending market; pressure from rising competition will remain
5.185.424.63
5.55
5.245.94
6.24 6.37
1.932.142.08
1.321.891.991.70
1.050
2
4
6
8
2010 2011 2012 2013
2009 2010 2011 2012 2013 1Q13 2Q13 3Q13 4Q13
NIM (%) 3.23 3.48 3.75 3.58 3.55 3.49 3.52 3.52 3.60
Yield on Earnings Assets (%) n.a. 4.63 5.55 5.42 5.18 5.09 5.11 5.16 5.24Yield on Loans (%) n.a. 5.24 5.94 6.24 6.37 6.26 6.29 6.44 6.46
Cost of Fund (%) n.a. 1.32 2.08 2.14 1.93 1.89 1.89 1.95 1.97
Cost of Deposit (%), incl DPA n.a. 1.05 1.70 1.99 1.89 1.81 1.82 1.92 1.93

47
72.80
63.5856.49
39.8646.74
0
20
40
60
80
2009 2010 2011 2012 2013
Interest Income - net
(Bt bn)106.23
96.17
62.27
83.69
15.5327.20
32.59 33.43
0
20
40
60
80
100
120
2010 2011 2012 2013Interest Income Interest Expenses
(Bt bn)
Interest Income - net
Interest Income and Interest Expenses Interest Income- net
December 2013 (Consolidated)
Note: KBank acquired additional ordinary shares in MTGH, to hold a 51% stake valued at Bt7,529mn; the MTGH Acquisition was completed on November 30, 2009. As the MTGH acquisition was completed on November 30, 2009, the Bank’s consolidated financial statements from 2010 include the performance of companies in the MTGH Group for the whole year.
2013 net interest income grew 14.50% YoY
2009 2010 2011 2012 2013 1Q13 2Q13 3Q13 4Q13
Interest Income (Bt bn) n.a. 62.27 83.69 96.17 106.23 25.09 26.05 27.16 27.93
Interest Expenses (Bt bn) n.a. 15.53 27.20 32.59 33.43 7.88 8.12 8.64 8.78
Interest Income - net (Bt bn) 39.86 46.74 56.49 63.58 72.80 17.21 17.93 18.52 19.14
Interest Income - net (% Growth YoY) n.a. 17.28% 20.85% 12.55% 14.50% 15.33% 15.95% 14.27% 12.65%
48
15%
2%0.04%2%
18%16%
60%61%
0
10
20
30
40
50
2010 2011 2012 2013
Other Operating Income
Fee and Service Income - net
Net Premium Earned - net*
Dividend Income
Share of Profit from Investmentson Equity Method
Gain on Investment
Gain on Trading and FXtransactions
4%
2%
64%
0.02%2%
14%
12%2%
2%
20%
61%
0.4%
16%
2%
14%
3%
2%
0.05%
3%
2%
1.621.95 2.08 2.14 2.21
0
1
2
3
4
2009 2010 2011 2012 2013
(%)
4039383835
0
10
20
30
40
50
60
2009 2010 2011 2012 2013
(%)
Non-interest Income and StructureNon-interest Income to Average Assets
Non-interest Income Ratio**
Non-interest Income Structure
2009 2010 2011 2012 2013 1Q13 2Q13 3Q13 4Q13Non-interest Income (Bt bn) 21.68 28.40 34.02 40.72 48.15 11.50 12.64 12.38 11.64
Non- interest Income Growth (%YoY) n.a. 30.97 19.78 19.72 18.24 16.72 21.39 20.09 14.61
Non- interest Income Ratio (%) 35.23 37.79 37.58 39.04 39.81 40.06 41.34 40.07 37.80
December 2013 (Consolidated)
Note: * Net Premium Earned - net = Net Premium Earned less Underwriting expense** Non-interest income ratio = Non-interest income / Total operating income-net
(Bt bn)
28.40
34.02
Non-interest income continued to grow, mainly from net fee income and life insurance earned premium
40.72
48.15

49
24%23%23%24%
26%
0
10
20
30
2009 2010 2011 2012 2013
(%)29.44
24.47
18.2315.94
20.64
0
10
20
30
2009 2010 2011 2012 2013
(Bt bn)
Net Fee IncomeDecember 2013 (Consolidated)
Net Fee Income to Net Total Operating IncomeNet Fee Income
2009 2010 2011 2012 2013 1Q13 2Q13 3Q13 4Q13Fee Income (Bt bn) 19.54 22.82 26.07 31.43 37.25 9.04 9.24 9.42 9.55Fee Income-net (Bt bn) 15.94 18.23 20.64 24.47 29.44 7.14 7.37 7.52 7.41
Fee Income Growth (%YoY) n.a. 16.77 14.25 20.55 18.51 26.19 20.53 18.73 10.18Net Fee Income Growth (%YoY) n.a. 14.36 13.22 18.56 20.34 29.52 23.63 20.64 9.67
Net Fee Income to Net Operating Income (%) 25.90 24.26 22.80 23.46 24.34 24.86 24.12 24.34 24.09
2013 net fee income grew 20.34% YoY, driven by a rise in card business, mutual fund business and brokerage business in line with market growthNet fee income growth will continue to be helped by the cross-selling capabilities of our customer-centric strategyNet fee income to net total operating income was 24% in 2013Consolidated net fee income reflects the accounting treatment following the MTGH consolidation; Bancassurance fees were not included
50
Others10%
Bancassurance16%
Trade Finance6%
Cash Management
5%
Commercial Credit24%
Transaction Services
24%
Credit Card Business
15%
Credit Card Business
Transaction Services
Commercial Credit
Cash Management
Trade Finance
Bancassurance
Others
Net Fee Income Structure (Bank only)
Net Fee Income by Product
Loan Related and Non-loan Related Fees - net
Loan related24%
Non-loan related76%
(mainly from credit card merchant fees)
(such as ATM & debit cards, bill payments, money transfers, etc.)
(such as mutual funds, securities services, capital market business, etc.)
(mainly from commercial credit related fees)
(such as fees from payroll accounts)
(fee income obtained from selling Bancassurance products)
Note: - On the consolidated basis, Bancassurance fees are not
included, due to the elimination of inter-company transactions (the accounting treatment from the Muangthai Group Holding consolidation)
- On the consolidated basis, Net Premium Earned - net (Net Premium Earned Less Underwriting Expenses) from Muang Thai Life Assurance (MTL) is reported as a part of non-Interest Income; KBank has a 38.25% economic interest in MTL
December 2013

51
9.73
7.33
5.41
0.26
3.87
0
5
10
15
20
2009 2010 2011 2012 2013
Net Premium Earned - net
(Bt bn)58.41
47.52
37.12
2.20
29.09
1.94
25.22
31.71
40.19
48.69
0
20
40
60
2009 2010 2011 2012 2013
Net Premium Earned Underwriting Expenses
(Bt bn)
Net Premium Earned - net
Net Premium Earned and Underwriting Expenses Net Premium Earned – net
December 2013 (Consolidated)
Note: KBank acquired additional ordinary shares in MTGH, to hold a 51% stake valued at Bt7,529mn; the MTGH Acquisition was completed on November 30, 2009. As the MTGH acquisition was completed on November 30, 2009, the Bank’s consolidated financial statements from 2010 include the performance of companies in the MTGH Group for the whole year.
2009 2010 2011 2012 2013 1Q13 2Q13 3Q13 4Q13
Net Premium Earned (Bt bn) 2.20 29.09 37.12 47.52 58.41 14.10 14.82 14.98 14.51
Underwriting Expenses (Bt bn) 1.94 25.22 31.71 40.19 48.69 11.87 11.97 12.40 12.45
Net Premium Earned - net (Bt bn) 0.26 3.87 5.41 7.33 9.73 2.23 2.85 2.59 2.07
Net Premium Earned - net (% Growth YoY) n.a. n.a. 39.84 35.41 32.79 22.17 47.24 27.88 33.70
Net Premium Earned - net = Net Premium Earned less Underwriting Expense
52
Other Operating ExpensesOther Operating Expenses Structure
December 2013 (Consolidated)
46%46%43%
21%22%
23%
8%7%
7%0.3%
0.2%0.2%
25%
25%27%
3%
0
10
20
30
40
50
60
2010 2011 2012 2013
Impairment on ApplicationSoftware & Related Expenses
Others
Directors' remuneration
Taxes & Duties
Premises & Equipment
Employee's expenses
44%
20%
7%
25%
0.2%38.00
43.0246.93
(Bt bn) 52.90
2013 other operating expenses rose 12.72% YoY, the majority came from other promotion, advertising and marketing expenses, and employee expensesIn 2Q13, the Bank set the allowance for impairment on application software and related expenses at Bt1.6bn as a result of changes to some parts of the deposit core banking development under the K-Transformation Strategic Project; in addition, the Bank has made a reversal of estimate for loss sharing for asset management amounting to Bt1.1bn by Thai Asset Management Corporation (TAMC)
2009 2010 2011 2012 2013 1Q13 2Q13 3Q13 4Q13Other Operating Expenses (Bt bn) 31.34 38.00 43.02 46.93 52.90 11.49 13.04 13.48 14.90
% Growth (YoY) n.a. 21.27 13.20 9.10 12.72 11.97 14.10 16.79 8.69

53
14.4312.43
9.578.46
0
5
10
15
20
2010 2011 2012 2013
(%)
Loan Growth December 2013 (Consolidated)
Loans grew sensibly at 8.46% YoY from all business segments: Corporate, SME, and Retail
Loan Growth (% YoY)
2010 2011 2012 2013 1Q13 2Q13 3Q13 4Q13Loans (Bt bn) 1,077 1,211 1,327 1,439 1,356 1,390 1,413 1,439
Loan Growth (% YoY) 14.43 12.43 9.57 8.46 11.12 10.67 9.77 8.46
Loan Growth (% YTD) 14.43 12.43 9.57 8.46 2.19 4.78 6.51 8.46
54
31%31%
36%36%
26%26%
7%7%
0
500
1,000
1,500
2012 2013
Corporate Loans SME Loans Retail Loans Other Loans
(Bt bn)1,327 1,439
Loan Structure and Loan Growth Targets
(Amount in Bt bn) Dec 12** Y2012 Dec 13 Y2013 2013 Y2014Loan Loan Yield Loan Growth
Growth Growth Range Target (%)(%) (%) (%)
1) Corporate 416 5.5 443 6.7 4-6 6-8Multi-Corporate Business 203 5.2 220 8.3Large Corporate Business 212 5.8 223 5.2
2) SME 469 8.7 521 10.9 7-8 9-11Medium Business 260 1.9 277 6.6Small and Micro Business 207 18.5 241 16.9
3) Retail 347 16.0 382 10.3 6-7 10-134) Others 95 10.8 93 (2.9)Total Loans 1,327 9.6 1,439 8.5 6.4 9-11
December 2013 (Consolidated, TFRS 8: Operating Segments*)
Loan Portfolio Structure Loan Structure, Loan Yield and Loan Growth Targets
** December 2012 loan base is not comparable with previous reports, due to customer migration to larger segments and changes to comply with TFRS 8
Loan Definition (TFRS 8: Operating Segments)Corporate Loans: Loans of KBank and KBank’s Subsidiaries in Corporate Segments (Annual sales turnover > Bt400mn)SME Loans: Loans of KBank and KBank’s Subsidiaries in SME Segments (Annual sales turnover ≤ Bt400mn)Retail Loans: Loans of KBank and KBank’s Subsidiaries in Retail SegmentsOther Loans: Loans in Enterprise Risk Management Division (NPL + Performing Restructured Loans), and other loan types
Note: * Since 1Q13, as per the Bank of Thailand’s requirement, the Bank has complied with TFRS 8 (Operating Segments) to present operating results for each key segment in financial reports

55
Loan by Retail Products December 2013 (Consolidated, TFRS 8: Operating Segments*)
Loan Definition (TFRS 8: Operating Segments)Housing Loans: KBank’s housing loans to retail customer segmentsCredit Cards: KBank’s credit card loans to all eight customer segmentsConsumer Loans: KBank’s consumer loans to retail customer segmentsKLeasing: KLeasing’s loans to all eight customer segments
(Amount in Bt bn) Dec 12** Y2012 Dec 13 Y2013 % Portion
Loan Loan to
Growth Growth Total Loan(%) (%)
Housing Loans 203 10.1 215 5.5 14.9Credit Cards 54 27.7 66 21.8 4.6Consumer Loans 37 38.7 44 17.8 3.1KLeasing 83 29.8 89 7.7 6.2
Note: * Since 1Q13, as per the Bank of Thailand’s requirement, the Bank has complied with TFRS 8 (Operating Segments) to present operating results for each key segment in financial reports
Loan by Retail Products
** December 2012 loan base is not comparable with previous reports, due to customer migration to larger segments and changes to comply with TFRS 8
56
6 months and over16.0%
Immediate Repricing61.0%
< 6 months11.5%
Other11.5%
48.4%48.9%51.2%54.3%55.4%
6.5%6.5%6.2%5.7%
6.3%10.8%
13.1%13.0%12.4%
10.7%
15.7%16.0%16.0%
15.5%14.0%
13.9%13.1%
11.6%
11.4%
10.9%
0
200
400
600
800
1,000
1,200
1,400
1,600
2009 2010 2011 2012 1H13
OthersHousing LoansUtilities & ServicesReal Estate & Construction
Manufacturing & commerceAgricultural and mining
(Bt bn)
2.7% 2.5%
942
1,077
2.5%
1,211
2.4%
1,327
2.3%
1,390
Loan Portfolio Breakdown by Industry, Currencies, and Interest Rate Consolidated
Loan Portfolio by Industry (June 2013)*
Definition of Loans1) by industry = Gross loans = Loans to customers less deferred revenue2) by top 20 borrowers = Loans excluding the wholly-owned subsidiaries of KBank and Phethai Asset
Management Company 3) by currency = Loans to customers and AIR - net4) by maturity of interest repricing = Loans to customers less deferred revenue
By Maturity of Interest Repricing (June 2013)*
By Currencies (June 2013)*
Note:
Thai Baht92.46%
US Dollar6.60%
Other Currencies0.94%
* The data as of December 2013 is not available until the release of the audited financial statements** The information on loans breakdown by currencies and maturity of interest repricing are disclosed on half year basis

57
134.52131.83127.12111.02
91.64
0
50
100
150
2009 2010 2011 2012 2013
3.762.91
2.45 2.16 2.11
0
2
4
6
8
2009 2010 2011 2012 2013
Asset QualityDecember 2013 (Consolidated)
NPL Ratio(%)
Coverage Ratio(%)
2009 2010 2011 2012 2013 1Q13 2Q13 3Q13 4Q13
NPL Ratio (%) 3.76 2.91 2.45 2.16 2.11 2.09 2.13 2.13 2.11
Coverage Ratio (%) 91.64 111.02 127.12 131.83 134.52 138.62 133.93 132.85 134.52
NPL ratio was 2.11% in 2013Coverage ratio was 134.52%; this ratio has been maintained above 100% since 2Q10
58
85666466
102
0
50
100
150
2009 2010 2011 2012 2013
9.38
6.707.35
8.39
11.74
0
4
8
12
2009 2010 2011 2012 2013
Impairment Loss of Loans and Debt Securities (Provision) and Credit CostDecember 2013 (Consolidated)
Impairment Loss of Loans and Debt Securities Credit Cost
2009 2010 2011 2012 2013 1Q13 2Q13 3Q13 4Q13Impairment Loss of Loans and Debt Securities (Bt bn) 9.38 6.70 7.35 8.39 11.74 3.53 2.20 2.98 3.04
Credit Cost (bps) 102 66 64 66 85 105 64 85 85
(Bt bn) (bps)
In 2013, KBank set aside a higher provision expense, partially to serve as a countercyclical provision to prepare the Bank for any potential future economic downturn or changing economic circumstance, both domestic and abroad
Credit cost was 85bps in 2013

59
0.0
10.0
20.0
Write-off 11.6 8.7 4.3 5.5 4.3 3.9 5.0 10.3
2006 2007 2008 2009 2010 2011 2012 2013
17%26%22%24%22%27%38% 22%
83%62%
73%78%
76% 78% 74% 78%
0
20
40
60
80
100
2006 2007 2008 2009 2010 2011 2012 2013
% of Performing Restructured loans to Restructured loans
% of Non-Performing Restructured loans to Restructured loans
Bad Assets Resolution
(Bt bn)
December 2013 (Consolidated)
Outstanding Foreclosed Properties
Note: * Accrued interest receivables included
(Bt bn)
2001-2004: KBank sold NPLs totaling Bt14.6bn* to TAMC
2007: KBank and Phethai AMC sold NPLstotaling Bt11.4bn to Standard Bank Asia Limited and Morgan Stanley Emerging Markets Inc. at Bt7.6bn and Bt3.8bn, respectively
2008-2013: NPLs continue to decline without bulk NPL sales
Write-offs NPL Portfolio Sales Sale of Foreclosed Properties
Restructured Loans
(Bt bn)
52.33
67.01
77.1974.50
% of Restructured loans to Total loans
Outstanding Restructured Loans was Bt85.83bn in 2013; 83% were performing restructured loans Definition: Outstanding Restructured Loans is the accumulated outstanding amount of restructured loans, comprised of performing restructured loans and non-performing restructured loans. Non-performing restructured loans are already counted as part of Non-Performing Loans (NPLs)
Restructured loans
61.51
76.7082.38
9.1%6.9% 7.4%
8.2%6.9% 6.3% 6.2% 5.9%
0%
4%
8%
12%
16%
2006 2007 2008 2009 2010 2011 2012 2013
12.5
15.115.9
18.717.3
16.1 16.7
0
5
10
15
20
2006 2007 2008 2009 2010 2011 2012 2013
(Bt bn)
12.1
85.83
4.14.85.6
7.2
5.05.65.45.06.0
0
2
4
6
8
10
2005 2006 2007 2008 2009 2010 2011 2012 2013
60
85% 83% 78%
79%81%6% 8% 12%
11%
10%
4%
4%
4%
5% 3%5%
6%
4% 6%
5%0.4%
0.5%
0.1%0.3%0.1%
0
100
200
300
400
500
600
2009 2010 2011 2012 2013Other Investment (Investments in Receivables, Investments in Subsidiaries and Other Investments)Equity InvestmentForeign BondsCorporate BondsGovernment & State Enterprise Bonds
(Bt bn)
255 251 264
382
80%
497
Investment in Securities Portfolio and Structure
Note: Accounting for investments 1) Trading: Stated at fair value (FV). Unrealized gains or losses arising from changes in FV are recognized in the income statement 2) AFS: Stated at FV. Unrealized gains or losses arising from revaluation are reflected in the equity 3) HTM: Stated at amortized cost, after deduction of any allowance for impairment
December 2013 (Consolidated)
Instrument Type Holding Type
KBank continues to manage its investment portfolio to reflect the BOT's interest rate trend and enhance risk adjusted returns
2009 2010 2011 2012 2013 1Q13 2Q13 3Q13 4Q13
Investment Portfolio (Bt bn 254.98 251.22 264.29 382.33 496.93 342.18 440.18 461.19 496.93
% Growth (YoY) 147.69 (1.48) 5.21 44.66 29.97 (8.09) 15.70 23.08 29.97
3% 6% 2% 2% 2%
73%65% 64%
68% 68%23% 28% 33%
29%
29%
1%0.1%
0.7%
0.4%0.1%
0.1% 0.1%
0.04%
0.07%
0
100
200
300
400
500
600
2009 2010 2011 2012 2013
Trading Available-for-sales Held-to-maturity
General Investment in Receivables Investments Subsidi
(Bt bn)
255251 264
382497
0.4%
0.4%
0.3%
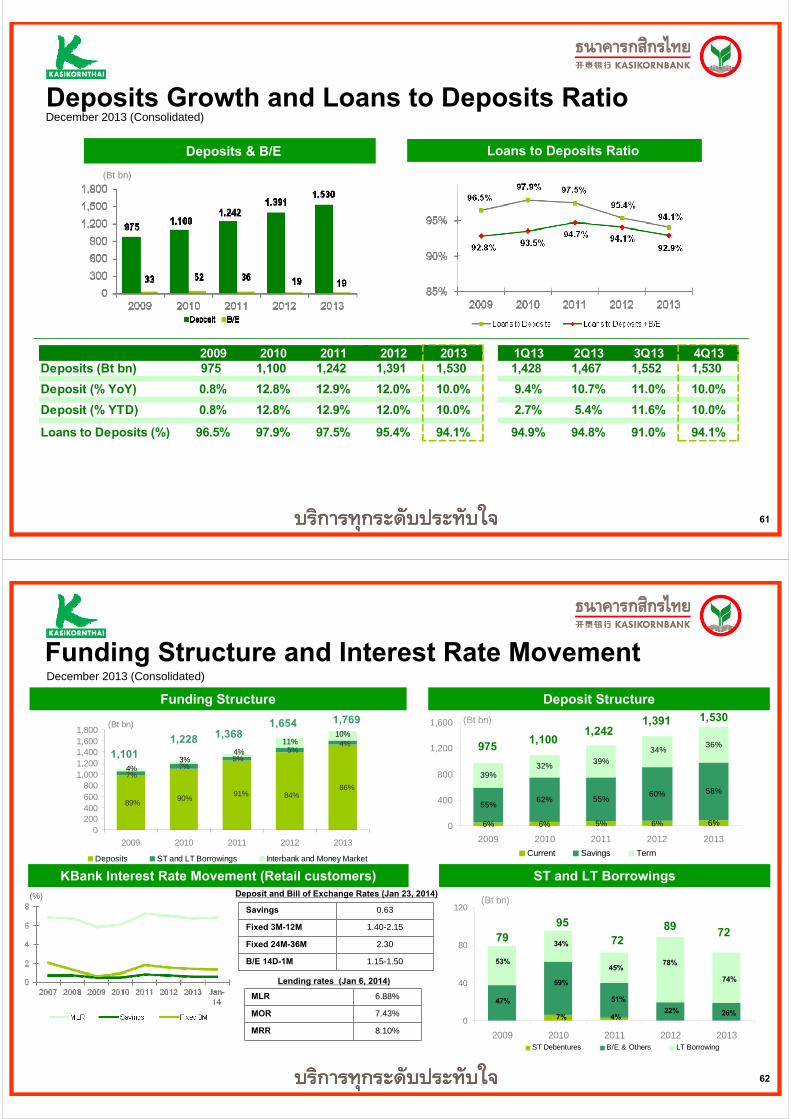
61
Deposits Growth and Loans to Deposits Ratio
Deposits & B/E Loans to Deposits Ratio
December 2013 (Consolidated)
(Bt bn)
2009 2010 2011 2012 2013 1Q13 2Q13 3Q13 4Q13Deposits (Bt bn) 975 1,100 1,242 1,391 1,530 1,428 1,467 1,552 1,530
Deposit (% YoY) 0.8% 12.8% 12.9% 12.0% 10.0% 9.4% 10.7% 11.0% 10.0%
Deposit (% YTD) 0.8% 12.8% 12.9% 12.0% 10.0% 2.7% 5.4% 11.6% 10.0%
Loans to Deposits (%) 96.5% 97.9% 97.5% 95.4% 94.1% 94.9% 94.8% 91.0% 94.1%
62
6% 6% 5% 6% 6%
55%62% 55%
60% 58%
39%32%
39%
34%36%
0
400
800
1,200
1,600
2009 2010 2011 2012 2013
Current Savings Term
975
(Bt bn)
1,1001,242
1,391 1,530
0
40
80
120
2009 2010 2011 2012 2013ST Debentures B/E & Others LT Borrowing
(Bt bn)
9579 72
89 72
22%
78%45%
51%
4%
34%
59%
7%
53%
47%
74%
26%
Deposit Structure
Funding Structure and Interest Rate Movement
ST and LT Borrowings
Funding Structure
KBank Interest Rate Movement (Retail customers)
Savings 0.63
Fixed 3M-12M 1.40-2.15
Fixed 24M-36M 2.30
B/E 14D-1M 1.15-1.50
MLR 6.88%
MOR 7.43%
MRR 8.10%
Deposit and Bill of Exchange Rates (Jan 23, 2014)
Lending rates (Jan 6, 2014)
(%)
December 2013 (Consolidated)
89%90%
91% 84%86%
7%7%
5%5%
4%
4%3%
4%11%
10%
0200400600800
1,0001,2001,4001,6001,800
2009 2010 2011 2012 2013
Deposits ST and LT Borrowings Interbank and Money Market
(Bt bn)
1,1011,228 1,368
1,654 1,769

63
Long-term Senior/Subordinated DebenturesIssued Date
Name Type Embedded Option
AmountMaturity
Years
Interest Rate
(Per annum)
Interest Payment period
Credit Rating
Thai Currency Long-term Senior/Subordinated Debentures
15/02/2012 Subordinated debentures of
KASIKORNBANK PCL
No.1/2555
Unsecured Callable
after
5 years
Bt22,000mn 10 Years
(15/02/2022)
4.5% Quarterly AA- (tha)
by Fitch Ratings
and axA by S&P
22/06/2010 Subordinated debentures of
KASIKORNBANK PCL
No.1/2553
Unsecured Callable
after
5 years
Bt7,500mn 10 Years
(22/06/2020)
4.5% Quarterly AA- (tha)
by Fitch Ratings
17/07/2009 Subordinated debentures of
KASIKORNBANK PCL
No.1/2552
Unsecured Callable
after
5 years
Bt600mn 10 Years
(17/07/2019)
Year 1-3: 4.85%
Year 4-7: 5.25%
Year 8-10: 5.75%
Quarterly AA- (tha)
by Fitch Ratings
Foreign Currency Long-term Senior/Subordinated Debentures
20/09/2012 Senior Unsecured Debentures of
KASIKORNBANK PCL
Unsecured - USD500mn* 5.5
(20/03/2018)
3.0% Semi-annually
A3 by Moody’s
BBB+ by S&P
and BBB+ by
Fitch Ratings
21/08/1996 Subordinated debentures of
KASIKORNBANK PCL
Unsecured - USD183.31mn 20
(21/08/2016)
8.25% Semi-annually
BBB by S&P
Baa3 by Moody’s
Note: *The issued noted is drawn down from the Bank’s USD2.5bn Euro Medium Term Note Programme
64
KBank: The wholly-owned subsidiaries, and
Muang Thai Life Assurance

65
The wholly-owned subsidiaries of KBank: Business Profile and AspirationDecember 2013
* In February 2012, KBank and Macquarie signed an Exclusive Strategic Alliance (ESA) covering a range of investment banking and securities operations; KSecurities and Macquarie Securities (Thailand) are traded under a new ticket called KSMACQ
KAsset
EST. 1992
KResearch
EST. 1995KSecurities*EST. Jul 2005
KLeasingEST. Aug 2005
KF&EEST.1990
Company Name
KASIKORN ASSET MANAGEMENT CO., LTD.
KASIKORN RESEARCH CENTER CO., LTD.
KASIKORN SECURITIES PCL KASIKORN LEASING CO., LTD.
KASIKORN FACTORY AND EQUIPMENT CO., LTD.
Company Profile
A leader in fund management business (i.e. mutual funds, provident funds, and private funds)
Professional in providing knowledge in economics, business, money, and banking
Only research house which is an affiliate of a bank
Professional in providing a complete range of professional and excellent financial solutions and services, including investment banking, securities underwriting, and securities brokerage
Professional in providing three core products: hire purchase, financial lease,
and floor plan
Professional in providing a complete range of machinery and equipment leasing services
Asset Size Bt1.75bn Bt0.06bn Bt10.69bn Bt87.62bn Bt11.29bn
Market Share 22.31**% (#1) N/A 6.02% (#2)* 7% (as of 3Q13) N/A
2014 Targets #1 in overall market
Top of mind research house for media and for the clients of KBank and
its wholly-owned subsidiaries
Maintain leading position in securities business
10-13% YoY growth on outstanding loans
9-11% YoY growth on outstanding loans
3-year Aspiration
Maintain #1 position Top of mind research house
Maintain position as a leading securities firm
Maintain leading position in equipment leasing industry
** KAsset’s market share is based on the AUM of mutual funds as of December 2013, and AUM of provident fund and private fund as of November 2013
66
1.19 1.431.84
2.25
3.23
0
1
2
3
4
2009 2010 2011 2012 2013
The wholly-owned subsidiaries of KBank: Y2013 Key Operating Performance
The wholly-owned subsidiaries of KBank: Net Profit
Net profit continues to rise, along with synergy among KBank and its wholly-owned subsidiaries
(Bt bn)
Since January 1, 2011, financial statements have been reclassified per the Bank of Thailand’s requirements; the 2010 financial statements were restated and adjusted for comparison purposes; in 4Q10, KBank early adopted TAS 19 (Employee Benefits) and TAS 12 (Income Taxes) to align with international practices and standards; 2009 financial statements were restated for comparison purposes
Note:
* In February 2012, KBank and Macquarie signed an Exclusive Strategic Alliance (ESA) covering a range of investment banking and securities operations; KSecurities and MacquarieSecurities (Thailand) are traded under a new ticket called KSMACQ
KAsset
EST. 1992
KResearch
EST. 1995KSecurities*EST. Jul 2005
KLeasingEST. Aug 2005
KF&EEST.1990
2013 Key Operating Performance
Assets Under Management (AUM)**: Bt943.65bn
(10.94% YoY)
Most quoted research house in the media
- Trading volume: Bt1.3trn
- Number of customers grew 63% YoY
Outstanding loans:
Bt89.22bn (7.67% YoY)
Outstanding loans:
Bt10.86bn (16.23% YoY)
December 2013

67
1,7562,228 2,167 2,576
2,883 3,0153,633 4,230
241 319 353 509635 742
851 944
0
2,000
4,000
2006 2007 2008 2009 2010 2011 2012 2013
0
500
1,000
Total Industry AUM KAsset AUM
KAsset Highlights in Y2013
(Bt bn)(Bt bn)
Provident Fund18%Private
Fund9% Mutual
Fund75%
KAsset AUM* Breakdown by Type
AUM (KAsset vs. Industry)
Market Share by AUM
22.019.5
11.09.0 7.8
30.6
24.6
19.3
12.08.9
5.9
29.3
23.4
18.3
11.88.3 7.2
30.9
22.3119.18
12.89
7.89 9.31
28.42
0
10
20
30
40
KAsset SCBAM KTAM MFC BBLAM Other
2010 2011 2012 2013
Industry Outlook:
Y2013 industry AUM* at Bt4.23trn, rising 16.44% YoY; KAsset AUM* at Bt943.65bn, growing 10.94% YoY
KAsset Highlights:
Continuously ranked #1 since 2009, with 22.31% market share in Y2013
Mutual fund accounts for 75% of KAsset AUM
(%)
December 2013
Note: * AUM is based on the AUM of mutual funds as of December 2013, and AUM of provident fund and private fund as of November 2013
68
KResearch Highlights in Y2013December 2013
Industry Outlook:
Only bank affiliated research house providing knowledge in economics, business, money, and banking
KResearch Highlights:
Most quoted research house in the media. Top of mind research house for media, and for the clients of KBank and its wholly-owned subsidiaries

69
7,967 8,544 7,962 8,640
12,377 12,486 13,772
21,551
41 91 117207
430 411 817
1,296
02004006008001,0001,2001,400
0
5,000
10,000
15,000
20,000
2006 2007 2008 2009 2010 2011 2012 2013
Total Industry Trading Volume KSMACQ Trading Volume
3.5 3.24.6 4.4 4.5
12.8
3.3 3.04.2 4.8 4.4
11.9
5.9
2.84.1 4.8 4.8
11.9
6.0
3.5 3.44.5 4.6
11.5
0
5
10
15
KSMACQ SCBS KTZ BLS TNS MBKET
2010 2011 2012 2013
KSecurities Highlights in Y2013
(Bt bn) (Bt bn)
KSecurities Revenue by Business
Trading Volume (KSecurities vs. Industry)
Market Share by Trading Volume(%)
CAGR’06-’13: 54%
Investment Banking
11%
Brokerage 89%
December 2013 Industry Outlook:
Y2013 industry trading volume* was Bt21.55trn, increasing 56% YoYKSMACQ** trading volume was Bt1.3trn
KSecurities Highlights:
KSMACQ** ranked #2, with 6.02% market share; maintained position as one of the leading securities firmsMajority of revenue came from brokerage
Number of customers grew 63% YoY, to 52,000 customers in 2013
* Industry trading volume excluding proprietary trade** In February 2012, KBank and Macquarie signed an Exclusive Strategic Alliance (ESA) covering a range of investment banking and securities operations; KSecurities and Macquarie
Securities (Thailand) are traded under a new ticket called KSMACQ
**
Note:
**
70
KLeasing Highlights in Y2013
(Thousand Units) (Bt bn)
KLeasing Outstanding Loans Breakdown**
KLeasing vs. Industry
KLeasing Highlights:
2013 KLeasing loans totaled Bt89.22bn, growing 7.67% YoY
NPL ratio remained in a very low single digit range, and better than industry average
Note: * Excluding captive and non-bank leasing ** Definition of loan type: Hire Purchase = car loans to retail customers; Fleet = a bulk of car loans to corporate and SME customers; Floor Plan = a bulk of car loans to car dealers
Market Share by Total Outstanding Loans (%)*
(%)
December 2013
Industry Outlook:
2013 industry car sales totaled 1,330,678 units, declining 7.35% YoY
Floor Plan6%Fleet /
Financial Lease25%
Hire Purchase
69%
37
18 15 12 11 8
35
18 15 12 11 8
34
17 16 14 11 8
35
18 14 15 11 7
35
18 15 15 10 7
0
25
50
TBANK AYCAL TISCO SCB KK KLeasing
2009 2010 2011 2012 3Q13
K-Car to Cash8.0%
Used Car
0.1%
New Car91.9%

71
KF&E Outstanding Loans
(Bt bn)
Industry Outlook:
Growth in Equipment Finance (EQF) business forecasted using numerous factors including total import volume and total registration volume of equipment and machinery from the Department of Industrial Works and Capital Investment Index
KF&E Highlights:
KF&E outstanding loans were Bt10.86bn, rising 16.23% YoY; Equipment Finance (EQF) was Bt10.60bn, rising 17.75% YoY
KF&E currently ranked #3; maintain the leading position in equipment leasing industry
Note: In 2010, KASIKORN FACTORING (KFactoring) was renamed KASIKORN FACTORY AND EQUIPMENT (KF&E) to better reflect their business, which is focused on offering leasing services for machinery and equipment; the factoring business operation of KFactoring was transferred to KBank
KF&E Highlights in Y2013December 2013
3.91
8.01
9.3410.86
0.0
2.0
4.0
6.0
8.0
10.0
2010 2011 2012 2013
72
26.3
12.5 12.5 10.7
8.9 7.4
5.8 3.8 2.9 1.4 7.8
24.4
14.0 12.3
10.6 9.6 8.2
5.5 3.1 2.8 2.2
7.3
-
5.0
10.0
15.0
20.0
25.0
30.0
AIA MTL TLI SCBLife BLA KTAL AZAY OLIC FWD PLT Others
2011 2012 9M13
133.1 151.1 166.8 173.3202.5 222.0
259.2296.3
328.6391.4
323.6
20
40
60
80
100
0
100
200
300
400
500
2003 2004 2005 2006 2007 2008 2009 2010 2011 2012 9M13
Total Premium First Year Premium
Market Share by Total Premium in Life Insurance (%)
Premium per % GDP by Country
(%)
Life Insurance Industry in Thailand
(%)
Size of Market by Premium(%)
CAGR’03-’12: 13%
Total Premium
(Bt bn)
First Year Premium
(Bt bn)
Source: The Thai Life Assurance Association
Source: The Thai Life Assurance Association
Source: Swiss Reinsurance
Note: Total Premium = New Business Premium + Renewal Premium; New Business Premium = First Year Premium + Single Premium
In 2012, low penetration rate of 3.0% in Thailand with a high opportunity for growth
Muang Thai Life Assurance (MTL) ranked #2 in life insurance industry in Thailand, in 9M13
#2 in total premium with 14.0% market share and 22% growth
#1 in new business premium with 18.7% market share and 28% growth
* First Year Premium in 9M13 = Bt 69.55 bn
*

73
Bancassurance Highlights in 3Q13The Bancassurance Life industry continued its positive trend in 9M13 with total premium growth of 26% and new business premium growth of 29%
MTL ranked #1 in Bancassurance market
#1 in Bancassurance total premium with 23.9% market share and 27% growth
#1 in Bancassurance new business premium with 25.7% market share and 27% growth
(%)
Bancassurance Market Share by Total Premium (%)
Bancassurance Market Share by New Business Premium (%)
22.3 25.3 15.0 3.7 3.5 6.4 2.6
23.9 22.7
11.6
4.3 3.9 3.6 3.4 3.3 2.9
11.3 2.4 4.0
16.2
0
10
20
30
MTL SCBLife BLA KTAL PLT TLI FWD AZAY TLA AIA
2011 2012 9M13
Source: Muang Thai Life Assurance (MTL)
Note: Bancassurance premium include all bank partners‘ premiums of MTL
23.5 24.2 9.8 10.7 2.7 10.4 3.5 6.2 3.2 0.0
25.7
21.0
11.6 10.8
5.7 5.0 4.6 4.5 3.2 3.0
0
10
20
30
MTL SCBLife BLA KTAL PLT TLA AIA TLI FWD DLA
2011 2012 9M13
(%)
74
KBank’s Economic Interest
MTFH MTI MTL MTB
10.0% 8.5% 7.5% 9.8%
KBank’s Economic Interest
MTGH MTI MTL MTB
51.0% 10.1% 38.3% 50.5%
KBank’s Strategic Acquisition in Muangthai Group Holding (MTGH)
Currently: 51% Stake in MTGH after Acquisition
Note: * MTFH = Muangthai Fortis Holding Company Limited, MTL = Muang Thai Life Assurance PCL, MTI = Muang Thai Insurance PCL, MTR = Muangthai Real Estate PCL, MTB = Muangthai Broker Company
Limited, MTGS = Muangthai Group Service Company Limited, PL = Phatra Leasing PCL, Group A Persons = Group of retail shareholders; Muangthai Fortis Holding (MTFH) changed its name to Muangthai Group Holding (MTGH) in July 2009
** The details of Group A Persons can be found in Appendix A of Opinion Report of the Independent Financial Advisor Regarding to Connected Transaction*** Fortis Insurance International NV changed its name to Ageas in 2010
FortisKBank
10.0%
MTFH
20.0%25.0%
75.0%
4.95%
Swiss ReGroup A Persons
65.05%
25.2%
MTB MTGSPL
100.0%98.0%
6.0% 10.0%
FortisKBank
10.0%
MTFH*
20.0%
MTL*
25.0%
75.0%
4.95%
Swiss ReGroup A Persons
65.05%
25.2%
MTR* MTB* MTGS*PL*
100.0%2.0%53.7%
MTI*
6.0% 10.0%
Before: 10% Stake in MTGH
MTGH*
Ageas***
MTL*
25.0%51.0 % 41.2% 7.8%
75.0%
KBank
MTI* MTB*
19.9% 99.0%
Group A PersonsGroup A Persons**
Source: Information from the General Meeting of Shareholders No. 97, April 3, 2009

75
Muang Thai Life Assurance (MTL) Information Summary Established on 6 April, 1951. The first life insurance company to be granted Royal Patronage (since 1959)Joined hands with Fortis Insurance International NV (changed name to Ageas in 2010) in 2004 and joined hands with KBank in 2005Credit Rating: BBB+/Stable and axA+ (ASEAN) from S&P’s, AA+(tha)/Stable / BBB+/Stable from Fitch RatingsLife Insurance Company with Outstanding Management Award from OIC five years in role
Source: Muang Thai Life Assurance, data based on book value except for RBC
Strategy in 2014
Continue to enhance process efficiency and service quality as well as developing new products and services to effectively satisfy the needs of all customer groups
2014 Key Financial Targets
Bt bn 2011 2012 2013 2014T
Total Premium after refund 37.9 48.9 60.2
% Growth 28% 29% 23% ≥ 15%
Statements of Comprehensive Income (Bt bn)2011 2012 9M13
Net premiums earned 37.1 47.6 43.9Net investment income 5.2 6.4 5.4Total revenues 42.3 54.0 49.3Life policy reserve increase from the previous period 21.0 28.0 25.6Benefits payments to life policyholders 5.9 6.9 6.4Insurance claims and loss adjustment expenses 1.9 1.9 1.5Commissions and brokerages 6.3 8.4 7.9Other underwriting expenses 0.3 0.4 0.4Operating expenses & Other 2.5 2.8 2.3Total Expenses 37.9 48.5 44.1Profit before income tax expense 4.4 5.6 5.8
Income tax expense 1.5 1.4 1.1
Net profit (loss) 2.9 4.1 4.7
Statements of Financial Position (Bt bn)2011 2012 9M13
Total Assets 116.4 151.9 183.0Total Liabilities 101.5 130.8 159.2Total Equities 14.9 21.1 23.9
2011 2012 9M13
ROE (%) 21.1% 22.8% 27.8%
ROA (%) 2.8% 3.1% 3.7%
Risk-Based Capital (RBC) 319.8% 436.6% 459.6%
76
13.1 16.4
21.7 20.9
16.5 21.5 27.2
24.5
29.6
37.9
48.9 45.4
0
10
20
30
40
50
60
2010 2011 2012 9M13
First Year and Single Premium Renewal Premium Total Premium
MTL Investment Portfolio and Insurance Premium
Total Premium by Channels: Bancassurance accounted for about 70% in 9M13with an increasing proportion
Total Premium by Products: Ordinary product accounted for around 90%
0%
20%
40%
60%
80%
100%
2010 2011 2012 9M13
Agents Bancassurance Direct Marketing Other
MTL Total Premium:Growth continues to outpace the industry
MTL Investment Portfolio: Fixed Income accounted for around 80%
Source: The Thai Life Assurance Association
Total Premium Growth
MTL Industry
(%YOY)Y2010Y2011Y20129M13
38%28%29%22%
14%11%19%16%
(bn)
0%
20%
40%
60%
80%
100%
2010 2011 2012 9M13
Ordinary Industrial Personal Accident Group
Total Investment (3Q13): Bt 172.2 bn
Gov & S/E Bond55.9%
Debenture21.3%
Stock6.6%
Note7.5%
Policy Loan3.9%
Unit Trust3.0%
Deposit1.3%
Mortgage Loan0.6%

77
MTL’s Life Insurance Product ProfileFour Major Types of Life Insurance Product
Ordinary Life Insurance Products: Provide life protection for a fixed amount to an insured person
Can be further classified into four sub-categories;
Endowment Life Insurance: Savings type product; insured person receives an amount at the certain period of
time or a designated beneficiary receives death benefits upon the death of the insured person within the insured
period (e.g. Pro Saving products)
Term Life Insurance: provides temporary protection with no savings component. Claim can be made upon death
within the stated term period (e.g. MRTA products)
Whole Life Insurance : provides life time protection (to the age of 90 or 99) with the death benefit paid to the
beneficiary upon the death of the insured (e.g. Pro Life products)
Rider : additional coverage desired by the insured (sample of additional coverage: medical expense, accident)
Group Life Insurance Products : term insurance covering a group of people, usually employees of a company or
members of a union or association
Industrial Insurance Products : life insurance with a modest amount of coverage, low premium, and no health check
requirement
Personal Accident : a limited life insurance designed to cover the insured in case of personal accident
78
Life Coverage at 100% of the sum insured amount
End of Policy Year
Premium Payment at the Beginning of
Policy year
Maturity Benefit100%
Maturity Benefit100%
End of Policy Year
Premium Payment at the Beginning of
Policy year
Life Coverage at 100% of the sum insured amount
Sample of K-Bancassurance and MTL Products
Pro-Savings 615Life insurance with a premium payment of only 6 years, but the coverage continues for 15 years
MRTA-Home (Mortgage Reducing Term Assurance)
Ormsap 20/14Pay premium for only 14 years, but the coverage continues for 20 years
Healthy Value1 year coverage period, covered medical expenses up to Bt2mn
Endowment Life Insurance
K-Bancassurance Products* Muang Thai Life Assurance Products**
Endowment Life Insurance
Term Life Insurance Term Life Insurance
* K-Bancassurance products are MTL’s life insurance products selling through KBank
** Muang Thai Life Assurance products are MTL’s life insurance products selling through MTL sales agents, and/or other channels

79
Sample of K-Bancassurance and MTL Products
Pro Life 90/5Whole life coverage to the age of 90 with annual cash bonus payment from the end of policy year 1 and requires only 5 years premium payment
Kumkrong TalodcheepSaving plan with whole life coverage: pay premium for only 20 years and get coverage to the age of 99
Pure CancerAdditional cancer insurance which provides cash benefits up to Bt1mn
K-Bancassurance Muang Thai Life Assurance
PA PlusAccident coverage
Health Care PlusHospital and surgery benefit rider
Whole Life Insurance Whole Life Insurance
Rider Rider
* K-Bancassurance products are MTL’s life insurance products selling through KBank
** Muang Thai Life Assurance products are MTL’s life insurance products selling through MTL sales agents, and/or other channels
80
KBank: Other Information

81
September 13, 2013 (Closing Registration Date)Shareholder Structure
Top 10 Shareholders* % Shareholder Structure
1. THAI NVDR CO., LTD
2. STATE STREET BANK EUROPE LIMITED
3. CHASE NOMINEES LIMITED 42
4. STATE STREET BANK AND TRUST COMPANY
5. HSBC (SINGAPORE) NOMINEES PTE LTD
6. NORTRUST NOMINEES LIMITED-NT0 SEC LENDING THAILAND
7. CHASE NOMINEES LIMITED 1
8. THAILAND SECURITIES DEPOSITORY COMPANY LIMITED FOR DEPOSITORS (THAI SECURITIES –HOLDER ACCOUNT)**
9. THE BANK OF NEW YORK MELLON-CGTTAXABLE
10. GIC PRIVATE LIMITED – C***
Other Shareholders
Total
26.754
8.542
4.912
4.366
2.434
2.158
1.999
1.599
1.335
1.331
44.569
100.00
Foreign Shareholders
49%
Thai Shareholders
51%
(NVDR = 26.75%)
Thai Shareholding Limit 51%
Foreign Shareholding Limit 49%
NVDR stands for Non-Voting Depository Receipt
Note:
Source: Thailand Securities Depository Company Limited (TSD), the Stock Exchange of Thailand website (www.set.or.th), and KBank
Note: * The top 10 shareholders are based on individual accounts** Thailand Securities Depository Company Limited (TSD), a subsidiary of the Stock Exchange of Thailand, provides three types of securities post trade services: securities
depository services, securities registration services, and provident fund registration services; the shareholders booked under TSD are those who are not eligible for dividend payments as their investment is not aligned with their citizenship (i.e. foreign investors buying KBank shares on the local board or Thai investors buying KBank shares on the foreign board)
*** GIC holds KBank shares via three accounts. Combining those three accounts, GIC holds 1.721% of KBank shares, ranking them at number 8
82
Credit Ratings As of January 15, 2014
Outlook Government Outlook
Long-term* Senior Unsecured
Notes
Subordinated Debts
Long-term Subordinated Debts
Moody's Baa1 A3 Baa3 A3 N/A Stable Baa1 Stable
S&P's BBB+ BBB+ BBB N/A N/A Stable BBB+ Stable
Fitch BBB+ BBB+ BBB AA(tha) AA-(tha) Stable BBB+ Stable
KBank Thailand
Local Currency/ National RatingsForeign Currency
Note: * Moody's: Foreign Currency Long-term Deposit Rating; S&P's: Long-term Counterparty Credit Rating; Fitch Ratings: Foreign Currency Long-term Issuer Default Rating

83
Organization Chart
Risk Management Committee
ShareholdersAuditor
Corporate Secretary Board of Directors
Advisory Directors to the Management
Committee
Management Committee
Corporate Governance Committee
Human Resources and Remuneration Committee
Audit Committee
Advisory Council to the Board of Directors/
Legal Adviser
World BusinessDivision
World BusinessDivision
Human ResourceDivision
Human ResourceDivisionSystems DivisionSystems DivisionFinance and Control
Division
Finance and Control Division
Enterprise Risk Management Division
Enterprise Risk Management Division
Customer Service Fulfillment Division
Customer Service Fulfillment Division
Corporate Secretariat Division
Corporate Secretariat Division
Corporate Strategy Management DivisionCorporate Strategy
Management Division
Corporate Business Division
Corporate Business Division
Corporate and SME Products Division
Corporate and SME Products Division
SME Business Division
SME Business Division
Compliance and Audit Division
Compliance and Audit Division
Retail Business Division
Retail Business Division
Capital Markets Business Division
Capital Markets Business Division
Investment Banking Business Division
Investment Banking Business Division
Independent Directors Committee
84
Board of Directors Structure
• Mr. Somchai Bulsook(Vice Chairman, Lead Independent Director and Chairman of the Human Resources and Remuneration Committee)
• Prof. Khunying Suchada Kiranandana(Chairperson of the Audit Committee)
• Prof. Dr. Yongyuth Yuthavong
• Prof. Dr. Pairash Thajchayapong
• Ms. Kobkarn Wattanavrangkul
• Sqn. Ldr. Nalinee Paiboon, M.D.
• Mr. Saravoot Yoovidhya
• Dr. Piyasvasti Amranand
• Mr. Kalin Sarasin
Executive Directors (3)
• Mr. Krisada Lamsam(Vice Chairman and Chairman of the Corporate Governance Committee)
• Ms. Sujitpan Lamsam
• Dr. Abhijai Chandrasen(Legal Adviser)
• Mr. Somkiat Sirichatchai(Chairman of the Risk Management Committee)
• Mr. Rapee Sucharitakul
17 board members: 9 Independent Directors, 3 Executive Directors, and 5 Non-Executive DirectorsDirector age limit is not to exceed 72 years oldTerm limit of directorship for Independent directors is not more than three consecutive terms of directorship, effective after the Annual General Meeting of Shareholders (AGM) in 2013Lead Independent Director and Independent Directors Committee were appointed in order to ensure proper checks and balances
Independent Directors (9) Non-Executive Directors (5)
• Mr. Banthoon Lamsam(Chairman of the Board and Chief Executive Officer)
• Mr. Predee Daochai(President)
• Mr. Teeranun Srihong(President)

85
Statement of Corporate Governance Principles: The Board of Directors strongly believes that good corporate governance will enhance the sustainable growth of performance of the Bank, and is central to achieving the Bank’s primary objective of maximizing shareholder value. The corporate governance practices at KASIKORNBANK provide the structure which enables this objective to be achieved, whilst ensuring that the business and affairs of the Bank are conducted competitively under high ethical standards and in accordance with the law.
Environmental
Economic
Social
In-Process CSR: Environmental In-Process CSR: Social
In-Process CSR: Economic
Sustainability Development
Note: More information on our sustainability development can be found on our website and KBank’s Sustainability Development 2012 report
Aim towards best practice on renewable energy and reducing the direct environmental impact of our operations• Green Building• Green Financing• Green Product K-ATM • Recycling Project • Electricity Cost Cutting Campaign
Support and facilitate life skills for youth development• Cultivation of Wisdom Project• K-Expert: Knowledge Enhancement Project
• Corporate Governance• Risk Management• Green Procurement
• K Global Business Center (AEC)• Chinese – Thai Business Center
• K-Value Chain Solutions• K Fam Club• K SME Care
• K-Expert • K Home Smiles Club
Provide solutions and knowledge to achieve a sustainable economy
86
Public Recognition Highlight: 2012 – 2013
- Best SME Bank in Thailand 2012- Best SME Banker in Thailand 2012- The Asset’s Platinum Awards in 2012
2012
- Asia’s Best CEO (Investor Relations) - Best Investor Relations Company (Thailand)- Asian Corporate Director Recognition Award 2012- Corporate Governance Asia Recognition Award 2012
- Best Retail Bank in Thailand - The Bankers Choice Awards in Thailand - The Leading Counterparty Bank in Thailand- Best Cash Management Bank in Thailand
- Product Excellence in Debit Cards 2012- Strategy Excellence in Business Innovation (Special Commendation)
- Best Bond House-Thailand 2012
- Best Investor Relations Professional
- Best Bank- Best Cash Management Bank- Best FX Bank for Corporates and FIs
- Best Cash Management House in Thailand
SET Awards 2012:- SET Award of Honor for Excellence in Corporate Governance Report 2008-2013- Outstanding Investor Relations Award - Corporate Social Responsibility Award
- House of the Year, Thailand
-Best Retail Bank of the Year 2012
- Best Investor Relations by a Thai Company for Excellence in Investor Relations
Awards for Listed Companies 2012:- Best Chief Executive Officer- Best Investor Relations
2013
- Best Retail Bank in Thailand- Best Cash Management Bank in Thailand - The Best Managed Banks Achievement Awards 2013- The Achievement in Credit Risk Management Award
-Best Retail Bank of the Year 2013
- Asia’s Best CEO (Investor Relations) - Asia’s Best CFO (Investor Relations)- Best Investor Relations Company (Thailand)
- The Asset’s Platinum Awards, Banking and Finance Sector- Best in Treasury and Working Capital – SMEs, Thailand- Best Regional Cash Management Solution
- Best Local Bank in Thailand
- Channel Excellence in Branch
-Best Business Leader of the Year in the Overall Business Performance
- Best Use of Social Media in Customer Service
- Thailand Zocial Award 2013 – Top Finance brand in Social network
- The Best Acquiring Institution in SEA (K-PowerP@y (mPOS))
- ESCO Excellent Supporting Bank Awards 2013
- Best Domestic Providers of FX services 2012
- Thailand Capital Market Deal 2012- Branch Innovation of the Year - Bronze- Thailand Domestic Cash Management Bank of the Year - Thailand Domestic Trade Finance Bank of the Year
- SME Bank of the Year – Asia 2013
- Best Bank- Best Cash Management Bank
- Best Investor Relations by a Thai Company 2013
SET Awards 2012:- SET Award of Honor for Excellence
in Corporate Governance Report 2008-2012
- SET Award of Honor for Excellence in Investor Relations 2010-2012
ThaiBMA Best Bond Awards 2012- Best Bond House- Deal of the Year- Best Dealer Compliance- Most Creative Issue- Dealer of the Year- MOF Award

87
Banking System and Regulations Update
88
Thai Commercial Banks and Specialized Financial Institutions (SFIs)November 2013
Market Share (% of Total Loans) Market Share (% of Total Deposits)
6 SFIs
Note: 6 SFIs include Government Saving Bank (GSB), Government Housing Bank (GHB), Export-Import Bank of Thailand (EXIM Bank), Bank for Agriculture and Agricultural Co-operatives (BAAC), Small and Medium Enterprise Development Bank of Thailand (SME Bank), and Islamic Bank of Thailand (IBank)
14 Commercial Banks
As of Nov-2013
8,824 9,1729,935
10,99613,439
8,622 8,87210,074
11,79313,573
14,77014,569
As of Nov-2013

89
Regulations Update
International Accounting Standards (IASs and IFRSs)
Financial Sector Master Plan II (FSMP II)
Capital (Basel III)
Note: TAS = Thai Accounting Standards; BCBS = Basel Committee on Banking Supervision
Year 2013 onwards: The time frame is specified by the Federation of Accounting Professions; TFRS 8 (Operating Segment) and TAS21 (Foreign Exchange) has been implemented since January 2013; full IFRS conversion is expected in 2016
Expected impacts on Thai banks: More logical and transparent presentation and disclosure, with different impacts on each bank
Expected impacts on KBank: Manageable impacts expected, as the Bank early adopted some IASs and IFRSs and continues to prepare for full implementation
January 2013 onwards: Basel III implementation on bank only and consolidated basis (early adopt). Requirements are in line with international guidelines
Expected impacts on Thai banks: Manageable impacts expected based on quantitative impact study by the BOT
Expected impacts on KBank: Manageable impacts to KBank expected
Source: The Bank of Thailand, KResearch
Year 2010-2014: The BOT’s FSMP II consists of three key policies:
Reducing system-wide operating costs
Promoting competition and access to financial services
Strengthening financial infrastructure, including market liberalization, increased access by foreign financial institutions via granting licenses in some business areas, and permission for an increased number of branches and ATMs
June 2013: The BOT announced the new “Guidelines and Conditions for Establishing a Branch and Undertaking the Business of a Branch of Foreign Commercial Bank’s Subsidiary”, allowing for new subsidiaries’ licenses of foreign commercial banks to open up to 20 branches and 20 off-premise ATMs
Year 2014: The BOT will establish a licensing framework for new types of business operation for underserved specific markets, i.e. Islamicbanking, investment banking and micro-finance
Expected impacts on Thai banks: Move toward more liberalization, along with higher competition
Expected impacts on KBank: Ability to maintain competitiveness over both existing and new players, helped by an effective customer-centric strategy and preparation for a changing environment
90
Basel III: The BOT Implementation TimeframeThe BOT implementation timeframe is mostly in line with the BCBS timeframe
Effective implementation: January 1, 2013 (Bank) and January 1, 2014 (Consolidated)Banks able to early adopt Basel III on consolidated basis since January 1, 2013Full Implementation: January 1, 2019
Transitional Arrangement for Capital Requirement
All dates are as of 1 January 2013 2014 2015 2016 2017 2018 2019
Conservation Buffer* - - - 0.625% 1.25% 1.875% 2.5%
CET1: Minimum Common Equity Tier 1 Ratio (after conservation buffer) 4.5% 4.5% 4.5% 5.125%(4.5%+0.625%)
5.75%(4.5%+1.25%)
6.375%(4.5%+1.875%)
7.0%(4.5%+2.5%)
Tier 1: Minimum Tier 1 Ratio (after conservation buffer) 6.0% 6.0% 6.0% 6.625%(6.0%+0.625%)
7.25%(6.0%+1.25%)
7.875%(6.0%+1.875%)
8.5%(6.0%+2.5%)
CAR: Minimum Total Capital Ratio (after conservation buffer) 8.5% 8.5% 8.5% 9.125%(8.5%+0.625%)
9.75%(8.5%+1.25%)
10.375%(8.5%+1.875%)
11.0%(8.5%+2.5%)
Countercyclical Buffer (Subject to the BOT consideration)** - - - 0.0-2.5% 0.0-2.5% 0.0-2.5% 0.0-2.5%
Source: Bank of Thailand (BOT), KBank
* Conservation Buffer is to ensure adequate capital to absorb losses during periods of financial and economic stress. Banks with a CET1 ratio less than the required conservation buffer (i.e. 2.5% CET1) will face various degrees of constraint on distribution of dividends and bonuses
** In periods of excess aggregate credit growth, the BOT may require banks to set a Countercyclical Buffer up to 2.5% to achieve the broader macroprudential goal of protecting the banking sector*** Requirements for liquidity ratios have not been finalized. Banks are required to submit data to the BOT for further calibration
Net Stable Funding Ratio (NSFR)*** Effective
Leverage Ratio Parallel run period Effective
Liquidity Coverage Ratio (LCR)*** Effective (Phase-in)

91
Tier 1• Issued and paid-up share capital• Premium on ordinary shares• Legal reserve and Retained earnings
• Hybrid Tier 1 (<15% of total Tier 1)• Minority interest, Preferred stock
Common Equity Tier 1• Issued and paid-up share capital• Premium on ordinary shares• Legal reserve and Retained earnings• Other comprehensive income (OCI)
e.g. surplus on AFS bond and equity (100%), surplus on land & premises (100%)
Additional Tier 1• Hybrid Tier 1 with loss absorbency feature*• Minority interest, Preferred stock*
Deduction of Tier 1• Goodwill, Treasury stock, Deferred tax asset
• Investment in insurance (50% Tier 1 and 50% Tier 2)
Deduction of Tier 1• Goodwill, Treasury stock*, Deferred tax asset• Intangible assets (new item: gradually deduct CET1)
• Investment in insurance (Threshold Deduction) - Amount ≤ 10% of CET1, %RW = 250% (KBank’s Case) - Amount > 10% of CET1, deduct CET1
• Long-term subordinated debt• Hybrid Tier 1 (exceeds from Tier 1 limit)
• General Provision (reserve on ‘Pass’ loans and the excess allowance of required reserves)
• Surplus on AFS equity (45%)• Surplus on land & premises (70% and 50%)
• Long-term sub-debt with loss absorbency feature**
• General Provision (reserve on ‘Pass’ loans and the excess allowance of required reserves)
Tie
r 1
cap
ital
Tie
r 1
cap
ital
Capital Definition Change (Consolidated)
Tie
r 2
cap
ital
Tie
r 2
cap
ital
Basel II Basel III
1
3
* Currently, KBank has no Hybrid Tier 1, Preferred Stock, or Treasury Stock** Long-term subordinated debentures must have loss absorbency feature, if issued
since 1 January 2013
2
1
92
Financial Sector Master Plan (FSMP) Implementation StagesFSMP III
(Y2015 onwards)FSMP II (Y2010-2014)
Looking forward to liberalizationFSMP I
(Y2004-2009)
Increase efficiency of the financial institutions system- ‘One Presence’ policy- Expand scope of business: ‘Universal Banking’
- New licenses for retail banks and foreign bank subsidiaries
Promote financial inclusion- Strengthen financial institutions (FIs) by promoting voluntary mergers
Protect customers
Source: BOT and KResearch
Reducing system-wide operating costs
Note: There are four types of Commercial banks in Thailand; Full service banks; Foreign bank branches; Retail banks; and Subsidiary
Further development based on FSMP II resultsAnother feasibility study in light of empirical resultsNo official announcement regarding FSMP III
Streamlining regulationsTackling remaining NPLs and NPAs(Allow banks to partner with private firms to work on raising attractiveness of NPAs, promote efficiency in the trading of NPLs and NPAs by establishing an NPA Information Center, and encourage write-offs of fully provisioned ‘doubtful of loss’ loans)
Promote competition- Encourage voluntary mergers to lower operating costs- Enhance the role of existing service providers (Liberalization of branch network, widen business scope, upgrade qualified retail banks to commercial banks, and expand branch network of foreign banks)
- Introduce new entry to fill gaps and create value-added - Reduce government ownership in the commercial banking sector
Promote financial access- Facilitate bank expansion of business, as well as support Specialized FIs in focusing on providing services to the populations without access to banks
- Introduce new service providers with microfinance expertise into the system
Promote development of financial products that help support risk managementEnhance information system for risk managementPush for draft/review of necessary financial laws to support risk management and an expedited resolutions to NPLsPromote information technology utilizationDevelop human resources in the financial sector
Promoting competition and access to financial services
Strengthening financial infrastructure (including market liberalization, increased access for foreign financial institutions via grants of licenses for some business areas, and permission for an increased number of branches and ATMs)

93
TAS and IFRS Implementation
31 Dec 2010 : TAS Implementation
TAS 19: Employee Benefits
(KBank early adopted in 4Q10; the formal effective date is January 1, 2011)
Use actuarial techniques to determine retirement reserve for eligible staff
TAS 12: Income Taxes (KBank early adopted)
(KBank early adopted in 4Q10; the formal effective date is January 1, 2013)
Use deferred income tax concept to record tax asset/ liability
BOT’s New Financial StatementPresentation/Convention
New and reclassified presentation lines in financial statement in order to align with the revised TAS
1 Jan 2011: New financial statement
IFRS 9 (IAS 39), IFRS 7 and IAS 32: Financial Instruments
Thai banks have implemented a new provisioning rule under IAS 39, since December 2006Thai banks have complied with IAS 39 when reporting embedded derivatives, since 2008
IFRS 4: Insurance ContractsRe-measuring insurance liability to reflect current market situation Unbundling of deposit components
IFRS13: Fair value measurement(Revised timeline from 2013 by Federation of Accounting Professions)
Clear required factors in fair valuation and disclosure about valuation techniques
Full IFRS Conversion
4Q10 2013 2016 (Tentative)
Note: TAS = Thai Accounting Standard
presentation
2014
TFRI 13: Customer Loyalty Programmes
Defer portion of income for reward credit granted
IFRS Conversion
TAS 21: Effects of Changes in Foreign Exchange Rates
Translate ‘Functional Currency’ to ‘Presentation Currency’
TFRS 8: Operating Segments
Present operating results for each key segment
TAS/TFRS Implementation
94
Updates on the Deposit Protection Agency (DPA)
Insured Deposit Under new Royal Decree
11 August 2012 – 10 August 2015 Up to Bt50mn
11 August 2015 – 10 August 2016 Up to Bt25mn
10 August 2016, onwards Up to Bt1mn
DPA Objectives and Missions
Amount of Insured DepositsInsured deposits include deposits and accrued interest denominated in Thai Baht accounts, excluding non-resident Thai Baht accounts Blanket guarantee will be gradually phased-out to a limited coverage of Bt1mn per depositor per institutionUntil 2011, Thai banks paid 0.40% per year of the daily average deposit amount (paid in June and December), excluding deposits in foreign currencies and deposits from financial institutions not insured by the DPASince January 27, 2012, the contribution rate has increased from 0.40% to 0.47%, of which 0.46% is paid to the BOT to manage FIDF debts* and 0.01% is paid to the DPARoyal Decree on an extension of deposit protection coverage was announced in the RoyalGazette on September 24, 2012
Deposit Accounts in Thailand (as of November 2013)
Enhanced understanding of the deposit protection schemeClose cooperation with related authorities to maintain stability of the financial institution systemEstablishment of an appropriate system for premium collection and sound management of the Deposit Protection FundDevelopment of an effective information system to ensure fairness of the deposit protection scheme, with accurate and rapid reimbursementManagement according to Good Governance Principles and in compliance with international standards established by the International Association of Deposit Insurers
Source: DPA, Bank of Thailand (BOT), KBank, KResearch
* According to the BOT announcement in the Royal Gazette, per the authority of the emergency decree dated May 11, 2012, financial institutions are required to pay 0.46% of the average deposit amount, B/Es, debt instrument (excluding the amount counted as capital), borrowings, and securities transactions under repurchase agreements, beginning January 27, 2012
Deposits (Corporate and Retail Deposits) # of Accounts % Amount (Bt mn) %
Less than Bt1mn 82,852,298 98.50% 2,559,197 23.20%
More than Bt1mn, but less than Bt50mn 1,240,539 1.47% 4,841,381 43.88%
More than Bt50mn 17,144 0.02% 3,631,660 32.92%
Total 84,109,981 100.00% 11,032,238 100.00%

95
Government Policy
96
Sources and Uses of Public Fund
Tax Revenue + Non-Tax Revenue
(Bt2.275trn)
Borrowing under the Annual Budget Act (Bt250bn)
+
Budget Planning
Annual Budget(Bt2.525trn)
Budget Execution
Budget Disbursement
(95% target disbursement rate +
carry-over)
FY2014 Annual Budget
Extra-Budget Borrowing Quasi-Fiscal Instrument
Extra-Budget Borrowing under
Special Act/Decree
1. Water ResourceManagement project (Bt350bn) Details in App. Page 99
2. Infrastructure Investment Project (Bt2trn)Details in App. Page 100
SFIs taking deposits, borrowing, as well
as government subsidy
Quasi-fiscal activities (e.g. Rice Pledging Scheme,
Soft Loan Program)
General Administration (Bt912.9bn)
DefenseDebt services
Economic Services(Bt527.9bn)
Subsidy to SFIs (e.g. loss from rice pledging scheme)Subsidy to SOEs(e.g. Infrastructure project, free bus and train service policy)Infrastructure/Agricultural Development
Social and Community Services (Bt1,084.2bn)
One Tablet per ChildUniversal Healthcare

97
Calendar Year2011 2012 2013 2014
2015-2019Q4 Q1 Q2 Q3 Q4 Q1 Q2 Q3 Q4 Q1 Q2 Q3 Q4
FY2013 Budget Disbursement
Total Bt2.4trn
Disbursed
FY2014 BudgetTotal Bt2.525trn
Disbursed
Emergency Decree for Water Management*
Total Bt350bn
Disbursed
Infrastructure Development Project*
Total
Other Investment Stimuli
Consumption Stimuli
Sources: MOF, NESDB, KResearch as of December 9, 2013Note: * Preliminary details for water management scheme: Central Administrative Court ordered the government to hold public hearings on all nine modules as required by the constitution before the construction
process could begin. Therefore, there will be some delays in the disbursement of funds
Government Investment and Stimulus: Progress Update
Bt2trn, still pending the enactment processas the House of Representatives has been
dissolved
FY2013 = Bt2,171.5bn (Disbursement rate = 90.5%)
Corporate Income Tax Reduction (from 30% to 23% in 2012 and to 20% in 2013 and 2014), The National Catastrophe Insurance Fund
Rice pledging policy; Performing-debt suspension;Bt300 daily minimum wage, Bt15,000 monthly income for civil servants;VAT maintained at 7.0%, Energy / cost of living
The BOT Soft Loans
‘First-Car’ buyer
Bt16.3bn or 4.7% (Cumulative disbursement as of October 2013)
Completely disbursed
Expired: December 2012‘First-Home’ buyer
Expired: December 2012
Personal Income Tax Restructuring
3MFY2014 = Bt760.8bn (Disbursement rate = 30.1%)
98
Funding Needed from the Government for Investment Stimuli In addition to commercial bank loan expansion, the government’s funding needs for financing the budget deficit as well as extra-budget investment, i.e. water resource management and infrastructure projects, may affect liquidity in the system
Due to the current political impasse, however, extra-budget borrowing may be very limited
Economic Policies
Key Points Implementation Process Possible Impacts/ Expected Budget
2014 Budget Act FY2014 budget at Bt2.525trn with a deficit of Bt250bn
FY2014Effective date: to recommence Oct 1, 2013 after being announced in the Royal Gazette on Oct 11, 2013
Government spending will help maintain economic momentumFiscal sustainability to remain manageable in the near-term; however, continued debt creation, both from budget deficit and other borrowings, may impact long-term fiscal sustainability
Sources: MOF, KResearch (As of January 2014)Note: FY2012 is actual data. FY2013 and FY2014 budget deficits are based on budget documentation whereas extra-budget borrowing is projected by KResearch
344 282 250
1.913.7
0
200
400
600
800
1,000
FY2012 FY2013 FY2014 F
Bill
ion B
aht
Budget Deficit Financing Extra-budget borrowing

99
Budget: Bt350bn* in 2012 - June 2013(Disbursement as of October 2013: Bt16.3bn or 4.7%)
Investment Period: 2012 - 2016
Objective:
To prevent severe flooding in the Central regionTo enhance investor confidence
Summary Information
Emergency Decree for Water Resource ManagementBt300bn long-term projects*
Sources: Strategic Committee for Water Resource Management, KResearch (As of January 2014)
Key Activity Plan
2Q13 2H13 2014- 2016
Announce winners and start borrowing to finance projectComplete borrowing as stated by the Emergency Decree
Award contractsContractors start their projects - Design and build projects- Compliance with related regulatory
requirements, e.g., EIA and public hearing process
Project implementation will experience a severe delay, due to the political impasse
Adapting irrigated agricultural areas into
retention areas (20%)
Flood ways or flood division
channel (40%)
Reservoir construction (16.7%)
Land use zoning and land utilization
(16.7%)
Others (6.7%)
Bt300bn for long-term projects
Bt50bn for short-term projects
Bt350bn Budget*
Note: * Bt50bn is allocated for short-term /emergency projects, and Bt300bn is allocated for long-term projects** In June 2013, the Central Administrative Court ordered the government to hold public hearings before starting on the main parts of the water management
and flood infrastructure plan
Source of Funds
50% borrowing
from commercial
banks
50% borrowing from SFIs
Borrowing from SFIs and commercial banks
100
Bt2trn infrastructure Development
Budget: Around Bt2trn
Investment Period: 2013 - 2020 (7 Years)
Objective:
Enhance long-term competitivenessCreate 1.5-2.0mn jobsStimulate domestic economyEnhance quality of life
Summary Information
Note: Preliminary data; pending more information from the authorities
Infrastructure Development (Thailand 2020)
High-speed trains and inter-city highways
(52.1%)
Electric trains in and around Bangkok plus road networks linking
rural areas with industrial and tourist
areas (29.7%)
Dual-track railways, port construction, and
distribution centers (17.7%)
Support systems and contingency funds
(0.5%)
Progress Update
2013 2014 2015 - 2020
The draft act was approved by both the House and the Senate in 3Q13; however, the enactment process has been frozen since the House resolution in 4Q13
A full-scale implementation of infrastructure projects under the draft act may not be achievable in 2014; however, some projects in the pipeline, i.e. mass-transit projects and dual track railways, remain intact and will likely resume, using traditional means of financing, once the new government comes into office
Construction work will peak around 2016-2017
60% Domestic Funding
40% USD- dominated
Bond
Source of Funds
Main funding is expected to be domestic borrowing under a special act
The infrastructure development project is expected to increase long-term potential economic growth by 1% each year and reduce the share of logistic cost to GDP by 2%, from 15.2% to 13.2%
Sources: Newspaper complied by KResearch, as of January 2014

101
Economic Policies Key Points
Corporate income tax cut Reduction in corporate income tax from 30% to 23% in 2012 and 20% in 2013 and 2014
Personal income tax restructuring Lowering maximum tax rate from 37% to 35% and increasing tax brackets
Enhancing Competitiveness for SMEs Financial assistance through cooperation between SME Bank, Thai Credit Guarantee Corporation (TCG), and the Social Security Fund, as well as tax breaks
Bt300 daily minimum wage Daily minimum wage rising to Bt300 until December 2015
Bt15,000 monthly salary or equivalent income for civil servants with undergraduate degrees
Salaries (wages plus benefits) increasing to at least Bt15,000 per month
Rice pledging policyThe Bank for Agriculture and Agricultural Co-operatives (BAAC) has been used as an arm of the government to support the rice pledging program
The government announced a reduction in the pledging price and imposed a white rice quota per family to ease the fiscal burden caused by this policyFor in-season rice (Oct13-Feb14), the pledging price is maintained at Bt15,000 per ton with a quota of Bt 350,000 per family
3-Year Performing Debt Moratorium 3-year debt moratorium for small-scale farmers and low income earners with outstanding debt not to exceed Bt500,000 per person with the interest rate reduced by 3% per year
Monthly welfare allowance for citizens over age 60 Monthly welfare allowance of Bt600-1,000 paid to citizens between ages 60-90
Fund for Entrepreneurship Provide startup capital/soft loans for entrepreneurs who want to open businesses
Expired Measures
‘First Home’ program (Expired measure)
10% maximum personal income tax deduction (maximum Bt100,000 deduction per year) for first-time buyers of new houses or condominiums valued below Bt5mn
‘First Car’ tax incentives(Expired measure)
Rebate of the excise tax (capped at Bt100,000) on small passenger cars (engine size less than or equal to 1,500cc) and pickup trucks worth up to Bt1mn
GHB home loans with 0% interest for 3 years (Expired measure)
Government Housing Bank (GHB) will provide up to Bt1mn in housing loans for first-time home buyers with 0% interest for the first three years
Summary on Government Stimulus Plans
Source: KResearch, information as of January 2014
102
Decree Name Key Points ImplementationProcess
Possible Impacts/ Expected Budget
Emergency decree authorizing government borrowing for strategic investment plans covering water resource management
Establishing water management system; flood prevention program to regain investor confidence
Approved (by Cabinet): Jan 10, 2012Effective date: Jan 27, 2012
Funding wholly financed by borrowing; the government has already secured the full amount of the contract loan with 4 financial institutions, i.e. GSB, BBL, KBank, and KTB. This fund can be disbursed until fiscal year 2017Boosting infrastructure investment
Emergency decree providing assistance loans to flood-hit SMEs and individuals
Providing soft-loans with fixed interest rate of no more than 3% for flood-affected parties
Approved (by Cabinet): Jan 10, 2012Effective date: Jan 27, 2012
Bt300bn in soft-loansBank of Thailand contributes up to 70% of total amountState-owned and commercial banks contribute the remaining amountAs of September 2012, this measure has provided support to more than 520,000 affected customers nationwide
Emergency decree establishing flood-related insurance fund
Establishing a flood insurance scheme, with favorable insurance premiums in light of partial government support
Approved (by Cabinet): Jan 10, 2012Effective date: Jan 27, 2012
Bt50bn in fundsFunding comes mainly from government borrowing
Emergency decree improving management of the Financial InstitutionsDevelopment Fund (FIDF) debt
Set a clear responsibility to manage debts, particularly yearly interest rate burdens, by introducing additional sources of funds from financial institution contributions
Approved (by Cabinet): Jan 10, 2012Effective date: Jan 27, 2012
Until 2011, Thai banks paid 0.40% per year of the daily average deposit amount to the Deposit Protection Agency; since January 27, 2012, the contribution rate has been increased from 0.40% to 0.47%, of which 0.46% is paid to the BOT to manage FIDF debts and 0.01% is paid to the DPA
Source: KResearch, information as of May 2013
Summary of Four Financial Emergency Decrees in 2012

103
Source: KResearch, information as of February 2013
Measures Details
Tax measures Reduce income taxIf annual income ≤ Bt300,000, income tax rate = 0%If annual income between Bt300,000 and Bt1mn, income tax rate = 15%If annual income over Bt1mn, income tax rate = 20%
Cut withholding tax to 2% (from 3%)Allow 100% depreciation in the first year for machineryExempt income tax from the sale of old machinery Offer tax deductions for 1.5 times incremental wages Effective Period: January 1, 2013 - December 31, 2013
Financial measures Offer soft loans worth Bt20bn from SME Bank and Bt10bn from Social Security FundOffer credit line guarantee worth Bt240bn by Thai Credit Guarantee CorporationEffective Period: March 2013 - December 31, 2016 for credit line guarantee;
March 2013 - December 31, 2018 for soft loan
Productivity-boosting measures Offer soft loans (0.1% p.a.) for staff training costs, by the Skill Development Fund Effective Date: January 1, 2013 - December 31, 2013
Other measures Reduce employer contributions to Social Security Fund to 4% (from 5%)Increase budget for state officer trainings and seminars at provincial hotels Reduce business tax by 50% to Bt40 per room (from Bt80) for small scale hotels under the supervision of the Local Administration Organization Effective Period: January 1, 2013 - December 31, 2013
Government Assistance Measures for SMEs Affected by Wage HikeDaily minimum wage rose to Bt300 and will remain at Bt300 until December 2015
104
Ongoing Government Measures to Assist Cost of Living
Source: KResearch
Measures Details
Household Assistance Train and Bus Fares: A subsidized fare for buses and trains; some buses and trains provided for free
Electricity: A full subsidy on electricity bills for households using less than 50 units of electricity per month
Energy Prices Diesel Fuel: The government intends to control diesel fuel prices to not exceed Bt30/litre by adjusting the amount contributed to the Oil Fund and implementing an excise tax on diesel fuel
NGV and LPG Price: The government has subsidized NGV and LPG costs, allowing retail selling prices to be lower than global market prices. However, the government has restructured the fuel pricing system to better reflect global market price movements
NGV price fixed at Bt10.50/kg LPG prices are as follows:
Household sector implemented a price increase of Bt0.50 per month starting September 1, 2013 until the price equals the transport sector price(as of January 2014, price at Bt20.63/kg) Transport sector adjusted in accordance with Oil Fund levies and thedirection of global prices (as of January 2014, price at Bt21.38/kg)Industrial sector adjusted in alignment with relevant production costs (as of January 2014, price at Bt30.13/kg)
FT Rate: Fuel Adjustment Tariff (FT) Rate for electricity is set to increase by less than the actual cost (from January-April 2014, FT Rate at Bt0.59/unit )
Value-added-tax (VAT) Rate On August 7, 2012, the Cabinet approved the following VAT Rates:Maintain the 7% value-added-tax (VAT) rate until September 30, 2014 After Sep 2014, the VAT rate may be increased to 10% unless the government
extends the VAT reduction period.
29.99
25
27
29
31
33
35
37
Dec-1
0
Jun-1
1
Dec-1
1
Jun-1
2
Dec-1
2
Ba
ht/L
itre
Diesel Price
Uncontrolled PricePegged Price
Elimination of some Oil Fund levies (effective Aug. 29, 2011)
29.99

105
Government budget disbursement rate for 3MFY2014 was 30.1%, on par with FY2013
The FY2014 budget disbursement target is 95%, compared to 94% in FY2013
Source: Ministry of Finance
9.7
18.9
30.1
12.1
23.429.2
36.742.1
50.557.6
62.969.3
75.981.4
90.5
0
10
20
30
40
50
60
70
80
90
100
Oct
Nov
Dec Jan
Feb
Mar
Apr
May Jun
Jul
Aug
Sep
% C
umul
ative
Bud
get D
isbur
sem
ent R
ate
(%)
FY 2014 FY 2013 FY 2012
Public Debt to GDP and Fiscal BudgetThe public debt to GDP ratio was 45.28% as of October 2013, still under the 60% limit set by the fiscal sustainability framework
The Thai government has committed to keep the ratio of public debt to GDP under 50%, including borrowing on the Bt2trn infrastructure development project
41.0
43.6
45.28
38
40
42
44
46
48
4,000
4,200
4,400
4,600
4,800
5,000
5,200
5,400
Oct-
11
De
c-1
1
Fe
b-1
2
Ap
r-1
2
Ju
n-1
2
Au
g-1
2
Oct-
12
De
c-1
2
Fe
b-1
3
Ap
r-1
3
Ju
n-1
3
Au
g-1
3
Oct-
13
% to GDPBt bn
Public Debt
% to GDP
106
Thai Economic Figures

107
33.3230.15 31.54
30.60
32.68 33.50
30
32
34
4Q09 4Q10 4Q11 4Q12 4Q13 4Q14FUSD/THB
USD/THB: End Period Interest Rate Trend
Currency and Interest Rate Outlook
Bt
The U.S. economy is likely to see continued progress, giving the Fed more confidence to further reduce QE
The markets expect the Fed to end its asset purchases in 2014. This means higher interest rates for investors investing in emerging markets
Outlook for Thailand’s weaker current account balance and political uncertainties indicates a negative impact on the economy and reduced investor appetite for Thai assets in the near term
Capital outflows are expected to continue, pressuring USDTHB to rise further to test a 34.50 level during 1H14 before normalizing to 33.50 at year-end
Note: F is estimated by KBank Capital Markets Research (as of Jan 22, 2013)
MPC voted 4:3 to maintain the policy rate at 2.25% in January 2014, as they may await clarity over political issues. MPC deems that sound fundamentals and monetary accommodation will help to support recovery
The policy rate is expected to remain at 2.25% in 1H14; a further rate cut would have limited impact on growth, given political uncertainties. Nevertheless, the markets view the bias toward risk to growth vs. inflation
MPC had revised down the growth forecast for 2013 and 2014 and is prepared to do more to lift growth
Over the medium term, the policy rate is expected to be normalized to 2.50-2.75%, possibly as soon as end of 2014, with economic recovery and higher inflation
1.252.00
3.25 2.75 2.25 2.75
0-0.250-0.250-0.250-0.250-0.25 0-0.250.00
2.00
4.00
Dec-09 Dec-10 Dec-11 Dec-12 Dec-13 Dec-14F
% p
.a.
Fed Funds rate BOT's 1-Day Repurchase rate
108
Monthly Economic Conditions: November - December 2013 Key economic figures in November 2013 indicated that the Thai economy decelerated further
Both private consumption and investment experienced a contraction due to heightened political uncertainties and the high base effect
Exports remained lackluster, dragged down by poor performance in fishery and electronic product exports
Trade balance remained in surplus, helped by a substantial decline in imports
Current account also registered a surplus after the profit repatriation season ended
Dec13 inflation declined amid dismal economic data
Sources: Bank of Thailand (BOT), Ministry of Commerce (MOC), University of the Thai Chamber of Commerce (UTCC),
Office of Industrial Economics (OIE), Office of Agricultural Economics (OAE)
Units: % over-year, otherwise indicated 20132012 1Q 2Q 3Q YTD. Sep Oct Nov Dec
Private Consumption Index (PCI) 5.7 3.8 0.7 -2.2 0.4 -6.2 0.1 -2.4Sales Volume of Benzene and Gasohol 5.1 7.0 10.6 9.1 7.9 5.5 5.1 2.4
Value-added Tax at 1995 prices 15.7 6.9 -0.1 -7.2 -0.8 -19.4 2.7 -7.8Imports of Consumer Goods at 1995 prices 10.6 8.6 4.9 -2.6 2.1 -4.0 0.8 -7.4
Passenger Car Sales 86.7 97.2 -3.3 -24.8 -3.2 -30.7 -44.1 -48.0Motorcycle Sales 6.1 5.7 -6.4 -8.6 -5.0 -11.2 -10.8 -16.3
Private Investment Index (PII) 17.4 5.2 -3.6 -3.5 -2.6 -3.5 -4.9 -7.8Domestic Sales Volume of Cement 10.9 17.5 10.6 8.5 10.7 6.2 0.4 9.0Sales Volume of Commercial Cars 75.4 19.4 3.2 -26.2 -7.8 -26.2 -31.2 -25.0
Imports of Capital Goods at 1995 prices 24.3 -2.1 -10.8 -9.3 -9.4 -10.9 -13.5 -19.6Value of BOI Applications 121.6 25.9 58.1 -60.9 -8.4 -64.1 -51.5 -46.0
Manufacturing Production Index 2.2 2.9 -4.9 -3.5 -2.9 -2.9 -4.0 -10.6Industrial Capacity Utilization 66.0 67.4 64.0 63.9 64.8 63.6 63.5 63.1
Agriculture Production Index 4.0 0.8 1.8 -4.1 1.0 -5.6 5.9 5.3Agriculture Price Index -9.7 -4.4 -0.4 2.1 -0.7 1.8 -0.2 0.5
Exports (In terms of US Dollars) 3.1 4.1 -1.9 -1.8 -0.4 -6.3 -0.5 -4.0Unit Value 0.6 0.4 -0.4 -0.6 -0.4 -0.9 -1.0 -1.3
Volume 2.5 3.8 -1.6 -1.2 0.0 -5.5 0.5 -2.7Imports (In terms of US Dollars) 8.8 8.5 1.0 -2.9 0.4 -6.1 -4.6 -9.3
Unit Value 1.6 -1.8 -3.0 -2.0 -2.2 -1.9 -1.5 -1.5Volume 7.1 10.6 4.1 -0.8 2.6 -4.3 -3.1 -7.9
Trade Balance (USD millions) 6,015 -1,571 -956 5,033 4,358 2,561 337 1,514Current Account (USD millions) -1,470 70 -7,169 -888 -5,317 -534 376 2,294Headline CPI 3.0 3.1 2.3 1.7 2.2 1.4 1.5 1.9 1.7Core CPI 2.1 1.5 1.0 0.7 1.0 0.6 0.7 0.8 0.9

109
75.0
46.9
30354045505560
70
75
80
85
90
Jun-11 Sep-11 Dec-11 Mar-12 Jun-12 Sep-12 Dec-12 Mar-13 Jun-13 Sep-13
BSI
CC
I
Consumer Confidence Index (CCI) Business Sentiment Index (BSI)
Sources: BOT, MOC, UTCC, OIE
800
1,300
1,800
2,300
2,800
Jan Apr Jul Oct
No.
of F
orei
gn T
ouris
t Arri
vals
(T
hous
and)
2010 2011 2012 2013
2,395
1,780
1,819
2,399
Nov13 CCI and BSI continued declining amid heightened concerns over political uncertainties
Nov13 private consumption and investment experienced substantial slowdowns due to heightened economic
uncertainties as well as the high base effect
Nov13 foreign tourist arrivals were still well above previous years, but lingering political turmoil slashed growth
Nov13 exports remained sluggish amid muted global demands and supply restrictions in certain marine
products
-2.4% -7.8%
-48.0%
-25.0%-19.6%
-7.8%
-60%
-40%
-20%
0%
20%
PCI PII Passenger Car Sales
Commercial Car Sales
Imports of Capital Goods
Imports of Consumer
Goods
%Yo
Y
2Q13 3Q13 Oct-13 Nov-13
-4.0%
-3.0%
-20%-15%-10%-5%0%5%10%15%20%25%30%35%
0
5,000
10,000
15,000
20,000
25,000
Nov-11 Mar-12 Jul-12 Nov-12 Mar-13 Jul-13 Nov-13
% Y
oY
Expo
rt Va
lue
(USD
Milli
on)
Exports Exports (excluding gold)
% YoY for Exports % YoY for Exports exc Gold
Economic Condition Highlights: November - December 2013
110
Nov13 MPI contracted further due to lukewarm domestic and external demand, as well as a high base effect
Sources: BOT, MOC, OIE, REIC (Real Estate Information Center)
New condominium registration picked up on transferring of completed units
Dec13 inflation declined in light of dismal economic dataLand and property prices continued to rise in 3Q13
amid good demand in Bangkok and vicinity due to the development of public mass transit
-10.5
63.1
3545556575
(100)(50)
-50
100
Aug-11 Dec-11 Apr-12 Aug-12 Dec-12 Apr-13 Aug-13
%C
apac
ity U
tiliz
atio
n R
ate
%Yo
Y of
MPI
MPI (lhs) %Capacity Utilization (rhs)
0.0
1.0
2.0
3.0
4.0
5.0
-0.5
0.0
0.5
1.0
1.5
Jul-12 Nov-12 Mar-13 Jul-13 Nov-13
%Y
oY
%M
oM
Headline CPI (MoM-lhs) Core CPI (MoM-lhs)
Headline CPI (YoY-rhs) Core CPI (YoY-rhs)
Economic Condition Highlights: November - December 2013
0.9% YoY
1.7% YoY

111
Exports and Imports: 11M13Exports by Country
Top 10 Exports by Product (BOP Basis)
Source: Bank of Thailand (BOT), BOP Basis = Balance of Payment Basis
Imports by Country
Top 10 Imports by Product (BOP Basis)
Total Imports (BOP Basis)11M13
USD Millions Weight %YoY Total Imports 201,199 100.0% -0.4%
Fuel 45,471 22.6% 4.2%Machinery, equipment, and supplies 42,080 20.9% -9.9%Electronics parts and electrical appliances 24,539 12.2% -2.8%Materials of base metal 20,120 10.0% -0.7%Non-monetary gold 14,077 7.0% 34.3%Automotive 12,463 6.2% -3.8%Chemicals 12,460 6.2% -2.4%Non-durables Consumer goods 12,085 6.0% 5.4%Agricultural and agro-manufacturing products 8,155 4.1% -4.9%Plastics 7,013 3.5% -2.7%
Total Exports (BOP Basis)11M13
USD Millions Weight %YoY Total Exports 207,315 100.0% -0.3%
Electronics 30,094 14.5% -0.6%Automotive 29,031 14.0% 9.8%Agro-manufacturing Products 25,745 12.4% -2.5%Machinery & Equipment 16,293 7.9% 3.0%Petroleum products 11,733 5.7% -3.3%Petro-chemical Products 11,386 5.5% 5.8%Electrical Appliances 10,918 5.3% 2.5%Metal & Steel 10,047 4.8% -2.0%Chemicals 8,317 4.0% 8.1%Other Manufacturing products 7,389 3.6% 5.8%
112
US
D M
illio
n
Top 10 Exports by Product (BOP Basis) Top 10 Imports by Product (BOP Basis)
Export and Import Data: 2008-2012Exports by Country
Source: Bank of Thailand (BOT), BOP Basis = Balance of Payment Basis
Imports by Country
21.5%5.3%5.7%11.4%11.3%9.1%13.2%22.6%
23.0%5.7%6.2%10.9%10.3%10.6%11.9%21.3%
22.7% 22.5%4.9% 4.7%6.7% 5.4%10.3% 9.8%10.5% 10.7%11.0% 11.8%11.2% 10.9%22.7% 24.3%
23.2%6.4%18.7%12.2%8.0%16.8%
15.7%
18.5% 16.6% 16.2% 16.1%9.0% 7.6% 7.8% 8.1%12.7% 13.2% 13.3% 14.8%18.7%20.7%
18.4% 19.8%6.3%
5.8%5.9% 5.0%
12.4%11.6%
13.3% 12.9%24.4%25.0% 23.2%
22.4%
US
D M
illio
n
Total Exports (BOP Basis)2012
USD Millions Weight %YoYTotal Exports 225,875 100.0% 3.1%
Electronics 33,004 14.6% 0.9%Automotive 29,366 13.0% 26.3%Agro-manufacturing Products 28,557 12.6% 4.1%Machinery & Equipment 17,091 7.6% 1.9%Petroleum products 13,096 5.8% 15.7%Petro-chemical Products 11,703 5.2% -1.8%Electrical Appliances 11,531 5.1% 2.2%Metal & Steel 11,406 5.0% 21.2%Rubber 8,746 3.9% -31.1%Chemicals 8,384 3.7% 2.1%
Total Imports (BOP Basis)2012
USD Millions Weight %YoYTotal Imports 219,860 100.0% 8.8%
Machinery, equipment, and supplies 50,537 23.0% 28.3%Fuel 47,359 21.5% 9.5%Electronics parts and electrical appliances 27,247 12.4% 1.0%Materials of base metal 21,866 9.9% 1.5%Automotive 14,259 6.5% 43.4%Chemicals 13,675 6.2% -4.6%Non-durables Consumer goods 12,418 5.6% 11.5%Non-monetary gold 12,379 5.6% -24.8%Agricultural and agro-manufacturing products 9,311 4.2% 6.4%Plastics 7,894 3.6% 10.7%
24.6%9.5%11.7%10.2%9.9%5.7%5.1%23.1%

113
106
49.5
24.2
210.
7
100.
5
80.9
455.
5
0
100
200
300
400
500
Agricultu
re
Minerals&Ceramics
Light Industr
y
Metal Processing
Electro
nics & Electri
cal
Chemical P
lastic Paper
Service & Inf
rastructu
re
Inve
stm
ent V
alue
(Bt b
n)
2009 2010 2011 2012 2013
281.4
491.3 447.3
983.6 1,027.3
0
200
400
600
800
1,000
1,200
2009 2010 2011 2012 2013
Inve
stm
ent V
alue
(B
t bn
)
Economic Condition Highlights: CAPEX and Investment Cycle
Source: BOT, MOC, OIE
(Data as of January 2014)
Capacity Utilization by Key Industries:
Investment value of BOI-approved applications (by Industry)*
Source: BOINote: *Figures above indicate investments of approved projects requesting investment promotion benefits from BOI
Investment value of BOI-approved applications (Total)*
51.86
48.97
43.32
69.05
88.76
77.80
50.11
98.62
71.26
61.81
0 50 100 150
Food and Beverage
Tobacco
Garments
Paper and Paper Products
Chemical & Chemical Products
Rubber & Plastic Products
Basic Metal
Vehicles
Integrated Circuits & Parts
Household Electrical Appliances
2010
2011
2012
11M 2013
Avg 04-08
114
19.4
13.5
10.9
-15.0
-10.0
-5.0
0.0
5.0
10.0
15.0
20.0
25.0
Land Single House Townhouse
1,000 Units
Supply Side: New Housing Completions and New Projects Launched in BMR*
1,000 Units
Demand Side: Transferred Properties in BMR*
Price Growth of Properties
Sources : National Economic and Social Development Board (NESDB), BOT, Real Estate Information Center (REIC), Agency for Real Estate Affairs (AREA), the BOT, and KResearch Note: * Including Condominium, Single House and Townhouse; BMR = Bangkok and Metropolitan Area
% (YoY)
Property Market: No clear sign of property bubble Outstanding Mortgage Loans to Individuals and Property Developers loan to GDP
%
Mortgage loans to GDP is higher than the pre-crisis level, due to several factors such as changes in consumer behavior, intense competition among banks, and a more accessible credit market
Outstanding loans granted to property developers (including contractors) to GDP was 6.1%, still lower than the pre-crisis level
Supply Side: New housing completions and new projects launched were still below the pre-crisis level
Demand Side: In the last 5 years, the number of transferred properties was still higher than the supply side figures
Prices: Property prices are on an upward trend because of the minimum wage increase and increasing cost of construction materials
Mortgage loans’ NPL among Thai commercial banks remained low at 2.3%, as of 3Q13
Avg. price growth in last 5-years (2008-2012): Land 7.1%; Single House 1.7%; Townhouse 3.1%
Avg. 5-year price growth before the crisis (1992-1996): Land 9.4%; Single House 6.3%; Townhouse 6.3%
5.4
6.7
7.8
146 161 178 151 156 124
0
100
200
2008 2009 2010 2011 2012 9M13
136 145 135 125
43 16 20 13 20 37 49 46 51 50 62 75 84 62
101 75
284
190 132
44 3
4 9 14
31 52 68 64 66 81 68 58 117 86 10290
0 50
100 150 200 250 300 New Housing Completions New Projects Launched

115
Household Borrowing
Source: BOT, Bank for International Settlements (BIS), National Statistical Office (NSO), and KResearch
Debt Service Ratio of Thai households
Household Borrowing to GDP
Household borrowing to GDP is higher than the pre-crisis level, due to several factors such as changes in consumer behavior, intense competition among banks, and a more accessible credit market
Thailand’s household debt to GDP is comparable to other countries and the debt service ratio of Thai households is still well below 40%, indicating that the household debt situation is unlikely to trigger any problems in the foreseeable future
NPL ratio for consumption loans of Thai commercial banks slightly increased; however, it is still below the 5-year average, reflecting a better quality of loans
Old Definition: Data from 1991 – 1997 are lending from commercial banks and SFIs to individual persons for consumption onlyNew Definition: Data from 2010 onwards takes into account individual persons’ outstanding loans from all types of financial
institutions, including saving Co-ops and non-banks
% NPL for Consumption Loans of Thai Commercial Banks
Old Definition New Definition
Cross-Country Comparison of Household Debt
116
Key Regulations for Mortgage Loans
Note: * The effective date is postpone from January 2012, due to the severe floods in 2011
Source: The Bank of Thailand
Price Condominium HouseLoan to Value
(LTV)Risk
WeightsEffective Date
≥ Bt10mn > 80%
75%
March 2009
< Bt10mn > 90% January 2011
< Bt10mn > 95% January 2013*
≥ Bt10mn ≤ 80%
35%
March 2009
< Bt10mn ≤ 90% January 2011
< Bt10mn ≤ 95% January 2013*
The BOT has taken preventive actions and closely monitored risk in the property market
Risk weights for mortgage loans dropped from 50% to 35% under Basel II since 2008
However, the BOT announced revised criteria in 2009-2010 on mortgage loan risk weights with a different effective date

117
QE Tapering and Thailand Economic Impacts
The Dec13 FOMC meeting resulted in QE tapering (US Treasuries and Mortgage-backed securities) as much as USD10bn in the Jan14 meeting. Further tapering will likely depend on US economic sentiment, going forward
Instances where QE tapering or domestic political issues triggerdrastic fund outflows, Thailand’s external stability will likely be maintained, as our FX reserves should be more than enough to meet all obligations
Thai banking system liquidity is sufficient to sustain loan growth, with a high CAR ratio (16.6%, as of Oct 13), low NPLs(2.2%, as of 3Q13), and strong profit-generating capacity (Bt173.8bn and Bt164.6bn in 2012 and 9M13)
Pace of Fed’s asset purchases under Quantitative Easing Program
Source: KResearch and *FOMC (18 Dec 2013) 23.6
167.6
0
50
100
150
200
$Billion
FX Reserves
Net Fwd Position
$191.3 Bn
64.3
22.0
43.0
5.0
0
50
100
150
200
$BillionCurrent Account DeficitReserves backing banknotesNR Bond HoldingsST External Debt
$134.3 Bn
Thailand has enough FX reserves to meet all of its internal and external obligations
Thai commercial banks have high liquidity AssetsThai commercial banks have high liquidity assets
Note: Liquidity includes cash, as well as net positions in short-term money market and net investments
Tapering size depends on economic momentum
118
High international reserve / Imports (Import Coverage)
High international reserve ratio / External debts
Low foreign holding ratio in Thai government bonds
Thailand’s external balances remain relatively strong compared to peers
QE tapering will likely pose manageable impact on the Thai economy, as well as Thai commercial banks, due to:
High import coverage (international reserves/monthly imports) compared with the IMF’s three months of imports coverage guideline
More than 100% of external debt is covered by international reserves
Low portion of foreign holdings in Thai government bonds compared with other countries
Notes: 1) International Reserve as of August 2013 was USD168.8bn2) Foreign investor holdings as of September 2013:
- Thai Government bonds: Bt570bn or 17.9% of the total Bt3.3trn in Thai Government bonds- Thai bonds: Bt770bn or 8.6% of the total Bt8.9trn in Thai bond market size
Source: Various central banks, ADB, Bloomberg, World Bank Complied by KResearch

119
Bond Yields
Current Account and FX Reserve
Other FiguresThai Bond Market Size (Gov. and Private bonds)
Foreign Holdings of Thai Bonds
4,88
8,17
7
5,08
5,98
0
6,11
8,23
7
6,96
2,13
6
7,32
7,10
0
8,57
9,95
7
8,63
6,04
0
8,87
5,30
0
8,91
9,66
6
8,56
3,86
7
57%56%68%69%70%75%76%78%78%
72%
0%10%20%30%40%50%60%70%80%90%
0
2,000,000
4,000,000
6,000,000
8,000,000
10,000,000
2007
2008
2009
2010
2011
2012
1Q 1
3
2Q 1
3
3Q 1
3
4Q 1
3
Per
cen
t to
GD
P
Mil
lio
n B
aht
Thai Bond Outstanding (LHS)
Bond Market Size to GDP (RHS)
49,0
15
76,4
55
65,8
92 280,
459
418,
549
710,
467
849,
971
770,
168
770,
967
718,
420
1.0%1.5%1.1%
4.0%5.9%
8.3%9.9%8.7%8.6%8.4%
0%
2%
4%
6%
8%
10%
12%
-100,000
100,000
300,000
500,000
700,000
900,000
20
07
20
08
20
09
20
10
20
11
20
12
1Q
13
2Q
13
3Q
13
4Q
13
%o
f T
ota
l B
on
d M
arke
t
Mil
lio
n B
aht
Foreign Holding Outstanding (LHS)
% of Thai Bond Market (RHS)
2.2 2.22.5 2.8
3.13.4 3.5 3.7 3.7 3.9 4.0 4.2
2.00
3.00
4.00
6M 2Y 4Y 6Y 8Y 10Y
Dec-11 Dec-12 Dec-13 Jan-14
%
* Data as of January 17, 2014
*
020,00040,00060,00080,000100,000120,000140,000160,000180,000200,000
-20,000
-15,000
-10,000
-5,000
0
5,000
10,000
15,000
20,000
25,000
US
D M
illio
n
US
D M
illio
n
Current Account (LHS) FX Reserves (RHS)
USD167.2bn (Dec13)
(-)USD5.3bn (11M13)
120
Other FiguresHousing Loans/GDP
Credit Card Loans/GDP
Personal Loans/GDP
Source: BOT, NESDB
Note: 2013 GDP is based on 3Q13 GDP annualized
Note : Housing loans represent outstanding housing loans for personal consumption granted to individuals of householders by financial institutions (including Commercial banks, Finance companies, Credit financiers, SFIs, and Insurance companies but excluding Saving Cooperatives and others financial Institution)
Note : Credit card loans represent outstanding credit card loans from commercial banks and non-banks, excluding SFIs, saving cooperatives and others financial Institutions
Note : Personal Loans represent outstanding personal loans under supervision(including commercial banks and non-banks, excluding SFIs, saving cooperatives and others financial Institution)
.

121
Other Figures
Credit Card Statistics
Loans to GDP as of 2012
Source: BOT, NSO, CEIC, and KResearch
Thai Banks’ Net Loans and NPLs
Note: Data on China, Korea and Japan include loans from commercial banks as well as financial institutions, the rest include loans only from commercial banks
Note : %YoY Net loans represent growth of net loans in 14 Thai commercial banks, % Gross NPLs as of Sep-13
Note: The credit card statistics number includes foreign bank and non-bank credit cards
GDP Per Capita
8.3%9.8%
7.9%5.8%
-1.1%
11.1%
3.9%
7.3%
4.50%
-2.0%0.0%2.0%4.0%6.0%8.0%10.0%12.0%
-
50,000
100,000
150,000
200,000
2005 2006 2007 2008 2009 2010 2011 2012 2013F
Bath
GDP Per Capita % YoY
122
Other Figures
Net Foreign Direct Investment
Population and Labour force Unemployment Rate
Source: NESDB, National Statistical Office (NSO), and KResearch
65.7 66.3 66.9 67.3 67.6 67.9 68.3
39.036.9 37.7 38.4 38.6 38.5 38.9
0.0
10.0
20.0
30.0
40.0
50.0
60.0
70.0
80.0
2007 2008 2009 2010 2011 2012 10M2013
Population Labour force
% YoY
million
Foreign Direct Investment Position by Countries
35.8%
14.6%
18.8%
9.7%
21.1% 21.2%
9.5%
18.8%
17.1%
33.5%
24.5%
9.2%
17.5%
17.0%
31.7%
24.4%
9.3%16.5%
19.8%
30.0%
23.1%
9.2%16.3%
20.4%
31.0%
%
Note: - FDI refers to equity investment, lending to affiliates, and reinvested earnings; investment in equity is treated as a direct investment when the direct investors own 10% or more of ordinary shares- Net FDI is the net flow of FDI data in each year as per flow concept- FDI position by countries is an investment outstanding that nonresident investors have with resident enterprises as stock concept

123
1.89 2.18 2.33 2.41 2.50 2.70
2010 2011 2012 2013F 2014F 2015F
CompetitiveEconomic
Region
CompetitiveEconomic
Region
EquitableEconomic
Development
EquitableEconomic
Development
IntegrationWith theGlobal
Economy
IntegrationWith theGlobal
Economy
Single Market and Production
Base
Single Market and Production
Base
Average Projected GDP Growth = 5-5.5%
Average Projected GDP Growth = 5-5.5%
Source: IMF (October 2013), KResearch
Thailand-ASEAN Trade: around 12.5% average growth expected during 2013-2015
Size of ASEAN Economy (USD Trillion)
The ASEAN Economic Community (AEC)
Source: The Association of Southeast Asian Nations, KResearch
AEC by 2015
By 2015, ASEAN will be transformed into the “ASEAN Economic Community,” with free movement ofgoods, services, investment, and skilled labour, and a freer flow of capital
MYANMAR
124
For Further Enquiries, Contact KASIKORNBANK Investor Relations:
Chief Investor Relations Officer Tel (66) 2470 2673-4
Fax (66) 2470 2680
Investor Relations Team Tel (66) 2470 6900-1
Tel (66) 2470 2659-62
Fax (66) 2470 2690
Email: [email protected]
IR Website www.kasikornbank.com Investor Relations
Disclosure Practice:
Unreviewed/unaudited quarterly financial reports are released within 21 days from the end of each period
Reviewed financial reports are released within 45 days from the end of the period for 1Q and 3Q; Audited financial reports are released within 60 days from the end of the period for 2Q and 4Q
Following good governance practice, KASIKORNBANK maintains a "silent period" for approximately 7 days prior to the unreviewed/unaudited earnings announcement. During this period, the Bank refrains from replying to questions or commenting on the earnings announcement

125
This document is intended to provide material information relating to investment or product in discussion and for reference during
discussion, presentation or seminar only. It does not represent or constitute an advice, offer, contract, recommendation or solicitation and
should not be relied on as such. In preparation of this document, KASIKORNBANK PUBLIC COMPANY LIMITED (“KBank”) has made
several crucial assumptions and relied on the financial and other information made available from public sources, and thus KBank assumes
no responsibility and makes no representations with respect to accuracy and/or completeness of the information described herein. Before
making your own independent decision to invest or enter into transaction, the recipient of the information (“Recipient”) shall review
information relating to service or products of KBank including economic and market situation and other factors pertaining to the transaction
as posted in KBank’s website at URL www.kasikornbank.com and in other websites including to review all other information, documents
prepared by other institutions and consult financial, legal or tax advisors each time. The Recipient understands and acknowledges that the
investment or execution of the transaction may be the transaction with low liquidity and that KBank shall assume no liability for any loss or
damage incurred by the Recipient arising out of such investment or execution of the transaction.
The Recipient also acknowledges and understands that the information so provided by KBank does not represent the expected yield or
consideration to be received by the Recipient arising out of the execution of the transaction. Further the Recipient should be aware that the
transaction can be highly risky as the markets are unpredictable and there may be inadequate regulations and safeguards available to the
Recipient.
KBank reserves the rights to amend either in whole or in part of information so provided herein at any time as it deems fit and the Recipient
acknowledges and agrees with such amendment. Where there is any inquiry, the Recipient may seek further information from KBank or in
case of making complaint, the Recipient can contact KBank at [email protected] or +(662) 470 6900 to 01, +(662) 470 2673 to 74.
* The information herewith represents data in the Bank's consolidated financial statements, some of the numbers and ratios are calculated
before netting with KBank’s non-controlling interest.
DISCLAIMER:
126