keep commerce human. · third-party payment providers; (16) acquisitions that may prove...
TRANSCRIPT

Keep commerce human.
Investor PresentationMay 2020

This presentation is a high-level summary of our Q1 2020 and financial results. For more information please refer to our press release dated May 6, 2020 and filings with the SEC.
Forward-looking Statements
2
This presentation contains forward-looking statements within the meaning of the federal securities laws. Forward-looking statements include statements relating to our financial guidance for the second quarter of 2020 and key drivers thereof; the impact of our investments on topline growth the uncertain impacts that the COVID-19 pandemic may have on our business, strategy, operating results, key metrics, financial condition, profitability, and cash flows and changes in overall level of consumer spending and volatility in the global economy and the impact of ongoing settlement of intercompany balances on future foreign exchange rate volatility.
Forward-looking statements include all statements that are not historical facts. In some cases, forward-looking statements can be identified by terms such as “anticipates,” “believes,” “could,” “estimates,” “expects,” “may,” “plans,” “will,” “intends,” or similar expressions and the negatives of those words.
Forward-looking statements involve substantial risks and uncertainties that may cause actual results to differ materially from those that we expect. These risks and uncertainties include: (1) COVID-19 pandemic is unprecedented and is impacting our GMS and results of operations in numerous ways that remain volatile and unpredictable; (2) the fluctuation of our quarterly operating results; (3) our failure to meet our publicly announced guidance or other expectations; (4) our ability to successfully execute on our business strategy or if our strategy proves to be ineffective; (5) our ability to attract and retain an active and engaged community of sellers and buyers; (6) our history of operating losses; (7) macroeconomic events that are outside of our control; (8) our ability to recruit and retain employees; (9) the importance to our success of the trustworthiness of our marketplace and the connections within our community; (10) our ability to enhance our current offerings and develop new offerings to respond to the changing needs of sellers and buyers, including the success of our Etsy Ads platform; (11) the effectiveness of our marketing efforts; (12) the effectiveness of our mobile solutions for sellers and buyers; (13) our ability to expand our business in our core geographic markets; (14) regulation in the area of privacy and protection of user data; (15) our dependence on third-party payment providers; (16) acquisitions that may prove unsuccessful or divert management attention, including our acquisition of Reverb; and (17) the potential misuse or disclosure of sensitive information about members of our community and the potential for cyber-attacks. These risks and uncertainties are more fully described in our filings with the Securities and Exchange Commission, including in the section entitled “Risk Factors” in our Annual Report on Form 10-K for the year ended December 31, 2019, current report on Form 8-K filed on May 6, 2020 and subsequent reports that we file with the Securities and Exchange Commission. Moreover, we operate in a very competitive and rapidly changing environment. New risks emerge from time to time. It is not possible for our management to predict all risks, nor can we assess the impact of all factors on our business or the extent to which any factor, or combination of factors, may cause actual results to differ materially from those contained in any forward-looking statements we may make. In light of these risks, uncertainties and assumptions, we cannot guarantee future results, levels of activity, performance, achievements or events and circumstances reflected in the forward-looking statements will occur. Forward-looking statements represent our beliefs and assumptions only as of the date of this presentation. We disclaim any obligation to update forward-looking statements.

Etsy’s Value Proposition
One of a kind platform offering unique handcrafted goods from
creative entrepreneurs around the world
Significant early stage opportunity to own “special” and capture a greater
share of a $250B+ TAM
Successfully executing a long-term growth strategy focused on our Right to Win
Leveraging our strong brand awareness with marketing initiatives to drive
frequency and growth
4
Flexible business model, delivering strong top and bottom line operating &
financial performance
5
1 2 3
6
Agile team, able to execute successfully through an extraordinary time to support
our global community

1
One of a kind platform offering unique handcrafted goods from creative entrepreneurs around the world

SellersBuyers2.8 Million*Active Sellers
47.7 Million*Active Buyers
Our marketplaces have two-sided vibrancy...
~66 million items
*Results are Consolidated as of March 31, 2020 and include Reverb buyers and sellers.
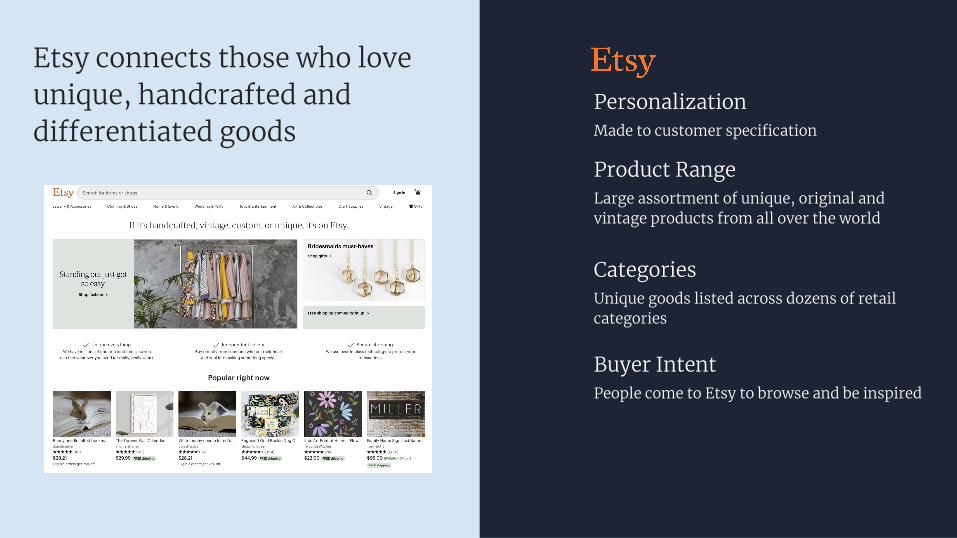
CategoriesUnique goods listed across dozens of retail categories
Product RangeLarge assortment of unique, original and vintage products from all over the world
PersonalizationMade to customer specification
Etsy connects those who love unique, handcrafted and differentiated goods
Buyer IntentPeople come to Etsy to browse and be inspired

*2019 survey of Etsy buyers
In a survey of Etsy buyers, 88% agreed that Etsy has items you
can’t find anywhere else

≠ specialself-expression
fun
human
personal
In a sea of sameness, we offer something unique...
everydaycommodities

2
Significant early stage opportunity to own “special” and capture a greater share of a
$250B+ TAM

~$100BMarket for “Special”
$1.7T 6 core geographiesAcross all relevant retail categories
→
$5B2019 Global GMS
Etsy Estimated Market Share:~5%
Top Geographies:United StatesUnited KingdomCanadaGermanyAustraliaFrance
Expanded to include online spend in ALL relevant retail categories and core geographies
Sources: Euromonitor (2018), Assoc. for Creative Ind. (Jan 2018), Art Basel (2018), Hiscox (2018), IBIS, Etsy Consumer Survey
2018 TOTAL RETAIL AND ONLINE TAM 2018
$249B
Significant opportunity to grow market share in a very large TAM

Based upon shopping styles...we know there’s a large population who would love Etsy - 40% of consumers fit our profile
Expressives28.8%
Target consumers for “special”
Data from a June 2018 Etsy study of US consumers
Seekers14.8%
~40%
Expressives
US Consumers
Seekers
We use this information to help size the marketplace for “Special”
3
Successfully executing a long-term growth strategy focused on our Right-to-Win

United StatesUnited KingdomCanadaGermanyAustraliaFrance
1.Focus on the core Etsy marketplace in our 6 core geographies
2.Build a sustainable competitive advantage around four key elements
Best-in-Class Search and Discovery
Human Connections
A Trusted Brand
Our Collection of Unique Items
× ×
Disciplined and focused long-term growth strategy

4
Leveraging our strong brand awareness with marketing investments to drive buyer
frequency and growth

Our buyers love Etsy, but many only shop once a year...
46 Million*
59%1x/year1
60+ NPS score among recent purchasers2
*Active buyers for Etsy marketplace includes Reverb and were approximately 46.4 million, as of December 31, 2019.1 Percent of buyers who have made purchases on only one day in the previous 12 months, as of December 31, 2019. 2Net Promoter Score for recent purchasers in Jan 2020 Etsy buyer survey; recent purchasers defined as having made purchase within past 30 days of answering survey.

And while millions love us, they don’t know when to think of us...
Prompted Awareness
Unprompted Awareness
Visit Intent (Consideration)
Purchase Intent
Loyalty
Advocacy
84%
41%
29%
23%
27%
25%
Etsy Brand Funnel: U.S., Q4 2019
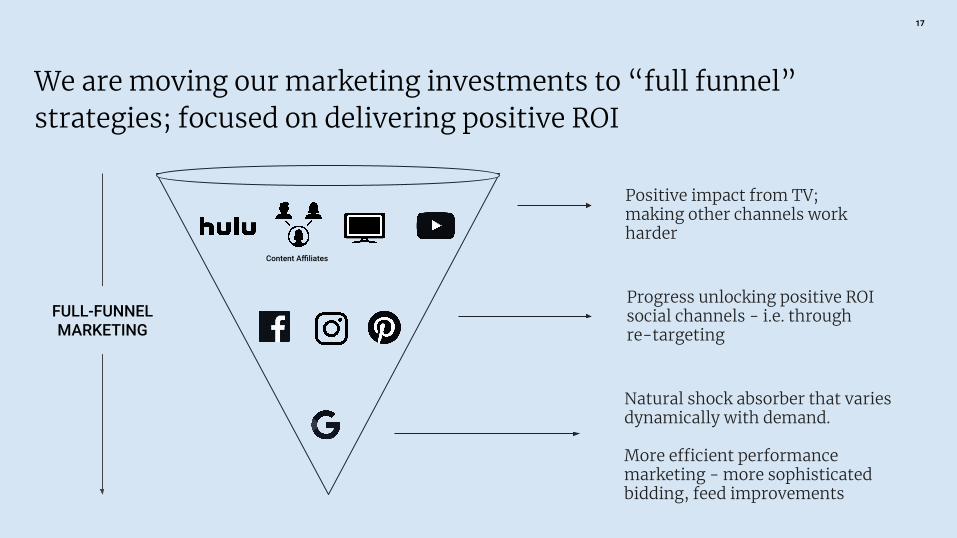
We are moving our marketing investments to “full funnel” strategies; focused on delivering positive ROI
17
FULL-FUNNEL MARKETING
Natural shock absorber that varies dynamically with demand.
More efficient performance marketing - more sophisticated bidding, feed improvements
Progress unlocking positive ROI social channels - i.e. through re-targeting
Positive impact from TV; making other channels work harder
Content Affiliates

Our goal is to make Etsy relevant for more of our buyers’ “special” purchase occasions
JANUARY | FEBRUARY | MARCH | APRIL | MAY | JUNE | JULY | AUGUST | SEPTEMBER | OCTOBER | NOVEMBER | DECEMBER
HolidayMother’s DayValentine’s Day Halloween
Special DressNew Home BabyWedding Back to school
4th of JulyEaster ThanksgivingLabor Day

5
Flexible business model, delivering strong top and bottom line operational and
financial performance
19

Includes Reverb financial results
Solid financial results despite macro uncertainty stemming from a global pandemic...
Adjusted EBITDA1
$55.1M+24.1% Margin
1Reconciliation of non-GAAP financial measures is contained in the appendix² EPS reflects diluted earnings per share
Includes Reverb financial results
20
Revenue
$228M+34.7% Y/Y
GMS
$1.4B+32.6% Y/YCurrency-Neutral
20.6%22.8% 31.1%
33.0%
32.6%
Includes Reverb financial results
40.1%36.8% 31.6%
35.0%34.7%
29.4%21.9%
21.3% 20.2% 24.1%
Q1
2020
Met
rics Net Income
$12.5M $0.10EPS²
$55.1

Services Revenue(Optional value-added services)
Advertising
Shipping Label /Protection
Other
Marketplace Revenue
Listing Fee
Transaction Fee
Payments Platform
$155.9M, up 22.6% YoY
$72.1M, up 71.1% YoY
Includes Reverb results Etsy transaction fee 5% and Reverb transaction fee 3.5% both including shipping fees Etsy Payments (3-4.5% +flat fee) plus Reverb Payments (2.5%-2.7% +flat fee)
1Q 2020 CONSOLIDATED REVENUE $228M, UP 34.7% YOY
Helped by our diversified revenue model consisting of marketplace fees and optional value-added services
21

GMS per Active Buyer3
Year-over-year growth
Improvement in key operating metrics signal continued progress improving frequency
1.0% 1.9% 3.7% 6.0%
2.0% 1.3% 1.8% 3.8%
Active Buyers1
47.7M+16% Y/Y
Habitual Buyers2
2.6M+22% Y/Y
4.1%
6.1%2-year growth rate
22
1Active buyers reflected for the consolidated marketplace2Habitual Buyers are a segment of buyers from the Etsy standalone marketplace3GMS per Active Buyer reflects results from the Etsy standalone marketplace

TTM Free Cash Flow Conversion2 (%)
Strong cash flow generation reinforces our financial position and capital allocation strategy
Strong Financial Position
Cash1
$898M
1Cash, Cash Equivalents, and Investments (short and long term)2Reconciliation of non-GAAP financial measures is contained in the appendixNon-GAAP Free Cash Flow Conversion is Free Cash Flow divided by adjusted EBITDA
23

Organic Growth Opportunistic M&A Return of Capital
Product and engineering resources
Marketing
Back office efficiencies to scale
Geographies (e.g. DaWanda*)
Adjacent marketplaces (e.g. Reverb)
Technology (e.g. Blackbird)
Vertical extensions
$222.5m worth of shares repurchased from Q4 2017 through Q1 2020 ¹
Cumulative average repurchase price of $33.78 ¹
We use our cash to invest for growth and value creation
*DaWanda Referral Agreement June 2018¹ Pursuant to board approved plan; excludes concurrent purchase with Q3 2019 debt offering. Given the macroeconomic situation related to COVID-19, our Board of Directors has decided to pause our share program.
24

Founded in 2013 and based in Chicago with core markets in US, UK, Germany, France & Australia
Mission & business model aligned with Etsy
Focused on inspiring content, price transparency and musician focused e-commerce tools to create a significant competitive advantage
Marketplace operated separately from Etsy.com
Reverb’s 2020 focus areas include: ● Investing in infrastructure● Establishing a product experimentation
process and ● Maturing marketing channels to drive
growth
Reverb: the Etsy of musical instruments - acquired August 2019
25

Agile team, able to execute successfully through an ‘extraordinary’ time to support our global community
26
6

Josh SilvermanChief Executive Officer
Rachel GlaserChief Financial Officer
Mike FisherChief Technology Officer
• Member of Etsy’s Board of Directors
• Two decades of leadership experience include growing consumer technology companies and scaling global marketplaces
• Previously served as President of Consumer Products and Services at American Express, CEO of Skype, and CEO of shopping.com, and held various executive roles at eBay
• Brings more than 30 years of senior financial experience to Etsy
• Previously at Leaf Group, where she served as CFO since 2015
• As the CFO at Move, Inc. she helped lead a successful sale of the company to News Corporation
• Manages our services platform globally overseeing development of the tools and services that enable our sellers to effectively start, scale and manage their creative businesses
• Held many integral roles at Etsy over the past six years from Business & Corporate Development, International, Marketplace Integrity and Trust & Safety
Kruti Patel GoyalChief Product Officer
Jill SimeoneGeneral Counsel and Secretary
• Brings more than 15 years of experience in international strategic advising, compliance, and public company reporting
• Before joining Etsy, Jill served as Vice President, Senior Counsel and Assistant Secretary at American Express Global Business Travel
• Manages our technology strategy helping to further scale our global platform
• Prior to joining Etsy, Mike was the co-founder and managing partner of the consulting firm AKF Partners
• Mike’s career in technology has also included the roles of Chief Technology Officer of Quigo, Vice President of Engineering & Architecture for PayPal, and various roles at General Electric
Raina MoskowitzSenior Vice President of People, Strategy, and Member Services
• Raina Moskowitz is Etsy’s Senior Vice President of People, Strategy, and member services. In this role, her mission is to develop and enable Etsy’s strategy by delivering exceptional service and experiences for both employees and customers.
• She comes to Etsy after nearly 13 years at American Express, where she held multiple leadership roles in product, strategy, operations and marketing.
Our Leadership Team
Ryan ScottChief Marketing Officer
• Two decades of marketing and e-commerce experience.• Leads Etsy’s digital marketing, advertising, communications, brand, market research and international growth initiatives.
• Prior to joining Etsy, Ryan was Chief Consumer and Marketing Officer at Slice, CMO of SoulCycle, Co-CEO at Pond5 and served as the first CMO of Seamless.
27

28
Covid-19 focus areas: Team, Marketplace & Brand and Financial Performance
SellersEmployees Buyers
Health and Safety
Productivity
Seller Performance
Shipping
Mindshare
Brand ReputationFocu
s A
reas
Financial Model
Expenses
Free Cash Flow
Marketplace & BrandOur Team Financials

The crisis disrupted typical buying behavior in our key categories in March
GM
S
GMS Y/Y for Select Categories
Jewelry
Home & living
Toys & games
Craft supplies & tools
Bath & beauty
Weddings
WHO declares COVID-19 a pandemic

Etsy Marketplace: April was Extraordinary
We experienced broad demand across the marketplace for both mask & non-mask items...
Mask Sales Non-Mask Sales
$133M in GMS +79% Y/Y
30

Demand shifted again in early April...
...first weekend of April generated over 2M mask-related searches
Mask-Related Search Volume
CDC recommends the use of cloth face coverings
New York mandates cloth face coverings in public
31
March April

Managed Delivery
Expectations
Rapid mobilization focused on six key areas to address surge in demand for face masks primarily due to changing CDC guidelines
Retrained our Search
Engine
Created Banners and Automated
Filters
Scaled Inventory
and Sellers
Screened Sellers
Distributed Demand
Within Hours Within Days
32

We experienced broad demand across the marketplace
Growing Demand in Key Categories and Occasions Fewer Alternatives Non-Mask GMS*
Craft SuppliesHome Decor Gifting Retail store closures
eCommerce shipping delays
Supply chain disruptions
+79%Growth in non-mask GMS during April
33
*Etsy standalone data reflected as of the month of April

March April
We’re seeing broad based demand and overall momentum for the Etsy marketplace
Key Insights*
• Face Masks represented 17% of Etsy marketplace GMS
• 22% of mask related GMS was from new buyers
• Acquired 4M new buyers and re-engaged 2.5M buyers who haven’t purchased in a year or more
• 32% of buyers who purchased a face mask returned within 14 days to make another purchase
34
*Etsy standalone data reflected as of the month of April
May

Influx of new buyers creates opportunity to build loyalty with a new cohort
Repeat Purchase Rate
Engagement
Create a comfort-filled home with one-of-a-kind creations.
Cozy home decorShop now >
TV
Paid Social
PLA & SEM
6.5M
32%
New buyers and those who have not purchased for a year or more*
Of mask buyers had a 14 day repeat purchase rate; higher than average*
35
Push
Organic Social
*Etsy standalone data reflected as of the month of April

We pivoted our brand strategy, messaging and spend to support Etsy sellers and drive buyer engagement beyond our traditional use cases
Brand Platform Category Alignment TV Creative Engagement
Strategies
Open for BusinessEveryday Essentials#StandWithSmall
Pivoted inventory to favor in demand products and categories
Delivering the Etsy story through the lens of our sellers
Enhancing investments to expand exposure and reach
TV & Social Investments
Building loyalty and retention among buyers (CRM, other targeting tools)
36

Our Reverb marketplace leveraged the ability to serve as a primary online channel for its sellers
37
Local music shops & gear makers are still online and shipping via Reverb marketplace
New Buyers
Seeing a surge in first time buyers
Shipping availability is driving traffic and GMS
Manufacturers embrace selling directly on the platform
Shipping Availability Manufacturers

Optimizing our cost structure while investing for long term growth
Offsite Ads fees waived
Bill Payment Deferral
Seller Resources and Support
Listing and Ad Credits
~$11M - $13M One-time
investments in our seller community
One-time Investments to Support our Sellers
38
Brand Marketing
Incremental Product Investments including Search and Frequency
Leaning into Variable Investments for Long Term Growth

Total GMS Growth Core Business Trends Tailwinds Headwinds
• Mask sales• Mask adjacent sales• New buyer cohorts• Offline to Online• Competitive dynamics• Pent-up demand• Gifting trends• Stimulus checks• Business closures
• Economic environment• Job losses• Consumer confidence
GMS Trends by Category
Depth and duration of headwinds and tailwinds are unknown
• Organic GMS• Product Development• Marketing
39

Q2 Guidance
Etsy has temporarily moved to providing quarterly guidance in light of uncertain macro conditions
40
*Based on the mid-point of Q2 2020 revenue guidance. Reconciliation of non-GAAP financial measures is contained in the Appendix. Key factors potentially impacting our 2020 guidance are contained in the Appendix.
GMS ($)GMS Growth (%)
Revenue ($)Revenue Growth (%)
Adj. EBITDA* ($)Adj. EBITDA Margin (%)
Q2 Consolidated GuidanceMay 6, 2020
~$2.0B-$2.2B80 - 100%
~$310M-$340M70 - 90%
$75M-$90M~23 - 27%

Appendix

Etsy withdrew its 2020 Annual Guidance on April 2, 2020 due to uncertainty caused by the COVID-19 crisis.We anticipate that the key factors impacting Etsy consolidated Q2 GMS and revenue guidance will be:
● The depth and duration of headwinds and tailwinds related to the healthcare and economic crisis caused by COVID-19. Headwinds and tailwinds include but are not limited to the following:
○ Headwinds: Economic environment, job losses, and consumer confidence○ Tailwinds: Retail store closures, shift in spend from offline to online, competitive dynamics, government stimulus, demand for face masks and mask
adjacent items, and the frequency of new buyer cohorts ● Continued visit growth and conversion rate improvements driven by global product launches enhancing the buying experience.● Incremental GMS from marketing investments.● The launch of our new Off-site Ads product in Q2, which is expected to generate incremental revenue in the form of an advertising fee to sellers. ● Additional external factors that may offset some growth include: sales taxes, regulatory changes, currency fluctuations, changes to VAT, elections, and the
potential for geopolitical events that impact trade, including, among other things, the COVID-19 pandemic.● GMS and Revenue performance related to our acquisition of Reverb.
We anticipate that the key factors impacting our Q2 Adjusted EBITDA guidance will be:
● Revenue growth driven by the core business● Planned investments in marketing, including investments in newer channels for Etsy with more speculative returns, as well as incremental investments in
marketing spend related to our new Offsite Ads product. ● One-time investments to support our seller community impacted by COVID-19.● Leverage in Product Development, G&A and Cost of Revenue.● Continued investment in the usage of our cloud infrastructure, most of which will be expensed through cost of revenue.● Adjusted EBITDA associated with the recent acquisition of Reverb, which we expect to be a drag on consolidated EBITDA margin for Q2.
Q1 2020 Financial Results
Key factors impacting our Q2 Guidance
*These and other risks and uncertainties are more fully described in in our Quarterly Filing on Form 10-Q for the quarter ended March 31, 2020, and subsequent reports that we file with the Securities and Exchange Commission.
42

1Q20 1Q19
(in thousands)
Revenue $228,055 $169,339
Cost of revenue 82,416 52,658
Gross profit 145,639 116,681
Marketing 48,505 35,444
Product development 37,782 24,947
General and administrative 33,987 24,647
Operating expenses 120,274 85,038
Income from operations 25,365 31,643
Other expense, net (15,672) (206)
Benefit for income taxes 2,829 142
Net income $12,522 $31,579
Net income per share — diluted $0.10 $0.24
43
Condensed Consolidated Statement of Operations
Q1 2020 Financial Results

Condensed Consolidated Statement of Cash Flows
Three months ended
3/31/20
Three months ended
3/31/19
(in thousands)
Net Income $12,522 $31,579
Net cash provided by operating activities 29,664 31,458
Net cash provided by (used in) investing activities 6,093 (22,004)
Net cash used in financing activities (32,678) (29,307)
Effect of exchange rate changes on cash (4,018) (1,458)
Net decrease in cash, cash equivalents, and restricted cash (939) (21,311)
Cash, cash equivalents, and restricted cash at the beginning of the period
448,634 372,326
Cash, cash equivalents, and restricted cash at the end of the period
$447,695 $351,015
44Q1 2020 Financial Results
Merilee Buckley
CommentCancel

Condensed Consolidated Balance Sheets
45Q1 2020 Financial Results
1Q20 4Q19
(in thousands)
Cash and cash equivalents $442,354 $443,293
Short-term investments 361,640 373,959
Accounts receivable, net 11,712 15,386
Property and equipment, net 134,519 144,864
Other current and non-current assets 567,417 564,850
Total assets $1,517,642 $1,542,352
Accounts payable $10,557 $26,324
Funds payable and amounts due to sellers 55,172 49,786
Long-term debt, net 794,129 785,126
Other current and non-current liabilities 250,937 274,482
Total liabilities 1,110,795 1,135,718
Total stockholders’ equity 406,847 406,634
Total liabilities and stockholders’ equity $1,517,642 $1,542,352

1Q20 1Q19
(in thousands)
Net income $12,522 $31,579
Excluding:
Interest and other non-operating expense, net 6,354 1,268
Benefit for income taxes (2,829) (142)
Depreciation and amortization 15,163 10,142
Stock-based compensation expense 13,811 8,082
Foreign exchange loss (gain) 9,318 (1,062)
Acquisition-related expenses 717 -
Adjusted EBITDA $55,056 $49,867
Q1 2020 Financial Results
Reconciliation of Quarterly Net Income to Adj. EBITDA
46
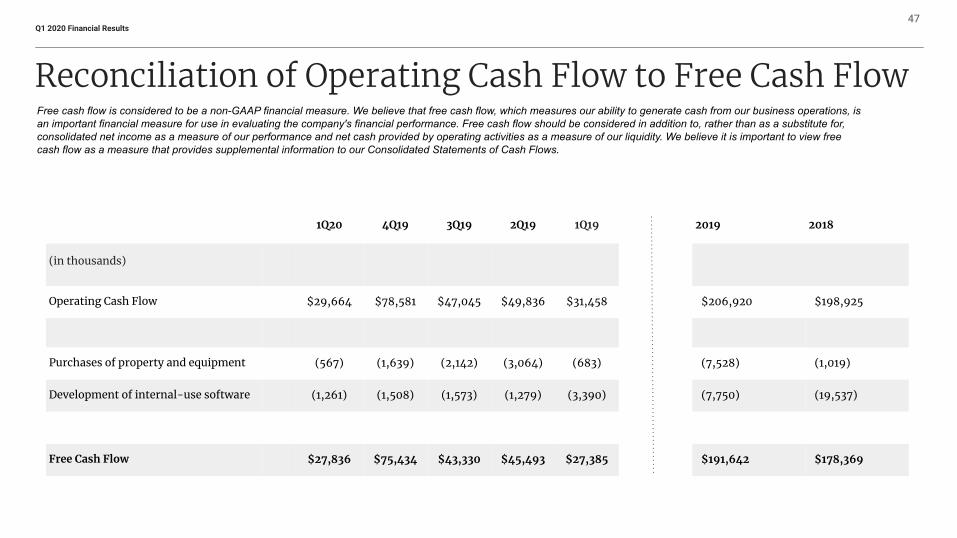
1Q20 4Q19 3Q19 2Q19 1Q19
(in thousands)
Operating Cash Flow $29,664 $78,581 $47,045 $49,836 $31,458
Purchases of property and equipment (567) (1,639) (2,142) (3,064) (683)
Development of internal-use software (1,261) (1,508) (1,573) (1,279) (3,390)
Free Cash Flow $27,836 $75,434 $43,330 $45,493 $27,385
Q1 2020 Financial Results
Reconciliation of Operating Cash Flow to Free Cash FlowFree cash flow is considered to be a non-GAAP financial measure. We believe that free cash flow, which measures our ability to generate cash from our business operations, is an important financial measure for use in evaluating the company's financial performance. Free cash flow should be considered in addition to, rather than as a substitute for, consolidated net income as a measure of our performance and net cash provided by operating activities as a measure of our liquidity. We believe it is important to view free cash flow as a measure that provides supplemental information to our Consolidated Statements of Cash Flows.
47
2019 2018
$206,920 $198,925
(7,528) (1,019)
(7,750) (19,537)
$191,642 $178,369