keep data report 2005 -...
TRANSCRIPT

KEEP Data Report 2005
Chapter 6:Anemia & chronic kidney disease

KEEP Data Report, 2005
Figure 6.1
Percent distribution of KEEP & NHANES participants with anemia, by CKD stage
CKD StagesStage 1: eGFR ≥ 90,
microalbuminuria +Stage 2: eGFR 60–89,
microalbuminuria +Stage 3: eGFR 30–59Stage 4: eGFR 1–29Stage 5: eGFR <15 or
patient on dialysis
KEEP N=2,831, NHANES N=222.
Anemia DefinitionsWHOMales: hemoglobin <13g/dlFemales: hemoglobin < 12g/dlK/DOQIMales: hemoglobin<12g/dl Women & age >50: <12 g/dlWomen & age ≤50: <11g/dl

KEEP Data Report, 2005
Figure 6.2
Anemia (WHO & K/DOQI anemia definitions) in KEEP & NHANES participants, by age
KEEP N=34,975, NHANES N=10,018. Excludes participants with missing values for hemoglobin.
Anemia DefinitionsWHOMales: hemoglobin <13g/dlFemales: hemoglobin < 12g/dlK/DOQIMales: hemoglobin<12g/dl Women & age >50: <12 g/dlWomen & age ≤50: <11g/dl
KEEP Data Report, 2005
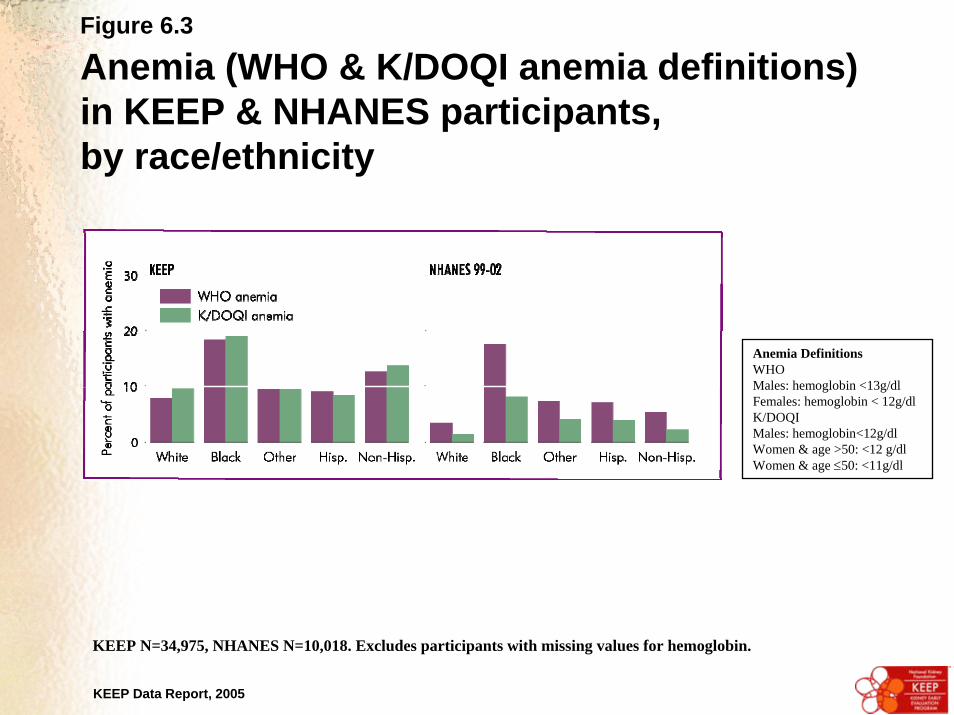
Figure 6.3
Anemia (WHO & K/DOQI anemia definitions) in KEEP & NHANES participants, by race/ethnicity
KEEP N=34,975, NHANES N=10,018. Excludes participants with missing values for hemoglobin.
Anemia DefinitionsWHOMales: hemoglobin <13g/dlFemales: hemoglobin < 12g/dlK/DOQIMales: hemoglobin<12g/dl Women & age >50: <12 g/dlWomen & age ≤50: <11g/dl

KEEP Data Report, 2005
Figure 6.4
Anemia (WHO definition) in KEEP & NHANES participants, by age, race, education, & insurance status
KEEP N=33,276, NHANES N=9,856. Excludes participants with missing values for hemoglobin, education, & insurance.
Anemia DefinitionsWHOMales: hemoglobin <13g/dlFemales: hemoglobin < 12g/dl

KEEP Data Report, 2005
Figure 6.5
Anemia (K/DOQI definition) in KEEP & NHANES participants, by age, race, education, & insurance status
KEEP N=33,276, NHANES N=9,856. Excludes participants with missing values for hemoglobin, education, & insurance. *Sample size less than 30 or coefficient of variation is not less than 30 percent.
Anemia DefinitionsK/DOQIMales: hemoglobin<12g/dl Women & age >50: <12 g/dlWomen & age ≤50: <11g/dl
Education & insurance<HS&NIns: Less than a high
school education, & no insurance
<HS&Ins: Less than a high school education, & insurance
HS+&NIns: High school education or greater, & no insurance
HS+&Ins: High school education or greater, & insurance

KEEP Data Report, 2005
Figure 6.6
Microalbuminuria in KEEP & NHANES participants with anemia (WHO & K/DOQI definitions)
KEEP N=3,739 WHO anemia; 4,041 K/DOQI definition. Excludes participants with missing values for hemoglobin or microalbuminuria.
Anemia DefinitionsWHOMales: hemoglobin <13g/dlFemales: hemoglobin < 12g/dlK/DOQIMales: hemoglobin<12g/dl Women & age >50: <12 g/dlWomen & age ≤50: <11g/dl

KEEP Data Report, 2005
Figure 6.7
Anemia (WHO & K/DOQI anemia definitions) in KEEP & NHANES participants, by CKD status
KEEP N=34,783, NHANES N=10,018. Excludes participants with missing values for hemoglobin or CKD status.
Anemia DefinitionsWHOMales: hemoglobin <13g/dlFemales: hemoglobin < 12g/dlK/DOQIMales: hemoglobin<12g/dl Women & age >50: <12 g/dlWomen & age ≤50: <11g/dl
CKD DefinitionIf eGFR by K/DOQI MDRD <60
ml/min/1.73 m2 or;If eGFR by K/DOQI MDRD ≥
60 ml/min/1.73 m2 and microalbuminuria +

KEEP Data Report, 2005
Figure 6.8
Anemia (WHO & K/DOQI anemia definitions) in KEEP & NHANES participants, by gender & CKD status
KEEP N=34,783, NHANES N=10,018. Excludes participants with missing values for hemoglobin or CKD status.
Anemia DefinitionsWHOMales: hemoglobin <13g/dlFemales: hemoglobin < 12g/dlK/DOQIMales: hemoglobin<12g/dl Women & age >50: <12 g/dlWomen & age ≤50: <11g/dl
CKD DefinitionIf eGFR by K/DOQI MDRD <60
ml/min/1.73 m2 or;If eGFR by K/DOQI MDRD ≥
60 ml/min/1.73 m2 and microalbuminuria +

KEEP Data Report, 2005
Figure 6.9
Anemia (WHO & K/DOQI definitions) in KEEP & NHANES participants, by race & CKD status
KEEP N=34,032, NHANES N=10,018. Excludes participants with missing values for hemoglobin, CKD status, or race.
Anemia DefinitionsWHOMales: hemoglobin <13g/dlFemales: hemoglobin < 12g/dlK/DOQIMales: hemoglobin<12g/dl Women & age >50: <12 g/dlWomen & age ≤50: <11g/dl
CKD DefinitionIf eGFR by K/DOQI MDRD <60
ml/min/1.73 m2 or;If eGFR by K/DOQI MDRD ≥
60 ml/min/1.73 m2 and microalbuminuria +

KEEP Data Report, 2005
Figure 6.10
Anemia (WHO & K/DOQI definitions) in KEEP & NHANES participants, by CKD stage & self-reported diabetic status
CKD StagesStage 1: eGFR ≥ 90,
microalbuminuria +Stage 2: eGFR 60–89,
microalbuminuria +Stage 3: eGFR 30–59Stage 4: eGFR 1–29Stage 5: eGFR <15 or
patient on dialysis
KEEP N=34,390, NHANES N=10,013. Excludes participants with missing values for hemoglobin, CKD status, or self-reported diabetic status.
Anemia DefinitionsWHOMales: hemoglobin <13g/dlFemales: hemoglobin < 12g/dlK/DOQIMales: hemoglobin<12g/dl Women & age >50: <12 g/dlWomen & age ≤50: <11g/dl

KEEP Data Report, 2005
Figure 6.11
Anemia (WHO & K/DOQI definitions) in KEEP & NHANES participants, by CKD stage & gender
KEEP N=34,783, NHANES N=10,018. Excludes participants with missing values for hemoglobin or CKD status. *Sample size less than 30 or coefficient of variation is not less than 30 percent.
CKD StagesStage 1: eGFR ≥ 90,
microalbuminuria +Stage 2: eGFR 60–89,
microalbuminuria +Stage 3: eGFR 30–59Stage 4: eGFR 1–29Stage 5: eGFR <15 or
patient on dialysis
Anemia DefinitionsWHOMales: hemoglobin <13g/dlFemales: hemoglobin < 12g/dlK/DOQIMales: hemoglobin<12g/dl Women & age >50: <12 g/dlWomen & age ≤50: <11g/dl

KEEP Data Report, 2005
Figure 6.12
Anemia (WHO & K/DOQI anemia definitions) in KEEP & NHANES participants, by CKD stage & race/ethnicity
KEEP N=34,783, NHANES N=10,018. Excludes participants with missing values for hemoglobin or CKD status. *Sample size less than 30 or coefficient of variation is not less than 30 percent.
CKD StagesStage 1: eGFR ≥ 90,
microalbuminuria +Stage 2: eGFR 60–89,
microalbuminuria +Stage 3: eGFR 30–59Stage 4: eGFR 1–29Stage 5: eGFR <15 or
patient on dialysis
Anemia DefinitionsWHOMales: hemoglobin <13g/dlFemales: hemoglobin < 12g/dlK/DOQIMales: hemoglobin<12g/dl Women & age >50: <12 g/dlWomen & age ≤50: <11g/dl

KEEP Data Report, 2005
Figure 6.13
Odds ratio of anemia (WHO & K/DOQI anemia definitions) in KEEP & NHANES participants, by eGFR
Anemia DefinitionsWHOMales: hemoglobin <13g/dlFemales: hemoglobin < 12g/dlK/DOQIMales: hemoglobin<12g/dl Women & age >50: <12 g/dlWomen & age ≤50: <11g/dl
KEEP: N= 34,975, NHANES N=8,707, excludes participants with missing values for race, smoking, BMI, serum creatinine, self-reported diabetes, self-reported hypertension, family history of diabetes or hypertension, or census region.

KEEP Data Report, 2005
Figure 6.14
Odds ratio of anemia (WHO & K/DOQI anemia definitions) in KEEP & NHANES participants, by age
Anemia DefinitionsWHOMales: hemoglobin <13g/dlFemales: hemoglobin < 12g/dlK/DOQIMales: hemoglobin<12g/dl Women & age >50: <12 g/dlWomen & age ≤50: <11g/dl
KEEP: N= 34,975, NHANES N=8,707, excludes participants with missing values for race, smoking, BMI, serum creatinine, self-reported diabetes, self-reported hypertension, family history of diabetes or hypertension, or census region.

KEEP Data Report, 2005
Figure 6.15
Odds of anemia (WHO & K/DOQI anemia definitions) in KEEP & NHANES participants, by race & self-reported diabetic status
Anemia DefinitionsWHOMales: hemoglobin <13g/dlFemales: hemoglobin < 12g/dlK/DOQIMales: hemoglobin<12g/dl Women & age >50: <12 g/dlWomen & age ≤50: <11g/dl
KEEP: N= 34,975, NHANES N=8,707, excludes participants with missing values for race, smoking, BMI, serum creatinine, self-reported diabetes, self-reported hypertension, family history of diabetes or hypertension, or census region.
KEEP Data Report, 2005
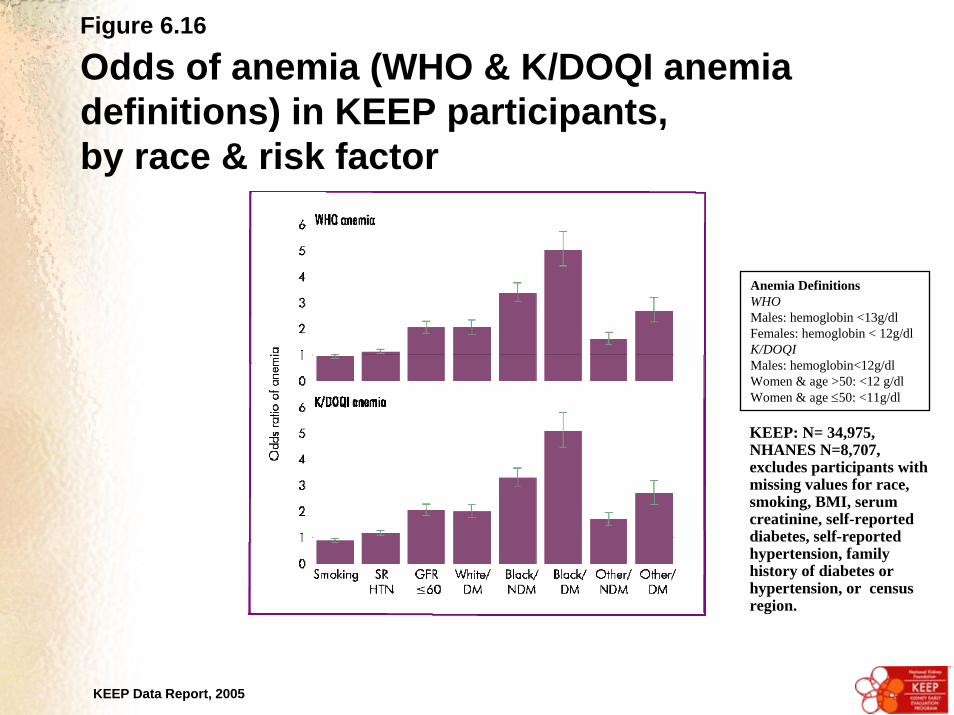
Figure 6.16
Odds of anemia (WHO & K/DOQI anemia definitions) in KEEP participants, by race & risk factor
KEEP: N= 34,975, NHANES N=8,707, excludes participants with missing values for race, smoking, BMI, serum creatinine, self-reported diabetes, self-reported hypertension, family history of diabetes or hypertension, or census region.
Anemia DefinitionsWHOMales: hemoglobin <13g/dlFemales: hemoglobin < 12g/dlK/DOQIMales: hemoglobin<12g/dl Women & age >50: <12 g/dlWomen & age ≤50: <11g/dl

KEEP Data Report, 2005
Figure 6.17
Odds of anemia (WHO & K/DOQI anemia definitions) in NHANES participants, by race & risk factor
Anemia DefinitionsWHOMales: hemoglobin <13g/dlFemales: hemoglobin < 12g/dlK/DOQIMales: hemoglobin<12g/dl Women & age >50: <12 g/dlWomen & age ≤50: <11g/dl
KEEP: N= 34,975, NHANES N=8,707, excludes participants with missing values for race, smoking, BMI, serum creatinine, self-reported diabetes, self-reported hypertension, family history of diabetes or hypertension, or census region.

KEEP Data Report, 2005
Table 6.a
Odds ratios of anemia (WHO & K/DOQI anemia definitions) in KEEP participants
Anemia DefinitionsWHOMales: hemoglobin <13g/dlFemales: hemoglobin < 12g/dlK/DOQIMales: hemoglobin<12g/dl Women & age >50: <12 g/dlWomen & age ≤50: <11g/dl
WHO anemia K/DOQI anemiaOR CI p-value OR CI p-value
Age (ref: 46-60)18-30 1.28 (1.09-1.49) 0.002 0.30 (0.24-0.37) <.000131-45 1.47 (1.33-1.62) <.0001 0.43 (0.38-0.49) <.000161-75 1.13 (1.02-1.25) 0.021 1.50 (1.37-1.65) <.000176+ 2.33 (2.04-2.67) <.0001 2.62 (2.31-2.98) <.0001
Male (ref: female) 0.68 (0.62-0.74) <.0001 0.31 (0.28-0.35) <.0001Smoking & used to smoke 0.94 (0.87-1.01) 0.108 0.88 (0.81-0.95) 0.001Self-reported HTN 1.12 (1.03-1.22) 0.007 1.17 (1.07-1.27) 0.000Family history of DM 1.00 (0.93-1.09) 0.933 1 (0.9-1.06) 0.533Family history of HTN 0.97 (0.88-1.07) 0.519 1.03 (0.94-1.14) 0.551BMI 30+ 1.03 (0.96-1.12) 0.389 0.99 (0.91-1.07) 0.7305GFR (ref: 90+)
60-<90 0.91 (0.84-1) 0.040 0.91 (0.83-0.99) 0.032<=60 2.04 (1.83-2.29) <.0001 2.05 (1.83-2.29) <.0001
Race & diabetic status (ref: White/NDM)White/DM 2.05 (1.79-2.35) <.0001 2.00 (1.76-2.28) <.0001Black/NDM 3.38 (3.04-3.75) <.0001 3.28 (2.95-3.65) <.0001Black/DM 5.02 (4.4-5.73) <.0001 5.08 (4.46-5.78) <.0001Other/NDM 1.61 (1.39-1.87) <.0001 1.69 (1.45-1.96) <.0001Other/DM 2.68 (2.25-3.19) <.0001 2.68 (2.26-3.18) <.0001
KEEP: N= 34,975, NHANES N=8,707, excludes participants with missing values for race, smoking, BMI, serum creatinine, self-reported diabetes, self-reported hypertension, family history of diabetes or hypertension, or census region.

KEEP Data Report, 2005
Table 6.b
Odds ratios of anemia (WHO & K/DOQI anemia definitions) in NHANES participants
Anemia DefinitionsWHOMales: hemoglobin <13g/dlFemales: hemoglobin < 12g/dlK/DOQIMales: hemoglobin<12g/dl Women & age >50: <12 g/dlWomen & age ≤50: <11g/dl
WHO Anemia K/DOQI AnemiaNHANES OR CI p-value OR CI p-valueAge (ref: 46-60)
20-30 1.04 (0.69-1.55) 0.85 0.37 (0.23-0.6) 0.0031-45 1.11 (0.81-1.53) 0.50 0.55 (0.33-0.9) 0.0261-75 1.14 (0.76-1.7) 0.51 1.11 (0.69-1.8) 0.65>=76 1.97 (1.29-2.99) 0.00 2.17 (1.28-3.67) 0.01
Male (ref: female) 0.38 (0.31-0.48) 0.00 0.26 (0.18-0.37) 0.00Smoking & used to smoke 0.85 (0.68-1.05) 0.13 0.97 (0.7-1.34) 0.85Self-reported HTN 0.86 (0.67-1.11) 0.23 0.96 (0.65-1.44) 0.8571GFR (ref: 90+)
60-<90 0.8 (0.59-1.08) 0.1437 1.15 (0.72-1.84) 0.5455<60 3.25 (2.17-4.86) 0 4.85 (3.06-7.67) 0
Race & diabetic status (ref: White/NDM)White/DM 2.29 (1.44-3.63) 0.00 2.1 (1.27-3.47) 0.0051Black/NDM 5.91 (4.53-7.72) 0.00 6.92 (4.94-9.69) 0Black/DM 10.42 (6.17-17.6) 0.00 10 (5.76-17.36) 0Other/NDM 2.17 (1.49-3.15) 0.00 3.28 (1.82-5.89) <.0001Other/DM 4.19 (2.2-7.98) 0.00 5.47 (2.29-13.09) <.0001
KEEP: N= 34,975, NHANES N=8,707, excludes participants with missing values for race, smoking, BMI, serum creatinine, self-reported diabetes, self-reported hypertension, family history of diabetes or hypertension, or census region.