keeping kiwis in the know. - nzme. - home1 print publications include 7 metro and regional...
TRANSCRIPT

ANNUAL REPORTNZME LIMITED
For the year ended 31 December 2019
KEEPING KIWIS IN THE KNOW.

We have the channels, brands, talent and audience to fulfil our commitment to Kiwis and to lead the future of news and journalism in New Zealand. We empower, enrich and enliven our audiences and connect them to the people, events, and decisions that matter.
2 NEW ZEALAND MEDIA AND ENTERTAINMENT

This annual report is dated 24 February 2020 and is signed on behalf of the Board of Directors by:
Carol CampbellDirector
Peter CullinaneChair
04 Operational Highlights
07 2019 Financial Results Summary
08 Chair’s Report
10 Chief Executive Officer’s Report
12 Keeping Kiwis in the Know
14 Financial Results and Channel Commentary
18 Our Sustainability Commitment
26 The NZME Board
28 The NZME Executive Team
30 Corporate Governance
44 Consolidated Financial Statements
96 Independent Auditors Report
101 Directory
CONTENTS.
ANNUAL REPORT 2019 3

OPERATIONAL HIGHLIGHTS.
4 NEW ZEALAND MEDIA AND ENTERTAINMENT

9radio brands serving all key demographics
2.0 millionweekly listeners4
NewstalkZBNumber one commercial radio network and ZB’s Mike Hosking Breakfast Show the most popular breakfast show5
ZM Breakfast#1 breakfast show for all New Zealanders Under 405
35.9%6
Radio audience market share (up from 34.9% in Dec 2018)
39.5%7
Radio Revenue market share for 12mths to Dec 2019 (up from 39.0% for 12mths to Dec 2018)
2.3 millionDigital users per month across our digital platforms9
OneRoof241,000 monthly unique audience9, 75% of residential for sale listings in New Zealand and 95% of residential for sale listings in Auckland10
46,000subscribers access NZ Herald Premium including 21,000 paid digital subscribers
DRIVENOver 40,000 for sale vehicle listings, 127,000 monthly unique audience9
1.8 millionMonthly unique audience on nzherald.co.nz9
GrabOne352,000 monthly unique audience9
1 Print publications include 7 Metro and Regional newspapers, 20 Community newspapers and 8 Newspaper Inserted Magazines. 2 Nielsen CMI Fused Q4 18 - Q3 19, People 15+. 3 PwC NPA quarterly performance comparison report, December 2019. 4 GfK Radio Audience Measurement, Commercial Stations, NZME and Partners, Cumulative Audience, S4 2019. 5 GfK Radio Audience Measurement, Commercial Stations, Total NZ, S4 2019, Share (%). 6 GfK Radio Audience Measurement, Commercial Stations, NZME and Partners in major markets, S4 2019, Monday-Sunday 12mn-12mn, station share %, AP 18-54. 7 PwC Radio advertising market benchmark report, December 2019. 8 AdsWizz and StreamGuys, December 2019. 9 Nielsen Online Ratings, December 2019. 10 OneRoof listings as a percentage of residential for sale listings on TradeMe.
35print publications across New Zealand1
1.7 million NZ Herald weekly brand audience2
1.3 millionweekly readers2
465,000average issue readership2
46.9%3
Print advertising revenue market share for 12 months to Dec 2019 (up from 44.8% for 12 months to Dec 2018)
iHeart Radio Growth to 944k registered users (up 14%) and 3.9 million average monthly listening hours (up 18%), growing revenue 40%8
RADIO
DIGITAL
ANNUAL REPORT 2019 5

6 NEW ZEALAND MEDIA AND ENTERTAINMENT

2019 FINANCIAL RESULTS SUMMARY.
Strong radio revenue growth of 5% in the second half of the year, up 2% year on year
Net debt reduction to $74.7 million and leverage ratio reduced to 1.5 times Operating EBITDA
Focus on cost savings reduces operating expenses by 4%
Operating Revenue1
$371.7m4%2018 $388.9m
Operating EBITDA1
$50.6m7%2018 $54.7m
Operating Earnings per Share1
10.0cps2018 9.6cps 4%
Operating NPAT1
$19.7m4%2018 $18.9 m
Statutory Net Loss After Tax($165.2m)
2018 Stat. NPAT $11.6m
Radio Growth
Cost Savings
Net Debt Down2% 4% $23.6m
1 Operating results are presented excluding the impact of NZ IFRS 16 and exceptional items to allow for a like for like comparison between 2018 and 2019 financial years. Please refer to slide 33 and 34 of the 2019 Full Year results presentation for a detailed reconciliation.
ANNUAL REPORT 2019 7
CHAIR’S REPORT.I’m pleased that NZME continues to deliver
on its core purpose of keeping Kiwis in
the know; continues to deliver excellent
results for its advertising partners; and has
improved its balance sheet as we strive to
maintain a vibrant business that delivers
sustainable growth for shareholders.
In 2019 we have reported a statutory Net Loss After Tax of $165.2 million. 2019 Net Profit was impacted by the impairment of intangible assets of $175.0 million. This is an accounting charge only with no change to cash flows and no impact on bank covenants.
2019 Operating Net Profit After Tax (“NPAT”)1 of $19.7 million and Operating EPS of 10.0 cents were up 4% compared to the
prior corresponding period.
In 2019 we championed the awareness of
many issues which impact New Zealanders
including; mental health, depression, and
New Zealand’s meth crisis. Events such
as the Christchurch mosque shootings,
the Grace Millane murder trial, the SkyCity
international convention centre fire and the
Whakaari/White Island volcanic eruption
punctuate how important well-resourced and
independent newsrooms are to New Zealand
and its communities. I am extremely proud
of the professionalism, camaraderie and
endurance our journalists, broadcasters and
producers demonstrated in conveying these
significant events to New Zealand.
The framework that supports the news
teams in bringing these stories to all
New Zealanders is a passionate media
business with diversified portfolios; multiple
platforms; and strategies for sustainable
growth with an unrelenting focus on
delivering for our audiences.
Our purpose has been underpinned
by three strategic key priorities -
ourcommitment to lead the future of news
and journalism in New Zealand, increasing
radio capability and performance, and
creating New Zealand’s leading real estate
platform. These have delivered measurable
results for the business.
NZME targeted the first of these
commitments firmly in 2019 with the
launch of our digital subscription news
service. To achieve sustainable growth our
business must be bold and be prepared
to lead the market. It is pleasing to see
the response from the tens of thousands
of New Zealanders, who prove that Kiwis
value and are willing to pay for high quality
local and international journalism through
NZ Herald Premium content on-line. We
now have over 21,000 paid premium digital
subscribers, with an additional 25,000 print
subscribers who access premium content
via their print bundle packages.
Our focus on radio capability continues to
prove itself with award winning stations,
increased radio audience market share and
increased radio revenue market share. It
was fantastic to see radio revenue return to
growth with 5% growth in the second half
of the year and 2% growth year on year –
delivering on our key strategic priority of
increasing radio capability and performance.
Our initiative to create New Zealand’s
leading real estate platform continues to
gain momentum, with OneRoof increasing
its market share of residential for sale
listings in Auckland and New Zealand wide.
Unique browsers to the OneRoof website
continue to increase as audiences value
I’m proud that NZME has always based its business decisions on a strong set of values focused on supporting our communities, our people and our environment. NZME’s Sustainability Commitment featured in this report, helps us share that story.
In 2019 we communicated our overriding purpose of keeping Kiwis in the know, highlighting for me the significant role New Zealand Media and Entertainment (NZME) plays in keeping New Zealanders connected to local, national and global events.
1 Operating results are presented excluding the impact of NZ IFRS 16 and exceptional items to allow for a like for like comparison between 2018 and 2019 financial years. Please refer to slide 33 and 34 of the 2019 Full Year results presentation for a detailed reconciliation
8 NEW ZEALAND MEDIA AND ENTERTAINMENT

specialist insights and reporting into the
real estate market. This value proposition
is starting to result in significant revenue
contribution.
The focus on our three key priorities of
news and journalism, radio, and OneRoof,
will continue to underpin our strategic
approach to 2020.
2019 was also a challenging year for
New Zealand media, and it was a year that
signaled some potentially extraordinary
changes ahead in the New Zealand
media landscape.
The impact of global players’ pressure on the
New Zealand advertising market continued to
impact the local media market. In an already
highly competitive industry, there simply
aren’t enough advertising dollars and not
a large enough audience market to sustain
New Zealand’s current industry structure.
What has been pleasing to see is the great
importance that New Zealanders place
on the need for quality local journalism,
for trustworthy information, and for the
opportunity to engage, as communities in
the stories that impact close to home.
There have been reports during the year
about NZME’s potential opportunity to
purchase Stuff. We firmly believe that NZME is
the most logical owner of Stuff. An acquisition
of Stuff is aligned with NZME’s strategic
priorities and our commitment to protecting
the craft of journalism.
No agreement in relation to the transaction
has been reached, however we continue
to progress towards the required regulatory
approvals.
NZME has made excellent progress in our
capital management targets during the
year. Net Debt reduced to $74.7 million as
at 31 December 2019 with leverage ratio
reduced to 1.5 times Operating EBITDA. We
will continue to progress with our capital
management commitment, to strengthen
our Balance Sheet by reducing both debt
and leverage ratio, while maintaining the
ability to invest in growth opportunities
across the business.
I am also pleased to highlight in this report
the formalisation of NZME’s Sustainability
Commitment. This includes a measurable
approach to connecting and empowering
our communities, providing a workplace
that fosters innovation, engagement and inclusion, and taking a responsible approach to the environment.
I’m proud that NZME has always based its business decisions on a strong set of values focused on supporting our communities, our people and our environment. NZME’s Sustainability Commitment featured in this report, helps us share that story. Importantly, it also sets out how we deliver on those values and how we’ll measure the sustainability commitments that sit alongside our financial performance.
Finally, on behalf of the Board, I would like to thank our shareholders for their on-going support, our talented and dedicated Executive Team, and all our people for the hard-work, commitment and creativity that they bring to NZME every day.
PETER CULLINANE Chair
ANNUAL REPORT 2019 9

1 Nielsen CMI Fused Q4 18 - Q3 19, People 15+. 2 GfK Radio Audience Measurement, Commercial Stations, NZME and Partners, Cumulative Audience, S4 2019. 3 Nielsen Online Ratings, December 2019. 4 Operating results are presented excluding the impact of NZ IFRS 16 and exceptional items to allow for a like for like comparison between 2018 and 2019 financial years. Please refer to slide 33 and 34 of the 2019 Full Year results presentation for a detailed reconciliation.
CHIEF EXECUTIVE OFFICER’S REPORT.In 2019 1.3 million1 people read our publications each week, 2.0 million2 Kiwis listened to our radio broadcasters each week, and 2.3 million3 people clicked, viewed and engaged with our digital platforms each month.
NZME’s enviable, high-powered blend of print, digital, and radio brands continue to power our success and provide the platforms from which we will maintain our commitment to drive the sustainable future of journalism and broadcasting into 2020 and beyond.
2019 Financial Results
Whilst NZME’s brands continue to deliver our commercial partners and advertisers with meaningful audience engagement, media advertising markets were extremely competitive across 2019, impacting on NZME’s overall results.
Total Operating Revenue4 was $371.7 million in 2019, down 4% compared to 2018, primarily due to the decline in print revenue but offset by pleasing results in radio and digital operations.
Operating Earnings Before Interest, Tax, Depreciation and Amortisation (“EBITDA”)4 was $50.6 million for the year, a decline of 7% against 2018. 2018 did benefit from an additional publishing week in the year and, adjusting for this, 2019 Operating EBITDA decreased by 5% against 2018 and was in growth of 4% in the second half of 2019 compared to the equivalent period in 2018.
Further commentary on our 2019 financial results can be found on page 14.
NZME’s key strategic priorities
Our Chair has discussed the achievements
we have made in 2019 against our three
strategic priorities - our commitment to
lead the future of news and journalism in
New Zealand, increasing radio capability
and performance, and creating New
Zealand’s leading real estate platform.
Our focus on these priorities is delivering
measurable results to the business,
and these will remain our key priorities
into 2020.
Supporting the future of news and
journalism in New Zealand, we launched NZ
Herald Premium in 2019, and our ambitions
in this area encompass both digital and
print. We are conscious that we operate in
a print environment which is challenged by
growing media competition from local and
global players. In 2020, our focus is to grow
NZ Herald Premium digital subscriptions;
maintain the core NZ Herald site audience;
enhance the digital product offering; and
improve print performance by reducing
subscriber churn and advertising revenue
declines.
Our focus in radio widened this year to
include the growth of our digital radio
platform, iHeart Radio. The challenges
we set were to deliver radio revenue
growth driven by regional and digital
performance; to grow radio audience
in the key demographics that underpin
advertiser spend; and to grow digital audio
consumption in iHeart Radio, podcasts and
other digital audio products.
In 2020 we will continue to drive the
development of OneRoof into a prominent
national brand as the property market
remains a significant driver of economic
activity in New Zealand. Growing OneRoof’s
popularity as a platform connecting home
buyers, sellers and real estate agents
remains a key strategic priority whilst
delivering continued revenue growth.
Each day around 1,400 people at NZME connect millions of Kiwis with one another and with the world around them.
NZME’s enviable, high-powered blend of print, digital and radio brands continue to power our success and provide the platforms from which we will maintain our commitment to drive the sustainable future of journalism and broadcasting into 2020 and beyond.
10 NEW ZEALAND MEDIA AND ENTERTAINMENT

The future of New Zealand media
During the last few months of 2019 there
were clear indications that businesses in
New Zealand have begun to feel more
confident about their future.
That said, the media industry in New
Zealand remains an incredibly competitive
sector and as such, media companies
remain significantly susceptible to
the local impact of global players like
Facebook and Google.
As demonstrated through our reduction
in debt and leverage ratio, NZME has
improved its balance sheet and is in
a financial position that allows us the
opportunity to forge our own path.
We’ve launched new ventures like NZ
Herald Premium and have continued
to invest in growth businesses such as
OneRoof. As a leading and successful
New Zealand media company, we are also
in the enviable position of being able to
continue to look for significant commercial
opportunities that will support our
commitment to lead the future of news
and broadcasting in New Zealand.
That position also means we can
start conversations with New Zealand
regulators, Nine Entertainment (Stuff’s
owners) and our shareholders regarding
the potential opportunity for NZME to
purchase Stuff.
While we respect the previous decisions of
the Commerce Commission and Court of
Appeal, we believe the media landscape
has shifted significantly since then – and
continues to do so. It is prudent for NZME
to ensure it is positioned to do what is
in the best interests of its audiences, its
people, and its shareholders.
As well as supporting NZME’s strategic
priorities, specifically leading the future
of news and journalism in New Zealand,
the potential acquisition of Stuff would
create a stronger and more sustainable
media presence; enhance our audience
and advertising proposition; deliver cost
savings and synergy benefits; and deliver
increased financial scale.
Changes in the NZME executive team
In 2019 we said farewell to two members
of the executive team with Group Director
of Entertainment Dean Buchanan and
Chief Commercial Officer Matt Headland
leaving NZME. Both Dean and Matt made
valuable contributions to the growth of
NZME and I thank them for their support
and the leadership they displayed during
their time on the NZME Executive.
At the end of 2019 we welcomed Wendy
Palmer to the NZME executive as Chief
Radio and Commercial Officer, and
appointed Paul Hancox as a member
of the executive team in his role as Chief
Revenue Officer.
Both Paul and Wendy are incredibly
experienced media executives, with
a deep and proven understanding of
the business strategies required to
connect content and audiences with
commercial partners.
ConclusionI opened this report by highlighting the role our people play in delivering on our commitment to Keeping Kiwis in the know. 2019 demonstrated both how important this role is to New Zealanders and how challenging sustaining a business that supports that commitment can be. I thank all our people for their commitment to their craft, their audiences, and to NZME.
I thank our suppliers, business partners, and advertisers for their ongoing support and partnership during the year and thank you to our audience of 3.2 million New Zealanders for your continued engagement – we are here to deliver news and entertainment from New Zealand and around the world to keep you in the know every day.
And finally, I would like to thank the Board for their continued support and guidance.
Michael Boggs Chief Executive Officer
ANNUAL REPORT 2019 11

On 15 March 2019, 51 people lost their lives and dozens more were wounded in an attack on New Zealand’s Muslim community when a gunman opened fire in two Christchurch mosques. This attack shattered hearts and struck at our belief that isolation, values and security protected us from the sorts of tragedies that occur elsewhere in the world.
What followed in the NZ Herald newsroom and for our teams on NewstalkZB will be familiar to any news organisation at the centre of a tragedy: professionalism, camaraderie, endurance, inspiration, and grief. Our journalists, from reporters to social media producers to editors, produced their finest work.
The events in Christchurch on 15 March were unprecedented – for New Zealand and its news media. From the moment news first broke on that Friday afternoon that shots had been heard at a mosque in the city, our teams swung into action.
Our editorial teams went to work on the story as reporters went to the multiple crime scenes and eyewitness accounts began to flow in, along with police updates and – shockingly – an apparent livestream of the atrocity itself.
More than a dozen reporters and visual journalists worked around the clock to capture the stories surrounding the event and its aftermath. They acted with sensitivity as they recorded first-hand accounts from survivors and those who had lost loved ones.
Our teams worked around the clock, delivering non-stop live coverage on nzherald.co.nz and NewstalkZB, accompanied by thematic print editions of the NZ Herald distilling the surges of information, while maintaining a focus on the victims and capturing a common spirit of compassion and inclusivity.
This comprehensive coverage stretched across many days as the story developed, from the shock and fear created by the attack itself, to mourning the loss of so many New Zealanders, to anger and the incredible soul searching that followed this terrible event.
Herald cartoonist and artist Rod Emmerson worked with editors to produce the NZ Herald’s “They Are Us” edition of March 18. A simple idea evolved into the powerful 50 Hearts front page – reflecting the death toll at the time – which became a symbol of the compassion and empathy that flowed throughout New Zealand as Kiwis embraced our Muslim community.
As the story widened to incorporate debates on gun control and the role of social media, investigative reporters
David Fisher and Jared Savage looked at the history of the gun lobby in New Zealand and examined the security agencies behind the scenes. Technology reporter Chris Keall secured the first interview with Facebook as it responded to its hosting of the alleged killer’s livestream.
KEEPING KIWIS IN THE KNOW. FOCUS ON CHRISTCHURCH.
12 NEW ZEALAND MEDIA AND ENTERTAINMENT

News and political angles from our gallery team were accompanied with brilliant writing by columnists Steve Braunias and Simon Wilson, who went deeper to express what the events meant for New Zealanders.
The events in Christchurch serve as an indelible reminder of the important role media plays in our society. Keeping our communities informed, connected and safe sit at the very core of NZME’s purpose - to keep Kiwis in the know.
On the day of March 15, I watched and listened as our editorial teams agonised over how to best cover the story and at the same time treat the victims, their families and our communities with respect and compassion. That kind of approach to journalism comes from being a part of communities we report from. Being connected, being present, being local is our future.Michael Boggs, NZME CEO
The way our newsroom, journalists and broadcasters responded to the Christchurch massacre will stay with me forever - the personal stories, insightful analysis and in-depth reporting were world-class, produced in horrific circumstances. We remain deeply affected by the events of March 15 - but committed to providing our readers the facts and the context. We have a leading and important role to play in ensuring an event like that is never repeated.Shayne Currie, NZME Managing Editor
Many of those who will have been directly affected by this shooting will be migrants, they will be refugees here. They have chosen to make New Zealand their home and it is their home. They are us. Jacinda Ardern, Prime Minister
ANNUAL REPORT 2019 13

FINANCIAL RESULTS & CHANNEL COMMENTARY.Total Operating Revenue1 was $371.7 million in 2019, down 4% compared to 2018, primarily due to the decline in print revenue but offset by growth in radio and digital operations.
A continued focus on cost savings and increased efficiencies across the business resulted in operating expenses1 reducing by 4% compared to the previous corresponding period.
Operating Earnings Before Interest, Tax, Depreciation and Amortisation (“EBITDA”)1 was $50.6 million for the year, a decline of 7% against 2018. As mentioned, 2018 benefitted from 53 publishing weeks in the year, compared to 52 weeks in 2019. Adjusting for this, 2019 Operating EBITDA decreased by 5% against a comparable period in 2018 and was in growth of 4% in the second half of 2019 compared to the equivalent week period in 2018.
The underlying depreciation expense excluding the impact of NZ IFRS 16 was $5.7 million lower than 2018 due to some assets fully depreciated in 2018 and the extension of life of some assets.
In 2019 there was $9.9 million of exceptional items (excluding impairment of intangible assets) which was slightly higher than the $9.2 million in 2018. The majority of these related to redundancies
This standard requires that most leases be recognized as a lease liability on the Balance Sheet with a corresponding “right of use” asset. In the income statement the operating lease cost is reclassified as depreciation and interest. The impact of this change for 2019 was that $15.1 million of operating lease cost was reclassified as $12.8 million of depreciation and $4.8 million of interest expense. The net result was a negative impact on NPAT of $1.7 million interest costs are recognized in the early years of a lease.
Balance Sheet and Cash Flows
Net debt was $74.7 million at 31 December 2019, a significant reduction from $98.3 million as at 31 December 2018. We have made significant progress in our capital management objective of reaching a Net debt to Operating EBITDA target range of 1.0 to 1.5 times, with Net debt to Operating EBITDA of 1.5 times as at 31 December 2019, a reduction from 1.8 times for the 2018 financial year.
Operating cash flow was $25.1m higher than 2018 due to positive movement in working capital in 2019, $9.5m lower taxes paid in 2019, and dividends paid in 2018.
Capital expenditure was $11.8 million in 2019, compared to $14.1 million in 2018.
1 Operating results are presented excluding the impact of NZ IFRS 16 and exceptional items to allow for a like for like comparison between 2018 and 2019 financial years. Please refer to slide 33 and 34 of the 2019 Full Year results presentation for a detailed reconciliation. 2 Refer to Supplementary Information on Slide 36 of the 2019 Full Year results presentation for an analysis of 2019 Operating Results compared to 52 weeks Operating Results in 2018.
and associated costs of restructuring to achieve cost savings with the balance including costs associated with one off projects and impairments.
In 2019 we have reported a statutory Net Loss After Tax of $165.2 million. 2019 Net Profit is impacted by the impairment of intangible assets of $175.0 million.
The impairment assessment recognises that the difference between the value of the company implied by its share price and the accounting value of equity has increased to a level, which can no longer be supported without an accounting adjustment. This is an accounting charge only with no change to cash flows and no impact on bank covenants.
Please refer to note 3.1 of the consolidated financial statements for further details.
2019 Operating Net Profit After Tax (“NPAT”)1 of $19.7 million and Operating EPS1 of 10.0 cents were up 4% compared to the prior corresponding period. Adjusting for the extra week in 2018, Operating NPAT was up 10% compared to the equivalent period in 2018, with 21% growth in the second half.2
IFRS 16
A new accounting standard NZ IFRS 16 was adopted on 1 January 2019.
14 NEW ZEALAND MEDIA AND ENTERTAINMENT

PrintPrint revenue was $192.4 million in 2019, down 9% compared to 2018. However as mentioned, 2018 benefitted from 53 publishing weeks in 2018 compared to 52 publishing weeks in 2019. Adjusting for this impact, 2019 total print revenue declined 8% against a comparable 52 weeks in 2018.
Print advertising revenue decreased 10% to $102.2 million compared to total print advertising market which decreased 13.7% in the year3 and print agency advertising demand which declined 10.9%4 in the year. Print circulation revenue declined 6% to $76.3 million. Excluding the extra publishing week in 2018, print circulation revenue declined 5% due to a print volume decrease of 8% and partially offset by a 4% increase in yield.
Our print fundamentals remain strong. The NZ Herald remains the most read newspaper in New Zealand attracting an average issuer readership of 465,000 kiwis. Across our 39 print publications throughout New Zealand, 1.3 million people read our papers each week.
Our journalists, reporters and producers were recognised again this year, with the NZ Herald winning Best Daily Newspaper5
and Viva winning Best Newspaper-Inserted
Magazine at the Voyager media awards
in 2019.
At the 2019 International News Media
Association (INMA) Global Media Awards in New York, the NZ Herald
was named best in Asia/Pacific for its
#NotforSale editorial campaign, which
also won the Best Public/Community
Service Campaign, heading off several
international media brands.
And at the Australasian 2019 News Media Awards, the NZ Herald won
the award for Best Use of print for the
coverage of the Christchurch terrorist attacks and “They are us” concept.
We remain conscious that print continues to operate in a tough market, against many market headwinds. Despite many challenges, 2020 will be an exciting time for our reporting teams. There are already many local and international events on the agenda this year and we look forward to reporting on these, and all the other news stories which arise, to keep Kiwis in the know in 2020.
3 PwC NPA quarterly performance comparison report, December 2019. 4 Standard Market Index (SMI) NZ, December 2019 Data Release. 5 Newspaper of the Year (more than 30,000 circulation).
ANNUAL REPORT 2019 15
Radio
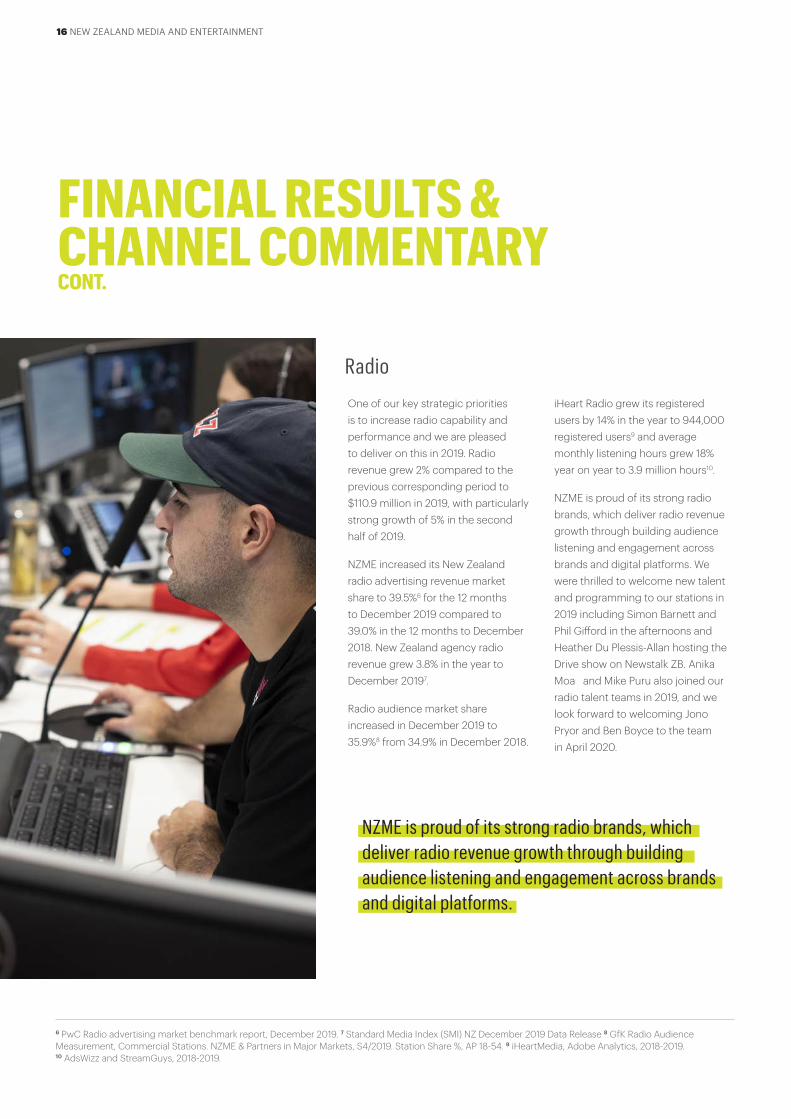
One of our key strategic priorities is to increase radio capability and performance and we are pleased to deliver on this in 2019. Radio revenue grew 2% compared to the previous corresponding period to $110.9 million in 2019, with particularly strong growth of 5% in the second half of 2019.
NZME increased its New Zealand radio advertising revenue market share to 39.5%6 for the 12 months to December 2019 compared to 39.0% in the 12 months to December 2018. New Zealand agency radio revenue grew 3.8% in the year to December 20197.
Radio audience market share increased in December 2019 to 35.9%8 from 34.9% in December 2018.
iHeart Radio grew its registered users by 14% in the year to 944,000 registered users9 and average monthly listening hours grew 18% year on year to 3.9 million hours10.
NZME is proud of its strong radio brands, which deliver radio revenue growth through building audience listening and engagement across brands and digital platforms. We were thrilled to welcome new talent and programming to our stations in 2019 including Simon Barnett and Phil Gifford in the afternoons and Heather Du Plessis-Allan hosting the Drive show on Newstalk ZB. Anika Moa and Mike Puru also joined our radio talent teams in 2019, and we look forward to welcoming Jono Pryor and Ben Boyce to the team in April 2020.
6 PwC Radio advertising market benchmark report, December 2019. 7 Standard Media Index (SMI) NZ December 2019 Data Release 8 GfK Radio Audience Measurement, Commercial Stations. NZME & Partners in Major Markets, S4/2019. Station Share %, AP 18-54. 9 iHeartMedia, Adobe Analytics, 2018-2019. 10 AdsWizz and StreamGuys, 2018-2019.
NZME is proud of its strong radio brands, which deliver radio revenue growth through building audience listening and engagement across brands and digital platforms.
FINANCIAL RESULTS & CHANNEL COMMENTARY CONT.
16 NEW ZEALAND MEDIA AND ENTERTAINMENT

DigitalDigital revenue was $60.4 million for the 2019 year, up 1% on prior year. While the first half of 2019 saw challenges in the digital space, the second half of the year saw total digital revenue growth of 5% compared to the second half of 2018.
Digital revenue comprises digital advertising revenue, digital classified revenue from listings on OneRoof and DRIVEN, digital subscription revenue from NZ Herald premium subscribers, and revenue from our ecommerce website GrabOne.
Digital advertising revenue declined 4% on prior year to $45.9 million, impacted by a decline in digital display agency advertising market demand which was down 2.4% in the year to December 201911. NZME saw an improvement in the second half of the year with a much lower rate of decline of 1% in digital advertising revenue compared to the second half of 2018, a significant improvement from the 8% decline experienced in the first half of 2019 compared to the first half 2018.
However, this was offset by strong growth in digital classifieds revenue which grew to $3.2 million in 2019, up from $0.9 million in 2018.
OneRoof continues to grow in listings, audience and revenue, with over 75% of total New Zealand residential for sale real estate listings and 95% of total Auckland
residential real estate listings12, 241,000
average unique audience every month13,
and over 150,000 app downloads14.
OneRoof is now making a significant
impact with $2.8 million of revenue
in 2019 and we expect OneRoof to
continue to grow in 2020.
DRIVEN is also proving to be a strong
digital classified platform with over
40,000 for sale vehicle listings and
127,000 average unique audience
every month13 attracting car buyers
and motoring enthusiasts who value
specialist insights into the automotive
industry. DRIVEN delivered revenue of
$0.4 million in 2019 and will be boosted
by lead generation revenues which
commenced in January 2020.
This year we took the strategic decision
to refocus our approach to the
employment sector to better suit the
evolving needs of recruiters and jobs
seekers. We made the decision to close
the YUDU site and leverage the power of NZ Herald as the vehicle for our employment market strategy, launching JobMarket within the NZHerald website in December 2019.
We are very pleased with the performance of NZ Herald premium digital subscriptions, which delivered $1.7 million revenue for eight months since its launch on 30 April 2019 – with subscriptions and revenue well ahead of expectations.
We now have over 21,000 paid premium digital subscribers, plus an additional 25,000 print subscribers who also access premium content with their print bundle packages. NZME is the first global customer of the Arc Digital Subscription product and it has been a resounding success. We have further developments on the horizon including a new NZ Herald app, corporate subscription options, and new payment gateways all planned for 2020.
NZME launched its own programmatic desk after the closure of the industry-led KPEX platform in September 2019, allowing advertisers and agencies to book programmatic digital advertising directly with NZME and is showing strong signs of revenue growth.
While the first half of 2019 saw challenges in the digital space, the second half of the year saw total digital revenue growth of 5% compared to the second half of 2018.
11 Standard Media Index (SMI) NZ December 2019 Data Release. 12 OneRoof’s listings as a percentage of residential for sale real estate listings on Trade Me. 13 Nielsen Online Ratings, December 2019. 14 Google Analytics, November 19.
ANNUAL REPORT 2019 17

OUR SUSTAINABILITY COMMITMENT.Keeping Kiwis in the know requires a broad commitment to sustainable practices and the well-being of our people and the wider community.
Keeping Kiwis in the know makes a powerful
promise: that New Zealand Media and
Entertainment (NZME) will make each day
livelier, more informed, and more connected
to the people and things that matter.
Delivering on our promise requires a
genuine commitment to doing right by
our customers, employees, and the wider
community. When the people important to
our business prosper and live better lives,
only then can we say we did the job we set
out to do.
For NZME, doing the right thing requires a commitment to the craft of journalism and broadcasting; making NZME a safe and inspiring place to work; and championing the diversity of voices that make us Kiwis.
NZME’s sustainability programme is aligned to the guidelines set out in the UN Sustainable Development Goals – an international blueprint to achieve a better and more sustainable future for everyone. Combined with our promise to keep Kiwis in the know,
NZME’s commitment to sustainable practices contributes to the prosperity of our business and the future of our communities, our people, and our environment.
In 2019 we completed our materiality matrix and assessed these results to determine NZME’s Corporate Social Responsibility Framework. We have identified the key initiatives and objectives for each pillar. These are detailed in the following pages and form the framework that we will report against commencing in the 2020 financial year.
When the people important to our business prosper and live better lives, only then can we say we did the job we set out to do.
18 NEW ZEALAND MEDIA AND ENTERTAINMENT

OUR COMMUNITIES
We connect and empower our communities.
Sharing our platforms
Connecting communities
Responsible reporting
Promoting a healthy, diverse and safe
workplace
Championing the craft
Best practice
Recycling
Responsibility
OUR PEOPLE
We provide a workplace that fosters innovation,
engagement and inclusion.
OUR ENVIRONMENT
We take our responsibility to the environment
seriously.
Equipping our people
We are committed to protecting the craft of journalism and broadcasting to keep Kiwis in the know.
ANNUAL REPORT 2019 19

OUR COMMUNITIES.
INITIATIVE OBJECTIVE MEASUREMENTS
RESPONSIBLE REPORTING AND BROADCASTING
Through best practice broadcasting and journalism, we will provide a diverse and balanced reporting platform, promoting the law and holding the powerful to account.
Adhere to our Editorial Code of Ethics and the principles and standards of the NZ Media Council and the Broadcasting Standards Authority.
Number of upholds.
Where justified in the interests of freedom of expression, open justice and holding the powerful to account, we will invest in legal challenges of suppression, take down orders, access to court files and other media law challenges as appropriate.
Number of challenges.
CONNECTING COMMUNITIES
We are deeply involved in our communities and as one of New Zealand’s largest media platforms we will facilitate conversations about the topics that matter to Kiwis.
Maintain our commitment to the regions through the presence of local journalists and broadcasters.
Number of local journalists/ broadcasters in the regions.
Participate in and support the Local Democracy Reporters (LDR) - NZ On Air funded journalists.
Number of LDRs in NZME newsrooms.
Support an increase in the diversity of content and contributors across our platforms.
Policies and initiatives that support this. Examples of diverse perspectives shared through our platforms.
SHARING OUR PLATFORMS
We will use our wide reach across New Zealand to provide a range of opinion and ensure a diversity of voice.
Use our platforms to fight for New Zealanders, including the disadvantaged, and to hold the powerful to account.
Examples of initiatives.
Partner to champion charitable causes and facilitate conversations that matter.
List of charitable partnerships.
We connect and empower our communities.
Through our extensive range of publications, radio networks and digital platforms NZME is proud to support communities right across New Zealand. We share their stories and support local campaigns to better their communities and we represent New Zealanders fighting for those less advantaged.
NZME recognises the responsibility that comes with acting as a voice of record for New Zealand. We use this reach to address key topics and conversations important to New Zealanders. In 2019 this included: A Not for Sale, B Fighting the Demon, C Radio Hauraki “We’re not talking” and D Jessica’s Tree.
20 NEW ZEALAND MEDIA AND ENTERTAINMENT

NZ Herald 'Jessica’s Tree' – raising awareness and in-depth conversation of suicide and mental health in New Zealand.
Radio Hauraki 'We’re not talking' – raising awareness of men's mental health and depression.
NZ Herald 'Fighting the Demon' – addressing New Zealand’s meth crisis.
NZ Herald 'Not for Sale' – raising awareness and opening the conversation to end exploitation of girls caught in modern day slavery.
B
D
C
A
ANNUAL REPORT 2019 21
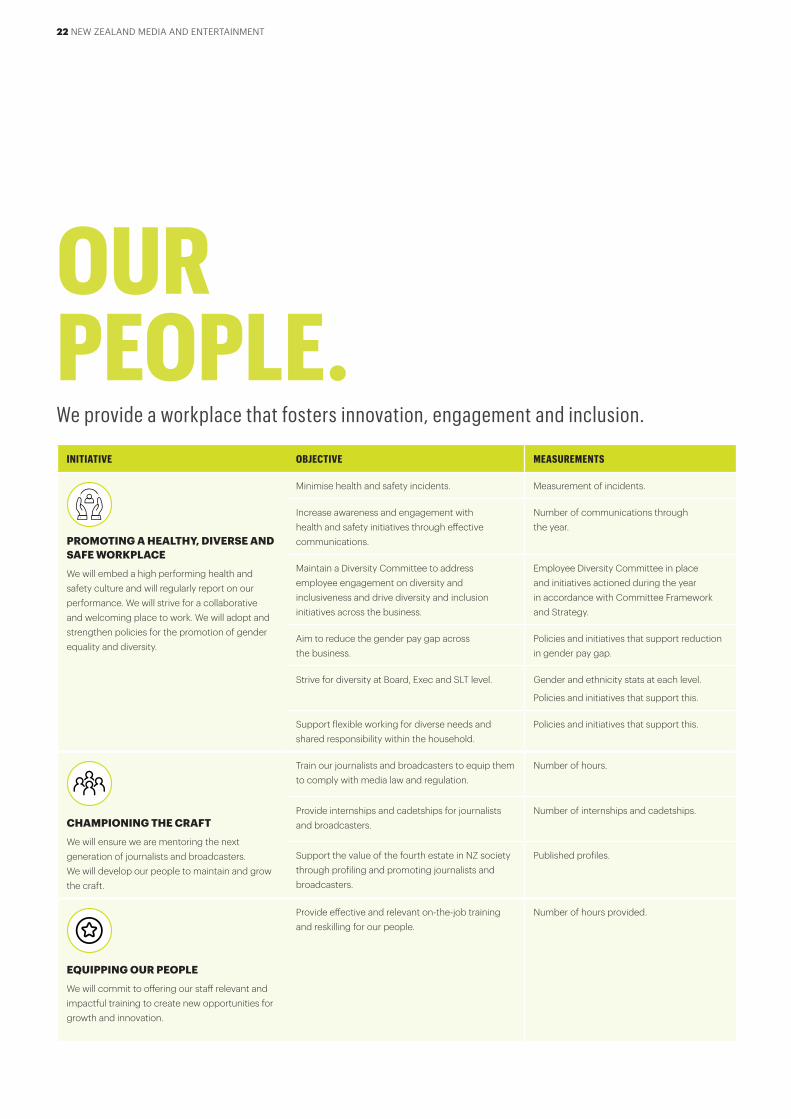
We provide a workplace that fosters innovation, engagement and inclusion.
INITIATIVE OBJECTIVE MEASUREMENTS
PROMOTING A HEALTHY, DIVERSE AND SAFE WORKPLACE
We will embed a high performing health and safety culture and will regularly report on our performance. We will strive for a collaborative and welcoming place to work. We will adopt and strengthen policies for the promotion of gender equality and diversity.
Minimise health and safety incidents. Measurement of incidents.
Increase awareness and engagement with health and safety initiatives through effective communications.
Number of communications through the year.
Maintain a Diversity Committee to address employee engagement on diversity and inclusiveness and drive diversity and inclusion initiatives across the business.
Employee Diversity Committee in place and initiatives actioned during the year in accordance with Committee Framework and Strategy.
Aim to reduce the gender pay gap across the business.
Policies and initiatives that support reduction in gender pay gap.
Strive for diversity at Board, Exec and SLT level. Gender and ethnicity stats at each level.
Policies and initiatives that support this.
Support flexible working for diverse needs and shared responsibility within the household.
Policies and initiatives that support this.
CHAMPIONING THE CRAFT
We will ensure we are mentoring the next generation of journalists and broadcasters. We will develop our people to maintain and grow the craft.
Train our journalists and broadcasters to equip them to comply with media law and regulation.
Number of hours.
Provide internships and cadetships for journalists and broadcasters.
Number of internships and cadetships.
Support the value of the fourth estate in NZ society through profiling and promoting journalists and broadcasters.
Published profiles.
EQUIPPING OUR PEOPLE
We will commit to offering our staff relevant and impactful training to create new opportunities for growth and innovation.
Provide effective and relevant on-the-job training and reskilling for our people.
Number of hours provided.
OUR PEOPLE.
22 NEW ZEALAND MEDIA AND ENTERTAINMENT
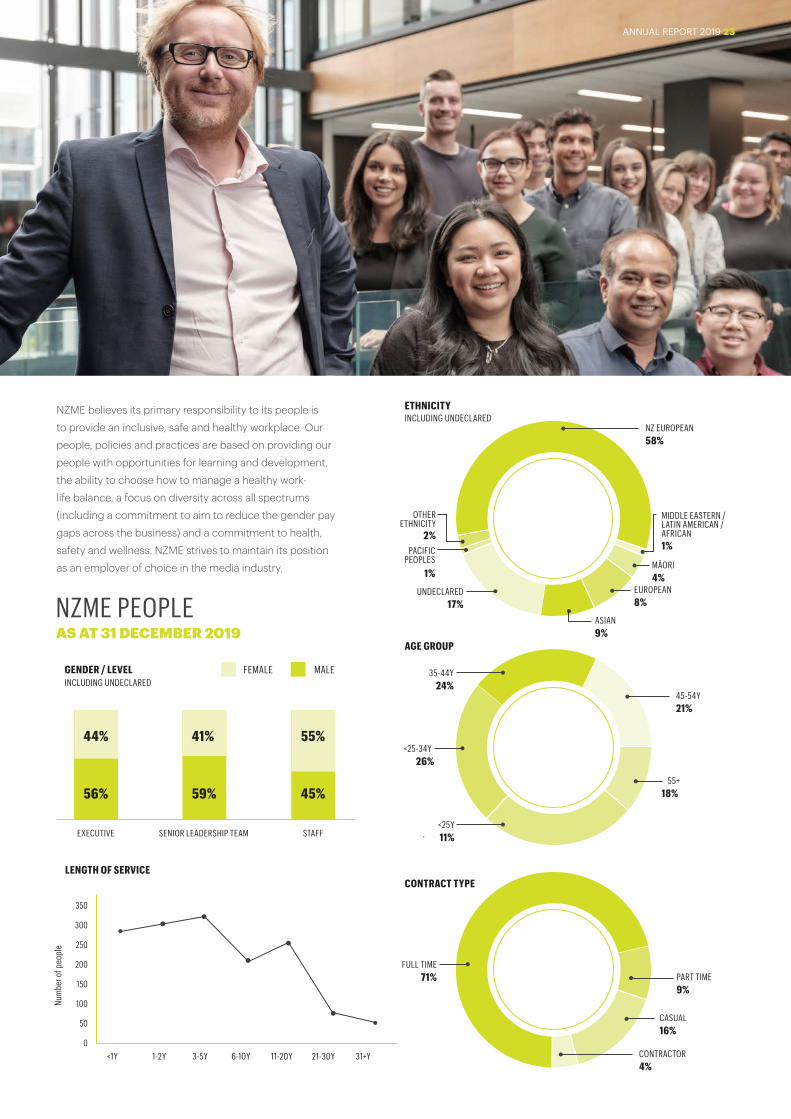
EXECUTIVE SENIOR LEADERSHIP TEAM STAFF
44%
56%
41%
59%
55%
45%
GENDER / LEVEL INCLUDING UNDECLARED
MALEFEMALE
AS AT 31 DECEMBER 2019NZME PEOPLE
LENGTH OF SERVICE
<1Y 1-2Y 3-5Y 6-10Y 11-20Y 21-30Y 31+Y
350
300
250
200
150
100
50
0
NZME believes its primary responsibility to its people is
to provide an inclusive, safe and healthy workplace. Our
people, policies and practices are based on providing our
people with opportunities for learning and development,
the ability to choose how to manage a healthy work-
life balance, a focus on diversity across all spectrums
(including a commitment to aim to reduce the gender pay
gaps across the business) and a commitment to health,
safety and wellness. NZME strives to maintain its position
as an employer of choice in the media industry.
ETHNICITYINCLUDING UNDECLARED
NZ EUROPEAN58%
MIDDLE EASTERN / LATIN AMERICAN / AFRICAN1%
MĀORI4%
EUROPEAN8%
ASIAN9%
UNDECLARED17%
PACIFIC PEOPLES
1%
OTHER ETHNICITY
2%
CONTRACT TYPE
FULL TIME71% PART TIME
9%
CASUAL16%
CONTRACTOR4%
AGE GROUP
35-44Y24%
<25-34Y26%
<25Y11%
45-54Y21%
55+18%
Num
ber o
f peo
ple
ANNUAL REPORT 2019 23
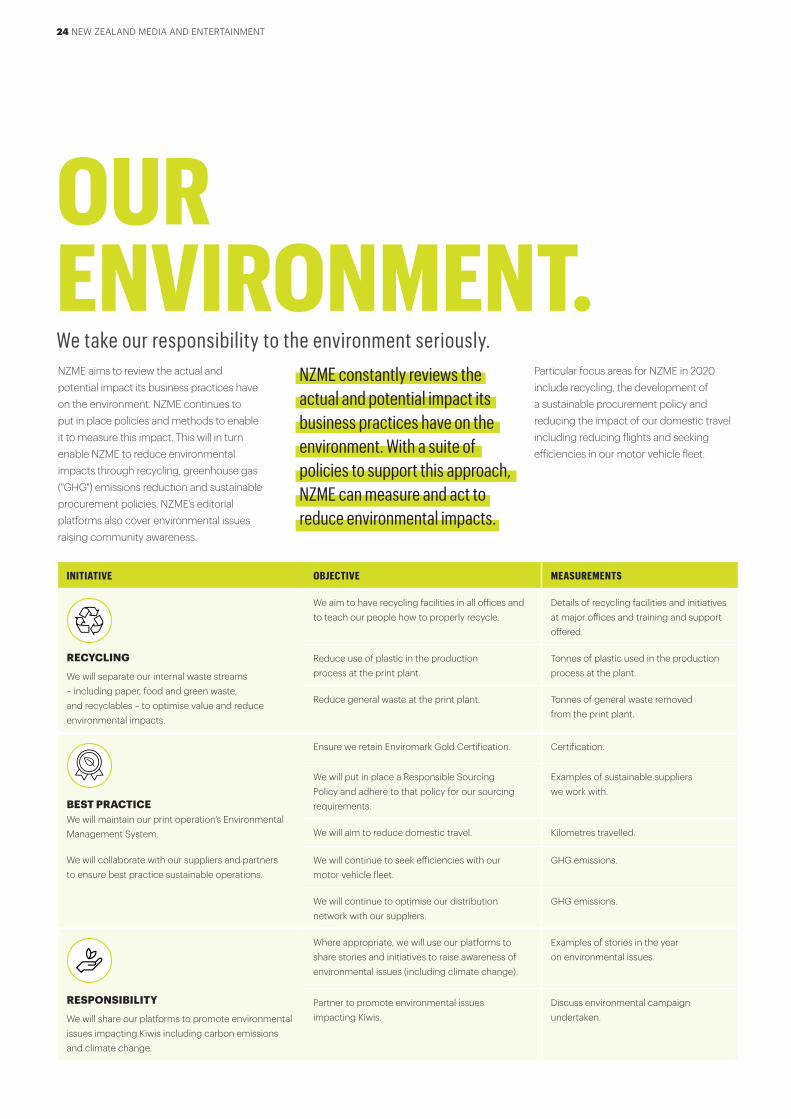
OUR ENVIRONMENT.We take our responsibility to the environment seriously.NZME aims to review the actual and potential impact its business practices have on the environment. NZME continues to put in place policies and methods to enable it to measure this impact. This will in turn enable NZME to reduce environmental impacts through recycling, greenhouse gas ("GHG") emissions reduction and sustainable procurement policies. NZME’s editorial platforms also cover environmental issues raising community awareness.
Particular focus areas for NZME in 2020 include recycling, the development of a sustainable procurement policy and reducing the impact of our domestic travel including reducing flights and seeking efficiencies in our motor vehicle fleet.
NZME constantly reviews the actual and potential impact its business practices have on the environment. With a suite of policies to support this approach, NZME can measure and act to reduce environmental impacts.
INITIATIVE OBJECTIVE MEASUREMENTS
RECYCLING
We will separate our internal waste streams – including paper, food and green waste, and recyclables – to optimise value and reduce environmental impacts.
We aim to have recycling facilities in all offices and to teach our people how to properly recycle.
Details of recycling facilities and initiatives at major offices and training and support offered.
Reduce use of plastic in the production process at the print plant.
Tonnes of plastic used in the production process at the plant.
Reduce general waste at the print plant. Tonnes of general waste removed from the print plant.
BEST PRACTICE We will maintain our print operation’s Environmental Management System.
We will collaborate with our suppliers and partners to ensure best practice sustainable operations.
Ensure we retain Enviromark Gold Certification. Certification.
We will put in place a Responsible Sourcing Policy and adhere to that policy for our sourcing requirements.
Examples of sustainable suppliers we work with.
We will aim to reduce domestic travel. Kilometres travelled.
We will continue to seek efficiencies with our motor vehicle fleet.
GHG emissions.
We will continue to optimise our distribution network with our suppliers.
GHG emissions.
RESPONSIBILITY
We will share our platforms to promote environmental issues impacting Kiwis including carbon emissions and climate change.
Where appropriate, we will use our platforms to share stories and initiatives to raise awareness of environmental issues (including climate change).
Examples of stories in the year on environmental issues.
Partner to promote environmental issues impacting Kiwis.
Discuss environmental campaign undertaken.
24 NEW ZEALAND MEDIA AND ENTERTAINMENT

We have commenced our journey of measuring our GHG emissions and are actively identifying our Scope 1, 2 and 3 carbon emission activities. We are currently assessing the boundaries of what emissions we report on.
To quantify and report our GHG emissions we have commenced collecting data and thinking about how we collect this in the future, to be able to convert this into a robust and comparable emissions number.
Our newspapers are 100 per cent recyclable, with newsprint made in New Zealand largely from waste or byproduct fibre from sustainable softwood resources using geothermal steam. We are very proud of our efforts around sustainability for print.
Matt Wilson, NZME Chief Operating Officer
ANNUAL REPORT 2019 25

THE NZME BOARD.
Peter Cullinane Independent Chair
Peter is widely respected in global advertising and marketing, and has extensive knowledge and expertise in both Australasian and global markets. Peter is the Founder and Chairman of Lewis Road Creamery Limited and is also an independent director of Sanford Limited. He was formerly Chief Operating Officer of Saatchi & Saatchi (Worldwide), and its Chief Executive Officer (New Zealand) and Chairman (Australasia). Peter was previously on the boards of HT&E Limited (listed on the ASX), WPP AUNZ Limited and SKYCITY Entertainment Group.
Carol Campbell Independent Director
Carol Campbell is a Chartered Accountant and Chartered member of the Institute of Directors. Carol was a partner at Ernst & Young for over 25 years and has been a professional Director for the last 9 years. Carol has extensive financial experience and a sound understanding of efficient board governance. Carol is a director of NZ Post Limited, Kiwibank Limited, T&G Global Limited, Asset Plus Limited, Chubb Insurance Limited and a number of other
private companies.
26 NEW ZEALAND MEDIA AND ENTERTAINMENT

David GibsonIndependent Director
David Gibson has a strong background in strategy and finance with over 20 years’ investment banking experience, including as Co-Head of Investment Banking in New Zealand for Deutsche Bank and Deutsche Craigs. During his finance career David has advised on many of New Zealand’s largest capital market transactions, including within the media industry. David is also a trustee for Diocesan School for Girls and a director of Rangatira Limited.
Sussan TurnerIndependent Director
For the past 25 years Sussan has held senior leadership roles across media companies, including Group CEO of MediaWorks, Managing Director of Radio Otago and CEO of RadioWorks. She is currently Group CEO and Director of Aspire2 Group Limited, one of the leading private tertiary education groups in New Zealand and is passionate about building executive teams and company cultures. Sussan has extensive experience as a director and is currently Pro-chancellor of Auckland University of Technology and Co-Chair of Organic Initiative Limited.
Barbara ChapmanIndependent Director
Barbara Chapman served as Chief Executive and Managing Director of ASB Bank Limited from 2011 until February 2018. She has extensive business experience gained through a successful career in banking and insurance. During her career she has held a number of senior and executive roles in retail banking, marketing, communications, human resources and life insurance. Barbara is passionate about people and culture, and promoting best practice in community, governance and sustainability. She is the Chair of Genesis Energy Limited and holds independent directorships on the boards of Fletcher Building Limited and IAG New Zealand Limited. She is also Deputy Chair of The New Zealand Initiative, Patron of the New Zealand Rainbow Tick Excellence Awards, Chair of the CEO Summit Committee for APEC 2021 and holds seats on the Reserve Bank Act Review Panel and the Prime Minister’s Business Advisory Council.
ANNUAL REPORT 2019 27
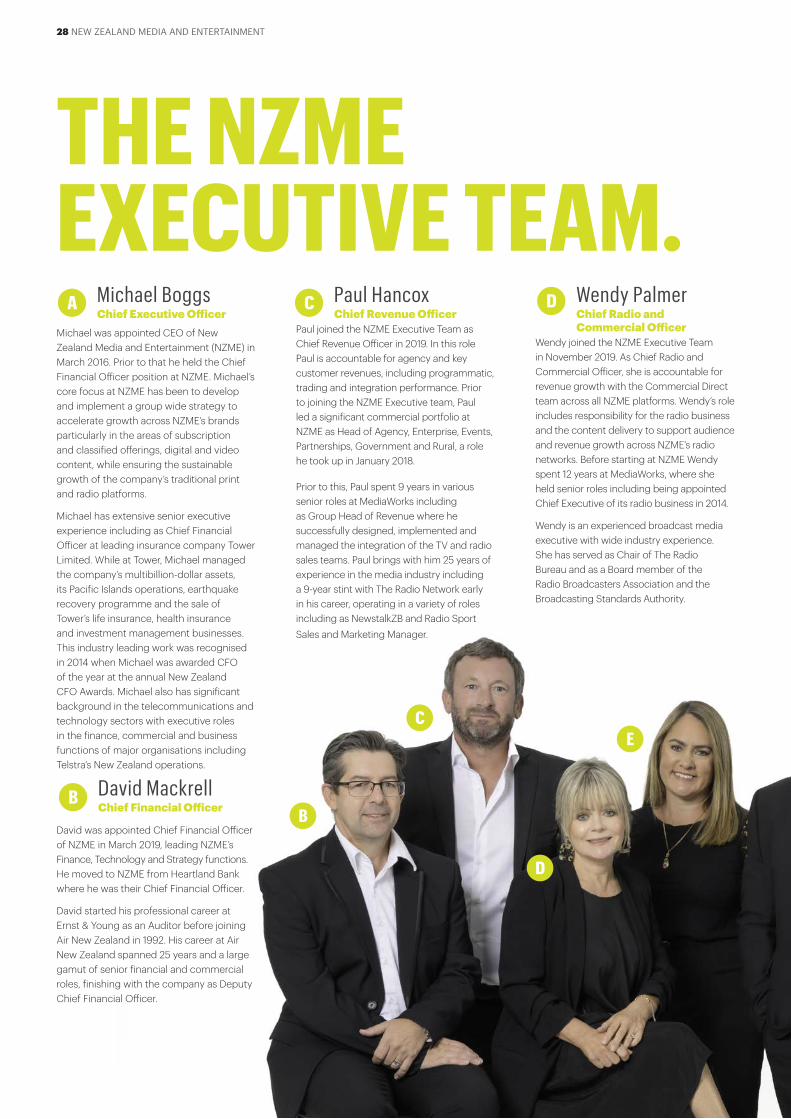
THE NZME EXECUTIVE TEAM.
Michael Boggs Chief Executive Officer
Michael was appointed CEO of New Zealand Media and Entertainment (NZME) in March 2016. Prior to that he held the Chief Financial Officer position at NZME. Michael’s core focus at NZME has been to develop and implement a group wide strategy to accelerate growth across NZME’s brands particularly in the areas of subscription and classified offerings, digital and video content, while ensuring the sustainable growth of the company’s traditional print and radio platforms.
Michael has extensive senior executive experience including as Chief Financial Officer at leading insurance company Tower Limited. While at Tower, Michael managed the company’s multibillion-dollar assets, its Pacific Islands operations, earthquake recovery programme and the sale of Tower’s life insurance, health insurance and investment management businesses. This industry leading work was recognised in 2014 when Michael was awarded CFO of the year at the annual New Zealand CFO Awards. Michael also has significant background in the telecommunications and technology sectors with executive roles in the finance, commercial and business functions of major organisations including Telstra’s New Zealand operations.
David Mackrell Chief Financial Officer
David was appointed Chief Financial Officer of NZME in March 2019, leading NZME’s Finance, Technology and Strategy functions. He moved to NZME from Heartland Bank where he was their Chief Financial Officer.
David started his professional career at Ernst & Young as an Auditor before joining Air New Zealand in 1992. His career at Air New Zealand spanned 25 years and a large gamut of senior financial and commercial roles, finishing with the company as Deputy Chief Financial Officer.
Paul Hancox Chief Revenue Officer
Paul joined the NZME Executive Team as Chief Revenue Officer in 2019. In this role Paul is accountable for agency and key customer revenues, including programmatic, trading and integration performance. Prior to joining the NZME Executive team, Paul led a significant commercial portfolio at NZME as Head of Agency, Enterprise, Events, Partnerships, Government and Rural, a role he took up in January 2018.
Prior to this, Paul spent 9 years in various senior roles at MediaWorks including as Group Head of Revenue where he successfully designed, implemented and managed the integration of the TV and radio sales teams. Paul brings with him 25 years of experience in the media industry including a 9-year stint with The Radio Network early in his career, operating in a variety of roles including as NewstalkZB and Radio Sport Sales and Marketing Manager.
Wendy Palmer Chief Radio and Commercial Officer
Wendy joined the NZME Executive Team in November 2019. As Chief Radio and Commercial Officer, she is accountable for revenue growth with the Commercial Direct team across all NZME platforms. Wendy’s role includes responsibility for the radio business and the content delivery to support audience and revenue growth across NZME’s radio networks. Before starting at NZME Wendy spent 12 years at MediaWorks, where she held senior roles including being appointed Chief Executive of its radio business in 2014.
Wendy is an experienced broadcast media executive with wide industry experience. She has served as Chair of The Radio Bureau and as a Board member of the Radio Broadcasters Association and the Broadcasting Standards Authority.
B
DA C
B
E
D
C
28 NEW ZEALAND MEDIA AND ENTERTAINMENT

Allison Whitney General Counsel and Company Secretary
Allison joined NZME in 2013. As General Counsel she heads up the legal team and manages the provision of legal advice and company secretarial services across NZME. Prior to commencing her role at NZME, Allison held roles both in-house and in private practice, including five years as Legal Counsel at Westpac, six years as Group Legal Advisor to a London-based international media group and three years in private practice at Kensington Swan.
Allison brings over 20 years of legal experience to her role spanning areas from corporate and commercial to intellectual property, consumer and media law.
Matthew Wilson Chief Operations Officer
Matt was appointed Chief Operations Officer in December 2016. In this role, Matt is responsible for NZME’s print product performance; driving NZME’s Operations functions including print, distribution, print and digital subscriptions and advertising production; and leading NZME’s Culture & Performance function. Prior to that, Matt’s role was GM Print Operations for NZME.
His passion for media has resulted in over two decades of experience working across NZME’s newspaper brands, including finance roles in print, commercial, content and corporate through to leading the Newspaper Sales, Print and Herald product
functions. During his time, Matt has led the consolidation of newspaper sales and distribution functions across NZME, the development of NZME’s highly successful distribution services business, and customer streams for the launch of Herald on Sunday and NZH Premium digital subscribers. Matt’s focus on operating performance has driven a strong passion for NZME’s people, their engagement and the culture fostered in the company.
Laura Maxwell Chief Digital Officer
Laura was appointed Chief Digital Officer in August 2017 and is responsible for growing digital business across NZME, including OneRoof, DRIVEN and GrabOne. Laura’s connection to NZME began in 2013 when she started out at The Radio Network as a Commercial Director, moving in 2014 to the position of Group Director Digital Media across the APN group. In 2015, Laura was appointed Group Revenue Director, a role that transitioned to Chief Commercial Officer as part of the NZME transformation.
Prior to joining the NZME group, Laura held the position of General Manager/Director for Yahoo! New Zealand and previously held the role of Sales Director for both APN Outdoor and Buspak New Zealand. Laura has over 25 years of experience in media and has held the role of Chair of the Interactive Advertising Bureau and The Radio Bureau.
Katie Mills Chief Marketing Officer
Katie joined the NZME Executive Team in December 2018 assuming leadership of the company’s Marketing and Communications functions. Immediately prior, Katie held the role of Group Marketing Director at Aspire2 Group Limited and was previously General Manager (Global) Marketing & Communications at Opus International Consultants.
Along with Katie’s wide marketing industry experience, she also brings to her role, more than 20 years of media-specific experience. 15 of those years were spent at MediaWorks in senior leadership positions including as Head of Marketing, successfully developing and delivering marketing and brand strategies for a portfolio of radio, digital, event and television ventures.
Shayne Currie Managing Editor
Shayne was appointed Managing Editor in 2015 and is responsible for NZME's 300-plus journalists and the company's editorial and news strategy. His role includes overseeing NZME’s unique mix of digital, print, audio and visual storytelling across the New Zealand Herald, nzherald.co.nz, Newstalk ZB, Radio Sport, NZME’s five regional daily newspapers and more than 20 community titles.
In 2019, Shayne helped oversee the successful launch of NZ Herald Premium digital subscriptions and he has helped lead some of the most significant projects at the Herald in the past 15 years including the launch of the Herald on Sunday in 2004 and the Herald's move to compact format in 2012. In 2019, Shayne celebrated his 30th year in
journalism, including two decades in senior editorial leadership roles
across New Zealand. In 2016 he was awarded the Wolfson Scholarship at Cambridge University in the UK, studying audience patterns
in the digital age.
F
G
H
I
E
A
G
I
F
H
ANNUAL REPORT 2019 29
CORPORATE GOVERNANCE.GOVERNANCE FRAMEWORK
NZME Limited ("the Company") is listed on the NZX Main Board and as a Foreign Exempt Listing on the ASX (both under the ticker code “NZM”). The ASX Foreign Exempt Listing category is based on a principle of substituted compliance recognising that, for secondary listings, the primary regulatory role and oversight rests with the home exchange and the supervisory regulator in that jurisdiction. As such, NZME is required to comply with a limited set of ASX Listing Rules.
The Company’s corporate governance framework, as described in this section, therefore primarily takes into consideration contemporary standards in New Zealand, incorporating the NZX Corporate Governance Code (“NZX Code”).
The Group is committed to having a strong governance framework and therefore complies with the recommendations of the NZX Code (unless specifically stated otherwise). The corporate governance policies referred to in this section reflect the Group’s governance framework as at 31 December 2019 (unless otherwise stated) and are available on the Company’s website: www.nzme.co.nz/corporate-governance.
PRINCIPLE 1 - CODE OF ETHICAL BEHAVIOURDirectors should set high standards of ethical behaviour, model this behaviour and hold management accountable for these standards being followed throughout the organisation.
Code of Conduct & Ethics
The Company’s Code of Conduct & Ethics governs the Company and its subsidiaries’ commercial operations and the conduct of directors, employees, consultants and all other people when they represent the Company and its subsidiaries. The Code of Conduct & Ethics comprises certain fundamental principles and demonstrates the high standards of conduct expected of us. The current Code of Conduct & Ethics was updated 11 April 2019. Reporting of breaches of the Code is encouraged and steps for doing so are set out in the Code of Conduct & Ethics and the Whistleblower Policy. The Company has provided training on the Code of Conduct & Ethics in the form of a video series on key points relevant to employees.
The Company also has an Editorial Code of Ethics highlighting that our principal responsibilities are to the community and the truth and our undertaking to maintain the highest ethical standards in our journalism while balancing the right of the individual with the public’s right to know.
Securities Trading Policy
The Securities Trading Policy details the Company’s trading policy and guidelines, including trading restrictions on dealing in the Company’s quoted financial products. This policy applies to the directors and all employees. The Securities Trading Policy places additional trading restrictions on the directors, the Chief Executive Officer (“CEO”) and his direct reports (and employees reporting directly to them) and all participants in any NZME Employee Incentive Plan.
PRINCIPLE 2 - BOARD COMPOSITION & PERFORMANCETo ensure an effective Board, there should be a balance of independence, skills, knowledge, experience and perspectives.
Role of the Board
The business and affairs of the Company is managed under the direction and supervision of the Board. The directors acknowledge their duty to act in good faith and in the best interests of the Company. The objective of the Company is to generate growth, corporate profit and shareholder gain from the activities of the Group. In pursuing this objective, the role of the Board is to assume accountability for the success of the Company by taking overall responsibility for the strategic direction and monitoring of operational management of the Group in accordance with good corporate governance principles. More details regarding the main functions of the Board can be found in the Board Charter.
Director Independence and Profile
All of the Company’s directors are independent directors for the purposes of the NZX Listing Rules. The profile for each director is available on the Company’s website
30 NEW ZEALAND MEDIA AND ENTERTAINMENT

(www.nzme.co.nz/corporate-governance/board-members) and on page 26 and 27 of the 2019 Annual Report. The roles of the Chair and CEO are exercised by different persons.
Nomination and Appointment
Directors are appointed by the Company’s shareholders, with rotation and retirement being determined by the Constitution and the NZX Listing Rules. The Board may appoint directors to fill casual vacancies. Directors appointed to fill casual vacancies are required to retire and stand for election at the first annual shareholders’ meeting after their appointment. The Governance & Remuneration Committee recommends to the Board potential candidates for appointment as directors.
Induction and Access to Information and Advice
On appointment to the Board a director will be given a copy of the Board Charter, an appointment letter covering the role of the Board, the Board’s expectations of the director and any particular terms of his or her appointment. The director will be offered induction training as to the responsibilities of the directors and to enable the director to become familiar with the Company’s operations and sites. All directors have access to the advice and assistance of the General Counsel on the Board’s affairs and governance matters. In addition, all directors may access such information and seek independent advice as they consider necessary to fulfil their duties and responsibilities.
Skills and Experience
The Governance & Remuneration Committee reviews, and makes recommendations to the Board, regarding the composition of the Board on an ongoing basis to ensure that it is comprised of members who provide the required breadth and depth of experience and knowledge to achieve the objectives of the Board. It also considers and recommends to the Board the appointment of additional directors to provide the expertise to achieve the strategic and economic goals of the Company. Directors are expected to maintain their knowledge of the latest governance and business practices in order to perform their duties and the Company supports their development.
Directors and Officers Insurance
In accordance with Section 162 of the Companies Act 1993 and the Company’s Constitution, NZME has indemnified and arranged insurance for all directors and executive officers to the extent permitted by law for liabilities arising out of the performance of their normal duties as directors and officers. The total amount of insurance for directors and officers contract premiums was $501,463.
Performance Review
The Chairperson meets annually with directors of the Company to discuss individual performance of directors. The Board reviews its performance as a whole, and the performance of its committees, on an annual basis. The Board may choose to use external facilitators, where appropriate, to assist with reviewing the performance of directors, the Board and its committees.
Diversity and Inclusion
The Diversity and Inclusion Policy details the Company’s approach to diversity and inclusion, including specifying the principles adopted by the Company, oversight and sponsorship, programmes and initiatives and the requirement for the Board, in consultation with the CEO, to set measurable objectives for achieving diversity and assess progress in achieving them.
The Group believes that a diverse workforce is essential for it to be able to deliver its strategic objectives and continue to meet its responsibilities to its customers, its employees, the communities in which it works, and its shareholders.
The Group is currently operating in accordance with, and applying the principles of, its Diversity and Inclusion Policy, which was updated in December 2019 and is available on the Company’s website. The Our People section on page 22 of the 2019 Annual Report contains more information on our diverse workforce and the diversity objectives and measurements for 2020 are included in our sustainability commitment.
ANNUAL REPORT 2019 31

The table below includes the quantitative breakdown as to the gender composition of NZME’s Board and Officers A.
As at Board Officers A
Male Female Male Female
31 December 2019 2 3 5 4
31 December 2018 2 3 5 4
PRINCIPLE 3 - BOARD COMMITTEESThe Board should use committees where this will enhance its effectiveness in key areas, while retaining Board responsibility.
The Board has three standing Committees, the Audit & Risk Committee, the Governance & Remuneration Committee and the Corporate Social Responsibility Committee, to assist in carrying out its responsibilities. The Committees operate under Board approved charters which are available on the Company’s website: www.nzme.co.nz/corporate-governance.
The Board may establish other committees from time to time to deal with specific projects or matters relating to the Company’s various activities. The Board does not have a separate Health & Safety Committee, but Health & Safety is considered by the full Board. The Board did not identify a need for any other standing Board committees. The Company also has an NZME Takeover Response Manual (not publicly available) as recommended by Recommendation 3.6 of the NZX Code (adopted 12 December 2017).
Audit & Risk Committee
The Committee consists of at least three non-executive directors, with the majority being also independent directors (one of whom has an accounting and financial background). The functions of the Committee are to:
• Review, consider and if necessary, investigate any reports or findings arising from any audit function either internally or externally;
• Evaluate financial information submitted to it, along with relevant policies and procedures; and
• Assess the effectiveness of risk management throughout the Group.
The Committee is also responsible for communicating and engaging with the external auditors and for oversight and review of the risk management framework. For further information, also refer to the Committee’s charter which is available on the Company’s website.
For the year ended 31 December 2019, directors Barbara Chapman and David Gibson were members of the Audit & Risk Committee and it was chaired by Carol Campbell. Employees and external parties may attend meetings of the Audit & Risk Committee at the invitation of the Audit & Risk Committee.
Governance & Remuneration Committee
The Governance & Remuneration Committee ensures that remuneration policies and practices are consistent with the strategic goals of the Group and are relevant to the achievement of those goals. The Committee also reviews the remuneration of the CEO and, in consultation with the CEO, the remuneration packages of executives reporting directly to the CEO.
The Governance & Remuneration Committee also makes recommendations to the full Board regarding the composition of the Board, filling of vacancies, appointing additional directors to the Board, and to review and adopt corporate governance policies and practices which reflect contemporary standards in New Zealand, incorporating principles and guidelines issued by the Financial Markets Authority and the NZX. For further information, refer to the Committee’s charter available on the Company’s website.
For the year ended 31 December 2019, directors Peter Cullinane and Sussan Turner were members of the Governance & Remuneration Committee and it was chaired by David Gibson. Employees and external parties may attend meetings of the Governance & Remuneration Committee at the invitation of the Governance & Remuneration Committee.
CORPORATE GOVERNANCE. CONT.
A The term ‘Officer’ is defined in the NZX Listing rules as a person, however designated, who is concerned or takes part in the management of the Issuer’s business, but excludes (i) a person who does not report directly to the Board or (ii) a person who does not report directly to a person who reports to the Board. NZME has interpreted this to mean the Chief Executive Officer (“CEO”) and any person reporting to the CEO or the Board directly. The numbers above therefore include the CEO and other members of the Group Executive Team.
32 NEW ZEALAND MEDIA AND ENTERTAINMENT
Corporate Social Responsibility Committee
The Corporate Social Responsibility Committee supports NZME’s values, strategic plan and corporate reputation by ensuring that the Company’s Corporate Social Responsibility (CSR) strategy is best practice and supports to the highest level its CSR objectives. The Committee also ensures CSR objectives, policies and practices are consistent with the strategic goals of the Group.
For the year ended 31 December 2019, directors Peter Cullinane and Sussan Turner were members of the Corporate Social Responsibility Committee and it was chaired by Barbara Chapman. Employees and external parties may attend meetings of the Corporate Social Responsibility Committee at the invitation of the Corporate Social Responsibility Committee.
PRINCIPLE 4 - REPORTING & DISCLOSUREThe Board should demand integrity in financial and non-financial reporting, and in the timeliness and balance of corporate disclosures.
Market Disclosure Policy
The Board has policies and procedures in place to keep investors and staff informed of material information about the Company and to ensure compliance with the continuous disclosure obligations under the Financial Markets Conduct Act 2013 and the NZX Listing Rules.
The Market Disclosure Policy is designed to ensure that:
• There is full and timely disclosure of the Company’s activities and material information to shareholders and the market; and
• All stakeholders (including shareholders, the market and other interested parties) have an equal opportunity to receive and obtain externally available information issued by the Company.
The Company will immediately notify the market of any material information concerning the Company in accordance with legislative and regulatory disclosure requirements.
Charters and Policies
The following charters and policies have been adopted by the Company and are available on the Company’s website under the Corporate Governance section (www.nzme.co.nz/corporate-governance):
• Board Charter
• Code of Conduct and Ethics
• Remuneration Policy
• Diversity and Inclusion Policy
• Editorial Code of Ethics
• Fraud Policy
• Market Disclosure Policy
• Whistleblower Policy
• Securities Trading Policy
• Audit & Risk Committee Charter
• Governance & Remuneration Committee Charter
• Risk Management Policy
• Corporate Social Responsibility Committee Charter
Constitution
The Company’s constitution (“Constitution”) is filed on the Companies Office website (http://www.companies.govt.nz/co/1181195). The Constitution specifies that the maximum number of directors (other than alternate directors) is eight. As at 31 December 2019, the Company had five directors.
The Constitution contains, amongst other things, the requirements regarding appointment and rotation of directors, filling vacancies on the Board, meetings of the Board and Board Committee proceedings, and appointing alternate directors. The Constitution also requires the Company to comply with the NZX Listing Rules for so long as it is listed on the NZX.
The Constitution was updated and approved by shareholders at the 2019 Annual Meeting in June 2019.
Financial Reporting and Disclosure
The Company is committed to providing financial reporting that is balanced, clear and objective. The Audit & Risk Committee oversees the quality, integrity and timeliness of external reporting. The Group’s Consolidated Financial Statements for the year ended 31 December 2019 are set out on pages 48 to 95 of this 2019 Annual Report. Also refer to the reports from the Chair and the CEO in this 2019 Annual Report and the NZME 2019 Full Year results presentation (available on the Company’s website) for additional information.
ANNUAL REPORT 2019 33

Non-Financial Reporting and Disclosure
The Company provides non-financial disclosures relating to Health & Safety, Risk Management, our interaction with our communities, people and our environment. We also include information about our performance against our operational priorities during the year.
NZME announced its Sustainability Commitment at the 2019 Annual Shareholders’ Meeting in June 2019. NZME’s Sustainability Commitment aligns with the UN Sustainability Development Goals – an international blueprint to achieve a better and more sustainable future for everyone. Combined with our promise to keep Kiwis in the know, NZME’s commitment to sustainable practices contributes to the prosperity of our business and our communities, people and the environment.
In 2019 we completed our materiality matrix and assessed these results to set the focus for NZME’s Sustainability Commitment. We have identified the key initiatives and objectives for each of the three pillars of our Sustainability Commitment: Our Communities, Our People and Our Environment. In this year’s Annual Report, we have released further details of our Sustainability Commitment including the initiatives, objectives and measurements against which we will report on for the 2020 financial year. This is discussed on pages 18 to 25 of the 2019 Annual Report.
PRINCIPLE 5 - REMUNERATIONThe remuneration of directors and executives should be transparent, fair and reasonable.
Remuneration Policy
The Remuneration Policy outlines the Company’s approach to the remuneration of its directors and executives. The Governance & Remuneration Committee is responsible for reviewing non-executive directors’ remuneration and benefits. The pool available to be paid to non-executive directors is subject to shareholder approval. The levels of fixed fees payable to non-executive directors should reflect the time commitment and responsibilities of the role. The Governance & Remuneration Committee will obtain independent advice, as necessary, and will also consider the results of market comparison and a benchmarking assessment in setting the fixed fees payable to non-executive directors.
While the Company does not pay equity-based remuneration to its non-executive directors, it encourages those directors to hold shares in the Company to better align their interests with the interests of other shareholders.
The Governance & Remuneration Committee is also responsible for reviewing the remuneration of the CEO and any executive directors and, in consultation with the CEO, for reviewing the remuneration packages of executives reporting directly to the CEO. The Company conducts external benchmarking analysis in order to determine the market rate for a role. The Company provides a combination of cash and non-cash benefits and takes a total remuneration approach. The Company reviews remuneration with the objective of achieving pay equity, including by gender.
Directors’ Remuneration
The fees paid to each director depends on the duties of the director, including committee work. Current fees per annum are as follow:
Fees ($)
Chair of the NZME Board 150,000
Membership of the NZME Board 100,000
Chair of NZME Board Committees 20,000
Membership of NZME Board Committees 10,000
CORPORATE GOVERNANCE. CONT.
34 NEW ZEALAND MEDIA AND ENTERTAINMENT

Director Date first appointed
Chairman of the Board Board Member Committee
ChairCommittee
Member Total
Peter Cullinane 24 June 2016 150,000 - - 20,000 170,000
Carol Campbell 24 June 2016 - 100,000 20,000 - 120,000
David Gibson 8 December 2017 - 100,000 20,000 10,000 130,000
Barbara Chapman 18 April 2018 - 100,000 20,000 10,000 130,000
Sussan Turner 16 July 2018 - 100,000 20,000 120,000
Total fees paid 670,000
The table below shows number of attendances at Board and Committee meetings by directors for the year ended 31 December 2019.
Director Board Audit & Risk Governance & Remuneration
Corporate Social Responsibility
Peter Cullinane 9 of 9 N/A 6 of 6 3 of 3
Carol Campbell 9 of 9 4 of 4 N/A N/A
David Gibson 9 of 9 4 of 4 6 of 6 N/A
Barbara Chapman 9 of 9 4 of 4 N/A 3 of 3
Sussan Turner 9 of 9 N/A 6 of 6 3 of 3
Salary A Bonus B TIP C Benefits D Total
Michael Boggs 806,260 - 204,459 24,188 1,034,907
A Salary includes normal basic salary and paid leave. B Bonus payments are those paid during the current accounting period and excludes any bonus accrual not yet paid. C TIP relates to the value of shares issued under the Group's Total Incentive Plan ("TIP") in relation to the 2016 scheme. D Benefits relate to company contributions for KiwiSaver.
Michael Boggs held 475,282 shares in the company as at 31 December 2019. In addition to the remuneration disclosed above as at 24 February 2020, Michael Boggs held 827,738 performance rights issued to him under the Group's Total Incentive Plan (“TIP”). Please refer to note 4.3 of the Consolidated Financial Statements for a summary of the TIP and the performance criteria used to determine performance-based payments. The number above includes rights for dividends foregone in the period 1 January 2018 to 31 December 2019 in relation to the 2017 TIP.
Directors of Subsidiary Companies
As at 31 December 2019, Michael Boggs (CEO) and David Mackrell (CFO) were directors of the wholly owned subsidiaries listed in Note 6.1 of the Consolidated Financial Statements,
other than NZME Australia Pty Limited. Michael Boggs and Mark O’Sullivan (a professional director resident in Australia) were directors of NZME Australia Pty Limited as at 31 December 2019. Michael Boggs, David Mackrell and Laura Maxwell (Chief Digital Officer) were directors of the subsidiary OneRoof Limited, in which an 80% interest was held, as listed in Note 6.1 of the Consolidated Financial Statements. Other than Mark O’Sullivan who received $9,004 for his services as a director of NZME Australia Pty Limited, they did not receive any fees or other benefit for their services as directors to any of these companies. Michael Boggs, David Mackrell and Laura Maxwell receive remuneration as employees of the Company which are not related to their duties as directors of these companies.
ANNUAL REPORT 2019 35

Directors of Associates, Joint Ventures and Joint Operations
Associates, joint ventures and joint operations are listed in Note 6.2 of the Consolidated Financial Statements. As at 31 December 2019 the following roles were held by Officers A:
Associates, Joint Ventures and Joint Operations Officer A Designation
New Zealand Press Association Limited Michael Boggs Director
Shayne Currie Director
Newspapers Publishers Association Michael Boggs Member – Board of control
Shayne Currie Member – Board of control
Chinese New Zealand Herald Limited Laura Maxwell Director (resigned 23 December 2019)
Matthew Wilson Director (resigned 23 December 2019)
Restaurant Hub Limited Laura Maxwell Director (resigned 8 April 2019)
Dean Buchanan Director (resigned 31 October 2019)
Eveve New Zealand Limited Laura Maxwell Director (resigned 8 April 2019)
Dean Buchanan Director (resigned 29 November 2019)
KPEX Limited Michael Boggs Director
Ratebroker Limited Michael Boggs Director (resigned 14 February 2019)
The Radio Bureau (unincorporated joint venture) Paul Hancox Chair – Board
Matt HeadlandRepresentative – Board (resigned 31 October 2019)
Katie Mills Representative – Board
Herald FoundationMichael Boggs, Matt Wilson, Allison Whitney
Trustee
Radio Broadcasters Association Incorporated Dean BuchananMember - Board (resigned 31 October 2019)
Wendy Palmer Member – Board
A Only roles held by “Officers” of NZME as defined in the NZX Listing Rules are included. The Officers did not receive any fees or other benefit for their services to any of these associates, joint ventures and joint operations, however NZME employees do receive remuneration as employees of the Company which are not related to their roles with these companies.
CORPORATE GOVERNANCE. CONT.
36 NEW ZEALAND MEDIA AND ENTERTAINMENT

Employee Remuneration
The Group paid remuneration including benefits in excess of $100,000 to employees (other than directors) during the year ended 31 December 2019. The salary banding for these employees are disclosed in the following table (bands with zero number of employees have been excluded):
Remuneration Amount Employees Remuneration Amount Employees
$100,000 - $110,000 66 $280,001 - $290,000 3
$110,001 - $120,000 61 $290,001 - $300,000 1
$120,001 - $130,000 47 $300,001 - $310,000 1
$130,001 - $140,000 55 $310,001 - $320,000 1
$140,001 - $150,000 29 $320,001 - $340,000 2
$150,001 - $160,000 25 $340,001 - $350,000 1
$160,001 - $170,000 23 $350,001 - $360,000 1
$170,001 - $180,000 10 $360,001 - $370,000 3
$180,001 - $190,000 13 $370,001 - $380,000 3
$190,001 - $200,000 14 $390,001 - $400,000 4
$200,001 - $210,000 11 $440,001 - $450,000 1
$210,001 - $220,000 9 $450,001 - $460,000 1
$220,001 - $230,000 8 $460,001 - $470,000 1
$230,001 - $240,000 5 $520,001 - $530,000 1
$240,001 - $250,000 2 $530,001 - $540,000 1
$250,001 - $260,000 9 $890,001 - $900,000 1
$260,001 - $270,000 2 $1,030,001 - $1,040,000 1
$270,001 - $280,000 2
Total number of employees that were paid remuneration of $100,000+ 418
The remuneration above includes all remuneration paid to permanent employees, including fixed remuneration, employer KiwiSaver contributions, medical aid contributions, bonuses, commission, settlements and redundancies.
ANNUAL REPORT 2019 37

PRINCIPLE 6 - RISK MANAGEMENTDirectors should have a sound understanding of the material risks faced by the issuer and how to manage them. The Board should regularly verify that the issuer has appropriate processes that identify and manage potential and material risks.
Risk Management Framework
The Audit & Risk Committee is responsible for the oversight and independent review of the Group’s Risk Management Framework and Guidelines, and assisting the Board to discharge its oversight responsibility for risk management, including:
• Review and approval of the risk management policy;
• Receiving and considering reports on risk management;
• Assessing the effectiveness of the Group’s responses to risk; and
• Providing the Board with regular reports on risk management.
The Group has a formal Risk Management Policy and is committed to the consistent, proactive and effective monitoring and management of risk throughout the organisation, in accordance with best practice and the NZME Risk Management Framework and Guidelines.
The Board is ultimately responsible for the effectiveness, oversight and implementation of the Group’s approach to risk management.
The CEO is responsible for:
• The management of strategic, operational and financial risk of the Group;
• Continually monitoring the Group’s progress against financial and operational performance targets;
• The day-to-day identification, assessment and management of risks applicable to the Group;
• Implementation of risk management controls, processes and policies and procedures appropriate for the Group; and
• Driving a culture of risk management throughout the Group.
The NZME Risk Committee (a management committee) acts as a governance forum to assist the CEO and the Group Executive in fulfilling their corporate governance responsibilities. This Committee provides assurance that the following aspects are managed appropriately:
• Strategic and operational risk management;
• Workplace Health & Safety matters;
• Legal, regulatory and policy compliance;
• Technology and security matters; and
• Business continuity planning.
The Group has a Head of Risk & Compliance who is responsible for providing guidance where required and developing tools, templates and policies that facilitate the identification, management and reporting of risk and supports the overall Risk Management Framework and Guidelines.
The Group is a diversified media company and is subject to different types of risk including, but not limited to cyber security, legal and regulatory compliance, financial and market, government policy and political, reputation and brand, operational risks and trading conditions.
The Group recognises that in order to achieve its strategic objectives it must be willing to take and accept informed risks. Risks relating to innovation, attracting and retaining talent, and content to drive audiences and address the needs of advertisers are encouraged within defined parameters. However, in doing so, it is not acceptable to trade off financial or strategic returns by compromising compliance with the law, the safety of our people, or our reputation as a responsible corporate citizen and provider of news, sport and entertainment.
When setting the appetite for taking and accepting risk, the Group also considers the risk posed by inaction in what is a fast-paced and disrupted market.
The Group’s approach to risk management is assessed at least annually by the Audit & Risk Committee of the Board in order to make a recommendation to the full Board on the appropriateness of NZME’s Risk Management Framework and Guidelines. The NZME Head of Risk & Compliance reports to the NZME Risk Committee and Chief Financial Officer (“CFO”) on the progress of the implementation of the Risk Management Framework and Guidelines. The CFO reports to the CEO and the Audit & Risk Committee on the progress of the implementation of the Risk Management Framework and Guidelines.
For additional information on financial risks, please also refer to Note 4.7 of the Consolidated Financial Statements.
CORPORATE GOVERNANCE. CONT.
38 NEW ZEALAND MEDIA AND ENTERTAINMENT

Health & SafetyThe NZME Board Charter states that the role of the Board includes ensuring that the Group Health & Safety and environmental practices and culture comply with legal requirements, reflects best practice and are recognised by employees and contractors as key priorities for the Group. As noted earlier, NZME does not have a separate Board-level Health & Safety Committee as Health & Safety is dealt with by the full Board.
Health & Safety is included on the NZME Board Risk Register. The NZME Annual Health & Safety Plan captures the projects and objectives for the year to respond to the identified risks. NZME records and monitors critical Health & Safety risks in a separate Health & Safety Risk Register. Currently that register is reviewed and monitored by the Risk Committee, who meet monthly and receive and review reporting on Health & Safety performance, trends and updates, with key matters and progress against the annual plan being reported to the Board.
Health & Safety advice and direction are overseen by the Culture and Performance team and a Health, Safety and Wellbeing Manager. NZME utilises the online safety management system “Vault” as the framework for how safety is managed within the business. Vault is used for incident reporting, contractor management, hazard and risk management, management of hazardous substances, risk monitoring and reporting.
Worker engagement and involvement is recognised as an important part of growing a positive workplace Health & Safety culture. At NZME, being actively involved in and contributing to Health & Safety is included in the GuideMe performance review template as a KPI for all employees and reviewed as part of the performance review process. Health & Safety training forms part of induction and ongoing training schedules to ensure awareness of NZME’s Health & Safety obligations, critical risks and the resources available to satisfy these. To ensure effective worker involvement, NZME has multiple Health & Safety Committees in place across New Zealand that actively contribute to the management of risk and the effectiveness of controls in place around the business. Health & Safety performance is communicated throughout all levels of NZME through regular Senior Leadership team meetings and internal business communications.
NZME maintains Wellness and Safety pages on its intranet with sections for Safety (which includes training manuals, emergency procedures and safety induction documents) and Wellness (which includes information about our Employee Assistance Programme, wellness videos and wellness success stories).
PRINCIPLE 7 - AUDITORSThe Board should ensure the quality and independence of the external audit process.
Refer to note 2.2.4 of the Consolidated Financial Statements for fees paid to the auditors, PricewaterhouseCoopers, for the year ended 31 December 2019.
The Audit & Risk Committee Charter requires the Committee to assess the following:
• The independence of the auditor;
• The ability of the auditors to provide additional services which may be occasionally required;
• The competency and reputation of the auditors;
• The projected audit fees; and
• Review the appointment, performance and remuneration of external auditors.
The Audit & Risk Committee also monitors and approves any services provided by the auditors other than in their statutory role and receives confirmation from the auditors as to their independence from the Company. This is undertaken on a service by service basis and assesses whether the service is permissible under Professional and Ethical Standard 1 (“PES 1”) issued by the New Zealand Auditing and Assurance Standards Board, ensuring that any potential threat to independence is identified and appropriate safeguards to eliminate the threat or reduce the threat to an acceptable level are established. The Audit & Risk Committee receives an annual confirmation from the auditor as to their independence from the Group. The auditor is also required to provide the Audit & Risk Committee with a detailed analysis of fees relating to non-audit services provided during the year, including a description of potential threats to their independence and the applicable safeguards implemented by the auditor and the Company to either mitigate those threats or reduce them to an acceptable level as required by PES 1. The Audit & Risk Committee takes the nature of the services provided, the quantum of the fee, the reason for the additional services and whether the services are likely to be one-off or repetitive in nature into consideration when evaluating and concluding on auditor independence.
For the year ended 31 December 2019, given the nature of the services provided and based on the Committee’s continuous monitoring of auditor independence, the Audit & Risk Committee do not believe that the non-audit services provided by the auditors compromised their objectivity and independence.
ANNUAL REPORT 2019 39

The Company requires the external auditor to attend the Annual Shareholders Meeting (“ASM”) to answer questions from shareholders in relation to the audit. The Group’s auditor, PricewaterhouseCoopers, attended the last ASM on 12 June 2019.
Internal Audit
The Audit & Risk Committee is responsible for reviewing the integrity and effectiveness of the internal audit function. NZME operates a co-sourced internal audit programme that utilises a mix of self-certifications, scheduled control testing by Group Financial Services, ad hoc assignments, investigations by Risk & Compliance and a structured internal audit programme executed by an external firm.
Any reporting from external parties is presented to the Audit & Risk Committee and any significant findings from other internal activities are reported to the Audit & Risk Committee in the Risk & Compliance report.
PRINCIPLE 8 - SHAREHOLDER RIGHTS & RELATIONSThe Board should respect the rights of shareholders and foster constructive relationships with shareholders that encourage them to engage with the issuer.
NZME seeks to regularly engage with shareholders to ensure they are informed about our activities and our progress against our stated priorities. NZME employs an Investor Relations Manager to ensure any questions or feedback from shareholders are responded to promptly.
The NZME website has a dedicated Investor Relations section containing NZX / ASX announcements, presentations & webcasts, financial reports, frequently asked questions and other information that might be useful to our shareholders. The share registry is maintained by Link Market Services and their contact details are available under the Investor Relations section of the Company’s website. Shareholders can elect to receive communications electronically.
Following each results announcement, NZME holds an investor call to present the results and to allow investors to ask questions. This is followed by an investor roadshow during which the CEO, CFO and other members of the Executive aim to meet with as many shareholders as possible.
Shareholders are entitled to exercise their voting rights as provided for under the applicable legislation and listing rules.
CORPORATE GOVERNANCE. CONT.
40 NEW ZEALAND MEDIA AND ENTERTAINMENT

INTERESTS REGISTERThe general disclosures of interests made by directors of Company during the accounting period, pursuant to section 140(2) of the Companies Act 1993, are shown below.
Director Company Position
Peter Cullinane Sanford Limited Director
David Gibson Rangatira Limited Director
Barbara Chapman The New Zealand InitiativeAPEC 2021 - CEO Summit Committee
Deputy Chair Chair
Sussan Turner Waitemata District Health Board Well Foundation Trustee (resigned 9 December 2019)
The Interests Register also includes, pursuant to section 140(1) of the Companies Act 1993, entries for authorising the remuneration and particulars of indemnities and insurance for the directors.
DIRECTORS INTERESTS IN NZME SHARESOrdinary shares held by directors and parties associated with them are as follows:
Director 31 December 2019
Peter Cullinane 68,286
Carol Campbell 50,000
David Gibson 50,000
Barbara Chapman 50,000
There were no individual directors’ share dealings entered in the Interests Register of the Company under section 148(2) of the Companies Act 1993 during the year ended 31 December 2019.
SHAREHOLDER INFORMATION
Substantial Shareholders
The following information is given pursuant to Sub-Part 5 of Part 5 of the Financial Markets Conduct Act 2013. According to notices given to the Company, the substantial product holders in the Company as at 31 December 2019 are noted below:
Shareholder Date of substantial product notice
Number of shares held % of shares held
Auscap Asset Management Limited 30/10/2018 37,722,980 19.25
Renaissance Smaller Companies Pty Limited 7/09/2018 24,298,829 12.40
Spheria Asset Management Pty Ltd 29/10/2019 20,158,249 10.28
Forager Funds Management Pty Limited 19/09/2017 12,408,486 6.33
The total number of ordinary shares issued by the Company as at 31 December 2019 was 196,555,998. The Company did not have any other quoted voting products.
ANNUAL REPORT 2019 41

Top 20 shareholdersAs at 20 February 2020
Number of shares held % of shares held
Citicorp Nominees Pty Limited 49,090,288 24.98
J P Morgan Nominees Australia Pty Limited 36,087,641 18.36
HSBC Custody Nominees (Australia) Limited 24,788,674 12.61
Citibank Nominees (Nz) Ltd 9,143,094 4.65
Accident Compensation Corporation 8,940,645 4.55
National Nominees Limited 8,301,984 4.22
Walling Pty Limited 7,000,000 3.56
Forsyth Barr Custodians Limited 3,309,558 1.68
Pax Pasha Pty Ltd 3,000,000 1.53
HSBC Nominees (New Zealand) Limited 1,156,817 0.59
Xu Li & Zhen Zhen 1,084,178 0.55
UBS Nominees Pty Ltd 1,049,420 0.53
Bnp Paribas Noms Pty Ltd 1,013,223 0.52
HSBC Custody Nominees (Australia) Limited Gsco Eca 971,029 0.49
Bnp Paribas Nominees Pty Ltd 940,756 0.48
Cs Third Nominees Pty Limited 899,506 0.46
Howard Cedric Zingel 832,470 0.42
Forsyth Barr Custodians Limited 711,000 0.36
Goolestan Dinshaw Katrak 700,000 0.36
Rudie Pty Ltd 698,427 0.36
Spread of Quoted Security HoldersAs at 20 February 2020
Range of Securities HeldNumber of
Investors% of Total Investors
Shares Held
% of Shares Issued
1-1000 3,516 64.09 904,426 0.46
1001-5000 1,072 19.54 2,589,151 1.32
5001-10000 316 5.76 2,428,654 1.24
10001-50000 431 7.86 10,053,349 5.11
50001-100000 72 1.31 5,148,205 2.62
Greater than 100000 79 1.44 175,432,213 89.25
Total 5,486 100.00 196,555,998 100.00
CORPORATE GOVERNANCE. CONT.
42 NEW ZEALAND MEDIA AND ENTERTAINMENT

OTHER INFORMATION
Waivers from the NZX
The Company transitioned to the new NZX Listing Rules dated 1 January 2019 on 1 June 2019, and relied on the class waivers and rulings granted by NZX Regulation on 19 November 2018 in relation to the transition.
The Company did not receive any other waivers from any of the NZX Listing Rules during the year.
Donations
In accordance with section 211(1)(h) of the Companies Act 1993, NZME notes that the Group made donations of $6,105 during the year ended 31 December 2019. In addition, the Group provided in excess of $2.8 million of donated media placement to a range of charities
Credit ratingAs at the date of this Annual Report, NZME did not have a credit rating.
Exercise of NZX disciplinary powers
For the year ended 31 December 2019, the NZX did not exercise any of its disciplinary powers under Rule 9.9.3 of the NZX Listing Rules in relation to the Company.
Direct director appointments under the Company Constitution
Rule 2.4.1 of the NZX Listing Rules allow a company to include in its Constitution a right for a product holder to appoint a director to the Board under certain circumstances. As at 31 December 2019, none of the Directors were appointed pursuant to Rule 2.4.1.
ANNUAL REPORT 2019 43

CONSOLIDATED FINANCIAL STATEMENTS.NZME LIMITED
For the year ended 31 December 2019
44 NEW ZEALAND MEDIA AND ENTERTAINMENT

ANNUAL REPORT 2019 45

Directors' Statement 47
Consolidated Income Statement 48
Consolidated Statement of Comprehensive Income 49
Consolidated Balance Sheet 50
Consolidated Statement of Changes in Equity 51
Consolidated Statement of Cash Flows 52
Notes to the Consolidated Financial Statements*
Basis of Preparation 53
Group Performance 54
Operating Assets & Liabilities 62
Capital Management 76
Taxation 87
Group Structure and Investments in Other Entities 90
Related Parties 94
Contingent Liabilities 95
Subsequent Events 95
Independent Auditor's Report 96
* In an attempt to make these financial statements easier to read, the notes to the financial statements have been grouped into nine sections; aimed at grouping items of a similar nature together. The Basis of Preparation section presents a summary of material information and general accounting policies that are necessary to understand the basis on which these consolidated financial statements have been prepared. Accounting policies specific to a particular note are included in that note and are boxed for ease of reference. Key judgments and estimates relevant to a particular note are also included in the relevant note, and are clearly marked as such. A summary of the key judgments and estimates is also included under the Basis of Preparation section on page 53.
CONTENTS.Consolidated Financial Statements for the year ended 31 December 2019
46 NEW ZEALAND MEDIA AND ENTERTAINMENT

DIRECTORS' STATEMENT.The directors are pleased to present the consolidated financial
statements of NZME Limited (the "Company") and its subsidiaries
(together the "Group") for the year ended 31 December 2019,
incorporating the consolidated financial statements and the
auditor's report.
The directors are responsible, on behalf of the Company, for
presenting these consolidated financial statements in accordance
with applicable New Zealand legislation and generally acceptable
accounting practices in New Zealand in order to present
consolidated financial statements that present fairly, in all material
respects, the financial position of the Group as at 31 December 2019
and the results of the Group's operations and cash flows for the year
then ended.
The consolidated financial statements for the Group as presented
on pages 48 to 95 are signed on behalf of the Board of Directors,
and are authorised for issue on the date below.
Peter Cullinane Carol Campbell Director Director
Date: 24 February 2020
For and on behalf of the Board of Directors
ANNUAL REPORT 2019 47

Note 2019 $’000
2018$’000
Revenue 2.1 371,079 388,269
Finance and other income 2.1 1,319 769
Total revenue and other income 2.1 372,398 389,038
Expenses from operations before finance costs, depreciation, amortisation 2.2.1 (315,829) (343,459)
Depreciation and amortisation 2.2.2 (31,672) (24,555)
Profit before interest, income tax and impairment of intangibles 24,897 21,024
Finance costs 2.2.3 (9,495) (4,636)
Impairment of intangible assets 2.4.2 (175,000) -
(Loss) / profit before income tax expense (159,598) 16,388
Income tax expense 5.1 (5,574) (4,816)
Net (loss) / profit after tax (165,172) 11,572
(Loss) / profit for the year is attributable to:
Owners of the Company (164,665) 11,735
Non-controlling interests (507) (163)
(165,172) 11,572
Cents Cents
Earnings per share attributable to the ordinary shareholders of the Company
Basic earnings per share 2.3 (83.77) 5.99
The above Consolidated Income Statement should be read in conjunction with the accompanying notes.
CONSOLIDATED INCOME STATEMENT.for the year ended 31 December 2019
48 NEW ZEALAND MEDIA AND ENTERTAINMENT

CONSOLIDATED STATEMENT OF COMPREHENSIVE INCOME.for the year ended 31 December 2019
Note 2019$’000
2018$’000
Net (loss) / profit after tax (165,172) 11,572
Other comprehensive income
Items that may be reclassified to profit or loss
Effective gain on hedging instruments 4.2 265 -
(Less): recycling of cash flow hedge reserve 4.2 (17) -
Tax impact of hedging transactions 4.2 (70) -
Net gain / (loss) on hedging instruments 178 -
Exchange differences on translation of foreign operations 4.2 12 32
Other comprehensive income, net of tax 190 32
Total comprehensive income (164,982) 11,604
Total comprehensive income attributable to:
Owners of the Company (164,475) 11,767
Non-controlling interests (507) (163)
(164,982) 11,604
The above Consolidated Statement of Comprehensive Income should be read in conjunction with the accompanying notes.
ANNUAL REPORT 2019 49

CONSOLIDATED BALANCE SHEET.
Note 2019 $’000
2018$’000
Current assets
Cash and cash equivalents 4.6 14,416 11,717
Trade and other receivables 3.5 52,449 57,125
Inventories 1,943 1,866
Income taxation - 898
Total current assets 68,808 71,606
Non-current assets
Intangible assets 3.1 150,263 329,911
Property, plant and equipment 3.2 39,902 47,145
Right-of-use assets 3.3 75,538 -
Capital work in progress 3.4 13,633 8,758
Other financial assets 6.2.2 4,123 5,357
Other receivables and prepayments 3.5 1,329 -
Derivative financial instruments 3.8 248 -
Total non-current assets 285,036 391,171
Total assets 353,844 462,777
Current liabilities
Trade and other payables 3.6 51,483 52,036
Current lease liabilities 3.3.3 11,076 -
Current tax provision 254 -
Total current liabilities 62,813 52,036
Non-current liabilities
Trade and other payables 3.6 - 13,665
Non-current lease liabilities 3.3.3 84,807 -
Interest bearing liabilities 4.5 89,149 109,992
Deferred tax liability 5.2 605 448
Total non-current liabilities 174,561 124,105
Total liabilities 237,374 176,141
Net assets 116,470 286,636
Equity
Share capital 4.1 360,768 360,363
Reserves 4.2 2,984 2,998
Retained earnings (247,712) (77,662)
Total Company interest 116,040 285,699
Non-controlling interests 430 937
Total equity 116,470 286,636
The above Consolidated Balance Sheet should be read in conjunction with the accompanying notes.
as at 31 December 2019
50 NEW ZEALAND MEDIA AND ENTERTAINMENT

CONSOLIDATED STATEMENT OF CHANGES IN EQUITY.
Attributable to owners of the company
NoteShare
capital $’000
Reserves $’000
Retained earnings
$’000Total
$’000
Non- controlling
interests $’000
Total Equity $’000
Balance at 1 January 2018 360,363 2,385 (73,716) 289,032 - 289,032
Profit for the year - - 11,735 11,735 (163) 11,572
Other comprehensive income - 32 - 32 - 32
Total comprehensive income - 32 11,735 11,767 (163) 11,604
Dividends paid - - (15,681) (15,681) - (15,681)
Supplementary dividends paid - - (1,864) (1,864) - (1,864)
Tax credit on supplementary dividends - - 1,864 1,864 - 1,864
Share based payments expense 4.2 - 581 - 581 - 581
Equity transactions with non-controlling interests
- - - - 1,100 1,100
Balance at 31 December 2018 360,363 2,998 (77,662) 285,699 937 286,636
Balance at 31 December 2018 360,363 2,998 (77,662) 285,699 937 286,636
Adoption of NZ IFRS 16 3.3.1 - - (5,931) (5,931) - (5,931)
Restated balance at 1 January 2019 360,363 2,998 (83,593) 279,768 937 280,705
Net loss after tax - - (164,665) (164,665) (507) (165,172)
Other comprehensive income - 190 - 190 - 190
Total comprehensive income - 190 (164,665) (164,475) (507) (164,982)
Deferred tax on share based payments - - 546 546 - 546
Share based payments expense 4.2 - 311 - 311 - 311
Settlement of 2016 TIP 405 (515) (110) - (110)
Balance at 31 December 2019 360,768 2,984 (247,712) 116,040 430 116,470
The above Consolidated Statement of Changes in Equity should be read in conjunction with the accompanying notes.
for the year ended 31 December 2019
ANNUAL REPORT 2019 51
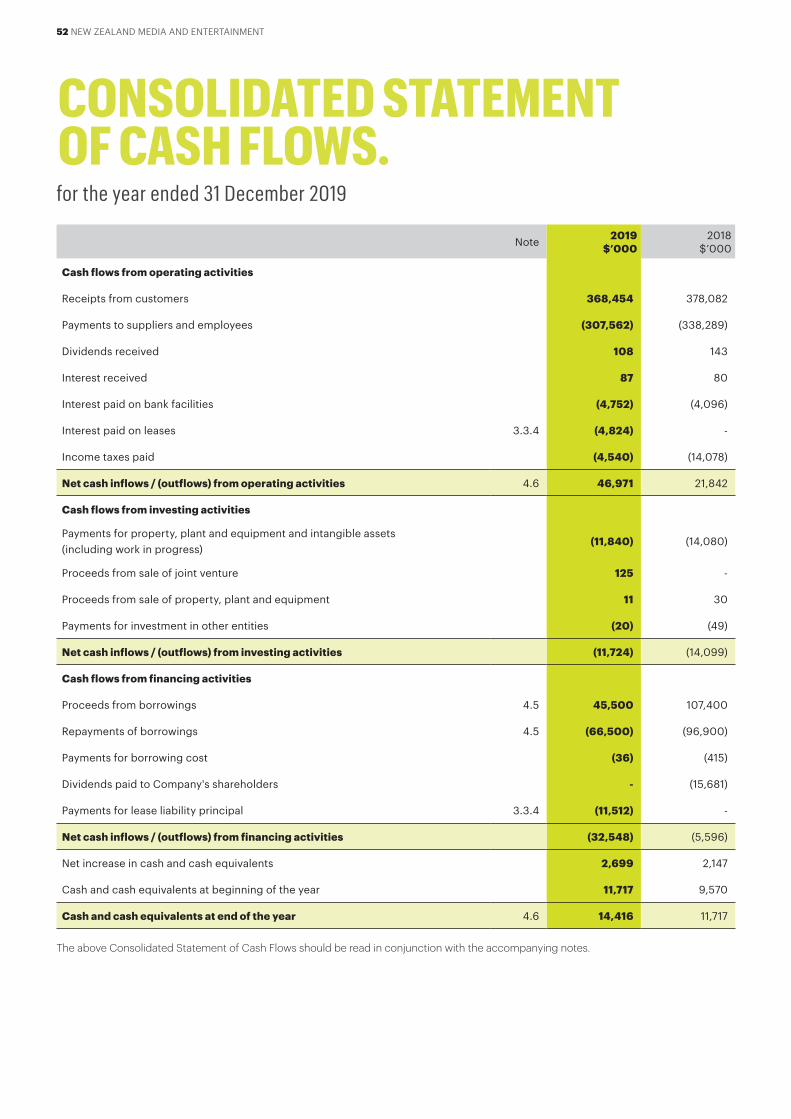
CONSOLIDATED STATEMENT OF CASH FLOWS.
Note 2019$’000
2018$’000
Cash flows from operating activities
Receipts from customers 368,454 378,082
Payments to suppliers and employees (307,562) (338,289)
Dividends received 108 143
Interest received 87 80
Interest paid on bank facilities (4,752) (4,096)
Interest paid on leases 3.3.4 (4,824) -
Income taxes paid (4,540) (14,078)
Net cash inflows / (outflows) from operating activities 4.6 46,971 21,842
Cash flows from investing activities
Payments for property, plant and equipment and intangible assets (including work in progress)
(11,840) (14,080)
Proceeds from sale of joint venture 125 -
Proceeds from sale of property, plant and equipment 11 30
Payments for investment in other entities (20) (49)
Net cash inflows / (outflows) from investing activities (11,724) (14,099)
Cash flows from financing activities
Proceeds from borrowings 4.5 45,500 107,400
Repayments of borrowings 4.5 (66,500) (96,900)
Payments for borrowing cost (36) (415)
Dividends paid to Company's shareholders - (15,681)
Payments for lease liability principal 3.3.4 (11,512) -
Net cash inflows / (outflows) from financing activities (32,548) (5,596)
Net increase in cash and cash equivalents 2,699 2,147
Cash and cash equivalents at beginning of the year 11,717 9,570
Cash and cash equivalents at end of the year 4.6 14,416 11,717
The above Consolidated Statement of Cash Flows should be read in conjunction with the accompanying notes.
for the year ended 31 December 2019
52 NEW ZEALAND MEDIA AND ENTERTAINMENT

NOTES TO THE CONSOLIDATED FINANCIAL STATEMENTS.1.0 BASIS OF PREPARATION1.1 REPORTING ENTITY AND STATUTORY BASENZME Limited (NZX and ASX:NZM) is a for-profit company limited by ordinary shares which are publicly traded on the NZX Main Board and the Australian Securities Exchange as a Foreign Exempt Listing. NZME Limited is incorporated and domiciled in New Zealand. It is registered under the Companies Act 1993 and is a FMC reporting entity under Part 7 of the Financial Markets Conduct Act 2013. The entity’s registered office is 2 Graham Street, Auckland, 1010, New Zealand.
NZME Limited (the "Company" or "Parent") and its subsidiaries' (together the "Group") principal activity during the financial year was the operation of an integrated media and entertainment business.
1.2 GENERAL ACCOUNTING POLICIESThese consolidated financial statements have been prepared in accordance with New Zealand Generally Accepted Accounting Practice ("NZ GAAP"). They comply with New Zealand equivalents to International Financial Reporting Standards ("NZ IFRS") and other applicable Financial Reporting Standards, as appropriate not for-profit entities. The consolidated financial statements also comply with International Financial Reporting Standards ("IFRS"). The consolidated financial statements have also been prepared in accordance with Part 7 of the Financial Markets Conduct Act 2013 and the NZX Listing Rules.
The principal accounting policies adopted in the preparation of the financial statements are either set out below, or in the relevant note. These policies have been consistently applied to all the years presented, unless otherwise stated. These consolidated financial statements are presented for the Group and were approved for issue by the Board of Directors on 24 February 2020.
1.2.1 Basis of measurementThese financial statements have been prepared under the historical cost convention with the exception of certain items for which specific accounting policies are identified.
1.2.2 ComparativesCertain prior period information has been re-presented to ensure consistency with current year disclosures and to provide more meaningful comparison.
1.2.3 Foreign currency translationFunctional and presentation currency
Items included in the financial statements of each of the Group's entities are measured using the currency of the primary economic environment in which the entity operates (functional currency).
The consolidated financial statements are presented in New Zealand dollars, which is the Company's functional and the Group's presentation currency, and rounded to the nearest thousand, except where otherwise stated.
1.2.4 Goods and Services Tax ('GST')The income statement has been prepared so that all components are stated exclusive of GST. All items in the balance sheet are stated net of GST, with the exception of receivables and payables, which include GST invoiced. In the statement of cash flows, receipts from customers and payments to suppliers are shown exclusive of GST.
1.3 SIGNIFICANT ACCOUNTING ESTIMATES AND JUDGEMENTSThe preparation of the consolidated financial statements requires the use of certain significant judgements, accounting estimates and assumptions, including judgements, estimates and assumptions concerning the future. The estimates and assumptions are based on historical experiences and other factors that are considered to be relevant. The resulting accounting estimates will by definition, seldom equal the related actual results and are reviewed on an ongoing basis. A list of those areas of significant estimation or judgement and a reference to the notes containing further information is provided below:
Areas of significant accounting estimates or judgements Note
Determination of the number of reportable segments 2.4.1
Intangible assets with indefinite useful lives 3.1
Assumptions used in testing for impairment 3.1.1 of indefinite life intangible assets
Right-of-use assets 3.3
1.4 NEW STANDARDS AND INTERPRETATIONS ADOPTED IN THE CURRENT PERIODNZ IFRS 16: Leases was adopted on 1 January 2019. The new standard requires a lessee to recognise a lease liability that reflects future lease payments and a ‘right-of-use' asset for virtually all lease contracts. Interest and depreciation charges on the lease liability and right-of-use assets replace the operating expenses that were incurred under NZ IAS 17. Note 3.3.1 provides further information on the impact on the Group of adopting NZ IFRS 16.
There have been no other changes to accounting policies and no other new standards adopted during the period.
ANNUAL REPORT 2019 53

NOTES TO THE CONSOLIDATED FINANCIAL STATEMENTS.CONT.
2.0 GROUP PERFORMANCE2.1 DISAGGREGATION OF REVENUE AND OTHER INCOME
Print $’000
Radio $’000
Digital & e-Commerce
$’000Total
$’000
For the year ended 31 December 2019
Advertising 102,163 110,111 55,796 268,070
Circulation and subscription 76,322 - 1,667 77,989
External printing and distribution 7,616 - - 7,616
Other 6,281 759 2,966 10,006
Segment revenue from integrated media and entertainment activities
192,382 110,870 60,429 363,681
Shared services centre 3,377
Events 4,021
Total revenues from external customers 371,079
Dividends 108
Rental income from sub-leases 475
Gain on disposal of property, plant and equipment 11
Gain on change in scope of lease 638
Other income 1,232
Finance income 87
Total finance and other income 1,319
Total revenue and other income 372,398
54 NEW ZEALAND MEDIA AND ENTERTAINMENT
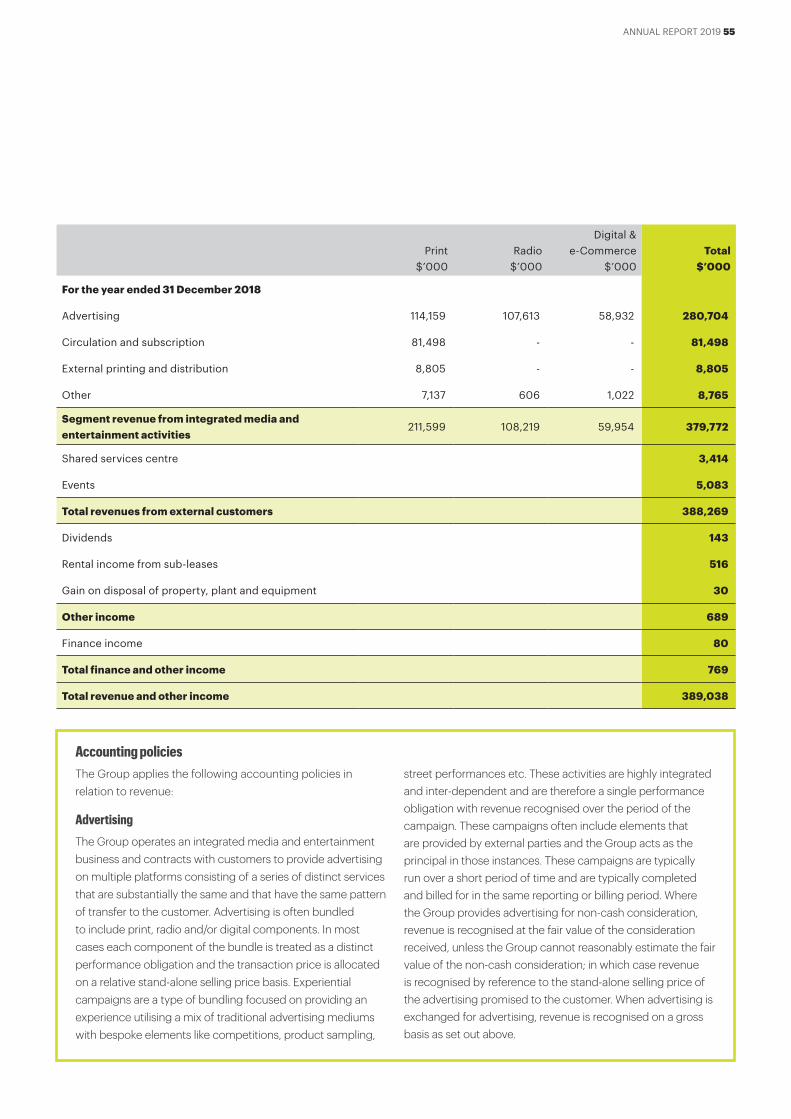
Print $’000
Radio $’000
Digital & e-Commerce
$’000Total
$’000
For the year ended 31 December 2018
Advertising 114,159 107,613 58,932 280,704
Circulation and subscription 81,498 - - 81,498
External printing and distribution 8,805 - - 8,805
Other 7,137 606 1,022 8,765
Segment revenue from integrated media and entertainment activities
211,599 108,219 59,954 379,772
Shared services centre 3,414
Events 5,083
Total revenues from external customers 388,269
Dividends 143
Rental income from sub-leases 516
Gain on disposal of property, plant and equipment 30
Other income 689
Finance income 80
Total finance and other income 769
Total revenue and other income 389,038
Accounting policiesThe Group applies the following accounting policies in relation to revenue:
AdvertisingThe Group operates an integrated media and entertainment business and contracts with customers to provide advertising on multiple platforms consisting of a series of distinct services that are substantially the same and that have the same pattern of transfer to the customer. Advertising is often bundled to include print, radio and/or digital components. In most cases each component of the bundle is treated as a distinct performance obligation and the transaction price is allocated on a relative stand-alone selling price basis. Experiential campaigns are a type of bundling focused on providing an experience utilising a mix of traditional advertising mediums with bespoke elements like competitions, product sampling,
street performances etc. These activities are highly integrated and inter-dependent and are therefore a single performance obligation with revenue recognised over the period of the campaign. These campaigns often include elements that are provided by external parties and the Group acts as the principal in those instances. These campaigns are typically run over a short period of time and are typically completed and billed for in the same reporting or billing period. Where the Group provides advertising for non-cash consideration, revenue is recognised at the fair value of the consideration received, unless the Group cannot reasonably estimate the fair value of the non-cash consideration; in which case revenue is recognised by reference to the stand-alone selling price of the advertising promised to the customer. When advertising is exchanged for advertising, revenue is recognised on a gross basis as set out above.
ANNUAL REPORT 2019 55

SubscriptionsThe Group enters into contracts with customers to deliver a specified publication on specified days. The performance obligation is satisfied, and revenue is recognised, when the publication is delivered.
CirculationThe Group enters into contracts with customers to deliver specified publications on specified days which the customer will on-sell to the public. The performance obligation is satisfied when the publication is delivered. Certain customers have a right to return any unsold publications which is treated as variable consideration. Customers are required to report unsold publications using an online system on a weekly basis. The Group therefore includes in the transaction price an estimate of the unsold publications using the most likely amount method based on the weekly reporting from customers to the extent that it is highly probable that a significant reversal in the amount of cumulative revenue recognised will not occur when the uncertainty associated with the variable consideration is subsequently resolved.
External printing and distributionThe Group enters into contracts with customers to print their publications and, in certain cases, distribute those publications on their behalf; including maintaining a distribution network. The printing, delivery and maintenance of a distribution network are distinct performance obligations. The performance obligation to print a publication is satisfied when those publications are printed. Similarly, the performance obligation to deliver a publication is satisfied when it is delivered. The performance obligation to maintain a distribution network is a service that is largely the same on a monthly basis and is satisfied, and revenue recognised, in equal increments over the billing period.
e-Commerce (GrabOne)The Group acts as an agent for merchants selling their products or services to the public using the GrabOne platform. The Group does not control the product or service before it is transferred to the purchaser. Revenue is recognised in the amount of any fees or commissions the Group expects to be entitled to in exchange for arranging for the product or service to be promoted on the GrabOne platform.
Shared services centreThe Group provides back-office support services to customers. These services consist of a number of functions
that are largely consistent on a month-to-month basis. Revenue is therefore recognised in equal increments over the billing period.
Deferred revenueWhen a customer pays for goods or services in advance, the Group recognises a deferred revenue liability which is reduced, and revenue recognised, as the Group satisfies each distinct performance obligation.
Significant financing componentThe Group does not expect, at contract inception, that the period between transferring the promised goods or services from contracts with customers and when the customer pays for those goods and services to be more than one year. The Group applies the practical expedient in NZ IFRS 15 to not adjust the promised amount of consideration it expects to receive for those goods or services for the effects of a significant financing component.
Incremental cost of obtaining a contractThe Group applies the practical expedient in NZ IFRS 15 to recognise the incremental cost of obtaining a contract (such as commission) when incurred if the amortisation period is one year or less. If material, the Group will recognise an asset for any incremental cost of obtaining a contract with a customer if the Group expects to recover those costs and the amortisation period is expected to be more than one year. Those costs will be amortised on a systematic basis that is consistent with the transfer of the good or service to which the asset relates.
Costs to fulfil a contractIf the costs incurred in fulfilling a contract with a customer are material and not within the scope of another standard, the Group recognises an asset from the costs incurred if all of the following criteria are met:
• The costs relate directly to the contract;
• The costs generate or enhance resources that the Group will use to satisfy the performance obligations in that contract; and
• The costs are expected to be recovered.
Those costs will be amortised on a systematic basis that is consistent with the transfer of the goods or services promised in that contract. Given the nature of the Group’s activities, this is expected to be rare.
NOTES TO THE CONSOLIDATED FINANCIAL STATEMENTS.CONT.
56 NEW ZEALAND MEDIA AND ENTERTAINMENT

2.2 EXPENSES
2019$’000
2018$’000
2.2.1 Expenses from operations before finance costs, depreciation, amortisation
Employee benefits expense 150,342 154,509
Production and distribution expense 67,313 72,997
Selling and marketing expense 50,690 52,728
Rental and occupancy expense 6,720 22,023
Costs in relation to one-off projects 2,729 1,632
Redundancies and associated costs 6,043 5,289
Loss on sale of joint venture 210 -
Asset write-downs and business closures - 89
Impairment of financial asset 869 2,249
Repairs and maintenance costs 7,550 7,541
Travel and entertainment costs 3,272 4,007
Other 20,091 20,395
Total expenses from operations before finance costs, depreciation, amortisation 315,829 343,459
2.2.2 Depreciation & amortisation
Depreciation on owned assets 8,853 14,664
Depreciation on right-of-use assets 12,817 -
Amortisation 10,002 9,891
Total depreciation and amortisation 31,672 24,555
2.2.3 Finance costs
Interest and finance charges – other entities 9,320 4,517
Interest income on interest rate swaps (17) -
Borrowing cost amortisation 192 119
Total finance costs 9,495 4,636
ANNUAL REPORT 2019 57
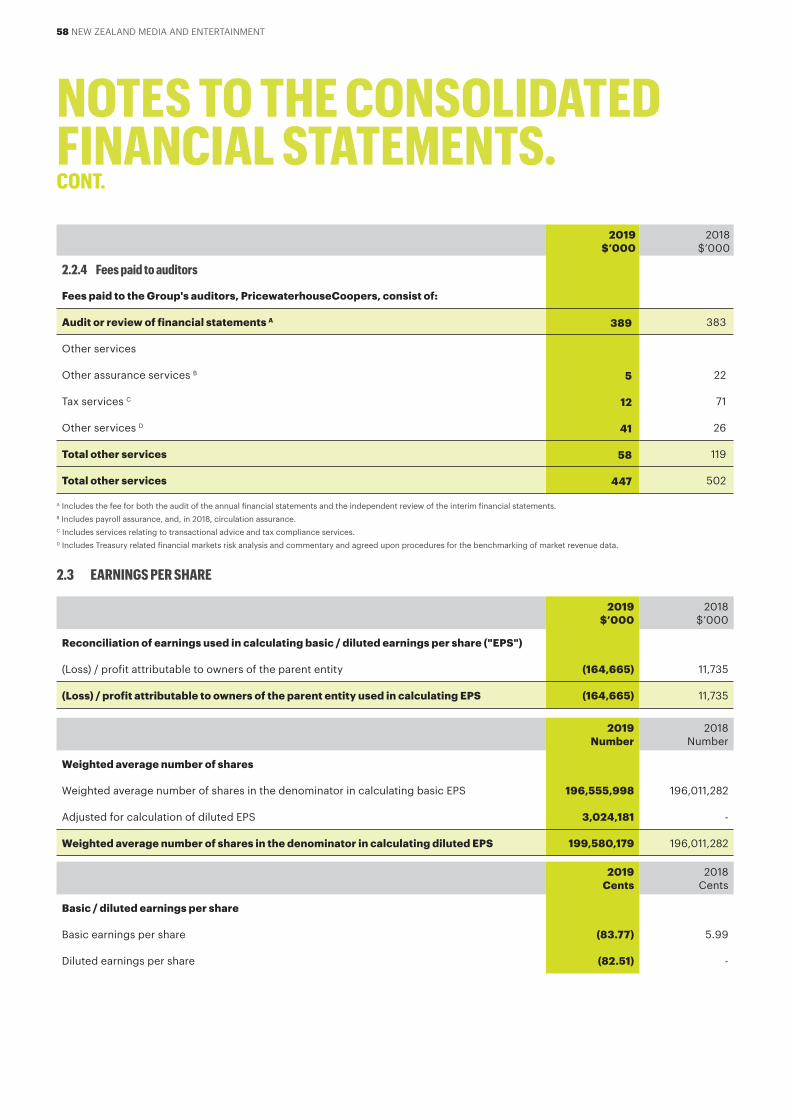
2019$’000
2018$’000
2.2.4 Fees paid to auditors
Fees paid to the Group's auditors, PricewaterhouseCoopers, consist of:
Audit or review of financial statements A 389 383
Other services
Other assurance services B 5 22
Tax services C 12 71
Other services D 41 26
Total other services 58 119
Total other services 447 502
A Includes the fee for both the audit of the annual financial statements and the independent review of the interim financial statements.B Includes payroll assurance, and, in 2018, circulation assurance.C Includes services relating to transactional advice and tax compliance services.D Includes Treasury related financial markets risk analysis and commentary and agreed upon procedures for the benchmarking of market revenue data.
2.3 EARNINGS PER SHARE
2019$’000
2018$’000
Reconciliation of earnings used in calculating basic / diluted earnings per share ("EPS")
(Loss) / profit attributable to owners of the parent entity (164,665) 11,735
(Loss) / profit attributable to owners of the parent entity used in calculating EPS (164,665) 11,735
2019Number
2018Number
Weighted average number of shares
Weighted average number of shares in the denominator in calculating basic EPS 196,555,998 196,011,282
Adjusted for calculation of diluted EPS 3,024,181 -
Weighted average number of shares in the denominator in calculating diluted EPS 199,580,179 196,011,282
2019Cents
2018Cents
Basic / diluted earnings per share
Basic earnings per share (83.77) 5.99
Diluted earnings per share (82.51) -
NOTES TO THE CONSOLIDATED FINANCIAL STATEMENTS.CONT.
58 NEW ZEALAND MEDIA AND ENTERTAINMENT

Accounting policies Basic earnings per shareBasic earnings per share is determined by dividing:
• the profit or loss attributable to owners of the Company; by
• the weighted average number of ordinary shares outstanding during the financial year, adjusted for bonus elements in ordinary shares issued during the financial year.
Diluted earnings per shareDiluted earnings per share adjusts the figures used in the determination of basic earnings per share by taking into account:
• the after-tax effect of dividends, interest and other changes in income or expense associated with dilutive potential ordinary shares; and
• the weighted average number of additional ordinary shares that would have been outstanding assuming the conversion of all dilutive potential ordinary shares.
2.4 SEGMENT INFORMATION
2.4.1 Determination and description of segments
Significant judgements: The Group has one reportable segment – being “Integrated Media and Entertainment”. All significant operating decisions are based upon analysis of NZME as one operating segment. The Executive Team and the Board of Directors have been identified as the Chief Operating Decision Maker. The Group’s major products and services are split by channel only at the revenue level into Print, Radio and Digital & e-Commerce which is the way in which revenue is reported to the Chief Operating Decision Maker. Although the Group operates in many different markets within New Zealand, for management reporting purposes the Group operates in one principle geographical area being New Zealand as a whole.
Integrated Media and Entertainment incorporates the sale of advertising, goods and services generated from the audiences attached to the Group's media platforms.
ANNUAL REPORT 2019 59

2.4.2 Segment revenues and resultsThe segment information provided to the Directors and Executive Team for the year ended 31 December 2019 is as follows:
2019$’000
2018$’000
Revenues from external customers by channel
Print 192,382 211,599
Radio 110,870 108,219
Digital and e-Commerce 60,429 59,954
Segment revenue from integrated media and entertainment activities 363,681 379,772
Revenue from shared services centre 3,377 3,414
Events 4,021 5,083
Total revenues from external customers 371,079 388,269
Dividend income 108 143
Rental income from sub-leasesA 475 516
Gain on disposal of property, plant and equipment 11 -
Expenses from operations before finance costs, depreciation, amortisation and exceptional items
(305,978) (334,200)
Total segment adjusted EBITDAB 65,695 54,728
Depreciation and amortisation on owned assets (18,855) (24,555)
Depreciation on right-of-use assets (12,817) -
Total depreciation and amortisation (31,672) (24,555)
Interest income 87 80
Finance cost (9,495) (4,636)
Gain on change in scope of Ellerslie Lease 638 -
Exceptional items
Loss on sale of joint ventureC (210) -
Loss on disposal of propertiesD - (59)
Redundancies and associated costsE (6,043) (5,289)
Costs in relation to one off projectsF (2,729) (1,632)
Impairment of financial assetsG (869) (2,249)
Impairment of intangible assetsH (175,000) -
Net (loss) / profit before tax (159,598) 16,388
NOTES TO THE CONSOLIDATED FINANCIAL STATEMENTS.CONT.
60 NEW ZEALAND MEDIA AND ENTERTAINMENT

A Rental income of $283,937 was received from the sub lease of right-of-use assets.B Adjusted Earnings before Interest, Tax, Depreciation and Amortisation (Adjusted EBITDA) from continuing operations which excludes exceptional items, is a non-GAAP measure that
represents the Group’s total segment result which is regularly monitored by the Chief Operating Decision Maker. Exceptional items are those gains, losses, income and expense items that are not directly related to the primary business activities of the Group which are determined in accordance with the NZME Exceptional Items Recognition Framework adopted by the Audit & Risk Committee. Exceptional items include redundancies, impairment, one-off projects and the disposal of properties or businesses. These items are excluded from the segment result that is regularly reviewed by the Chief Operating Decision Maker.
C Loss on disposal of the Group's interest in the Chinese New Zealand Herald Limited.D Loss on disposal of properties is the final adjustment on Greymouth land in 2018.E The redundancies and associated costs relate to the restructuring and integration of the New Zealand operations.F 2019 costs are primarily in relation to the ongoing work in connection with acquiring Stuff Limited, the disposal of the Group's investment in Ratebroker Limited and historical
holiday pay adjustments. 2018 costs relate to the provision for historical holiday pay adjustments, residual costs in relation to the Stuff Ltd merger appeal and one off project costs.G 2019 cost relates to the impairment of KPEX Limited and the loan to Jugl Limited while the 2018 cost is in relation to the investment in Ratebroker Limited.H Cost relates to the impairment of the indefinite life intangible assets. (See note 3.1.1) .
As the Group has one operating segment, the assets and liabilities as reported on the consolidated balance sheet are also the segment assets and liabilities, and the income tax expense in the consolidated income statement is also the segment income tax.
2.4.3 Impact of NZ IFRS 16 on the segment results and earnings per share
The following table shows the adjustments to profit or loss for the period as a result of the adoption of NZ IFRS 16:
Pre NZ IFRS 16$’000
Adjustment$’000
NZ IFRS 16$’000
For the year ended 31 December 2019
Total revenue and other income excluding interest income and gain on lease.
371,673 - 371,673
Segment expenses (321,048) 15,070 (305,978)
Total segment adjusted EBITDA 50,625 15,070 65,695
Depreciation and amortisation (18,855) (12,817) (31,672)
Finance costs (4,671) (4,824) (9,495)
Interest income 87 - 87
Gain on change in scope of Ellerslie Lease - 638 638
Exceptional items (184,851) - (184,851)
Loss before income tax expense (157,665) (1,933) (159,598)
Tax expense (5,807) 233 (5,574)
Net loss after tax (163,472) (1,700) (165,172)
(Less): non-controlling interests (507) - (507)
Attributable to the owners of the Company (162,965) (1,700) (164,665)
Cents Cents Cents
Earnings per share attributable to the ordinary shareholders of the Company
Basic earnings per share (82.91) (0.86) (83.77)
Diluted earnings per share (81.66) (0.85) (82.51)
ANNUAL REPORT 2019 61

3.0 OPERATING ASSETS & LIABILITIES3.1 INTANGIBLE ASSETS
Significant judgement: The Directors have determined that masthead brands and brands have indefinite lives and are therefore not amortised. Refer to the accounting policies below for further information.
Goodwill $’000
Software $’000
Masthead Brands $’000
Radio Licences
$’000Brands $’000
Total$’000
As at 1 January 2018
Cost 166,397 59,384 146,976 77,547 59,079 509,383
Accumulated amortisation and impairment
(95,614) (44,874) - (38,342) - (178,830)
Net book value 70,783 14,510 146,976 39,205 59,079 330,553
For the year ended 31 December 2018
Opening net book amount 70,783 14,510 146,976 39,205 59,079 330,553
Additions - 2,103 - - - 2,103
Amortisation - (6,935) - (2,956) - (9,891)
Transfers from capitalised work in progress
- 7,146 - - - 7,146
Net book value 70,783 16,824 146,976 36,249 59,079 329,911
As at 31 December 2018
Cost 166,397 68,633 146,976 77,547 59,079 518,632
Accumulated amortisation and impairment (95,614) (51,809) - (41,298) - (188,721)
Net book value 70,783 16,824 146,976 36,249 59,079 329,911
NOTES TO THE CONSOLIDATED FINANCIAL STATEMENTS.CONT.
62 NEW ZEALAND MEDIA AND ENTERTAINMENT

Accounting policies GoodwillGoodwill represents the excess of the cost of an acquisition over the fair value of the Group’s share of the net identifiable assets of the acquired business at the date of the acquisition. Goodwill is not amortised but rather is subject to periodic impairment testing (refer to note 3.1.1 on page 64).
SoftwareCosts incurred in developing systems, acquiring software and licences are capitalised to software. Costs capitalised include materials, services, payroll and payroll related costs of employees involved in development. Amortisation is calculated on a straight line basis over the useful life of the asset (typically 3 to 10 years).
Radio LicencesCommercial radio licences are accounted for as identifiable assets and are initially recognised at cost. The current New Zealand radio licences expire on 31 March 2031 and are being amortised on a straight line basis to that date.
Masthead BrandsMasthead brands, being the titles, logo's and similar items of the integrated media assets of the Group are accounted for as identifiable assets and are initially recognised at cost. The Directors believe the masthead brands have indefinite lives as there is no foreseeable limit over which they are expected to generate net cash inflows for the Group. Accordingly, masthead brands are not amortised but are tested for impairment each year (refer to note 3.1.1 on page 64).
BrandsBrands are accounted for as identifiable assets and are initially recognised at cost. The Directors have considered the geographic location, legal, technical and other commercial factors likely to impact the assets’ useful lives and consider that they have indefinite lives. Accordingly, Brands are not amortised but are tested for impairment each year (refer to note 3.1.1 on page 64).
Goodwill $’000
Software $’000
Masthead Brands $’000
Radio Licences
$’000Brands $’000
Total$’000
As at 1 January 2019
Cost 166,397 68,633 146,976 77,547 59,079 518,632
Accumulated amortisation and impairment (95,614) (51,809) - (41,298) - (188,721)
Net book value 70,783 16,824 146,976 36,249 59,079 329,911
For the year ended 31 December 2019
Opening net book amount 70,783 16,824 146,976 36,249 59,079 329,911
Additions - 344 - - - 344
Amortisation - (7,042) - (2,960) - (10,002)
Impairment (70,783) - (74,336) - (29,881) (175,000)
Transfers from capitalised work in progress - 5,010 - - - 5,010
Net book value - 15,136 72,640 33,289 29,198 150,263
As at 31 December 2019
Cost 166,397 73,987 146,976 77,547 59,079 523,986
Accumulated amortisation and impairment (166,397) (58,851) (74,336) (44,258) (29,881) (373,723)
Net book value - 15,136 72,640 33,289 29,198 150,263
ANNUAL REPORT 2019 63

3.1.1 Year-end impairment review
Significant judgement: As disclosed in note 2.4 the Directors have determined that the Group has one reportable segment – being “Integrated Media and Entertainment”. The Directors have also determined that this is the only cash generating unit ("CGU") for impairment testing because this is the lowest level for which there are separately identifiable cash inflows which are largely independent of the cash inflows from other assets or groups of assets. Accordingly all goodwill and intangibles with indefinite useful lives are allocated to one CGU. This note also includes details of certain key estimates and assumptions made during the impairment testing process.
A comprehensive impairment review was conducted at 31 December 2019. The recoverable amount of the CGU (which includes goodwill and indefinite life intangible assets) is determined based on the higher of fair value less costs to sell and value in use calculations using management budgets and forecasts. The recoverable amount of the CGU is compared against the carrying value of the CGU to determine whether there has been impairment.
Key estimates and assumptions
Discount Rate
The post tax discount rate used in the fair value assessment was 9.5% (2018: 9.5%).
Terminal Value
For the purpose of calculating the terminal value within the fair value assessment an "exit multiple method" has been used with a 4.5 times EBITDA multiple applied. Using this methodology equates to a terminal growth rate assumption of -1.2% (2018 0%).
Forecasts prepared over the forecast period (2020 - 2024)
The forecasts used in impairment testing have been prepared by management for that specific purpose. Actual results may differ materially from those forecast or implied. The forecasts are not, and should not be read as, a forecast of, or guidance as to, the future financial performance and earnings of the Group.
Revenue forecasts are prepared based on management’s current expectations, with consideration given to internal information and relevant external industry data and analysis. The key forecast assumptions used were:
Key Assumptions Reasonably Possible Changes
Upside Downside
CAGRA
Movement change in CAGRA %
Impact on value
recoverable amount
$'m
Movement change in CAGRA %
Impact on value
recoverable amount
$'m
Print revenue -6.5% +1% 30 -1% (28)
Radio revenue 1.1% +3% 96 -1% (30)
Digital advertising revenue 1.3% +3% 35 -2% (22)
Digital Classifieds revenue 28.6% +5% 15 -5% (13)
Digital Subscriptions revenue 45.2% +5% 12 -5% (11)
Operating expenses -1.4% -0.2% 26 +0.2% (26)
A CAGR = compound annual growth rate. Impacts in the table above assume that each of the changes is in isolation and that all other factors are consistent.
NOTES TO THE CONSOLIDATED FINANCIAL STATEMENTS.CONT.
64 NEW ZEALAND MEDIA AND ENTERTAINMENT

Based on the above assumptions an impairment of intangible assets of $175 million has been recognised in the income statement. The impairment has been allocated to reduce goodwill by $70.8 million, masthead brands by $74.3 million and brands by $29.9 million. The impairment review has resulted from a set of assumptions which are more conservative than the company's medium term plans but recognises that the difference between the Company's total market capitalisation and the carrying value of net assets has increased beyond a reasonable level.
The forecasts used in impairment testing require assumptions and judgements about the future, such as discount rates, long term growth rates, forecasted revenues, to which the model is sensitive and which are inherently uncertain.
The table on page 64 shows the key assumptions. For each key assumption management, has identified reasonably possible changes, based on expected ranges which would significantly impact the recoverable amount. In addition, if a terminal growth rate of 0% was used, the recoverable amount would be around $15 million higher. If a discount rate of 10% was used, the recoverable amount would be around $9 million lower.
The impairment in 2019 has been identified using the recoverable amount determined by management's value in use model, as this was higher than the fair value less costs of disposal. Following the current year impairment of intangible assets the recoverable amount of the CGU is equal to its carrying amount.
The Group compares the carrying amount of net assets with the market capitalisation value at each balance date. The share price at 31 December 2019 was $0.41 equating to a market capitalisation of $80.6 million. This market value excludes any control premium and may not reflect the value of 100% of NZME’s net assets. The carrying amount of NZME’s net assets at 31 December 2019 was $116.5 million ($0.59 per share) (post impairment of intangible assets recognised of $175 million). Management considered the reasons for this difference and whether all relevant factors had been allowed for in their value in use model.
Accounting policyGoodwill and intangible assets that have an indefinite useful life are not subject to amortisation and are tested annually for impairment and at the end of each reporting period if there is an indication that they may be impaired. Intangible assets that are subject to amortisation are tested for impairment whenever events or changes in circumstances indicate that the carrying amount may exceed its recoverable amount. An impairment charge is recognised for the amount by which the asset’s carrying amount exceeds its recoverable amount. The recoverable amount is the higher of an asset’s
fair value less costs to sell and value in use. For the purposes of assessing impairment, assets are grouped at the lowest levels for which there are separately identifiable cash inflows which are largely independent of the cash inflows from other assets or groups of assets (cash-generating units). Currently, the group has only one CGU, being Integrated Media and Entertainment. Non-financial intangible assets, other than goodwill, that suffer impairment are reviewed for possible reversal of the impairment at each reporting date.
ANNUAL REPORT 2019 65

3.2 PROPERTY, PLANT AND EQUIPMENT
Freehold landA
$’000BuildingsA
$’000
Plant and equipmentB
$’000Total
$’000
As at 1 January 2018
Cost or fair value 1,165 14,764 330,021 345,950
Accumulated depreciation and impairment - (4,485) (285,434) (289,919)
Net book amount 1,165 10,279 44,587 56,031
Year ended 31 December 2018
Opening net book amount 1,165 10,279 44,587 56,031
Additions - 23 626 649
Disposals - (89) - (89)
Depreciation - (1,780) (12,884) (14,664)
Transfers from capitalised work in progress - 10 5,208 5,218
Net book amount 1,165 8,443 37,537 47,145
As at 31 December 2018
Cost or fair value 1,165 14,697 335,602 351,464
Accumulated depreciation and impairment - (6,254) (298,065) (304,319)
Net book amount 1,165 8,443 37,537 47,145
Year ended 31 December 2019
Opening net book amount 1,165 8,443 37,537 47,145
Additions - - 457 457
Disposals - - (1) (1)
Depreciation - (1,224) (7,629) (8,853)
Transfers from capitalised work in progress - - 1,154 1,154
Net book amount 1,165 7,219 31,518 39,902
As at 31 December 2019
Cost or fair value 1,165 14,697 337,165 353,027
Accumulated depreciation and impairment - (7,478) (305,647) (313,125)
Net book amount 1,165 7,219 31,518 39,902
A Freehold land and buildings include leasehold improvements with a net book value of $7,104,280 (2018: $8,311,993) carried at cost. All other freehold land and buildings are held at fair value based on independent valuations. If land and buildings were stated on the historical cost basis, the net book value of land would have been $442,270 (2018: $442,270) and the net book value of buildings would have been $317,103 (2018: $327,038). The last revaluation was performed for the year ended 31 December 2015.
B A review of the useful life of Ellerslie Print Plant assets has resulted in the extension of some assets lives to 2023 with the depreciation charge for the year $3.2 million lower than it would have been had the extension not occurred.
NOTES TO THE CONSOLIDATED FINANCIAL STATEMENTS.CONT.
66 NEW ZEALAND MEDIA AND ENTERTAINMENT

Accounting policiesLand is not depreciated. Depreciation on other assets is calculated using the straight line method to allocate their cost or revalued amounts, net of their residual values, over their estimated useful lives, as follows:
• Furniture and fittings • 3 to 25 years
• Buildings • 10 to 50 years
• Leasehold improvements • 2.5 to 50 years
• Motor vehicles • 5 to 10 years
• Plant & equipment • 1.5 to 25 years
The assets’ residual values and useful lives are reviewed and adjusted, if appropriate, at each balance sheet date. Gains and losses on disposals are determined by comparing proceeds with carrying amount and are included in the income statement.
Land and buildings (excluding leasehold improvements) are recorded at fair value, based on periodic valuations by external independent valuers, less subsequent depreciation for buildings. Independent valuations are performed with sufficient regularity to ensure that the carrying value of assets is materially consistent with their fair value. Any accumulated depreciation at the date of revaluation is eliminated against the gross carrying amount of the asset and the net amount is restated to the revalued amount of the asset. Increases in the carrying amounts arising on revaluation of land and buildings are credited to revaluation reserves in equity. To the extent that the increase reverses a decrease previously recognised
in the income statement, the increase is first recognised in the income statement. Decreases that reverse previous increases of the same asset are first charged against the revaluation reserves directly in equity to the extent of the remaining reserve attributable to the asset. All other decreases are charged to the income statement.
Plant and equipment, furniture and fittings and motor vehicles are stated at historical cost less depreciation. Historical cost includes expenditure that is directly attributable to the acquisition of the items. Subsequent costs are included in the assets carrying amount or recognised as a separate asset, as appropriate, only when it is probable that future economic benefits associated with the item will flow to the Group and the cost of the item can be reliably measured. All other repairs and maintenance are charged to the income statement during the financial period in which they are incurred.
Impairment of assets
An asset’s carrying amount is written down immediately to its recoverable amount if the asset’s carrying amount is greater than its estimated recoverable amount. Assets that are subject to depreciation are tested for impairment whenever changes in circumstances indicate that the asset’s carrying amount may exceed its recoverable amount. An impairment charge is recognised for the amount by which the asset’s carrying amount exceeds its recoverable amount. Assets that suffer an impairment are reviewed for possible reversal of the impairment at each reporting date.
3.3 RIGHT-OF-USE ASSETS
Significant judgments: The Group has elected to use the Modified Retrospective Approach in adopting NZ IFRS 16 and has further decided to recognise the right-of-use assets in relation to the Graham Street and Ellerslie Print Plant leases as if the standard had been applied from the commencement date of these leases using the Group's incremental borrowing rate and recognising an equity adjustment. For all other leases the right-of-use asset recognised on adoption is equal to the lease liability calculated on 1 January 2019. The Group has also elected not to reassess whether a contract is, or contains a lease, at the date of initial application. Instead, for contracts entered into before the transition date the Group relied upon its assessment made applying NZ IAS 17 and NZ IFRIC 4. The Group has used the practical expedient of applying a single discount rate to a portfolio of assets and has further applied the same incremental borrowing rate of 5% to each portfolio of assets. In determining the discount rate to use, Management reviewed publicly available rates for Government Bonds, Westpac swap rates and Treasury Risk-free discount rates and then applied an adjustment to these rates to apply a company specific credit risk. The Group has also used the practical expedient of relying on previous assessments of whether leases are onerous.
ANNUAL REPORT 2019 67
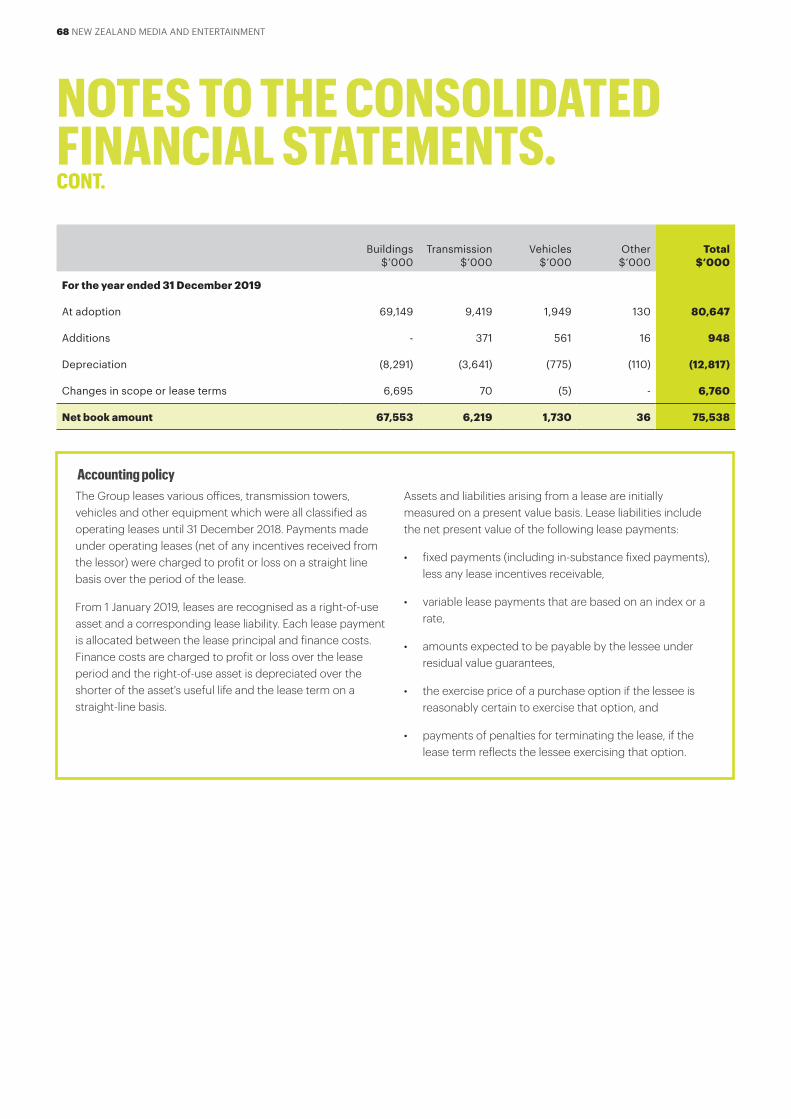
Buildings$’000
Transmission$’000
Vehicles$’000
Other$’000
Total$’000
For the year ended 31 December 2019
At adoption 69,149 9,419 1,949 130 80,647
Additions - 371 561 16 948
Depreciation (8,291) (3,641) (775) (110) (12,817)
Changes in scope or lease terms 6,695 70 (5) - 6,760
Net book amount 67,553 6,219 1,730 36 75,538
Accounting policyThe Group leases various offices, transmission towers, vehicles and other equipment which were all classified as operating leases until 31 December 2018. Payments made under operating leases (net of any incentives received from the lessor) were charged to profit or loss on a straight line basis over the period of the lease.
From 1 January 2019, leases are recognised as a right-of-use asset and a corresponding lease liability. Each lease payment is allocated between the lease principal and finance costs. Finance costs are charged to profit or loss over the lease period and the right-of-use asset is depreciated over the shorter of the asset's useful life and the lease term on a straight-line basis.
Assets and liabilities arising from a lease are initially measured on a present value basis. Lease liabilities include the net present value of the following lease payments:
• fixed payments (including in-substance fixed payments), less any lease incentives receivable,
• variable lease payments that are based on an index or a rate,
• amounts expected to be payable by the lessee under residual value guarantees,
• the exercise price of a purchase option if the lessee is reasonably certain to exercise that option, and
• payments of penalties for terminating the lease, if the lease term reflects the lessee exercising that option.
NOTES TO THE CONSOLIDATED FINANCIAL STATEMENTS.CONT.
68 NEW ZEALAND MEDIA AND ENTERTAINMENT
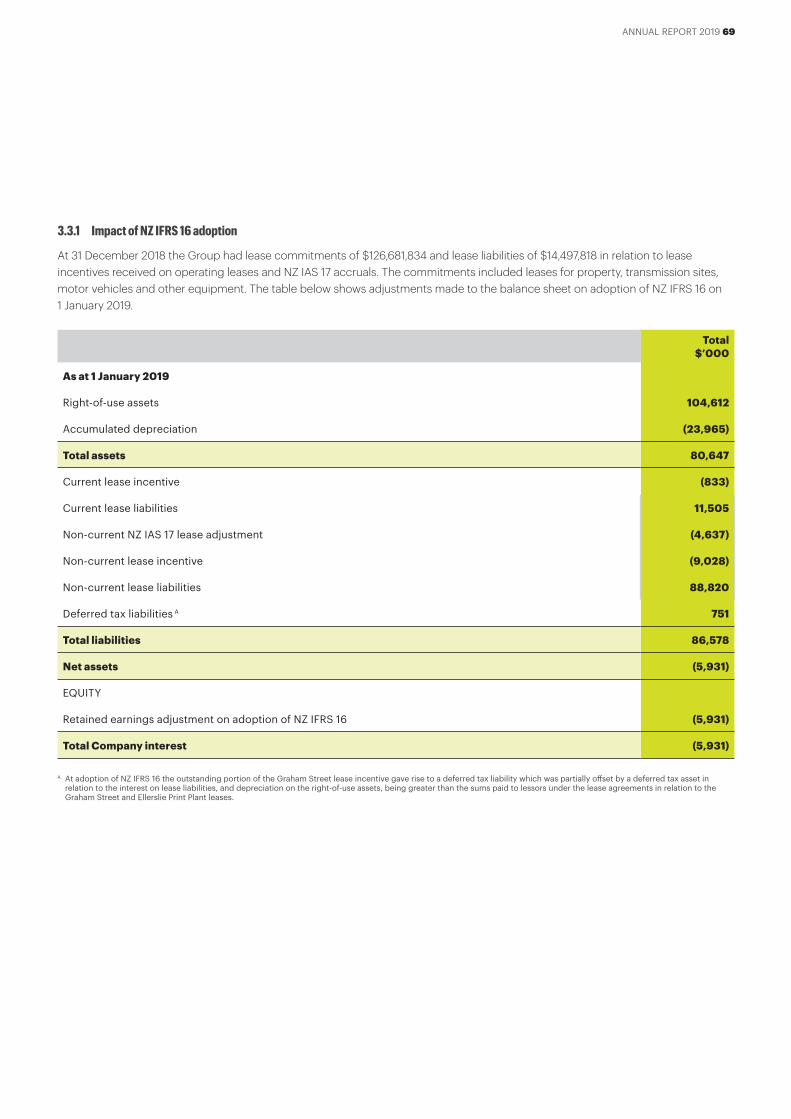
3.3.1 Impact of NZ IFRS 16 adoption
At 31 December 2018 the Group had lease commitments of $126,681,834 and lease liabilities of $14,497,818 in relation to lease incentives received on operating leases and NZ IAS 17 accruals. The commitments included leases for property, transmission sites, motor vehicles and other equipment. The table below shows adjustments made to the balance sheet on adoption of NZ IFRS 16 on 1 January 2019.
Total$’000
As at 1 January 2019
Right-of-use assets 104,612
Accumulated depreciation (23,965)
Total assets 80,647
Current lease incentive (833)
Current lease liabilities 11,505
Non-current NZ IAS 17 lease adjustment (4,637)
Non-current lease incentive (9,028)
Non-current lease liabilities 88,820
Deferred tax liabilities A 751
Total liabilities 86,578
Net assets (5,931)
EQUITY
Retained earnings adjustment on adoption of NZ IFRS 16 (5,931)
Total Company interest (5,931)
A At adoption of NZ IFRS 16 the outstanding portion of the Graham Street lease incentive gave rise to a deferred tax liability which was partially offset by a deferred tax asset in relation to the interest on lease liabilities, and depreciation on the right-of-use assets, being greater than the sums paid to lessors under the lease agreements in relation to the Graham Street and Ellerslie Print Plant leases.
ANNUAL REPORT 2019 69

3.3.2 Reconciliation of lease commitments to lease liabilities
Total$’000
Operating lease commitments disclosed as at 31 December 2018 126,682
As at 1 January 2019
Discounted at the incremental borrowing rate at the date of initial application 100,203
Add: CPI increases not contained in lease commitments schedule 369
Add: motor vehicles not in 31 December lease commitments 105
(Less): service component of motor vehicle leases included in lease commitments (352)
Net present value of future lease liabilities 100,325
Current lease liabilities 11,505
Non-current lease liabilities 88,820
Total future lease liabilities 100,325
3.3.3 Impact of NZ IFRS 16 on the balance sheet at 31 December 2019
Assets and liabilities have both increased as a result of the change in accounting policy in relation to leases. At 31 December 2019 the balance sheet accounts affected by the change are detailed in the table below:
Pre NZ IFRS 16 $’000
Adjustment$’000
NZ IFRS 16$’000
Right-of-use assets - 75,538 75,538
Impact on total assets 75,538
Current lease incentive 833 (833) -
Current lease liabilities - 11,076 11,076
Current tax provision 67 187 254
Non-current NZ IAS 17 lease adjustment 4,204 (4,204) -
Non-current lease incentive 8,195 (8,195) -
Non-current lease liabilities - 84,807 84,807
Deferred tax liabilities 274 331 605
Impact on total liabilities 83,169
Impact on net assets (7,631)
NOTES TO THE CONSOLIDATED FINANCIAL STATEMENTS.CONT.
70 NEW ZEALAND MEDIA AND ENTERTAINMENT

3.3.4 Impact of NZ IFRS 16 on the statement of cash flows for the twelve months ended 31 December 2019
Cash outflows from leases for the twelve months ended 31 December 2019 are detailed below. For the period ended 31 December 2018 the equivalent cash outflows were included in the cash flows from operating activities as payments to suppliers and employees.
Total$’000
Year ended 31 December 2019
Interest paid on leases (operating activities) (4,824)
Payments for lease liability principal (financing activities) (11,512)
Total cash outflows from leases (16,336)
3.4 CAPITAL WORK IN PROGRESS
2019$’000
2018$’000
As at 1 January 8,758 8,694
Additions 11,039 12,428
Transfers to intangible assets (5,010) (7,146)
Transfers to property plant and equipment (1,154) (5,218)
As at 31 December 13,633 8,758
Capital work in progress, which historically was included under property, plant and equipment, is transferred to the relevant asset category once the project is completed. Capitalised work in progress is not depreciated or amortised prior to being transferred to the relevant asset category.
ANNUAL REPORT 2019 71
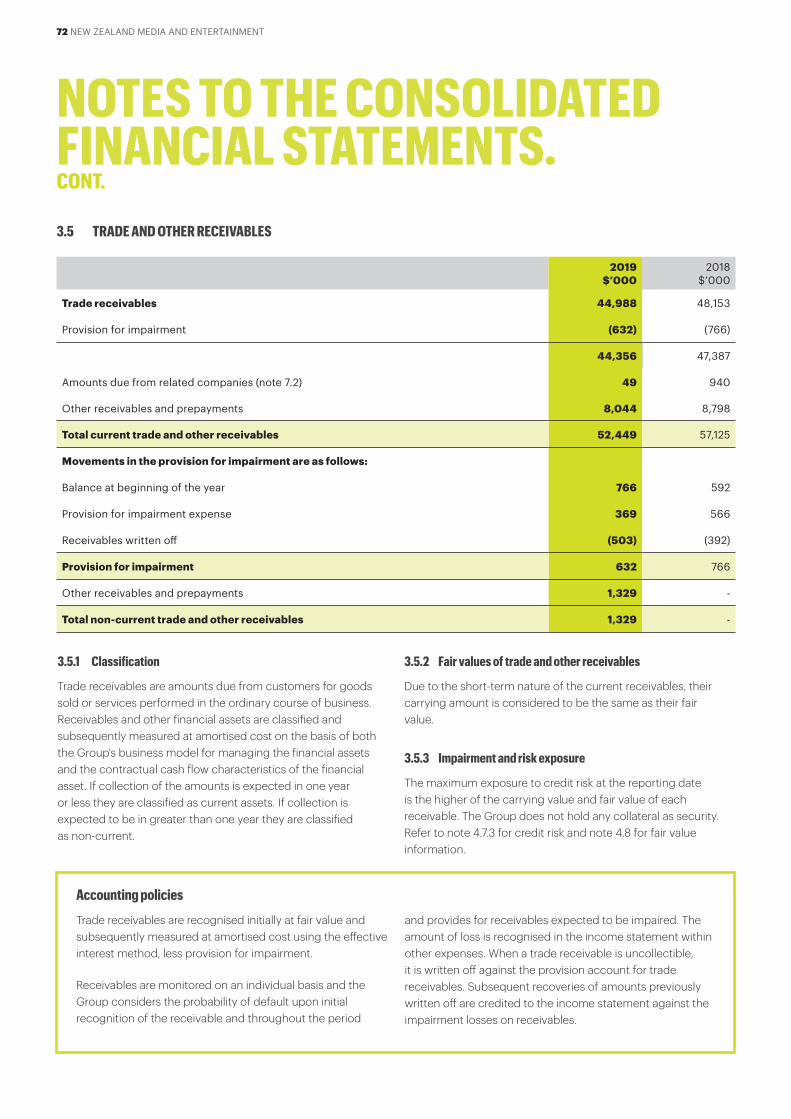
3.5 TRADE AND OTHER RECEIVABLES
2019$’000
2018$’000
Trade receivables 44,988 48,153
Provision for impairment (632) (766)
44,356 47,387
Amounts due from related companies (note 7.2) 49 940
Other receivables and prepayments 8,044 8,798
Total current trade and other receivables 52,449 57,125
Movements in the provision for impairment are as follows:
Balance at beginning of the year 766 592
Provision for impairment expense 369 566
Receivables written off (503) (392)
Provision for impairment 632 766
Other receivables and prepayments 1,329 -
Total non-current trade and other receivables 1,329 -
Accounting policies
Trade receivables are recognised initially at fair value and subsequently measured at amortised cost using the effective interest method, less provision for impairment.
Receivables are monitored on an individual basis and the Group considers the probability of default upon initial recognition of the receivable and throughout the period
and provides for receivables expected to be impaired. The amount of loss is recognised in the income statement within other expenses. When a trade receivable is uncollectible, it is written off against the provision account for trade receivables. Subsequent recoveries of amounts previously written off are credited to the income statement against the impairment losses on receivables.
3.5.1 Classification
Trade receivables are amounts due from customers for goods sold or services performed in the ordinary course of business. Receivables and other financial assets are classified and subsequently measured at amortised cost on the basis of both the Group's business model for managing the financial assets and the contractual cash flow characteristics of the financial asset. If collection of the amounts is expected in one year or less they are classified as current assets. If collection is expected to be in greater than one year they are classified as non-current.
3.5.2 Fair values of trade and other receivables
Due to the short-term nature of the current receivables, their carrying amount is considered to be the same as their fair value.
3.5.3 Impairment and risk exposure
The maximum exposure to credit risk at the reporting date is the higher of the carrying value and fair value of each receivable. The Group does not hold any collateral as security. Refer to note 4.7.3 for credit risk and note 4.8 for fair value information.
NOTES TO THE CONSOLIDATED FINANCIAL STATEMENTS.CONT.
72 NEW ZEALAND MEDIA AND ENTERTAINMENT

Accounting policies
Trade and other payables
Trade payables, including accruals not yet billed, are recognised when the Group becomes obliged to make future payments as a result of a purchase of assets or services. Trade payables are carried at amortised cost which is the fair value of the consideration to be paid in the future for goods and services received. Trade payables are unsecured and are generally settled within 30 to 45 days.
Employee entitlements
Wages and salaries and annual leave.
Liabilities for wages and salaries, including non-monetary benefits and annual leave expected to be wholly settled within 12 months from the reporting date are recognised in payables and accruals in respect of employees’ services up to the reporting date and are measured at the amounts expected to be paid when the liabilities are settled. Amounts to be settled more than 12 months after the reporting date are recognised as a non-current payable. Liabilities for non-accumulating sick leave are recognised when the leave is taken and measured at the rates paid or payable.
Short-term incentive plans A liability for short-term incentives is recognised in trade payables when there is an expectation of settlement and at least one of the following conditions is met:
• there are contracted terms in the plan for determining the amount of the benefit;
• the amounts to be paid are determined before the time of completion of the financial statements; or
• past practice gives clear evidence of the amount of the obligation.
Liabilities for short-term incentives are expected to be settled within 12 months and are recognised at the amounts expected to be paid when they are settled.
Refer to note 4.3 for disclosures relating to share based payments and note 7.1.1 for key management compensation.
3.6 TRADE AND OTHER PAYABLES
2019$’000
2018$’000
Current payables
Lease liability A - 833
Amounts due to related companies (note 7.1.2) 104 359
Employee entitlements 5,829 7,732
Trade payables and accruals 45,550 43,112
Total current trade and other payables 51,483 52,036
Non-current payables
Lease liability A - 13,665
Total non-current trade and other payables - 13,665
A Lease liability includes lease incentives received on operating leases.
ANNUAL REPORT 2019 73
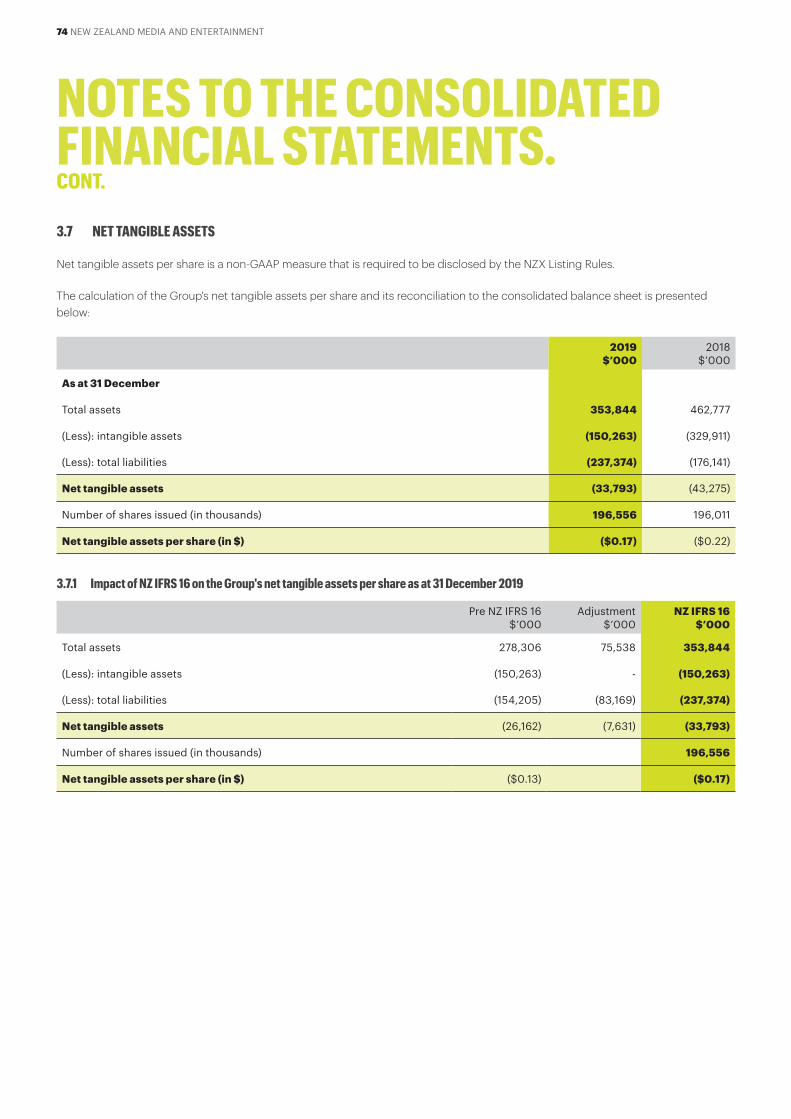
3.7 NET TANGIBLE ASSETS
Net tangible assets per share is a non-GAAP measure that is required to be disclosed by the NZX Listing Rules.
The calculation of the Group's net tangible assets per share and its reconciliation to the consolidated balance sheet is presented below:
2019$’000
2018$’000
As at 31 December
Total assets 353,844 462,777
(Less): intangible assets (150,263) (329,911)
(Less): total liabilities (237,374) (176,141)
Net tangible assets (33,793) (43,275)
Number of shares issued (in thousands) 196,556 196,011
Net tangible assets per share (in $) ($0.17) ($0.22)
3.7.1 Impact of NZ IFRS 16 on the Group's net tangible assets per share as at 31 December 2019
Pre NZ IFRS 16$’000
Adjustment$’000
NZ IFRS 16$’000
Total assets 278,306 75,538 353,844
(Less): intangible assets (150,263) - (150,263)
(Less): total liabilities (154,205) (83,169) (237,374)
Net tangible assets (26,162) (7,631) (33,793)
Number of shares issued (in thousands) 196,556
Net tangible assets per share (in $) ($0.13) ($0.17)
NOTES TO THE CONSOLIDATED FINANCIAL STATEMENTS.CONT.
74 NEW ZEALAND MEDIA AND ENTERTAINMENT
Accounting policies
For each cash flow hedge relationship, the effective part of any gain or loss on the derivative financial instrument is recognised directly in other comprehensive income. Gains or losses that are recognised in other comprehensive income are transferred to the income statement in the same period in which the hedged exposure affects the income statement. The ineffective part of any gain or loss is recognised immediately in the income statement at the time hedge effectiveness is tested.
Hedge accounting is discontinued when the hedging instrument expires or is sold, terminated or exercised, or no longer qualifies for hedge accounting. At that point in time, any cumulative gain or loss on the hedging instrument recognised in other comprehensive income is kept in other comprehensive income until the forecasted transaction occurs. If a hedged transaction is no longer expected to occur, the net cumulative gain or loss recognised in other comprehensive income is immediately transferred to the income statement.
3.8 DERIVATIVE FINANCIAL INSTRUMENTS
In August 2019 the Group entered into some cash flow hedging arrangements to minimise the Group's interest rate risk. The Group has $30 million invested in five different interest rate swaps with maturity dates from August 2021 to August 2023. At 31 December 2019 the Group has a non-current asset of $248,291 and has recycled interest income of $17,089 through other comprehensive income.
ANNUAL REPORT 2019 75

4.0 CAPITAL MANAGEMENT4.1 SHARE CAPITAL
2019Number
2018Number
2019$’000
2018$’000
Authorised, issued and paid up share capital
Balance at the beginning of the period 196,011 196,011 360,363 360,363
Shares issued during the year 545 - 405 -
Balance at the end of the period 196,556 196,011 360,768 360,363
4.2 RESERVES
2019 $’000
2018$’000
Share based payments reserve
Balance at the beginning of the year 1,950 1,369
Share based payment expense 311 581
Settlement of 2016 TIP (515) -
Balance at end of the year 1,746 1,950
Cash flow hedge reserve
Fair value gains 265 -
Recycling of cash flow hedge reserve (17) -
Tax impact of hedging transactions (70) -
Balance at end of the year 178 -
Asset revaluation reserve
Balance at beginning of the year 722 722
Balance at end of year 722 722
Foreign currency translation reserve
Balance at beginning of the year 326 294
Net exchange difference on translation of foreign operations 12 32
Balance at end of year 338 326
Total reserves 2,984 2,998
Accounting policies
Ordinary shares are classified as equity. Incremental costs directly attributable to the issue of new shares or options are shown in equity as a deduction, net of tax, from the proceeds.
NOTES TO THE CONSOLIDATED FINANCIAL STATEMENTS.CONT.
76 NEW ZEALAND MEDIA AND ENTERTAINMENT
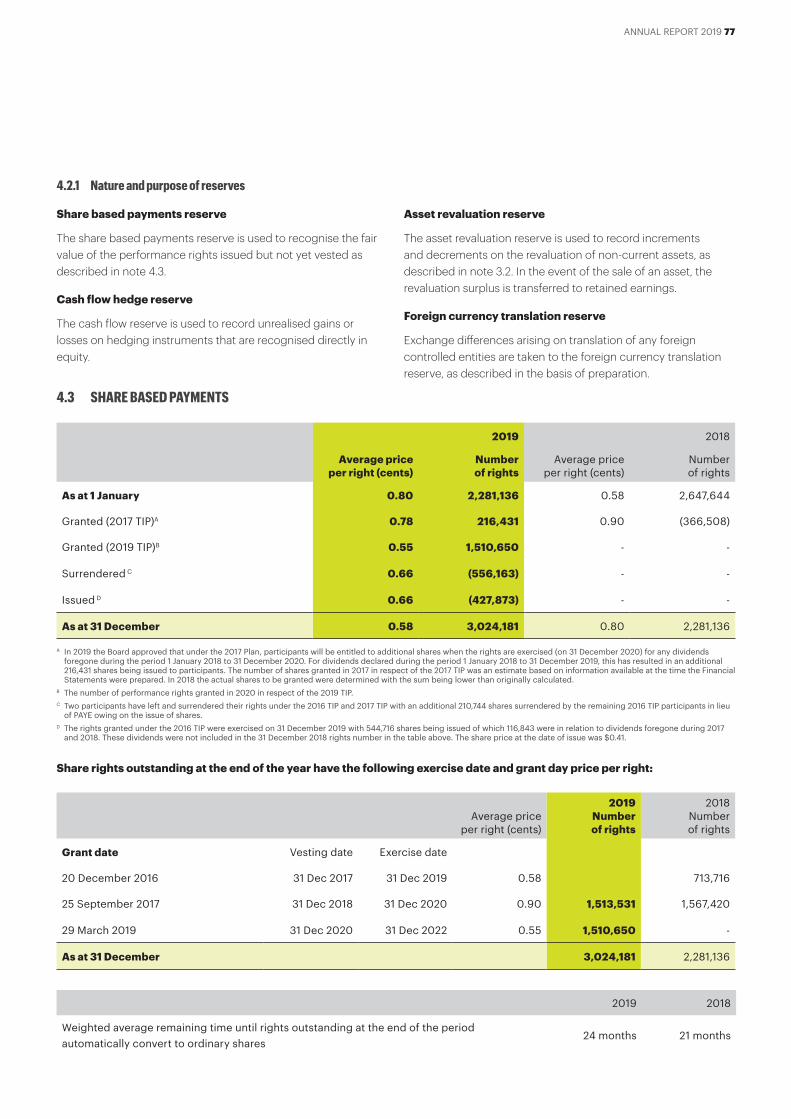
4.2.1 Nature and purpose of reserves
Share based payments reserve
The share based payments reserve is used to recognise the fair value of the performance rights issued but not yet vested as described in note 4.3.
Cash flow hedge reserve
The cash flow reserve is used to record unrealised gains or losses on hedging instruments that are recognised directly in equity.
Asset revaluation reserve
The asset revaluation reserve is used to record increments and decrements on the revaluation of non-current assets, as described in note 3.2. In the event of the sale of an asset, the revaluation surplus is transferred to retained earnings.
Foreign currency translation reserve
Exchange differences arising on translation of any foreign controlled entities are taken to the foreign currency translation reserve, as described in the basis of preparation.
4.3 SHARE BASED PAYMENTS
2019 2018
Average price per right (cents)
Number of rights
Average price per right (cents)
Number of rights
As at 1 January 0.80 2,281,136 0.58 2,647,644
Granted (2017 TIP)A 0.78 216,431 0.90 (366,508)
Granted (2019 TIP)B 0.55 1,510,650 - -
Surrendered C 0.66 (556,163) - -
Issued D 0.66 (427,873) - -
As at 31 December 0.58 3,024,181 0.80 2,281,136
A In 2019 the Board approved that under the 2017 Plan, participants will be entitled to additional shares when the rights are exercised (on 31 December 2020) for any dividends foregone during the period 1 January 2018 to 31 December 2020. For dividends declared during the period 1 January 2018 to 31 December 2019, this has resulted in an additional 216,431 shares being issued to participants. The number of shares granted in 2017 in respect of the 2017 TIP was an estimate based on information available at the time the Financial Statements were prepared. In 2018 the actual shares to be granted were determined with the sum being lower than originally calculated.
B The number of performance rights granted in 2020 in respect of the 2019 TIP. C Two participants have left and surrendered their rights under the 2016 TIP and 2017 TIP with an additional 210,744 shares surrendered by the remaining 2016 TIP participants in lieu
of PAYE owing on the issue of shares. D The rights granted under the 2016 TIP were exercised on 31 December 2019 with 544,716 shares being issued of which 116,843 were in relation to dividends foregone during 2017
and 2018. These dividends were not included in the 31 December 2018 rights number in the table above. The share price at the date of issue was $0.41.
Share rights outstanding at the end of the year have the following exercise date and grant day price per right:
Average price per right (cents)
2019Number of rights
2018Number of rights
Grant date Vesting date Exercise date
20 December 2016 31 Dec 2017 31 Dec 2019 0.58 713,716
25 September 2017 31 Dec 2018 31 Dec 2020 0.90 1,513,531 1,567,420
29 March 2019 31 Dec 2020 31 Dec 2022 0.55 1,510,650 -
As at 31 December 3,024,181 2,281,136
2019 2018
Weighted average remaining time until rights outstanding at the end of the period automatically convert to ordinary shares
24 months 21 months
ANNUAL REPORT 2019 77

4.3.1 Background
Total incentive plan ("TIP")
The TIP is designed to align the reward outcomes with the shareholders' interest and to support the achievement of the Group's business strategy and was approved by the Board on 20 December 2016. Under the TIP, and at the absolute discretion of the Board, the CEO and other executive key management personnel are eligible to participate in the TIP. Eligible participants have a target award opportunity, which varies
between 50% and 100% of fixed remuneration, depending on the participant's role and responsibilities. A new TIP opportunity will be offered at the commencement of each financial year. The award is dependent on performance over a one year period ("performance period") and there is no opportunity for retesting. Performance is formally evaluated after the date that the full year financial performance is announced to the market.
4.3.2 2019 and 2017 TIP Schemes
Performance measures
• Financial performance conditions (50% to 75%): Performance will be measured against earnings before interest, tax, depreciation and amortisation ("EBITDA"). This portion is determined based on actual EBITDA against budgeted EBITDA on the following scale:
% of EBITDA % of target opportunity awarded
< 95% 0%
> 95% to 100% Pro-rata vesting between 25% and 100%
> 100% to 110% Pro-rata vesting between 100% and 150%
• Business Unit Goals (0% to 25%):This portion is determined based on actual achievement against Business Unit ("BU") Goals on the following scale:
% of BU Goal achieved
% of target opportunity awarded
< 95% 25%
> 95% to 100% Pro-rata vesting between 25% and 100%
> 100% to 110% Pro-rata vesting between 100% and 150%
• Individual performance conditions (25%): This portion is determined against individual performance conditions, as determined for each participant. The TIP award is earned if all of the individual performance conditions have been achieved, although the Board has discretion to award less than a 100% of the target for partial performance and more than a 100% of the target for exceptional performance.
Awards under the TIP are granted to participants following the assessment of performance. To the extent that performance measures are met:
• 50% of awards are made in cash; and
• 50% of awards are granted in rights to acquire fully paid ordinary shares in the Company for nil consideration ("Rights").
The performance period for the awards is a twelve month period commencing on 1 January of the relevant year. Subject to remaining employed by the Company for a further one year period following the performance period ("service period"), rights will vest. The vested rights cannot be exercised for a further two years ("deferral period"). Vested rights will automatically convert into ordinary shares for nil consideration at the end of the deferral period without the requirement for the participant to exercise their Rights. At the discretion of the Board, validly exercised rights may be satisfied in cash, rather than in shares. Participants are not entitled to receive any dividends for the rights they hold, but the Board may, at its sole discretion, allocate shares or make a cash payment to participants equal to the value of dividends that were payable whilst holding the unvested and/or vested rights. The Company may reduce unvested equity awards in certain circumstances such as gross misconduct, material misstatement or fraud. The Board may also reduce unvested awards to recover amounts where performance that led to payments being awarded is later determined to have been incorrectly measured or not sustained. Awards are normally forfeited if the participant leaves before the end of the performance period, except in limited circumstances that are approved by the Board on a case-by-case basis. If a participant leaves during the service period, the rights that will vest will be determined on a pro-rata basis based on when they leave during the service period. If a participant leaves during the deferral
NOTES TO THE CONSOLIDATED FINANCIAL STATEMENTS.CONT.
78 NEW ZEALAND MEDIA AND ENTERTAINMENT

period, no rights will be forfeited, but rights will still only convert into ordinary shares at the end of the deferral period.
The fair value of the rights at grant date was estimated based on the NZME share price at that date, being the date after the Board approved the TIP and the terms were communicated to the eligible participants. The number of rights awarded are based on the Volume Weighted Average Price ("VWAP") of the Company's shares for the first 5 trading days of each Performance Period.
In February 2019 the Board approved the allocation of shares to participants of the 2017 TIP equal to the value of dividends that were payable whilst holding the unvested and/or vested rights. The fair value of these rights is based on the NZME share price on the date that the dividend was paid. The number of rights awarded are based on the Volume Weighted Average Price ("VWAP") of the Company's shares for the first 5 trading days of each Performance Period.
Model inputs
The following is a summary of the key inputs in calculating the share-based payment expense under the 2019 TIP:
• Performance Period 1 January 2019 to 31 December 2019
• Service Period 1 January 2020 to 31 December 2020
• Vesting Period (being the Performance Period and the Service Period) 1 January 2019 to 31 December 2020
• Deferral Period 1 January 2021 to 31 December 2022
• Share price at grant date 55 cents
• VWAP 50.4 cents
The following is a summary of the key inputs in calculating the share-based payment expense under the 2017 TIP:
• Performance Period 1 January 2017 to 31 December 2017
• Service Period 1 January 2018 to 31 December 2018
• Vesting Period (being the Performance Period and the Service Period) 1 January 2017 to 31 December 2018
• Deferral Period 1 January 2019 to 31 December 2020
• Share price at grant date 90 cents
• VWAP 59.4 cents
It is assumed that all participating employees will remain employed with the Company until the end of the Vesting Period.
4.3.3 2018 TIP
No TIP was offered for the 2018 Financial Year.
4.3.4 2016 TIP
The rights owing to the participants of the 2016 TIP were settled on 31 December 2019 with the issue of 544,176 shares.
ANNUAL REPORT 2019 79

4.4 DIVIDENDS
4.4.1 Dividends paid
No dividends were paid during 2019.
4.4.2 Dividends declared after balance date
On 24 February 2020, the Board of Directors confirmed that NZME would not be declaring a final dividend for the 2019 financial year.
4.4.3 Franking and imputation credits
2019$’000
2018$’000
Imputation credits available for subsequent reporting periods based on the New Zealand 28% tax rate for the Group
NZ$ 12,596 NZ$ 8,289
Franking credits available to the Company for subsequent reporting periods based on the Australian 30% tax rate for the Group
AU$ 0A AU$ 0A
A Although the Company does not have any franking credits available for use, other entities within the Group have AU$10,828,676 (2018:AU$10,828,676) available that might become available to the Company in future periods.
Accounting policies
Total incentive plan (TIP)
The fair value of rights granted under the TIP plan is recognised as an employee benefits expense with a corresponding increase in equity over the vesting period, being the performance period and the service period. The fair value is measured at grant date and the number of rights are determined using the volume weighted average price of NZME's shares on the NZX over the first 5 trading days of the performance period.
The fair value at grant date is determined taking into account the share price, any market performance conditions and any non-vesting conditions, but excluding the impact of any
service and non-market performance vesting conditions.
Non-market vesting conditions are included in assumptions about the number of rights that are expected to vest. At each reporting date, the Group revises its estimate of the number of rights that are expected to become exercisable.
The employee benefits expense recognised each period takes into account the most recent estimate. The impact of the revision to the original estimates, is recognised in profit or loss with a corresponding adjustment to equity.
NOTES TO THE CONSOLIDATED FINANCIAL STATEMENTS.CONT.
80 NEW ZEALAND MEDIA AND ENTERTAINMENT
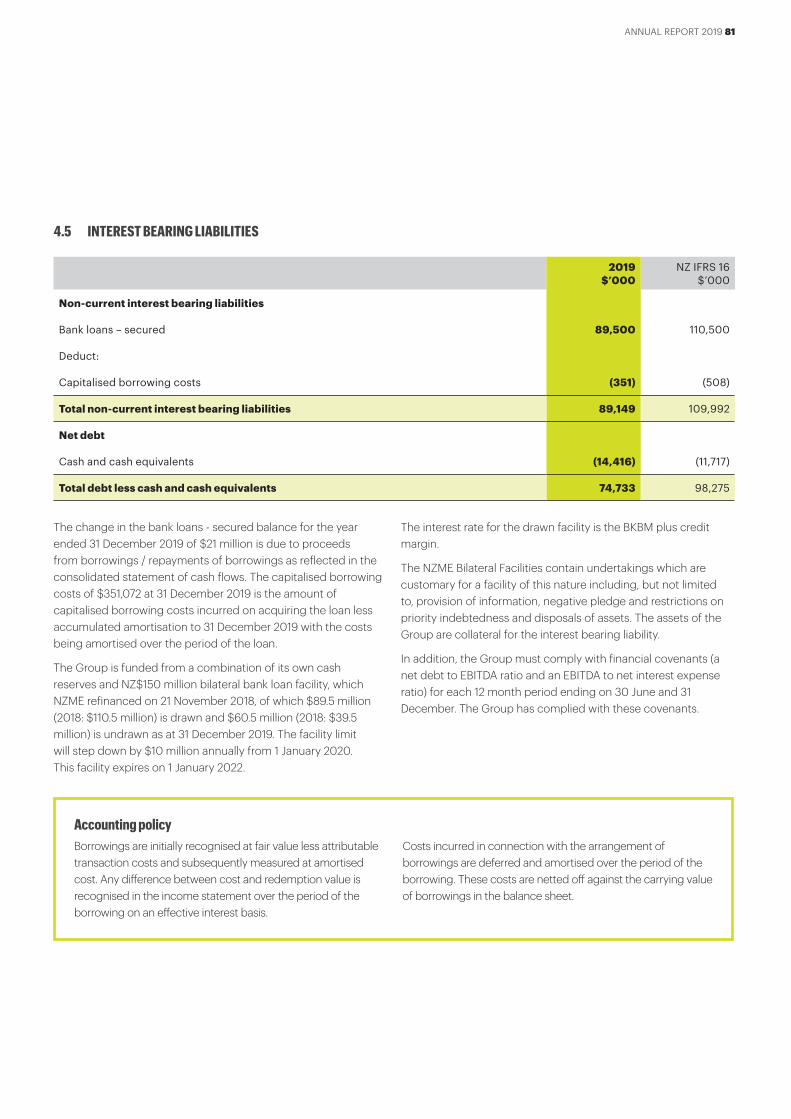
4.5 INTEREST BEARING LIABILITIES
2019$’000
NZ IFRS 16$’000
Non-current interest bearing liabilities
Bank loans – secured 89,500 110,500
Deduct:
Capitalised borrowing costs (351) (508)
Total non-current interest bearing liabilities 89,149 109,992
Net debt
Cash and cash equivalents (14,416) (11,717)
Total debt less cash and cash equivalents 74,733 98,275
The change in the bank loans - secured balance for the year ended 31 December 2019 of $21 million is due to proceeds from borrowings / repayments of borrowings as reflected in the consolidated statement of cash flows. The capitalised borrowing costs of $351,072 at 31 December 2019 is the amount of capitalised borrowing costs incurred on acquiring the loan less accumulated amortisation to 31 December 2019 with the costs being amortised over the period of the loan.
The Group is funded from a combination of its own cash reserves and NZ$150 million bilateral bank loan facility, which NZME refinanced on 21 November 2018, of which $89.5 million (2018: $110.5 million) is drawn and $60.5 million (2018: $39.5 million) is undrawn as at 31 December 2019. The facility limit will step down by $10 million annually from 1 January 2020. This facility expires on 1 January 2022.
The interest rate for the drawn facility is the BKBM plus credit margin.
The NZME Bilateral Facilities contain undertakings which are customary for a facility of this nature including, but not limited to, provision of information, negative pledge and restrictions on priority indebtedness and disposals of assets. The assets of the Group are collateral for the interest bearing liability.
In addition, the Group must comply with financial covenants (a net debt to EBITDA ratio and an EBITDA to net interest expense ratio) for each 12 month period ending on 30 June and 31 December. The Group has complied with these covenants.
Accounting policyBorrowings are initially recognised at fair value less attributable transaction costs and subsequently measured at amortised cost. Any difference between cost and redemption value is recognised in the income statement over the period of the borrowing on an effective interest basis.
Costs incurred in connection with the arrangement of borrowings are deferred and amortised over the period of the borrowing. These costs are netted off against the carrying value of borrowings in the balance sheet.
ANNUAL REPORT 2019 81

4.6 CASH FLOW INFORMATION
2019$’000
NZ IFRS 16$’000
Reconciliation of cash
Cash at end of the year, as shown in the statements of cash flows, comprises:
Cash and cash equivalents 14,416 11,717
Reconciliation of net cash inflows / (outflows) from operating activities to profit for the year:
(Loss) / profit for the year (165,172) 11,572
Depreciation and amortisation expense 31,672 24,555
Borrowing cost amortisation 192 119
Non-cash lease transactions - 99
Net (gain) / loss on sale of non-current assets (11) 59
Change in current / deferred tax payable 1,034 (9,263)
Net loss on sale of investment 210 -
Impairment of intangible assets 175,000 -
Gain on change in scope of lease (638) -
Revaluation / impairment of financial assets 869 2,249
Share based payment expense 311 581
Changes in assets and liabilities net of effect of acquisitions:
Trade and other receivables 4,030 (2,801)
Inventories (78) 61
Prepayments (630) (571)
Trade and other payables and employee benefits 182 (4,818)
Net cash inflows / (outflows) from operating activities 46,971 21,842
Accounting policyFor the purposes of presentation on the statement of cash flows, cash and cash equivalents includes cash on hand and
short term deposits held at call with finance institutions, net of bank overdrafts.
NOTES TO THE CONSOLIDATED FINANCIAL STATEMENTS.CONT.
82 NEW ZEALAND MEDIA AND ENTERTAINMENT

4.7 FINANCIAL RISK MANAGEMENT
4.7.1 Capital and risk management
The Group's objectives when managing capital are to:
• Safeguard their ability to continue as a going concern, so that they can continue to provide returns for shareholders and benefits for other stakeholders; and
• Maintain an optimal capital structure to reduce the cost of capital.
In order to maintain or adjust the capital structure, the Group may adjust the amount of dividends paid to shareholders, return capital to shareholders, issue new shares or sell assets to reduce debt.
Refer to note 4.5 for undrawn facilities to which the group has access to as well as the net debt calculation that is used by the group to manage capital requirements.
The Group’s activities expose it to a variety of financial risks: market risk (including interest rate risk, and price risk), credit risk and liquidity risk. The Group’s overall risk management programme focuses on the unpredictability of financial markets and seeks to minimise potential adverse effects on the financial performance of the Group. The Group uses different methods to measure different types of risk to which it is exposed. These methods include sensitivity analysis in the case of interest rate and ageing analysis for credit risk.
Financial risk management is carried out by the Group Treasury function. The Group Treasury function meet regularly with the Group CFO to cover specific areas, such as interest rate risk and credit risk, use of derivative financial instruments and non-derivative financial instruments, and investment of excess liquidity. Due to the Group's limited operations in foreign jurisdictions, the Group does not have a significant foreign exchange exposure.
4.7.2 Market riskCash flow and fair value interest rate risk
Long term borrowings issued at variable rates expose the Group to cash flow interest rate risk. Borrowings issued at fixed interest rates expose the Group to fair value interest rate risk. The Group has undertaken hedging transactions to mitigate this risk (note 3.8). Current interest bearing debt is fixed for 30 days on a rolling basis.
NZME’s interest rate risk is managed with interest rate derivatives. Hedge accounting is applied to derivatives that are effective in offsetting the changes in fair value or cash flows of the hedged items. The hedge relationship is documented and the effectiveness of such hedges is tested at regular intervals, at least on a semi-annual basis.
Based on the outstanding net floating debt at 31 December 2019, a change in interest rates of +/-1% per annum with all other variables being constant would impact post-tax profit and equity by $0.6 million lower / higher (2018: $1.1 million lower / higher).
Price risk
The Group is not exposed to significant price risk. There is some risk associated with other financial assets however this is not deemed to be significant as other financial assets are categorised as level 3 in the fair value hierarchy and have been impaired, where applicable, to the present value of expected future cash flows.
4.7.3 Credit risk
Credit risk is managed on a Group basis. Credit risk arises from cash and cash equivalents and deposits with banks and financial institutions, as well as credit exposures to wholesale and retail customers, including outstanding receivables and committed transactions. For banks and financial institutions, the creditworthiness is assessed prior to entering into arrangements and approved by the Board. For other customers, NZME's credit control department assesses the credit quality, taking into account financial position, past experience and other factors. The utilisation of credit limits is regularly monitored and the Group does not normally obtain collateral from its customers.
ANNUAL REPORT 2019 83

The table below sets out additional information about the credit quality of trade receivables net of the provision for doubtful debts:
Current $’000
Less than one month
$’000
One to three months
$’000
Three to six months
$’000
Over six months
$’000Total
$’000
2019
Expected loss rate 0.5% 1.9% 3.7% 1.6% 20.7%
Trade Receivables 29,886 9,151 2,892 2,298 761 44,988
Impaired receivables (160) (169) (108) (37) (158) (632)
29,726 8,982 2,784 2,261 603 44,356
Current $’000
Less than one month
$’000
One to three months
$’000
Three to six months
$’000
Over six months
$’000Total
$’000
2018
Expected loss rate 0.0% 0.7% 4.6% 11.9% 42.0%
Trade Receivables 31,168 11,802 2,493 1,868 822 48,153
Impaired receivables - (84) (115) (222) (345) (766)
31,168 11,718 2,378 1,646 477 47,387
Trade receivables are generally settled within 30 to 45 days. The Directors consider the carrying amount of trade receivables approximates to their net fair value. Receivables are monitored on an individual basis and the Company considers the probability of default upon initial recognition of the receivable and throughout the period and provides for receivables considered to be impaired.
As of 31 December 2019, trade receivables of $5,648,000 (2018: $4,501,000) were past due but not impaired.
The maximum exposure to credit risk at 31 December 2019 is equal to the carrying amount of cash and cash equivalents and trade and other receivables. The Group is not exposed to any concentrations of credit risk within cash and cash equivalents or trade and other receivables.
Credit risk further arises in relation to financial guarantees given to certain parties from time to time.
NOTES TO THE CONSOLIDATED FINANCIAL STATEMENTS.CONT.
84 NEW ZEALAND MEDIA AND ENTERTAINMENT
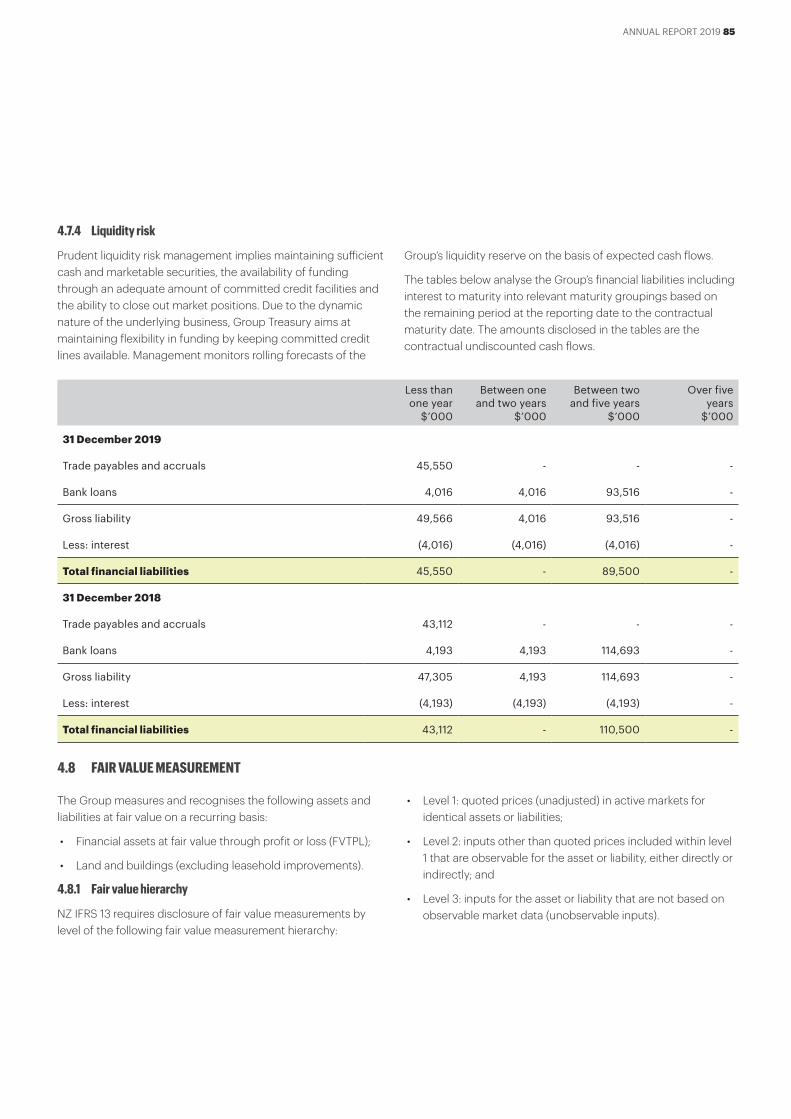
4.7.4 Liquidity risk
Prudent liquidity risk management implies maintaining sufficient cash and marketable securities, the availability of funding through an adequate amount of committed credit facilities and the ability to close out market positions. Due to the dynamic nature of the underlying business, Group Treasury aims at maintaining flexibility in funding by keeping committed credit lines available. Management monitors rolling forecasts of the
Group’s liquidity reserve on the basis of expected cash flows.
The tables below analyse the Group’s financial liabilities including interest to maturity into relevant maturity groupings based on the remaining period at the reporting date to the contractual maturity date. The amounts disclosed in the tables are the contractual undiscounted cash flows.
Less than one year
$’000
Between one and two years
$’000
Between two and five years
$’000
Over five years
$’000
31 December 2019
Trade payables and accruals 45,550 - - -
Bank loans 4,016 4,016 93,516 -
Gross liability 49,566 4,016 93,516 -
Less: interest (4,016) (4,016) (4,016) -
Total financial liabilities 45,550 - 89,500 -
31 December 2018
Trade payables and accruals 43,112 - - -
Bank loans 4,193 4,193 114,693 -
Gross liability 47,305 4,193 114,693 -
Less: interest (4,193) (4,193) (4,193) -
Total financial liabilities 43,112 - 110,500 -
4.8 FAIR VALUE MEASUREMENT
The Group measures and recognises the following assets and liabilities at fair value on a recurring basis:
• Financial assets at fair value through profit or loss (FVTPL);
• Land and buildings (excluding leasehold improvements).
4.8.1 Fair value hierarchy
NZ IFRS 13 requires disclosure of fair value measurements by level of the following fair value measurement hierarchy:
• Level 1: quoted prices (unadjusted) in active markets for identical assets or liabilities;
• Level 2: inputs other than quoted prices included within level 1 that are observable for the asset or liability, either directly or indirectly; and
• Level 3: inputs for the asset or liability that are not based on observable market data (unobservable inputs).
ANNUAL REPORT 2019 85

4.8.2 Recognised fair value measurements
2019$’000
2018$’000
Recurring fair value measurements
Financial assets (Level 2)
Derivative financial instruments 248 -
Financial assets (Level 3)
There are no financial assets carried at fair value. Other financial assets of $4,122,569 (2018: $5,356,765) are held at cost and therefore have been excluded from this table.
Total financial assets 248 -
Non-financial assets (Level 3)
Freehold land and buildings
Freehold land 1,165 1,165
Buildings (excluding leasehold improvements) 115 131
Total non-financial assets 1,280 1,296
All fair value measurements referred to above are either level 2 or level 3 of the fair value hierarchy and there were no transfers between levels. The Group’s policy is to recognise transfers between fair value hierarchy levels as at the end of the reporting period.
4.8.3 Disclosed fair values
The Group also has a number of assets and liabilities which are not measured at fair value but for which fair values are disclosed in these notes.
The carrying amounts of trade receivables and payables are assumed to approximate their fair values due to their short-term nature. There are no outstanding non-current receivables as at 31 December 2019 or 31 December 2018 (level 3).
The fair value of interest bearing liabilities disclosed in note 4.5 is estimated by discounting the future contractual cash flows at the current market interest rates that are available to the group for similar financial instruments. For the period ending 31 December 2019, the borrowing rates were determined to be between 3.4% and 4.6% (2018: between 3.3% and 4.5%), depending on the type of borrowing. The fair value of borrowings approximates the carrying amount, as the impact of discounting is not significant (level 2).
4.8.4 Valuation techniques used to derive at level 2 and 3 fair values
Recurring fair value measurements
The fair value of financial instruments that are not traded in an active market is determined using valuation techniques. These valuation techniques maximise the use of observable market data where it is available and rely as little as possible on entity specific estimates. If all significant inputs required to fair value an instrument are observable, the instrument is included in level 2.
If one or more of the significant inputs is not based on observable market data, the instrument is included in level 3.
The Group obtains independent valuations for its freehold land and buildings (classified as property, plant and equipment in note 3.2), less subsequent depreciation for buildings, with sufficient regularity to ensure that the carrying value of the assets is materially consistent with their fair value. All resulting fair value estimates for properties are included as level 3.
NOTES TO THE CONSOLIDATED FINANCIAL STATEMENTS.CONT.
86 NEW ZEALAND MEDIA AND ENTERTAINMENT
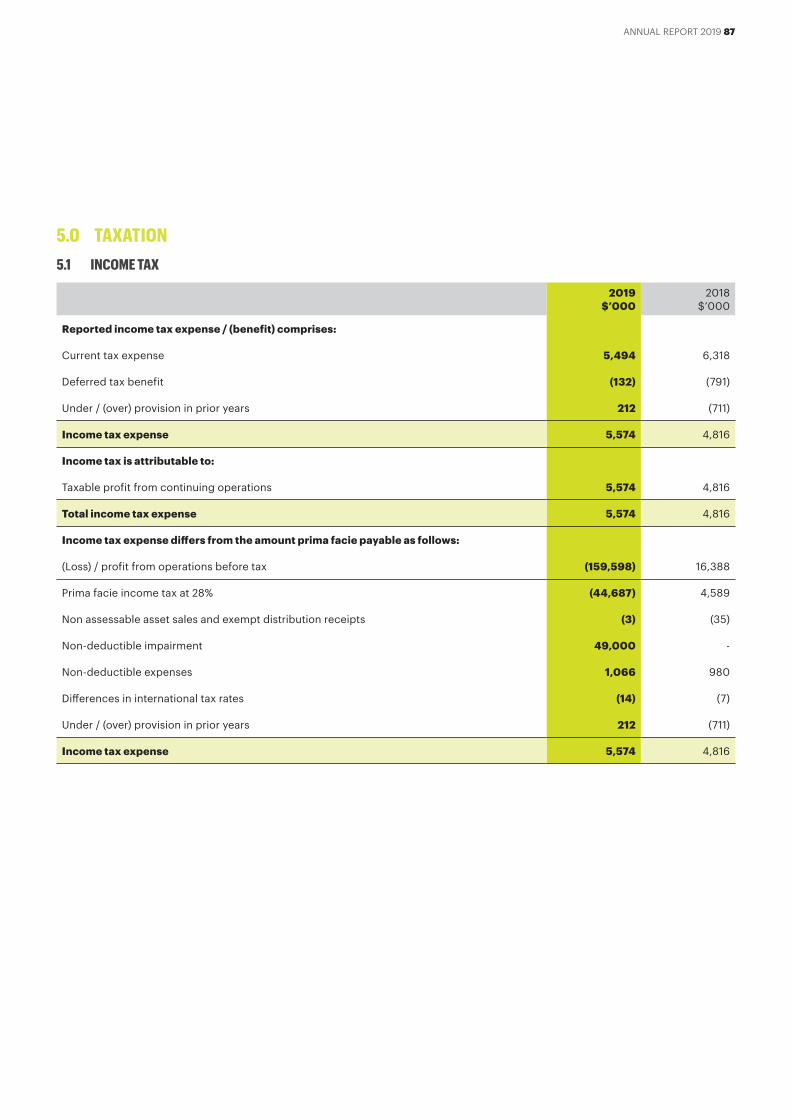
5.0 TAXATION5.1 INCOME TAX
2019$’000
2018$’000
Reported income tax expense / (benefit) comprises:
Current tax expense 5,494 6,318
Deferred tax benefit (132) (791)
Under / (over) provision in prior years 212 (711)
Income tax expense 5,574 4,816
Income tax is attributable to:
Taxable profit from continuing operations 5,574 4,816
Total income tax expense 5,574 4,816
Income tax expense differs from the amount prima facie payable as follows:
(Loss) / profit from operations before tax (159,598) 16,388
Prima facie income tax at 28% (44,687) 4,589
Non assessable asset sales and exempt distribution receipts (3) (35)
Non-deductible impairment 49,000 -
Non-deductible expenses 1,066 980
Differences in international tax rates (14) (7)
Under / (over) provision in prior years 212 (711)
Income tax expense 5,574 4,816
ANNUAL REPORT 2019 87

5.2 DEFERRED TAXDeferred tax assets and liabilities are attributable to:
Balance $’000
Recognised in income
$’000
Recognised in equity
$’000
Other movements
$’000Balance
$’000
2018
Tax credits 3 - - - 3
Employee benefits 2,198 (1,164) - - 1,034
Doubtful debts 165 49 - - 214
Accruals/restructuring 542 372 - - 914
Intangible assets (492) 37 - - (455)
Property Plant and Equipment (3,650) 1,497 - - (2,153)
Other (5) - - - (5)
(1,239) 791 - - (448)
2019
Tax credits 3 (3) - - -
Employee benefits 1,034 451 - - 1,485
Doubtful debts 214 (37) - - 177
Accruals/restructuring 914 (795) - - 119
Intangible assets (455) 37 - - (418)
Property Plant and Equipment (2,153) 60 - - (2,093)
Leases - 420 (751) (331)
Share Schemes - (6) (14) 546 526
Other (5) 5 - (70) (70)
(448) 132 (14) (275) (605)
There are unrecognised tax losses of $1,805,182 (AUD1,744,812) (2018: $1,835,141 (AUD1,744,812)) in an Australian subsidiary of the Company which have not been recognised as there is uncertainty as to their future recoverability. The deferred tax asset on these losses was not offset against the deferred tax liabilities of the rest of the Group because they are levied by a different tax authority.
There is now a deferred tax asset in relation to share schemes to recognise the income tax deduction now available.
The adoption of NZ IFRS 16 has resulted in the creation of a deferred tax liability to recognises the difference between the accounting and tax treatment of operating leases.
NOTES TO THE CONSOLIDATED FINANCIAL STATEMENTS.CONT.
88 NEW ZEALAND MEDIA AND ENTERTAINMENT

Accounting policiesThe tax expense for the period comprises current and deferred tax. Tax is recognised in the income statement, except to the extent that it relates to items recognised in other comprehensive income or directly in equity. In this case the tax is also recognised in other comprehensive income or directly in equity, respectively.
The current income tax charge is calculated on the basis of the tax laws enacted or substantively enacted at the balance sheet date in the countries where the Company and its subsidiaries operate and generate taxable income. Management periodically evaluates positions taken in tax returns with respect to situations in which applicable tax regulation is subject to interpretation. It establishes provision where appropriate on the basis of amounts expected to be paid to the tax authorities.
Deferred tax is recognised, using the liability method, on temporary differences arising between the tax bases of assets and liabilities and their carrying amounts in the consolidated financial statements. However, deferred tax liabilities are not recognised if they arise from the initial recognition of goodwill: deferred income tax is not accounted for if it arises from initial recognition of an asset or liability in a transaction other than a business combination that at the time of the transaction affects
neither accounting nor taxable profit or loss. Deferred income tax is determined using tax rates (and laws) that have been enacted or substantially enacted by the balance sheet date and are expected to apply when the related deferred income tax asset is realised or the deferred income tax liability is settled.
Deferred income tax assets are recognised only to the extent that it is probable that future taxable profit will be available against which the temporary differences can be utilised.
Deferred income tax is provided on temporary differences arising on investments in subsidiaries and associates, except for deferred income tax liability where the timing of the reversal of the temporary difference is controlled by the Group and it is probable that the temporary difference will not reverse in the foreseeable future.
Deferred income tax assets and liabilities are offset when there is a legally enforceable right to offset current tax assets against current tax liabilities and when the deferred income taxes assets and liabilities relate to income taxes levied by the same taxation authority on either the same taxable entity or different taxable entities where there is an intention to settle the balances on a net basis.
ANNUAL REPORT 2019 89

6.0 GROUP STRUCTURE AND INVESTMENTS IN OTHER ENTITIES6.1 CONTROLLED ENTITIES
The consolidated financial statements incorporate the assets, liabilities and results of the subsidiaries listed below. Unless otherwise stated, they have share capital consisting solely of ordinary shares that are held directly by the Group, and the proportion of ownership interest held equals the voting rights held by the Group. All entities are incorporated in, and operate in, New Zealand unless otherwise stated. There were no changes in control during the year ended 31 December 2019.
2019 2019 Ownership Ownership
InterestInterest
2018 2018 Ownership Ownership
InterestInterest
Name of entity
Grabone Limited 100% 100%
NZME Australia Pty Limited A 100% 100%
NZME Educational Media Limited 100% 100%
NZME Holdings Limited 100% 100%
NZME Investments Limited 100% 100%
NZME Print Limited 100% 100%
NZME Publishing Limited 100% 100%
NZME Radio Investments Limited 100% 100%
NZME Radio Limited B 100% 100%
NZME Specialist Limited 100% 100%
The Hive Online Limited 100% 100%
New Zealand Radio Network Limited 100% 100%
The Radio Bureau Limited 100% 100%
OneRoof Limited 80% 80%
A Incorporated in, and operates in, Australia.
B One "Kiwi Share" held by the Minister of Finance. The rights and obligations are set out in the NZME Radio constitution.
NOTES TO THE CONSOLIDATED FINANCIAL STATEMENTS.CONT.
90 NEW ZEALAND MEDIA AND ENTERTAINMENT

Accounting policiesThe Group controls an entity when the Group is exposed to, or has rights to, variable returns from its involvement with the entity and has the ability to affect those returns through its power to direct the activities of the entity. Subsidiaries are fully consolidated from the date on which control is transferred to the Group. They are de-consolidated from the date that control ceases. The acquisition method of accounting is used to account for business combinations by the Group.
Intercompany transactions, balances and unrealised gains on transactions between Group companies are eliminated. Accounting policies of subsidiaries have been changed where necessary to ensure consistency with the policies adopted by the group. Non-controlling interests in the results and equity of subsidiaries are shown separately in the consolidated income statement, statement of comprehensives income, statement of changes in equity and balance sheet respectively.
ANNUAL REPORT 2019 91

6.2 INTERESTS IN OTHER ENTITIES
6.2.1 Associates, joint ventures and joint operations
The Group has the following associates, joint ventures and joint operations:
2019 2019 Ownership Ownership
InterestInterest
2018 2018 Ownership Ownership
InterestInterest
Name of entity
Chinese New Zealand Herald Limited E 0% 50%
Eveve New Zealand Limited A 40% 40%
KPEX Limited F 25% 25%
New Zealand Press Association Limited A 38.82% 38.82%
Restaurant Hub Limited A 40% 40%
The Beacon Printing & Publishing Company Limited A 21% 21%
The Gisborne Herald Company Limited (held through Essex Castle Limited as a trust company for NZME Publishing Limited)A
49% 49%
The Radio Bureau B 50% 50%
The Wairoa Star Limited A 40.41% 40.41%
Ratebroker Limited D 0% 50%
The Newspaper Publishers Association of New Zealand Incorporated C
Online Media Association C
New Zealand Media Council C
Radio Broadcasters Association Incorporated C
A These entities are classified as joint ventures or associates. Because the effects of equity accounting are immaterial, these investments are carried at cost (refer note 6.2.2).B The Radio Bureau is classified as a joint operation and the Group has included its direct right to the assets, liabilities, revenues and expenses of joint operations and its share of any
jointly held or incurred assets, liabilities, revenues and expenses in these consolidated financial statements.C These are bodies with which entities in the Group have memberships, but no ownership interest.D In June 2019, the Group transferred all of its shares to the founding shareholders of Ratebroker Limited.E In December 2019 the Group sold its share of the Chinese New Zealand Herald Limited to Chinese Herald Investments Limited.F In August 2019 it was announced that KPEX Limited would be wound up.
NOTES TO THE CONSOLIDATED FINANCIAL STATEMENTS.CONT.
92 NEW ZEALAND MEDIA AND ENTERTAINMENT

Accounting policies
Associates
Associates are all entities over which the Group has significant influence but not control or joint control. Where the impact of the equity method of accounting is material, interests in associates are accounted for in the consolidated financial statements using the equity method (see below), after initially being recognised at cost. The Group’s investment in associates includes goodwill (net of any accumulated impairment loss) identified on acquisition.
Joint arrangements
Under IFRS 11: Joint Arrangements investments in joint arrangements are classified as either joint operations or joint ventures. The classification depends on the contractual rights and obligations of each investor, rather than the legal structure of the joint arrangement.
For material joint operations, the Group recognises its direct right to the assets, liabilities, revenues and expenses of joint operations and its share of any jointly held or incurred assets, liabilities, revenues and expenses. These have been incorporated in the financial statements under the appropriate headings.
Where the impact of the equity method of accounting is material, interests in material joint ventures are accounted for using the equity method (see below) after initially being recognised at cost in the consolidated balance sheet.
Equity method of accounting
Under the equity method of accounting, the investments are initially recognised at cost and adjusted thereafter to
recognise the group’s share of the post-acquisition profits or losses of the investee in profit or loss, and the Group’s share of movements in other comprehensive income of the investee in other comprehensive income. Dividends received or receivable from associates and joint ventures are recognised as a reduction in the carrying amount of the investment.
When the Group’s share of losses in an equity-accounted investment equals or exceeds its interest in the entity, including any other unsecured long-term receivables, the Group does not recognise further losses, unless it has incurred obligations or made payments on behalf of the other entity.
Unrealised gains on transactions between the group and its associates and joint ventures are eliminated to the extent of the Group’s interest in these entities. Unrealised losses are also eliminated unless the transaction provides evidence of an impairment of the asset transferred. Accounting policies of equity accounted investees have been changed where necessary to ensure consistency with the policies adopted by the Group.
The carrying amount of equity-accounted investments is tested for impairment whenever events or changes in circumstances indicate that the carrying amount may not be recoverable.
Where the effects of equity accounting are immaterial, investments are carried at cost.
6.2.2 Other financial assets
2018 $’000
2018 $’000
Shares in other corporations 3,308 3,788
Loans to other companies 815 1,569
Total other financial assets 4,123 5,357
Shares in other corporations consist of investments in entities that are not consolidated or equity accounted (see also note 6.2.1). These investments are carried at cost.
ANNUAL REPORT 2019 93

7.0 RELATED PARTIES7.1 KEY MANAGEMENT COMPENSATION
20192019$’000
20182018$’000
Total remuneration for Directors and other key management personnel:
Short term benefits 5,443 5,429
Termination benefits 771 499
Dividends (relating to shares held in the Company during the year) - 70
Share-based payments 311 581
6,525 6,579
The table above includes remuneration of the Board of Directors and the Executive Team, including amounts paid to members of the Executive Team who left during the year. Where a staff member was acting in a position on the Executive Team, that portion of their remuneration has been included in the table above.
7.2 OTHER TRANSACTIONS WITH RELATED PARTIESThe Group did not purchase print services from The Beacon Printing & Publishing Company Limited, a company in which the Group holds a 21% interest in as the contract for supply ended on 30 September 2018. In the year to 31 December 2018 purchases were $2,363,784. The Beacon Printing & Publishing Company Limited purchased advertising from the Group during the year ended 31 December totalling $3,559 (2018: $445) and reimbursed $6,200 for paper used in 2018 (2018: nil).
In November 2015, the Company, Fairfax Media, TVNZ and MediaWorks launched a new local advertising exchange service, KPEX Limited, offering media agencies and clients a programmatic option for purchasing online advertising. The group received advertising revenue of $1,427,209 (2018: $2,571,450) and paid commission of $156,246 (2018: $306,342). On 19 August 2019 it was agreed that KPEX Limited would be wound up.
The Group has commitments to provide future services (such as house advertising, occupancy space at NZME offices, business as usual finance and human resources support) to certain joint ventures and associates. During the year such
services were provided to Eveve New Zealand Limited, valued at $98,642 (2018: $27,992) and Restaurant Hub Limited, valued at $10,752 (2018: $260,040). The outstanding balances for future services are included in the table below, along with other receivables and payables.
During the year the Group received advertising revenue from The Wairoa Star Limited totalling $8,931 (2018: $8,396). The Wairoa Star Limited also purchased other services totalling $1,207 (2018: $2,898) from the Group. The Group purchased services from The Wairoa Star Limited totalling $1,286 (2018: $1,486) during the year.
The Group received advertising revenue totalling $89,929 (2018: $46,096) from The Chinese New Zealand Herald Limited during the year and paid commission totalling $42,698 (2018: $33,328).
The transactions with Ratebroker Limited during the year were $nil (2018: $nil).
The Group's transactions with the New Zealand Press Association Limited during the year were $nil (2018: $nil).
NOTES TO THE CONSOLIDATED FINANCIAL STATEMENTS.CONT.
94 NEW ZEALAND MEDIA AND ENTERTAINMENT
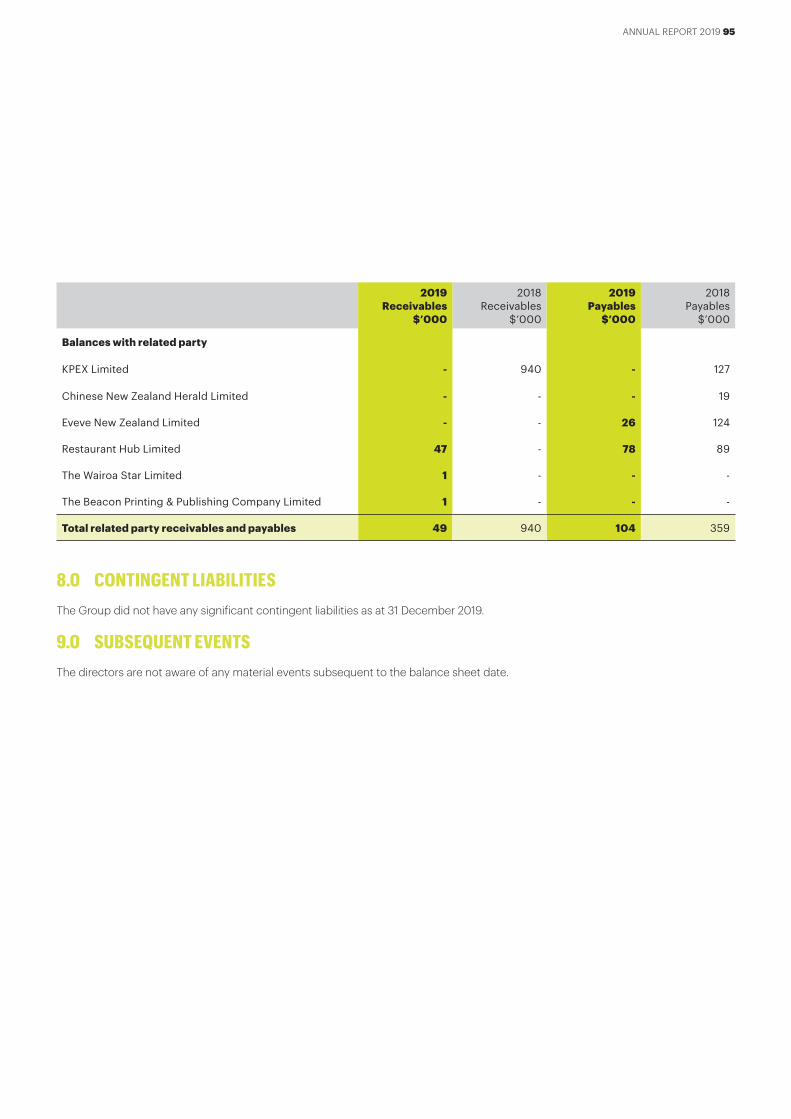
8.0 CONTINGENT LIABILITIESThe Group did not have any significant contingent liabilities as at 31 December 2019.
9.0 SUBSEQUENT EVENTSThe directors are not aware of any material events subsequent to the balance sheet date.
2019 Receivables
$’000
2018 Receivables
$’000
2019 Payables
$’000
2018 Payables
$’000
Balances with related party
KPEX Limited - 940 - 127
Chinese New Zealand Herald Limited - - - 19
Eveve New Zealand Limited - - 26 124
Restaurant Hub Limited 47 - 78 89
The Wairoa Star Limited 1 - - -
The Beacon Printing & Publishing Company Limited 1 - - -
Total related party receivables and payables 49 940 104 359
ANNUAL REPORT 2019 95

PricewaterhouseCoopers, 188 Quay Street, Private Bag 92162, Auckland 1142, New Zealand T: +64 9 355 8000, F: +64 9 355 8001, pwc.co.nz
Independent auditor’s report To the shareholders of NZME Limited
We have audited the consolidated financial statements which comprise:
• the consolidated balance sheet as at 31 December 2019;
• the consolidated income statement for the year then ended;
• the consolidated statement of comprehensive income for the year then ended;
• the consolidated statement of changes in equity for the year then ended;
• the consolidated statement of cash flows for the year then ended; and
• the notes to the consolidated financial statements, which include significant accounting policies.
Our opinion In our opinion, the accompanying consolidated financial statements of NZME Limited (the Company), including its subsidiaries (the Group), present fairly, in all material respects, the financial position of the Group as at 31 December 2019, its financial performance and its cash flows for the year then ended in accordance with New Zealand Equivalents to International Financial Reporting Standards (NZ IFRS) and International Financial Reporting Standards (IFRS).
Basis for opinion We conducted our audit in accordance with International Standards on Auditing (New Zealand) (ISAs (NZ)) and International Standards on Auditing (ISAs). Our responsibilities under those standards are further described in the Auditor’s responsibilities for the audit of the consolidated financial statements section of our report.
We believe that the audit evidence we have obtained is sufficient and appropriate to provide a basis for our opinion.
We are independent of the Group in accordance with Professional and Ethical Standard 1 (Revised) Code of Ethics for Assurance Practitioners (PES 1) issued by the New Zealand Auditing and Assurance Standards Board and the International Ethics Standards Board for Accountants’ Code of Ethics for Professional Accountants (IESBA Code), and we have fulfilled our other ethical responsibilities in accordance with these requirements.
Our firm carries out other services for the Group in the areas of taxation compliance and taxation advisory services, treasury related financial markets risk analysis and commentary, agreed upon procedures for the benchmarking of market revenue data, and payroll assurance services. In addition, certain partners and employees of our firm may subscribe to NZME services on normal terms within the ordinary course of the trading activities of the Group. The provision of these other services has not impaired our independence as auditor of the Group.
96 NEW ZEALAND MEDIA AND ENTERTAINMENT

PwC
Our audit approach
Overview
An audit is designed to obtain reasonable assurance whether the financial statements are free from material misstatement.
Overall Group materiality: $1,260,000, which represents approximately 5% of profit before tax, after adjusting to exclude exceptional expense items incurred during the year.
We chose profit before tax as the benchmark because, in our view, it is the benchmark against which the performance of the Group is most commonly measured by users and is a generally accepted benchmark. We have adjusted this benchmark for exceptional expenses (refer to note 2.4.2) to reduce volatility and to reflect the underlying performance of the Group.
We have determined that there is one key audit matter being the impairment testing of intangible assets.
Materiality The scope of our audit was influenced by our application of materiality.
Based on our professional judgement, we determined certain quantitative thresholds for materiality, including the overall Group materiality for the consolidated financial statements as a whole as set out above. These, together with qualitative considerations, helped us to determine the scope of our audit, the nature, timing and extent of our audit procedures and to evaluate the effect of misstatements, both individually and in aggregate on the consolidated financial statements as a whole.
Audit scope We designed our audit by assessing the risks of material misstatement in the consolidated financial statements and our application of materiality. As in all of our audits, we also addressed the risk of management override of internal controls including among other matters, consideration of whether there was evidence of bias that represented a risk of material misstatement due to fraud.
We tailored the scope of our audit in order to perform sufficient work to enable us to provide an opinion on the consolidated financial statements as a whole, taking into account the structure of the Group, the accounting processes and controls, and the industry in which the Group operates.
Key audit matters Key audit matters are those matters that, in our professional judgment, were of most significance in our audit of the consolidated financial statements of the current year. These matters were addressed in the context of our audit of the consolidated financial statements as a whole, and in forming our opinion thereon, and we do not provide a separate opinion on these matters.
ANNUAL REPORT 2019 97

PwC
Key audit matter How our audit addressed the key audit matter
Impairment testing of intangible assets
As at 31 December 2019 the total carrying amount of the Group’s non-amortising intangible assets, including masthead brands and brands, amounted to $101.8 million after recording an impairment charge of $175.0 million during the year, as disclosed in note 3.1.1.
The impairment testing of non-amortising intangible assets is considered a Key Audit Matter due to the existence of indicators of impairment including the increased gap between the market capitalisation of the Company and the carrying amount of net assets. There is also a significant level of management judgement applied in estimating the future performance and cash flows of the business and other key assumptions made in determining the recoverable amount.
Management tests for impairment of these assets on an annual basis by preparing a value in use (VIU) assessment, using a discounted cash flow model based on forecast future performance to determine the recoverable amount. Key estimates and assumptions include: • The assessment that the NZME business
constitutes one CGU • The expected future trading results and
cash flows of the business which are based on forecasts approved by the Board of Directors
• The weighted average cost of capital of 9.5% used as the discount rate in the VIU model
• The application of a negative long-term growth rate of 1.2% for the purposes of impairment testing.
Management also assessed recoverable amount on a fair value less costs of disposal (FVLCD) basis. The FVLCD assessment, based on market capitalisation at balance
We gained an understanding of the strategic objectives of the business to assess the appropriateness of using a value in use model. We also gained an understanding of how the business is managed and how the results are reported to management and the directors in order to understand management’s determination that NZME constitutes one CGU.
We gained an understanding of the business process and controls applied by management in their impairment assessment.
We engaged an auditor’s expert to assist us in testing and challenging management’s impairment assessment, including the procedures below:
• We ensured that the impairment model used by management was approved by the Board
• We assessed the Group’s forecasting accuracy by comparing historical forecasts to actual results
• We considered the reasonableness of key assumptions in the cash flow forecasts, in particular revenue growth for each channel, forecast expenses and the terminal growth rate. This was done with reference to the historical performance of the Group, key initiatives being undertaken by both the Group and businesses operating in similar markets, and comparison to third party industry forecasts and available broker reports
• We considered the reasonableness of the discount rate assumption by recalculating it using our own inputs
• We tested the accuracy of the calculations in the VIU model by reperforming the calculation of the recoverable amount and the resulting impairment
• We considered management’s FVLCD assessment based on market capitalisation at balance date and applied our estimate of the appropriate control premium.
We obtained and evaluated management’s sensitivity analysis to ascertain the impact of reasonably possible changes and also considered alternative possible scenarios and their potential impact.
98 NEW ZEALAND MEDIA AND ENTERTAINMENT

PwC
Information other than the consolidated financial statements and auditor’s report The Directors are responsible for the annual report. Our opinion on the consolidated financial statements does not cover the other information included in the annual report and we do not express any form of assurance conclusion on the other information.
In connection with our audit of the consolidated financial statements, our responsibility is to read the other information and, in doing so, consider whether the other information is materially inconsistent with the consolidated financial statements or our knowledge obtained in the audit, or otherwise appears to be materially misstated. If, based on the work we have performed on the other information that we obtained prior to the date of this auditor’s report, we conclude that there is a material misstatement of this other information, we are required to report that fact. We have nothing to report in this regard.
Responsibilities of the Directors for the consolidated financial statements The Directors are responsible, on behalf of the Company, for the preparation and fair presentation of the consolidated financial statements in accordance with NZ IFRS and IFRS, and for such internal control as the Directors determine is necessary to enable the preparation of consolidated financial statements that are free from material misstatement, whether due to fraud or error.
In preparing the consolidated financial statements, the Directors are responsible for assessing the Group’s ability to continue as a going concern, disclosing, as applicable, matters related to going concern and using the going concern basis of accounting unless the Directors either intend to liquidate the Group or to cease operations, or have no realistic alternative but to do so.
date and taking into account that market capitalisation does not include any control premium, indicated a lower recoverable amount. Management considered the reasons for this difference in finalising their assessment of the recoverable amount.
In their assessment management determined that the model was most sensitive to changes in the assumptions relating to the growth rates for print revenue, radio revenue, digital advertising revenue, digital classifieds revenue, digital subscriptions revenue and operating expenses as well as the terminal growth rate and discount rate.
As a result of the impairment review, management identified an impairment in the carrying value of goodwill, masthead brands and brands.
Management also determined that reasonably possible changes in key assumptions could result in further impairment, as disclosed in note 3.1.1.
We reviewed the disclosures in the financial statements to ensure that they are compliant with the requirements of the relevant accounting standards.
We have no other matters to report.
ANNUAL REPORT 2019 99
PwC
Auditor’s responsibilities for the audit of the consolidated financial statements Our objectives are to obtain reasonable assurance about whether the consolidated financial statements, as a whole, are free from material misstatement, whether due to fraud or error, and to issue an auditor’s report that includes our opinion. Reasonable assurance is a high level of assurance, but is not a guarantee that an audit conducted in accordance with ISAs (NZ) and ISAs will always detect a material misstatement when it exists. Misstatements can arise from fraud or error and are considered material if, individually or in the aggregate, they could reasonably be expected to influence the economic decisions of users taken on the basis of these consolidated financial statements.
A further description of our responsibilities for the audit of the financial statements is located at the External Reporting Board’s website at:
https://www.xrb.govt.nz/standards-for-assurance-practitioners/auditors-responsibilities/audit-report-1/
This description forms part of our auditor’s report.
Who we report to This report is made solely to the Company’s shareholders as a body. Our audit work has been undertaken so that we might state those matters which we are required to state to them in an auditor’s report and for no other purpose. To the fullest extent permitted by law, we do not accept or assume responsibility to anyone other than the Company and the Company’s shareholders, as a body, for our audit work, for this report or for the opinions we have formed.
The engagement partner on the audit resulting in this independent auditor’s report is Jonathan Skilton.
For and on behalf of:
Chartered Accountants 24 February 2020
Auckland
100 NEW ZEALAND MEDIA AND ENTERTAINMENT

Registered Address NZME Limited 2 Graham St Auckland 1010 New Zealand
Registred Office Contact Details Postal Address: Private Bag 92198 Victoria St West Auckland 1142 New Zealand
Phone: +64 9 379 5050
Website: www.nzme.co.nz
Email: [email protected]
Auditors PricewaterhouseCoopers
Principal Bankers Westpac
Principal Solicitors Chapman Tripp
Share Registry Link Market Services
Share Registry Contact Details Postal Address: PO Box 91976 Auckland 1142
Street Address: Level 11, Deloitte House 80 Queen Street Auckland
Phone: +64 9 375 5998
Fax: +64 9 375 5990
Website: www.linkmarketservices.co.nz
Email: [email protected]
DIRECTORY
ANNUAL REPORT 2019 101

TUKUTUKU KŌREROEducation Gazette NEW ZEALAND
102 NEW ZEALAND MEDIA AND ENTERTAINMENT