kellogg community college...kellogg community college management’s discussion and an alysis -...
TRANSCRIPT

Kellogg Community College
Financial Report
with Supplementary Information
June 30, 2017

Kellogg Community College
Contents
Report Letter 1-2
Management’s Discussion and Analysis 3-15
Basic Financial Statements
Statement of Net Position 16
Statement of Revenue, Expenses, and Changes in Net Position 17
Statement of Cash Flows 18-19
Discretely Presented Component Unit - Kellogg Community College Foundation 20
Notes to Financial Statements 21-40
Required Supplementary Information 41
Schedule of the College’s Proportionate Share of the Net Pension Liability 42
Schedule of College’s Contributions 42
Other Supplementary Information 43
Combining Statement of Net Position 44-45
Combining Statement of Revenue, Expenses, and Changes in Net Position 46-47
Schedule of General Fund Expenditures 48

Independent Auditor's Report
To the Board of TrusteesKellogg Community College
Report on the Financial Statements
We have audited the accompanying financial statements of Kellogg Community College (the "College")and its discretely presented component unit as of and for the years ended June 30, 2017 and 2016 andthe related notes to the financial statements, which collectively comprise Kellogg Community College'sbasic financial statements as listed in the table of contents.
Management’s Responsibility for the Financial Statements
Management is responsible for the preparation and fair presentation of these financial statements inaccordance with accounting principles generally accepted in the United States of America; this includesthe design, implementation, and maintenance of internal control relevant to the preparation and fairpresentation of financial statements that are free from material misstatement, whether due to fraud orerror.
Auditor’s Responsibility
Our responsibility is to express an opinion on these financial statements based on our audits. Weconducted our audits in accordance with auditing standards generally accepted in the United States ofAmerica and the standards applicable to financial audits contained in Government Auditing Standards,issued by the Comptroller General of the United States. Those standards require that we plan andperform the audit to obtain reasonable assurance about whether the financial statements are free frommaterial misstatement. The financial statements of the discretely presented component unit were notaudited under Government Auditing Standards.
An audit involves performing procedures to obtain audit evidence about the amounts and disclosures inthe financial statements. The procedures selected depend on the auditor’s judgment, including theassessment of the risks of material misstatement of the financial statements, whether due to fraud orerror. In making those risk assessments, the auditor considers internal control relevant to the entity’spreparation and fair presentation of the financial statements in order to design audit procedures that areappropriate in the circumstances, but not for the purpose of expressing an opinion on the effectivenessof the entity’s internal control. Accordingly, we express no such opinion. An audit also includes evaluatingthe appropriateness of accounting policies used and the reasonableness of significant accountingestimates made by management, as well as evaluating the overall presentation of the financial statements.
We believe that the audit evidence we have obtained is sufficient and appropriate to provide a basis forour audit opinions.
Opinions
In our opinion, the financial statements referred to above present fairly, in all material respects, therespective financial position of Kellogg Community College and its discretely presented component unitas of June 30, 2017 and 2016 and the respective changes in its financial position and cash flows, whereapplicable, for the years then ended in accordance with accounting principles generally accepted in theUnited States of America.
1

To the Board of TrusteesKellogg Community College
Other Matters
Required Supplementary Information
Accounting principles generally accepted in the United States of America require that the management'sdiscussion and analysis, schedule of the College's proportionate share of the net pension liability, andschedule of the College's contributions be presented to supplement the basic financial statements. Suchinformation, although not a part of the basic financial statements, is required by the GovernmentalAccounting Standards Board, which considers it to be an essential part of financial reporting for placingthe basic financial statements in an appropriate operational, economic, or historical context. We haveapplied certain limited procedures to the required supplementary information in accordance withauditing standards generally accepted in the United States of America, which consisted of inquiries ofmanagement about the methods of preparing the information and comparing the information forconsistency with management's responses to our inquiries, the basic financial statements, and otherknowledge we obtained during our audit of the basic financial statements. We do not express an opinionor provide any assurance on the information because the limited procedures do not provide us withsufficient evidence to express an opinion or provide any assurance.
Other Information
Our audit was conducted for the purpose of forming opinions on the financial statements that collectivelycomprise the Kellogg Community College's basic financial statements. The other supplementaryinformation, as identified in the table of contents, is presented for purposes of additional analysis and isnot a required part of the basic financial statements.
The other supplementary information, as identified in the table of contents, is the responsibility ofmanagement and was derived from and relates directly to the underlying accounting and other recordsused to prepare the basic financial statements. Such information has been subjected to the auditingprocedures applied in the audit of the basic financial statements and certain additional procedures,including comparing and reconciling such information directly to the underlying accounting and otherrecords used to prepare the basic financial statements or to the basic financial statements themselves,and other additional procedures in accordance with auditing standards generally accepted in the UnitedStates of America. In our opinion, the other supplementary information, as identified in the table ofcontents, is fairly stated in all material respects in relation to the basic financial statements as a whole.
Other Reporting Required by Government Auditing Standards
In accordance with Government Auditing Standards, we have also issued our report dated November 8,2017 on our consideration of the Kellogg Community College's internal control over financial reportingand on our tests of its compliance with certain provisions of laws, regulations, contracts, grantagreements, and other matters. The purpose of that report is to describe the scope of our testing ofinternal control over financial reporting and compliance and the results of that testing, and not to providean opinion on the internal control over financial reporting or on compliance. That report is an integralpart of an audit performed in accordance with Government Auditing Standards in considering KelloggCommunity College's internal control over financial reporting and compliance.
November 8, 2017
2

Kellogg Community College
Management’s Discussion and Analysis - Unaudited
3
The discussion and analysis of Kellogg Community College’s (the “College”) financial statements provides an overview of the College’s financial activities for the years ended June 30, 2017 and 2016. Management has prepared the financial statements and the related note disclosures along with the discussion and analysis. Responsibility for the completeness and fairness of this information rests with the College’s administration.
Using this Report
The College's annual financial report includes the report of independent auditors, the management’s discussion and analysis, basic financial statements, notes to the financial statements, and supplemental information. The basic financial statements are comprised of three components: the statement of net position, the statement of revenue, expenses, and changes in net position, and the statement of cash flows. These financial statements are prepared in accordance with Governmental Accounting Standards Board (GASB) Statement No. 35, Basic Financial Statements - and Management's Discussion and Analysis - for Public Colleges and Universities.
The Kellogg Community College Foundation (the “Foundation”), a separate nonprofit organization, qualifies as a component unit of the College under GASB Statement No. 61, The Financial Reporting Entity: Omnibus. Accordingly, the Foundation’s financial activity has been discretely presented within the accompanying financial statements.
Change in Accounting Principle
As of June 30, 2015, the College was required to adopt GASB No. 68, which requires governments providing defined benefit pensions through a cost-sharing plan to recognize its portion of any unfunded pension benefit obligation as a liability for the first time, and to more comprehensively measure the annual costs of pension benefits.
As the Michigan Public Schools Employees’ Retirement System (MPSERS), in which the College is a participating employer, has an unfunded pension liability, the College has reported a change in accounting principle adjustment to unrestricted net position in the amount of $35.8 million as of July 1, 2014, resulting in an unrestricted net deficit of $26.9 million and reducing the College’s overall net position to $22.5 million.
Financial Highlights
Despite enduring several consecutive years of declining enrollment, the College’s financial position increased during the fiscal years ended June 30, 2017, 2016, and 2015. In 2017 and 2016, the College’s net position increased $3 million (11 percent) and $2.6 million (11 percent), respectively, from the previous year.
The College’s enrollment peaked in 2011 at 4,305 fiscal year equated students (FYES - total credit hours divided by 31). In 2017, as enrollment was challenged across Michigan and the nation, the College’s FYES fell to 2,734, a decrease of approximately 37 percent since the 2011 peak.

Kellogg Community College
Management’s Discussion and Analysis - Unaudited (Continued)
4
The College believes the decline in enrollment is related to a declining population, an improving economy in which fewer students need training or their skills enhanced, and students reaching the limit on their ability to receive federal financial aid. Federal student financial aid has steadily decreased each of the past four years from approximately $32.5 million in 2013 to $15.9 million in 2017, a decrease of 51 percent.
To counter enrollment decreases over the past several years, as well as to keep up with rising operating costs, the College has modestly increased its tuition rates. When FYES decreased 14 percent in 2016, the College’s tuition rate increases were not sufficient to offset the drop in credit hours, resulting in decreasing tuition revenue for the first time in several years. However, in 2017, the College was able to counter the continued enrollment decline with tuition rate increases that resulted in approximately $300,000 more in gross tuition revenue. Also, the College did receive a $2 million increase in state appropriations in the form of a reimbursement for lost property tax revenue as part of a property tax reform by the State of Michigan, exclusive of state appropriations revenues impacted by GASB 68.

Kellogg Community College
Management’s Discussion and Analysis - Unaudited (Continued)
5
The following chart provides a graphical breakdown of net position by category for the fiscal years ended June 30, 2017, 2016, and 2015:
Net Investment inCapital Assets
Scholarshipsand Fellowships
CapitalImprovements
Unrestricted (Deficit)
2017 48.5 0.1 2.9 (22.2)
2016 50.1 0.2 1.7 (25.6)
2015 47.4 0.2 2.3 (26.2)
(40.0)
(30.0)
(20.0)
(10.0)
0.0
10.0
20.0
30.0
40.0
50.0
60.0
Breakdown of Net Position - By Category

Kellogg Community College
Management’s Discussion and Analysis - Unaudited (Continued)
6
The Statement of Net Position and the Statement of Revenue, Expenses, and Changes in Net Position
These two statements will help the reader answer the question, “Is Kellogg Community College, as a whole, better or worse off as a result of the year’s activities?” The statement of net position and the statement of revenue, expenses, and changes in net position report information on the College as a whole and on its activities in a way that helps answer this question. They report the College’s net position and its changes. One can think of net position - the difference between assets and liabilities - as one way to measure the College’s financial health or financial position. Many other nonfinancial factors, such as the trend in admission applicants, student retention, condition of the buildings, and strength of the faculty, need to be considered to assess the overall health of the College. These statements include all assets and liabilities using the accrual basis of accounting, which is similar to the accounting used by most private-sector institutions. All of the current year’s revenue and expenses are taken into account regardless of when cash is received or paid. The following is a comparison of the major components of the statement of net position of the College for the years ended June 30, 2017, 2016, and 2015:
2017 2016 2015
Assets
Current assets 22.7$ 19.3$ 21.9$ Restricted cash 7.6 - - Long-term investments 4.9 4.0 2.1 Capital assets - Net 57.7 58.0 56.4
Total assets 92.9 81.3 80.4
Deferred Outflows of Resources 4.7 4.3 3.5
Total assets and deferred outflows of resources 97.6$ 85.6$ 83.9$
LiabilitiesCurrent liabilities 8.6 9.1 9.9Noncurrent liabilities 57.2 48.3 46.4
Total liabilities 65.8 57.4 56.3
Deferred Inflows of Resources 2.5 1.9 3.9
Total liabilities and deferred inflows of resources 68.3 59.3 60.2
Net PositionNet investment in capital assets 48.5 50.1 47.4Expendable restricted for:
Scholarships and fellowships 0.1 0.2 0.2 Capital improvements 2.9 1.7 2.3
Unrestricted (deficit) (22.2) (25.6) (26.2)
Total net position 29.3 26.3 23.7
Total liabilities, deferred inflows, and net position 97.6$ 85.6$ 83.9$
Statement of Net Position at June 30 (in millions)

Kellogg Community College
Management’s Discussion and Analysis - Unaudited (Continued)
7
Statement of Net Position
The significant changes in the assets and liabilities of the College are as follows:
In 2017 and 2016, current assets and restricted cash increased (decreased) appoximately $11 million and ($2.6) million, respectively. The increase in 2017 was primarily the result of selling approximately $10 million of bonds. The decrease in 2016 resulted from using cash to purchase investments, offset by an increase in accounts receivable related to a large receivable on a state grant.
In 2017, the College had approximately $1 million more in long-term investments than in 2016. Additionally, the College’s investments in its infrastructure were primarily offset by the depreciation of its existing assets. In 2016, the College continued investing in equipment, building, and capital improvement projects, outpacing depreciation of assets.
Current liabilities decreased by $500,000 and $800,000 in 2017 and 2016, respectively. In 2016, the College completed construction of a couple of projects and paid down its accounts payable by $900,000, offset by an increase in accrued retirements due to offering a retirement incentive to encourage staff to retire to reduce the institution’s long-term expenses. During 2017, the decrease was primarily the result of the College paying the amounts due to employees who accepted the retirement incentive in 2016.
Long-term liabilities increased by $8.9 million as the College issued $10 million in bonds in June 2017 to fund some construction projects. The College also retired $1 million of its 2014 bond issue. Long-term liabilities increased $1.9 million in 2016, primarily as a result in the increase of the College’s proportionate share of the MPSERS unfunded liability, net of a reduction in bonds payable and reclassifying some long-term retirement obligations as current as a result of the retirement incentive mentioned above.
Deferred outflows and inflows of resources relate to the MPSERS unfunded net pension liability, with the actuarial determination of its funded status as of September 30, 2016 and 2015 (the “measurement date”), changes in the actuarial assumptions compared to actual results of the plan, and the contributions the College makes into the plan and receives from the State of Michigan after the measurement date.

Kellogg Community College
Management’s Discussion and Analysis - Unaudited (Continued)
8
The following is the detail of the major components of operating results of the College for the years ended June 30, 2017, 2016, and 2015:
2017 2016 2015
Operating RevenueTuition and fees - Net 12.3$ 11.8$ 12.8$ Federal grants and contracts 2.0 2.0 1.8 State grants and contracts 0.5 2.1 0.7 Private gifts, grants, and contracts 2.0 2.0 2.6 Sales and services of auxiliary activities 2.0 2.0 2.5 Other sources 1.1 1.3 1.3
Total operating revenue 19.9 21.2 21.7
Operating ExpensesInstruction 19.6 20.4 21.6 Public service 1.2 0.8 0.9 Instructional support 6.4 6.1 6.3 Student services 9.4 10.3 12.5 Institutional administration 4.3 4.1 4.2 Physical plant operations 4.0 4.2 4.6 Independent operations 1.8 1.8 1.9 Depreciation 2.4 2.3 2.1
Total operating expenses 49.1 50.0 54.1
Operating Loss (29.2) (28.8) (32.4)
Nonoperating Revenue (Expenses)State appropriations 13.8 10.6 11.2Property taxes 12.0 12.7 12.3Federal Pell grant 7.0 7.9 10.4Investment income 0.1 0.1 0.0Loss on disposal of capital assets (0.5) (1.2) (0.1) Interest on capital asset - Related debt (0.3) (0.2) (0.2)
Net nonoperating revenue 32.1 29.9 33.6
Other Revenue - Local capital appropriations 0.1 1.5 -
Increase in Net Position 3.0 2.6 1.2
Net Position - Beginning of year 26.3 23.7 58.3
Adjustment for change in accounting principle - - (35.8)
Net Position - Beginning of year, as restated 26.3 23.7 22.5
Net Position - End of year 29.3$ 26.3$ 23.7$
Operating Results for the Years Ended June 30 (in millions)

Kellogg Community College
Management’s Discussion and Analysis - Unaudited (Continued)
9
Internally, the College accounts for its financial statements using fund accounting, which is then reorganized into operating and nonoperating components for the audited financial statements. The College accounts for its primary programs and operations in its General Fund. The General Fund is primarily financed through four sources of revenue - tuition and fees, state appropriations, property taxes, and other. For this report, these sources of revenue are classified as both operating and nonoperating. The following chart shows the percentage of these sources of revenue as they were reported in the General Fund for the year ended June 30, 2017.
General Fund Revenue - By Source
Tuition and fees39%
Other3%
State appropriations34%
Property taxes24%
Operating Revenue
For the College as a whole, operating revenue includes all transactions that result in the sales and/or receipts from goods and services, such as tuition and fees, and other auxiliary operations, such as bookstore sales. In addition, certain federal, state, and private grants are considered operating if they are not for capital purposes and are considered a contract for services.
The College’s operating revenue decreased by $1.4 million (7 percent) and $400,000 (2 percent) in 2017 and 2016, respectively. The decrease in 2017 was primarily due to one-time funding from the State of Michigan in 2016 for training equipment and loss of rental revenue of $300,000, offset by a $500,000 increase in net tuition and fees. In 2016, the College received $1.6 million more in state grants, as previously mentioned. These increases were offset by a $1 million decrease in net tuition and fees, $600,000 decrease in local grants, and a $500,000 decrease in net sales in the bookstore.

Kellogg Community College
Management’s Discussion and Analysis - Unaudited (Continued)
10
The following is a graphic illustration of operating revenue by source, including all funds of the College:
Operating Revenue - By Source
Private grants and contracts
10%
State grants2%
Other operating6%
Federal grants10%
Tuition and fees62%
Auxiliary10%
Nonoperating Revenue
Nonoperating revenue is all revenue sources that are primarily nonexchange in nature. They consist primarily of state appropriations, property taxes, federal Pell grant revenue, and investment income. Nonoperating revenue increased $2.2 million in 2017 and decreased $3.7 million in 2016.
Due to a number of legislative reforms, the College’s state appropriations, which increased $3.2 million in 2017, comes via several different forms. The state appropriations for College operations increased approximately $100,000. A reimbursement for lost property tax revenue due to tax reforms was received for the first time at $2 million and the increase in state appropriations related to the effects of implementing GASB 68 was $1.1 million. This increase was offset by the loss of personal property tax revenue due to legislative reforms and a $900,000 reduction in federal Pell grants.
In 2016, nonoperating revenue decreased $3.7 million, primarily due to a $2.5 million decrease in federal Pell grants and disposal of assets with $1.2 million of book value. These decreases were offset by $400,000 increases in property taxes and $600,000 in state appropriations (excluding GASB 68 impacts) to the state to help pay down the unfunded MPSERS liability.
The following is a graphic illustration of nonoperating revenue by source:
Nonoperating Revenue - By Source
Property taxes37%
Federal Pell grant21%
State appropriations42%

Kellogg Community College
Management’s Discussion and Analysis - Unaudited (Continued)
11
Operating Expenses
Operating expenses are all the costs necessary to perform and conduct the programs and primary purposes of the College. They include salaries and benefits, utilities, supplies, services, and depreciation and are then categorized by function. Overall, total operating expenses decreased $900,000 and $4.1 million in 2017 and 2016, respectively. In 2017, the declining in enrollment led to a $800,000 decrease in instructional costs, while slight increases in instructional support public service and administration were offset by reductions in student services and facilities costs. Among the reasons for the decrease in 2016 were $2.7 million reduction in student financial aid (primarily federal Pell grants), $1.2 million related to adjustments resulting from GASB 68 activity, and a $700,000 reduction in instructional costs related to the enrollment decrease.
The majority of total expenses are reported internally in the College’s General Fund. The College spent approximately 66 and 67 percent of its General Fund expenditures on instruction and instructional support in 2017 and 2016, respectively. The following is a graphic illustration of operating expenses by source as reported by the General Fund for the year ended June 30, 2017:
General Fund Expenses - By Source
Instruction50%
Operations/maintenance
10%Institutional administration
12%
Student service11% Instructional support
17%

Kellogg Community College
Management’s Discussion and Analysis - Unaudited (Continued)
12
For this financial report, the different funds of the College are netted and internal expenditures are eliminated. The following is a graphic illustration of operating expenses by source for the College as a whole at June 30, 2017:
Operating Expenses - By Source
Independent operations4%
Public service2%
Depreciation5%
Instructional support13%
Student services19%
Instit. Admin.9%
Physical plant operations8%
Instruction40%
Other
Other revenue consists of items that are typically nonrecurring, extraordinary, or unusual to the College. Examples would be state capital appropriations, additions to permanent endowments, and transfers from related entities. In 2017, the College received $79,946 in state capital appropriations. In 2016, the College received a $1.5 million capital gift from a local governmental agency to help with an addition to one of its facilities. The College had no such revenue in 2015.
Statement of Cash Flows
Another way to assess the financial health of the College is to look at the statement of cash flows. Its primary purpose is to provide relevant information about the cash receipts and cash payments of an entity during a period. The statement of cash flows also helps users assess:
An entity’s ability to generate future net cash flows
Its ability to meet its obligations as they come due
Its needs for external financing
2017 2016 2015
Cash (Used in) Provided byOperating activities (25.2)$ (27.4)$ (29.2)$ Noncapital financing activities 30.3 28.5 31.0 Capital and related financing activities 8.0 (2.3) (6.5)
Investing activities (1.7) (2.0) -
Net Increase (Decrease) in Cash and Cash Equivalents 11.4 (3.2) (4.7)
Cash and Cash Equivalents - Beginning of year 10.4 13.6 18.3
Cash and Cash Equivalents - End of year 21.8$ 10.4$ 13.6$
Cash Flows for the Years Ended June 30 (in millions)

Kellogg Community College
Management’s Discussion and Analysis - Unaudited (Continued)
13
Major sources of funds from operations came from student tuition and fees, grants and contracts, and auxiliary activities, which includes the bookstore. These sources were offset by expenditures for operations such as payments to employees and suppliers. Some items of note on the statement of cash flows are as follows:
The net cash used in operating activities decreased $2.2 million and $1.8 million in 2017 and 2016, respectively. In 2017, the decrease was primarily due to increases in cash received from tuition and fees. Increases in cash received from grants and contracts and reductions in expenses were primarily the reason for the decrease in 2016. Overall, the College still utilizes significant cash in its operating activities.
Cash provided by noncapital financing activities increased $1.8 million in 2017 and decreased by $2.5 million in 2016. As stated earlier, large increases in state appropriations due to the loss of property tax revenues drove the increase in 2017. In 2016, the decrease in Pell grants was partially offset by having more property tax and state appropriations.
Cash provided by (used in) capital and related financing activities approximated $8 million and $(2.3) million in 2017 and 2016, respectively. As previously stated, the 2017 bond issue was the primary reason for the increase in that year. And in 2016, the College completed $5.6 million worth of capital projects, offset by an increase in property taxes restricted for capital projects.
Capital Assets
At June 30, 2017, the College had $57.7 million invested in capital assets, net of accumulated depreciation of $42.2 million. Depreciation charges totaled $2.4 million for the current fiscal year.
2017 2016 2015
Land and land improvements 3.5$ 3.3$ 3.3$
Buildings and improvements 78.1 76.9 72.7
Furniture, fixtures, and equipment 16.5 16.5 14.8
Construction in progress 1.8 2.4 4.9
Total 99.9$ 99.1$ 95.7$
Capital Assets at June 30 (in millions)
The College is now in its second phase of an expansion, facility improvement, and renovation project called the 21st Century Project. This initiative was funded with a 15-year millage levy approved by voters in 1998 and expired with the 2012 tax year. The voters of the College’s district approved a 15-year extension of this millage in November 2012 that will generate an estimated $40 million through 2028 to help fund further expansion and improvements to the College’s facilities.

Kellogg Community College
Management’s Discussion and Analysis - Unaudited (Continued)
14
Debt
During 2017, the College issued the Kellogg Community College Building and Site Bonds, Series 2017 in the amount of $9.4 million. The outstanding bonds are noted below.
The table below summarizes this amount by type of debt instrument. The College’s bond ratings are AA- by the Standard & Poors’ Ratings Services.
2017 2016 2015
Bonds, Series 2014 6.7$ 7.7$ 8.7$
Bonds, Series 2017 9.4$ -$ -$
Debt Outstanding at June 30 (in millions)
Economic Factors That Will Affect the Future
The College’s ability to attract students will be its most critical economic factor in the near future. For the first time in several years, the College is reporting enrollment growth in its two most recent semesters. The growth of high school students taking college-level course work has had a dramatic impact on the College’s enrollment and tuition revenue and will likely continue to be a positive driver on the bottom line for at least the next several years. Tuition revenue from these students grew 50 percent in 2017 after a 22 percent increase in 2016. Early indications are that trend will continue as revenue for the 2017 fall semester is approximately 40 percent higher than in 2016.
The State of Michigan has modestly increased its operational support of the College and continues to maintain funding to reduce its educational system’s retirement liability and reimburse the College for lost property tax revenue due to tax reforms enacted in recent years. All funding mechanisms have been beneficial to the College and will be critical for the future. Property values and related tax revenue, after considering the losses due to legislative reforms, has begun to stabilize after decreasing and remaining stagnant in recent years. We are hopeful for that trend to continue in the upcoming years.
However, even with the increases in support from the state and tuition revenue, the enrollment trends mentioned earlier are causing the College to examine its priorities, programs, and structure to make sure it is aligned for future enrollment levels. In 2016, the College offered a retirement incentive to encourage downsizing through attrition. In 2017, this tactic was employed again as more reductions in enrollment were anticipated. This led to $1 million in personnel savings in the 2017 budget and further demonstrated the College’s ability to quickly respond to emerging trends.
Another asset of the College is the voter-approved capital millage renewal in 2012. The College is fortunate to have a dedicated resource to support funding most of its future infrastructure needs, as well as retire its bonded indebtedness.

Kellogg Community College
Management’s Discussion and Analysis - Unaudited (Continued)
15
Despite declining enrollment and excluding the effects of implementing GASB No. 68, the College had a favorable year financially, balancing its budget and investing in its infrastructure and future. Together, with the College’s board, management will continue to monitor enrollment trends, programs, the state and local economies, and react with revenue enhancements and/or further expense containment measures as necessary to ensure that the financial health and stability of the College are preserved.

Kellogg Community College
The Accompanying Notes are an Integral Part of This Statement. 16
Statement of Net Position
2017 2016
Current assets:Cash and cash equivalents (Note 3) 14,124,439$ 10,422,403$ Short-term investments (Note 3) 2,044,049 1,288,664 Accounts receivable - Net (Note 5) 5,013,322 6,547,698
Other current assets 1,447,525 1,061,504
Total current assets 22,629,335 19,320,269
Noncurrent assets:
Restricted cash (Note 3) 7,629,353 - Long-term investments (Note 3) 4,897,755 3,960,393 Capital assets (Note 6) 57,720,939 58,046,978
Total noncurrent assets 70,248,047 62,007,371
Total assets 92,877,382 81,327,640
Deferred Outflows of Resources (Note 8) 4,701,654 4,258,570
Total assets and deferred outflows of resources 97,579,036$ 85,586,210$
Current liabilities:Accounts payable 958,588 841,463 Accrued payroll and related liabilities 1,870,231 1,812,398 Unearned revenue 2,877,521 3,313,795 Bonds payable - Current (Note 7) 995,000 995,000 Unamortized bond premium - Current (Note 7) 66,366 18,129 Accrued retirement and compensated absences - Current (Note 7) 1,020,000 1,400,000 Other current liabilities 765,119 754,297
Total current liabilities 8,552,825 9,135,082
Noncurrent liabilities:Accrued retirement and compensated absences 2,725,000 2,475,000 Bonds payable - Net of current portion (Note 7) 15,120,000 6,740,000 Unamortized bond premium - Net of current portion (Note 7) 641,164 176,924 Net pension liability (Note 8) 38,754,345 38,858,498
Total noncurrent liabilities 57,240,509 48,250,422
Total liabilities 65,793,334 57,385,504
Deferred Inflows of Resources (Note 8) 2,447,590 1,878,459
Total liabilities and deferred outflows of resources 68,240,924 59,263,963
Net PositionNet investment in capital assets 48,527,762 50,076,925 Expendable restricted for:
Expendable scholarships and fellowships 129,920 154,056 Capital improvements 2,889,021 1,678,606
Unrestricted (Deficit) (22,208,591) (25,587,340)
Total net position 29,338,112 26,322,247
Total liabilities, deferred inflows, and net position 97,579,036$ 85,586,210$
June 30
Assets
Liabilities

Kellogg Community College
The Accompanying Notes are an Integral Part of This Statement. 17
Statement of Revenue, Expenses, and Changes in Net Position
2017 2016
Operating Revenue
Tuition and fees - Net of scholarship allowance of $4,094,961 and $4,361,982 for 2017 and 2016, respectively 12,329,412$ 11,772,003$
Federal grants and contracts 2,022,556 1,984,402 State grants and contracts 455,736 2,150,208 Private gifts, grants, and contracts 1,984,533 1,990,031 Sales and services of auxiliary activities - Net of scholarship allowance
of $645,298 and $649,968 for 2017 and 2016, respectively 2,039,102 1,995,546 Other sources 1,096,693 1,344,238
Total operating revenue 19,928,032 21,236,428
Operating ExpensesInstruction 19,535,701 20,393,132 Public service 1,180,292 750,219 Instructional support 6,395,988 6,079,740 Student services 9,430,385 10,326,905 Institutional administration 4,333,264 4,080,832 Physical plant operations 4,028,853 4,291,314 Independent operations 1,820,569 1,816,982 Depreciation 2,400,775 2,295,541
Total operating expenses 49,125,827 50,034,665
Operating Loss (29,197,795) (28,798,237)
Nonoperating Revenue (Expenses)State appropriations 13,796,264 10,629,083 Property taxes 11,973,068 12,762,091 Pell revenue 6,961,555 7,867,325 Investment income 91,531 65,991 Loss on disposal of capital assets (435,141) (1,248,851) Interest on capital asset - Related debt (253,563) (179,308)
Net nonoperating revenue 32,133,714 29,896,331
Income Before Transfers 2,935,919 1,098,094
Other Revenue - Local capital appropriations 79,946 1,500,000
Increase in Net Position 3,015,865 2,598,094
Net Position - Beginning of year 26,322,247 23,724,153
Net Position - End of year 29,338,112$ 26,322,247$
Year Ended June 30

Kellogg Community College
The Accompanying Notes are an Integral Part of This Statement. 18
Statement of Cash Flows
2017 2016
Cash Flows from Operating ActivitiesTuition and fees 12,258,442$ 11,345,071$ Grants and contracts 5,491,838 6,544,305 Payments to suppliers (14,189,594) (17,716,501) Payments to employees (32,141,667) (31,304,681) Auxiliary enterprise charges - Net 2,245,956 1,995,546 Other 1,070,932 1,746,942
Net cash used in operating activities (25,264,093) (27,389,318)
Cash Flows from Noncapital Financing ActivitiesLocal property taxes 9,487,364 10,113,146 Federal direct lending receipts 8,997,897 9,523,918 Federal direct lending disbursements (8,997,897) (9,523,918) Federal Pell grant 6,961,555 7,867,325
State appropriations 13,860,905 10,522,332
Net cash provided by noncapital financing activities 30,309,824 28,502,803
Cash Flows from Capital and Related Financing ActivitiesPurchase of capital assets (2,509,877) (5,245,551) Capital property taxes 2,485,704 2,648,945 Principal paid on capital debt (1,013,130) (995,000)
Capital appropriations 79,946 1,500,000
Proceeds from issuance of capital debt 9,375,000 -
Interest paid on capital debt (439,238) (179,308)
Net cash provided by (used in) capital and related financing activities 7,978,405 (2,270,914)
Cash Flows from Investing ActivitiesSales and maturities of investments - 18,401 Purchases of investments (1,784,278) (2,061,041)
Interest on investments 91,531 65,991
Net cash used in investing activities (1,692,747) (1,976,649)
Net Increase (Decrease) in Cash and Cash Equivalents 11,331,389 (3,134,078)
Cash and Cash Equivalents - Beginning of year 10,422,403 13,556,481
Cash and Cash Equivalents - End of year 21,753,792$ 10,422,403$
Year Ended June 30

Kellogg Community College
The Accompanying Notes are an Integral Part of This Statement. 19
Statement of Cash Flows (Continued)
2017 2016
Reconciliation of Operating Loss to Net Cash from Operating Activities
Operating loss (29,197,795)$ (28,798,237)$ Adjustments to reconcile operating loss to net cash from
operating activities:Depreciation expense 2,400,775 2,295,541 Change in allowance for bad debts 175,000 275,000 Loss on disposal of fixed assets 435,141 1,248,851 Change in deferred inflows and outflows (78,967) (2,793,219) Change in pension liability (104,153) 3,085,836 Decrease (increase) in assets:
Accounts receivable 1,341,815 (2,476,885) Inventories, prepaids, and other assets (386,021) 366,422
Increase (decrease) in liabilities:Accounts payable 117,125 (665,330) Accrued liabilities and other (61,345) 312,805 Unamortized bond premium 530,606 18,179 Unearned revenue (436,274) (258,281)
Net cash used in operating activities (25,264,093)$ (27,389,318)$
Year Ended June 30
There were no significant noncash activities during 2017 or 2016.

Kellogg Community College
The Accompanying Notes are an Integral Part of This Statement. 20
Discretely Presented Component Unit Kellogg Community College Foundation
2017 2016
Assets
Cash and cash equivalents 2,014,741$ 1,533,930$
Contribution receivable 55,000 10,000 Long-term investments 7,388,768 6,849,137
Total assets 9,458,509$ 8,393,067$
Liabilities
Payable to Kellogg Community College 431,308$ 461,632$ Deferred revenue 4,445 -
Total liabilities 435,753 461,632
Net Assets
Unrestricted 2,406,085 2,201,156
Temporarily restricted 2,499,738 1,538,030 Permanently restricted 4,116,933 4,192,249
Total net assets 9,022,756 7,931,435
Total liabilities and net assets 9,458,509$ 8,393,067$
2017 2016
Revenue
Contributions 691,326$ 377,111$
Contributed services 273,952 235,709
Special event revenue 96,512 95,687
Investment income 311,070 447,953 Unrealized and realized gains (losses) on investments 460,114 (1,002,935)
Total revenue 1,832,974 153,525
Expenses
Scholarships and grants expense 391,527 492,375
Management and general 178,618 153,986 Fundraising 171,508 151,739
Total expenses 741,653 798,100
Change in Net Assets 1,091,321 (644,575)
Net Assets - Beginning of year 7,931,435 8,576,010
Net Assets - End of year 9,022,756$ 7,931,435$
May 31
Year Ended May 31
Statement of Activities
Balance Sheet

Kellogg Community College
Notes to Financial Statements June 30, 2017 and 2016
21
Note 1 - Industry Information and Significant Accounting Policies
Reporting Entity - Kellogg Community College (the “College”) is a Michigan community college whose financial statements have been prepared in accordance with generally accepted accounting principles as applicable to public colleges and universities outlined in Governmental Accounting Standards Board (GASB) Statement No. 35 and the Manual for Uniform Financial Reporting - Michigan Public Community Colleges, 2001.
The College reports as a business-type activity, as defined by GASB Statement No. 35. Business-type activities are those that are financed in whole or in part by fees charged to external parties for goods or services.
The accompanying financial statements have been prepared in accordance with criteria established by the Governmental Accounting Standards Board for determining the various governmental organizations to be included in the reporting entity. These criteria include significant operational or financial relationships with the College. Based on application of the criteria, the financial statements of Kellogg Community College Foundation have been discretely presented in Kellogg Community College’s financial statements.
The Kellogg Community College Foundation (the “Foundation”), a nonprofit organization, was formed to solicit, collect, and invest donations made for the promotion of educational activities and capital campaigns at the College. Separate financial statements of the Foundation may be obtained by contacting Kellogg Community College, 450 North Avenue, Battle Creek, MI 49017.
The Foundation is a private nonprofit organization that reports under Financial Accounting Standards Board (FASB) standards. As such, certain revenue recognition criteria and presentation features are different from GASB revenue recognition criteria and presentation features. No modifications have been made to the Foundation’s financial information in the College’s financial reporting entity for these differences. The Internal Revenue Service has determined the Foundation is exempt from federal income taxes under Section 501(c)(3) of the Internal Revenue Code. Accordingly, no provision for income taxes has been recorded.
Significant accounting policies followed by the College are described below to enhance the usefulness of the financial statements to the reader:
Accrual Basis - The financial statements of Kellogg Community College have been prepared on the accrual basis of accounting, whereby revenue is recognized when earned and expenditures are recognized when the related liabilities are incurred and certain measurement and matching criteria are met.
Cash and Cash Equivalents - Cash and cash equivalents consist of all highly liquid investments with an initial maturity of three months or less.
Investments - Investments are recorded at fair value. Level 1 investments are based on quoted market prices and Level 2 investments are recorded using a matrix pricing technique. Matrix pricing is used to value the investments’ relationship to benchmark quoted prices.

Kellogg Community College
Notes to Financial Statements June 30, 2017 and 2016
22
Note 1 - Industry Information and Significant Accounting Policies (Continued)
Restricted Cash - Restricted cash consists of unspent bond proceeds, which are externally restricted for construction or purchase of capital assets.
Property and Equipment - Property and equipment are recorded at cost. Gifts of property are recorded at fair market value at the time gifts are received. Library books are recorded using a historically based estimated value. Expenditures for maintenance and repairs are expensed as incurred. Depreciation is computed using the straight-line method. No depreciation is recorded on land. Expenditures for major renewals and betterments that extend the useful lives of the assets are capitalized. The following estimated useful lives are used to compute depreciation:
Buildings 40 yearsLand improvements and infrastructure 20 yearsFurniture, fixtures, and equipment 5-15 years Unearned Revenue - Revenue received prior to year end that relates to the next fiscal period is recorded as unearned revenue. Unearned revenue consists of approximately $300,000 and $438,000 for the 2017 and 2016 summer semesters, respectively, and approximately $820,000 and $742,000 for the 2017 and 2016 fall semesters, respectively. The remaining amount included in unearned revenue relates to grant funding received during the year that will either be spent in future years or returned to the granting agencies. Unrestricted Net Position - Unrestricted net position represents net positions that are not subject to externally imposed constraints. Unrestricted net position may be designated for specific purposes by action of management or the board of trustees.
Net Investment in Capital Assets - Net investment in capital assets represents capital assets, net of accumulated depreciation, and outstanding principal balances of debt attributable to the acquisition, construction, or improvement of those assets.
Restricted Net Position - Restricted net position represents amounts over which third parties have imposed restrictions that cannot be changed by the board, including amounts that the board has agreed to set aside under contractual agreements with third parties. The restricted balance consists primarily of funds restricted for student loans, scholarships, capital improvements, and other purposes. Generally, the College first applies restricted resources when an expense is incurred for which both restricted and unrestricted resources are available.

Kellogg Community College
Notes to Financial Statements June 30, 2017 and 2016
23
Note 1 - Industry Information and Significant Accounting Policies (Continued)
Scholarship Discounts and Allowances - Student tuition and fee revenue and certain other revenue from students are reported net of scholarship discounts and allowances in the statement of revenue, expenses, and changes in net position. Scholarship discounts and allowances are the difference between the stated charge for goods and services provided by the College, and the amount that is paid by students and/or third parties making payments on the students’ behalf. Certain governmental grants, such as Pell grants, and other federal, state, or nongovernmental programs are recorded as either operating or nonoperating revenue in the College’s financial statements. To the extent that revenue from such programs is used to satisfy tuition and fees and other student charges, the College has recorded a scholarship discount and allowance.
Operating Revenue and Expenses - Revenue and expense transactions are normally classified as operating revenue and expenses when such transactions are generated by the College’s principal ongoing operations. However, most revenue that is considered to be nonexchange, such as tax revenue, federal Pell grant revenue, and state appropriations, is nonoperating revenue.
Revenue Recognition of Tuition and Fees - The academic programs are offered in traditional fall and spring semesters. Revenue from tuition and student fees is recognized during the academic term. Revenue from the summer semester, which commences in May and ends in August, is split and recognized proportionally to the number of days of the semester within the fiscal year. Tuition revenue is reported at established rates net of institutional financial aid and discounts provided directly by the College to students.
Grant Revenue - Revenue from grant and contract agreements is recognized as it is earned through expenditure in accordance with the agreement.
Federal Financial Assistance Programs - The College participates in federally funded Pell grants, SEOG grants, Federal Work Study, and Federal Direct Lending programs. Federal programs are audited in accordance with Title 2 U.S. Code of Federal Regulations Part 200, Uniform Administrative Requirements, Cost Principles, and Audit Requirements for Federal Awards.
During the years ended June 30, 2017 and 2016, the College distributed $8,997,897 and $9,523,918, respectively, for direct lending through the U.S. Department of Education, which is not included as revenue and expenditures on the accompanying financial statements.
Use of Estimates - The preparation of financial statements in conformity with accounting principles generally accepted in the United States of America requires management to make estimates and assumptions that affect certain reported amounts of assets and liabilities and disclosure of contingent assets and liabilities at the date of the financial statements and the reported amounts of revenue, expenses, gains, losses, and other changes in net position during the reporting period. Actual results could differ from those estimates.

Kellogg Community College
Notes to Financial Statements June 30, 2017 and 2016
24
Note 1 - Industry Information and Significant Accounting Policies (Continued)
Pensions - For the purpose of measuring the net pension liability, deferred outflows of resources and deferred inflows of resources related to pensions, and pension expense, information about the fiduciary net position of the Michigan Public School Employees’ Retirement System (MPSERS) and additions to/deductions from MPSERS fiduciary net position have been determined on the same basis as they are reported by MPSERS. MPSERS uses the economic resources measurement focus and the full accrual basis of accounting. Contribution revenue is recorded as contributions are due, pursuant to legal requirements. Benefit payments (including refunds of employee contributions) are recognized as expense when due and payable in accordance with the benefit terms. Related plan investments are reported at fair value. Deferred Outflows of Resources - In addition to assets, the statement of Net position reports a separate section for deferred outflows of resources. This separate financial statement element represents a consumption of net position that applies to a future period and so will not be recognized as an outflow of resources (expense) until then.
Deferred Inflows of Resources - In addition to liabilities, the statement of net position reports a separate section for deferred inflows of resources. This separate financial statement element represents an acquisition of net position that applies to a future period and so will not be recognized as an inflow of resources (revenue) until that time. At June 30, 2017 and 2016, the College’s deferred inflows of resources related to the net pension liability. See Note 8 for more information. Deferred inflows of resources at June 30, 2017 include $1,179,223 for funding received through state appropriations for contributions to the MPSERS pension plan after the measurement date and $1,268,367 related to the pension plan described in Note 8. Deferred inflows of resources at June 30, 2016 include $1,132,143 for funding received through state appropriations for contributions to the MPSERS pension plan after the measurement date and $746,316 related to the pension plan described in Note 8. Adoption of New Standard - For the year ended June 30, 2017, the College implemented GASB Statement No. 77, Tax Abatement Disclosures, which improves disclosure of tax abatement information, such as how the tax abatements affect the College’s financial statements, operations, and ability to raise resources in the future, by reporting (1) the College’s own tax abatement agreements and (2) those entered into by other governments that reduce the College’s tax revenues. See Note 9 regarding the effect of this pronouncement on the College.

Kellogg Community College
Notes to Financial Statements June 30, 2017 and 2016
25
Note 2 - Property Taxes
Property tax revenue is recognized in the year for which taxes have been levied.
Property taxes are levied on July 1 and December 1 based on taxable values as of the preceding December 31. The taxes, which are collected and remitted to the College by townships within the college district boundaries, are collected through February 28. Uncollected real property taxes of the College are turned over to the counties in which the district is located for subsequent collection. The College is subsequently paid 100 percent of delinquent real property taxes through the counties’ tax revolving funds. These payments are usually received within three to five months after the delinquency date.
During the years ended June 30, 2017 and 2016, $2.8636 of tax per $1,000 of taxable property value in the College’s taxing district was levied for general operating purposes on all property. Total operating property tax revenue was $9,487,364 and $10,113,146 for the years ended June 30, 2017 and 2016, respectively.
For capital improvement and debt retirement purposes, $.7500 per $1,000 of taxable property value in the College’s taxing district was levied for the years ended June 30, 2017 and 2016. Total property tax revenue for the retirement of debt related to the 2014 bond issuances and capital improvement projects was $2,485,704 and $2,648,945 for the years ended June 30, 2017 and 2016, respectively.
Note 3 - Cash and Investments
The College considers all highly liquid investments with a maturity of three months or less when purchased to be cash equivalents. The College’s deposits and investments are included on the statement of net position under the following classifications at June 30, 2017 and 2016:
2017 2016
Cash and cash equivalents 14,124,439$ 10,422,403$ Short-term investments 2,044,049 1,288,664 Restricted cash 7,629,353 - Long-term investments 4,897,755 3,960,393
Total cash and investments 28,695,596$ 15,671,460$
The amounts in the previous chart are classified in the following categories:
2017 2016
Cash and cash equivalents 14,117,105$ 10,415,269$ Investments in securities and similar instruments 6,941,804 5,249,057 Unspent bond proceeds 7,629,353 - Petty cash and cash on hand 7,334 7,134
Total cash and investments 28,695,596$ 15,671,460$

Kellogg Community College
Notes to Financial Statements June 30, 2017 and 2016
26
Note 3 - Cash and Investments (Continued)
As of June 30, 2017, the College had the following investments and maturities:
Fair Market
Value
Less Than
One Year 1-5 Years 6-10 Years
More Than 10
Years
Certificates of deposit 4,913,044$ 1,509,159$ 3,403,885$ - $ - $
Notes and bonds 1,993,820 998,660 995,160 - -
Money market 34,940 34,940 - - -
Total 6,941,804$ 2,542,759$ 4,399,045$ - $ - $ As of June 30, 2016, the College had the following investments and maturities:
Fair Market
Value
Less Than
One Year 1-5 Years 6-10 Years
More Than 10
Years
Certificates of deposit 3,127,028$ 1,169,355$ 1,957,673$ - $ - $
Notes and bonds 2,002,720 - 2,002,720 - -
Money market 119,309 119,309 - - -
Total 5,249,057$ 1,288,664$ 3,960,393$ - $ - $
Interest Rate Risk - The College does not have a formal investment policy that limits investment maturities as a means of managing its exposure to fair value losses arising from increasing interest rates. The College does invest in accordance with state law.
Credit Risk - According to state law, the College must limit investments in commercial paper to corporations rated prime by at least one of the standard rating services. The Foundation invests in mutual funds with a long-term growth objective.
At June 30, 2017 and 2016, the College’s investments (notes and bonds) subject to credit risk (interest rate fluctuations) and related ratings consisted of the following:
Market NRSRO Market NRSRO
Value Rating Value Rating
Federal Home Loan Mortgage Corp., 1.05%, 8/10/17 499,950$ Aaa 500,316$ Aaa
Federal Farm Credit Bank,1.12%, 2/22/19 497,005 Aaa 500,019 Aaa
Federal Farm Credit Bank,1.00%, 8/23/18 498,155 Aaa 500,235 Aaa
Kent County Bonds, 1.00%, 4/1/18 498,710 Aaa 502,150 Aaa
Total 1,993,820$ 2,002,720$
20162017
The nationally recognized statistical rating organization (NRSRO) utilized is primarily Moody’s Investors Service.

Kellogg Community College
Notes to Financial Statements June 30, 2017 and 2016
27
Note 3 - Cash and Investments (Continued)
Custodial Credit Risk of Bank Deposits - Custodial credit risk is the risk that in the event of a bank failure, the College’s deposits may not be available or returned. The College does not have a deposit policy for custodial credit risk. At June 30, 2017 and 2016, the carrying amount of the College’s deposits was $27,491,573 and $13,737,993, respectively. Of that amount, $4,131,795 and $2,599,358, respectively, was insured by the Federal Deposit Insurance Corporation and National Credit Union Insurance Fund. The remaining $23,359,598 and $11,138,634 at June 30, 2017 and 2016, respectively, was uninsured and uncollateralized. The College does not require deposits to be insured or collateralized. It is precluded by state law from collateralizing its deposits.
Custodial Credit Risk of Investments - Custodial credit risk is the risk that, in the event of the failure of the counterparty, the College will not be able to recover the value of its investments or collateral securities that are in the possession of an outside party. The College’s investment policy does not address custodial credit risk. All of the investments are, however, in the name of the College, and the investments are held in trust accounts with each financial institution from which they were purchased.
More than 5 percent of the College’s investments at June 30 were invested as follows:
Issuer 2017 2016
Chemical Bank 7% 5%JPMorgan 7% 10%Kellogg Community Federal Credit Union 8% 10%Marshall Community Credit Union 4% 5%Omni Community Credit Union 5% 7%Post Community Credit Union 4% 5%Southern Michigan Bank and Trust 4% 5%United Educational Credit Union 0% 5%Ally Bank 4% 5%Federal Home Loan Bank 7% 10%Federal Farm Credit Bank 14% 19%Kent County Bonds 7% 10%Bank of America 7% 0%
Foundation Investments - Investments at Kellogg Community College Foundation are as follows:
Amortized Cost Fair Value Amortized Cost Fair Value
Mutual funds 7,345,991$ 7,298,954$ 6,759,560$ 6,253,191$
Corporate bonds 74,063 89,814 - -
Exchange-traded products - - 600,052 595,946
Total 7,420,054$ 7,388,768$ 7,359,612$ 6,849,137$
2017 2016

Kellogg Community College
Notes to Financial Statements June 30, 2017 and 2016
28
Note 3 - Cash and Investments (Continued) The Foundation invests in mutual funds with a long-term objective to preserve principal and provide appreciation. Due to the long-term nature of the investments, the Foundation does not limit investment maturities. The Foundation is also not limited to the investing restrictions imposed on the College by state law.
Note 4 - Fair Value Measurements
The college categorizes its fair value measurements within the fair value hierarchy established by generally accepted accounting principles. The hierarchy is based on the valuation inputs used to measure the fair value of the asset. Level 1 inputs are quoted prices in active markets for identical assets; Level 2 inputs are significant other observable inputs; Level 3 inputs are significant unobservable inputs. Investments that are measured at fair value using the net asset value per share (or its equivalent) as a practical expedient are not classified in the fair value hierarchy below.
In instances whereby inputs used to measure fair value fall into different levels in the above fair value hierarchy, fair value measurements in their entirety are categorized based on the lowest level input that is significant to the valuation. The College’s assessment of the significance of particular inputs to these fair value measurements requires judgment and considers factors specific to each asset or liability.
The following tables present information about the College’s assets measured at fair value on a recurring basis at June 30, 2017 and 2016 and the valuation techniques used by the College to determine those values.
Balance at
June 30, 2017
Quoted Prices in
Active Markets
for Identical
Assets
(Level 1)
Significant Other
Observable
Inputs
(Level 2)
Significant
Unobservable
Inputs
(Level 3)
Investments by Fair Value Level
Notes and bonds 1,993,820$ -$ 1,993,820$ -$
Assets Measured at Fair Value on a Recurring Basis at June 30, 2017
Balance at
June 30, 2016
Quoted Prices in
Active Markets
for Identical
Assets
(Level 1)
Significant Other
Observable
Inputs
(Level 2)
Significant
Unobservable
Inputs
(Level 3)
Investments by Fair Value Level
Notes and bonds 2,002,720$ -$ 2,002,720$ -$
Assets Measured at Fair Value on a Recurring Basis at June 30, 2016

Kellogg Community College
Notes to Financial Statements June 30, 2017 and 2016
29
Note 4 - Fair Value Measurements (Continued)
Investments classified in Level 1 are valued using prices quoted in active markets for those securities. Investments classified in Level 2 of the fair value hierarchy are valued using a matrix pricing technique. Matrix pricing is used to value securities based on the securities' relationship to benchmark quoted prices.
The Foundation’s investments classified as Level 1 are valued quoted prices in active markets for identical assets the Foundation has the ability to access. Investments classified in Level 2 of the fair value hierarchy are valued using a matrix pricing technique. Matrix pricing is used to value securities based on the securities' relationship to benchmark quoted prices. The following tables represent the Foundation’s assets measured at fair value on a recurring basis at June 30, 2017 and 2016.
Balance at
June 30, 2017
Quoted Prices in
Active Markets
for Identical
Assets
(Level 1)
Significant Other
Observable
Inputs
(Level 2)
Significant
Unobservable
Inputs
(Level 3)
Investments by Fair Value Level
Mutual funds:
Equity 1,540,003$ 1,540,003$ - $ - $
Fixed income 1,231,008 1,231,008 - -
Balanced 4,527,943 4,527,943 - -
Corporate bonds 89,814 - 89,814 -
Total investments by fair value level 7,388,768$ 7,298,954$ 89,814$ - $
Assets Measured at Fair Value on a Recurring Basis at June 30, 2017
Balance at
June 30, 2016
Quoted Prices in
Active Markets
for Identical
Assets
(Level 1)
Significant Other
Observable
Inputs
(Level 2)
Significant
Unobservable
Inputs
(Level 3)
Investments by Fair Value Level
Mutual funds:
Equity 1,488,076$ 1,488,076$ - $ - $
Fixed income 1,114,175 1,114,175 - -
Balanced 3,650,940 3,650,940 - -
Exchange traded funds 595,946 595,946 - -
Total investments by fair value level 6,849,137$ 6,849,137$ - $ - $
Assets Measured at Fair Value on a Recurring Basis at June 30, 2016

Kellogg Community College
Notes to Financial Statements June 30, 2017 and 2016
30
Note 5 - Accounts Receivable
Accounts receivable consist of the following:
2017 2016
Student and third party $ 4,168,362 $ 3,853,563
Grants and contracts 1,118,065 2,849,364
State appropriations - Operating 2,257,944 2,275,505 Other 668,951 594,266
Total accounts receivable 8,213,322 9,572,698
Less allowance for uncollectibles (3,200,000) (3,025,000)
Net accounts receivable 5,013,322$ 6,547,698$ The College values accounts receivable at gross realizable value. All amounts deemed to be uncollectible are charged directly against income in the period that determination is made.
Note 6 - Capital Assets
Capital asset activity for the year ended June 30, 2017 was as follows:
Beginning
Balance Additions
Transfers/
Disposals
Ending
Balance
Land improvements $ 3,057,791 $ 221,337 $ (23,753) $ 3,255,375 Building and building improvements 76,940,336 2,667,670 (1,555,653) 78,052,353 Furniture, fixtures, and equipment 16,456,332 248,127 (245,445) 16,459,014
Subtotal - Depreciable assets 96,454,459 3,137,134 (1,824,851) 97,766,742
Land 290,602 - - 290,602 Construction in progress 2,404,358 1,712,435 (2,290,590) 1,826,203
Subtotal - Nondepreciable assets 2,694,960 1,712,435 (2,290,590) 2,116,805
Total 99,149,419 4,849,569$ (4,115,441)$ 99,883,547
Less accumulated depreciation:
Land improvements 2,070,876 $ 86,422 $ (23,753) 2,133,545
Building and building improvements 26,952,055 1,718,562 (1,123,049) 27,547,568
Furniture, fixtures, and equipment 12,079,510 595,791 (193,806) 12,481,495
Total accumulated depreciation 41,102,441 2,400,775$ (1,340,608)$ 42,162,608
Capital assets - Net 58,046,978$ 57,720,939$
Kellogg Community College
Notes to Financial Statements June 30, 2017 and 2016
31
Note 6 - Capital Assets (Continued)
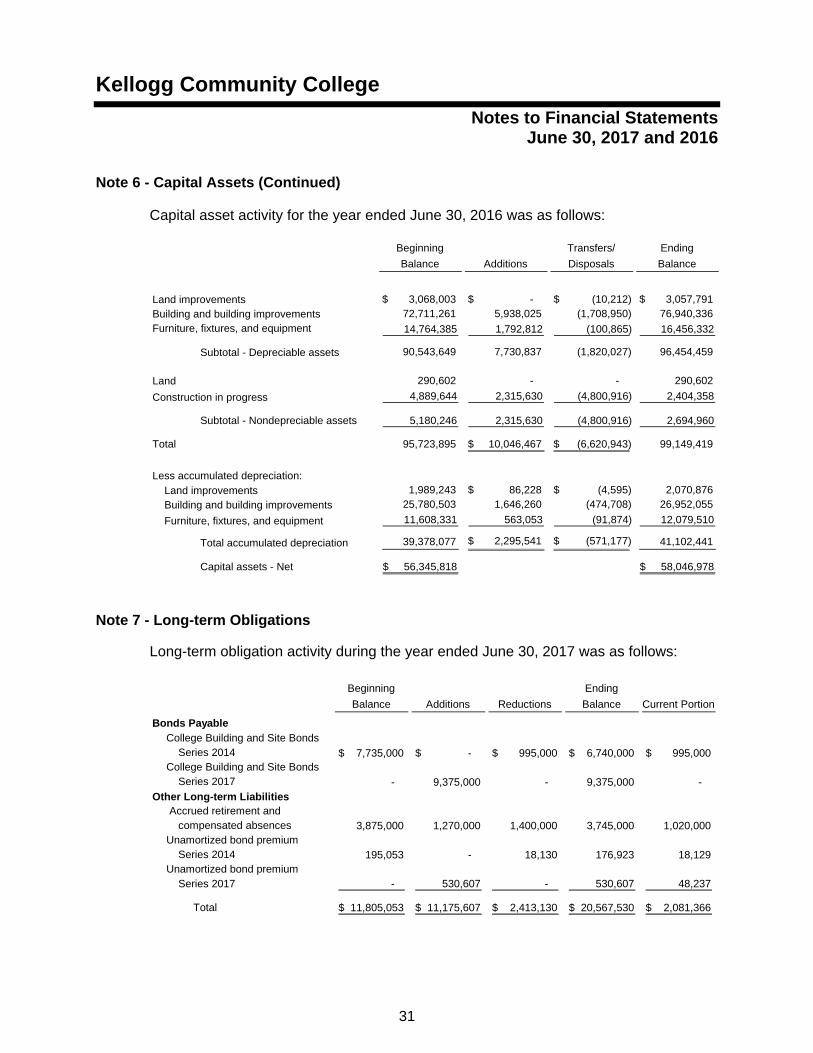
Capital asset activity for the year ended June 30, 2016 was as follows:
Beginning
Balance Additions
Transfers/
Disposals
Ending
Balance
Land improvements $ 3,068,003 $ - $ (10,212) $ 3,057,791 Building and building improvements 72,711,261 5,938,025 (1,708,950) 76,940,336 Furniture, fixtures, and equipment 14,764,385 1,792,812 (100,865) 16,456,332
Subtotal - Depreciable assets 90,543,649 7,730,837 (1,820,027) 96,454,459
Land 290,602 - - 290,602
Construction in progress 4,889,644 2,315,630 (4,800,916) 2,404,358
Subtotal - Nondepreciable assets 5,180,246 2,315,630 (4,800,916) 2,694,960
Total 95,723,895 $ 10,046,467 $ (6,620,943) 99,149,419
Less accumulated depreciation: Land improvements 1,989,243 $ 86,228 $ (4,595) 2,070,876
Building and building improvements 25,780,503 1,646,260 (474,708) 26,952,055
Furniture, fixtures, and equipment 11,608,331 563,053 (91,874) 12,079,510
Total accumulated depreciation 39,378,077 $ 2,295,541 $ (571,177) 41,102,441
Capital assets - Net 56,345,818$ 58,046,978$
Note 7 - Long-term Obligations
Long-term obligation activity during the year ended June 30, 2017 was as follows:
Beginning
Balance Additions Reductions
Ending
Balance Current Portion
College Building and Site Bonds Series 2014 7,735,000$ - $ 995,000$ 6,740,000$ 995,000$
College Building and Site Bonds Series 2017 - 9,375,000 - 9,375,000 -
Other Long-term Liabilities Accrued retirement and
compensated absences 3,875,000 1,270,000 1,400,000 3,745,000 1,020,000 Unamortized bond premium
Series 2014 195,053 - 18,130 176,923 18,129 Unamortized bond premium
Series 2017 - 530,607 - 530,607 48,237
Total 11,805,053$ 11,175,607$ 2,413,130$ 20,567,530$ 2,081,366$
Bonds Payable

Kellogg Community College
Notes to Financial Statements June 30, 2017 and 2016
32
Note 7 - Long-term Obligations (Continued)
Long-term obligation activity during the year ended June 30, 2016 was as follows:
Beginning
Balance Additions Reductions
Ending
Balance Current Portion
College Building and Site Bonds Series 2014 8,730,000$ - $ 995,000$ 7,735,000$ 995,000$
Other Long-term Liabilities Accrued retirement and
compensated absences 3,565,000 310,000 - 3,875,000 1,400,000 Unamortized bond premium
Series 2014 213,232 - 18,179 195,053 18,129
Total 12,508,232$ 310,000$ 1,013,179$ 11,805,053$ 2,413,129$
Bonds Payable -
College Building and Site Bonds, Series 2017 - Bonds issued in June 2017 for $9,375,000. Interest on the bond ranges from 2.00 percent to 3.00 percent and is payable semiannually in April and October. The principal payments range from $410,000 to $1,320,000 with the final principal installment of $1,320,000 due on April 1, 2028. The proceeds from the bonds are expected to be used for capital projects during the period from July 1, 2017 through June 30, 2018.
College Building and Site Bonds, Series 2014 - Bonds issued in March 2014 for $9,750,000. Interest on the bond ranges from 2.00 percent to 3.00 percent and is payable semiannually in April and October. The principal payments range from $490,000 to $995,000 with the final principal installment of $490,000 due on April 1, 2027. The proceeds from the bonds were used for capital projects.
Total principal and interest maturities on the bond payable as of June 30, 2017 are as follows:
Years Ending
June 30 Principal Interest Total
2018 995,000$ 374,465$ 1,369,465$ 2019 1,405,000 414,463 1,819,463 2020 1,415,000 386,362 1,801,362 2021 1,450,000 358,062 1,808,062 2022 1,495,000 320,525 1,815,525
2023-2026 6,275,000 849,988 7,124,988 2027-2028 3,080,000 134,450 3,214,450
Total 16,115,000$ 2,838,315$ 18,953,315$
Debt Obligations

Kellogg Community College
Notes to Financial Statements June 30, 2017 and 2016
33
Note 7 - Long-term Obligations (Continued)
Accrued Retirement and Compensated Absences - The College provides termination benefits upon departure from the College resulting from unused sick time and years of service and defined by each respective labor contract and administrative policy under the vesting method. Under the vesting method, the liability is accrued for employees based on the amount eligible and certain assumptions are used to determine probability of reaching the criteria required for eligibility. Included in the current portion of the accrual is earned but not used vacation and amounts to be provided to employees that will be retiring in the upcoming fiscal year. Management believes these calculations accurately reflect the College’s liability as a result of offering these benefits.
Note 8 - Retirement Plans
Defined Benefit Plan
Plan Description - The College participates in the Michigan Public School Employees’ Retirement System (MPSERS), a statewide, cost-sharing, multiple-employer defined benefit public employee retirement system governed by the State of Michigan that covers substantially all employees of the College. MPSERS provides retirement, survivor, and disability benefits to plan members and their beneficiaries. MPSERS also provides postemployment healthcare benefits to retirees and beneficiaries who elect to receive those benefits.
The Michigan Public School Employees’ Retirement System issues a publicly available financial report that includes financial statements and required supplemental information for MPSERS. That is available on the web at http://www.michigan.gov/orsschools, or by writing to the Office of Retirement System (ORS) at 7150 Harris Drive, P.O. Box 30171, Lansing, MI 48909-7671.
Contributions - Public Act 300 of 1980, as amended, required the College to contribute amounts necessary to finance the coverage of pension benefits of active and retired members. Contribution provisions are specified by state statute and may be amended only by action of the state legislature. Under these provisions, each college’s contribution is expected to finance the costs of benefits earned by employees during the year, with an additional amount to finance a portion of the unfunded accrued liability.
College contributions are determined based on employee elections. There are seven different benefit options included in the plan available to employees based on date of hire. Contribution rates are adjusted annually by the ORS. The range of rates is as follows:
July 1, 2015 – September 30, 2015 18.76% - 23.07% October 1, 2015 – September 30, 2016 14.56% - 18.95% October 1, 2016 – June 30, 2017 15.27% - 19.03%

Kellogg Community College
Notes to Financial Statements June 30, 2017 and 2016
34
Note 8 - Retirement Plans (Continued)
Depending on the plan selected, plan member contributions range from 0 percent up to 6.0 percent of gross wages. Plan members electing into the defined contribution plan are not required to make additional contributions.
The College’s required and actual contributions to the plan for the years ended June 30, 2017 and 2016 were $3,585,329 and $3,699,005, respectively. Contributions include $1,179,223 and $1,132,143 of revenue received from the State of Michigan to fund the MPSERS Unfunded Actuarial Accrued Liability (UAAL) stabilization rate for the years ended June 30, 2017 and 2016, respectively. These funds were also remitted to the plan.
Benefits Provided - Benefit provisions of the defined benefit pension plan are established by state statute, which may be amended. Public Act 300 of 1980, as amended, establishes eligibility and benefit provisions for the defined benefit (DB) pension plan.
Depending on the plan option selected, member retirement benefits are calculated as final average compensation times years of service times a pension factor ranging from 1.25 percent to 1.50 percent. The requirements to retire range from attaining the age of 46 to 60 with years of service ranging from 5 to 30 years, depending on when the employee became a member. Early retirement is computed in the same manner as a regular pension, but is permanently reduced 0.50 percent for each full and partial month between the pension effective date and the date the member will attain age 60. There is no mandatory retirement age. Members are eligible for nonduty disability benefits after 10 years of service and for duty-related disability benefits upon hire. Disability retirement benefits are determined in the same manner as retirement benefits but are payable immediately without an actuarial reduction. The disability benefits plus authorized outside earnings are limited to 100 percent of the participant’s final average compensation with an increase of 2 percent each year thereafter. Benefits may transfer to a beneficiary upon death and are determined in the same manner as retirement benefits, but with an actuarial reduction. Benefit terms provide for annual cost-of-living adjustments to each employee’s retirement allowance subsequent to the employee’s retirement date. The annual adjustment, if applicable, is 3 percent. For some members that do not receive an annual increase, they are eligible to receive a supplemental payment in those years when investment earnings exceed actuarial assumptions.

Kellogg Community College
Notes to Financial Statements June 30, 2017 and 2016
35
Note 8 - Retirement Plans (Continued)
Net Pension Liability, Deferrals, and Pension Expense - At June 30, 2017 and 2016, the College reported a liability of $38,754,345 and $38,858,498, respectively, for its proportionate share of the net pension liability. The net pension liability was measured as of September 30, 2016 and 2015, respectively, and the total pension liability used to calculate the net pension liability was determined by an actuarial valuation as of September 30, 2015 and 2014, respectively, which used updated procedures to roll forward the estimated liability to September 30, 2016 and 2015. The College’s proportion of the net pension liability was based on a projection of its long-term share of contributions to the pension plan relative to the projected contributions of all participating reporting units, actuarially determined. At September 30, 2016, the College’s proportion was 0.15533 percent, a decrease of 0.00376 percent from its proportion measured as of September 30, 2015. At September 30, 2015, the College’s proportion was 0.15909 percent, a decrease of 0.00332 percent from its proportion measured as of September 30, 2014.
For the years ended June 30, 2017 and 2016, the College recognized pension expense of $3,328,858 and $3,119,054 respectively.
The College reported deferred outflows of resources and deferred inflows of resources related to pensions from the following sources:
Deferred Outflows
of Resources
Deferred Inflows of
Resources
Differences between expected and actual experience $ 482,981 (91,849)$ Changes of assumptions 605,894 -
Net difference between projected and actual earnings on pension plan investments 644,097 - Changes in proportion and differentces between college contributions and proportionate share of contributions 2,081 (1,176,518) College contributions subsequent to the measurement date 2,966,601 -
Total 4,701,654$ (1,268,367)$
Deferred Outflows
of Resources
Deferred Inflows of
Resources
Differences between expected and actual experience $ - (128,711)$ Changes of assumptions 956,779 -
Net difference between projected and actual earnings on pension plan assets 198,341 -
Changes in proportion and differences between college contributions and proportionate share of contributions 2,969 (617,605)
College contributions subsequent to the measurement date 3,100,481 -
Total 4,258,570$ (746,316)$
June 30, 2017
June 30, 2016

Kellogg Community College
Notes to Financial Statements June 30, 2017 and 2016
36
Note 8 - Retirement Plans (Continued)
Amounts reported as deferred outflows of resources and deferred inflows of resources related to pensions will be recognized in pension expense as follows:
Year Ending
June 30 Amount
2018 (60,000)$ 2019 (110,712)2020 613,6592021 23,739
Total 466,686$
In addition, the contributions subsequent to the measurement date will be included as a reduction of the net pension liability in the next year (2018). Actuarial Assumptions - The total pension liability as of September 30, 2016 and 2015 is based on the results of an actuarial valuation date of September 30, 2015 and 2014, rolled forward, and was determined using the following actuarial assumptions, applied to all periods included in the measurement: Actuarial cost method Entry age normal cost actuarial cost method
Assumed rate of return 7.00 percent to 8.00 percent, net of investment fees
based on the groups Rate-of-pay increases 3.50 to 12.30 percent, including wage inflation of
3.50 percent Mortality basis RP-2000 Combined Healthy Mortality Table,
adjusted for mortality improvements to 2025 using projection scale AA
Assumption changes as a result of an experience study for the periods 2007 through 2012 have been adopted by the system for use in the annual pension valuations beginning with the September 30, 2014 valuation. Discount Rate - The discount rate used to measure the total pension liability was 7.00 to 8.00 percent, depending on the plan option. The projection of cash flows used to determine the discount rate assumed that employee contributions will be made at the current contribution rate and that employer contributions will be made at contractually required rates. Based on those assumptions, the pension plan’s fiduciary net position was projected to be available to make all projected future benefit payments for current active and inactive employees. Therefore, the long-term expected rate of return on pension plan investments was applied to all periods of projected benefit payments to determine the total pension liability.

Kellogg Community College
Notes to Financial Statements June 30, 2017 and 2016
37
Note 8 - Retirement Plans (Continued)
The long-term expected rate of return on pension plan investments was determined using a building-block method in which best-estimate ranges of expected future real rates of return (expected returns, net of pension plan investment expense and inflation) are developed for each major asset class. These ranges are combined to produce the long-term expected rate of return by weighting the expected future real rates of return by the target asset allocation percentage and by adding expected inflation. The target allocation and best estimates of arithmetic real rates of return for each major asset class are summarized in the following table:
Investment Category
Target
Allocation
Percentage
Long-term
Expected Real
Rate of Return
Target
Allocation
Percentage
Long-term
Expected Real
Rate of Return
Domestic equity pools 28.0% 5.9% 28.0% 4.8%
Private equity pools 18.0% 9.2% 18.0% 8.5%
International equity pools 16.0% 7.2% 16.0% 6.1%
Fixed-income pools 10.5% 0.9% 11.0% 1.5%
Real estate and infrastructure pools 10.0% 4.3% 10.0% 5.3%
Real return, opportunistic, and absolute pools 15.5% 6.0% 16.0% 6.3%
Short-term investment pools 2.0% 0.0% 1.0% -0.2%
Total 100% 100%
September 30, 2016 September 30, 2015
Sensitivity of the Net Pension Liability to Changes in the Discount Rate - The following presents the net pension liability of the College calculated using the discount rate of 7.00 to 8.00 percent, as well as what the College’s net pension liability would be if it were calculated using a discount rate that is 1.00 percentage point lower or 1.00 percentage point higher than the current rate:
2017
1.00 percent decrease
(7.00/6.00 percent)
Current Discount Rate
(8.00/7.00 percent)
1.00 percent increase
(9.00/8.00 percent)
Net pension liability 49,905,842$ 38,754,345$ 29,352,561$
2016
1.00 percent decrease
(7.00/6.00 percent)
Current Discount Rate
(8.00/7.00 percent)
1.00 percent increase
(9.00/8.00 percent)
Net pension liability 50,098,565$ 38,858,498$ 29,382,661$
Pension Plan Fiduciary Net Position - Detailed information about the pension plan’s fiduciary net position is available in the separately issued MPSERS financial report. Changes Since Measurement Date - On February 23, 2017, MPSERS approved a decrease in the discount rate for the September 30, 2016 annual actuarial valuation by 0.5 percent. The actuarial computed employer contributions and the net pension liability for the measurement period ending September 30, 2017 will increase as a result of this change.

Kellogg Community College
Notes to Financial Statements June 30, 2017 and 2016
38
Note 8 - Retirement Plans (Continued)
Payable to the Pension Plan - At June 30, 2017 and 2016, the College reported a payable of $443,651 and $418,568 for the outstanding amount of contributions to the pension plan required for the years ended June 30, 2017 and 2016, respectively, consisting of pension contribution payable plus any other amounts owed to the pension plan including the UAAL payments for July and August 2017 and 2016.
Postemployment Benefits Other than Pension (OPEB) - Under the MPSERS Act, all retirees participating in the MPSERS pension plan have the option of continuing health, dental, and vision coverage through MPSERS. Retirees electing this coverage contribute an amount equivalent to the monthly cost for Part B Medicare and 20 percent of the monthly premium amount for the health, dental, and vision coverage at the time of receiving the benefits. The MPSERS board of trustees annually sets the employer contribution rate to fund the benefits on a pay-as-you-go basis. Participating employers are required to contribute at that rate. The employer contribution rate ranged from 2.20 percent to 2.71 percent of covered payroll for the period from October 1, 2014 through September 30, 2015 and from 6.40 percent to 6.83 percent of covered payroll for the period from October 1, 2015 through September 30, 2016 and from 5.69 percent to 5.91 percent of covered payroll for the period from October 1, 2016 through June 30, 2017, dependent upon the employee’s date of hire and plan election as noted above. Members can choose to contribute 3.00 percent of their covered payroll to the Retiree Healthcare Fund and keep this premium subsidy benefit, or they can elect not to pay the 3.00 percent contribution and instead choose the Personal Healthcare Fund, which can be used to pay healthcare expenses in retirement. Members electing the Personal Healthcare Fund will be automatically enrolled in a 2.00 percent employee contribution into their 457 accounts as of their transition date and create a 2.00 percent employer match into the employees’ 403(b) accounts.
The College’s required and actual contributions to the plan for retiree healthcare benefits for the years ended June 30, 2017, 2016, and 2015 were $765,952, $733,554, and $496,000, respectively.
Defined Contribution Plan
As an alternative pension option, the College offers all full-time faculty and administrative employees the opportunity to participate in the Teachers’ Insurance and Annuity Association - College Retirement Equities Fund (TIAA-CREF). Funding for the plan consists of employer contributions of 10.5 percent and employee contributions of 4.0 percent of covered compensation for the years ended June 30, 2017 and 2016. Benefits vest immediately. Compensation covered under the plan for the years ended June 30, 2017 and 2016 was $7,222,976 and $7,143,716, respectively, resulting in contributions of $767,936 and $750,071, respectively, for the College and $290,583 and $285,749, respectively, for employees.

Kellogg Community College
Notes to Financial Statements June 30, 2017 and 2016
39
Note 9 - Tax Abatements
The College receives reduced property tax revenues as a result of Industrial Facilities Tax exemptions (PA 198 of 1974) and Brownfield Redevelopment Agreements granted by cities, villages, and townships within Barry, Branch, Calhoun, Hillsdale, Kalamazoo, and St. Joseph counties that impact the College. Industrial facility exemptions are intended to promote construction of new industrial facilities, or to rehabilitate historical facilities; Brownfield redevelopment agreements are intended to reimburse taxpayers that remediate environmental contamination on their properties.
For the fiscal year ended June 30, 2017, the College’s property tax revenues were reduced by $57,767 under these programs. The College was unable to obtain tax abatement information for the year ended June 30, 2016.
Note 10 - Kellogg Community College Foundation
The Foundation was incorporated in 1998 and was organized to provide support exclusively for the objectives and purposes of Kellogg Community College and to augment the facilities of the College in such a manner as may be designated by its board of trustees. During the years ended June 30, 2017 and 2016, the Foundation made grants and distributions to and on behalf of the College totalling $391,527 and $492,375, respectively. If the Foundation was dissolved, its remaining assets would be distributed to the College.
The Foundation's net assets include donor-restricted endowment funds, whose purpose is to provide scholarships to students of the College. Net assets associated with these funds are classified and reported based on the existence or absence of donor- or board-imposed restrictions. Permanently restricted endowment net assets are $4,116,933 and $4,192,249 as of June 30, 2017 and 2016, respectively. Excess earnings on the endowments, classified as temporarily restricted, are $2,499,738 and $1,538,030 as of June 30, 2017 and 2016, respectively.
Note 11 - Risk Management
The College is exposed to various risks of loss related to property loss, errors and omissions, and employee injuries (workers' compensation), as well as medical benefits provided to employees. The College has purchased commercial insurance for property loss, errors and omissions, and medical benefits provided to employees and claims relating to employee injuries. Settled claims relating to the commercial insurance have not exceeded the amount of insurance coverage in any of the past three fiscal years.

Kellogg Community College
Notes to Financial Statements June 30, 2017 and 2016
40
Note 11 - Risk Management (Continued)
Self Insurance
The College is self insured for health benefits. The College estimates the liability for medical benefit claims that have been incurred through the end of the fiscal year, including both those claims that have been reported as well as those that have not yet been reported. The College has purchased insurance to protect the College for claims in excess of $35,000.
2017 2016 2015
Estimated liability - Beginning of year 150,000$ 210,000$ 250,000$ Estimated claims incurred, including changes
in estimates (1,001,737) 873,593 907,310 Less claim payments 1,036,737 (933,593) (947,310)
Estimated liability - End of year 185,000$ 150,000$ 210,000$
Note 12 - Upcoming Pronouncement
In June 2015, the GASB issued Statement No. 75, Accounting and Financial Reporting for Postemployment Benefits Other Than Pensions, which addresses reporting for governments that provide postemployment benefits other than pensions (OPEB) to their employees and for governments that finance OPEB for employees of other governments. This OPEB standard will require the College to recognize on the face of the financial statements its proportionate share of the net OPEB liability related to its participation in the Michigan Public School Employees’ Retirement System (MPSERS) plan. This statement also enhances required supplementary information (RSI). The College is currently evaluating the impact this standard will have on the financial statements when adopted. The provisions of this statement are effective for the College’s financial statements for the year ending June 30, 2018.

41
Required Supplementary Information

Kellogg Community College
Required Supplementary Information
42
2016 2015 2014
College’s proportion of the collective MPSERS net pension liability:
As a percentage
Amount $ 38,754,345 $ 38,858,498 $ 35,772,662
College’s covered employee payroll $ 13,306,128 $ 13,571,978 $ 13,936,866
College’s proportionate share of the collective pension liability (amount),
as a percentage of the College’s covered employee payroll
MPSERS fiduciary net position as a percentage of the total pension liability 63.01% 62.92% 66.15%
2017 2016 2015
Statutorily required contribution $ 3,524,952 $ 3,639,846 $ 4,286,250
Contributions in relation to the actuarially determined contractually
required contribution
Contribution deficiency (excess) $ - $ - $ -
Covered employee payroll $ 12,597,901 $ 12,846,838 $ 13,800,928
Contributions as a percentage of covered employee payroll 27.98% 28.33% 31.06%
Notes to Required Supplementary Information
Changes of Benefit Terms - There were no changes of benefit terms for the plan year ended September 30, 2016, 2015, and 2014.
Changes of Assumptions - There were no changes to assumptions for the plan year ended September 30, 2016, 2015, and 2014.
(Amounts were determined as of September 30 of each fiscal year)
Schedule of College's ContributionsMichigan Public School Employees' Retirement Plan
(Amounts were determined as of June 30 of each fiscal year)
0.16241%
256.68%
$ 4,286,250
286.31%
$ 3,639,846
0.15909%
291.25%
$ 3,524,952
0.15533%
Schedule of the College's Proportionate Share of the Net Pension LiabilityMichigan Public School Employees' Retirement Plan

43
Other Supplementary Information

~This Page Intentionally Left Blank ~

Kellogg Community College
44
General Fund MPSERS Fund Auxiliary Fund
Assets
Current assets:Cash and cash equivalents $ 14,124,439 -$ - $Short-term investments 2,044,049 - - Accounts receivable - Net 3,514,614 - 216,879Other current assets 1,056,273 - 391,252
Due (to) from other funds (11,231,074) 1,700,000 1,382,881
Total current assets 9,508,301 1,700,000 1,991,012
Noncurrent assets:Restricted cash - - - Long-term investments 4,897,755 - -
Capital assets - - -
Total noncurrent assets 4,897,755 - -
Total assets 14,406,056 1,700,000 1,991,012
Deferred Outflows of Resources - 4,701,654 -
Total assets and deferred outflows of resources 14,406,056$ 6,401,654$ 1,991,012$
Liabilities
Current liabilities:Accounts payable 956,432$ -$ 2,156Accrued payroll and related liabilities 1,870,231 - -Unearned revenue 1,128,399 - -Bonds payable - Current - - - Unamortized bond premium - Current - - - Accrued retirement and compensated absences - Current 935,000 - 25,000
Other current liabilities 717,621 - 47,498
Total current liabilities 5,607,683 - 74,654
Noncurrent liabilities:
Accrued retirement and compensated 2,725,000 - - Bonds payable - Noncurrent - - - Unamortized bond premium - Noncurrent - - - Net pension liability - 38,754,345 -
Total noncurrent liabilities 2,725,000 38,754,345 -
Total liabilities 8,332,683 38,754,345 74,654
Deferred Inflows of Resources - 2,447,590 -
Net PositionNet investment in capital assets - - - Restricted for:
Nonexpendable endowments - - Expendable scholarships and fellowships - - - Capital improvements - - -
Unrestricted (deficit) 6,073,373 (34,800,281) 1,916,358
Total net position 6,073,373 (34,800,281) 1,916,358
Total liabilities, deferred inflows, and net position 14,406,056$ 6,401,654$ 1,991,012$

45
Combining Statement of Net Position June 30, 2017 (with 2016 comparative totals)
Restricted Fund Plant Fund Fund Total Eliminations
-$ -$ 14,124,439$ -$ 14,124,439$ 10,422,403$ - - 2,044,049 - 2,044,049 1,288,664
1,281,829 - 5,013,322 - 5,013,322 6,547,698 - - 1,447,525 - 1,447,525 1,061,504
657,213 7,490,980 - - - -
1,939,042 7,490,980 22,629,335 - 22,629,335 19,320,269
- 7,629,353 7,629,353 - 7,629,353 - - - 4,897,755 - 4,897,755 3,960,393 - 57,720,939 57,720,939 - 57,720,939 58,046,978
- 65,350,292 70,248,047 - 70,248,047 62,007,371
1,939,042 72,841,272 92,877,382 - 92,877,382 81,327,640
- - 4,701,654 - 4,701,654 4,258,570
1,939,042$ 72,841,272$ 97,579,036$ - $ 97,579,036$ 85,586,210$
-$ -$ 958,588$ -$ 958,588$ 841,463$ - - 1,870,231 - 1,870,231 1,812,398
1,749,122 - 2,877,521 - 2,877,521 3,313,795 - 995,000 995,000 - 995,000 995,000 - 66,366 66,366 - 66,366 18,129
60,000 - 1,020,000 - 1,020,000 1,400,000 - - 765,119 - 765,119 754,297
1,809,122 1,061,366 8,552,825 - 8,552,825 9,135,082
- - 2,725,000 - 2,725,000 2,475,000 - 15,120,000 15,120,000 - 15,120,000 6,740,000 - 641,164 641,164 - 641,164 176,924 - - 38,754,345 - 38,754,345 38,858,498
- 15,761,164 57,240,509 - 57,240,509 48,250,422
1,809,122 16,822,530 65,793,334 - 65,793,334 57,385,504
- - 2,447,590 - 2,447,590 1,878,459
- 48,527,762 48,527,762 - 48,527,762 50,076,925
- - - - - - 129,920 - 129,920 - 129,920 154,056
- 2,889,021 2,889,021 - 2,889,021 1,678,606 - 4,601,959 (22,208,591) - (22,208,591) (25,587,340)
129,920 56,018,742 29,338,112 - 29,338,112 26,322,247
1,939,042$ 72,841,272$ 97,579,036$ - $ 97,579,036$ 85,586,210$
Combined Total
June 30, 2016
Combined Total
June 30, 2017

Kellogg Community College
46
General Fund MPSERS Fund Auxiliary Fund
Operating RevenueTuition and fees - Net of scholarship allowance 15,721,085$ -$ 235,000$ Federal grants and contracts 145,487 - - State grants and contracts - - - Private gifts, grants, and contracts - - - Sales and services of auxiliary activities - Net of scholarship allowance 55,676 - 2,628,724Other sources 1,069,516 - -
Total operating revenue 16,991,764 - 2,863,724
Operating ExpensesInstruction 18,053,373 (12,352) - Public service 166,749 (114) -Instructional support 6,400,367 (4,379) -Student services 3,940,606 (2,696) 360,895Institutional administration 4,336,231 (2,967) -Physical plant operations 3,914,366 (2,678) -Independent operations - - 2,465,867 Depreciation - - -
Total operating expenses 36,811,692 (25,186) 2,826,762
Operating (Loss) Income (19,819,928) 25,186 36,962
Nonoperating Revenue (Expenses)State appropriations 13,740,751 (47,080) 78,383Property taxes 9,487,364 - - Pell revenue - - - Investment income 73,722 - - Gain (loss) on disposal of capital assets - -
Interest on capital asset - Related debt - - -
Net nonoperating revenue (expense) 23,301,837 (47,080) 78,383
Income (Loss) Before Other Revenue 3,481,909 (21,894) 115,345
Other Revenue - Local capital appropriations - - -
Increase in Net Position - Before transfers 3,481,909 (21,894) 115,345
Transfers (3,424,044) 1,700,000 -
Increase (Decrease) in Net Position 57,865 1,678,106 115,345
Net Position - Beginning of year 6,015,508 (36,478,387) 1,801,013
Net Position - End of year 6,073,373$ (34,800,281)$ 1,916,358$

47
Combining Statement of Revenue, Expenses, and Changes in Net Position
Year Ended June 30, 2017 (with 2016 comparative totals)
Restricted Fund Plant Fund Total Eliminations
Combined Total
June 30, 2017
Combined Total
June 30, 2016
468,288$ -$ 16,424,373$ (4,094,961)$ 12,329,412$ 11,772,003$ 1,877,069 - 2,022,556 - 2,022,556 1,984,402
455,736 - 455,736 - 455,736 2,150,208 1,984,533 - 1,984,533 - 1,984,533 1,990,031
- - 2,684,400 (645,298) 2,039,102 1,995,546 27,177 - 1,096,693 - 1,096,693 1,344,238
4,812,803 - 24,668,291 (4,740,259) 19,928,032 21,236,428
1,494,680 - 19,535,701 - 19,535,701 20,393,132 1,013,657 - 1,180,292 - 1,180,292 750,219
- - 6,395,988 - 6,395,988 6,079,740 9,226,541 - 13,525,346 (4,094,961) 9,430,385 10,326,905
- - 4,333,264 - 4,333,264 4,080,832 - 117,165 4,028,853 - 4,028,853 4,291,314 - - 2,465,867 (645,298) 1,820,569 1,816,982 - 2,400,775 2,400,775 - 2,400,775 2,295,541
11,734,878 2,517,940 53,866,086 (4,740,259) 49,125,827 50,034,665
(6,922,075) (2,517,940) (29,197,795) - (29,197,795) (28,798,237)
24,210 - 13,796,264 - 13,796,264 10,629,083 - 2,485,704 11,973,068 - 11,973,068 12,762,091
6,961,555 - 6,961,555 - 6,961,555 7,867,325 - 17,809 91,531 - 91,531 65,991
9,100 (444,241) (435,141) - (435,141) (1,248,851) - (253,563) (253,563) - (253,563) (179,308)
6,994,865 1,805,709 32,133,714 - 32,133,714 29,896,331
72,790 (712,231) 2,935,919 - 2,935,919 1,098,094 - 79,946 79,946 - 79,946 1,500,000
72,790 (632,285) 3,015,865 - 3,015,865 2,598,094
(96,926) 1,820,970 - - - -
(24,136) 1,188,685 3,015,865 - 3,015,865 2,598,094
154,056 54,830,057 26,322,247 - 26,322,247 23,724,153
129,920$ 56,018,742$ 29,338,112$ -$ 29,338,112$ 26,322,247$

Kellogg Community College
48
Schedule of General Fund Expenditures Year Ended June 30, 2017
(with comparative totals for the year ended June 30, 2016)
Salaries and
Related
Expenses Other Expenses Equipment
June 30, 2017
Total
June 30, 2016
Total
InstructionGeneral education 6,504,817$ 715,515$ - $ 7,220,332$ 7,374,467$ Business and human services 2,377,857 306,551 - 2,684,408 3,303,474 Technical and industrial trades 1,297,632 326,239 - 1,623,871 1,943,861 Health occupations 4,470,414 778,656 - 5,249,070 5,341,101 Developmental and basic skills 966,177 73,717 - 1,039,894 1,084,324 Human development 55,463 4,051 - 59,514 101,122 Personal interest 159,964 16,320 - 176,284 131,595
Equipment - - - - -
Total instruction 15,832,324 2,221,049 - 18,053,373 19,279,944
Public Service 163,037 3,712 - 166,749 174,978
Instructional Support 5,462,976 937,391 - 6,400,367 6,217,996
Student ServicesStudent services programs and administration 2,472,381 388,714 - 2,861,095 2,703,938 Financial aid 558,120 399,786 - 957,906 1,046,668 Intercollegiate athletics 113,328 8,277 - 121,605 118,686
Total student services 3,143,829 796,777 - 3,940,606 3,869,292
Institutional AdministrationInstitutional administration 2,558,500 1,772,987 - 4,331,487 4,173,632
Equipment - - 4,744 4,744 -
Total institutional administration 2,558,500 1,772,987 4,744 4,336,231 4,173,632
Physical Plant OperationsPhysical plant operations 968,632 1,667,447 - 2,636,079 2,855,692 Energy services - 800,562 - 800,562 777,600 Campus security 190,125 282,779 - 472,904 408,118
Equipment - - 4,821 4,821 -
Total physical plant operations 1,158,757 2,750,788 4,821 3,914,366 4,041,410
Total expenditures 28,319,423$ 8,482,704$ 9,565$ 36,811,692$ 37,757,252$