kenji yamaji, director-general · policy trends of japan and the world, and scenarios of long-range...
TRANSCRIPT

Policy trends of Japan and the world, and Scenarios of long-range strategy for deep CO2 emission reduction
Kenji YAMAJI, Director-GeneralResearch Institute of Innovative Technology for the Earth(RITE)
ALPS International Symposium (FY 2018)
Feb.19, 2019@Toranomon Hills Forum, Tokyo
1

Policy Trends of Japan and the World
Paris Agreement (framework after 2020 covering all major countries):Adopt(2015) → Effective(2016) → Implementation scheme(2018;exc. market mkm)
2
Schedule for Future :June 2019:G20 in Japan、long-term low emission develop. strategy?Nov. 2019(COP25):rule for market mechanismNov. 2020(COP26):limit for submission of NDC for 2030Nov. 2020:election of US President、US exit?、(G7 in the USA)Nov. 2022:technical review for global stocktakeDec. 2023:high level event for global stocktakeEnd of 2024:1st biennial report of Paris Agreement due2025:submission of second NDC
IPCC 1.5℃ Special Report (2018):net zero emission required in 2050
5th Strategic Energy plan of Japan decided in July, 2018:Target for 2030 maintained、Vision for 2050 as an ambitious goal
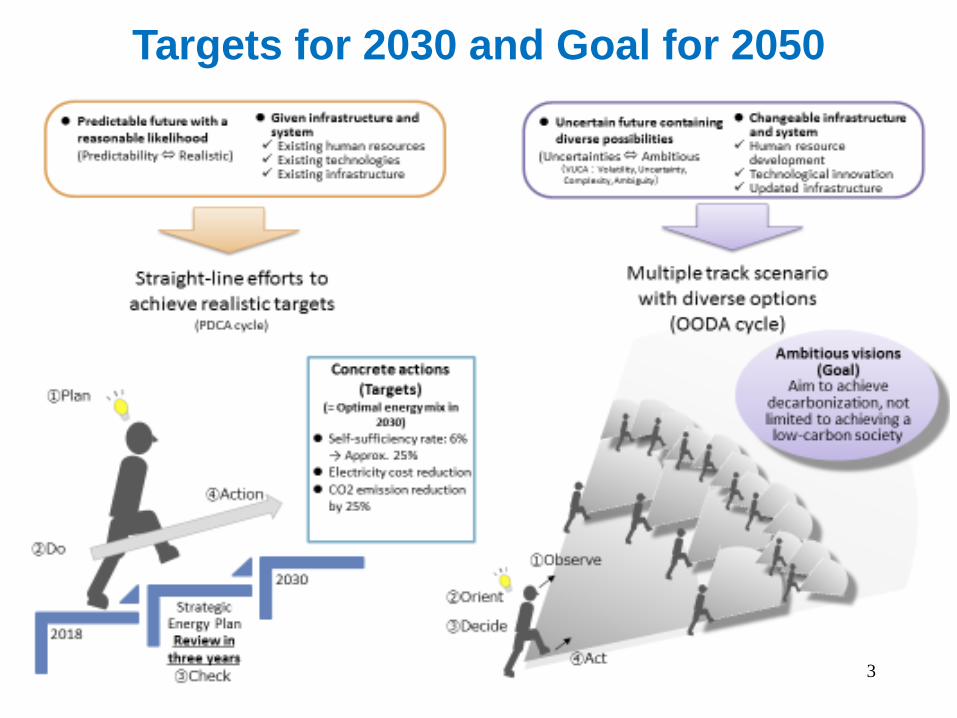
Targets for 2030 and Goal for 2050
3
4
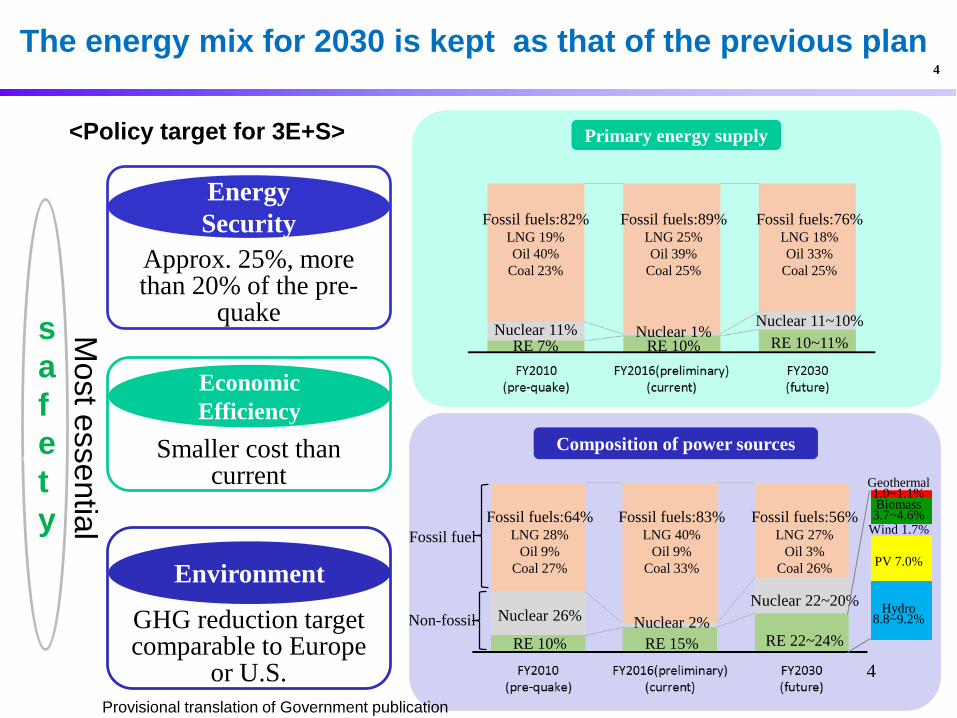
The energy mix for 2030 is kept as that of the previous plan
<Policy target for 3E+S>
Most essential
Approx. 25%, more than 20% of the pre-
quake
Smaller cost than current
GHG reduction target comparable to Europe
or U.S.
Safety
Energy Security
Economic Efficiency
Environment
Primary energy supply
Composition of power sources
RE 7%Nuclear 11%
Fossil fuels:82%LNG 19%Oil 40%
Coal 23%
RE 10%Nuclear 1%
Fossil fuels:89%LNG 25%Oil 39%
Coal 25%
RE 10~11%Nuclear 11~10%
Fossil fuels:76%LNG 18%Oil 33%
Coal 25%
RE 10%
Nuclear 26%
Fossil fuels:64%LNG 28%
Oil 9%Coal 27%
RE 15%Nuclear 2%
Fossil fuels:83%LNG 40%
Oil 9%Coal 33%
RE 22~24%
Nuclear 22~20%
Fossil fuels:56%LNG 27%
Oil 3%Coal 26%
Geothermal1.0~1.1%Biomass3.7~4.6%
Wind 1.7%
PV 7.0%
Hydro8.8~9.2%
Fossil fuel
Non-fossil
Provisional translation of Government publication
4
safety

5
Direction of energy trend in Japan towards 2050- Key points of Recommendations by the Round Table for Studying Energy Situations -
Source) Government data
5
Possibility → Ambitious scenario: Energy transitions toward decarbonization
Uncertainty → Multiple track scenario: Seeking possibility in all choices
Unclarity → Scientific review mechanism: Flexible determination of priority
■ Energy transitions under complex uncertain environments
→ Sophistication of 3E+S
Safety at the top priority → Enhancement of safety through innovations by technologies
and governance reforms
Energy Security: Resource self-sufficiency rates → Improvement of technology self-
sufficiency rates + Securement of diversity of energy options
Environmental friendliness → Taking on decarbonization
Economy: Curbing public burdens → Enhancement of domestic industrial competitiveness
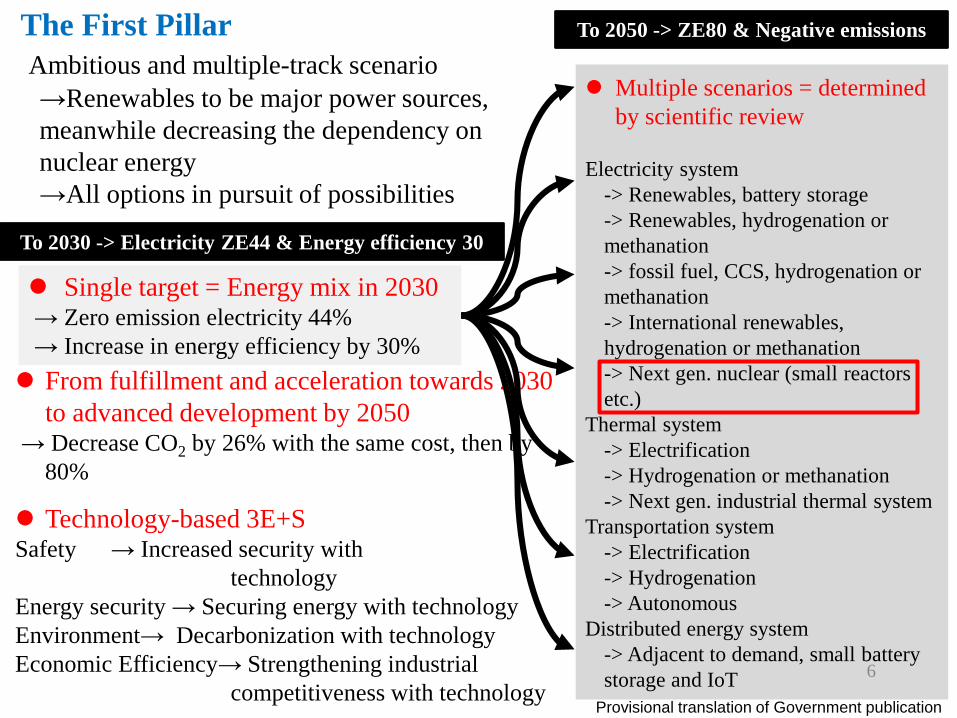
Multiple scenarios = determined by scientific review
Electricity system-> Renewables, battery storage-> Renewables, hydrogenation or methanation-> fossil fuel, CCS, hydrogenation or methanation-> International renewables, hydrogenation or methanation-> Next gen. nuclear (small reactors etc.)
Thermal system-> Electrification-> Hydrogenation or methanation-> Next gen. industrial thermal system
Transportation system-> Electrification-> Hydrogenation-> Autonomous
Distributed energy system-> Adjacent to demand, small battery storage and IoT 6
The First PillarAmbitious and multiple-track scenario→Renewables to be major power sources, meanwhile decreasing the dependency on nuclear energy→All options in pursuit of possibilities
To 2030 -> Electricity ZE44 & Energy efficiency 30
From fulfillment and acceleration towards 2030 to advanced development by 2050
→ Decrease CO2 by 26% with the same cost, then by80%
Technology-based 3E+SSafety → Increased security with
technologyEnergy security → Securing energy with technologyEnvironment→ Decarbonization with technologyEconomic Efficiency→ Strengthening industrial
competitiveness with technology
To 2050 -> ZE80 & Negative emissions
Single target = Energy mix in 2030→ Zero emission electricity 44%→ Increase in energy efficiency by 30%
Provisional translation of Government publication

7
The Second PillarIntroduction of Scientific Review Mechanism
→Priority of energy option will be determined considering leading-edge technologies and situations
Shift from verification of electricity generation to that of system cost<Generation costs>
¥12 ¥14¥22
¥24
¥8~9 ¥7
Nuclear Coal LNG Wind(onshore)
PV(utility)
¥10~
Thermal Renewables*Cost data based on Power generation cost verification WG*Costs of thermal based on model plant in 2014*Target costs for RE in 2030
Increased safety, economy and
flexibility
Zero emission with hydrogenation or
methanationThermal-independent
and zero emission with battery storage and
hydrogenNuclear Fossil fuel
for hydro-genation
Fossil fuelfor metha-
nation
RE to battery storage
RE to hydrogen
~¥200
¥70
¥30
¥10~
~¥130
<System costs>
Benchmark cost(¥10 for base load)
Renewables are calculated with a cost of ¥7/kWh
2030=single target (energy mix) -> must be fulfilledExisting technologies -> securing safety, maintaining cost, increasing self sufficiency, decreasing emission by 26%
2050=multiple scenarios -> with all strength, immediate startInnovative technologies -> innovating safety, increasing competitiveness, energy security, decreasing emission by 80%
Scientific review for energy transition by every 2 to 3 yearsDetermine priority issues in light of latest technological and geopolitical situation
Provisional translation of Government publication

8
Third-pillar: All-out efforts Actions aligned with world, finance, and industry
Energy Scientific review Decision on priority ofBig data Mechanism energy choices
Review cycleReview➡Project, international cooperation, financial dialogue,
policies➡Structural transformation
Project on energy transformation/de-carbonization➡ industry-government-academiacollaboration
(Unified understanding of technological maturity by examining systems costs)Renewable energy
Storage of electricity fossil
HydrogenNext-generationNuclear power
Industrial Process Decentralization
International alliance for energy transformation/de-carbonization➡Cooperation among resource-rich countries, emerging countries and developed countriesEnergy finance dialogue➡ Cooperation with financial sectors
Energy transformation/de-carbonization policiesStrengthening
energy industriesReorganizing
energy infrastructureStructural reforms in
energy system

Structure of Climate Change Response
Human Needs
Human Activities
Energy・Material・Information/Human Activities
CO2 Emission/Energy・Material・Information
CO2 Concentration/CO2 Emission
Temp. Rise/GHG Concentration
Impact of Climate Change/Temp. Rise
Residual Damage by Climate Change
Change of Society and Behavior
Energy Efficiency ↑Material Efficiency ↑
Low Carbon EnergyLow Carbon Material+low carbon information
CCS, CCU
Afforestation、DAC
Climate Control(SRM etc.)
Adaptation to Climate Impact
Mitigation( CO2 Reduction )
Adaptation
Climate Engineering(Geoengineering)
Source:Kenji Yamaji, 2006:「Theory of 3E Systems Analysis」, Iwanami-Shoten (in Japanese) + modifications by KY
Emission of Non CO2 GHG
Society 5.0
9
ICT replace Ene./Mat.

-10
0
10
20
30
40
50
2010 2060 2110 2160 2210 2260
CO
2em
issi
onis
[GtC
O2/
yr]
Business as Usual (BaU)
Submitted NDCs
+2℃ stabilization under climate sensitivity of 2.5℃ (No exceedance of 580 ppm)+2℃ stabilization under climate sensitivity of 3.0℃ (No exceedance of 500 ppm)450 ppm CO2eq stabilization
Submitted NDCs23002050 2100
10
Global CO2 emission profiles toward 2300for the 2 °C targets
- The global CO2 emissions should be nearly zero for a long period of time in the far future in any pathway to achieve temperature stabilization.
- On the other hand, the allowable global CO2 emissions toward the middle of this century have a wide range according to the uncertainties in climate sensitivity (or achieving probability) even when the temperature target level is determined as a 2 °C. We should use this flexibility to develop several kinds of innovative technologies and societies.
Estimated by RITE using MAGICC and DNE21+
(the middle socioeconomic scenario)
10

11
The relationship between baseline emissions due to different socioeconomic scenarios and those for 2 °C goals
Baseline emission range of SSPs
2 °C goal(>66% & >50%)
- There are large uncertainties in baseline emissions due to uncertainties insocioeconomic conditions. The uncertainty ranges are much larger than those fordifferent target levels of temperature (e.g., ±0.5 °C, that is, 1.5 to 2.5 °C target).
- It is significant to achieve low emissions in baseline, that is, technologies with netnegative costs achieving such low emissions.
SSP: Shared Socioeconomic Pathway(used for IPCC scenario analyses etc.)
11

0
5000
10000
15000
20000
25000
2010 Baseline World total:▲40% World total:▲70%
Prim
ary
ener
gy s
uppl
y[M
toe/
yr]
Solar thermal
Solar PV
Wind power
Nuclear power
Hydro + Geothermal
Biomass w/ CCS
Biomass w/o CCS
Gas w/ CCS
Gas w/o CCS
Oil w/ CCS
Oil w/o CCS
Coal w/ CCS
Coal w/o CCS
0
2000
4000
6000
8000
10000
12000
14000
16000
18000
20000
2010 Baseline World total:▲40% World total:▲70%
Fina
l ene
rgy
cons
umpt
ion
[Mto
e/yr
]Electricity
Heat:CGS
Gaseous fuel:Hydrogen
Gaseous fuel:Gas
Liquid fuel:Bio fuel
Liquid fuel:Oil
Solid fuel:Biomass
Solid fuel:Coal
12
Primary energy supply and final energy consumption (World, 2050)
Japan: ▲65%
For 70% GHG mitigation:・considerable BECCS is required・significant reduction on oil and gas・electrification ratio should be increased for cost-effective measures
Primary energy supply
Final Energy Consumption
BECCS Electrification to decarbonize electricity
12
0
10000
20000
30000
40000
50000
60000
2010 Baseline World total:▲40% World total:▲70%
Ele
ctric
ity g
ener
atio
n[T
Wh/
yr]
Hydrogen (Co-firing)
Hydrogen(Single-fuel firing)Solar thermal
Solar PV
Wind power
Nuclear power
Hydro + Geothermal
Biomass (Co-firing)w/ CCSBiomass (Single-fuel firing)w/ CCSBiomass (Co-firing)w/o CCSBiomass (Single-fuel firing)w/o CCSGas w/ CCS
Gas CGS
Gas w/o CCS
Oil w/ CCS
Oil w/o CCS
Coal w/ CCS
Coal w/o CCS
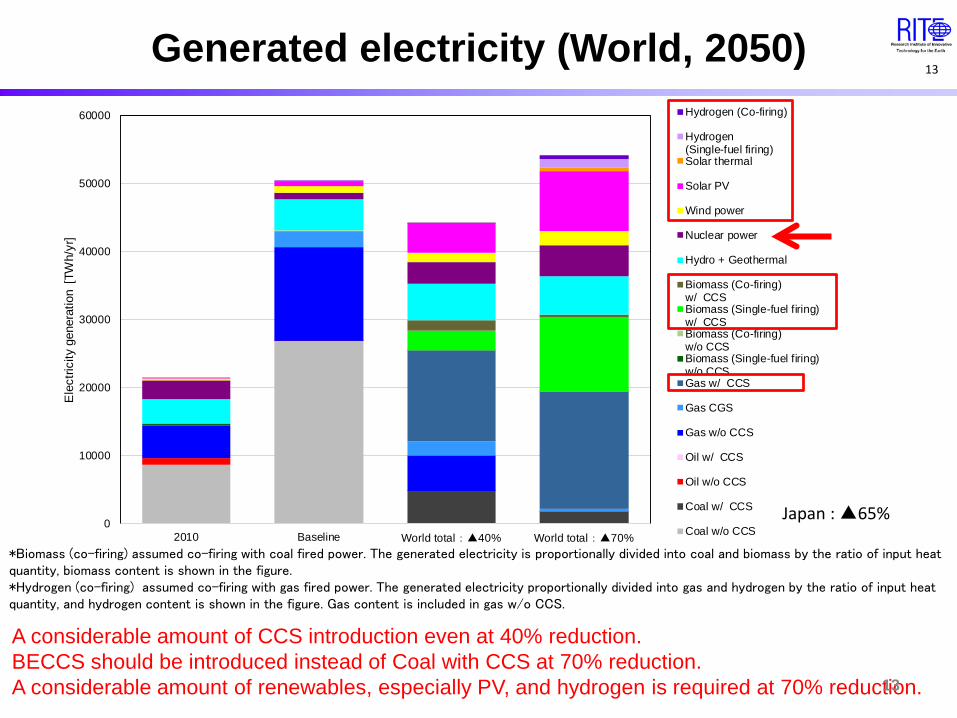
13Generated electricity (World, 2050)
*Biomass (co-firing) assumed co-firing with coal fired power. The generated electricity is proportionally divided into coal and biomass by the ratio of input heat quantity, biomass content is shown in the figure.*Hydrogen (co-firing) assumed co-firing with gas fired power. The generated electricity proportionally divided into gas and hydrogen by the ratio of input heat quantity, and hydrogen content is shown in the figure. Gas content is included in gas w/o CCS.
Japan : ▲65%
A considerable amount of CCS introduction even at 40% reduction.BECCS should be introduced instead of Coal with CCS at 70% reduction.A considerable amount of renewables, especially PV, and hydrogen is required at 70% reduction.13

14
USA
Japan
Germany
China
UK
France
2000 2009 2015
9.0t
15.5t
5.2t
7.4t
5.3t
8.9t
8.3t
16.7t
6.0t
8.8t
2.5t
10.0t
9.0t
20.0t
8.9t
6.6t
6.0t
4.4t
-3.3
-0.8
-1.4
-1.1
-3.3
-0.7
-1.4
-0.8
±0
Changes in per capita CO2 emissions in major countriesCO2 emissions in Japan rise after the earthquake.In Germany, CO2 reductions are sluggish, while UK and France steadily reduce.China’s CO2 emissions has increased to the comparable level of developed countries, while the US tends to decline, the level is still high.
*
* Adjusted by coal-fired power to increase renewables ⇒ No CO2 reduction14
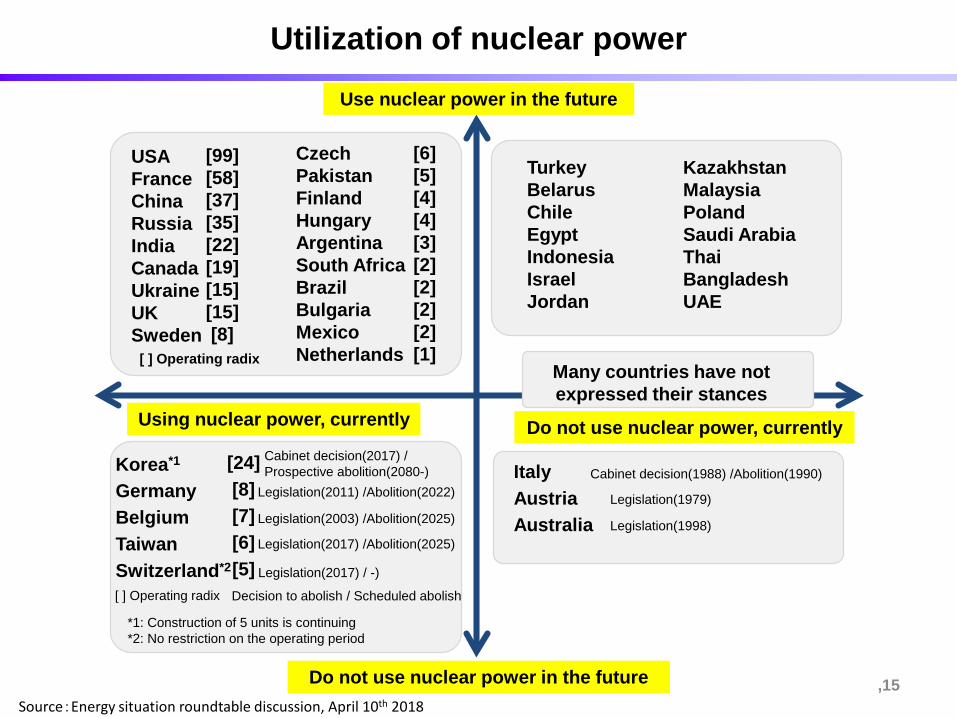
Source:Energy situation roundtable discussion, April 10th 2018,15
USA France China RussiaIndiaCanadaUkraineUKSweden
CzechPakistanFinlandHungaryArgentinaSouth AfricaBrazilBulgariaMexicoNetherlands
TurkeyBelarusChileEgyptIndonesiaIsraelJordan
KazakhstanMalaysiaPolandSaudi ArabiaThaiBangladeshUAE
Korea*1
GermanyBelgiumTaiwanSwitzerland*2
ItalyAustriaAustralia
[99][58][37][35][22][19][15][15][8]
[6][5][4][4][3][2][2][2] [2][1]
[24][8][7][6][5]
Cabinet decision(2017) /Prospective abolition(2080-)
Legislation(2011) /Abolition(2022)
Legislation(2003) /Abolition(2025)
Legislation(2017) /Abolition(2025)
Legislation(2017) / -)
[ ] Operating radix
[ ] Operating radix Decision to abolish / Scheduled abolish
*1: Construction of 5 units is continuing*2: No restriction on the operating period
Cabinet decision(1988) /Abolition(1990)
Legislation(1979)
Legislation(1998)
Many countries have not expressed their stances
Do not use nuclear power, currentlyUsing nuclear power, currently
Use nuclear power in the future
Do not use nuclear power in the future
Utilization of nuclear power

Impacts of “Super Smart Society” (Society 5.0)
16
Society 5.0 is capable of providing the necessary goods and services to the people who need them at the required time and in just the right amount; a society that is able to respond precisely to a wide variety of social needs; a society in which all kinds of people can readily obtain high‐quality services, overcome differences of age, gender, region, and language, and live vigorous and comfortable lives.
Society 5.0 is characterized by the sophisticated integration of cyberspace with physical space (“the real world”)
Beyond energy saving, Society 5.0 promotes sharing economy to shift the industry from manufacturing to service providers leading to a ultimate circular society.
1) car/ride share → car ↓ → car productions ↓ → material needs ↓ → energy/CO2 ↓2) smart maintenance → component replace↓ → material needs ↓ → energy/CO2 ↓3) IC tag for all component → recycling rate ↑ → material needs ↓ → energy/CO2 ↓
Information replaces Material

Source: METI, “Connected Industries” Tokyo Initiative, October 2017 17
⇒ Sharing Economy, Circular Economy, …

18(Sources): Sugiyama (2017), SCJ (Science Council of Japan) symposium, Sept. 27, 2017
There are a lot of things in every sector we can reduce.
Operating rate of automobiles: 4%
Vacant houses: 13%
More than half of the people have leftover medicine.
One third of foods are wasted.
Twenty-two pieces of unused clothing in women’s closet
40% of rooms in hotel is unoccupied.
(Lacy and Rutqvist (2015))
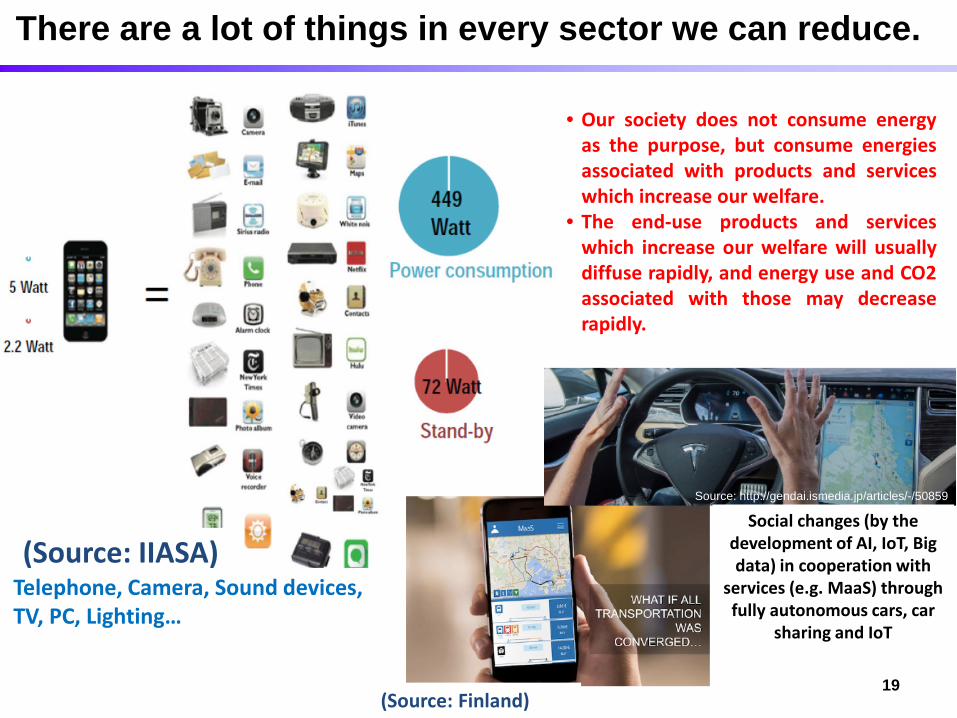
Telephone, Camera, Sound devices, TV, PC, Lighting…
19
There are a lot of things in every sector we can reduce.
(Source: IIASA)
(Source: Finland)
• Our society does not consume energyas the purpose, but consume energiesassociated with products and serviceswhich increase our welfare.
• The end-use products and serviceswhich increase our welfare will usuallydiffuse rapidly, and energy use and CO2associated with those may decreaserapidly.
Social changes (by the development of AI, IoT, Big data) in cooperation with
services (e.g. MaaS) through fully autonomous cars, car
sharing and IoT
Source: http://gendai.ismedia.jp/articles/-/50859

CO2 emission
Carbon price
Baseline scenario
Intervention scenario
Carbon price/Marginal abatement cost
Explicit high carbon prices of such as over 100$/tCO2 in real price are unlikely in a real world. Technology and social innovations resulting in low (implicit or explicit) carbon prices (including coordination of secondary energy prices) are key for deep emission cuts to be implemented.
Model world: Ordinary technology progress
CO2 emission
Carbon price
Baseline scenario
Intervention scenario
Implicit or explicit carbon price/Marginal abatement cost
By technology and social innovations
Realistic world requirement:Innovations stimulated & implemented
20
Image of standard scenario by models and real world scenarios for deep cuts
20

21
Integration of Energy and ICT
Power sector will be requested to be negative emission in Global Net Zero Emission Scenarios:BECCS(Bioenergy+CCS) should be comparatively evaluated with other options such as afforestation, CO2 use, geoengineering (DAC, (SRM) …), etc.
Revolutionary Energy Saving through Electrification and Digitalization of Energy (EV, PHEV, FCV, Heat Pump, …..)
Clean and Efficient Energy Carrier(Electricity, Hydrogen etc.)
Carbon Free Power Source:Renewables, Nuclear,Fossil Fuel with CCS
Carbon Free Fuel: Biomass, Fossil Fuel with CCS, etc.
Carbon Free Heat Source:Solar Heat, Geothermal, etc.
SDGs
Keep Options as Many as Possible!
Super Smart Society (Society 5.0)IoT, AI, Big Data, Blockchain, Smart Sensor, …
Social system reform: material producer → service provider, etc.→ utilization rate up, recycle up, longer life, etc.
Reduced material demands, Behavior change, etc.
Mobilize demand sideDR, V2G, VPP, etc.
Energy StorageBattery, PtX…
+ Adaptation
Pathways to Net Zero Emission
ご清聴ありがとうございました
Thanks for your attention
公益財団法人 地球環境産業技術研究機構(RITE)Research Institute of Innovative Technology for the Earth
22