kensington gold project - alaska department of...
TRANSCRIPT
CBR GOLD CORP. Niblack Exploration Project
2008 Annual Report
Prepared for
State of Alaska Department of Environmental Conservation
Division of Water 410 Willoughby Ave., Suite 303
Juneau, AK 99801
Prepared by
220 9797 45th Ave.
Edmonton, AB Canada T6E 5V8
12303 Airport Way, Suite 370
Broomfield, CO 80021
TECS-AK P.O. Box 6193
Ketchikan, AK 99901
May 12, 2009

Niblack Exploration Project Annual Report May 12, 2009
iii
CONTENTS
LIST OF FIGURES .................................................................................................................................... v LIST OF TABLES ................................................................................................................................... vii ACRONYMS AND ABBREVIATIONS............................................................................................... ix
1 INTRODUCTION ........................................................................................................................... 1-1
2 SUMMARY OF ACTIVITIES ....................................................................................................... 2-1 2.1 SURFACE DISTURBANCE ................................................................................................. 2-1 2.2 UNDERGROUND DEVELOPMENT ................................................................................. 2-2 2.3 EXPLORATION DRILLING ................................................................................................ 2-3
2.3.1 Underground Exploration Drilling ...................................................................... 2-3 2.3.2 Surface Drilling ....................................................................................................... 2-3
2.4 RECLAMATION ................................................................................................................... 2-4 2.4.1 Construction Reclamation ..................................................................................... 2-4 2.4.2 Interim Reclamation ............................................................................................... 2-4
2.5 WORK PLANNED FOR 2009 .............................................................................................. 2-4
3 WATER QUALITY REPORTING ................................................................................................ 3-1 3.1 CHANGES TO THE WATER QUALITY MONITORING PROGRAM......................... 3-1
3.1.1 Groundwater and Surface Water Sampling and Analysis ............................... 3-2 3.1.2 Visual Inspections .................................................................................................. 3-2
3.2 DATA QUALITY EVALUATION ...................................................................................... 3-3 3.3 SAMPLING RESULT SUMMARY ...................................................................................... 3-4 3.4 WATER QUALITY COMPLIANCE EVALUATION ....................................................... 3-5
3.4.1 Screening against Alaska Department of Environmental Conservation Criteria ..................................................................................................................... 3-6
3.4.2 Time Series Analysis and Trend Detection ......................................................... 3-7 3.4.3 Statistical Comparisons ......................................................................................... 3-8 3.4.4 Overall Weight-of-Evidence Compliance Assessment ................................... 3-16
3.5 MONITORING WORK PLANNED FOR 2009 ............................................................... 3-17

Niblack Exploration Project Annual Report May 12, 2009
iv
4 STORMWATER POLLUTION PREVENTION PLAN REPORTING ................................... 4-1 4.1 VISUAL INSPECTIONS ....................................................................................................... 4-1 4.2 SIGNIFICANT SPILL REPORTS SUMMARY .................................................................. 4-2 4.3 CHANGES MADE TO THE STORMWATER POLLUTION PREVENTION PLAN
BEST MANAGEMENT PRACTICES ................................................................................. 4-2
5 ADEQUACY OF FINANCIAL RESPONSIBILITY ................................................................... 5-1
6 REFERENCES ................................................................................................................................... 6-1
Appendix A. Photographs of Site Facilities
Appendix B. Niblack Master Acid Base Accounting Geochemical Database (provided on CD)
Appendix C. Water Quality Monitoring Results for Surface Water and Groundwater (provided on CD)
Appendix D. Visual Site Inspection Forms

Niblack Exploration Project Annual Report May 12, 2009
v
LIST OF FIGURES
Figure 1-1. Niblack Project Location Map
Figure 2-1. Niblack Project Site As-Built Drawing
Figure 2-2. Water Treatment Facilities As-Built Drawing
Figure 3-1. Water Quality Monitoring Stations
Figure 3-2. Time Series Plots: Total and Dissolved Aluminum, Surface Water
Figure 3-3. Time Series Plots: Total and Dissolved Aluminum, Groundwater
Figure 3-4. Time Series Plots: Dissolved Arsenic, Surface Water and Groundwater
Figure 3-5. Time Series Plots: Dissolved Cadmium, Surface Water and Groundwater
Figure 3-6. Time Series Plots: Dissolved Copper, Surface Water and Groundwater
Figure 3-7. Time Series Plots: Dissolved Lead, Surface Water and Groundwater
Figure 3-8. Time Series Plots: Dissolved Mercury, Surface Water and Groundwater
Figure 3-9. Time Series Plots: Dissolved Nickel, Surface Water and Groundwater
Figure 3-10. Time Series Plots: Dissolved Selenium, Surface Water and Groundwater
Figure 3-11. Time Series Plots: Dissolved Silver, Surface Water and Groundwater
Figure 3-12. Time Series Plots: Dissolved Zinc, Surface Water and Groundwater

Niblack Exploration Project Annual Report May 12, 2009
vii
LIST OF TABLES
Table 2-1. Water Balance Monthly Summary, 2008
Table 3-1. Sampling Event Summary, 2008
Table 3-2. Water Quality Monitoring Stations
Table 3-3. Water Quality Monitoring Station Analyte List Summary, 2008
Table 3-4. Water Quality Parameters to be Monitored in Surface Water, Groundwater, and Effluent
Table 3-5. Laboratory Methods for Water Quality Samples
Table 3-6. Zinc Concentrations in Field Blanks, 2008
Table 3-7. ADEC Criteria Screening Summary
Table 3-8. ADEC Chronic Aquatic Life Criteria Screening Results – Surface Water
Table 3-9. ADEC Chronic Aquatic Life Criteria Screening Results – Groundwater
Table 3-10. Summary of Statistical Tests Performed for Surface Water Permit Compliance Stations, 2008
Table 3-11. Summary of Statistical Tests Performed for Groundwater Permit Compliance Stations, 2008
Table 3-12. Results of Natural Condition Criteria Comparisons for Surface Water, 2008
Table 3-13. Results of Natural Condition Criteria Comparisons for Groundwater, 2008
Table 3-14. Summary of Exceedances of Natural Conditions as Analyzed with the Alternative Population Approach for Surface Water, 2008
Table 3-15. Summary of Exceedances of Natural Conditions as Analyzed with the Alternative Population Approach for Groundwater, 2008
Table 3-16. Summary of Exceedances of Natural Conditions as Compared to Upper Prediction Limits for Surface Water, 2008
Table 3-17. Summary of Exceedances of Natural Conditions as Compared to Upper Prediction Limits for Groundwater, 2008


Niblack Exploration Project Annual Report May 12, 2009
ix
ACRONYMS AND ABBREVIATIONS
ADEC Alaska Department of Environmental Conservation
BMP best management practice
CBG CBR Gold Corp.
CBR Committee Bay Resources Ltd.
NAG non-acid-generating
NC Tool natural conditions tool
PAG potentially acid-generating
Permit State of Alaska’s Waste Management Permit 2006-DB0037
QA/QC quality assurance and quality control
QAPP quality assurance project plan
ROS regression on order statistics
SWPPP stormwater pollution prevention plan
TDS total dissolved solids
UPL upper prediction limit


Niblack Exploration Project Annual Report May 12, 2009
1-1
1 INTRODUCTION
This report is submitted in accordance with annual reporting requirements for the Niblack Underground Exploration Project. The Niblack Project is a copper-zinc-gold-silver prospect located off Moira Sound on southeastern Prince of Wales Island, approximately 30 miles southwest of the town of Ketchikan (Figure 1-1). Underground development on the Niblack Project was initiated by Niblack Mining Corporation on September 21, 2007, and was completed on July 12, 2008. Underground exploration (drilling) was completed on October 7, 2008. Niblack Mining Corporation was acquired by Committee Bay Resources Ltd. (CBR) on October 1, 2008, which has subsequently undergone a corporate name change to CBR Gold Corp. (CBG). However, the project remains the principal asset of Abacus Alaska Inc., now a wholly owned subsidiary of CBG.
Following the acquisition of Niblack Mining Corporation by CBR (now CBG) and the completion of the initial phase of underground development and exploration, the property was placed into Temporary Closure status. Contractor demobilization was completed in early December 2008, and, following discussions with the State, Temporary Closure status was approved in February 2009.
The permits, plans, and approvals reported and referred to herein include:
• Alaska Department of Natural Resources Reclamation Plan Approval #J072711
• Alaska Department of Environmental Conservation (ADEC) Waste Management Permit (2006-DB0037) (hereinafter Permit)
• Niblack Project Plans
− Underground Exploration Project Plan of Operations
− Reclamation and Closure Plan
− Storm Water Pollution Prevention Plan (SWPPP)
− Water Quality Baseline and Site Monitoring Plan
− Quality Assurance Project Plan (QAPP)
− Operational Characterization Plan


Niblack Exploration Project Annual Report May 12, 2009
2-1
2 SUMMARY OF ACTIVITIES
2.1 SURFACE DISTURBANCE
Surface disturbance as of December 31, 2008, is shown on the site-wide as-built map (Figure 2-1) and includes the following:
• 5,000 ft of access road
• Ditches, culverts, and settling basins for storm water management
• Construction of laydown areas for equipment/supply storage including a fuel storage facility, magazine sites (currently decommissioned), portal area, shop area (old camp) and a mineralized stockpile identified on the map as the Lookout Stockpile (tarped)
• Sediment ponds, waste water treatment plant, and land application system
• Barge landing and dock facilities
• Temporary potentially acid generating (PAG) waste rock storage facility
• Non-acid generating (NAG) waste rock dumps, access roads, NAG fines stockpile, berms, and run-on diversion ditches
• Topsoil and growth media stockpiles.
The total surface area cleared or disturbed at the project site is 14.81 acres. This total includes access roads and a historical land camp site constructed prior to 2007, which are not covered under the Niblack Underground Exploration Program permits. Photographs of site facilities are provided in Appendix A.
Underground development began in September 2007, continued through the early part of 2008, and was completed on July 12, 2008 (blasting of final round). As a result, the placement of NAG material at construction sites and on the NAG waste dumps was completed shortly thereafter, as was the loading of the temporary PAG waste rock storage facility, the construction of which was completed in spring 2008. The majority of the NAG material removed from the underground development was utilized in the construction of site facilities and thus the NAG waste dumps actually only contain material that was required to construct access roads. Some additional NAG material was placed on the lower NAG road in 2008 and was sorted through a 6–in. grizzly to create a small “fines” stockpile for road maintenance (Figure 2-1).
The temporary PAG waste rock storage facility (see Figure 2-1) was constructed on a stable foundation of crushed rock overlain by a 6 in. layer of compacted sand, and lined with 80-mil high-density polyethylene (geo-membrane) between two layers of geotextile fabric. This was overlain by another 6 in. layer of compacted sand as a service layer (Figure 2-1). The PAG liner
Niblack Exploration Project Annual Report May 12, 2009
2-2
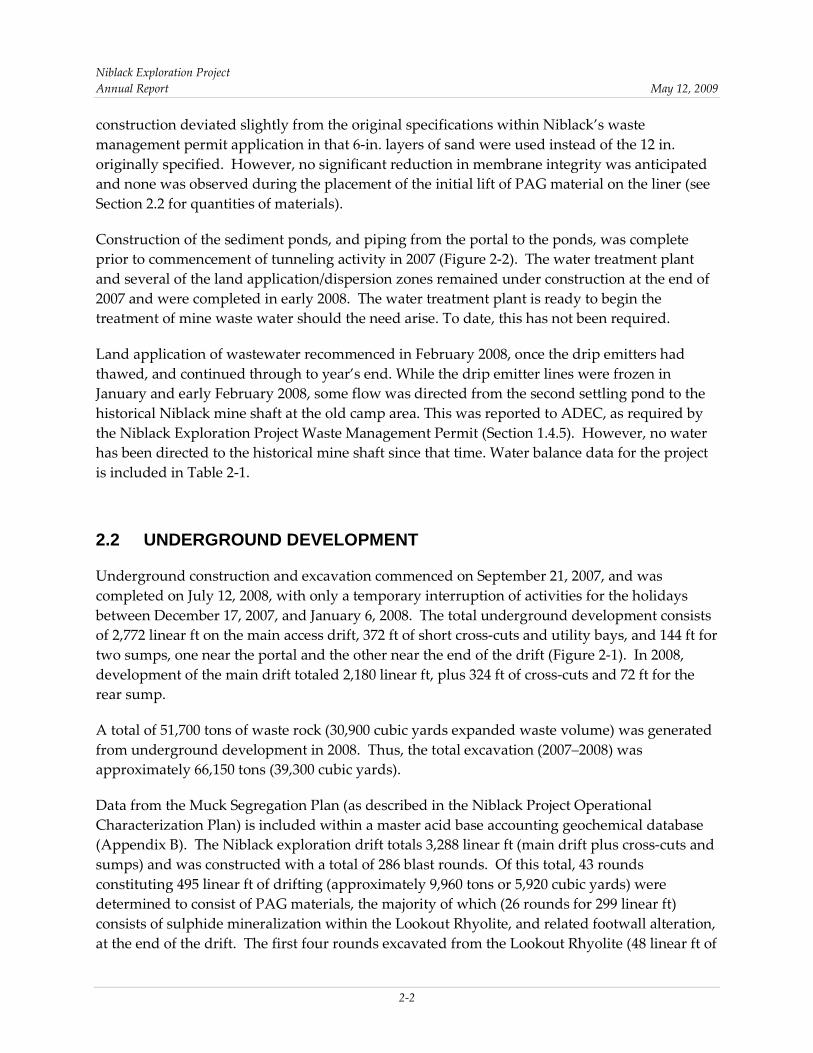
construction deviated slightly from the original specifications within Niblack’s waste management permit application in that 6-in. layers of sand were used instead of the 12 in. originally specified. However, no significant reduction in membrane integrity was anticipated and none was observed during the placement of the initial lift of PAG material on the liner (see Section 2.2 for quantities of materials).
Construction of the sediment ponds, and piping from the portal to the ponds, was complete prior to commencement of tunneling activity in 2007 (Figure 2-2). The water treatment plant and several of the land application/dispersion zones remained under construction at the end of 2007 and were completed in early 2008. The water treatment plant is ready to begin the treatment of mine waste water should the need arise. To date, this has not been required.
Land application of wastewater recommenced in February 2008, once the drip emitters had thawed, and continued through to year’s end. While the drip emitter lines were frozen in January and early February 2008, some flow was directed from the second settling pond to the historical Niblack mine shaft at the old camp area. This was reported to ADEC, as required by the Niblack Exploration Project Waste Management Permit (Section 1.4.5). However, no water has been directed to the historical mine shaft since that time. Water balance data for the project is included in Table 2-1.
2.2 UNDERGROUND DEVELOPMENT
Underground construction and excavation commenced on September 21, 2007, and was completed on July 12, 2008, with only a temporary interruption of activities for the holidays between December 17, 2007, and January 6, 2008. The total underground development consists of 2,772 linear ft on the main access drift, 372 ft of short cross-cuts and utility bays, and 144 ft for two sumps, one near the portal and the other near the end of the drift (Figure 2-1). In 2008, development of the main drift totaled 2,180 linear ft, plus 324 ft of cross-cuts and 72 ft for the rear sump.
A total of 51,700 tons of waste rock (30,900 cubic yards expanded waste volume) was generated from underground development in 2008. Thus, the total excavation (2007–2008) was approximately 66,150 tons (39,300 cubic yards).
Data from the Muck Segregation Plan (as described in the Niblack Project Operational Characterization Plan) is included within a master acid base accounting geochemical database (Appendix B). The Niblack exploration drift totals 3,288 linear ft (main drift plus cross-cuts and sumps) and was constructed with a total of 286 blast rounds. Of this total, 43 rounds constituting 495 linear ft of drifting (approximately 9,960 tons or 5,920 cubic yards) were determined to consist of PAG materials, the majority of which (26 rounds for 299 linear ft) consists of sulphide mineralization within the Lookout Rhyolite, and related footwall alteration, at the end of the drift. The first four rounds excavated from the Lookout Rhyolite (48 linear ft of

Niblack Exploration Project Annual Report May 12, 2009
2-3
the drift representing approximately 965 tons or 574 cubic yards of material) consisted of well-mineralized rock and was set aside for future test work. This material was placed on a laydown area (unlined) between the temporary PAG storage facility and the old camp and was covered with 80-mil geo-membrane (sealed) with ditching so as to prevent the run-on of surface waters. The remainder of the PAG material (approximately 8,995 tons or 5,346 cubic yards of material) was placed on the temporary PAG storage facility. NAG waste rock, dominated by mafic volcanic rocks and mafic dykes, totaled 2,793 linear ft of the total excavation and represents some 56,200 tons, or 33,400 cubic yards, of material. All NAG waste rock has been used in construction activities, including expanding the laydown areas, the NAG site access roads and berms, the base for the temporary PAG storage facility, and for performing road maintenance.
Groundwater flows from the underground excavation exceeded pre-project estimates and necessitated grouting to remain below the permitted wastewater discharge limit of 150 gpm. On August 13, 2008, approval was granted by the State for an increase in the permitted wastewater discharge limit to 250 gpm. Grouting was completed over the majority of the main access drift and proved effective at reducing groundwater flows to rates well below permitted discharge limits throughout 2008.
2.3 EXPLORATION DRILLING
2.3.1 Underground Explo ra tion Drilling
A total of 18,161.5 ft of underground exploration drilling (25 drill holes) was completed during 2008. Six drill holes (4,423.5 ft) were completed from the Mammoth Drill Station (east cross-cut #1) located approximately 485 ft into the exploration drift between January 12 and February 13, 2008. An additional 17 drill holes (11,461 ft) were completed from the East Drill Station (east cross-cut #5) located approximately 2,440 ft into the drift between June 15 and September 15, 2008. Finally, two drill holes (2,277 ft) were completed from the West Drill Station (west cross-cut #2) located approximately 2,370 ft into the drift between September 15 and October 7, 2008. These drill holes were plugged with “packers” (sections of pipe with ball valves), which proved effective at reducing discharge from the drill holes.
2.3.2 Surface Drilling
No surface exploration drilling was performed in 2008.

Niblack Exploration Project Annual Report May 12, 2009
2-4
2.4 RECLAMATION
Reclamation in 2008 included both construction reclamation and interim reclamation (as described the Niblack Project Reclamation and Closure Plan).
2.4.1 Cons truc tion Rec lamation
Construction reclamation activities are those activities that occur during and directly after the exploration tunnel and associated facilities are constructed. This phase of reclamation involves the removal and storage of topsoil and growth media from disturbed areas. During construction, vegetation was cleared from the surfaces that were developed, primarily from the PAG and water treatment facility. Topsoil and soil-like growth media were removed where possible and stockpiled for reclamation. Stockpiles are located along the outer edge of access roads and laydown areas (Figure 2-1). Following the construction of the majority of the site facilities and access roads in 2007, there have been only minor construction reclamation activities. This was limited to the completion of the NAG site, which consisted of the felling of trees and construction of access roads, run-on diversion ditches, and berms. Concurrent reclamation of the lower NAG haul road included placement of topsoil along the lower side of the road and berm.
2.4.2 In te rim Reclamation
Interim reclamation is defined as temporary measures for reducing the potential for erosion and sedimentation, and other activities required to protect surface water and groundwater resources. Interim reclamation has been undertaken to stabilize road cuts, stockpiles, and other disturbances resulting from construction activities. Interim reclamation measures completed in 2008 included seeding over road cuts, installation, and maintenance of sedimentation control systems, and employing other best management practices (BMPs) commonly used for construction and exploration projects.
2.5 WORK PLANNED FOR 2009
As of the end of 2008, the project remained on “Temporary Closure” status; however, CBG remains hopeful that it will be able to reopen the exploration drift and continue the underground drill testing of the Lookout Zone of mineralization in the spring or summer of 2009.

Niblack Exploration Project Annual Report May 12, 2009
3-1
3 WATER QUALITY REPORTING
This section presents the results of water quality monitoring conducted in 2008 at the Niblack Exploration Project in accordance with the requirements of the Permit (ADEC 2007). The objectives of this water quality monitoring summary are to provide ADEC with the following:
• A summary of sampling and analysis activities conducted during 2008, including any visual observations of anomalous conditions or any other conditions considered relevant to interpretation of water quality monitoring data
• A summary of data quality reviews completed in accordance with the QAPP (Integral 2007)
• Tabulated results of laboratory analyses and field parameter measurements from the surface water and groundwater quality monitoring sites included in the Permit
• Graphical, time-series presentation of water quality monitoring results for constituents required under the Permit, to facilitate trend detection
• Statistical comparison of surface water and groundwater results
• A discussion of any exceedances of applicable water quality criteria during the quarter
• Water quality monitoring work planned for 2009.
3.1 CHANGES TO THE WATER QUALITY MONITORING PROGRAM
Sampling and analysis of groundwater and surface water through Q2 2008 was performed as required by the original Permit. On July 15, 2008, Niblack submitted to ADEC a technical memorandum (Locke 2008, pers. comm.) outlining a series of recommended changes to the water quality monitoring program. These recommendations were developed in light of permit requirements, the results of groundwater and surface monitoring conducted to date, and results of graphical and statistical evaluations of water quality at the project site before and after underground exploration began in late September 2007. In an e-mail dated August 13, 2008 from Kenwyn George of ADEC to Darwin Green of Niblack (George 2008, pers. comm.), ADEC approved these recommended changes, as follows:
1. Reduce the monitoring frequency at surface water monitoring sites to quarterly beginning in Q3 2008.
2. Reduce the monitoring frequency at groundwater monitoring sites to quarterly beginning in Q3 2008 (after a total of 20 samples have been collected at each site).

Niblack Exploration Project Annual Report May 12, 2009
3-2
3. Discontinue the concurrent measurement approach for surface water on Waterfall Creek (WQ-08), Camp Creek (WQ-07), and Unnamed Creek #1 (WQ-12).
4. Discontinue regular monitoring of groundwater monitoring sites MW -07, MW-08,
MW-09.
5. Reduce the analyte list to include only those parameters needed to determine permit compliance and selected additional general water quality parameters needed to track trends in overall water quality.
These changes were implemented in Q3 and Q4 2008.
3.1.1 Groundwater and Surface Water Sampling and Analys is
Ten sampling events were conducted during 2008 (Table 3-1) at the water quality monitoring sites indicated on Figure 3-1. As discussed above, the composition of sampling stations in the water quality monitoring network changed in the second half of 2008. Table 3-2 summarizes the sample stations and designated purpose (reference, compliance, and information-only) of each station as specified in the water quality monitoring permit; the monitoring stations that were removed from the sampling network beginning in Q3 2008 are marked with an asterisk (*). Table 3-3 details the monitoring schedule and analyte list for surface water and groundwater stations sampled in 2008.
Field quality assurance and quality control (QA/QC) samples were collected during each 2008 sampling event, as summarized in Table 3-1. For each sampling event, the QA/QC samples included a field duplicate for the surface water stations and a field duplicate for the groundwater stations, and field blanks for all analytes including total and dissolved metals.
The water quality and field QA/QC samples for each 2008 sampling event were analyzed for the parameters identified in the permit (ADEC 2007) and project QAPP (Integral 2007) identified in Table 3-4. Table 3-5 presents the original complete monitoring list as well as the reduced list of water quality parameters implemented beginning in July 2008, and identifies the method of analysis for each parameter.
3.1.2 Vis ua l Ins pec tions
Visual inspections of the site for stress to vegetation and channelization in wastewater application areas were conducted at a minimum frequency of weekly as required in Section 1.6.11 of the Permit. No stress to vegetation and no channelization were observed in the land application area.

Niblack Exploration Project Annual Report May 12, 2009
3-3
Visual inspections of the site were conducted at a minimum frequency of every 15 days as prescribed by Section 6 of the SWPPP (RTR 2006). From these inspections it is noted that visibly turbid stormwaters were occasionally observed downstream of the portal area during 2008 due to road activity. These waters are routed through a sediment pond prior to discharge into a vegetated stream course, which flows to Waterfall Creek above sampling station WQ-04. Efforts to improve BMPs (enlargement of settling pond, increase in height of road lift and straw-bales placed in ditch lines) in this area have led to visible reductions in the turbidity of stormwater discharges to Waterfall Creek (see also Section 4.1). Visual site inspection forms are provided in Appendix D.
3.2 DATA QUALITY EVALUATION
As specified in the Niblack Exploration Project QAPP (Integral 2007), a quality assurance review of the laboratory data from chemical analyses of surface and groundwater samples was conducted for all 10 water quality sampling events conducted in 2008. The data were validated according to the data validation procedures in the EPA guidance for data review (USEPA 2002). Data that did not meet the applicable laboratory or data validation quality control limits were qualified as undetected (assigned a U qualifier), estimated (assigned a J qualifier), or rejected (assigned an R qualifier) during the quality assurance review. The tabulated analytical summary data discussed in the next section also present the data validation qualifiers assigned to the project data.
As specified in the QAPP (Integral 2007), a readiness review was conducted on the entire set of water quality data collected in 2008. This review assures that all data underwent complete quality assurance review and validation and that all qualifiers assigned during validation were entered into the database and verified.
The quality assurance review included assessment of the field blank results (Table 3-6), as well as evaluation of natural samples, for each sampling event. Field blanks are collected for each sampling event for all analytes including total and dissolved metals analyses. As indicated in the 2007 annual report (Integral 2008a) and the Q1 2008 quarterly report (Integral 2008b), zinc was detected in all field blanks collected from July 2007 through March 2008 at concentrations ranging from 0.64 to 51.9 μg/L. Zinc concentrations were systematically higher in the dissolved fraction than in the total fraction in the field blanks collected over this period. In addition, a systematic positive bias was observed in the dissolved versus total results for natural samples of surface water collected July through December 2007 (65 percent) as well as for Q1 2008 (67 percent). Based on these results, surface water sample collection procedures were modified beginning in Q2 2008 to follow the groundwater protocols (i.e., use of a peristaltic pump and in-line cartridge filters for dissolved samples) in an effort to reduce or eliminate the potential for introducing zinc contamination to dissolved surface water samples during filtration. Q2 through Q4 2008 field blank sample zinc concentrations ranged from 0.5 to 4.75 μg/L; no
Niblack Exploration Project Annual Report May 12, 2009
3-4
positive bias was observed in the dissolved versus total field blanks. The improvements in the field blank results in Q2 through Q4 2008 suggest that the changes in the surface water sampling protocols reduced zinc contamination during filtration. These protocols will continue to be used for both surface water and groundwater sampling.
The qualification of zinc data for Q2 through Q4 2008 was consistent with the qualification scheme developed in late 2007. Qualifiers were reassigned based on the 95th percentile of the distribution of the field blank concentrations across all sampling events from July through December 2007, rather than qualifying the zinc results based on the field blanks for each individual sampling event. The 95th percentile values for zinc in the field blanks are 5.0 μg/L for the total fraction and 6.19 μg/L for the dissolved fraction. Results less than or equal to two times the 95th percentile values (≤ 10.0 μg/L total, ≤ 12.4 μg/L dissolved) were qualified as undetected (assigned a U qualifier) and results greater than two times the 95th percentile but less than five times the 95th percentile distribution (≤ 25.0 μg/L total, ≤ 30.9 μg/L dissolved), were qualified as estimated (assigned a J qualifier).
Despite detections of zinc in field blank samples, detected zinc concentrations do not exceed ADEC chronic aquatic life criteria in any of the groundwater or surface water samples collected from compliance locations.
3.3 SAMPLING RESULT SUMMARY
Tabulated surface water quality monitoring results for data collected through 2008 are provided in Table C-1 in Appendix C. Table C-1 includes results for all surface water stations identified in the Permit for all field and laboratory parameters identified in the Water Quality Baseline and Site Monitoring Plan (Knight Piesold 2007) and QAPP (Integral 2007). Surface water replicate results and relative percent differences are presented in Table C-2. Surface water method detection limits are provided in Table C-3.
A corresponding set of tables for groundwater monitoring locations specified under the Permit are also provided in Appendix C (Tables C-4 through C-6).
As required by the Permit, the measured value of total dissolved solids (TDS) was compared to a calculated TDS value (“TDScalc.”) as a technique to check the correctness of analyses. TDScalc. was calculated using the following equation, which was adapted from the methods outlined in Standard Method 1030E from the 20th edition of the Standard Methods for the Examination of Water and Wastewater (AWWA 1998).1
1 To calculate TDScalc., nondetect values were set equal to one-half the detection limit. Whenever available, the dissolved concentration fraction was used in the calculation. The formula was modified from Standard Method 1030E to include the contributions of iron and aluminum, which occur at appreciable concentrations in many water

Niblack Exploration Project Annual Report May 12, 2009
3-5
( )3323
24
223. )(6.0
OHAlFeOOHFNOSiOSOClMgCaKNaCaCOasALKTDScalc
++++
+++++++×=−−−
−−++++
For comparison, the calculated and measured TDS values are presented in Appendix C in Table C-1 for surface water and Table C-4 for groundwater. The measured TDS concentration is generally expected to be greater than the calculated TDS value because the measured TDS should capture all dissolved analytes, whereas the calculated value includes only those ions indicated in the sum. According to Standard Method 1030E, an acceptable ratio of measured TDS to calculated TDS is:
2.10.1 <>TDScalculatedTDSmeasured
In 2008, the majority of the calculated ratios fell outside this range. This is attributed to the generally low measured TDS of surface water and groundwater at the site and the possibility that additional ions may be present in the water that are not accounted for in the calculation.
3.4 WATER QUALITY COMPLIANCE EVALUATION
ADEC has determined that water quality parameters at the Niblack Exploration Project shall be monitored at locations and frequencies listed in Table B of the Permit for groundwater and Table C of the Permit for surface streams. Furthermore, Section 1.13.2 of the Permit requires that site-specific, natural conditions based water quality criteria shall be established for a subset of water quality parameters—pH, aluminum (total recoverable), cadmium (dissolved), copper (dissolved), lead (dissolved), nickel (dissolved), silver (dissolved) and zinc (dissolved)—listed in Table E of the Permit.
The compliance evaluation presented in this section includes the following elements:
1. A screening evaluation of compliance samples collected after the initiation of underground exploration against ADEC water quality criteria to identify a subset of metals to be evaluated further using visual trend analysis and statistical comparisons.
quality samples from the site, to TDScalc. SiO3
2– was calculated from the measured value of elemental silicon (Si) using the conversion factor 2.709, FeOOH was calculated from the measured value of elemental iron (Fe) using the conversion factor 1.59, and Al(OH)3 was calculated from the measured value of elemental aluminum (Al) using the conversion factor 2.89. Also, in many cases, NO3
– was not analyzed individually, but rather as a sum of the nitrate and nitrite. When only this sum was available, the total nitrate plus nitrate value (as NO3
–) was used in the TDS calculation. This may provide a slight overestimate in the contribution of nitrate to the calculated TDS value; however, a brief analysis of sample pairs where nitrate and nitrite were analyzed individually showed that, on average, nitrate made up 87 percent of the total summed value.

Niblack Exploration Project Annual Report May 12, 2009
3-6
2. Visual trend analysis using time series graphical plots.
3. Statistical comparisons using the following approaches:
a. ADEC Natural Conditions method (surface water and groundwater)
b. Alternate population testing methods described in the Niblack QAPP (surface water and groundwater)
c. An upper threshold value screening method using an upper prediction limit (UPL) statistic (surface water and groundwater).
4. An overall assessment of compliance with natural-conditions water quality criteria based on the weight of evidence provided by the tools listed above.
As agreed to by Niblack (now CBG) and ADEC on August 13, 2008 the ADEC Concurrent Measurement method is no longer being used as a statistical tool to evaluate compliance with surface water quality standards. The concurrent monitoring approach was excluded because, for some parameters and in some monitoring events, upstream water quality values were higher than the downstream values, making the statistical methods used in concurrent monitoring inapplicable.
3.4.1 Screening aga ins t Alas ka Department of Environmen ta l Cons erva tion Crite ria
To identify a subset of these metals that will be evaluated further in this annual monitoring report using statistical comparisons and visual trend analysis, the surface water and groundwater data collected in 2006, 2007, and 2008 were screened against ADEC chronic aquatic life criteria (ADEC 2003) for metals included in Tables B, C, and E of the Permit.2
In 2008, concentrations of Permit-regulated metals at surface water compliance locations were below ADEC screening criteria for all constituents except total aluminum and dissolved copper. As shown in Table 3-8, total aluminum exceeded the ADEC chronic criterion of 87 μg/L (total recoverable) in multiple sampling events at surface water stations WQ-04, WQ-06, WQ-08, WQ-10, and WQ-12. This is consistent with the results from 2007. Dissolved copper did not exceed the hardness-based ADEC chronic criteria at any surface water station, in contrast to the one exceedance for copper observed in 2007. Pre-activity reference samples at all stations (WQ-04, WQ-06, WQ-07, WQ-08, WQ-10, WQ-12, and WQ-13) and post-activity initiation reference
Table 3-7 presents a summary of the screening results for all surface water and groundwater data collected in 2006, 2007, and 2008.
2 There is no ADEC screening criterion for silver. Also, per discussion with ADEC Water Quality Officer James Gendron, dissolved mercury was screened against the human health criterion for consumption of aquatic organisms (0.051 µg/L).

Niblack Exploration Project Annual Report May 12, 2009
3-7
samples collected upstream of site operations (WQ-07, WQ-08, and WQ-12) also exhibited multiple exceedances of the total aluminum and dissolved copper chronic criteria (Table 3-8).
Concentrations of Permit-regulated metals in groundwater compliance samples collected after the initiation of underground exploration in September 2007 were below ADEC screening criteria for all constituents except total aluminum, dissolved copper, dissolved lead, and dissolved mercury. Locations and dates of these exceedances are presented in Table 3-9. (Limited exceedances of dissolved cadmium and dissolved zinc were recorded before the initiation of underground exploration, as shown in Table 3-7.) In 2008, the exceedance patterns for groundwater samples were similar to those in 2007 for total aluminum, dissolved copper, and dissolved lead; there were no exceedances of the screening criterion for mercury in 2008. As with surface water, multiple exceedances of the ADEC screening criteria for total aluminum, dissolved copper, and dissolved lead were also observed in pre-activity reference samples. Since site activity began in September 2007, land application of waste water has occurred upgradient of MW-02, MW-03, and MW-04. No land application of waste water has occurred upgradient of the MW-01 area. Therefore, samples collected at MW-01 after September 21, 2007 therefore fall within the definition of compliance samples.
3.4.2 Time Se ries Analys is and Trend Detec tion
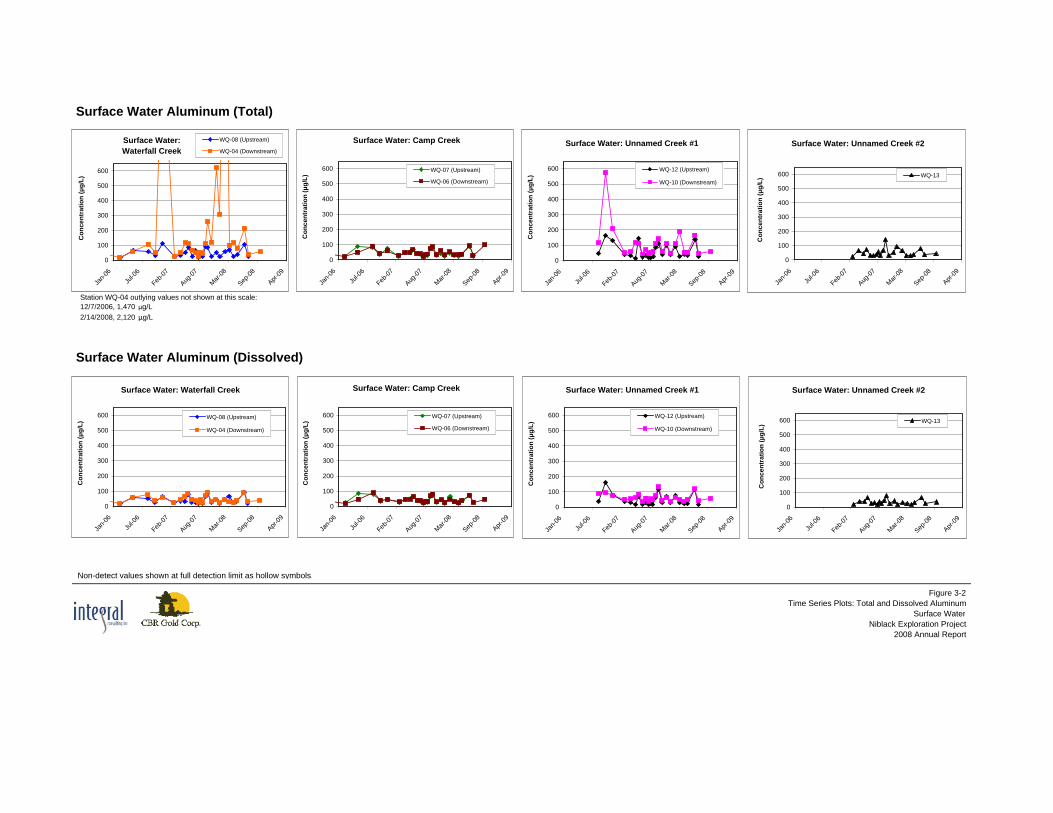
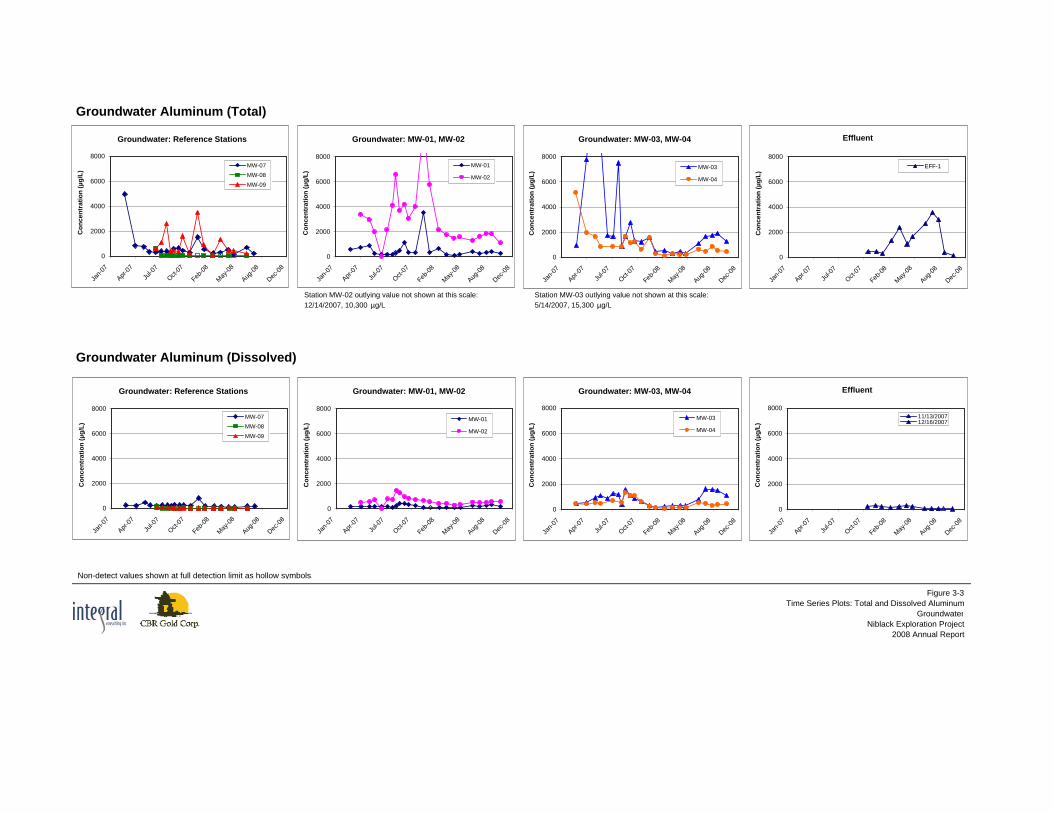
Time series concentration plots (Figures 3-2 through 3-12)were prepared for the 10 metals—aluminum, arsenic, cadmium, copper, lead, mercury, nickel, selenium, silver, and zinc—that are identified for monitoring in surface water and groundwater in Tables B, C, and E of the Permit. These plots present all reference and compliance samples collected from February 2006 to October 2008, with values below detection limits shown as hollow symbols.
For surface water trend analysis, upstream reference/downstream compliance station pairs are plotted together. While these pairs represent the best available sampling locations to evaluate potential project influences, systematic biases related to surface and groundwater inflows between station pairs may influence trend analysis and direct comparison of upstream and downstream stations. In particular, physical differences are known to exist between upstream and downstream stations on both Unnamed Creek #1 and Waterfall Creek. On Unnamed Creek, upstream station WQ-12 exhibits lower flows than downstream station WQ-10. Similarly, upstream station WQ-08 on Waterfall Creek generally exhibits lower flows than downstream station WQ-04, and known small tributaries enter Waterfall Creek between these two stations. No known inflows exist on Camp Creek between upstream station WQ-07 and downstream station WQ-06, and fairly consistent flows have been observed between these two stations.
For the four metals (aluminum, copper, lead, and mercury) that exceeded ADEC screening criteria in compliance samples collected in 2007 or 2008, visual analysis of time series plots provides important insights to the magnitude, patterns, and trends observed both before and
Niblack Exploration Project Annual Report May 12, 2009
3-8
after project initiation, and provides context to the results of statistical comparison tests. In 2007, total aluminum in surface water (Figure 3-2) suggested a possible increasing trend at station WQ-04 following project initiation; however, inclusion of the 2008 data indicates that this was likely due to natural variability. Total aluminum concentrations at compliance stations WQ-06 and WQ-10 closely track upstream reference station trends and fall well within pre-initiation concentration ranges. Similarly, total aluminum in groundwater compliance samples at MW-03 and MW-04 (Figure 3-3) fall well within pre-project concentration ranges. Total aluminum concentrations at compliance wells MW-01 and MW-02 also fall with pre-project concentration ranges during all sampling events in 2008.
Dissolved copper concentrations at surface water compliance stations WQ-04, WQ-06, and WQ-10 (Figure 3-6) closely track their respective upstream reference station trends and fall well within pre-initiation concentration ranges. At groundwater station MW-04 (Figure 3-6), dissolved copper shows a gradual increase prior to project initiation, but has stabilized at concentrations within or below pre-project concentration ranges.
As observed for copper, dissolved lead (Figure 3-7) in groundwater compliance samples at MW-04 shows a gradual concentration increase just prior to project initiation, and then generally decreases post-initiation. Post-initiation samples at MW-03 fall within the low range of pre-initiation concentrations.
Mercury was not seen above laboratory detection limits in surface water or groundwater in 2008 (Figure 3-8), and has been detected only once in surface water and once in groundwater (both in 2007). Trend analysis is not possible on this limited data set; however, it is clear that mercury is not generally present in elevated concentrations either pre- or post-initiation of the project.
In summary, total aluminum, dissolved copper, dissolved lead, and dissolved mercury concentrations in compliance samples fall within pre-initiation concentration ranges and do not suggest project impacts during the first year of underground exploration activity.
3.4.3 Sta tis tica l Comparis ons
This section presents a discussion of statistical comparisons performed on surface water and groundwater sampling results that exceeded promulgated ADEC criteria as discussed above. Table 3-10 provides an overview of the specific statistical tests to be performed on each relevant surface water data set, and Table 3-11 provides the same information for groundwater.
3.4.3.1 ADEC Natural Conditions Approach
The ADEC natural conditions approach (also referred to as the statistical characterization approach in ADEC guidance) determines natural conditions-based standards based on

Niblack Exploration Project Annual Report May 12, 2009
3-9
statistical characterization of the distribution of historical (pre-activity) data at the site and current (post-initiation) reference station concentrations. Like the concurrent measurement approach, the natural conditions approach produces a site-specific standard that is variable in time as more reference sampling results become available. With the natural conditions approach, compliance data are screened against these calculated site-specific standards external to the Natural Conditions tool (NC Tool).
The NC Tool passes reference data through a series of automated data processing and evaluation steps:
• Data screening for minimum data requirements and seasonality
• Data trimming to remove nondetect values and an equal number of high detected concentrations
• Additional data trimming (up to 25 percent of the data) from the upper and lower tails of the data set until the data (with appropriate transformations) passes a normality test
• Distribution testing of the trimmed data set to determine appropriate central tendency tests
• Calculation of natural condition-based site criteria
The NC Tool uses a lower-bound measure of central tendency to identify a site-specific chronic aquatic life criterion. This measure varies depending on the characteristics of the data set. The 95 percent lower confidence limit on the mean using the Student’s t distribution is used for parametric data sets with a sample size greater than or equal to 50; the 95 percent lower confidence limit on the median is used for nonparametric data sets and/or those with a sample size less than 50. In cases where the natural conditions-based standard is less than the published water quality criteria, the published criteria applies and is used for evaluation of permit compliance.
Application of the NC Tool
Data and data processing: The surface water reference data sets evaluated with the NC Tool included total and dissolved aluminum and dissolved copper for all pre-activity (April 20, 2005, to September 11, 2007) surface water samples collected at stations WQ-04, WQ-06, WQ-07, WQ−08, WQ-10, WQ-12, and WQ-13, and all post-initiation samples (October 1, 2007, to July 24, 2008) collected at upstream stations WQ-07, WQ-08, and WQ-12. Groundwater reference data sets for total and dissolved aluminum, dissolved copper, and dissolved lead included all pre-activity (February 27 to September 11, 2007) groundwater samples collected at stations MW-01, MW-02, MW-03, MW-04, and MW-07, and all post- initiation samples (September 30, 2007, to July 25, 2008) collected at the designated reference well MW-07.
Seasonality: The NC Tool default season definitions were applied to the reference data sets, with summer defined as April to September and winter as October to March.
Niblack Exploration Project Annual Report May 12, 2009
3-10
Treatment of nondetect values: No nondetect data values existed in the surface water reference data sets for total or dissolved aluminum. For groundwater reference data only one nondetect value was found in each the total and dissolved aluminum groundwater data sets. These values were included at the full detection limit and flagged as required by the NC Tool. Due to minimum data requirements of the NC Tool, high nondetect values were removed from the surface water dissolved copper, groundwater dissolved copper, and groundwater dissolved lead reference data sets, as described in detail below.
Treatment of outliers: The NC Tool default data trimming operations were applied to eliminate outliers and skewing data values.
Spreadsheet modifications: Because the data collected for the Niblack Project do not meet all of the minimum sample requirements embedded in the NC Tool, the following modifications were made:
• Period of record: To meet this minimum 2-year sample requirement, surface water data collected during the April 20, 2005, sampling event was included in the surface water reference data set. Groundwater data are currently available for only 1 year; therefore, data sample dates were modified to adjust one winter and one summer sample from each groundwater analyte reference data set from February 2007 or April 2007 to February 2005 or April 2005, respectively.
• Detection frequency: The NC Tool requires that only up to 20 percent of observations in reference data sets may be nondetect values. In addition, the tool trims all detected data values which are below the highest detection limit. Due to these requirements, the surface water dissolved copper and the groundwater dissolved copper and dissolved lead reference data sets failed the minimum data requirements and could not be processed by the NC Tool. Nondetect values in these two data sets were therefore pre-processed to remove high nondetect values prior to data import into the NC Tool. High nondetect values were defined as any nondetect value that was higher than the lowest detected value in the reference data set. Following removal of high nondetect values, remaining nondetects were included in the NC Tool analysis at the full detection limit and flagged as required by the NC Tool.
• Default criteria: The ADEC NC Tool requires entry of a single published chronic aquatic life criterion value for each analyte. Generally, the ADEC chronic aquatic life criterion was applied here. In cases where this criterion is calculated based on hardness (e.g., dissolved copper and dissolved lead), the criterion varies between sampling events. The published criterion has no effect on the natural conditions standard calculation; therefore, a simple average of the calculated hardness-based criteria was entered for each analyte, and the natural conditions criterion was not directly compared to the published criterion.
Niblack Exploration Project Annual Report May 12, 2009
3-11
NC Tool Screening Results
Results of surface water sample concentration screening against site-specific criteria calculated with the NC Tool for total aluminum and dissolved copper are presented in Table 3-12. Groundwater screening results using the natural conditions approach for total aluminum, dissolved copper, and dissolved lead are presented in Table 3-13. Both reference (pre-site activity) and compliance (ongoing site activity) data were screened against the NC Tool criteria. For surface water, the site-specific criterion calculated for total aluminum was 57.6 μg/L, below the ADEC chronic aquatic life criterion of 87 μg/L; therefore, the lower site-specific criterion does not apply and was not used in screening. Screening against the site-specific dissolved copper criterion of 0.89 μg/L yielded multiple exceedances both before and after initiation of underground exploration activity at both reference (upstream) and compliance (downstream) stations. Similarly, groundwater exceedances of site-specific criteria for total aluminum (1,173 μg/L), dissolved copper (1.53 μg/L), and dissolved lead (0.21 μg/L) were observed both before and after project initiation and at both reference and compliance wells. No increases in the frequency of site-specific criteria exceedances following initiation of project activity, or in 2008 as compared to 2007, were evident for any of the surface water or groundwater samples tested.
A primary limitation of ADEC’s NC Tool for determining site-specific water quality criteria is the assumed equivalence of a lower-bound estimate of the central tendency of the reference data set and a site-specific chronic aquatic life criterion. Because this approach relies on point comparisons of individual compliance sample results with a lower-bound central tendency estimate from the reference data, a high rate of false positive “exceedances” can be expected even if the compliance data come from the same underlying distribution (i.e., population) as the reference data. This limitation is well illustrated by the high rate of false positives when the pre-initiation data (which cannot reflect impacts from the project) are screened against the criteria developed using the NC Tool (Tables 3-12 and 3-13), as discussed above.
Other limitations arise from the treatment of nondetect results in the NC Tool. The tool is designed to remove all nondetect results prior to computing the site-specific criteria and also to remove an equal number of results from the upper end of the distribution. Trimming of the upper end is intended to avoid creating a data set that would be upward biased if only the nondetects were trimmed, but has the undesirable consequence of artificially reducing the variance of the reference data set. Well-established and widely applied methods that avoid bias and do not require the trimming procedures used in the NC Tool are available (e.g., Helsel 2005) and should be considered in future revisions of ADEC’s methods for establishing natural conditions criteria.
3.4.3.2 Alternate Population Testing Methods
The Niblack QAPP (Integral 2007) recommends a general statistical approach to compare compliance and reference data for the Niblack Project, to be applied in parallel to the ADEC

Niblack Exploration Project Annual Report May 12, 2009
3-12
spreadsheet tools. The general statistical method recommended in the QAPP is a single-value t-test (or its non-parametric equivalent), with a false positive rate (α) of 0.05. The test evaluates whether or not a compliance sample measurement is significantly different than the central tendency of the reference data. This method is generally consistent with ADEC’s guidance for natural conditions assessment, although the treatment of outliers may differ and the treatment of nondetects does differ from ADEC’s guidance, as described below.
The QAPP statistical analysis is a collection of methods for data evaluation and testing, which may be applied in slightly different ways for different data sets, depending on the characteristics of the data. This flexible, or adaptive, approach is typical of statistical analysis tasks, and is carried out within a general analysis framework. This general framework consists of the following steps:
• Evaluation of seasonality in the data, and modification of the data sets used, as necessary
• Identification and elimination of outliers
• Evaluation and compensation for undetected measurements
• Evaluation of normality of the reference data distribution, and selection of an appropriate hypothesis test
• Application of the selected test.
Depending on the characteristics of a particular data set, these steps may not always be carried out in the same order. Some steps may be performed repeatedly. For example, examination of the data for outliers may be performed both before and after undetected measurements are compensated for.
Software tools to carry out the steps above have been implemented in the R programming language. The tools are a set of R functions that have been tailored specifically for the data and analyses needed for this project. These allow for statistical analyses to be carried out in an interactive and adaptive fashion by issuing commands to execute these functions at the R console.
Population Test Hypotheses
For normal and lognormal reference data sets, the QAPP statistical method compares individual compliance point samples to the reference population mean using a one-sided t-test of the null hypothesis (H0) that the mean (μ) of the reference data is equivalent to the effluent concentration (Ceff)—or, equivalently, that the effluent data are typical of the reference distribution. The alternative hypothesis (H1) is that the mean of the reference data is less than the effluent concentration—or, equivalently, that the effluent concentration is significantly higher than the reference data:

Niblack Exploration Project Annual Report May 12, 2009
3-13
H0: Ceff = μref
H1: Ceff > μref
For a 95 percent confidence limit on the reference data mean (α = 0.05), a p value of less than 0.05 indicates that the null hypothesis should be rejected.
For reference data sets that do not fit a normal or lognormal distribution, the Wilcoxon signed rank test is applied as a nonparametric equivalent to the one-sided t-test. This test compares each compliance point sample to the reference population by evaluating whether the compliance point sample is a plausible estimate of the reference population distribution median:
H0: Ceff - Medianref = 0
H1: Ceff - Medianref > 0
For a 95 percent confidence limit on the reference data median (α = 0.05), a p value of less than 0.05 indicates that the null hypothesis should be rejected.
Population Test Application
The surface water reference data sets for total and dissolved aluminum and dissolved copper included all pre-activity (February 15, 2006, to September 11, 2007) surface water samples collected at stations WQ-04, WQ-06, WQ-07, WQ-08, WQ-10, WQ-12, and WQ-13, and all post- initiation samples (October 1, 2007, to July 24, 2008) collected at upstream stations WQ-07, WQ-08, and WQ-12. The groundwater reference data sets for total and dissolved aluminum, dissolved copper, and dissolved lead included all pre-activity (February 27 to September 11, 2007) groundwater samples collected at stations MW-01, MW-02, MW-03, MW-04, and MW-07, and all post- initiation samples (September 30, 2007, to July 25, 2008) collected at offsite well MW-07. Compliance samples were compared individually to reference populations; these include surface water stations WQ-04, WQ-06, and WQ-07 and monitoring wells MW-01, MW-02, MW-03, MW-04, for the 12 surface water and 14 groundwater post-initiation sampling events, which occurred between September 30, 2007, and October 16, 2008.
Following distribution testing and log-transformation to most closely approximate a normal distribution (when applicable), reference data sets were screened for outliers using classical statistical outlier tests and visual evaluation of time series plots. The box plot outlier function in R was used to identify as a potential outlier any value greater than the last data point that is within a coefficient of 1.5 times the length of the box (the Tukey criterion for outliers; Cleveland 1993). Time series plots of the data were also reviewed before final exclusion of any high or low outliers from the data sets.

Niblack Exploration Project Annual Report May 12, 2009
3-14
Reference data were screened for nondetect values following outlier removal. No nondetect data values existed in the surface water reference data sets for total or dissolved aluminum, and 37 nondetect values were present in the dissolved copper data set, with a detection frequency of 73 percent. Regression on order statistics (ROS) substitution was applied to estimate nondetect values for the surface water dissolved copper data set (Helsel 2005). For groundwater reference data, 6 nondetect data values were present in the dissolved copper data set, 5 nondetect values were found in the total aluminum, and 6 nondetect values were found in the dissolved aluminum groundwater data sets, with a detection frequency of 95 percent in each of these data sets. Thirty-two nondetect values were present in the groundwater dissolved lead reference data set (67 percent detection frequency). ROS substitution was applied to each of the groundwater reference data sets.
Time series plots generated with both unprocessed reference data and processed (i.e., outliers removed and nondetect substitution applied where applicable) were visually examined to identify potential seasonality in the reference data set. Due to the short time period of available reference data, definitive evaluation of seasonality was not possible at this time, and the data were assumed to be non-seasonal.
Population Testing Results
Tables 3-14 and 3-15 present the results of surface water and groundwater data testing conducted with the alternative statistical population approach for each of the surface water and groundwater permit metals identified as potential parameters of concern by screening against ADEC chronic aquatic life criteria. Only post-project initiation compliance samples were screened against reference populations. For surface water, compliance sample concentrations measured at all three compliance stations failed the alternative population screening for both total and dissolved aluminum during at least one sampling event. Station WQ-10 also failed the screening for dissolved copper during one event in 2007, but none in 2008. Similarly, all four groundwater compliance stations failed the alternative population screening for total and dissolved aluminum, dissolved copper, and dissolved lead for at least one post-project initiation event.
The primary limitation of screening using an alternate population testing method is fundamentally similar to that of the ADEC natural conditions method in that underlying statistical hypothesis involves a comparison of an individual compliance measurement (i.e., point measurement) with the central tendency (mean or median) of the reference data set. As a result, frequent “failures” of this test can be expected, both when individual pre-initiation reference point measurements and post-initiation compliance point measurements are compared with the reference data sets using this approach. Because of this, the “failures” reported in Tables 3-14 and 3-15 cannot necessarily be interpreted as exceedances of (or departures from) the site-specific natural conditions, but may warrant further assessment.

Niblack Exploration Project Annual Report May 12, 2009
3-15
3.4.3.3 Upper Prediction Limit Analysis
As an alternative to the comparisons of central tendency embodied in the NC Tool and the alternate population test approach described in the previous sections, EPA guidance (e.g., USEPA 1989, 1992, 2006, 2007) recommends the use of estimates of an upper percentile of a reference data set (e.g., the 90th or 95th percentile) as an appropriate approach to make comparisons between background data and individual measurements from a compliance point. One such estimate is a UPL. A UPL is the upper bound of a prediction interval, defined as a statistical interval, based upon historical and/or background data, within which a newly and independently obtained site compliance observation will fall with a given probability (or confidence coefficient) (Gibbons 1994). A UPL represents an estimate of a threshold value in the upper tail of the data distribution. Therefore, a UPL should represent a number larger than the lower confidence limit on the mean (as applied in the NC Tool) and the upper confidence limit on the mean (as applied in the alternate population test approach). Upper threshold values, such as UPLs, are commonly used when individual point-by-point compliance observations are compared with a background compliance limit.
UPLs were calculated for a 95 percent prediction limit according to the general equation
nstxUPL n
11)1)(1( +××+= −−α
Where:
x = the reference data set mean s = the standard deviation n = the number of reference samples t(1-α)(n-1) = the critical value from the Student’s t-distribution with n – 1 degrees of
freedom α = 0.05.
For lognormal data sets, the UPL is calculated using the log-transformed data.
Application of the Upper Prediction Limit Screen
Upper prediction limits were calculated using the processed (log-transformed, outliers removed, and/or ROS substitution applied to nondetects, where applicable) surface water and groundwater reference data sets generated for the alternate population testing approach (Section 3.4.3.3). Compliance samples were screened individually against the calculated UPL thresholds.
Niblack Exploration Project Annual Report May 12, 2009
3-16
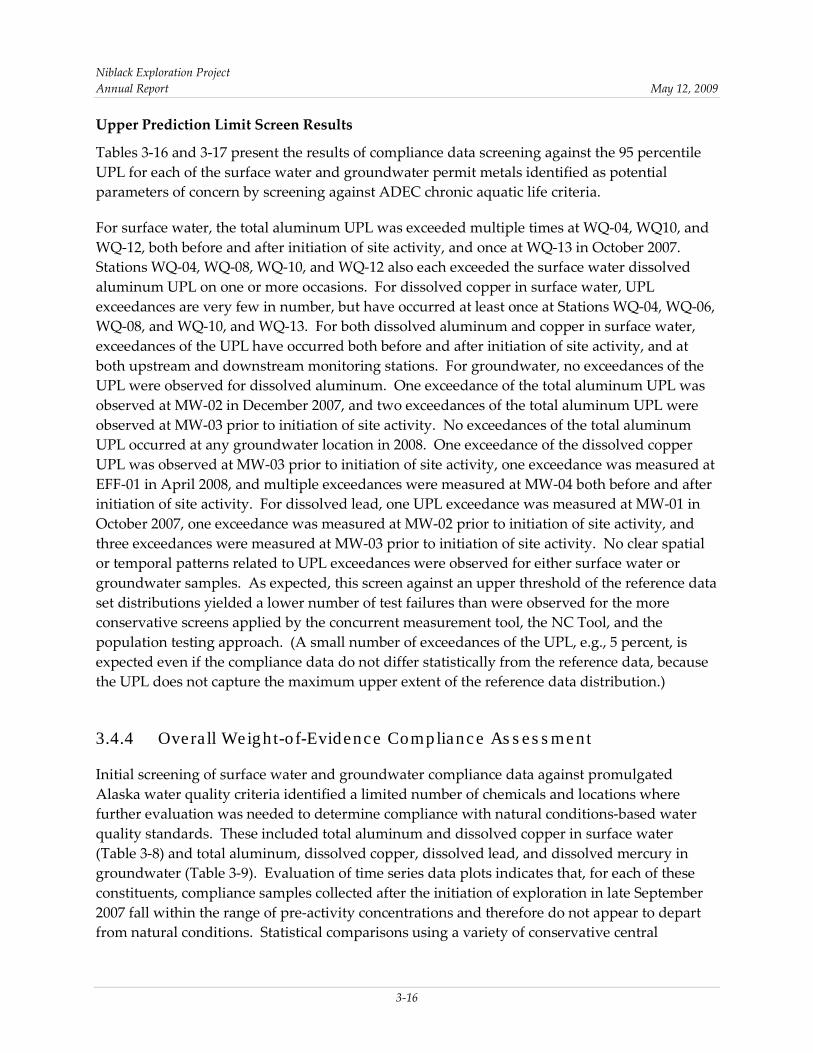
Upper Prediction Limit Screen Results
Tables 3-16 and 3-17 present the results of compliance data screening against the 95 percentile UPL for each of the surface water and groundwater permit metals identified as potential parameters of concern by screening against ADEC chronic aquatic life criteria.
For surface water, the total aluminum UPL was exceeded multiple times at WQ-04, WQ10, and WQ-12, both before and after initiation of site activity, and once at WQ-13 in October 2007. Stations WQ-04, WQ-08, WQ-10, and WQ-12 also each exceeded the surface water dissolved aluminum UPL on one or more occasions. For dissolved copper in surface water, UPL exceedances are very few in number, but have occurred at least once at Stations WQ-04, WQ-06, WQ-08, and WQ-10, and WQ-13. For both dissolved aluminum and copper in surface water, exceedances of the UPL have occurred both before and after initiation of site activity, and at both upstream and downstream monitoring stations. For groundwater, no exceedances of the UPL were observed for dissolved aluminum. One exceedance of the total aluminum UPL was observed at MW-02 in December 2007, and two exceedances of the total aluminum UPL were observed at MW-03 prior to initiation of site activity. No exceedances of the total aluminum UPL occurred at any groundwater location in 2008. One exceedance of the dissolved copper UPL was observed at MW-03 prior to initiation of site activity, one exceedance was measured at EFF-01 in April 2008, and multiple exceedances were measured at MW-04 both before and after initiation of site activity. For dissolved lead, one UPL exceedance was measured at MW-01 in October 2007, one exceedance was measured at MW-02 prior to initiation of site activity, and three exceedances were measured at MW-03 prior to initiation of site activity. No clear spatial or temporal patterns related to UPL exceedances were observed for either surface water or groundwater samples. As expected, this screen against an upper threshold of the reference data set distributions yielded a lower number of test failures than were observed for the more conservative screens applied by the concurrent measurement tool, the NC Tool, and the population testing approach. (A small number of exceedances of the UPL, e.g., 5 percent, is expected even if the compliance data do not differ statistically from the reference data, because the UPL does not capture the maximum upper extent of the reference data distribution.)
3.4.4 Overa ll Weight-of-Evidence Compliance As s es s ment
Initial screening of surface water and groundwater compliance data against promulgated Alaska water quality criteria identified a limited number of chemicals and locations where further evaluation was needed to determine compliance with natural conditions-based water quality standards. These included total aluminum and dissolved copper in surface water (Table 3-8) and total aluminum, dissolved copper, dissolved lead, and dissolved mercury in groundwater (Table 3-9). Evaluation of time series data plots indicates that, for each of these constituents, compliance samples collected after the initiation of exploration in late September 2007 fall within the range of pre-activity concentrations and therefore do not appear to depart from natural conditions. Statistical comparisons using a variety of conservative central
Niblack Exploration Project Annual Report May 12, 2009
3-17
tendency and upper threshold statistical tests produced varying rates of test failures, including high rates of “false positive” test failures for individual reference samples. These statistical results are not unexpected given the limitations of the approaches employed and the characteristics of the data set, as documented in the preceding sections.
Based on the 2007 and 2008 compliance monitoring data collected after the initiation of underground exploration, and the graphical and statistical analyses presented in this report, the weight of evidence does not indicate that site exploration activities have resulted in significant changes to natural surface water and groundwater quality in the vicinity of the project. Additional trend evaluation and statistical analysis (including consideration of refined or alternate methods) will be required to confirm these initial findings as the monitoring program proceeds.
3.5 MONITORING WORK PLANNED FOR 2009
The monitoring program will continue to be implemented through 2009 in accordance with the requirements of the Waste Management Permit, Site Monitoring Plan, and QAPP.


Niblack Exploration Project Annual Report May 12, 2009
4-1
4 STORMWATER POLLUTION PREVENTION PLAN REPORTING
4.1 VISUAL INSPECTIONS
During 2008, recorded visual inspections of the site were conducted at a minimum frequency of every 15 days as prescribed by Section 6 of the SWPPP (RTR 2006). Visual site inspection forms are provided in Appendix D. From these inspections, it was noted that visible turbidity in stormwater was significantly reduced in 2008 in comparison to 2007 as cut banks stabilized and previously implemented BMPs took effect. As a result, only minor turbidity during extremely high rainfall events was observed in site drainages. Efforts such as the maintenance of both upstream and downstream culvert settling ponds, increases in road lifts and ditch depths to properly control water flow, and the addition and maintenance of flow control measures (e.g., straw-bales), have led to a visible reduction in the turbidity of stormwater discharge.
Perhaps the best example of action taken in 2008 that resulted in an immediate reduction of turbidity in stormwater pertained to a culvert on the portal access road. During a routine site inspection conducted in late August 2008, it was noticed that stormwater running in the ditch above the portal access road was entering a 4-in. high-density polyethylene culvert that was not meant to carry stormwater but rather to carry portal water to the settling ponds. During high-flow events, stormwater was causing erosion of the road bank on the downstream side of the culvert. The upstream end of the culvert was cemented shut to prevent water from entering. As a result, stormwater was controlled in the road ditch and no longer passed through the culvert and thus the erosion on the downstream cut bank was eliminated along with the previously observed downstream turbidity.
In addition to improvements made in the BMP applications for runoff to Waterfall Creek coming from the portal area (as described above), other more minor issues were noted during inspections conducted in 2008, with corrective actions noted in subsequent inspection reports. General inspection of stormwater BMPs by site personnel is conducted on an almost daily basis. A visual inspection of these stormwater controls is documented on a weekly visual inspection form that additionally focuses on the waste storage areas and water treatment areas.
Non-stormwater source contributions to surface water are minimal at the Niblack Exploration Project site. All inspections take into account any potential contributions from pollutants. For example, fueling facilities and vehicle maintenance areas are examined during each of the regular recorded inspections. Inspection records are archived in a binder at the Niblack exploration camp office.
Niblack Exploration Project Annual Report May 12, 2009
4-2
4.2 SIGNIFICANT SPILL REPORTS SUMMARY
There were no significant/reportable spills of hydrocarbons, or other deleterious fluids, during 2008.
4.3 CHANGES MADE TO THE STORMWATER POLLUTION PREVENTION PLAN BEST MANAGEMENT PRACTICES
There are no changes planned to the SWPPP or to the BMPs described in the SWPPP at this time. All of the BMPs currently described in the SWPPP are good options for stormwater and associated sediment control at the site. As a result of the BMPs implemented on site, and the stabilization of the site post-construction, the turbidity observed in stormwater has been significantly reduced.
This annual report will be kept on file at the Niblack exploration camp office.

Niblack Exploration Project Annual Report May 12, 2009
5-1
5 ADEQUACY OF FINANCIAL RESPONSIBILITY
There have been no significant changes to inflation, required reclamation activities, or scope of the project from that presented in the Niblack Project Reclamation and Closure Plan. Acreage of disturbance for the various facilities requiring reclamation at project closure is the same or less than that used to calculate reclamation costs. Monitoring results to date provide no indication of revision required to the financial responsibility cost estimate of $1,221,408.

Niblack Exploration Project Annual Report May 12, 2009
6-1
6 REFERENCES
ADEC. 2003. Alaska water quality manual for toxic and deleterious organic and inorganic substances. As amended through May 15, 2003. State of Alaska Department of Environmental Conservation, Juneau, AK.
ADEC. 2007. Waste Management Permit 2006-DB0037, Niblack Exploration Project. State of Alaska Department of Environmental Conservation, Juneau, AK.
AWWA. 1998. Standard methods for the examination of water and wastewater. 20th Edition. Method 1030E, Data Quality. American Water Works Association, Denver, CO.
George, K. 2008. Personal communication (e-mail to D. Green, Niblack Mining Corporation, dated August 13, 2008, regarding Niblack water quality sampling). State of Alaska, Division of Water.
Gibbons, R.D. 1994. Statistical methods for groundwater monitoring. John Wiley & Sons Inc., New York. 286 pp.
Helsel, D.R. 2005. Nondetects and data analysis: statistics for censored environmental data. John Wiley & Sons, Inc., Hoboken, NJ.
Integral. 2007. Niblack Mining Corporation quality assurance project plan. Integral Consulting Inc., Portland, OR.
Integral. 2008a. Committee Bay Resources, Niblack Exploration Project, annual report. Integral Consulting Inc., Broomfield, CO.
Integral. 2008b. First quarter 2008 water quality monitoring report, Niblack Underground Exploration Project. Prepared for State of Alaska, Department of Environmental Conservation. Integral Consulting Inc., Broomfield, CO.
Knight Piesold. 2007. Niblack Mining Corporation, Niblack Project: Water quality baseline and site monitoring plan. Knight Piesold Consulting, Vancouver, BC, Canada. 200 pp.
Locke, B. 2008. Personal communication (memorandum to D. Green, Niblack Mining Corporation, dated July 10, 2008, regarding recommended changes to Niblack water quality monitoring program). Integral Consulting Inc., Broomfield, CO.
RTR. 2006. Niblack lookout unit initial construction/exploration project stormwater pollution prevention plan (SWPPP). RTR Resource Management, Inc., Boise, ID.
Niblack Exploration Project Annual Report May 12, 2009
6-2
USEPA. 2002. USEPA contract laboratory program national functional guidelines for inorganic data review. 540-R-01-008. U.S. Environmental Protection Agency, Office of Emergency and Remedial Response, Washington, DC.

FIGURES

Figure 1-1Niblack Project Location Map
Niblack Exploration Project2008 Annual Report

Figure 2-1Niblack Project Site As-Built Drawing
Niblack Exploration Project2008 Annual Report

Figure 2-2Water Treatment Facilities
As-Built DrawingNiblack Exploration Project
2008 Annual Report

EFF-1
Cam
pC
reek
Unna
med
Cree
k1
Unnamed Creek 2
Waterfall Creek
PAG Waste Disposal Area
NAG Waste Disposal Area
Settlement / Treatment Ponds
PortalMW-09
MW-08
MW-07
MW-04
MW-03
MW-02
MW-01
WQ-13
WQ-12
WQ-10
WQ-08
WQ-07
WQ-06
WQ-04
Figure 3-1Water Quality Monitoring Stations
Niblack Exploration Project 2008 Annual Report 8
Permit StationsSurface Water
Groundwater
Waste Rock Piles
Treatment Pond
Temporary Access Road
Topographic Source Boundary
Topographic Contours (50 ft interval)
Waterline
High Tide Waterline
Local Streams
E2EM1P-Estuarine-Emergent Intertidal
E2US1N Estuarine-Unvegetated Intertidal
PFO-4B -Needleleaf Forest Wetland
PFO-SS4B Needleleaf Forest/Scrub-Shrub Wetland
Source: Knight Piésold Consulting
\\192
.168
.3.1
1\gi
s\dm
\Pro
ject
s\C
384
-Nib
lack
\Map
Layo
uts_
Prod
uctio
n\20
08Q
1_Q
uarte
rly_R
epor
t_St
atio
n_Lo
catio
n_M
ap_2
0080
515.
mxd
-5/1
5/20
08@
3:32
:11
PM
0 280 560140
Feet
Surface Water:Waterfall Creek
0
100
200
300
400
500
600
Jan-0
6
Jul-0
6
Feb-0
7
Aug-07
Mar-08
Sep-08
Apr-09
Con
cent
ratio
n (µ
g/L)
WQ-08 (Upstream)
WQ-04 (Downstream)
Surface Water: Camp Creek
0
100
200
300
400
500
600
Jan-0
6
Jul-0
6
Feb-0
7
Aug-07
Mar-08
Sep-08
Apr-09
Con
cent
ratio
n (µ
g/L)
WQ-07 (Upstream)
WQ-06 (Downstream)
Surface Water: Unnamed Creek #1
0
100
200
300
400
500
600
Jan-0
6
Jul-0
6
Feb-0
7
Aug-07
Mar-08
Sep-08
Apr-09
Con
cent
ratio
n (µ
g/L)
WQ-12 (Upstream)
WQ-10 (Downstream)
Surface Water: Unnamed Creek #2
0
100
200
300
400
500
600
Jan-0
6
Jul-0
6
Feb-0
7
Aug-07
Mar-08
Sep-08
Apr-09
Con
cent
ratio
n (µ
g/L)
WQ-13
Surface Water Aluminum (Dissolved)
Surface Water Aluminum (Total)
Figure 3-2Time Series Plots: Total and Dissolved Aluminum
Surface WaterNiblack Exploration Project
2008 Annual Report
Surface Water: Waterfall Creek
0
100
200
300
400
500
600
Jan-0
6
Jul-0
6
Feb-0
7
Aug-07
Mar-08
Sep-08
Apr-09
Con
cent
ratio
n (µ
g/L)
WQ-08 (Upstream)
WQ-04 (Downstream)
Surface Water: Camp Creek
0
100
200
300
400
500
600
Jan-0
6
Jul-0
6
Feb-0
7
Aug-07
Mar-08
Sep-08
Apr-09
Con
cent
ratio
n (µ
g/L)
WQ-07 (Upstream)
WQ-06 (Downstream)
Surface Water: Unnamed Creek #1
0
100
200
300
400
500
600
Jan-0
6
Jul-0
6
Feb-0
7
Aug-07
Mar-08
Sep-08
Apr-09
Con
cent
ratio
n (µ
g/L)
WQ-12 (Upstream)
WQ-10 (Downstream)
Surface Water: Unnamed Creek #2
0
100
200
300
400
500
600
Jan-0
6
Jul-0
6
Feb-0
7
Aug-07
Mar-08
Sep-08
Apr-09
Con
cent
ratio
n (µ
g/L)
WQ-13
Station WQ-04 outlying values not shown at this scale:12/7/2006, 1,470 µg/L2/14/2008, 2,120 µg/L
Non-detect values shown at full detection limit as hollow symbols.
Groundwater Aluminum (Dissolved)
Groundwater Aluminum (Total)
Figure 3-3Time Series Plots: Total and Dissolved Aluminum
GroundwaterNiblack Exploration Project
2008 Annual Report
Non-detect values shown at full detection limit as hollow symbols.
Groundwater: Reference Stations
0
2000
4000
6000
8000
Jan-0
7
Apr-07
Jul-0
7
Oct-07
Feb-0
8
May-08
Aug-08
Dec-08
Con
cent
ratio
n (µ
g/L)
MW-07MW-08MW-09
Groundwater: MW-01, MW-02
0
2000
4000
6000
8000
Jan-0
7
Apr-07
Jul-0
7
Oct-07
Feb-0
8
May-08
Aug-08
Dec-08
Con
cent
ratio
n (µ
g/L)
MW-01
MW-02
Effluent
0
2000
4000
6000
8000
Jan-0
7
Apr-07
Jul-0
7
Oct-07
Feb-0
8
May-08
Aug-08
Dec-08
Con
cent
ratio
n (µ
g/L)
EFF-1
Groundwater: MW-03, MW-04
0
2000
4000
6000
8000
Jan-0
7
Apr-07
Jul-0
7
Oct-07
Feb-0
8
May-08
Aug-08
Dec-08
Con
cent
ratio
n (µ
g/L)
MW-03
MW-04
Groundwater: Reference Stations
0
2000
4000
6000
8000
Jan-0
7
Apr-07
Jul-0
7
Oct-07
Feb-0
8
May-08
Aug-08
Dec-08
Con
cent
ratio
n (µ
g/L)
MW-07MW-08MW-09
Groundwater: MW-01, MW-02
0
2000
4000
6000
8000
Jan-0
7
Apr-07
Jul-0
7
Oct-07
Feb-0
8
May-08
Aug-08
Dec-08
Con
cent
ratio
n (µ
g/L)
MW-01
MW-02
Effluent
0
2000
4000
6000
8000
Jan-0
7
Apr-07
Jul-0
7
Oct-07
Feb-0
8
May-08
Aug-08
Dec-08
Con
cent
ratio
n (µ
g/L)
11/13/200712/16/2007
Groundwater: MW-03, MW-04
0
2000
4000
6000
8000
Jan-0
7
Apr-07
Jul-0
7
Oct-07
Feb-0
8
May-08
Aug-08
Dec-08
Con
cent
ratio
n (µ
g/L)
MW-03
MW-04
Station MW-02 outlying value not shown at this scale:12/14/2007, 10,300 µg/L
Station MW-03 outlying value not shown at this scale:5/14/2007, 15,300 µg/L

Groundwater Arsenic (Dissolved)
Surface Water Arsenic (Dissolved)
Figure 3-4Time Series Plots: Dissolved Arsenic
Surface Water and GroundwaterNiblack Exploration Project
2008 Annual Report
Non-detect values shown at full detection limit as hollow symbols.
Surface Water: Waterfall Creek
-0.1
6E-16
0.1
0.2
0.3
0.4
0.5
0.6
.. ... .. .. . .. ..
Con
cent
ratio
n (µ
g/L)
WQ-08 (Upstream)
WQ-04 (Downstream)
Surface Water: Camp Creek
-0.1
6E-16
0.1
0.2
0.3
0.4
0.5
0.6
.. ... .. .. . .. ..
Con
cent
ratio
n (µ
g/L)
WQ-07 (Upstream)
WQ-06 (Downstream)
Surface Water: Unnamed Creek #1
-0.1
6E-16
0.1
0.2
0.3
0.4
0.5
0.6
.. ... .. .. . .. ..
Con
cent
ratio
n (µ
g/L)
WQ-12 (Upstream)
WQ-10 (Downstream)
Surface Water: Unnamed Creek #2
-0.1
6E-16
0.1
0.2
0.3
0.4
0.5
0.6
.. .. .. .. . .. ..
Con
cent
ratio
n (µ
g/L)
2/26/20074/10/2007
Groundwater: Reference Stations
0
0.2
0.4
0.6
0.8
1
1.2
Jan-0
7
Apr-07
Jul-0
7
Oct-07
Feb-0
8
May-08
Aug-08
Dec-08
Con
cent
ratio
n (µ
g/L)
MW-07MW-08MW-09
Groundwater: MW-01, MW-02
0
0.2
0.4
0.6
0.8
1
1.2
Jan-0
7
Apr-07
Jul-0
7
Oct-07
Feb-0
8
May-08
Aug-08
Dec-08
Con
cent
ratio
n (µ
g/L)
MW-01
MW-02
Effluent
0
0.5
1
1.5
2
2.5
3
3.5
Jan-0
7
Apr-07
Jul-0
7
Oct-07
Feb-0
8
May-08
Aug-08
Dec-08
Con
cent
ratio
n (µ
g/L)
11/13/200712/16/2007
Groundwater: MW-03, MW-04
0
0.2
0.4
0.6
0.8
1
1.2
Jan-0
7
Apr-07
Jul-0
7
Oct-07
Feb-0
8
May-08
Aug-08
Dec-08
Con
cent
ratio
n (µ
g/L)
MW-03
MW-04

Groundwater Cadmium (Dissolved)
Surface Water Cadmium (Dissolved)
Figure 3-5Time Series Plots: Dissolved Cadmium
Surface Water and GroundwaterNiblack Exploration Project
2008 Annual Report
Non-detect values shown at full detection limit as hollow symbols.
Surface Water: Waterfall Creek
0
0.005
0.01
0.015
0.02
0.025
0.03
0.035
Jan-0
6
Jul-0
6
Feb-0
7
Aug-07
Mar-08
Sep-08
Apr-09
Con
cent
ratio
n (µ
g/L)
WQ-08 (Upstream)
WQ-04 (Downstream)
Surface Water: Camp Creek
0
0.005
0.01
0.015
0.02
0.025
0.03
0.035
Jan-0
6
Jul-0
6
Feb-0
7
Aug-07
Mar-08
Sep-08
Apr-09
Con
cent
ratio
n (µ
g/L)
WQ-07 (Upstream)
WQ-06 (Downstream)
Surface Water: Unnamed Creek #1
0
0.005
0.01
0.015
0.02
0.025
0.03
0.035
Jan-0
6
Jul-0
6
Feb-0
7
Aug-07
Mar-08
Sep-08
Apr-09
Con
cent
ratio
n (µ
g/L)
WQ-12 (Upstream)
WQ-10 (Downstream)
Surface Water: Unnamed Creek #2
0
0.005
0.01
0.015
0.02
0.025
0.03
0.035
Jan-0
6
Jul-0
6
Feb-0
7
Aug-07
Mar-08
Sep-08
Apr-09
Con
cent
ratio
n (µ
g/L)
2/26/20074/10/2007
Groundwater: Reference Stations
0
0.02
0.04
0.06
0.08
0.1
Jan-0
7
Apr-07
Jul-0
7
Oct-07
Feb-0
8
May-08
Aug-08
Dec-08
Con
cent
ratio
n (µ
g/L)
MW-07MW-08MW-09
Groundwater: MW-01, MW-02
0
0.02
0.04
0.06
0.08
0.1
Jan-0
7
Apr-07
Jul-0
7
Oct-07
Feb-0
8
May-08
Aug-08
Dec-08
Con
cent
ratio
n (µ
g/L)
MW-01
MW-02
Effluent
0
0.02
0.04
0.06
0.08
0.1
Jan-0
7
Apr-07
Jul-0
7
Oct-07
Feb-0
8
May-08
Aug-08
Dec-08
Con
cent
ratio
n (µ
g/L)
11/13/200712/16/2007
Groundwater: MW-03, MW-04
0
0.02
0.04
0.06
0.08
0.1
Jan-0
7
Apr-07
Jul-0
7
Oct-07
Feb-0
8
May-08
Aug-08
Dec-08
Con
cent
ratio
n (µ
g/L)
MW-03
MW-04
Station MW-04 outlying value not shown at this scale:9/9/2008, 0.104 U, µg/L

Groundwater Copper (Dissolved)
Surface Water Copper (Dissolved)
Figure 3-6Time Series Plots: Dissolved Copper
Surface Water and GroundwaterNiblack Exploration Project
2008 Annual Report
Non-detect values shown at full detection limit as hollow symbols.
Surface Water: Waterfall Creek
0
0.5
1
1.5
2
2.5
3
3.5
4
Jan-0
6
Jul-0
6
Feb-0
7
Aug-07
Mar-08
Sep-08
Apr-09
Con
cent
ratio
n (µ
g/L)
WQ-08(Upstream)
WQ-04(Downstream)
Surface Water: Camp Creek
0
0.5
1
1.5
2
2.5
3
3.5
4
Jan-0
6
Jul-0
6
Feb-0
7
Aug-07
Mar-08
Sep-08
Apr-09
Con
cent
ratio
n (µ
g/L)
WQ-07 (Upstream)
WQ-06 (Downstream)
Surface Water: Unnamed Creek #1
0
0.5
1
1.5
2
2.5
3
3.5
4
Jan-0
6
Jul-0
6
Feb-0
7
Aug-07
Mar-08
Sep-08
Apr-09
Con
cent
ratio
n (µ
g/L)
WQ-12 (Upstream)
WQ-10 (Downstream)
Surface Water: Unnamed Creek #2
0
0.5
1
1.5
2
2.5
3
3.5
4
Jan-0
6
Jul-0
6
Feb-0
7
Aug-07
Mar-08
Sep-08
Apr-09
Con
cent
ratio
n (µ
g/L)
2/26/20074/10/2007
Groundwater: Reference Stations
0
1
2
3
4
5
6
7
Jan-0
7
Apr-07
Jul-0
7
Oct-07
Feb-0
8
May-08
Aug-08
Dec-08
Con
cent
ratio
n (µ
g/L)
MW-07MW-08MW-09
Groundwater: MW-01, MW-02
0
1
2
3
4
5
6
7
Jan-0
7
Apr-07
Jul-0
7
Oct-07
Feb-0
8
May-08
Aug-08
Dec-08
Con
cent
ratio
n (µ
g/L)
MW-01
MW-02
Effluent
0
1
2
3
4
5
6
7
Jan-0
7
Apr-07
Jul-0
7
Oct-07
Feb-0
8
May-08
Aug-08
Dec-08
Con
cent
ratio
n (µ
g/L)
11/13/200712/16/2007
Groundwater: MW-03, MW-04
0
1
2
3
4
5
6
7
Jan-0
7
Apr-07
Jul-0
7
Oct-07
Feb-0
8
May-08
Aug-08
Dec-08
Con
cent
ratio
n (µ
g/L)
MW-03
MW-04

Groundwater Lead (Dissolved)
Surface Water Lead (Dissolved)
Figure 3-7Time Series Plots: Dissolved Lead
Surface Water and GroundwaterNiblack Exploration Project
2008 Annual Report
Non-detect values shown at full detection limit as hollow symbols.
Surface Water: Waterfall Creek
-0.1
6E-16
0.1
0.2
0.3
0.4
0.5
0.6
. . . . . . .
Con
cent
ratio
n (µ
g/L)
WQ-08 (Upstream)
WQ-04 (Downstream)
Surface Water: Camp Creek
-0.1
6E-16
0.1
0.2
0.3
0.4
0.5
0.6
. . . . . . .
Con
cent
ratio
n (µ
g/L)
WQ-07 (Upstream)
WQ-06 (Downstream)
Surface Water: Unnamed Creek #1
-0.1
6E-16
0.1
0.2
0.3
0.4
0.5
0.6
. . . . . . .
Con
cent
ratio
n (µ
g/L)
WQ-12 (Upstream)
WQ-10 (Downstream)
Surface Water: Unnamed Creek #2
-0.1
6E-16
0.1
0.2
0.3
0.4
0.5
0.6
. . . . . . .
Con
cent
ratio
n (µ
g/L)
2/26/20074/10/2007
Groundwater: Reference Stations
0
0.4
0.8
1.2
1.6
2
Jan-0
7
Apr-07
Jul-0
7
Oct-07
Feb-0
8
May-08
Aug-08
Dec-08
Con
cent
ratio
n (µ
g/L)
MW-07MW-08MW-09
Groundwater: MW-01, MW-02
0
0.4
0.8
1.2
1.6
2
Jan-0
7
Apr-07
Jul-0
7
Oct-07
Feb-0
8
May-08
Aug-08
Dec-08
Con
cent
ratio
n (µ
g/L)
MW-01
MW-02
Effluent
0
0.4
0.8
1.2
1.6
2
Jan-0
7
Apr-07
Jul-0
7
Oct-07
Feb-0
8
May-08
Aug-08
Dec-08
Con
cent
ratio
n (µ
g/L)
11/13/200712/16/2007
Groundwater: MW-03, MW-04
0
0.4
0.8
1.2
1.6
2
Jan-0
7
Apr-07
Jul-0
7
Oct-07
Feb-0
8
May-08
Aug-08
Dec-08
Con
cent
ratio
n (µ
g/L)
MW-03
MW-04

Groundwater Mercury (Dissolved)
Surface Water Mercury (Dissolved)
Figure 3-8Time Series Plots: Dissolved Mercury
Surface Water and GroundwaterNiblack Exploration Project
2008 Annual Report
Non-detect values shown at full detection limit as hollow symbols.
Surface Water: Waterfall Creek
0
0.02
0.04
0.06
0.08
0.1
0.12
Jan-0
6
Jul-0
6
Feb-0
7
Aug-07
Mar-08
Sep-08
Apr-09
Con
cent
ratio
n (µ
g/L)
WQ-08 (Upstream)
WQ-04 (Downstream)
Surface Water: Camp Creek
0
0.02
0.04
0.06
0.08
0.1
0.12
Jan-0
6
Jul-0
6
Feb-0
7
Aug-07
Mar-08
Sep-08
Apr-09
Con
cent
ratio
n (µ
g/L)
WQ-07 (Upstream)
WQ-06 (Downstream)
Surface Water: Unnamed Creek #1
0
0.02
0.04
0.06
0.08
0.1
0.12
Jan-0
6
Jul-0
6
Feb-0
7
Aug-07
Mar-08
Sep-08
Apr-09
Con
cent
ratio
n (µ
g/L)
WQ-12 (Upstream)
WQ-10(Downstream)
Surface Water: Unnamed Creek #2
0
0.02
0.04
0.06
0.08
0.1
0.12
Jan-0
6
Jul-0
6
Feb-0
7
Aug-07
Mar-08
Sep-08
Apr-09
Con
cent
ratio
n (µ
g/L)
WQ-13
Groundwater: Reference Stations
0
0.02
0.04
0.06
0.08
0.1
Jan-0
7
Apr-07
Jul-0
7
Oct-07
Feb-0
8
May-08
Aug-08
Dec-08
Con
cent
ratio
n (µ
g/L)
MW-07MW-08MW-09
Groundwater: MW-01, MW-02
0
0.02
0.04
0.06
0.08
0.1
Jan-0
7
Apr-07
Jul-0
7
Oct-07
Feb-0
8
May-08
Aug-08
Dec-08
Con
cent
ratio
n (µ
g/L)
MW-01
MW-02
Effluent
0
0.02
0.04
0.06
0.08
0.1
Jan-0
7
Apr-07
Jul-0
7
Oct-07
Feb-0
8
May-08
Aug-08
Dec-08
Con
cent
ratio
n (µ
g/L)
11/13/200712/16/2007
Groundwater: MW-03, MW-04
0
0.02
0.04
0.06
0.08
0.1
Jan-0
7
Apr-07
Jul-0
7
Oct-07
Feb-0
8
May-08
Aug-08
Dec-08
Con
cent
ratio
n (µ
g/L)
MW-03
MW-04
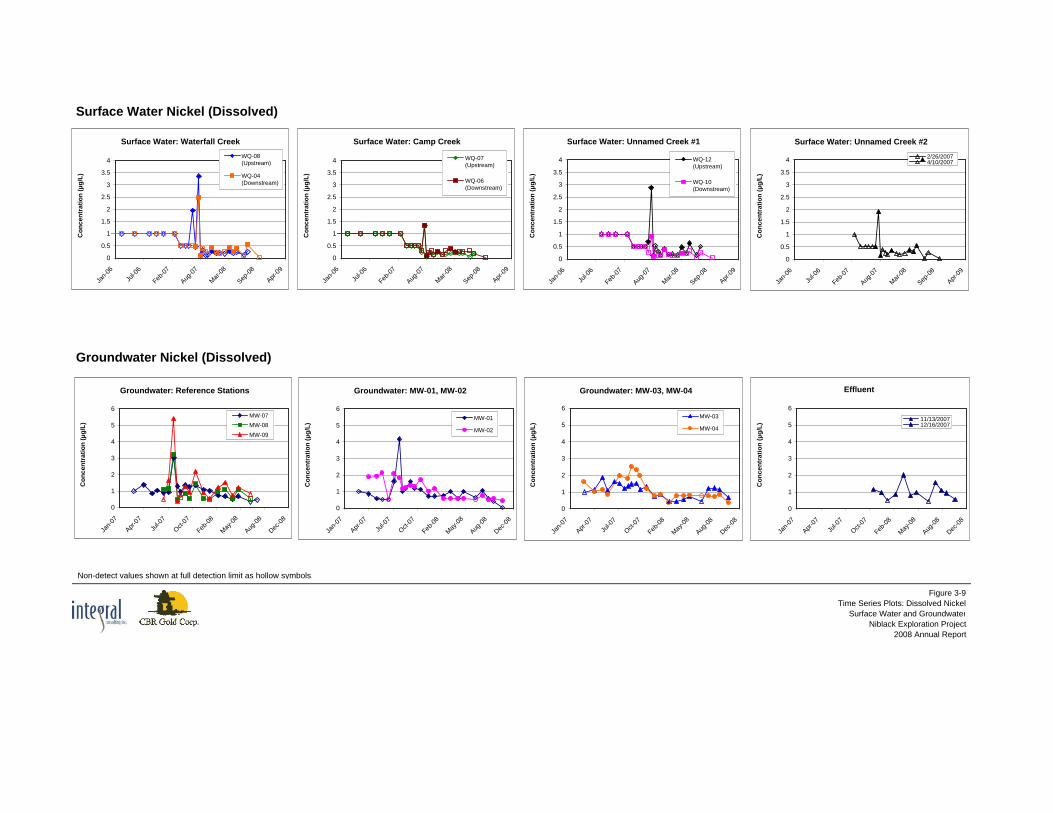
Groundwater Nickel (Dissolved)
Surface Water Nickel (Dissolved)
Figure 3-9Time Series Plots: Dissolved Nickel
Surface Water and GroundwaterNiblack Exploration Project
2008 Annual Report
Non-detect values shown at full detection limit as hollow symbols.
Surface Water: Waterfall Creek
0
0.5
1
1.5
2
2.5
3
3.5
4
Jan-0
6
Jul-0
6
Feb-0
7
Aug-07
Mar-08
Sep-08
Apr-09
Con
cent
ratio
n (µ
g/L)
WQ-08(Upstream)
WQ-04(Downstream)
Surface Water: Camp Creek
0
0.5
1
1.5
2
2.5
3
3.5
4
Jan-0
6
Jul-0
6
Feb-0
7
Aug-07
Mar-08
Sep-08
Apr-09
Con
cent
ratio
n (µ
g/L)
WQ-07(Upstream)
WQ-06(Downstream)
Surface Water: Unnamed Creek #1
0
0.5
1
1.5
2
2.5
3
3.5
4
Jan-0
6
Jul-0
6
Feb-0
7
Aug-07
Mar-08
Sep-08
Apr-09
Con
cent
ratio
n (µ
g/L)
WQ-12(Upstream)
WQ-10(Downstream)
Surface Water: Unnamed Creek #2
0
0.5
1
1.5
2
2.5
3
3.5
4
Jan-0
6
Jul-0
6
Feb-0
7
Aug-07
Mar-08
Sep-08
Apr-09
Con
cent
ratio
n (µ
g/L)
2/26/20074/10/2007
Groundwater: Reference Stations
0
1
2
3
4
5
6
Jan-0
7
Apr-07
Jul-0
7
Oct-07
Feb-0
8
May-08
Aug-08
Dec-08
Con
cent
ratio
n (µ
g/L)
MW-07MW-08MW-09
Groundwater: MW-01, MW-02
0
1
2
3
4
5
6
Jan-0
7
Apr-07
Jul-0
7
Oct-07
Feb-0
8
May-08
Aug-08
Dec-08
Con
cent
ratio
n (µ
g/L)
MW-01
MW-02
Effluent
0
1
2
3
4
5
6
Jan-0
7
Apr-07
Jul-0
7
Oct-07
Feb-0
8
May-08
Aug-08
Dec-08
Con
cent
ratio
n (µ
g/L)
11/13/200712/16/2007
Groundwater: MW-03, MW-04
0
1
2
3
4
5
6
Jan-0
7
Apr-07
Jul-0
7
Oct-07
Feb-0
8
May-08
Aug-08
Dec-08
Con
cent
ratio
n (µ
g/L)
MW-03
MW-04

Groundwater Selenium (Dissolved)
Surface Water Selenium (Dissolved)
Figure 3-10Time Series Plots: Dissolved Selenium
Surface Water and GroundwaterNiblack Exploration Project
2008 Annual Report
Non-detect values shown at full detection limit as hollow symbols.
Surface Water: Waterfall Creek
0
0.2
0.4
0.6
0.8
1
1.2
Jan-0
6
Jul-0
6
Feb-0
7
Aug-07
Mar-08
Sep-08
Apr-09
Con
cent
ratio
n (µ
g/L)
WQ-08(Upstream)
WQ-04(Downstream)
Surface Water: Camp Creek
0
0.2
0.4
0.6
0.8
1
1.2
Jan-0
6
Jul-0
6
Feb-0
7
Aug-07
Mar-08
Sep-08
Apr-09
Con
cent
ratio
n (µ
g/L)
WQ-07(Upstream)
WQ-06(Downstream)
Surface Water: Unnamed Creek #1
0
0.2
0.4
0.6
0.8
1
1.2
Jan-0
6
Jul-0
6
Feb-0
7
Aug-07
Mar-08
Sep-08
Apr-09
Con
cent
ratio
n (µ
g/L)
WQ-12(Upstream)
WQ-10(Downstream)
Surface Water: Unnamed Creek #2
0
0.2
0.4
0.6
0.8
1
1.2
Jan-0
6
Jul-0
6
Feb-0
7
Aug-07
Mar-08
Sep-08
Apr-09
Con
cent
ratio
n (µ
g/L)
2/26/20074/10/2007
Groundwater: Reference Stations
0
0.5
1
1.5
2
2.5
3
Jan-0
7
Apr-07
Jul-0
7
Oct-07
Feb-0
8
May-08
Aug-08
Dec-08
Con
cent
ratio
n (µ
g/L)
MW-07MW-08MW-09
Groundwater: MW-01, MW-02
0
0.5
1
1.5
2
2.5
3
Jan-0
7
Apr-07
Jul-0
7
Oct-07
Feb-0
8
May-08
Aug-08
Dec-08
Con
cent
ratio
n (µ
g/L)
MW-01
MW-02
Effluent
0
0.5
1
1.5
2
2.5
3
Jan-0
7
Apr-07
Jul-0
7
Oct-07
Feb-0
8
May-08
Aug-08
Dec-08
Con
cent
ratio
n (µ
g/L)
11/13/200712/16/2007
Groundwater: MW-03, MW-04
0
0.5
1
1.5
2
2.5
3
Jan-0
7
Apr-07
Jul-0
7
Oct-07
Feb-0
8
May-08
Aug-08
Dec-08
Con
cent
ratio
n (µ
g/L)
MW-03
MW-04
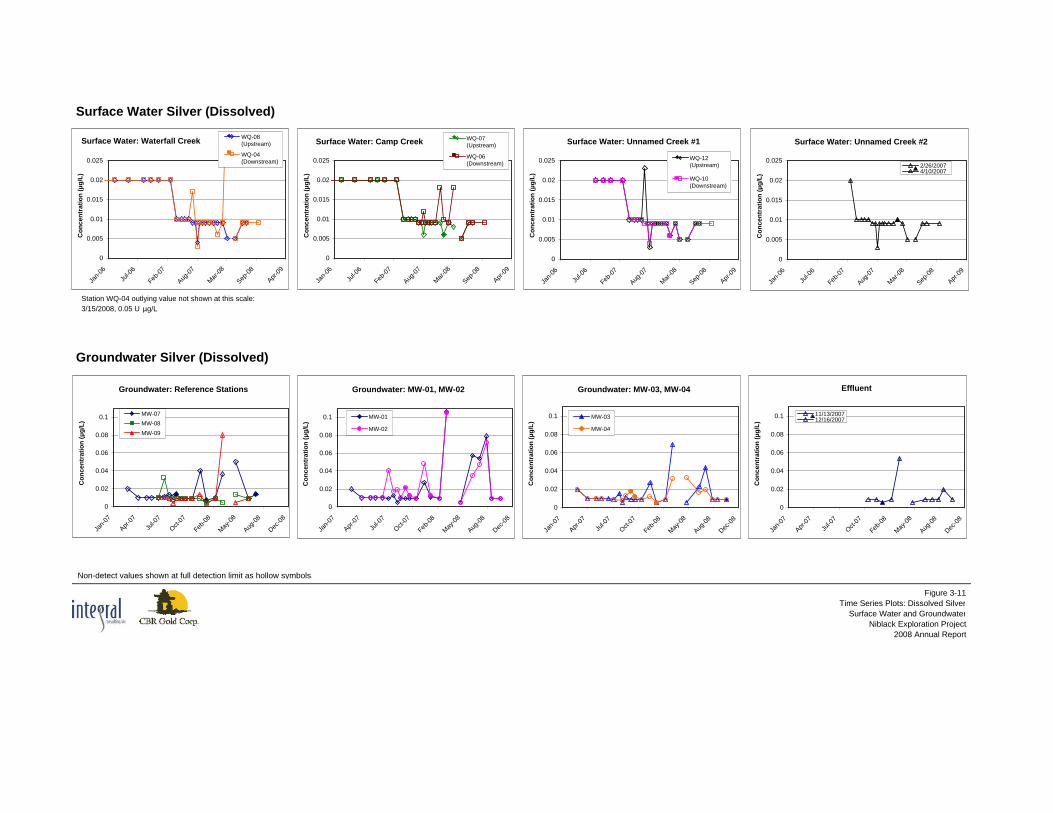
Groundwater Silver (Dissolved)
Surface Water Silver (Dissolved)
Figure 3-11Time Series Plots: Dissolved Silver
Surface Water and GroundwaterNiblack Exploration Project
2008 Annual Report
Non-detect values shown at full detection limit as hollow symbols.
Surface Water: Waterfall Creek
0
0.005
0.01
0.015
0.02
0.025
Jan-0
6
Jul-0
6
Feb-0
7
Aug-07
Mar-08
Sep-08
Apr-09
Con
cent
ratio
n (µ
g/L)
WQ-08(Upstream)
WQ-04(Downstream)
Surface Water: Camp Creek
0
0.005
0.01
0.015
0.02
0.025
Jan-0
6
Jul-0
6
Feb-0
7
Aug-07
Mar-08
Sep-08
Apr-09
Con
cent
ratio
n (µ
g/L)
WQ-07(Upstream)
WQ-06(Downstream)
Surface Water: Unnamed Creek #1
0
0.005
0.01
0.015
0.02
0.025
Jan-0
6
Jul-0
6
Feb-0
7
Aug-07
Mar-08
Sep-08
Apr-09
Con
cent
ratio
n (µ
g/L)
WQ-12(Upstream)
WQ-10(Downstream)
Surface Water: Unnamed Creek #2
0
0.005
0.01
0.015
0.02
0.025
Jan-0
6
Jul-0
6
Feb-0
7
Aug-07
Mar-08
Sep-08
Apr-09
Con
cent
ratio
n (µ
g/L)
2/26/20074/10/2007
Groundwater: Reference Stations
0
0.02
0.04
0.06
0.08
0.1
Jan-0
7
Apr-07
Jul-0
7
Oct-07
Feb-0
8
May-08
Aug-08
Dec-08
Con
cent
ratio
n (µ
g/L)
MW-07MW-08MW-09
Groundwater: MW-01, MW-02
0
0.02
0.04
0.06
0.08
0.1
Jan-0
7
Apr-07
Jul-0
7
Oct-07
Feb-0
8
May-08
Aug-08
Dec-08
Con
cent
ratio
n (µ
g/L)
MW-01
MW-02
Effluent
0
0.02
0.04
0.06
0.08
0.1
Jan-0
7
Apr-07
Jul-0
7
Oct-07
Feb-0
8
May-08
Aug-08
Dec-08
Con
cent
ratio
n (µ
g/L)
11/13/200712/16/2007
Groundwater: MW-03, MW-04
0
0.02
0.04
0.06
0.08
0.1
Jan-0
7
Apr-07
Jul-0
7
Oct-07
Feb-0
8
May-08
Aug-08
Dec-08
Con
cent
ratio
n (µ
g/L)
MW-03
MW-04
Station WQ-04 outlying value not shown at this scale:3/15/2008, 0.05 U µg/L
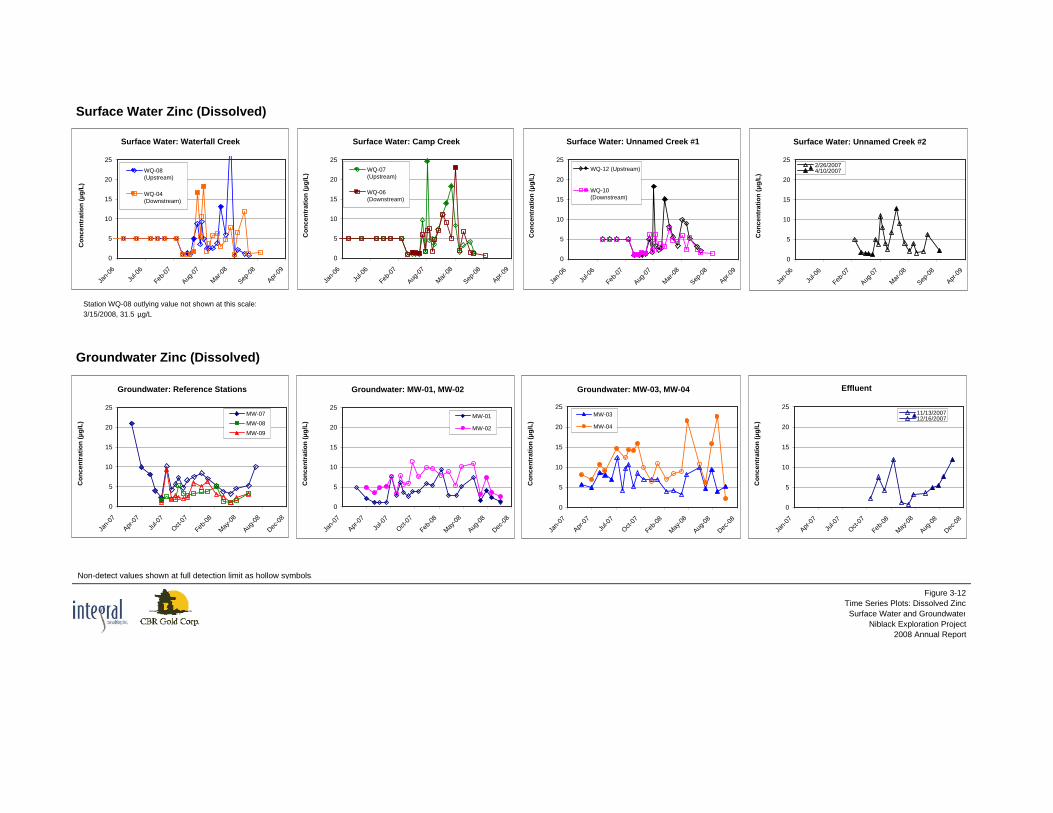
Groundwater Zinc (Dissolved)
Surface Water Zinc (Dissolved)
Figure 3-12Time Series Plots: Dissolved ZincSurface Water and Groundwater
Niblack Exploration Project2008 Annual Report
Non-detect values shown at full detection limit as hollow symbols.
Surface Water: Waterfall Creek
0
5
10
15
20
25
Jan-0
6
Jul-0
6
Feb-0
7
Aug-07
Mar-08
Sep-08
Apr-09
Con
cent
ratio
n (µ
g/L)
WQ-08(Upstream)
WQ-04(Downstream)
Surface Water: Camp Creek
0
5
10
15
20
25
Jan-0
6
Jul-0
6
Feb-0
7
Aug-07
Mar-08
Sep-08
Apr-09
Con
cent
ratio
n (µ
g/L)
WQ-07(Upstream)
WQ-06(Downstream)
Surface Water: Unnamed Creek #1
0
5
10
15
20
25
Jan-0
6
Jul-0
6
Feb-0
7
Aug-07
Mar-08
Sep-08
Apr-09
Con
cent
ratio
n (µ
g/L)
WQ-12 (Upstream)
WQ-10(Downstream)
Surface Water: Unnamed Creek #2
0
5
10
15
20
25
Jan-0
6
Jul-0
6
Feb-0
7
Aug-07
Mar-08
Sep-08
Apr-09
Con
cent
ratio
n (µ
g/L)
2/26/20074/10/2007
Groundwater: Reference Stations
0
5
10
15
20
25
Jan-0
7
Apr-07
Jul-0
7
Oct-07
Feb-0
8
May-08
Aug-08
Dec-08
Con
cent
ratio
n (µ
g/L)
MW-07MW-08MW-09
Groundwater: MW-01, MW-02
0
5
10
15
20
25
Jan-0
7
Apr-07
Jul-0
7
Oct-07
Feb-0
8
May-08
Aug-08
Dec-08
Con
cent
ratio
n (µ
g/L)
MW-01
MW-02
Effluent
0
5
10
15
20
25
Jan-0
7
Apr-07
Jul-0
7
Oct-07
Feb-0
8
May-08
Aug-08
Dec-08
Con
cent
ratio
n (µ
g/L)
11/13/200712/16/2007
Groundwater: MW-03, MW-04
0
5
10
15
20
25
Jan-0
7
Apr-07
Jul-0
7
Oct-07
Feb-0
8
May-08
Aug-08
Dec-08
Con
cent
ratio
n (µ
g/L)
MW-03
MW-04
Station WQ-08 outlying value not shown at this scale:3/15/2008, 31.5 µg/L
TABLES
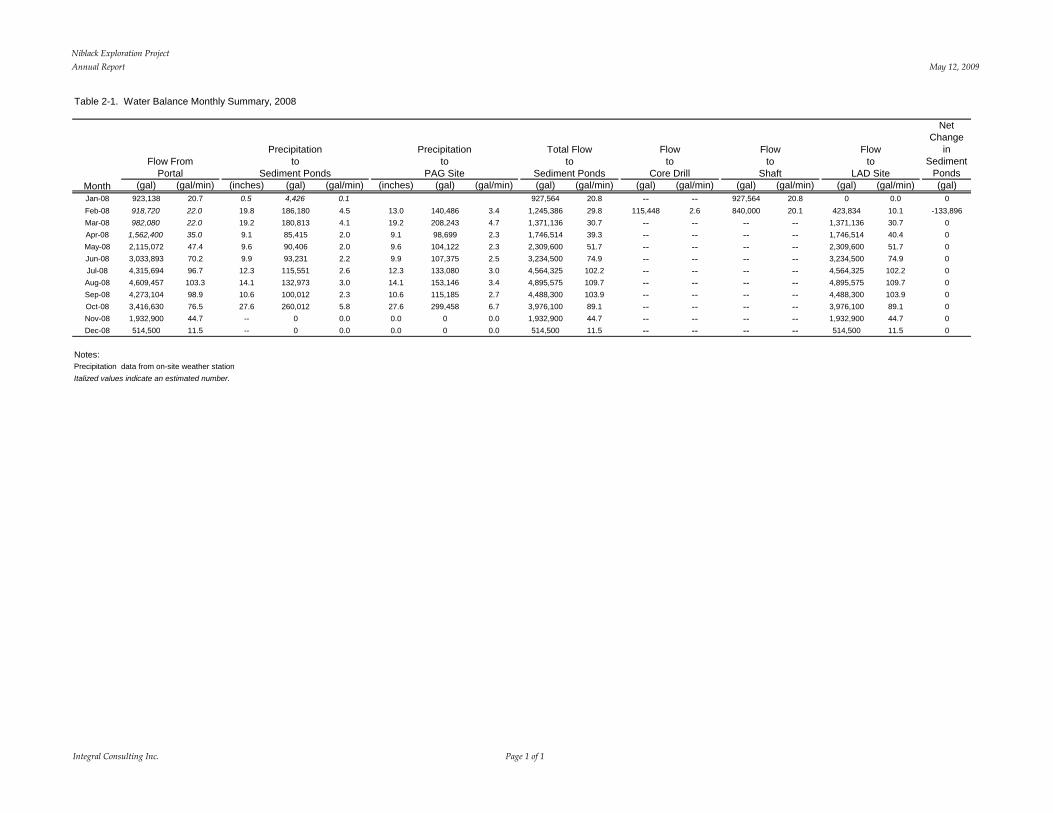
Niblack Exploration ProjectAnnual Report May 12, 2009
Integral Consulting Inc. Page 1 of 1
Table 2-1. Water Balance Monthly Summary, 2008
Net Change
in Sediment
Ponds(gal) (gal/min) (inches) (gal) (gal/min) (inches) (gal) (gal/min) (gal) (gal/min) (gal) (gal/min) (gal) (gal/min) (gal) (gal/min) (gal)
Jan-08 923,138 20.7 0.5 4,426 0.1 927,564 20.8 -- -- 927,564 20.8 0 0.0 0Feb-08 918,720 22.0 19.8 186,180 4.5 13.0 140,486 3.4 1,245,386 29.8 115,448 2.6 840,000 20.1 423,834 10.1 -133,896Mar-08 982,080 22.0 19.2 180,813 4.1 19.2 208,243 4.7 1,371,136 30.7 -- -- -- -- 1,371,136 30.7 0Apr-08 1,562,400 35.0 9.1 85,415 2.0 9.1 98,699 2.3 1,746,514 39.3 -- -- -- -- 1,746,514 40.4 0May-08 2,115,072 47.4 9.6 90,406 2.0 9.6 104,122 2.3 2,309,600 51.7 -- -- -- -- 2,309,600 51.7 0Jun-08 3,033,893 70.2 9.9 93,231 2.2 9.9 107,375 2.5 3,234,500 74.9 -- -- -- -- 3,234,500 74.9 0Jul-08 4,315,694 96.7 12.3 115,551 2.6 12.3 133,080 3.0 4,564,325 102.2 -- -- -- -- 4,564,325 102.2 0Aug-08 4,609,457 103.3 14.1 132,973 3.0 14.1 153,146 3.4 4,895,575 109.7 -- -- -- -- 4,895,575 109.7 0Sep-08 4,273,104 98.9 10.6 100,012 2.3 10.6 115,185 2.7 4,488,300 103.9 -- -- -- -- 4,488,300 103.9 0Oct-08 3,416,630 76.5 27.6 260,012 5.8 27.6 299,458 6.7 3,976,100 89.1 -- -- -- -- 3,976,100 89.1 0Nov-08 1,932,900 44.7 -- 0 0.0 0.0 0 0.0 1,932,900 44.7 -- -- -- -- 1,932,900 44.7 0Dec-08 514,500 11.5 -- 0 0.0 0.0 0 0.0 514,500 11.5 -- -- -- -- 514,500 11.5 0
Notes:Precipitation data from on-site weather stationItalized values indicate an estimated number.
Flowto
Core Drill
Flowto
LAD Site
Total Flowto
Sediment Ponds
Flowto
ShaftMonth
Flow FromPortal
Precipitationto
Sediment Ponds
Precipitationto
PAG Site

Niblack Exploration ProjectAnnual Report May 12, 2009
Integral Consulting Inc. Page 1 of 2
Table 3-12. Results of Natural Condition Criteria Comparisons for Surface Water, 2008
Analyte Fraction
NC Criteria(All ND Included)a
ug/L
NC Criteria(High ND Excluded)b
ug/L Event Event Period
WQ-08(Waterfall Creek
upstream)
WQ-04(Waterfall Creek
downstream)
WQ-07(Camp Creek
upstream)
WQ-06(Camp Creek downstream)
WQ-12(Unnamed Creek #1
upstream)
WQ-10(Unnamed Creek #1
downstream)WQ-13
(Unnamed Creek #2)Aluminum Dissolved 42.5 all detected October 1996 II Pre-site activity -- nd -- nd -- -- --Aluminum Dissolved 42.5 all detected April 2005 II Pre-site activity -- n/a -- n/a -- -- --Aluminum Dissolved 42.5 all detected February 2006 II Pre-site activity n/a n/a n/a n/a -- -- --Aluminum Dissolved 42.5 all detected May 2006 II Pre-site activity n/a n/a n/a n/a -- -- --Aluminum Dissolved 42.5 all detected August 2006 II Pre-site activity n/a n/a n/a n/a n/a n/a --Aluminum Dissolved 42.5 all detected October 2006 Pre-site activity n/a n/a n/a n/a n/a n/a --Aluminum Dissolved 42.5 all detected December 2006 Pre-site activity n/a n/a n/a n/a n/a n/a --Aluminum Dissolved 42.5 all detected February 2007 Pre-site activity n/a n/a n/a n/a n/a n/a n/aAluminum Dissolved 42.5 all detected April 2007 Pre-site activity n/a n/a n/a n/a n/a n/a n/aAluminum Dissolved 42.5 all detected May 2007 Pre-site activity n/a n/a n/a n/a n/a n/a n/aAluminum Dissolved 42.5 all detected June 2007 Pre-site activity n/a n/a n/a n/a n/a n/a n/aAluminum Dissolved 42.5 all detected July 2007 I Pre-site activity n/a n/a n/a n/a n/a n/a n/aAluminum Dissolved 42.5 all detected July 2007 II Pre-site activity n/a n/a n/a n/a n/a n/a n/aAluminum Dissolved 42.5 all detected August 2007 I Pre-site activity n/a n/a n/a n/a n/a n/a n/aAluminum Dissolved 42.5 all detected August 2007 II Pre-site activity n/a n/a n/a n/a n/a n/a n/aAluminum Dissolved 42.5 all detected September 2007 I Pre-site activity n/a n/a n/a n/a n/a n/a n/aAluminum Dissolved 42.5 all detected September 2007 II Ongoing site activity n/a n/a n/a n/a n/a n/a --Aluminum Dissolved 42.5 all detected October 2007 Ongoing site activity n/a n/a n/a n/a n/a n/a --Aluminum Dissolved 42.5 all detected November 2007 Ongoing site activity n/a n/a n/a n/a n/a n/a --Aluminum Dissolved 42.5 all detected December 2007 I Ongoing site activity n/a n/a n/a n/a n/a n/a --Aluminum Dissolved 42.5 all detected January 2008 Ongoing site activity n/a n/a n/a n/a n/a n/a --Aluminum Dissolved 42.5 all detected Februrary 2008 Ongoing site activity n/a n/a n/a n/a n/a n/a --Aluminum Dissolved 42.5 all detected March 2008 Ongoing site activity n/a n/a n/a n/a n/a n/a --Aluminum Dissolved 42.5 all detected April 2008 Ongoing site activity n/a n/a n/a n/a n/a n/a --Aluminum Dissolved 42.5 all detected May 2008 Ongoing site activity n/a n/a n/a n/a n/a n/a --Aluminum Dissolved 42.5 all detected June 2008 Ongoing site activity n/a n/a n/a n/a n/a n/a --Aluminum Dissolved 42.5 all detected July 2008 Ongoing site activity n/a n/a n/a n/a n/a n/a --Aluminum Dissolved 42.5 all detected October 2008 Ongoing site activity -- n/a -- n/a -- n/a --Aluminum Total 55.4 all detected October 1996 II Pre-site activity -- nd -- nd -- -- --Aluminum Total 55.4 all detected April 2005 II Pre-site activity -- n/a -- n/a -- -- --Aluminum Total 55.4 all detected February 2006 II Pre-site activity n/a n/a n/a n/a -- -- --Aluminum Total 55.4 all detected May 2006 II Pre-site activity n/a n/a n/a n/a -- -- --Aluminum Total 55.4 all detected August 2006 II Pre-site activity n/a n/a n/a n/a n/a n/a --Aluminum Total 55.4 all detected October 2006 Pre-site activity n/a n/a n/a n/a n/a n/a --Aluminum Total 55.4 all detected December 2006 Pre-site activity n/a n/a n/a n/a n/a n/a --Aluminum Total 55.4 all detected February 2007 Pre-site activity n/a n/a n/a n/a n/a n/a n/aAluminum Total 55.4 all detected April 2007 Pre-site activity n/a n/a n/a n/a n/a n/a n/aAluminum Total 55.4 all detected May 2007 Pre-site activity n/a n/a n/a n/a n/a n/a n/aAluminum Total 55.4 all detected June 2007 Pre-site activity n/a n/a n/a n/a n/a n/a n/aAluminum Total 55.4 all detected July 2007 I Pre-site activity n/a n/a n/a n/a n/a n/a n/aAluminum Total 55.4 all detected July 2007 II Pre-site activity n/a n/a n/a n/a n/a n/a n/aAluminum Total 55.4 all detected August 2007 I Pre-site activity n/a n/a n/a n/a n/a n/a n/aAluminum Total 55.4 all detected August 2007 II Pre-site activity n/a n/a n/a n/a n/a n/a n/aAluminum Total 55.4 all detected September 2007 I Pre-site activity n/a n/a n/a n/a n/a n/a n/aAluminum Total 55.4 all detected September 2007 II Ongoing site activity n/a n/a n/a n/a n/a n/a --Aluminum Total 55.4 all detected October 2007 Ongoing site activity n/a n/a n/a n/a n/a n/a --Aluminum Total 55.4 all detected November 2007 Ongoing site activity n/a n/a n/a n/a n/a n/a --Aluminum Total 55.4 all detected December 2007 I Ongoing site activity n/a n/a n/a n/a n/a n/a --Aluminum Total 55.4 all detected January 2008 Ongoing site activity n/a n/a n/a n/a n/a n/a --Aluminum Total 55.4 all detected Februrary 2008 Ongoing site activity n/a n/a n/a n/a n/a n/a --Aluminum Total 55.4 all detected March 2008 Ongoing site activity n/a n/a n/a n/a n/a n/a --Aluminum Total 55.4 all detected April 2008 Ongoing site activity n/a n/a n/a n/a n/a n/a --Aluminum Total 55.4 all detected May 2008 Ongoing site activity n/a n/a n/a n/a n/a n/a --Aluminum Total 55.4 all detected June 2008 Ongoing site activity n/a n/a n/a n/a n/a n/a --Aluminum Total 55.4 all detected July 2008 Ongoing site activity n/a n/a n/a n/a n/a n/a --Aluminum Total 55.4 all detected October 2008 Ongoing site activity -- n/a -- n/a -- n/a --

Niblack Exploration ProjectAnnual Report May 12, 2009
Integral Consulting Inc. Page 2 of 2
Table 3-12. Results of Natural Condition Criteria Comparisons for Surface Water, 2008
Analyte Fraction
NC Criteria(All ND Included)a
ug/L
NC Criteria(High ND Excluded)b
ug/L Event Event Period
WQ-08(Waterfall Creek
upstream)
WQ-04(Waterfall Creek
downstream)
WQ-07(Camp Creek
upstream)
WQ-06(Camp Creek downstream)
WQ-12(Unnamed Creek #1
upstream)
WQ-10(Unnamed Creek #1
downstream)WQ-13
(Unnamed Creek #2)
Copper Dissolved fnd > 20% 0.838 October 1996 II Pre-site activity -- nd -- nd -- -- --Copper Dissolved fnd > 20% 0.838 September 1997 Pre-site activity -- nd -- nd -- -- --Copper Dissolved fnd > 20% 0.838 April 2005 II Pre-site activity -- nd -- fail -- -- --Copper Dissolved fnd > 20% 0.838 February 2006 II Pre-site activity nd nd nd nd -- -- --Copper Dissolved fnd > 20% 0.838 May 2006 II Pre-site activity nd nd nd nd -- -- --Copper Dissolved fnd > 20% 0.838 August 2006 II Pre-site activity fail fail fail fail nd fail --Copper Dissolved fnd > 20% 0.838 October 2006 Pre-site activity nd nd nd nd fail fail --Copper Dissolved fnd > 20% 0.838 December 2006 Pre-site activity nd nd nd nd nd nd --Copper Dissolved fnd > 20% 0.838 February 2007 Pre-site activity nd nd nd nd nd nd ndCopper Dissolved fnd > 20% 0.838 April 2007 Pre-site activity pass pass pass pass pass pass failCopper Dissolved fnd > 20% 0.838 May 2007 Pre-site activity pass fail pass pass nd fail failCopper Dissolved fnd > 20% 0.838 June 2007 Pre-site activity fail fail fail fail fail fail failCopper Dissolved fnd > 20% 0.838 July 2007 I Pre-site activity fail fail fail fail pass pass failCopper Dissolved fnd > 20% 0.838 July 2007 II Pre-site activity pass pass pass pass nd fail failCopper Dissolved fnd > 20% 0.838 August 2007 I Pre-site activity pass pass pass pass pass fail passCopper Dissolved fnd > 20% 0.838 August 2007 II Pre-site activity fail fail pass pass pass fail failCopper Dissolved fnd > 20% 0.838 September 2007 I Pre-site activity pass pass pass pass pass fail failCopper Dissolved fnd > 20% 0.838 September 2007 II Ongoing site activity fail fail fail fail pass fail --Copper Dissolved fnd > 20% 0.838 October 2007 Ongoing site activity fail fail fail fail fail fail --Copper Dissolved fnd > 20% 0.838 November 2007 Ongoing site activity pass fail pass pass pass pass --Copper Dissolved fnd > 20% 0.838 December 2007 I Ongoing site activity fail fail fail pass pass fail --Copper Dissolved fnd > 20% 0.838 January 2008 Ongoing site activity pass pass nd pass pass fail --Copper Dissolved fnd > 20% 0.838 Februrary 2008 Ongoing site activity pass fail pass pass pass pass --Copper Dissolved fnd > 20% 0.838 March 2008 Ongoing site activity pass pass nd nd nd fail --Copper Dissolved fnd > 20% 0.838 April 2008 Ongoing site activity pass pass pass pass pass pass --Copper Dissolved fnd > 20% 0.838 May 2008 Ongoing site activity fail pass fail fail nd fail --Copper Dissolved fnd > 20% 0.838 June 2008 Ongoing site activity nd nd nd nd nd nd --Copper Dissolved fnd > 20% 0.838 July 2008 Ongoing site activity pass fail pass pass pass fail --Copper Dissolved fnd > 20% 0.838 October 2008 Ongoing site activity -- nd -- nd -- nd --
Notes: -- = Sample not collectedn/a = The Natural Conditions Tool calculated criteria of 55.4 ug/L (total) and 42.5 ug/L (dissolved) are less than the Alaska Department of Environmental Conservation (ADEC) chronic aquatic life criterion of 87 ug/L; therefore, the Natural Conditions criteria do not apply.nd = Screening not conducted for nondetected samples.fnd > 20% = Frequency of ND data greater than 20%; fails minimum data requirements of Natural Conditions Tool.a All ND included indicates that all nondetect data values were included in the Natural Conditions Tool analysis at the full detection limit and were flagged as nondetect values.b High ND excluded indicates that, prior to analysis with the Natural Conditions Tool, high nondetect values were screened out of the reference data set. High nondetects were defined as any nondetect value that was higher than the lowest detected value.

Niblack Exploration ProjectAnnual Report May 12, 2009
Integral Consulting Inc. Page 1 of 3
Table 3-13. Results of Natural Condition Criteria Comparisons for Groundwater, 2008
Analyte Fraction
NC Criteria(All ND Included)a
ug/L
(High ND
Excluded)b
ug/L Event Event PeriodMW-07
(Offsite reference)
MW-01(Wetlands below
NAG site)
MW-02(Wetlands below treatment ponds)
MW-03(Wetlands below
PAG site)
MW-04(Wetlands below
infiltration system)Aluminum Total 548 n/a February 2007 Pre-site activity fail fail -- fail failAluminum Total 548 n/a April 2007 Pre-site activity fail fail fail fail failAluminum Total 548 n/a May 2007 Pre-site activity fail fail fail fail failAluminum Total 548 n/a June 2007 Pre-site activity pass pass fail fail failAluminum Total 548 n/a July 2007 I Pre-site activity pass pass pass fail --Aluminum Total 548 n/a July 2007 II Pre-site activity pass pass fail fail failAluminum Total 548 n/a August 2007 I Pre-site activity pass pass fail fail --Aluminum Total 548 n/a August 2007 II Pre-site activity pass pass fail fail failAluminum Total 548 n/a September 2007 I Pre-site activity fail pass fail fail failAluminum Total 548 n/a September 2007 II Ongoing site activity fail fail fail fail failAluminum Total 548 n/a October 2007 Ongoing site activity pass pass fail fail failAluminum Total 548 n/a November 2007 Ongoing site activity pass pass fail fail failAluminum Total 548 n/a December 2007 I Ongoing site activity fail fail fail fail failAluminum Total 548 n/a January 2008 Ongoing site activity fail pass fail pass passAluminum Total 548 n/a Februrary 2008 Ongoing site activity pass fail fail fail passAluminum Total 548 n/a March 2008 Ongoing site activity pass pass fail pass passAluminum Total 548 n/a April 2008 Ongoing site activity pass pass fail pass passAluminum Total 548 n/a May 2008 Ongoing site activity pass pass fail pass passAluminum Total 548 n/a June 2008 Ongoing site activity fail pass fail fail failAluminum Total 548 n/a July 2008 Ongoing site activity pass pass fail fail passAluminum Total 548 n/a August 2008 Ongoing site activity -- pass fail fail failAluminum Total 548 n/a September 2008 Ongoing site activity -- pass fail fail passAluminum Total 548 n/a October 2008 Ongoing site activity -- pass fail fail passAluminum Dissolved 217 n/a February 2007 Pre-site activity fail pass -- fail failAluminum Dissolved 217 n/a April 2007 Pre-site activity fail pass fail fail failAluminum Dissolved 217 n/a May 2007 Pre-site activity fail pass fail fail failAluminum Dissolved 217 n/a June 2007 Pre-site activity fail pass fail fail failAluminum Dissolved 217 n/a July 2007 I Pre-site activity pass pass pass fail --Aluminum Dissolved 217 n/a July 2007 II Pre-site activity fail pass fail fail failAluminum Dissolved 217 n/a August 2007 I Pre-site activity fail pass fail fail --Aluminum Dissolved 217 n/a August 2007 II Pre-site activity pass fail fail fail failAluminum Dissolved 217 n/a September 2007 I Pre-site activity fail fail fail fail failAluminum Dissolved 217 n/a September 2007 II Ongoing site activity fail fail fail fail failAluminum Dissolved 217 n/a October 2007 Ongoing site activity fail fail fail fail failAluminum Dissolved 217 n/a November 2007 Ongoing site activity pass fail fail fail failAluminum Dissolved 217 n/a December 2007 I Ongoing site activity fail pass fail fail failAluminum Dissolved 217 n/a January 2008 Ongoing site activity pass nd fail pass passAluminum Dissolved 217 n/a Februrary 2008 Ongoing site activity pass pass fail fail passAluminum Dissolved 217 n/a March 2008 Ongoing site activity pass pass fail fail passAluminum Dissolved 217 n/a April 2008 Ongoing site activity pass pass fail fail passAluminum Dissolved 217 n/a May 2008 Ongoing site activity pass pass fail fail passAluminum Dissolved 217 n/a June 2008 Ongoing site activity pass fail fail fail failAluminum Dissolved 217 n/a July 2008 Ongoing site activity pass fail fail fail failAluminum Dissolved 217 n/a August 2008 Ongoing site activity -- fail fail fail failAluminum Dissolved 217 n/a September 2008 Ongoing site activity -- fail fail fail fail

Niblack Exploration ProjectAnnual Report May 12, 2009
Integral Consulting Inc. Page 2 of 3
Table 3-13. Results of Natural Condition Criteria Comparisons for Groundwater, 2008
Analyte Fraction
NC Criteria(All ND Included)a
ug/L
(High ND
Excluded)b
ug/L Event Event PeriodMW-07
(Offsite reference)
MW-01(Wetlands below
NAG site)
MW-02(Wetlands below treatment ponds)
MW-03(Wetlands below
PAG site)
MW-04(Wetlands below
infiltration system)Aluminum Dissolved 217 n/a October 2008 Ongoing site activity -- pass fail fail failCopper Dissolved NC tool failure 1.65 February 2007 Pre-site activity fail fail -- fail failCopper Dissolved NC tool failure 1.65 April 2007 Pre-site activity pass pass pass fail failCopper Dissolved NC tool failure 1.65 May 2007 Pre-site activity fail pass pass fail failCopper Dissolved NC tool failure 1.65 June 2007 Pre-site activity pass pass fail fail failCopper Dissolved NC tool failure 1.65 July 2007 I Pre-site activity pass pass pass pass --Copper Dissolved NC tool failure 1.65 July 2007 II Pre-site activity pass pass fail fail failCopper Dissolved NC tool failure 1.65 August 2007 I Pre-site activity pass pass pass pass --Copper Dissolved NC tool failure 1.65 August 2007 II Pre-site activity pass pass fail fail failCopper Dissolved NC tool failure 1.65 September 2007 I Pre-site activity pass fail fail fail failCopper Dissolved NC tool failure 1.65 September 2007 II Ongoing site activity pass fail fail fail failCopper Dissolved NC tool failure 1.65 October 2007 Ongoing site activity pass fail fail fail failCopper Dissolved NC tool failure 1.65 November 2007 Ongoing site activity pass pass fail pass failCopper Dissolved NC tool failure 1.65 December 2007 I Ongoing site activity pass pass fail pass passCopper Dissolved NC tool failure 1.65 January 2008 Ongoing site activity pass pass pass pass passCopper Dissolved NC tool failure 1.65 Februrary 2008 Ongoing site activity pass pass pass pass passCopper Dissolved NC tool failure 1.65 March 2008 Ongoing site activity pass pass pass pass passCopper Dissolved NC tool failure 1.65 April 2008 Ongoing site activity pass pass pass pass passCopper Dissolved NC tool failure 1.65 May 2008 Ongoing site activity nd pass pass nd passCopper Dissolved NC tool failure 1.65 June 2008 Ongoing site activity nd nd nd nd failCopper Dissolved NC tool failure 1.65 July 2008 Ongoing site activity pass pass pass fail passCopper Dissolved NC tool failure 1.65 August 2008 Ongoing site activity -- fail nd fail failCopper Dissolved NC tool failure 1.65 September 2008 Ongoing site activity -- pass pass fail failCopper Dissolved NC tool failure 1.65 October 2008 Ongoing site activity -- nd nd fail failLead Dissolved NC tool failure 0.314 February 2007 Pre-site activity fail fail -- nd ndLead Dissolved NC tool failure 0.314 April 2007 Pre-site activity pass pass pass fail failLead Dissolved NC tool failure 0.314 May 2007 Pre-site activity fail pass pass fail failLead Dissolved NC tool failure 0.314 June 2007 Pre-site activity pass pass pass fail passLead Dissolved NC tool failure 0.314 July 2007 I Pre-site activity pass pass nd fail --Lead Dissolved NC tool failure 0.314 July 2007 II Pre-site activity pass fail pass fail passLead Dissolved NC tool failure 0.314 August 2007 I Pre-site activity pass pass pass fail --Lead Dissolved NC tool failure 0.314 August 2007 II Pre-site activity pass fail fail fail passLead Dissolved NC tool failure 0.314 September 2007 I Pre-site activity pass fail fail fail failLead Dissolved NC tool failure 0.314 September 2007 II Ongoing site activity pass fail fail fail failLead Dissolved NC tool failure 0.314 October 2007 Ongoing site activity pass fail fail fail failLead Dissolved NC tool failure 0.314 November 2007 Ongoing site activity pass fail fail fail failLead Dissolved NC tool failure 0.314 December 2007 I Ongoing site activity fail fail fail pass passLead Dissolved NC tool failure 0.314 January 2008 Ongoing site activity pass pass pass pass passLead Dissolved NC tool failure 0.314 Februrary 2008 Ongoing site activity pass pass pass pass passLead Dissolved NC tool failure 0.314 March 2008 Ongoing site activity pass pass pass pass passLead Dissolved NC tool failure 0.314 April 2008 Ongoing site activity pass pass pass pass passLead Dissolved NC tool failure 0.314 May 2008 Ongoing site activity pass pass fail nd ndLead Dissolved NC tool failure 0.314 June 2008 Ongoing site activity pass fail pass pass passLead Dissolved NC tool failure 0.314 July 2008 Ongoing site activity pass fail pass fail passLead Dissolved NC tool failure 0.314 August 2008 Ongoing site activity -- fail pass fail pass

Niblack Exploration ProjectAnnual Report May 12, 2009
Integral Consulting Inc. Page 3 of 3
Table 3-13. Results of Natural Condition Criteria Comparisons for Groundwater, 2008
Analyte Fraction
NC Criteria(All ND Included)a
ug/L
(High ND
Excluded)b
ug/L Event Event PeriodMW-07
(Offsite reference)
MW-01(Wetlands below
NAG site)
MW-02(Wetlands below treatment ponds)
MW-03(Wetlands below
PAG site)
MW-04(Wetlands below
infiltration system)Lead Dissolved NC tool failure 0.314 September 2008 Ongoing site activity -- fail pass fail failLead Dissolved NC tool failure 0.314 October 2008 Ongoing site activity -- fail pass fail fail
Notes: -- = Sample not collectedn/a = Not applicable. Natural Condition Tool was successfully run with nondetect values included, so it was not necessary to run the tool seperately without high nondetect values.nd = Screening not conducted for nondetected samples.NC tool failure = Fails minimum data requirements of Natural Conditions Tool due to nondetect values which are greater than detected values.NAG = Non-acid generatingPAG = Potentially acid generatinga All ND included indicates that all nondetect data values were included in the Natural Conditions Tool analysis at the full detection limit and were flagged as nondetect values.
b High ND excluded indicates that, prior to analysis with the Natural Conditions Tool, high nondetect values were screened out of the reference data set. High nondetects were defined as any nondetect value that was higher than the lowest detected value.
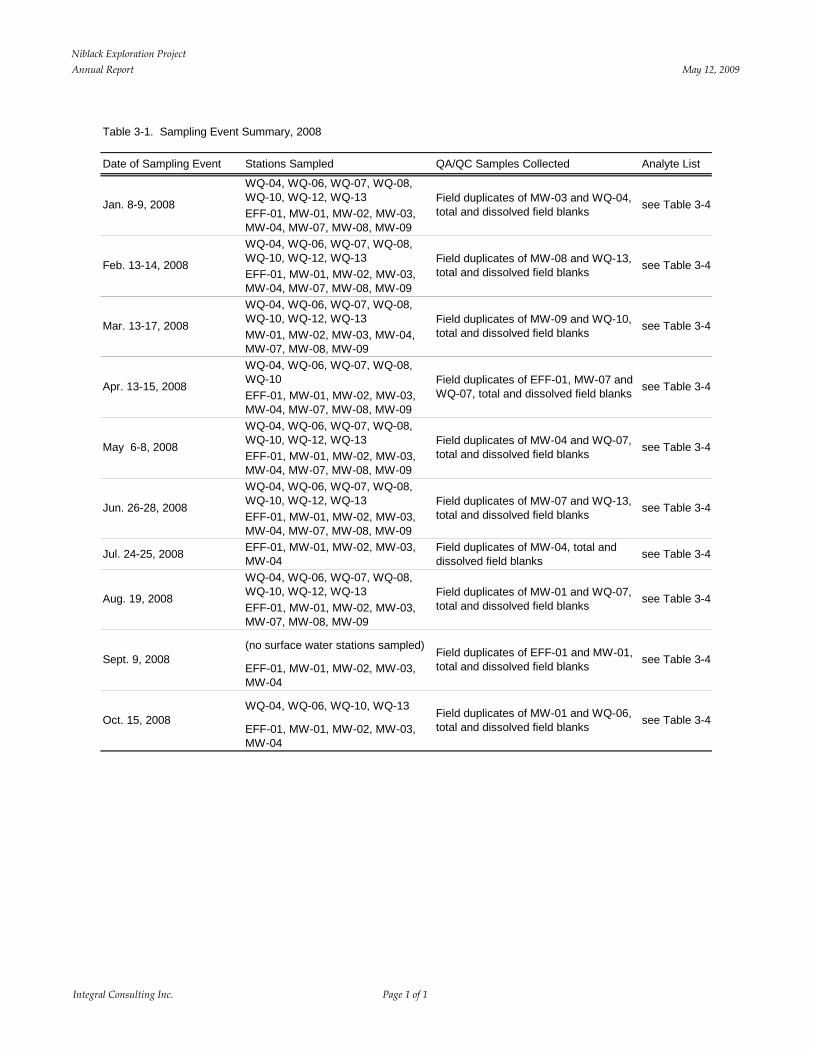
Niblack Exploration ProjectAnnual Report May 12, 2009
Integral Consulting Inc. Page 1 of 1
Table 3-1. Sampling Event Summary, 2008
Date of Sampling Event Stations Sampled QA/QC Samples Collected Analyte List
WQ-04, WQ-06, WQ-07, WQ-08, WQ-10, WQ-12, WQ-13EFF-01, MW-01, MW-02, MW-03, MW-04, MW-07, MW-08, MW-09WQ-04, WQ-06, WQ-07, WQ-08, WQ-10, WQ-12, WQ-13EFF-01, MW-01, MW-02, MW-03, MW-04, MW-07, MW-08, MW-09WQ-04, WQ-06, WQ-07, WQ-08, WQ-10, WQ-12, WQ-13MW-01, MW-02, MW-03, MW-04, MW-07, MW-08, MW-09WQ-04, WQ-06, WQ-07, WQ-08, WQ-10EFF-01, MW-01, MW-02, MW-03, MW-04, MW-07, MW-08, MW-09WQ-04, WQ-06, WQ-07, WQ-08, WQ-10, WQ-12, WQ-13EFF-01, MW-01, MW-02, MW-03, MW-04, MW-07, MW-08, MW-09WQ-04, WQ-06, WQ-07, WQ-08, WQ-10, WQ-12, WQ-13EFF-01, MW-01, MW-02, MW-03, MW-04, MW-07, MW-08, MW-09
Jul. 24-25, 2008 EFF-01, MW-01, MW-02, MW-03, MW-04
Field duplicates of MW-04, total and dissolved field blanks see Table 3-4
WQ-04, WQ-06, WQ-07, WQ-08, WQ-10, WQ-12, WQ-13EFF-01, MW-01, MW-02, MW-03, MW-07, MW-08, MW-09
(no surface water stations sampled)
EFF-01, MW-01, MW-02, MW-03, MW-04
WQ-04, WQ-06, WQ-10, WQ-13
EFF-01, MW-01, MW-02, MW-03, MW-04
Jan. 8-9, 2008 Field duplicates of MW-03 and WQ-04, total and dissolved field blanks see Table 3-4
Feb. 13-14, 2008 Field duplicates of MW-08 and WQ-13, total and dissolved field blanks see Table 3-4
Mar. 13-17, 2008 Field duplicates of MW-09 and WQ-10, total and dissolved field blanks see Table 3-4
Apr. 13-15, 2008 Field duplicates of EFF-01, MW-07 and WQ-07, total and dissolved field blanks see Table 3-4
May 6-8, 2008 Field duplicates of MW-04 and WQ-07, total and dissolved field blanks see Table 3-4
Jun. 26-28, 2008 Field duplicates of MW-07 and WQ-13, total and dissolved field blanks see Table 3-4
Oct. 15, 2008 Field duplicates of MW-01 and WQ-06, total and dissolved field blanks see Table 3-4
Aug. 19, 2008 Field duplicates of MW-01 and WQ-07, total and dissolved field blanks see Table 3-4
Sept. 9, 2008 Field duplicates of EFF-01 and MW-01, total and dissolved field blanks see Table 3-4

Niblack Exploration ProjectAnnual Report May 12, 2009
Integral Consulting Inc. Page 1 of 2
Table 3-2. Water Quality Monitoring Stations
Location
Pre-project reference conditions
Concurrent reference conditions
Compliance location Information only
Post-closure monitoring
EffluentEFF-01 Discharge from the treatment
pondsX
Surface watersWQ-04 Waterfall Creek – downstream X X X
WQ-06 Camp Creek – downstream X X
WQ-07 Camp Creek – upstream X X*
WQ-08 Waterfall Creek – upstream X X*
WQ-10 Unnamed Creek 1 – downstream X X
WQ-12 Unnamed Creek 1 – upstream X X*
WQ-13 Unnamed Creek 2 X X
PAG site under drain See Note A1
Groundwater wellsMW-01 Wetlands below NAG site X See Note A2* See Note A2 X
MW-02 Wetlands below settlement/treatment ponds
X See Note A2* See Note A2 X
MW-03 Wetlands below PAG site X See Note A2* See Note A2 X
Monitoring point
Purpose
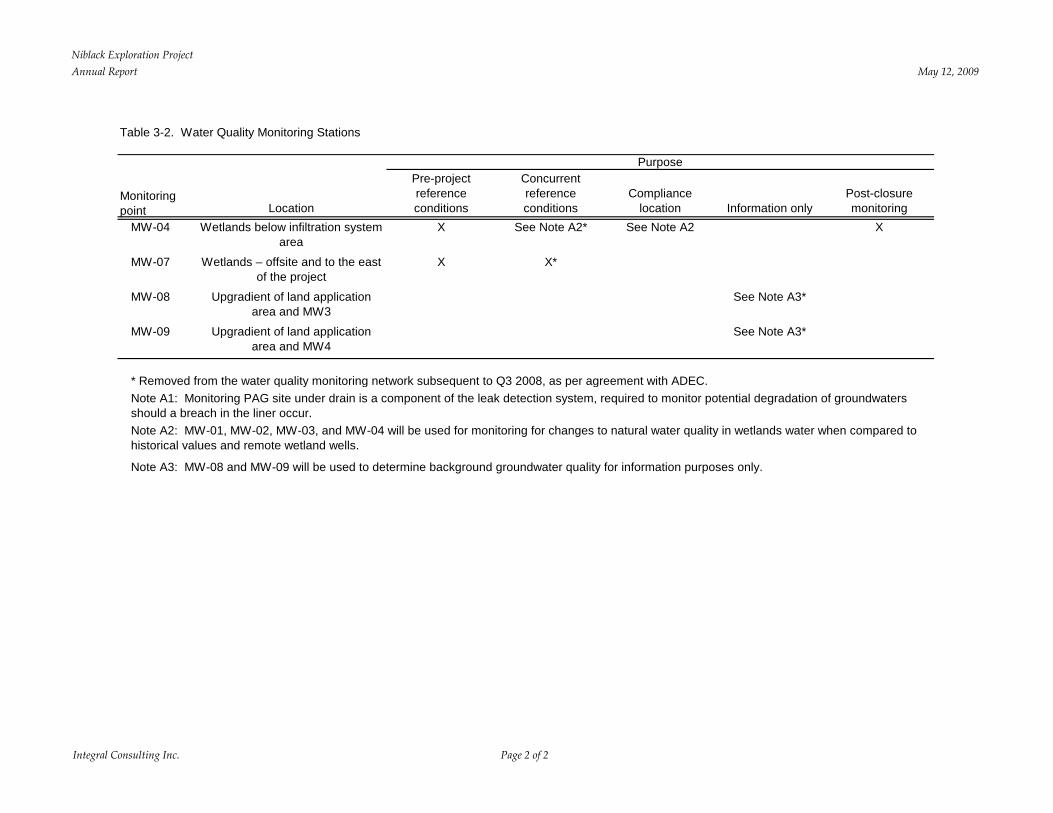
Niblack Exploration ProjectAnnual Report May 12, 2009
Integral Consulting Inc. Page 2 of 2
Table 3-2. Water Quality Monitoring Stations
Location
Pre-project reference conditions
Concurrent reference conditions
Compliance location Information only
Post-closure monitoring
Monitoring point
Purpose
MW-04 Wetlands below infiltration system area
X See Note A2* See Note A2 X
MW-07 Wetlands – offsite and to the east of the project
X X*
MW-08 Upgradient of land application area and MW3
See Note A3*
MW-09 Upgradient of land application area and MW4
See Note A3*
* Removed from the water quality monitoring network subsequent to Q3 2008, as per agreement with ADEC.
Note A3: MW-08 and MW-09 will be used to determine background groundwater quality for information purposes only.
Note A1: Monitoring PAG site under drain is a component of the leak detection system, required to monitor potential degradation of groundwaters should a breach in the liner occur.Note A2: MW-01, MW-02, MW-03, and MW-04 will be used for monitoring for changes to natural water quality in wetlands water when compared to historical values and remote wetland wells.
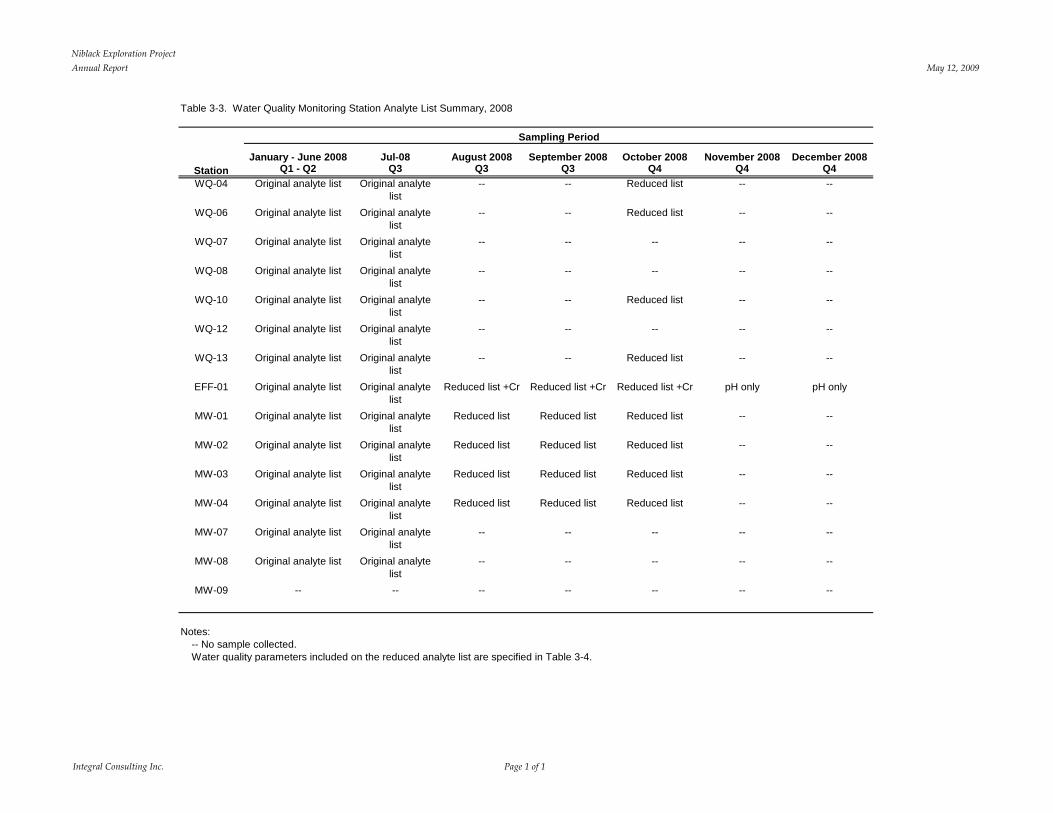
Niblack Exploration ProjectAnnual Report May 12, 2009
Integral Consulting Inc. Page 1 of 1
Table 3-3. Water Quality Monitoring Station Analyte List Summary, 2008
January - June 2008 Jul-08 August 2008 September 2008 October 2008 November 2008 December 2008Q1 - Q2 Q3 Q3 Q3 Q4 Q4 Q4
WQ-04 Original analyte list Original analyte list
-- -- Reduced list -- --
WQ-06 Original analyte list Original analyte list
-- -- Reduced list -- --
WQ-07 Original analyte list Original analyte list
-- -- -- -- --
WQ-08 Original analyte list Original analyte list
-- -- -- -- --
WQ-10 Original analyte list Original analyte list
-- -- Reduced list -- --
WQ-12 Original analyte list Original analyte list
-- -- -- -- --
WQ-13 Original analyte list Original analyte list
-- -- Reduced list -- --
EFF-01 Original analyte list Original analyte list
Reduced list +Cr Reduced list +Cr Reduced list +Cr pH only pH only
MW-01 Original analyte list Original analyte list
Reduced list Reduced list Reduced list -- --
MW-02 Original analyte list Original analyte list
Reduced list Reduced list Reduced list -- --
MW-03 Original analyte list Original analyte list
Reduced list Reduced list Reduced list -- --
MW-04 Original analyte list Original analyte list
Reduced list Reduced list Reduced list -- --
MW-07 Original analyte list Original analyte list
-- -- -- -- --
MW-08 Original analyte list Original analyte list
-- -- -- -- --
MW-09 -- -- -- -- -- -- --
Notes:-- No sample collected.Water quality parameters included on the reduced analyte list are specified in Table 3-4.
Sampling Period
Station
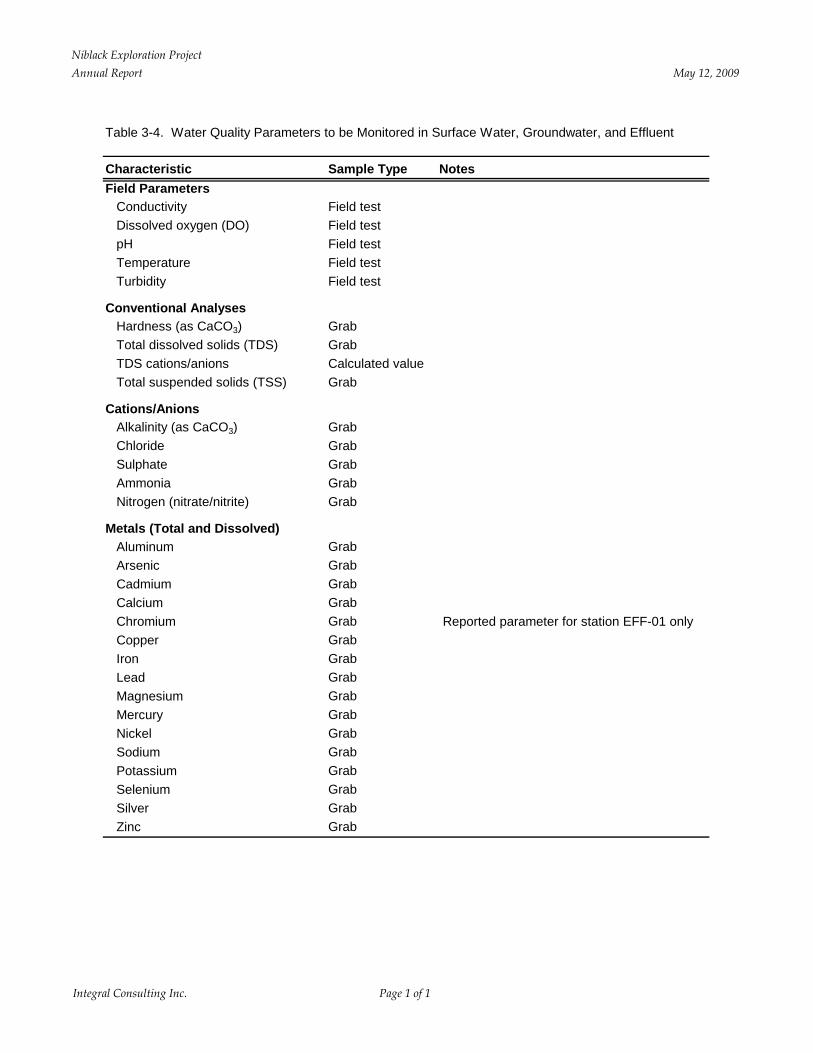
Niblack Exploration ProjectAnnual Report May 12, 2009
Integral Consulting Inc. Page 1 of 1
Table 3-4. Water Quality Parameters to be Monitored in Surface Water, Groundwater, and Effluent
Characteristic Sample Type NotesField Parameters
Conductivity Field testDissolved oxygen (DO) Field testpH Field testTemperature Field testTurbidity Field test
Conventional AnalysesHardness (as CaCO3) GrabTotal dissolved solids (TDS) GrabTDS cations/anions Calculated valueTotal suspended solids (TSS) Grab
Cations/AnionsAlkalinity (as CaCO3) GrabChloride GrabSulphate GrabAmmonia GrabNitrogen (nitrate/nitrite) Grab
Metals (Total and Dissolved)Aluminum GrabArsenic GrabCadmium GrabCalcium GrabChromium Grab Reported parameter for station EFF-01 onlyCopper GrabIron GrabLead GrabMagnesium GrabMercury GrabNickel GrabSodium GrabPotassium GrabSelenium GrabSilver GrabZinc Grab

Niblack Exploration ProjectAnnual Report May 12, 2009
Integral Consulting Inc. Page 1 of 1
Table 3-5. Laboratory Methods for Water Quality Samples
Protocol Procedure Protocol Procedure
Conventional AnalysesHardness as CaCO3 X -- -- EPA 130.2 TitrimetricTotal dissolved solids X -- -- SM 2540C GravimetricTotal suspended solids X -- -- SM 2540D Gravimetric
Cations/AnionsAlkalinity as CaCO3 X -- -- SM 2320 TitrimetricBromide, fluoride EPA 300.0 Ion chromatographyChloride, sulfate X EPA 300.0 Ion chromatographyNitrate/nitrite as N X EPA 353.2 Cadmium reduction EPA 353.2 ColorimetricAmmonia as N X EPA 350.1 Buffered to pH 9.5 EPA 350.1 Colorimetrico-Phosphate as P, dissolved Persulfate digestionPhosphate as P, dissolved Persulfate digestion & 0.45-mm filtrationPhosphate as P, total Persulfate digestion
Total/Dissolved MetalsAntimony, barium, beryllium, bismuth, cobalt, manganese, molybdenum, thallium, uranium, vanadium
EPA 3020A Nitric acid digestion EPA 200.8 ICP/MS
Aluminum, arsenic, cadmium, chromium, copper, lead, nickel, selenium, silver, zinc
X EPA 3020A Nitric acid digestion EPA 200.8 ICP/MS
Boron, lithium, phosphorus, silicon, strontium, tin, titanium
EPA 3010A Nitric/hydrochloric acid digestion EPA 200.7 ICP/AES
Calcium, iron, magnesium, potassium, sodium
X EPA 3010A Nitric/hydrochloric acid digestion EPA 200.7 ICP/AES
Mercury X EPA 7470A Acid digestion/oxidation EPA 245.1 CVAAS
Notes:-- Not applicable
SM = Standard MethodICP/MS = inductively-coupled plasma/mass spectrometry
EPA = U.S. Environmental Protection Agency
Field measurements collected for each event include dissolved oxygen, pH, temperature, conductivity, and turbidity.
CVAAS = cold vapor atomic absorption spectrometry
ICP/AES = inductively-coupled plasma/atomic emission spectrometry
EPA 365.3 EPA 365.3 Colorimetric
Analysis
Sample Preparation Quantitative Analysis
-- --
Analyte Included on Reduced Monitoring List

Niblack Exploration ProjectAnnual Report May 12, 2009
Integral Consulting Inc. Page 1 of 1
Table 3-6. Zinc Concentrations in Field Blanks, 2008
Sampling Event Quarter Sample ID DescriptionTotal Zinc
(ug/L)Dissolved Zinc
(ug/L)
Field Blank SamplesJanuary 2008 Q1 2008 WQ21 DI blank, SW protocol 0.7 2.1
February 2008 Q1 2008 WQ24 DI blank, GW protocol 2 2.77February 2008 Q1 2008 WQ21 DI blank, SW protocol 2.9 2.49February 2008 Q1 2008 WQ22 DI blank, SW protocol 1.3 3.77February 2008 Q1 2008 WQ23 DI blank, SW protocol 1.8 2.59
March 2008 Q1 2008 WQ21 DI blank, SW protocol 3 1March 2008 Q1 2008 WQ22 DI blank, acid rinse, SW protocol 1.6 51.9March 2008 Q1 2008 MW21 DI blank, GW protocol 1.7 0.7March 2008 Q1 2008 MW22 DI blank, acid rinse, GW protocol 1 0.8
April 2008 Q2 2008 WQ21 DI blank, GW protocol 1 0.5May 2008 Q2 2008 WQ21 DI blank, GW protocol 3.3 0.5
June 2008 Q2 2008 WQ21 DI blank, GW protocol 2.6 2.7
July 2008 Q3 2008 WQ21 DI blank, GW protocol 4 0.7August 2008 Q3 2008 WQ21 DI blank, GW protocol 4.75 4.21
September 2008 Q3 2008 WQ21 DI blank, GW protocol 2.98 2.7
October 2008 Q4 2008 WQ21 DI blank, GW protocol 1.17 1.55
Notes: DI = deionized waterGW = groundwaterSW = surface water
All concentrations are presented as reported by the laboratory. Validation qualifiers have not been applied.

Niblack Exploration ProjectAnnual Report May 12, 2009
Integral Consulting Inc. Page 1 of 1
Analyte Fraction Event Event Period
WQ-04(Waterfall Creek
downstream)
WQ-06(Camp Creek downstream)
WQ-10(Unnamed Creek #1
downstream)Aluminum Total September 2007 II Ongoing site activity Fail n/a FailAluminum Total October 2007 Ongoing site activity Fail n/a FailAluminum Total November 2007 Ongoing site activity Fail n/a n/aAluminum Total December 2007 Ongoing site activity Fail n/a FailAluminum Total January 2008 Ongoing site activity Fail n/a n/aAluminum Total February 2008 Ongoing site activity Fail n/a FailAluminum Total March 2008 Ongoing site activity Fail n/a FailAluminum Total April 2008 Ongoing site activity Fail n/a n/aAluminum Total May 2008 Ongoing site activity n/a n/a n/aAluminum Total June 2008 Ongoing site activity Fail Fail FailAluminum Total July 2008 Ongoing site activity n/a n/a n/aAluminum Total October 2008 Ongoing site activity n/a Fail n/aAluminum Dissolved September 2007 II Ongoing site activity Fail n/a FailAluminum Dissolved October 2007 Ongoing site activity Fail Fail FailAluminum Dissolved November 2007 Ongoing site activity n/a n/a n/aAluminum Dissolved December 2007 Ongoing site activity n/a n/a FailAluminum Dissolved January 2008 Ongoing site activity n/a n/a n/aAluminum Dissolved February 2008 Ongoing site activity n/a n/a n/aAluminum Dissolved March 2008 Ongoing site activity n/a n/a n/aAluminum Dissolved April 2008 Ongoing site activity n/a n/a n/aAluminum Dissolved May 2008 Ongoing site activity n/a n/a n/aAluminum Dissolved June 2008 Ongoing site activity Fail n/a FailAluminum Dissolved July 2008 Ongoing site activity n/a n/a n/aAluminum Dissolved October 2008 Ongoing site activity n/a n/a n/aCopper Dissolved September 2007 II Ongoing site activity n/a n/a FailCopper Dissolved October 2007 Ongoing site activity n/a n/a n/aCopper Dissolved November 2007 Ongoing site activity n/a n/a n/aCopper Dissolved December 2007 Ongoing site activity n/a n/a n/aCopper Dissolved January 2008 Ongoing site activity n/a n/a n/aCopper Dissolved February 2008 Ongoing site activity n/a n/a n/aCopper Dissolved March 2008 Ongoing site activity n/a nd n/aCopper Dissolved April 2008 Ongoing site activity n/a n/a n/aCopper Dissolved May 2008 Ongoing site activity n/a n/a n/aCopper Dissolved June 2008 Ongoing site activity nd nd ndCopper Dissolved July 2008 Ongoing site activity n/a n/a n/aCopper Dissolved October 2008 Ongoing site activity nd nd nd
Notes:
nd = Concentration below laboratory detection limit. Nondetect values were not screened against ADEC chronic aquatic life criteria.
n/a = Not applicable. Integral alternative population statistical test not applied; metal concentration was below ADEC chronic aquatic life criterion.
Table 3-14. Summary of Exceedances of Natural Conditions as Analyzed with the Alternative Population Approach for Surface Water, 2008
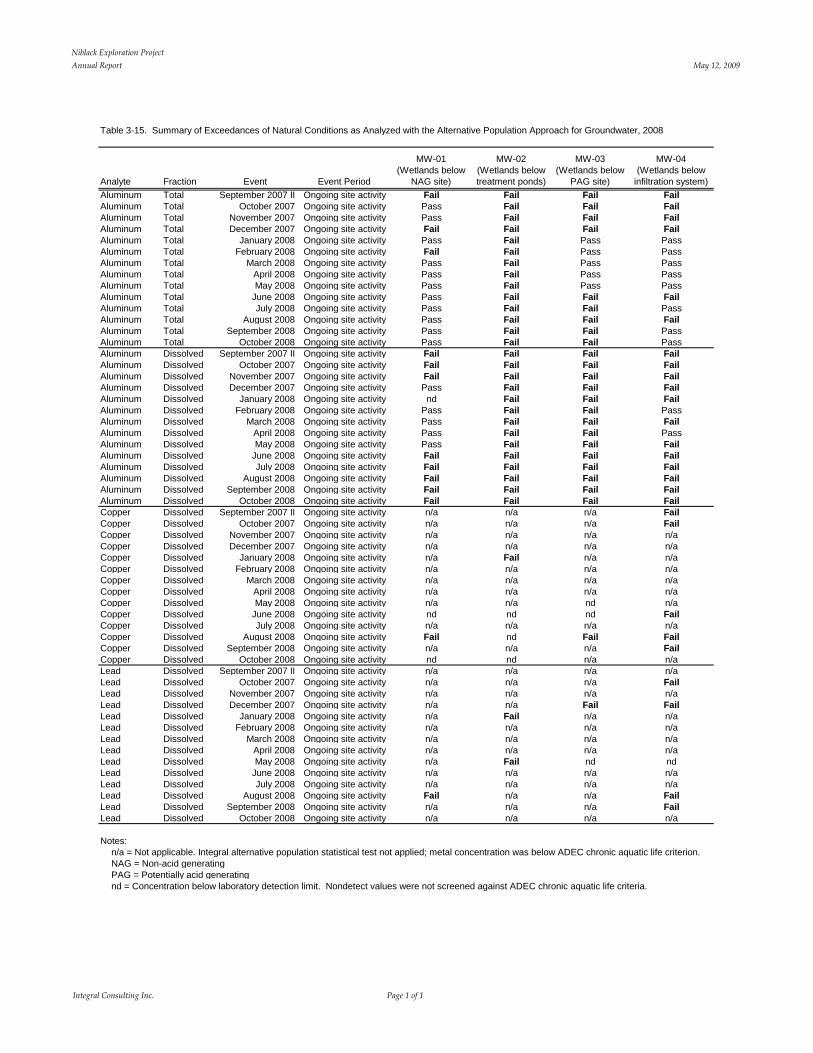
Niblack Exploration ProjectAnnual Report May 12, 2009
Integral Consulting Inc. Page 1 of 1
Table 3-15. Summary of Exceedances of Natural Conditions as Analyzed with the Alternative Population Approach for Groundwater, 2008
Analyte Fraction Event Event Period
MW-01(Wetlands below
NAG site)
MW-02(Wetlands below treatment ponds)
MW-03(Wetlands below
PAG site)
MW-04(Wetlands below
infiltration system)Aluminum Total September 2007 II Ongoing site activity Fail Fail Fail FailAluminum Total October 2007 Ongoing site activity Pass Fail Fail FailAluminum Total November 2007 Ongoing site activity Pass Fail Fail FailAluminum Total December 2007 Ongoing site activity Fail Fail Fail FailAluminum Total January 2008 Ongoing site activity Pass Fail Pass PassAluminum Total February 2008 Ongoing site activity Fail Fail Pass PassAluminum Total March 2008 Ongoing site activity Pass Fail Pass PassAluminum Total April 2008 Ongoing site activity Pass Fail Pass PassAluminum Total May 2008 Ongoing site activity Pass Fail Pass PassAluminum Total June 2008 Ongoing site activity Pass Fail Fail FailAluminum Total July 2008 Ongoing site activity Pass Fail Fail PassAluminum Total August 2008 Ongoing site activity Pass Fail Fail FailAluminum Total September 2008 Ongoing site activity Pass Fail Fail PassAluminum Total October 2008 Ongoing site activity Pass Fail Fail PassAluminum Dissolved September 2007 II Ongoing site activity Fail Fail Fail FailAluminum Dissolved October 2007 Ongoing site activity Fail Fail Fail FailAluminum Dissolved November 2007 Ongoing site activity Fail Fail Fail FailAluminum Dissolved December 2007 Ongoing site activity Pass Fail Fail FailAluminum Dissolved January 2008 Ongoing site activity nd Fail Fail FailAluminum Dissolved February 2008 Ongoing site activity Pass Fail Fail PassAluminum Dissolved March 2008 Ongoing site activity Pass Fail Fail FailAluminum Dissolved April 2008 Ongoing site activity Pass Fail Fail PassAluminum Dissolved May 2008 Ongoing site activity Pass Fail Fail FailAluminum Dissolved June 2008 Ongoing site activity Fail Fail Fail FailAluminum Dissolved July 2008 Ongoing site activity Fail Fail Fail FailAluminum Dissolved August 2008 Ongoing site activity Fail Fail Fail FailAluminum Dissolved September 2008 Ongoing site activity Fail Fail Fail FailAluminum Dissolved October 2008 Ongoing site activity Fail Fail Fail FailCopper Dissolved September 2007 II Ongoing site activity n/a n/a n/a FailCopper Dissolved October 2007 Ongoing site activity n/a n/a n/a FailCopper Dissolved November 2007 Ongoing site activity n/a n/a n/a n/aCopper Dissolved December 2007 Ongoing site activity n/a n/a n/a n/aCopper Dissolved January 2008 Ongoing site activity n/a Fail n/a n/aCopper Dissolved February 2008 Ongoing site activity n/a n/a n/a n/aCopper Dissolved March 2008 Ongoing site activity n/a n/a n/a n/aCopper Dissolved April 2008 Ongoing site activity n/a n/a n/a n/aCopper Dissolved May 2008 Ongoing site activity n/a n/a nd n/aCopper Dissolved June 2008 Ongoing site activity nd nd nd FailCopper Dissolved July 2008 Ongoing site activity n/a n/a n/a n/aCopper Dissolved August 2008 Ongoing site activity Fail nd Fail FailCopper Dissolved September 2008 Ongoing site activity n/a n/a n/a FailCopper Dissolved October 2008 Ongoing site activity nd nd n/a n/aLead Dissolved September 2007 II Ongoing site activity n/a n/a n/a n/aLead Dissolved October 2007 Ongoing site activity n/a n/a n/a FailLead Dissolved November 2007 Ongoing site activity n/a n/a n/a n/aLead Dissolved December 2007 Ongoing site activity n/a n/a Fail FailLead Dissolved January 2008 Ongoing site activity n/a Fail n/a n/aLead Dissolved February 2008 Ongoing site activity n/a n/a n/a n/aLead Dissolved March 2008 Ongoing site activity n/a n/a n/a n/aLead Dissolved April 2008 Ongoing site activity n/a n/a n/a n/aLead Dissolved May 2008 Ongoing site activity n/a Fail nd ndLead Dissolved June 2008 Ongoing site activity n/a n/a n/a n/aLead Dissolved July 2008 Ongoing site activity n/a n/a n/a n/aLead Dissolved August 2008 Ongoing site activity Fail n/a n/a FailLead Dissolved September 2008 Ongoing site activity n/a n/a n/a FailLead Dissolved October 2008 Ongoing site activity n/a n/a n/a n/a
Notes: n/a = Not applicable. Integral alternative population statistical test not applied; metal concentration was below ADEC chronic aquatic life criterion.NAG = Non-acid generatingPAG = Potentially acid generatingnd = Concentration below laboratory detection limit. Nondetect values were not screened against ADEC chronic aquatic life criteria.
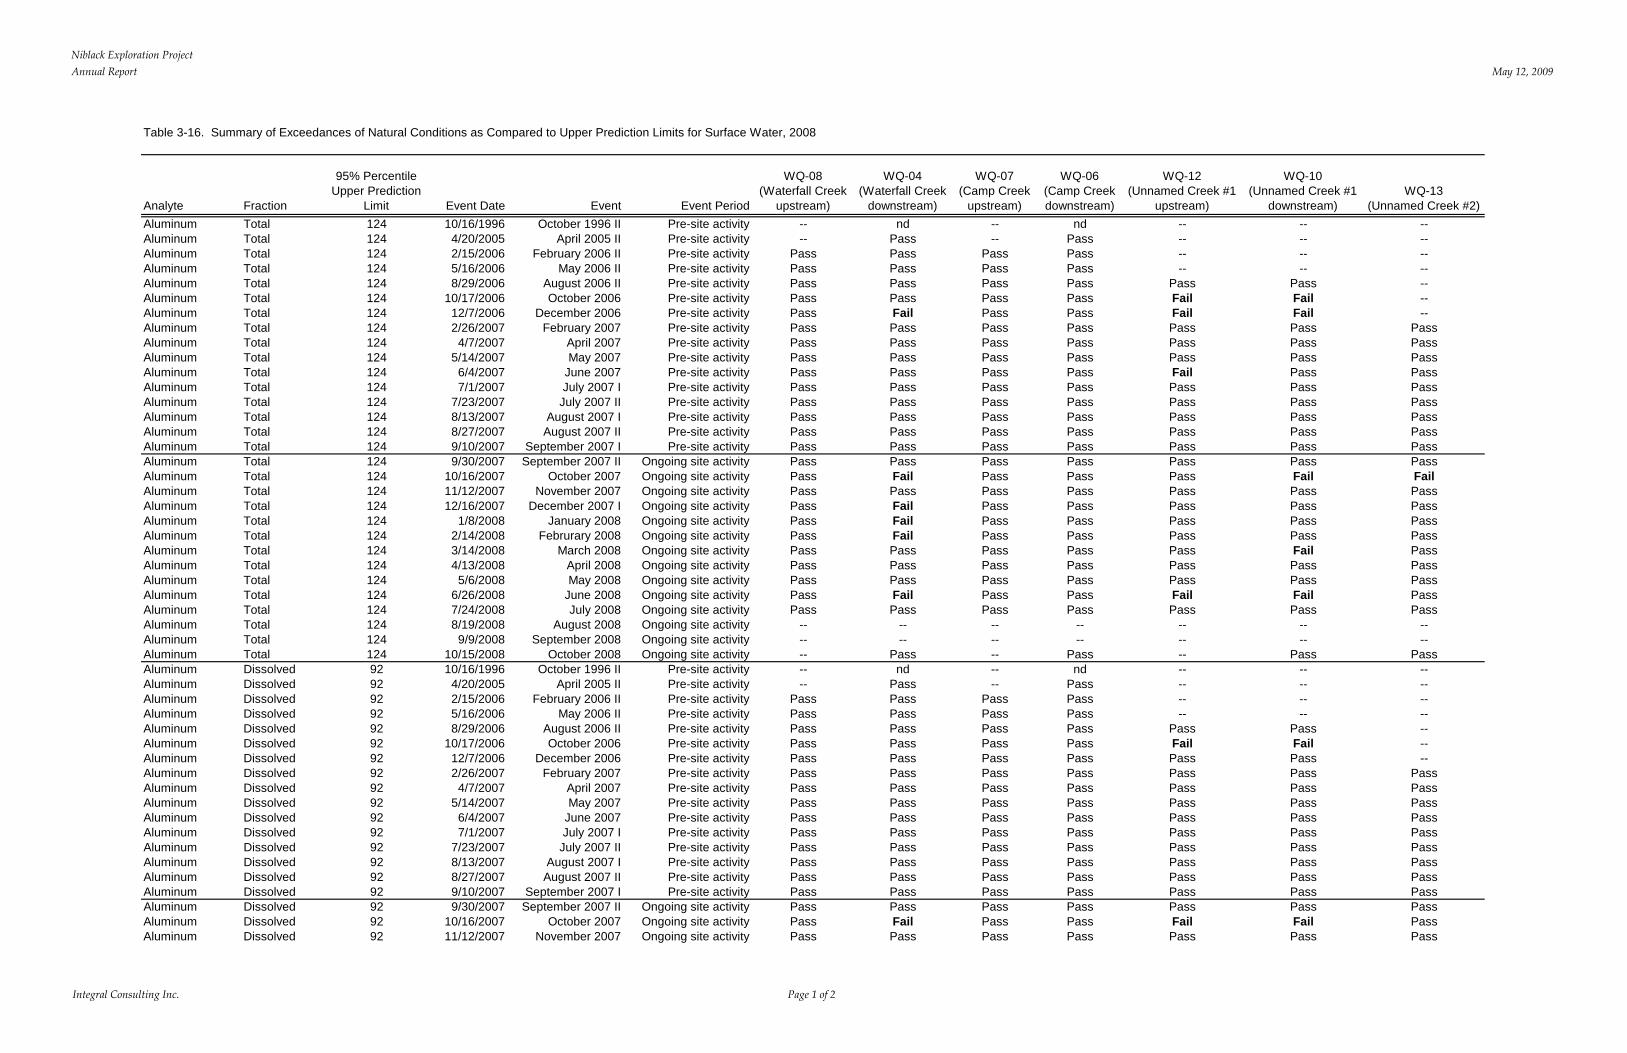
Niblack Exploration ProjectAnnual Report May 12, 2009
Integral Consulting Inc. Page 1 of 2
Table 3-16. Summary of Exceedances of Natural Conditions as Compared to Upper Prediction Limits for Surface Water, 2008
Analyte Fraction
95% Percentile Upper Prediction
Limit Event Date Event Event Period
WQ-08(Waterfall Creek
upstream)
WQ-04(Waterfall Creek
downstream)
WQ-07(Camp Creek
upstream)
WQ-06(Camp Creek downstream)
WQ-12(Unnamed Creek #1
upstream)
WQ-10(Unnamed Creek #1
downstream)WQ-13
(Unnamed Creek #2)Aluminum Total 124 10/16/1996 October 1996 II Pre-site activity -- nd -- nd -- -- --Aluminum Total 124 4/20/2005 April 2005 II Pre-site activity -- Pass -- Pass -- -- --Aluminum Total 124 2/15/2006 February 2006 II Pre-site activity Pass Pass Pass Pass -- -- --Aluminum Total 124 5/16/2006 May 2006 II Pre-site activity Pass Pass Pass Pass -- -- --Aluminum Total 124 8/29/2006 August 2006 II Pre-site activity Pass Pass Pass Pass Pass Pass --Aluminum Total 124 10/17/2006 October 2006 Pre-site activity Pass Pass Pass Pass Fail Fail --Aluminum Total 124 12/7/2006 December 2006 Pre-site activity Pass Fail Pass Pass Fail Fail --Aluminum Total 124 2/26/2007 February 2007 Pre-site activity Pass Pass Pass Pass Pass Pass PassAluminum Total 124 4/7/2007 April 2007 Pre-site activity Pass Pass Pass Pass Pass Pass PassAluminum Total 124 5/14/2007 May 2007 Pre-site activity Pass Pass Pass Pass Pass Pass PassAluminum Total 124 6/4/2007 June 2007 Pre-site activity Pass Pass Pass Pass Fail Pass PassAluminum Total 124 7/1/2007 July 2007 I Pre-site activity Pass Pass Pass Pass Pass Pass PassAluminum Total 124 7/23/2007 July 2007 II Pre-site activity Pass Pass Pass Pass Pass Pass PassAluminum Total 124 8/13/2007 August 2007 I Pre-site activity Pass Pass Pass Pass Pass Pass PassAluminum Total 124 8/27/2007 August 2007 II Pre-site activity Pass Pass Pass Pass Pass Pass PassAluminum Total 124 9/10/2007 September 2007 I Pre-site activity Pass Pass Pass Pass Pass Pass PassAluminum Total 124 9/30/2007 September 2007 II Ongoing site activity Pass Pass Pass Pass Pass Pass PassAluminum Total 124 10/16/2007 October 2007 Ongoing site activity Pass Fail Pass Pass Pass Fail FailAluminum Total 124 11/12/2007 November 2007 Ongoing site activity Pass Pass Pass Pass Pass Pass PassAluminum Total 124 12/16/2007 December 2007 I Ongoing site activity Pass Fail Pass Pass Pass Pass PassAluminum Total 124 1/8/2008 January 2008 Ongoing site activity Pass Fail Pass Pass Pass Pass PassAluminum Total 124 2/14/2008 Februrary 2008 Ongoing site activity Pass Fail Pass Pass Pass Pass PassAluminum Total 124 3/14/2008 March 2008 Ongoing site activity Pass Pass Pass Pass Pass Fail PassAluminum Total 124 4/13/2008 April 2008 Ongoing site activity Pass Pass Pass Pass Pass Pass PassAluminum Total 124 5/6/2008 May 2008 Ongoing site activity Pass Pass Pass Pass Pass Pass PassAluminum Total 124 6/26/2008 June 2008 Ongoing site activity Pass Fail Pass Pass Fail Fail PassAluminum Total 124 7/24/2008 July 2008 Ongoing site activity Pass Pass Pass Pass Pass Pass PassAluminum Total 124 8/19/2008 August 2008 Ongoing site activity -- -- -- -- -- -- --Aluminum Total 124 9/9/2008 September 2008 Ongoing site activity -- -- -- -- -- -- --Aluminum Total 124 10/15/2008 October 2008 Ongoing site activity -- Pass -- Pass -- Pass PassAluminum Dissolved 92 10/16/1996 October 1996 II Pre-site activity -- nd -- nd -- -- --Aluminum Dissolved 92 4/20/2005 April 2005 II Pre-site activity -- Pass -- Pass -- -- --Aluminum Dissolved 92 2/15/2006 February 2006 II Pre-site activity Pass Pass Pass Pass -- -- --Aluminum Dissolved 92 5/16/2006 May 2006 II Pre-site activity Pass Pass Pass Pass -- -- --Aluminum Dissolved 92 8/29/2006 August 2006 II Pre-site activity Pass Pass Pass Pass Pass Pass --Aluminum Dissolved 92 10/17/2006 October 2006 Pre-site activity Pass Pass Pass Pass Fail Fail --Aluminum Dissolved 92 12/7/2006 December 2006 Pre-site activity Pass Pass Pass Pass Pass Pass --Aluminum Dissolved 92 2/26/2007 February 2007 Pre-site activity Pass Pass Pass Pass Pass Pass PassAluminum Dissolved 92 4/7/2007 April 2007 Pre-site activity Pass Pass Pass Pass Pass Pass PassAluminum Dissolved 92 5/14/2007 May 2007 Pre-site activity Pass Pass Pass Pass Pass Pass PassAluminum Dissolved 92 6/4/2007 June 2007 Pre-site activity Pass Pass Pass Pass Pass Pass PassAluminum Dissolved 92 7/1/2007 July 2007 I Pre-site activity Pass Pass Pass Pass Pass Pass PassAluminum Dissolved 92 7/23/2007 July 2007 II Pre-site activity Pass Pass Pass Pass Pass Pass PassAluminum Dissolved 92 8/13/2007 August 2007 I Pre-site activity Pass Pass Pass Pass Pass Pass PassAluminum Dissolved 92 8/27/2007 August 2007 II Pre-site activity Pass Pass Pass Pass Pass Pass PassAluminum Dissolved 92 9/10/2007 September 2007 I Pre-site activity Pass Pass Pass Pass Pass Pass PassAluminum Dissolved 92 9/30/2007 September 2007 II Ongoing site activity Pass Pass Pass Pass Pass Pass PassAluminum Dissolved 92 10/16/2007 October 2007 Ongoing site activity Pass Fail Pass Pass Fail Fail PassAluminum Dissolved 92 11/12/2007 November 2007 Ongoing site activity Pass Pass Pass Pass Pass Pass Pass
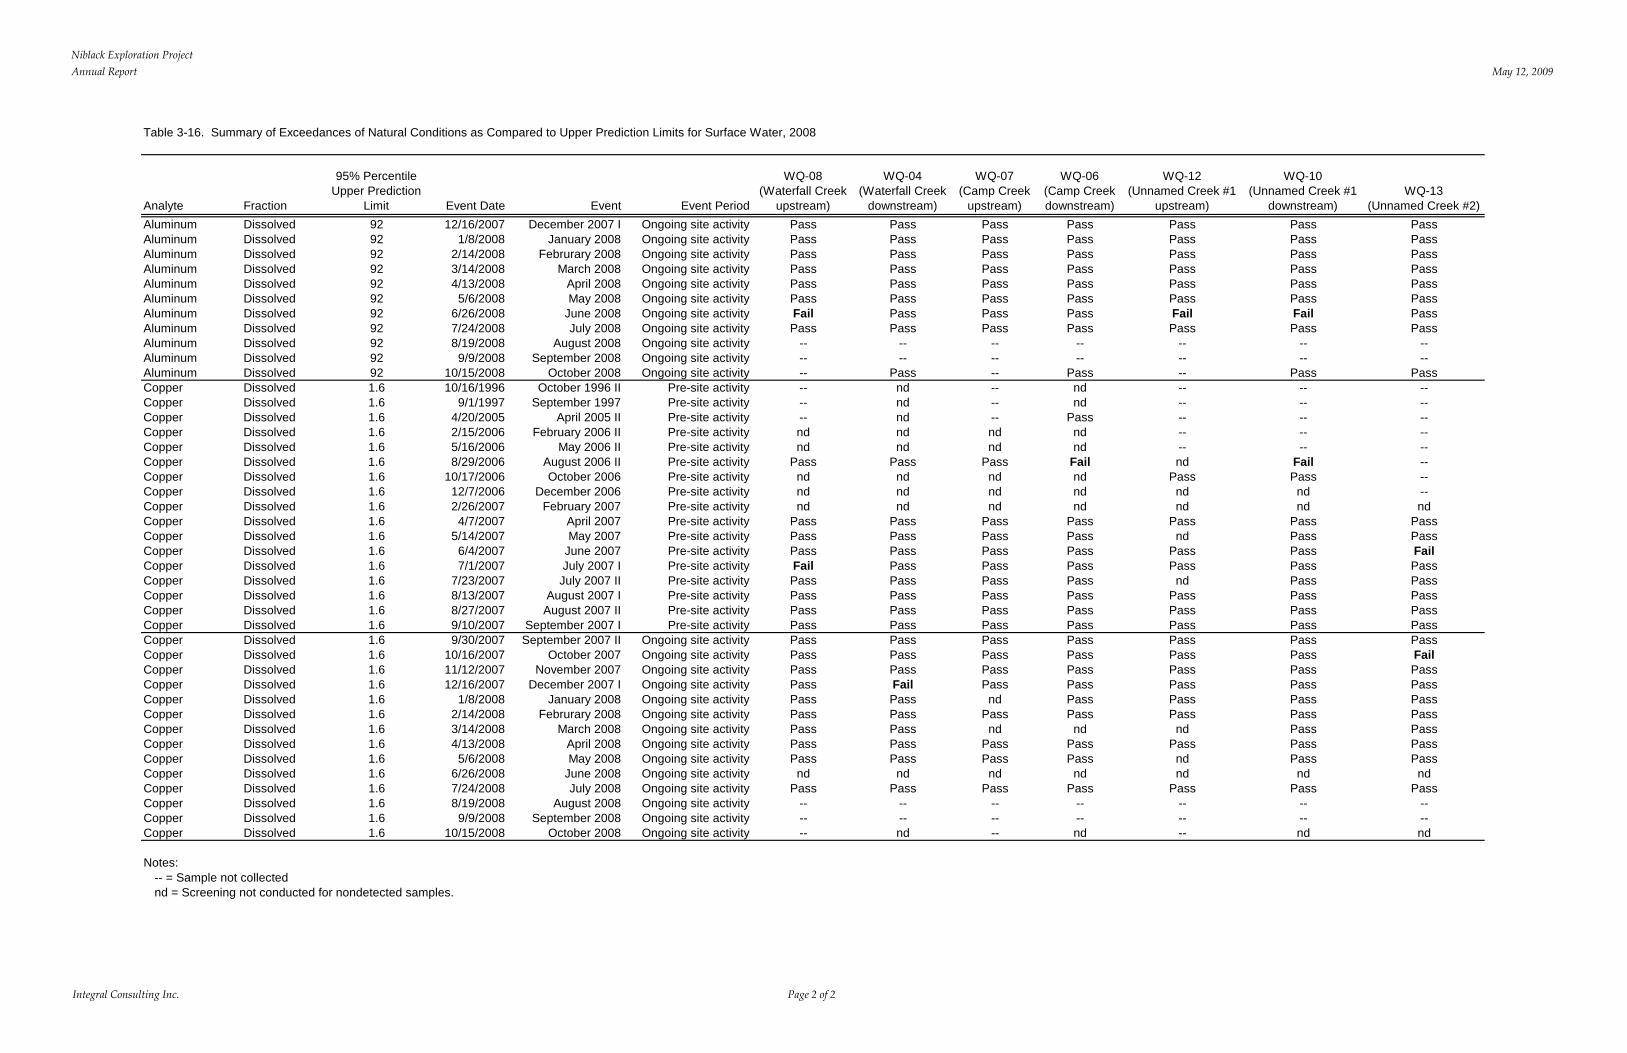
Niblack Exploration ProjectAnnual Report May 12, 2009
Integral Consulting Inc. Page 2 of 2
Table 3-16. Summary of Exceedances of Natural Conditions as Compared to Upper Prediction Limits for Surface Water, 2008
Analyte Fraction
95% Percentile Upper Prediction
Limit Event Date Event Event Period
WQ-08(Waterfall Creek
upstream)
WQ-04(Waterfall Creek
downstream)
WQ-07(Camp Creek
upstream)
WQ-06(Camp Creek downstream)
WQ-12(Unnamed Creek #1
upstream)
WQ-10(Unnamed Creek #1
downstream)WQ-13
(Unnamed Creek #2)Aluminum Dissolved 92 12/16/2007 December 2007 I Ongoing site activity Pass Pass Pass Pass Pass Pass PassAluminum Dissolved 92 1/8/2008 January 2008 Ongoing site activity Pass Pass Pass Pass Pass Pass PassAluminum Dissolved 92 2/14/2008 Februrary 2008 Ongoing site activity Pass Pass Pass Pass Pass Pass PassAluminum Dissolved 92 3/14/2008 March 2008 Ongoing site activity Pass Pass Pass Pass Pass Pass PassAluminum Dissolved 92 4/13/2008 April 2008 Ongoing site activity Pass Pass Pass Pass Pass Pass PassAluminum Dissolved 92 5/6/2008 May 2008 Ongoing site activity Pass Pass Pass Pass Pass Pass PassAluminum Dissolved 92 6/26/2008 June 2008 Ongoing site activity Fail Pass Pass Pass Fail Fail PassAluminum Dissolved 92 7/24/2008 July 2008 Ongoing site activity Pass Pass Pass Pass Pass Pass PassAluminum Dissolved 92 8/19/2008 August 2008 Ongoing site activity -- -- -- -- -- -- --Aluminum Dissolved 92 9/9/2008 September 2008 Ongoing site activity -- -- -- -- -- -- --Aluminum Dissolved 92 10/15/2008 October 2008 Ongoing site activity -- Pass -- Pass -- Pass PassCopper Dissolved 1.6 10/16/1996 October 1996 II Pre-site activity -- nd -- nd -- -- --Copper Dissolved 1.6 9/1/1997 September 1997 Pre-site activity -- nd -- nd -- -- --Copper Dissolved 1.6 4/20/2005 April 2005 II Pre-site activity -- nd -- Pass -- -- --Copper Dissolved 1.6 2/15/2006 February 2006 II Pre-site activity nd nd nd nd -- -- --Copper Dissolved 1.6 5/16/2006 May 2006 II Pre-site activity nd nd nd nd -- -- --Copper Dissolved 1.6 8/29/2006 August 2006 II Pre-site activity Pass Pass Pass Fail nd Fail --Copper Dissolved 1.6 10/17/2006 October 2006 Pre-site activity nd nd nd nd Pass Pass --Copper Dissolved 1.6 12/7/2006 December 2006 Pre-site activity nd nd nd nd nd nd --Copper Dissolved 1.6 2/26/2007 February 2007 Pre-site activity nd nd nd nd nd nd ndCopper Dissolved 1.6 4/7/2007 April 2007 Pre-site activity Pass Pass Pass Pass Pass Pass PassCopper Dissolved 1.6 5/14/2007 May 2007 Pre-site activity Pass Pass Pass Pass nd Pass PassCopper Dissolved 1.6 6/4/2007 June 2007 Pre-site activity Pass Pass Pass Pass Pass Pass FailCopper Dissolved 1.6 7/1/2007 July 2007 I Pre-site activity Fail Pass Pass Pass Pass Pass PassCopper Dissolved 1.6 7/23/2007 July 2007 II Pre-site activity Pass Pass Pass Pass nd Pass PassCopper Dissolved 1.6 8/13/2007 August 2007 I Pre-site activity Pass Pass Pass Pass Pass Pass PassCopper Dissolved 1.6 8/27/2007 August 2007 II Pre-site activity Pass Pass Pass Pass Pass Pass PassCopper Dissolved 1.6 9/10/2007 September 2007 I Pre-site activity Pass Pass Pass Pass Pass Pass PassCopper Dissolved 1.6 9/30/2007 September 2007 II Ongoing site activity Pass Pass Pass Pass Pass Pass PassCopper Dissolved 1.6 10/16/2007 October 2007 Ongoing site activity Pass Pass Pass Pass Pass Pass FailCopper Dissolved 1.6 11/12/2007 November 2007 Ongoing site activity Pass Pass Pass Pass Pass Pass PassCopper Dissolved 1.6 12/16/2007 December 2007 I Ongoing site activity Pass Fail Pass Pass Pass Pass PassCopper Dissolved 1.6 1/8/2008 January 2008 Ongoing site activity Pass Pass nd Pass Pass Pass PassCopper Dissolved 1.6 2/14/2008 Februrary 2008 Ongoing site activity Pass Pass Pass Pass Pass Pass PassCopper Dissolved 1.6 3/14/2008 March 2008 Ongoing site activity Pass Pass nd nd nd Pass PassCopper Dissolved 1.6 4/13/2008 April 2008 Ongoing site activity Pass Pass Pass Pass Pass Pass PassCopper Dissolved 1.6 5/6/2008 May 2008 Ongoing site activity Pass Pass Pass Pass nd Pass PassCopper Dissolved 1.6 6/26/2008 June 2008 Ongoing site activity nd nd nd nd nd nd ndCopper Dissolved 1.6 7/24/2008 July 2008 Ongoing site activity Pass Pass Pass Pass Pass Pass PassCopper Dissolved 1.6 8/19/2008 August 2008 Ongoing site activity -- -- -- -- -- -- --Copper Dissolved 1.6 9/9/2008 September 2008 Ongoing site activity -- -- -- -- -- -- --Copper Dissolved 1.6 10/15/2008 October 2008 Ongoing site activity -- nd -- nd -- nd nd
Notes: -- = Sample not collectednd = Screening not conducted for nondetected samples.
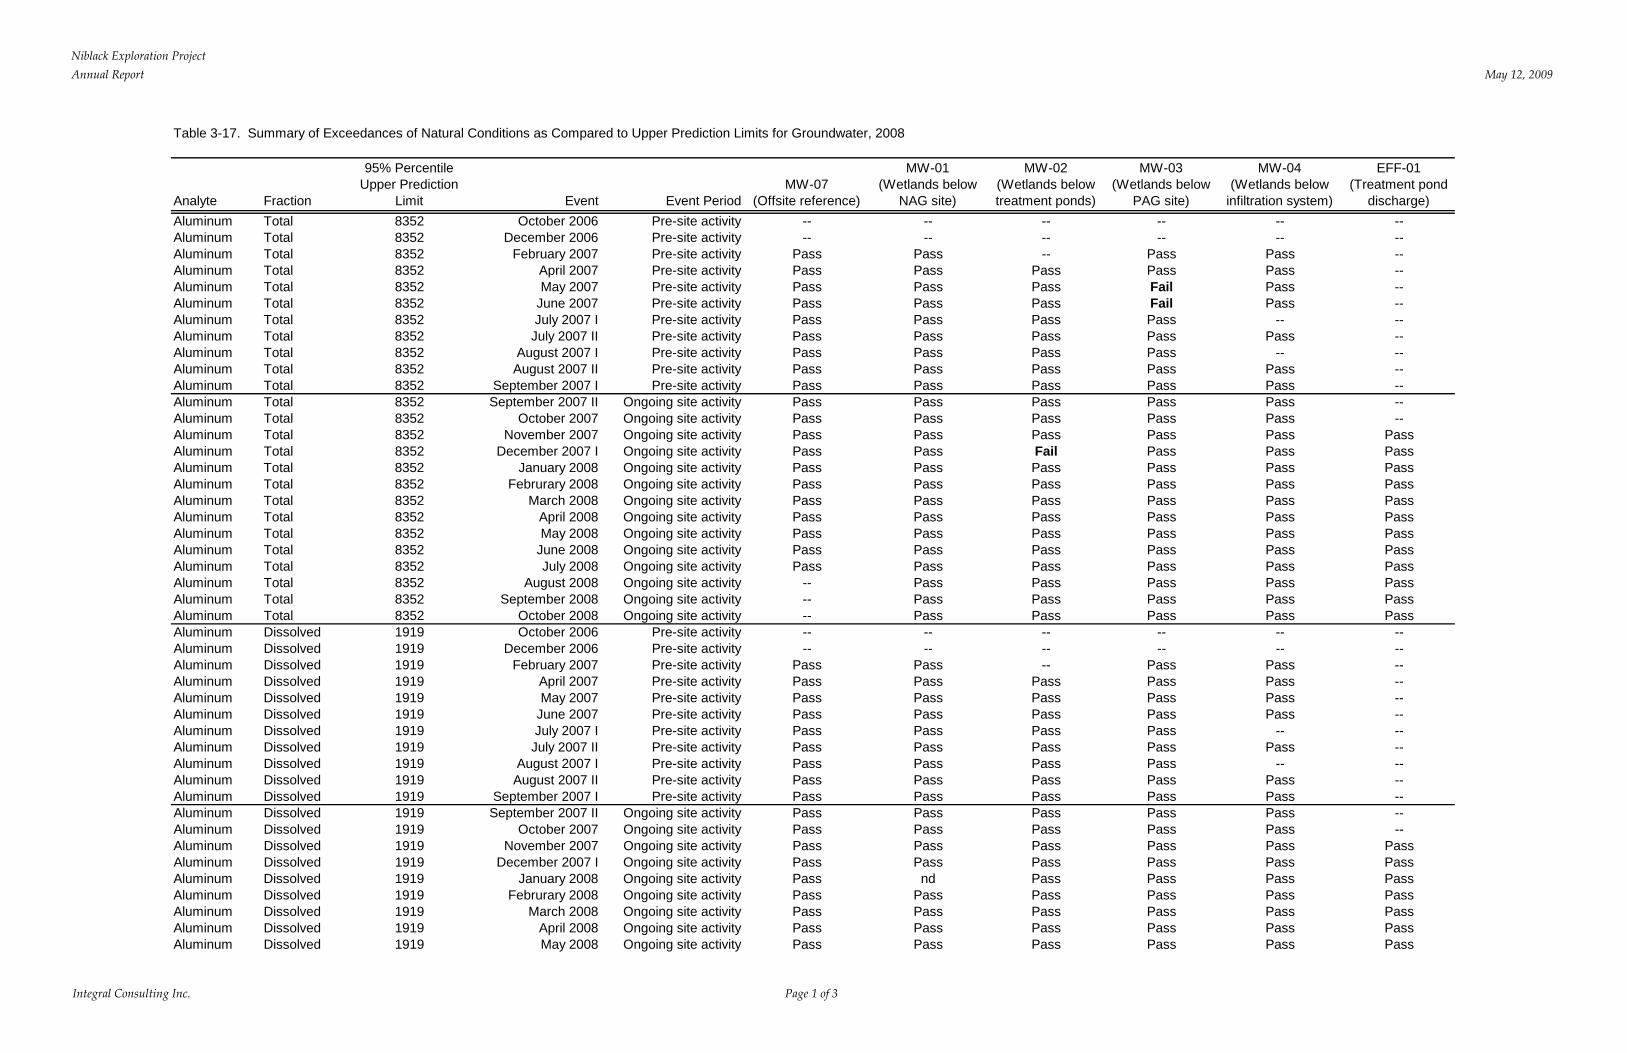
Niblack Exploration ProjectAnnual Report May 12, 2009
Integral Consulting Inc. Page 1 of 3
Table 3-17. Summary of Exceedances of Natural Conditions as Compared to Upper Prediction Limits for Groundwater, 2008
Analyte Fraction
95% Percentile Upper Prediction
Limit Event Event PeriodMW-07
(Offsite reference)
MW-01(Wetlands below
NAG site)
MW-02(Wetlands below treatment ponds)
MW-03(Wetlands below
PAG site)
MW-04(Wetlands below
infiltration system)
EFF-01(Treatment pond
discharge)Aluminum Total 8352 October 2006 Pre-site activity -- -- -- -- -- --Aluminum Total 8352 December 2006 Pre-site activity -- -- -- -- -- --Aluminum Total 8352 February 2007 Pre-site activity Pass Pass -- Pass Pass --Aluminum Total 8352 April 2007 Pre-site activity Pass Pass Pass Pass Pass --Aluminum Total 8352 May 2007 Pre-site activity Pass Pass Pass Fail Pass --Aluminum Total 8352 June 2007 Pre-site activity Pass Pass Pass Fail Pass --Aluminum Total 8352 July 2007 I Pre-site activity Pass Pass Pass Pass -- --Aluminum Total 8352 July 2007 II Pre-site activity Pass Pass Pass Pass Pass --Aluminum Total 8352 August 2007 I Pre-site activity Pass Pass Pass Pass -- --Aluminum Total 8352 August 2007 II Pre-site activity Pass Pass Pass Pass Pass --Aluminum Total 8352 September 2007 I Pre-site activity Pass Pass Pass Pass Pass --Aluminum Total 8352 September 2007 II Ongoing site activity Pass Pass Pass Pass Pass --Aluminum Total 8352 October 2007 Ongoing site activity Pass Pass Pass Pass Pass --Aluminum Total 8352 November 2007 Ongoing site activity Pass Pass Pass Pass Pass PassAluminum Total 8352 December 2007 I Ongoing site activity Pass Pass Fail Pass Pass PassAluminum Total 8352 January 2008 Ongoing site activity Pass Pass Pass Pass Pass PassAluminum Total 8352 Februrary 2008 Ongoing site activity Pass Pass Pass Pass Pass PassAluminum Total 8352 March 2008 Ongoing site activity Pass Pass Pass Pass Pass PassAluminum Total 8352 April 2008 Ongoing site activity Pass Pass Pass Pass Pass PassAluminum Total 8352 May 2008 Ongoing site activity Pass Pass Pass Pass Pass PassAluminum Total 8352 June 2008 Ongoing site activity Pass Pass Pass Pass Pass PassAluminum Total 8352 July 2008 Ongoing site activity Pass Pass Pass Pass Pass PassAluminum Total 8352 August 2008 Ongoing site activity -- Pass Pass Pass Pass PassAluminum Total 8352 September 2008 Ongoing site activity -- Pass Pass Pass Pass PassAluminum Total 8352 October 2008 Ongoing site activity -- Pass Pass Pass Pass PassAluminum Dissolved 1919 October 2006 Pre-site activity -- -- -- -- -- --Aluminum Dissolved 1919 December 2006 Pre-site activity -- -- -- -- -- --Aluminum Dissolved 1919 February 2007 Pre-site activity Pass Pass -- Pass Pass --Aluminum Dissolved 1919 April 2007 Pre-site activity Pass Pass Pass Pass Pass --Aluminum Dissolved 1919 May 2007 Pre-site activity Pass Pass Pass Pass Pass --Aluminum Dissolved 1919 June 2007 Pre-site activity Pass Pass Pass Pass Pass --Aluminum Dissolved 1919 July 2007 I Pre-site activity Pass Pass Pass Pass -- --Aluminum Dissolved 1919 July 2007 II Pre-site activity Pass Pass Pass Pass Pass --Aluminum Dissolved 1919 August 2007 I Pre-site activity Pass Pass Pass Pass -- --Aluminum Dissolved 1919 August 2007 II Pre-site activity Pass Pass Pass Pass Pass --Aluminum Dissolved 1919 September 2007 I Pre-site activity Pass Pass Pass Pass Pass --Aluminum Dissolved 1919 September 2007 II Ongoing site activity Pass Pass Pass Pass Pass --Aluminum Dissolved 1919 October 2007 Ongoing site activity Pass Pass Pass Pass Pass --Aluminum Dissolved 1919 November 2007 Ongoing site activity Pass Pass Pass Pass Pass PassAluminum Dissolved 1919 December 2007 I Ongoing site activity Pass Pass Pass Pass Pass PassAluminum Dissolved 1919 January 2008 Ongoing site activity Pass nd Pass Pass Pass PassAluminum Dissolved 1919 Februrary 2008 Ongoing site activity Pass Pass Pass Pass Pass PassAluminum Dissolved 1919 March 2008 Ongoing site activity Pass Pass Pass Pass Pass PassAluminum Dissolved 1919 April 2008 Ongoing site activity Pass Pass Pass Pass Pass PassAluminum Dissolved 1919 May 2008 Ongoing site activity Pass Pass Pass Pass Pass Pass
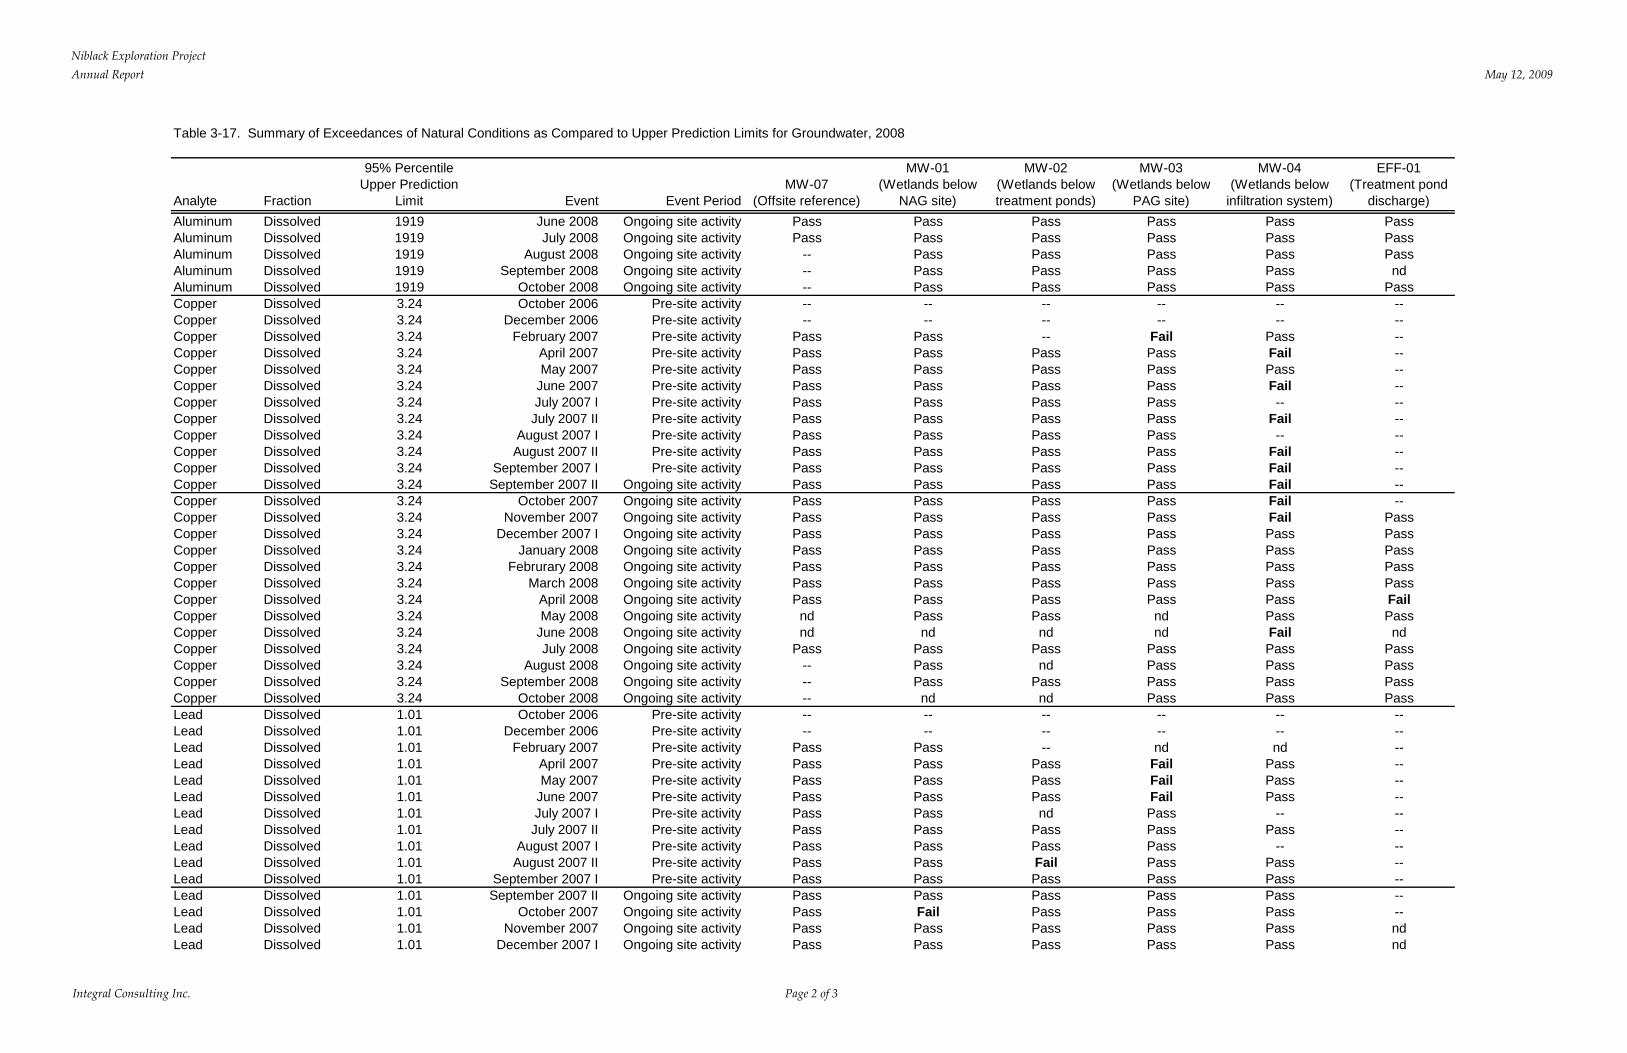
Niblack Exploration ProjectAnnual Report May 12, 2009
Integral Consulting Inc. Page 2 of 3
Table 3-17. Summary of Exceedances of Natural Conditions as Compared to Upper Prediction Limits for Groundwater, 2008
Analyte Fraction
95% Percentile Upper Prediction
Limit Event Event PeriodMW-07
(Offsite reference)
MW-01(Wetlands below
NAG site)
MW-02(Wetlands below treatment ponds)
MW-03(Wetlands below
PAG site)
MW-04(Wetlands below
infiltration system)
EFF-01(Treatment pond
discharge)Aluminum Dissolved 1919 June 2008 Ongoing site activity Pass Pass Pass Pass Pass PassAluminum Dissolved 1919 July 2008 Ongoing site activity Pass Pass Pass Pass Pass PassAluminum Dissolved 1919 August 2008 Ongoing site activity -- Pass Pass Pass Pass PassAluminum Dissolved 1919 September 2008 Ongoing site activity -- Pass Pass Pass Pass ndAluminum Dissolved 1919 October 2008 Ongoing site activity -- Pass Pass Pass Pass PassCopper Dissolved 3.24 October 2006 Pre-site activity -- -- -- -- -- --Copper Dissolved 3.24 December 2006 Pre-site activity -- -- -- -- -- --Copper Dissolved 3.24 February 2007 Pre-site activity Pass Pass -- Fail Pass --Copper Dissolved 3.24 April 2007 Pre-site activity Pass Pass Pass Pass Fail --Copper Dissolved 3.24 May 2007 Pre-site activity Pass Pass Pass Pass Pass --Copper Dissolved 3.24 June 2007 Pre-site activity Pass Pass Pass Pass Fail --Copper Dissolved 3.24 July 2007 I Pre-site activity Pass Pass Pass Pass -- --Copper Dissolved 3.24 July 2007 II Pre-site activity Pass Pass Pass Pass Fail --Copper Dissolved 3.24 August 2007 I Pre-site activity Pass Pass Pass Pass -- --Copper Dissolved 3.24 August 2007 II Pre-site activity Pass Pass Pass Pass Fail --Copper Dissolved 3.24 September 2007 I Pre-site activity Pass Pass Pass Pass Fail --Copper Dissolved 3.24 September 2007 II Ongoing site activity Pass Pass Pass Pass Fail --Copper Dissolved 3.24 October 2007 Ongoing site activity Pass Pass Pass Pass Fail --Copper Dissolved 3.24 November 2007 Ongoing site activity Pass Pass Pass Pass Fail PassCopper Dissolved 3.24 December 2007 I Ongoing site activity Pass Pass Pass Pass Pass PassCopper Dissolved 3.24 January 2008 Ongoing site activity Pass Pass Pass Pass Pass PassCopper Dissolved 3.24 Februrary 2008 Ongoing site activity Pass Pass Pass Pass Pass PassCopper Dissolved 3.24 March 2008 Ongoing site activity Pass Pass Pass Pass Pass PassCopper Dissolved 3.24 April 2008 Ongoing site activity Pass Pass Pass Pass Pass FailCopper Dissolved 3.24 May 2008 Ongoing site activity nd Pass Pass nd Pass PassCopper Dissolved 3.24 June 2008 Ongoing site activity nd nd nd nd Fail ndCopper Dissolved 3.24 July 2008 Ongoing site activity Pass Pass Pass Pass Pass PassCopper Dissolved 3.24 August 2008 Ongoing site activity -- Pass nd Pass Pass PassCopper Dissolved 3.24 September 2008 Ongoing site activity -- Pass Pass Pass Pass PassCopper Dissolved 3.24 October 2008 Ongoing site activity -- nd nd Pass Pass PassLead Dissolved 1.01 October 2006 Pre-site activity -- -- -- -- -- --Lead Dissolved 1.01 December 2006 Pre-site activity -- -- -- -- -- --Lead Dissolved 1.01 February 2007 Pre-site activity Pass Pass -- nd nd --Lead Dissolved 1.01 April 2007 Pre-site activity Pass Pass Pass Fail Pass --Lead Dissolved 1.01 May 2007 Pre-site activity Pass Pass Pass Fail Pass --Lead Dissolved 1.01 June 2007 Pre-site activity Pass Pass Pass Fail Pass --Lead Dissolved 1.01 July 2007 I Pre-site activity Pass Pass nd Pass -- --Lead Dissolved 1.01 July 2007 II Pre-site activity Pass Pass Pass Pass Pass --Lead Dissolved 1.01 August 2007 I Pre-site activity Pass Pass Pass Pass -- --Lead Dissolved 1.01 August 2007 II Pre-site activity Pass Pass Fail Pass Pass --Lead Dissolved 1.01 September 2007 I Pre-site activity Pass Pass Pass Pass Pass --Lead Dissolved 1.01 September 2007 II Ongoing site activity Pass Pass Pass Pass Pass --Lead Dissolved 1.01 October 2007 Ongoing site activity Pass Fail Pass Pass Pass --Lead Dissolved 1.01 November 2007 Ongoing site activity Pass Pass Pass Pass Pass ndLead Dissolved 1.01 December 2007 I Ongoing site activity Pass Pass Pass Pass Pass nd

Niblack Exploration ProjectAnnual Report May 12, 2009
Integral Consulting Inc. Page 3 of 3
Table 3-17. Summary of Exceedances of Natural Conditions as Compared to Upper Prediction Limits for Groundwater, 2008
Analyte Fraction
95% Percentile Upper Prediction
Limit Event Event PeriodMW-07
(Offsite reference)
MW-01(Wetlands below
NAG site)
MW-02(Wetlands below treatment ponds)
MW-03(Wetlands below
PAG site)
MW-04(Wetlands below
infiltration system)
EFF-01(Treatment pond
discharge)Lead Dissolved 1.01 January 2008 Ongoing site activity Pass Pass Pass Pass Pass ndLead Dissolved 1.01 Februrary 2008 Ongoing site activity Pass Pass Pass Pass Pass PassLead Dissolved 1.01 March 2008 Ongoing site activity Pass Pass Pass Pass Pass PassLead Dissolved 1.01 April 2008 Ongoing site activity Pass Pass Pass Pass Pass ndLead Dissolved 1.01 May 2008 Ongoing site activity Pass Pass Pass nd nd ndLead Dissolved 1.01 June 2008 Ongoing site activity Pass Pass Pass Pass Pass ndLead Dissolved 1.01 July 2008 Ongoing site activity Pass Pass Pass Pass Pass PassLead Dissolved 1.01 August 2008 Ongoing site activity -- Pass Pass Pass Pass ndLead Dissolved 1.01 September 2008 Ongoing site activity -- Pass Pass Pass Pass PassLead Dissolved 1.01 October 2008 Ongoing site activity -- Pass Pass Pass Pass nd
Notes: -- = Sample not collectednd = Screening not conducted for nondetected samples.
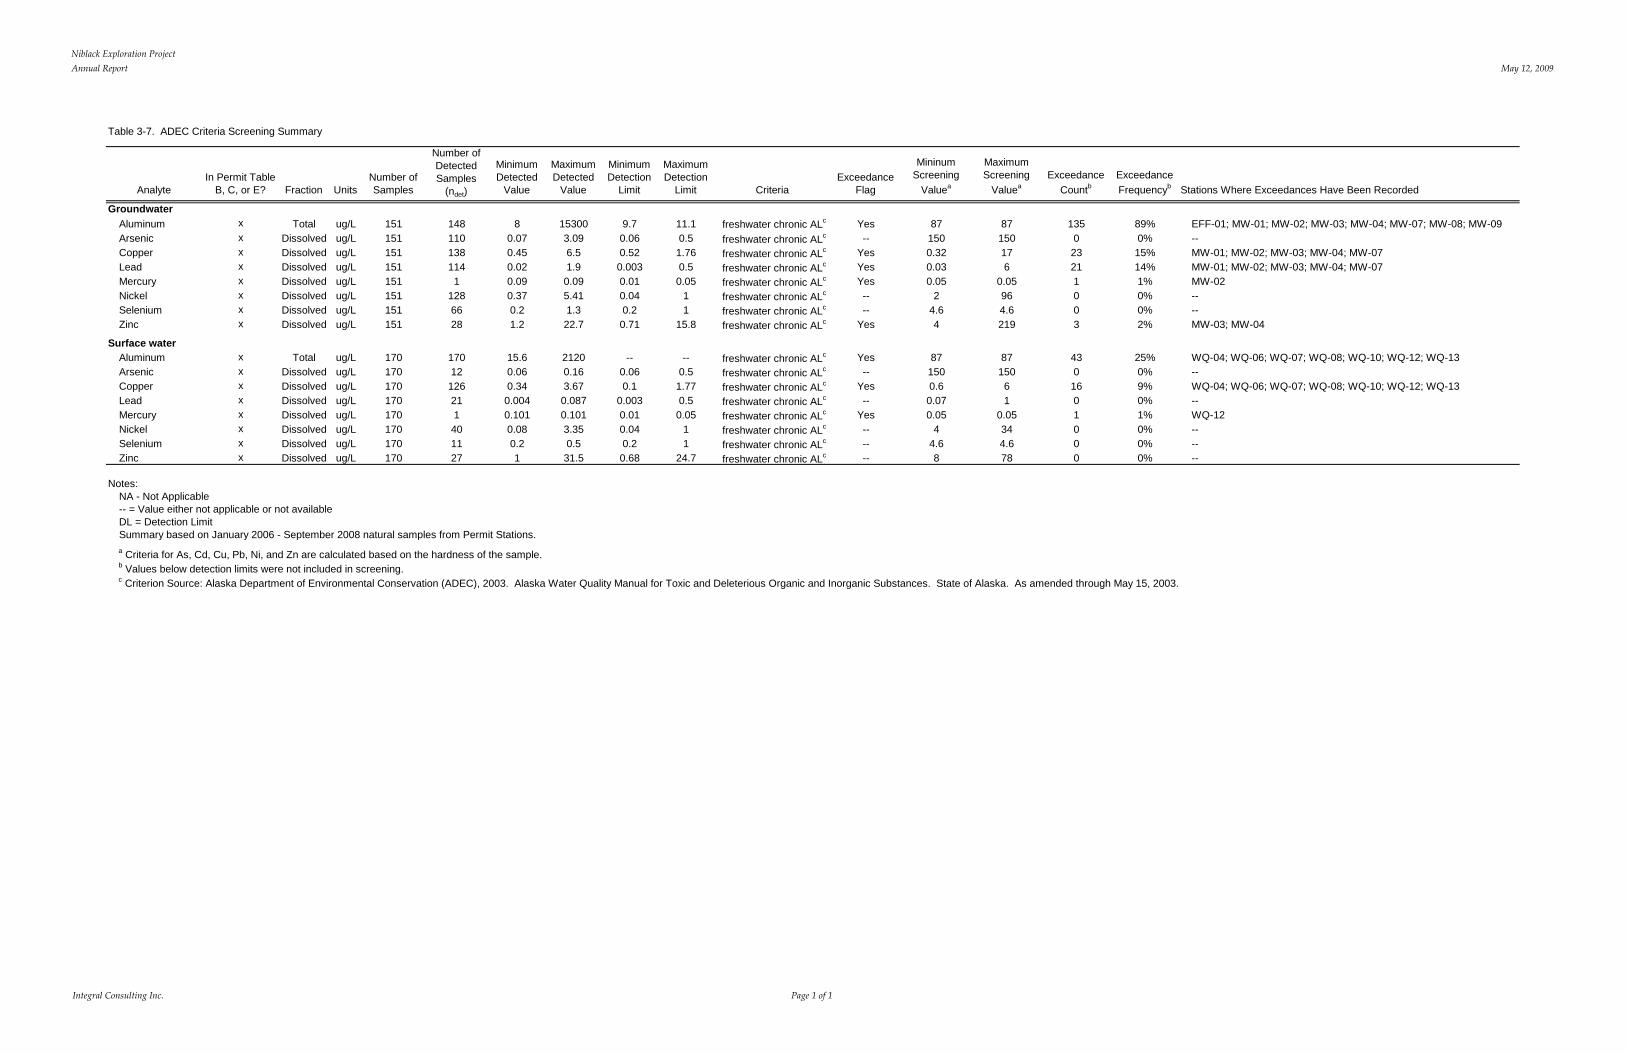
Niblack Exploration ProjectAnnual Report May 12, 2009
Integral Consulting Inc. Page 1 of 1
Table 3-7. ADEC Criteria Screening Summary
AnalyteIn Permit Table
B, C, or E? Fraction UnitsNumber of Samples
Number of Detected Samples
(ndet)
Minimum Detected
Value
Maximum Detected
Value
Minimum Detection
Limit
Maximum Detection
Limit CriteriaExceedance
Flag
Mininum Screening
Valuea
Maximum Screening
ValueaExceedance
CountbExceedance Frequencyb Stations Where Exceedances Have Been Recorded
GroundwaterAluminum x Total ug/L 151 148 8 15300 9.7 11.1 freshwater chronic ALc Yes 87 87 135 89% EFF-01; MW-01; MW-02; MW-03; MW-04; MW-07; MW-08; MW-09Arsenic x Dissolved ug/L 151 110 0.07 3.09 0.06 0.5 freshwater chronic ALc -- 150 150 0 0% --Copper x Dissolved ug/L 151 138 0.45 6.5 0.52 1.76 freshwater chronic ALc Yes 0.32 17 23 15% MW-01; MW-02; MW-03; MW-04; MW-07Lead x Dissolved ug/L 151 114 0.02 1.9 0.003 0.5 freshwater chronic ALc Yes 0.03 6 21 14% MW-01; MW-02; MW-03; MW-04; MW-07Mercury x Dissolved ug/L 151 1 0.09 0.09 0.01 0.05 freshwater chronic ALc Yes 0.05 0.05 1 1% MW-02Nickel x Dissolved ug/L 151 128 0.37 5.41 0.04 1 freshwater chronic ALc -- 2 96 0 0% --Selenium x Dissolved ug/L 151 66 0.2 1.3 0.2 1 freshwater chronic ALc -- 4.6 4.6 0 0% --Zinc x Dissolved ug/L 151 28 1.2 22.7 0.71 15.8 freshwater chronic ALc Yes 4 219 3 2% MW-03; MW-04
Surface waterAluminum x Total ug/L 170 170 15.6 2120 -- -- freshwater chronic ALc Yes 87 87 43 25% WQ-04; WQ-06; WQ-07; WQ-08; WQ-10; WQ-12; WQ-13Arsenic x Dissolved ug/L 170 12 0.06 0.16 0.06 0.5 freshwater chronic ALc -- 150 150 0 0% --Copper x Dissolved ug/L 170 126 0.34 3.67 0.1 1.77 freshwater chronic ALc Yes 0.6 6 16 9% WQ-04; WQ-06; WQ-07; WQ-08; WQ-10; WQ-12; WQ-13Lead x Dissolved ug/L 170 21 0.004 0.087 0.003 0.5 freshwater chronic ALc -- 0.07 1 0 0% --Mercury x Dissolved ug/L 170 1 0.101 0.101 0.01 0.05 freshwater chronic ALc Yes 0.05 0.05 1 1% WQ-12Nickel x Dissolved ug/L 170 40 0.08 3.35 0.04 1 freshwater chronic ALc -- 4 34 0 0% --Selenium x Dissolved ug/L 170 11 0.2 0.5 0.2 1 freshwater chronic ALc -- 4.6 4.6 0 0% --Zinc x Dissolved ug/L 170 27 1 31.5 0.68 24.7 freshwater chronic ALc -- 8 78 0 0% --
Notes:NA - Not Applicable-- = Value either not applicable or not availableDL = Detection LimitSummary based on January 2006 - September 2008 natural samples from Permit Stations.a Criteria for As, Cd, Cu, Pb, Ni, and Zn are calculated based on the hardness of the sample.b Values below detection limits were not included in screening.c Criterion Source: Alaska Department of Environmental Conservation (ADEC), 2003. Alaska Water Quality Manual for Toxic and Deleterious Organic and Inorganic Substances. State of Alaska. As amended through May 15, 2003.

Niblack Exploration ProjectAnnual Report May 12, 2009
Integral Consulting Inc. Page 1 of 5
Table 3-8. ADEC Chronic Aquatic Life Criteria Screening Results - Surface Water
Aluminum Arsenic Copper Lead Mercury Nickel Selenium Silver ZincTotal Dissolved Dissolved Dissolved Dissolved Dissolved Dissolved Dissolved Dissolved
WQ-04 October 1996 II 10/16/1996 Historical nd Pass nd nd nd nd nd nd FailWQ-04 September 1997 9/3/1997 Historical nc nd nd nd nd nd nd nd ndWQ-04 April 2005 II 4/20/2005 Historical Pass nd nd nd nd nd nd nd ndWQ-04 February 2006 II 2/15/2006 Reference Pass nd nd nd nd nd nd nd ndWQ-04 May 2006 II 5/16/2006 Reference Pass nd nd nd nd nd nd nd ndWQ-04 August 2006 II 8/29/2006 Reference Fail nd Pass nd nd nd nd nd ndWQ-04 October 2006 10/17/2006 Reference Pass nd nd nd nd nd nd nd ndWQ-04 December 2006 12/7/2006 Reference Fail nd nd nd nd nd nd nd ndWQ-04 February 2007 2/26/2007 Reference Pass nd nd nd nd nd nd nd ndWQ-04 February 2007 2/26/2007 Reference (FR) Pass nd nd nd nd nd nd nd ndWQ-04 April 2007 4/10/2007 Reference Pass nd Pass nd nd nd nd nd ndWQ-04 May 2007 5/14/2007 Reference (FR) Fail nd Pass nd nd nd nd nd ndWQ-04 May 2007 5/14/2007 Reference Fail nd Pass nd nd nd nd nd ndWQ-04 June 2007 6/4/2007 Reference Fail nd Fail nd nd nd nd nd ndWQ-04 July 2007 I 7/1/2007 Reference Pass nd Pass nd nd nd nd nd PassWQ-04 July 2007 II 7/24/2007 Reference (FR) Pass Pass Pass nd nd Pass Pass nd ndWQ-04 July 2007 II 7/24/2007 Reference Pass Pass Pass nd nd Pass Pass nd PassWQ-04 August 2007 I 8/14/2007 Reference Pass nd Pass nd nd Pass nd nd PassWQ-04 August 2007 II 8/27/2007 Reference Pass nd Pass nd nd Pass nd nd ndWQ-04 September 2007 I 9/11/2007 Reference Pass Pass Pass nd nd nd Pass nd ndWQ-04 September 2007 II 10/2/2007 Compliance Fail nd Pass nd nd nd nd nd ndWQ-04 October 2007 10/17/2007 Compliance Fail nd Pass Pass nd nd nd nd ndWQ-04 November 2007 11/13/2007 Compliance Fail nd Pass nd nd Pass nd nd ndWQ-04 December 2007 12/15/2007 Compliance Fail nd Pass nd nd nd nd n/a ndWQ-04 January 2008 1/9/2008 Compliance Fail nd Pass nd nd nd Pass nd ndWQ-04 February 2008 2/14/2008 Compliance Fail nd Pass Pass nd nd nd nd ndWQ-04 March 2008 3/15/2008 Compliance Fail nd Pass nd nd Pass nd R ndWQ-04 April 2008 4/14/2008 Compliance Fail nd Pass nd nd Pass nd nd ndWQ-04 May 2008 5/8/2008 Compliance Pass nd Pass nd nd Pass nd nd ndWQ-04 June 2008 6/28/2008 Compliance Fail nd nd nd nd nd nd nd ndWQ-04 July 2008 7/24/2008 Compliance Pass nd Pass Pass nd Pass nd nd ndWQ-04 October 2008 10/15/2008 Compliance Pass nd nd nd nd nd nd nd ndWQ-06 October 1996 II 10/16/1996 Historical nd nd nd Fail nd nd nd nd ndWQ-06 September 1997 9/3/1997 Historical (FR) nc nd nd nd nd nd nd nd ndWQ-06 September 1997 9/3/1997 Historical nc nd nd nd nd nd nd nd ndWQ-06 April 2005 II 4/20/2005 Historical Pass nd Fail nd nd nd nd nd ndWQ-06 February 2006 II 2/15/2006 Reference Pass nd nd nd nd nd nd nd ndWQ-06 May 2006 II 5/16/2006 Reference (FR) Pass nd nd nd nd nd nd nd ndWQ-06 May 2006 II 5/16/2006 Reference Pass nd nd nd nd nd nd nd ndWQ-06 August 2006 II 8/29/2006 Reference Fail nd Fail nd nd nd nd nd ndWQ-06 October 2006 10/17/2006 Reference Pass nd nd nd nd nd nd nd ndWQ-06 December 2006 12/7/2006 Reference Pass nd nd nd nd nd nd nd ndWQ-06 February 2007 2/26/2007 Reference Pass nd nd nd nd nd nd nd nd
Station ID Date Sample PurposeSample Event
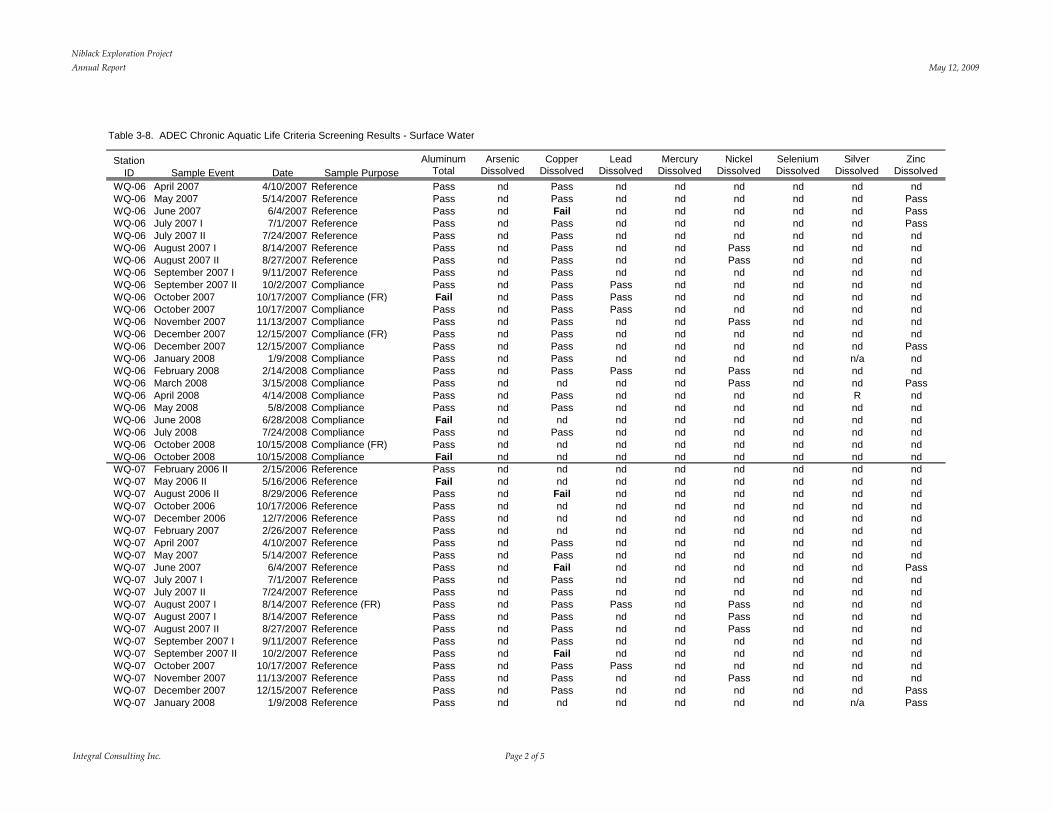
Niblack Exploration ProjectAnnual Report May 12, 2009
Integral Consulting Inc. Page 2 of 5
Table 3-8. ADEC Chronic Aquatic Life Criteria Screening Results - Surface Water
Aluminum Arsenic Copper Lead Mercury Nickel Selenium Silver ZincTotal Dissolved Dissolved Dissolved Dissolved Dissolved Dissolved Dissolved Dissolved
Station ID Date Sample PurposeSample Event
WQ-06 April 2007 4/10/2007 Reference Pass nd Pass nd nd nd nd nd ndWQ-06 May 2007 5/14/2007 Reference Pass nd Pass nd nd nd nd nd PassWQ-06 June 2007 6/4/2007 Reference Pass nd Fail nd nd nd nd nd PassWQ-06 July 2007 I 7/1/2007 Reference Pass nd Pass nd nd nd nd nd PassWQ-06 July 2007 II 7/24/2007 Reference Pass nd Pass nd nd nd nd nd ndWQ-06 August 2007 I 8/14/2007 Reference Pass nd Pass nd nd Pass nd nd ndWQ-06 August 2007 II 8/27/2007 Reference Pass nd Pass nd nd Pass nd nd ndWQ-06 September 2007 I 9/11/2007 Reference Pass nd Pass nd nd nd nd nd ndWQ-06 September 2007 II 10/2/2007 Compliance Pass nd Pass Pass nd nd nd nd ndWQ-06 October 2007 10/17/2007 Compliance (FR) Fail nd Pass Pass nd nd nd nd ndWQ-06 October 2007 10/17/2007 Compliance Pass nd Pass Pass nd nd nd nd ndWQ-06 November 2007 11/13/2007 Compliance Pass nd Pass nd nd Pass nd nd ndWQ-06 December 2007 12/15/2007 Compliance (FR) Pass nd Pass nd nd nd nd nd ndWQ-06 December 2007 12/15/2007 Compliance Pass nd Pass nd nd nd nd nd PassWQ-06 January 2008 1/9/2008 Compliance Pass nd Pass nd nd nd nd n/a ndWQ-06 February 2008 2/14/2008 Compliance Pass nd Pass Pass nd Pass nd nd ndWQ-06 March 2008 3/15/2008 Compliance Pass nd nd nd nd Pass nd nd PassWQ-06 April 2008 4/14/2008 Compliance Pass nd Pass nd nd nd nd R ndWQ-06 May 2008 5/8/2008 Compliance Pass nd Pass nd nd nd nd nd ndWQ-06 June 2008 6/28/2008 Compliance Fail nd nd nd nd nd nd nd ndWQ-06 July 2008 7/24/2008 Compliance Pass nd Pass nd nd nd nd nd ndWQ-06 October 2008 10/15/2008 Compliance (FR) Pass nd nd nd nd nd nd nd ndWQ-06 October 2008 10/15/2008 Compliance Fail nd nd nd nd nd nd nd ndWQ-07 February 2006 II 2/15/2006 Reference Pass nd nd nd nd nd nd nd ndWQ-07 May 2006 II 5/16/2006 Reference Fail nd nd nd nd nd nd nd ndWQ-07 August 2006 II 8/29/2006 Reference Pass nd Fail nd nd nd nd nd ndWQ-07 October 2006 10/17/2006 Reference Pass nd nd nd nd nd nd nd ndWQ-07 December 2006 12/7/2006 Reference Pass nd nd nd nd nd nd nd ndWQ-07 February 2007 2/26/2007 Reference Pass nd nd nd nd nd nd nd ndWQ-07 April 2007 4/10/2007 Reference Pass nd Pass nd nd nd nd nd ndWQ-07 May 2007 5/14/2007 Reference Pass nd Pass nd nd nd nd nd ndWQ-07 June 2007 6/4/2007 Reference Pass nd Fail nd nd nd nd nd PassWQ-07 July 2007 I 7/1/2007 Reference Pass nd Pass nd nd nd nd nd ndWQ-07 July 2007 II 7/24/2007 Reference Pass nd Pass nd nd nd nd nd ndWQ-07 August 2007 I 8/14/2007 Reference (FR) Pass nd Pass Pass nd Pass nd nd ndWQ-07 August 2007 I 8/14/2007 Reference Pass nd Pass nd nd Pass nd nd ndWQ-07 August 2007 II 8/27/2007 Reference Pass nd Pass nd nd Pass nd nd ndWQ-07 September 2007 I 9/11/2007 Reference Pass nd Pass nd nd nd nd nd ndWQ-07 September 2007 II 10/2/2007 Reference Pass nd Fail nd nd nd nd nd ndWQ-07 October 2007 10/17/2007 Reference Pass nd Pass Pass nd nd nd nd ndWQ-07 November 2007 11/13/2007 Reference Pass nd Pass nd nd Pass nd nd ndWQ-07 December 2007 12/15/2007 Reference Pass nd Pass nd nd nd nd nd PassWQ-07 January 2008 1/9/2008 Reference Pass nd nd nd nd nd nd n/a Pass
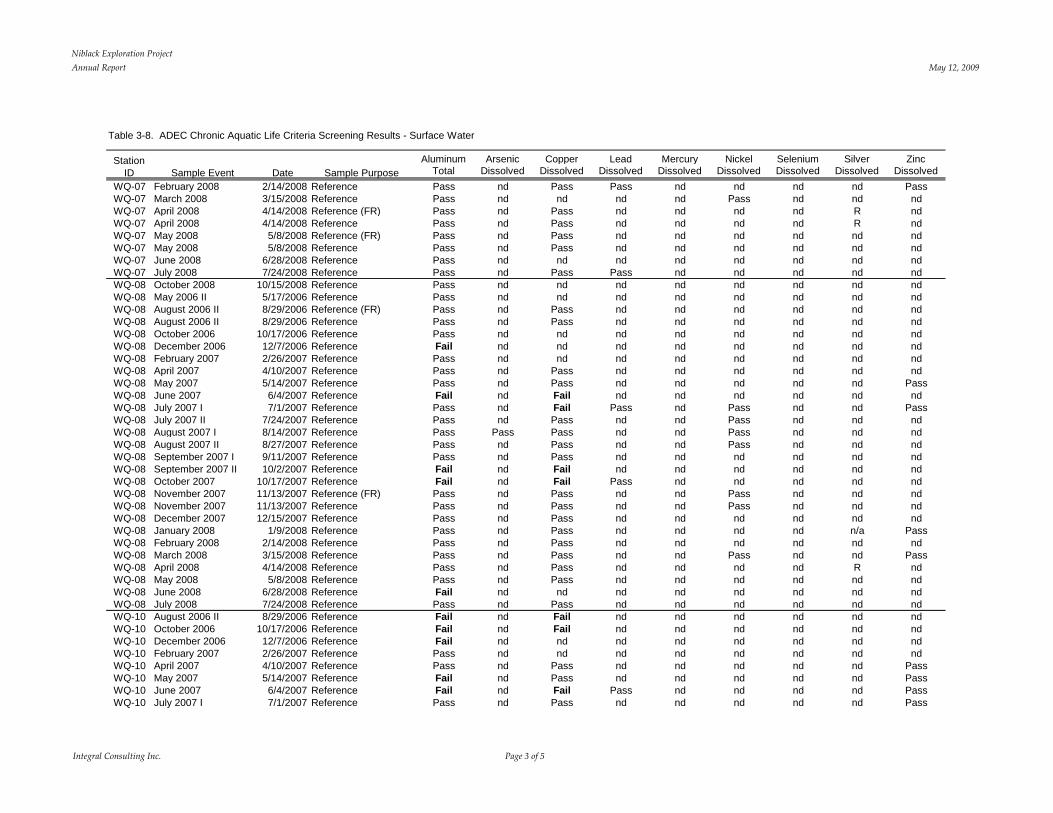
Niblack Exploration ProjectAnnual Report May 12, 2009
Integral Consulting Inc. Page 3 of 5
Table 3-8. ADEC Chronic Aquatic Life Criteria Screening Results - Surface Water
Aluminum Arsenic Copper Lead Mercury Nickel Selenium Silver ZincTotal Dissolved Dissolved Dissolved Dissolved Dissolved Dissolved Dissolved Dissolved
Station ID Date Sample PurposeSample Event
WQ-07 February 2008 2/14/2008 Reference Pass nd Pass Pass nd nd nd nd PassWQ-07 March 2008 3/15/2008 Reference Pass nd nd nd nd Pass nd nd ndWQ-07 April 2008 4/14/2008 Reference (FR) Pass nd Pass nd nd nd nd R ndWQ-07 April 2008 4/14/2008 Reference Pass nd Pass nd nd nd nd R ndWQ-07 May 2008 5/8/2008 Reference (FR) Pass nd Pass nd nd nd nd nd ndWQ-07 May 2008 5/8/2008 Reference Pass nd Pass nd nd nd nd nd ndWQ-07 June 2008 6/28/2008 Reference Pass nd nd nd nd nd nd nd ndWQ-07 July 2008 7/24/2008 Reference Pass nd Pass Pass nd nd nd nd ndWQ-08 October 2008 10/15/2008 Reference Pass nd nd nd nd nd nd nd ndWQ-08 May 2006 II 5/17/2006 Reference Pass nd nd nd nd nd nd nd ndWQ-08 August 2006 II 8/29/2006 Reference (FR) Pass nd Pass nd nd nd nd nd ndWQ-08 August 2006 II 8/29/2006 Reference Pass nd Pass nd nd nd nd nd ndWQ-08 October 2006 10/17/2006 Reference Pass nd nd nd nd nd nd nd ndWQ-08 December 2006 12/7/2006 Reference Fail nd nd nd nd nd nd nd ndWQ-08 February 2007 2/26/2007 Reference Pass nd nd nd nd nd nd nd ndWQ-08 April 2007 4/10/2007 Reference Pass nd Pass nd nd nd nd nd ndWQ-08 May 2007 5/14/2007 Reference Pass nd Pass nd nd nd nd nd PassWQ-08 June 2007 6/4/2007 Reference Fail nd Fail nd nd nd nd nd ndWQ-08 July 2007 I 7/1/2007 Reference Pass nd Fail Pass nd Pass nd nd PassWQ-08 July 2007 II 7/24/2007 Reference Pass nd Pass nd nd Pass nd nd ndWQ-08 August 2007 I 8/14/2007 Reference Pass Pass Pass nd nd Pass nd nd ndWQ-08 August 2007 II 8/27/2007 Reference Pass nd Pass nd nd Pass nd nd ndWQ-08 September 2007 I 9/11/2007 Reference Pass nd Pass nd nd nd nd nd ndWQ-08 September 2007 II 10/2/2007 Reference Fail nd Fail nd nd nd nd nd ndWQ-08 October 2007 10/17/2007 Reference Fail nd Fail Pass nd nd nd nd ndWQ-08 November 2007 11/13/2007 Reference (FR) Pass nd Pass nd nd Pass nd nd ndWQ-08 November 2007 11/13/2007 Reference Pass nd Pass nd nd Pass nd nd ndWQ-08 December 2007 12/15/2007 Reference Pass nd Pass nd nd nd nd nd ndWQ-08 January 2008 1/9/2008 Reference Pass nd Pass nd nd nd nd n/a PassWQ-08 February 2008 2/14/2008 Reference Pass nd Pass nd nd nd nd nd ndWQ-08 March 2008 3/15/2008 Reference Pass nd Pass nd nd Pass nd nd PassWQ-08 April 2008 4/14/2008 Reference Pass nd Pass nd nd nd nd R ndWQ-08 May 2008 5/8/2008 Reference Pass nd Pass nd nd nd nd nd ndWQ-08 June 2008 6/28/2008 Reference Fail nd nd nd nd nd nd nd ndWQ-08 July 2008 7/24/2008 Reference Pass nd Pass nd nd nd nd nd ndWQ-10 August 2006 II 8/29/2006 Reference Fail nd Fail nd nd nd nd nd ndWQ-10 October 2006 10/17/2006 Reference Fail nd Fail nd nd nd nd nd ndWQ-10 December 2006 12/7/2006 Reference Fail nd nd nd nd nd nd nd ndWQ-10 February 2007 2/26/2007 Reference Pass nd nd nd nd nd nd nd ndWQ-10 April 2007 4/10/2007 Reference Pass nd Pass nd nd nd nd nd PassWQ-10 May 2007 5/14/2007 Reference Fail nd Pass nd nd nd nd nd PassWQ-10 June 2007 6/4/2007 Reference Fail nd Fail Pass nd nd nd nd PassWQ-10 July 2007 I 7/1/2007 Reference Pass nd Pass nd nd nd nd nd Pass

Niblack Exploration ProjectAnnual Report May 12, 2009
Integral Consulting Inc. Page 4 of 5
Table 3-8. ADEC Chronic Aquatic Life Criteria Screening Results - Surface Water
Aluminum Arsenic Copper Lead Mercury Nickel Selenium Silver ZincTotal Dissolved Dissolved Dissolved Dissolved Dissolved Dissolved Dissolved Dissolved
Station ID Date Sample PurposeSample Event
WQ-10 July 2007 II 7/24/2007 Reference Pass Pass Pass nd nd nd Pass nd ndWQ-10 August 2007 I 8/14/2007 Reference Pass Pass Pass nd nd Pass nd nd ndWQ-10 August 2007 II 8/27/2007 Reference Pass nd Pass nd nd Pass nd nd ndWQ-10 September 2007 I 9/11/2007 Reference (FR) Pass Pass Pass nd nd nd Pass nd ndWQ-10 September 2007 I 9/11/2007 Reference Pass Pass Pass nd nd nd Pass nd ndWQ-10 September 2007 II 10/1/2007 Compliance Fail nd Fail nd nd nd nd nd ndWQ-10 October 2007 10/17/2007 Compliance Fail nd Pass Pass nd nd nd nd ndWQ-10 November 2007 11/13/2007 Compliance Pass nd Pass nd nd Pass Pass nd ndWQ-10 December 2007 12/15/2007 Compliance Fail nd Pass nd nd nd nd nd ndWQ-10 January 2008 1/9/2008 Compliance Pass nd Pass nd nd nd nd n/a ndWQ-10 February 2008 2/14/2008 Compliance Fail nd Pass Pass nd nd nd nd ndWQ-10 March 2008 3/15/2008 Compliance (FR) Fail Pass Pass nd nd Pass nd nd ndWQ-10 March 2008 3/15/2008 Compliance Fail Pass Pass nd nd Pass nd nd ndWQ-10 April 2008 4/14/2008 Compliance Pass nd Pass nd nd nd nd R ndWQ-10 May 2008 5/8/2008 Compliance Pass nd Pass nd nd nd nd nd ndWQ-10 June 2008 6/28/2008 Compliance Fail nd nd nd nd nd nd nd ndWQ-10 July 2008 7/24/2008 Compliance Pass nd Pass Pass nd nd nd nd ndWQ-10 October 2008 10/15/2008 Compliance Pass nd nd nd nd nd nd nd ndWQ-12 August 2006 II 8/29/2006 Reference Pass nd nd nd nd nd nd nd ndWQ-12 October 2006 10/17/2006 Reference Fail nd Fail nd nd nd nd nd ndWQ-12 December 2006 12/7/2006 Reference Fail nd nd nd nd nd nd nd ndWQ-12 February 2007 2/26/2007 Reference Pass nd nd nd nd nd nd nd ndWQ-12 April 2007 4/10/2007 Reference Pass nd Pass nd nd nd nd nd ndWQ-12 May 2007 5/14/2007 Reference Pass nd nd nd nd nd nd nd ndWQ-12 June 2007 6/4/2007 Reference (FR) Fail nd Pass nd nd nd nd nd ndWQ-12 June 2007 6/4/2007 Reference Fail nd Pass nd Fail nd nd nd PassWQ-12 July 2007 I 7/1/2007 Reference Pass nd Pass nd nd nd nd nd PassWQ-12 July 2007 II 7/24/2007 Reference Pass Pass nd nd nd Pass Pass nd ndWQ-12 August 2007 I 8/14/2007 Reference Pass Pass Pass nd nd Pass nd nd ndWQ-12 August 2007 II 8/27/2007 Reference Pass nd Pass nd nd Pass nd nd ndWQ-12 September 2007 I 9/11/2007 Reference Pass Pass Pass nd nd nd Pass nd ndWQ-12 September 2007 II 10/1/2007 Reference (FR) Fail nd Pass nd nd nd Pass nd ndWQ-12 September 2007 II 10/1/2007 Reference Fail nd Pass nd nd nd nd nd ndWQ-12 October 2007 10/17/2007 Reference Fail nd Pass Pass nd nd nd nd ndWQ-12 November 2007 11/13/2007 Reference Pass Pass Pass Pass nd Pass Pass nd ndWQ-12 December 2007 12/15/2007 Reference Fail nd Pass nd nd nd nd nd ndWQ-12 January 2008 1/9/2008 Reference Pass nd Pass nd nd nd nd n/a ndWQ-12 February 2008 2/14/2008 Reference Fail nd Pass Pass nd nd nd nd ndWQ-12 March 2008 3/15/2008 Reference Pass nd nd nd nd Pass nd nd ndWQ-12 April 2008 4/14/2008 Reference Pass nd Pass nd nd nd nd R ndWQ-12 May 2008 5/8/2008 Reference Pass nd nd nd nd Pass nd nd ndWQ-12 June 2008 6/28/2008 Reference Fail nd nd nd nd nd nd nd ndWQ-12 July 2008 7/24/2008 Reference Pass nd Pass nd nd nd nd nd nd

Niblack Exploration ProjectAnnual Report May 12, 2009
Integral Consulting Inc. Page 5 of 5
Table 3-8. ADEC Chronic Aquatic Life Criteria Screening Results - Surface Water
Aluminum Arsenic Copper Lead Mercury Nickel Selenium Silver ZincTotal Dissolved Dissolved Dissolved Dissolved Dissolved Dissolved Dissolved Dissolved
Station ID Date Sample PurposeSample Event
WQ-13 February 2007 2/26/2007 Reference Pass nd nd nd nd nd nd nd ndWQ-13 April 2007 4/10/2007 Reference (FR) Pass nd Pass nd nd nd nd nd PassWQ-13 April 2007 4/10/2007 Reference Pass nd Pass nd nd nd nd nd PassWQ-13 May 2007 5/14/2007 Reference Pass nd Pass nd nd nd nd nd PassWQ-13 June 2007 6/4/2007 Reference Pass nd Fail nd nd nd nd nd PassWQ-13 July 2007 I 7/1/2007 Reference (FR) Pass nd Pass nd nd nd nd nd PassWQ-13 July 2007 I 7/1/2007 Reference Pass nd Pass nd nd nd nd nd PassWQ-13 July 2007 II 7/24/2007 Reference Pass Pass Pass nd nd Pass Pass nd ndWQ-13 August 2007 I 8/14/2007 Reference Pass nd Pass nd nd Pass nd nd ndWQ-13 August 2007 II 8/27/2007 Reference (FR) Pass nd Pass nd nd Pass nd nd ndWQ-13 August 2007 II 8/27/2007 Reference Pass nd Pass nd nd Pass nd nd ndWQ-13 September 2007 I 9/11/2007 Reference Pass nd Pass nd nd nd nd nd ndWQ-13 September 2007 II 10/1/2007 Information Only Pass nd Pass nd nd nd nd nd ndWQ-13 October 2007 10/17/2007 Information Only Fail nd Pass Pass nd nd nd nd ndWQ-13 November 2007 11/13/2007 Information Only Pass nd Pass nd nd Pass nd nd ndWQ-13 December 2007 12/16/2007 Information Only Pass nd Pass nd nd nd nd nd PassWQ-13 January 2008 1/9/2008 Information Only (FR) Pass nd Pass nd nd nd nd n/a ndWQ-13 January 2008 1/9/2008 Information Only Fail nd Pass nd nd nd Pass n/a ndWQ-13 February 2008 2/14/2008 Information Only (FR) Pass nd Pass nd nd nd nd nd ndWQ-13 February 2008 2/14/2008 Information Only Pass nd Pass Pass nd nd nd nd ndWQ-13 March 2008 3/15/2008 Information Only Pass nd Pass nd nd Pass nd nd ndWQ-13 April 2008 4/14/2008 Information Only Pass nd Pass nd nd Pass nd R ndWQ-13 May 2008 5/8/2008 Information Only Pass nd Pass nd nd Pass nd nd ndWQ-13 June 2008 6/27/2008 Information Only (FR) Pass nd nd nd nd nd nd nd ndWQ-13 June 2008 6/27/2008 Information Only Pass nd nd nd nd nd nd nd ndWQ-13 July 2008 7/25/2008 Information Only (FR) Pass nd Pass nd nd nd nd nd ndWQ-13 July 2008 7/25/2008 Information Only Pass nd Pass Pass nd nd nd nd ndWQ-13 October 2008 10/15/2008 Information Only Pass nd nd nd nd nd nd nd nd
Count of Exceedances - All Data 48 0 17 1 1 0 0 0 1Count of Exceedances - Compliance Samples Only 19 0 1 0 0 0 0 0 0
Notes: Fail = Indicates that a detected sample concentration exceeds ADEC chronic aquatic life criterion.Pass = Indicates that a detected sample concentration is equal to or below ADEC chronic aquatic life criterion.nc = Sample not collectednd = Concentration below laboratory detection limit. Nondetect values were not screened against ADEC chronic aquatic life criteria.FR = Field Replicate

Niblack Exploration ProjectAnnual Report May 12, 2009
Integral Consulting Inc. Page 1 of 5
Table 3-9. ADEC Chronic Aquatic Life Criteria Screening Results - Groundwater
Aluminum Arsenic Copper Lead Mercury Nickel Selenium Silver ZincTotal Dissolved Dissolved Dissolved Dissolved Dissolved Dissolved Dissolved Dissolved
EFF-01 November 2007 11/13/2007 Information Only Fail Pass Pass nd nd Pass Pass nd ndEFF-01 December 2007 12/16/2007 Information Only Fail nd Pass nd nd Pass Pass nd ndEFF-01 January 2008 1/9/2008 Information Only Fail nd Pass nd nd nd Pass n/a ndEFF-01 February 2008 2/13/2008 Information Only Fail Pass Pass Pass nd Pass Pass nd ndEFF-01 March 2008 3/17/2008 Information Only Fail Pass Pass Pass nd Pass Pass nd ndEFF-01 April 2008 4/15/2008 Information Only (FR) Fail Pass Pass nd nd Pass Pass R ndEFF-01 April 2008 4/15/2008 Information Only Fail Pass Pass nd nd Pass Pass R ndEFF-01 May 2008 5/8/2008 Information Only Fail Pass Pass nd nd Pass Pass nd ndEFF-01 June 2008 6/27/2008 Information Only Fail Pass nd nd nd nd Pass nd ndEFF-01 July 2008 7/25/2008 Information Only Fail Pass Pass Pass nd Pass Pass nd ndEFF-01 August 2008 8/19/2008 Information Only Fail Pass Pass nd nd Pass nd nd ndEFF-01 September 2008 9/9/2008 Information Only (FR) Fail Pass Pass Pass nd Pass Pass nd ndEFF-01 September 2008 9/9/2008 Information Only Fail Pass Pass Pass nd Pass Pass nd ndEFF-01 October 2008 10/15/2008 Information Only Fail Pass Pass nd nd Pass Pass nd PassMW-01 February 2007 2/28/2007 Reference Fail Pass Pass Pass nd nd nd nd ndMW-01 April 2007 4/10/2007 Reference Fail Pass Pass Pass nd Pass nd nd PassMW-01 May 2007 5/14/2007 Reference Fail Pass Pass Pass nd Pass nd nd PassMW-01 June 2007 6/4/2007 Reference (FR) Fail Pass Pass Pass nd nd nd nd PassMW-01 June 2007 6/4/2007 Reference Fail Pass Pass Pass nd nd nd nd ndMW-01 July 2007 I 7/2/2007 Reference Fail Pass Pass Pass nd nd Pass nd ndMW-01 July 2007 II 7/24/2007 Reference Fail Pass Pass Pass nd Pass Pass nd ndMW-01 August 2007 I 8/14/2007 Reference (FR) nd Pass Pass Pass nd Pass nd nd ndMW-01 August 2007 I 8/14/2007 Reference Fail Pass Pass Pass nd Pass nd nd ndMW-01 August 2007 II 8/28/2007 Reference Fail Pass Pass Pass nd Pass nd nd ndMW-01 September 2007 I 9/11/2007 Reference Fail Pass Pass Pass nd Pass Pass nd ndMW-01 September 2007 II 9/30/2007 Compliance Fail Pass Pass Pass nd Pass Pass nd ndMW-01 October 2007 10/16/2007 Compliance (FR) Fail Pass Pass Pass nd Pass Pass nd ndMW-01 October 2007 10/16/2007 Compliance Fail Pass Pass Pass nd Pass Pass nd ndMW-01 November 2007 11/12/2007 Compliance Fail Pass Pass Pass nd Pass Pass nd ndMW-01 December 2007 12/14/2007 Compliance (FR) Fail nd Pass Pass nd Pass nd nd ndMW-01 December 2007 12/14/2007 Compliance Fail nd Pass Pass nd Pass nd nd ndMW-01 January 2008 1/92008 Compliance Fail nd Pass Pass nd Pass nd n/a ndMW-01 February 2008 2/14/2008 Compliance Fail nd Pass Pass nd Pass nd nd ndMW-01 March 2008 3/17/2008 Compliance Fail Pass Pass Pass nd Pass nd n/a ndMW-01 April 2008 4/15/2008 Compliance Fail nd Pass Pass nd Pass nd R ndMW-01 May 2008 5/7/2008 Compliance Fail nd Pass Pass nd Pass nd nd ndMW-01 June 2008 6/26/2008 Compliance Fail Pass nd Pass nd nd nd nd ndMW-01 July 2008 7/24/2008 Compliance (FR) Fail Pass Pass Pass nd Pass nd nd ndMW-01 July 2008 7/24/2008 Compliance Fail Pass Pass Pass nd Pass nd nd ndMW-01 August 2008 8/19/2008 Compliance Fail nd Fail Fail nd Pass nd nd ndMW-01 September 2008 9/9/2008 Compliance (FR) Fail Pass Pass Pass nd nd nd nd ndMW-01 September 2008 9/9/2008 Compliance Fail Pass Pass Pass nd nd nd nd ndMW-01 October 2008 10/15/2008 Compliance (FR) Fail nd Pass Pass nd nd nd nd nd
Station ID Date Sample PurposeSample Event
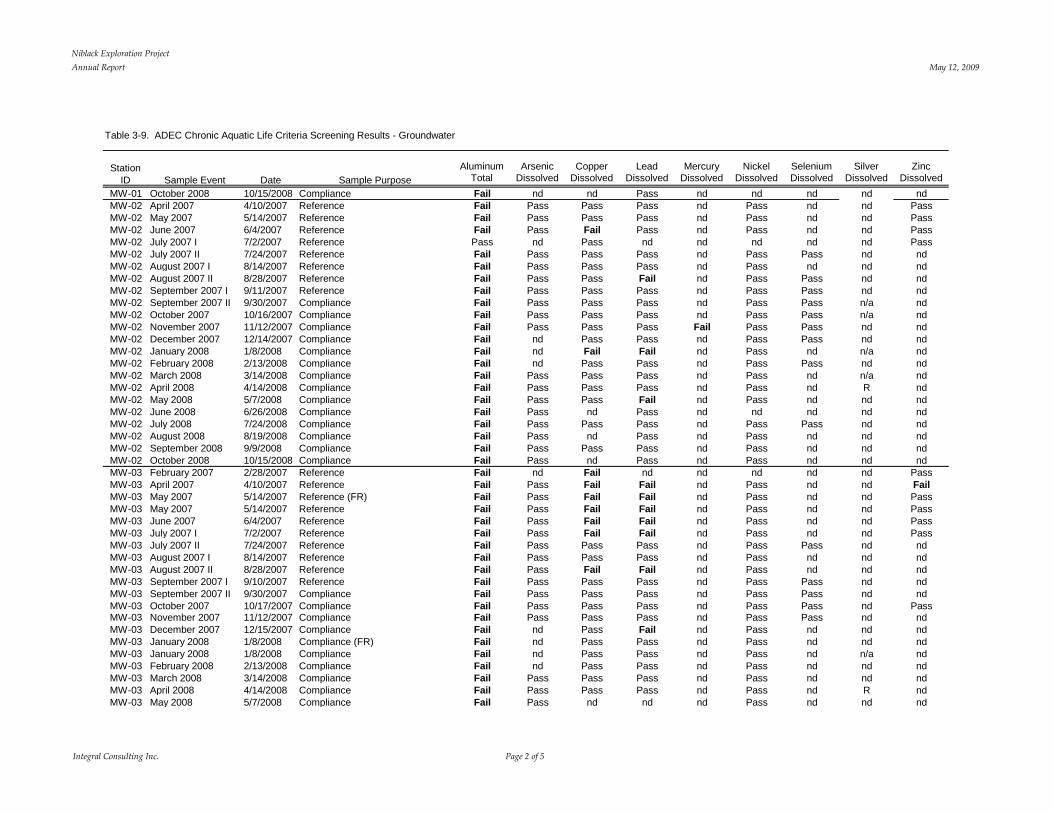
Niblack Exploration ProjectAnnual Report May 12, 2009
Integral Consulting Inc. Page 2 of 5
Table 3-9. ADEC Chronic Aquatic Life Criteria Screening Results - Groundwater
Aluminum Arsenic Copper Lead Mercury Nickel Selenium Silver ZincTotal Dissolved Dissolved Dissolved Dissolved Dissolved Dissolved Dissolved Dissolved
Station ID Date Sample PurposeSample Event
MW-01 October 2008 10/15/2008 Compliance Fail nd nd Pass nd nd nd nd ndMW-02 April 2007 4/10/2007 Reference Fail Pass Pass Pass nd Pass nd nd PassMW-02 May 2007 5/14/2007 Reference Fail Pass Pass Pass nd Pass nd nd PassMW-02 June 2007 6/4/2007 Reference Fail Pass Fail Pass nd Pass nd nd PassMW-02 July 2007 I 7/2/2007 Reference Pass nd Pass nd nd nd nd nd PassMW-02 July 2007 II 7/24/2007 Reference Fail Pass Pass Pass nd Pass Pass nd ndMW-02 August 2007 I 8/14/2007 Reference Fail Pass Pass Pass nd Pass nd nd ndMW-02 August 2007 II 8/28/2007 Reference Fail Pass Pass Fail nd Pass Pass nd ndMW-02 September 2007 I 9/11/2007 Reference Fail Pass Pass Pass nd Pass Pass nd ndMW-02 September 2007 II 9/30/2007 Compliance Fail Pass Pass Pass nd Pass Pass n/a ndMW-02 October 2007 10/16/2007 Compliance Fail Pass Pass Pass nd Pass Pass n/a ndMW-02 November 2007 11/12/2007 Compliance Fail Pass Pass Pass Fail Pass Pass nd ndMW-02 December 2007 12/14/2007 Compliance Fail nd Pass Pass nd Pass Pass nd ndMW-02 January 2008 1/8/2008 Compliance Fail nd Fail Fail nd Pass nd n/a ndMW-02 February 2008 2/13/2008 Compliance Fail nd Pass Pass nd Pass Pass nd ndMW-02 March 2008 3/14/2008 Compliance Fail Pass Pass Pass nd Pass nd n/a ndMW-02 April 2008 4/14/2008 Compliance Fail Pass Pass Pass nd Pass nd R ndMW-02 May 2008 5/7/2008 Compliance Fail Pass Pass Fail nd Pass nd nd ndMW-02 June 2008 6/26/2008 Compliance Fail Pass nd Pass nd nd nd nd ndMW-02 July 2008 7/24/2008 Compliance Fail Pass Pass Pass nd Pass Pass nd ndMW-02 August 2008 8/19/2008 Compliance Fail Pass nd Pass nd Pass nd nd ndMW-02 September 2008 9/9/2008 Compliance Fail Pass Pass Pass nd Pass nd nd ndMW-02 October 2008 10/15/2008 Compliance Fail Pass nd Pass nd Pass nd nd ndMW-03 February 2007 2/28/2007 Reference Fail nd Fail nd nd nd nd nd PassMW-03 April 2007 4/10/2007 Reference Fail Pass Fail Fail nd Pass nd nd FailMW-03 May 2007 5/14/2007 Reference (FR) Fail Pass Fail Fail nd Pass nd nd PassMW-03 May 2007 5/14/2007 Reference Fail Pass Fail Fail nd Pass nd nd PassMW-03 June 2007 6/4/2007 Reference Fail Pass Fail Fail nd Pass nd nd PassMW-03 July 2007 I 7/2/2007 Reference Fail Pass Fail Fail nd Pass nd nd PassMW-03 July 2007 II 7/24/2007 Reference Fail Pass Pass Pass nd Pass Pass nd ndMW-03 August 2007 I 8/14/2007 Reference Fail Pass Pass Pass nd Pass nd nd ndMW-03 August 2007 II 8/28/2007 Reference Fail Pass Fail Fail nd Pass nd nd ndMW-03 September 2007 I 9/10/2007 Reference Fail Pass Pass Pass nd Pass Pass nd ndMW-03 September 2007 II 9/30/2007 Compliance Fail Pass Pass Pass nd Pass Pass nd ndMW-03 October 2007 10/17/2007 Compliance Fail Pass Pass Pass nd Pass Pass nd PassMW-03 November 2007 11/12/2007 Compliance Fail Pass Pass Pass nd Pass Pass nd ndMW-03 December 2007 12/15/2007 Compliance Fail nd Pass Fail nd Pass nd nd ndMW-03 January 2008 1/8/2008 Compliance (FR) Fail nd Pass Pass nd Pass nd nd ndMW-03 January 2008 1/8/2008 Compliance Fail nd Pass Pass nd Pass nd n/a ndMW-03 February 2008 2/13/2008 Compliance Fail nd Pass Pass nd Pass nd nd ndMW-03 March 2008 3/14/2008 Compliance Fail Pass Pass Pass nd Pass nd nd ndMW-03 April 2008 4/14/2008 Compliance Fail Pass Pass Pass nd Pass nd R ndMW-03 May 2008 5/7/2008 Compliance Fail Pass nd nd nd Pass nd nd nd

Niblack Exploration ProjectAnnual Report May 12, 2009
Integral Consulting Inc. Page 3 of 5
Table 3-9. ADEC Chronic Aquatic Life Criteria Screening Results - Groundwater
Aluminum Arsenic Copper Lead Mercury Nickel Selenium Silver ZincTotal Dissolved Dissolved Dissolved Dissolved Dissolved Dissolved Dissolved Dissolved
Station ID Date Sample PurposeSample Event
MW-03 June 2008 6/27/2008 Compliance Fail Pass nd Pass nd nd nd nd ndMW-03 July 2008 7/24/2008 Compliance Fail Pass Pass Pass nd Pass Pass nd ndMW-03 August 2008 8/19/2008 Compliance Fail Pass Fail Pass nd Pass Pass nd ndMW-03 September 2008 9/9/2008 Compliance Fail Pass Pass Pass nd Pass Pass nd ndMW-03 October 2008 10/15/2008 Compliance Fail Pass Pass Pass nd Pass nd n/a ndMW-04 February 2007 2/27/2007 Reference (FR) Fail nd Fail nd nd nd nd nd PassMW-04 February 2007 2/27/2007 Reference Fail nd Fail nd nd Pass nd nd FailMW-04 April 2007 4/10/2007 Reference Fail nd Fail Fail nd Pass nd nd FailMW-04 May 2007 5/14/2007 Reference Fail Pass Fail Fail nd Pass nd nd PassMW-04 June 2007 6/4/2007 Reference Fail Pass Fail Fail nd Pass nd nd PassMW-04 July 2007 II 7/23/2007 Reference Fail Pass Fail Pass nd Pass Pass nd ndMW-04 August 2007 II 8/27/2007 Reference Fail Pass Fail Fail nd Pass nd nd ndMW-04 September 2007 I 9/10/2007 Reference Fail Pass Fail Fail nd Pass Pass nd ndMW-04 September 2007 II 9/30/2007 Compliance Fail Pass Fail Pass nd Pass Pass n/a ndMW-04 October 2007 10/16/2007 Compliance Fail Pass Fail Fail nd Pass Pass n/a PassMW-04 November 2007 11/12/2007 Compliance (FR) Fail Pass Pass Pass nd Pass Pass nd ndMW-04 November 2007 11/12/2007 Compliance Fail Pass Pass Pass nd Pass Pass nd ndMW-04 December 2007 12/15/2007 Compliance Fail nd Pass Fail nd Pass nd nd ndMW-04 January 2008 1/8/2008 Compliance Fail nd Pass Pass nd Pass nd n/a ndMW-04 February 2008 2/13/2008 Compliance Fail nd Pass Pass nd nd nd nd ndMW-04 March 2008 3/15/2008 Compliance Fail Pass Pass Pass nd Pass nd nd ndMW-04 April 2008 4/14/2008 Compliance Fail nd Pass Pass nd Pass nd R ndMW-04 May 2008 5/8/2008 Compliance (FR) Fail Pass Pass nd nd Pass nd nd ndMW-04 May 2008 5/8/2008 Compliance Fail Pass Pass nd nd Pass nd nd PassMW-04 June 2008 6/27/2008 Compliance Fail Pass Fail Pass nd nd nd nd ndMW-04 July 2008 7/24/2008 Compliance Fail Pass Pass Pass nd Pass Pass nd ndMW-04 August 2008 8/19/2008 Compliance (FR) Fail Pass Fail Fail nd Pass nd nd ndMW-04 August 2008 8/19/2008 Compliance Fail nd Fail Fail nd Pass nd nd ndMW-04 September 2008 9/9/2008 Compliance Fail Pass Fail Fail nd Pass nd nd PassMW-04 October 2008 10/15/2008 Compliance Fail Pass Pass Pass nd Pass nd nd ndMW-07 February 2007 2/28/2007 Reference Fail Pass Fail Fail nd nd nd nd PassMW-07 April 2007 4/10/2007 Reference (FR) Fail Pass Pass Pass nd Pass nd nd PassMW-07 April 2007 4/10/2007 Reference Fail Pass Pass Pass nd Pass nd nd PassMW-07 May 2007 5/15/2007 Reference Fail Pass Pass Fail nd Pass nd nd PassMW-07 June 2007 6/5/2007 Reference Fail Pass Pass Pass nd Pass nd nd PassMW-07 July 2007 I 7/1/2007 Reference Fail Pass Pass Pass nd Pass nd nd PassMW-07 July 2007 II 7/23/2007 Reference Fail Pass Pass Pass nd Pass Pass nd ndMW-07 August 2007 I 8/13/2007 Reference Fail Pass Pass Pass nd Pass nd nd ndMW-07 August 2007 II 8/28/2007 Reference Fail Pass Pass Pass nd Pass Pass nd ndMW-07 September 2007 I 9/10/2007 Reference (FR) Fail Pass Pass Pass nd nd Pass nd PassMW-07 September 2007 I 9/10/2007 Reference Fail Pass Pass Pass nd Pass Pass n/a ndMW-07 September 2007 II 9/30/2007 Reference Fail Pass Pass Pass nd Pass Pass nd ndMW-07 October 2007 10/16/2007 Reference Fail Pass Pass Pass nd Pass Pass nd nd

Niblack Exploration ProjectAnnual Report May 12, 2009
Integral Consulting Inc. Page 4 of 5
Table 3-9. ADEC Chronic Aquatic Life Criteria Screening Results - Groundwater
Aluminum Arsenic Copper Lead Mercury Nickel Selenium Silver ZincTotal Dissolved Dissolved Dissolved Dissolved Dissolved Dissolved Dissolved Dissolved
Station ID Date Sample PurposeSample Event
MW-07 November 2007 11/13/2007 Reference Fail Pass Pass Pass nd Pass Pass nd ndMW-07 December 2007 12/15/2007 Reference Fail nd Pass Pass nd Pass nd nd PassMW-07 January 2008 1/9/2008 Reference Fail nd Pass Pass nd Pass Pass n/a ndMW-07 February 2008 2/14/2008 Reference Fail nd Pass Pass nd Pass nd nd ndMW-07 March 2008 3/13/2008 Reference Fail Pass Pass Pass nd Pass nd nd ndMW-07 April 2008 4/13/2008 Reference (FR) Fail nd Pass Pass nd Pass nd R ndMW-07 April 2008 4/13/2008 Reference Fail nd Pass Pass nd Pass nd R ndMW-07 May 2008 5/6/2008 Reference Fail Pass nd Pass nd Pass nd nd ndMW-07 June 2008 6/26/2008 Reference (FR) Fail Pass nd Pass nd nd nd nd ndMW-07 June 2008 6/26/2008 Reference Fail Pass nd Pass nd nd nd nd ndMW-07 July 2008 7/25/2008 Reference Fail Pass Pass Pass nd nd nd nd ndMW-08 July 2007 I 7/2/2007 Reference - Information Only Fail Pass Pass nd nd Pass nd nd PassMW-08 July 2007 II 7/23/2007 Reference - Information Only (FR) Pass Pass Pass nd nd Pass Pass nd ndMW-08 July 2007 II 7/23/2007 Reference - Information Only Pass Pass Pass nd nd Pass Pass nd ndMW-08 August 2007 I 8/13/2007 Reference - Information Only Pass Pass Pass nd nd Pass nd nd ndMW-08 August 2007 II 8/28/2007 Reference - Information Only (FR) Pass nd Pass nd nd Pass nd nd ndMW-08 August 2007 II 8/28/2007 Reference - Information Only Pass nd Pass nd nd Pass nd nd ndMW-08 September 2007 I 9/10/2007 Reference - Information Only Pass Pass Pass nd nd nd Pass nd ndMW-08 September 2007 II 9/30/2007 Reference - Information Only (FR) Pass Pass Pass nd nd Pass Pass nd ndMW-08 September 2007 II 9/30/2007 Reference - Information Only Pass Pass Pass nd nd Pass Pass nd ndMW-08 October 2007 10/16/2007 Reference - Information Only Pass Pass Pass Pass nd Pass Pass nd ndMW-08 November 2007 11/12/2007 Reference - Information Only Pass Pass Pass Pass nd Pass Pass nd ndMW-08 December 2007 12/14/2007 Reference - Information Only nd nd Pass nd nd Pass Pass nd ndMW-08 January 2008 1/8/2008 Reference - Information Only Pass nd Pass nd nd nd nd nd ndMW-08 February 2008 2/13/2008 Reference - Information Only (FR) nd nd Pass Pass nd Pass Pass nd ndMW-08 February 2008 2/13/2008 Reference - Information Only nd nd Pass nd nd Pass Pass nd ndMW-08 March 2008 3/13/2008 Reference - Information Only Pass Pass Pass nd nd Pass Pass nd ndMW-08 April 2008 4/14/2008 Reference - Information Only Pass nd Pass nd nd Pass nd R ndMW-08 May 2008 5/6/2008 Reference - Information Only nd nd Pass nd nd Pass Pass nd ndMW-08 June 2008 6/26/2008 Reference - Information Only Pass nd nd nd nd nd Pass nd ndMW-09 July 2007 I 7/2/2007 Reference - Information Only (FR) Fail nd Pass nd nd nd nd nd ndMW-09 July 2007 I 7/2/2007 Reference - Information Only Fail nd Pass nd nd nd nd nd ndMW-09 July 2007 II 7/23/2007 Reference - Information Only Fail Pass Pass nd nd Pass Pass nd ndMW-09 August 2007 I 8/13/2007 Reference - Information Only Fail Pass Pass Pass nd Pass nd nd ndMW-09 August 2007 II 8/28/2007 Reference - Information Only Fail nd Pass nd nd Pass nd nd ndMW-09 September 2007 I 9/10/2007 Reference - Information Only Fail Pass Pass nd nd nd Pass nd ndMW-09 September 2007 II 9/30/2007 Reference - Information Only Fail Pass Pass nd nd Pass Pass nd ndMW-09 October 2007 10/16/2007 Reference - Information Only Fail Pass Pass Pass nd Pass Pass nd ndMW-09 November 2007 11/12/2007 Reference - Information Only Fail Pass Pass nd nd Pass Pass nd ndMW-09 December 2007 12/14/2007 Reference - Information Only Fail nd Pass nd nd Pass Pass nd ndMW-09 January 2008 1/8/2008 Reference - Information Only Fail nd Pass nd nd Pass nd nd ndMW-09 February 2008 2/13/2008 Reference - Information Only Pass nd Pass Pass nd Pass Pass nd ndMW-09 March 2008 3/13/2008 Reference - Information Only (FR) Fail nd Pass Pass nd Pass nd nd nd
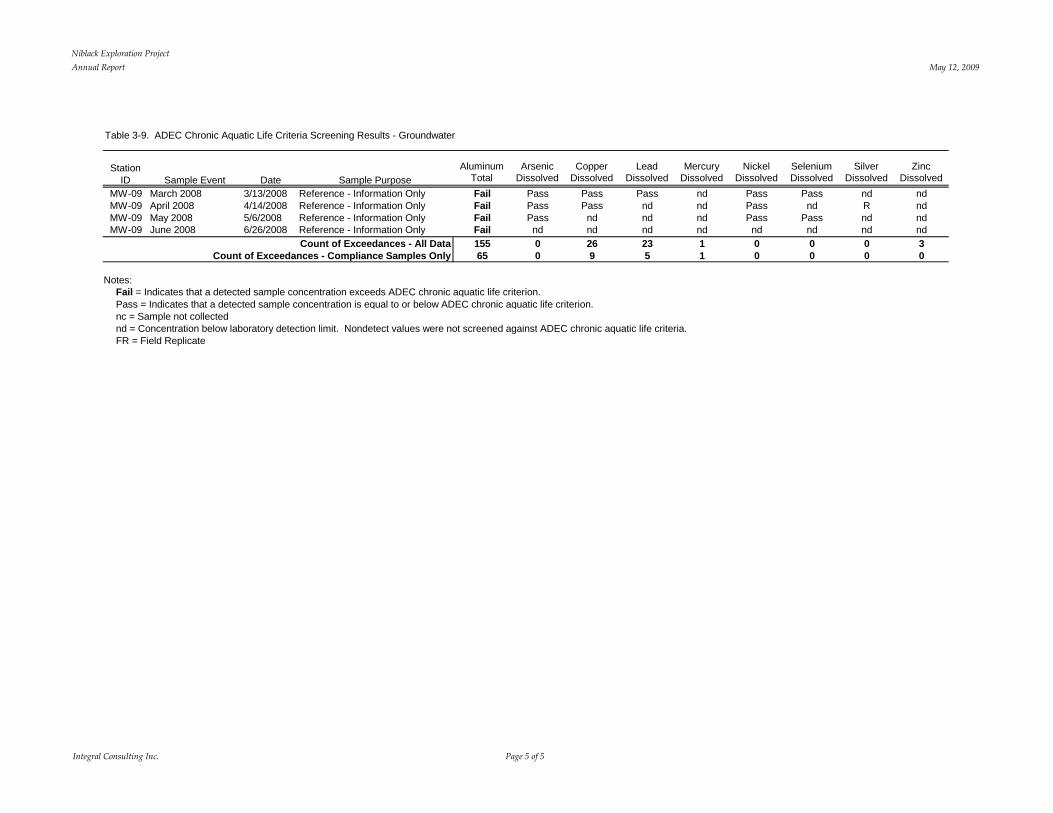
Niblack Exploration ProjectAnnual Report May 12, 2009
Integral Consulting Inc. Page 5 of 5
Table 3-9. ADEC Chronic Aquatic Life Criteria Screening Results - Groundwater
Aluminum Arsenic Copper Lead Mercury Nickel Selenium Silver ZincTotal Dissolved Dissolved Dissolved Dissolved Dissolved Dissolved Dissolved Dissolved
Station ID Date Sample PurposeSample Event
MW-09 March 2008 3/13/2008 Reference - Information Only Fail Pass Pass Pass nd Pass Pass nd ndMW-09 April 2008 4/14/2008 Reference - Information Only Fail Pass Pass nd nd Pass nd R ndMW-09 May 2008 5/6/2008 Reference - Information Only Fail Pass nd nd nd Pass Pass nd ndMW-09 June 2008 6/26/2008 Reference - Information Only Fail nd nd nd nd nd nd nd nd
Count of Exceedances - All Data 155 0 26 23 1 0 0 0 3Count of Exceedances - Compliance Samples Only 65 0 9 5 1 0 0 0 0
Notes: Fail = Indicates that a detected sample concentration exceeds ADEC chronic aquatic life criterion.Pass = Indicates that a detected sample concentration is equal to or below ADEC chronic aquatic life criterion.nc = Sample not collectednd = Concentration below laboratory detection limit. Nondetect values were not screened against ADEC chronic aquatic life criteria.FR = Field Replicate
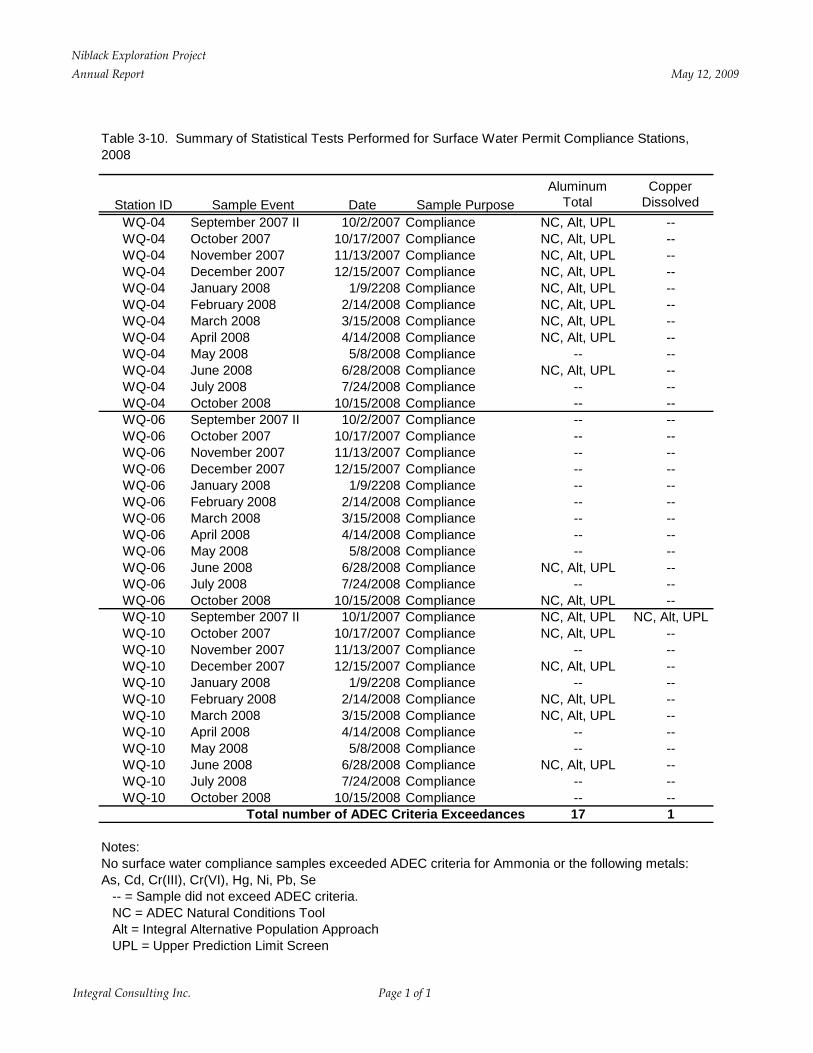
Niblack Exploration ProjectAnnual Report May 12, 2009
Integral Consulting Inc. Page 1 of 1
Aluminum CopperTotal Dissolved
WQ-04 September 2007 II 10/2/2007 Compliance NC, Alt, UPL --WQ-04 October 2007 10/17/2007 Compliance NC, Alt, UPL --WQ-04 November 2007 11/13/2007 Compliance NC, Alt, UPL --WQ-04 December 2007 12/15/2007 Compliance NC, Alt, UPL --WQ-04 January 2008 1/9/2208 Compliance NC, Alt, UPL --WQ-04 February 2008 2/14/2008 Compliance NC, Alt, UPL --WQ-04 March 2008 3/15/2008 Compliance NC, Alt, UPL --WQ-04 April 2008 4/14/2008 Compliance NC, Alt, UPL --WQ-04 May 2008 5/8/2008 Compliance -- --WQ-04 June 2008 6/28/2008 Compliance NC, Alt, UPL --WQ-04 July 2008 7/24/2008 Compliance -- --WQ-04 October 2008 10/15/2008 Compliance -- --WQ-06 September 2007 II 10/2/2007 Compliance -- --WQ-06 October 2007 10/17/2007 Compliance -- --WQ-06 November 2007 11/13/2007 Compliance -- --WQ-06 December 2007 12/15/2007 Compliance -- --WQ-06 January 2008 1/9/2208 Compliance -- --WQ-06 February 2008 2/14/2008 Compliance -- --WQ-06 March 2008 3/15/2008 Compliance -- --WQ-06 April 2008 4/14/2008 Compliance -- --WQ-06 May 2008 5/8/2008 Compliance -- --WQ-06 June 2008 6/28/2008 Compliance NC, Alt, UPL --WQ-06 July 2008 7/24/2008 Compliance -- --WQ-06 October 2008 10/15/2008 Compliance NC, Alt, UPL --WQ-10 September 2007 II 10/1/2007 Compliance NC, Alt, UPL NC, Alt, UPLWQ-10 October 2007 10/17/2007 Compliance NC, Alt, UPL --WQ-10 November 2007 11/13/2007 Compliance -- --WQ-10 December 2007 12/15/2007 Compliance NC, Alt, UPL --WQ-10 January 2008 1/9/2208 Compliance -- --WQ-10 February 2008 2/14/2008 Compliance NC, Alt, UPL --WQ-10 March 2008 3/15/2008 Compliance NC, Alt, UPL --WQ-10 April 2008 4/14/2008 Compliance -- --WQ-10 May 2008 5/8/2008 Compliance -- --WQ-10 June 2008 6/28/2008 Compliance NC, Alt, UPL --WQ-10 July 2008 7/24/2008 Compliance -- --WQ-10 October 2008 10/15/2008 Compliance -- --
Total number of ADEC Criteria Exceedances 17 1
Notes:
-- = Sample did not exceed ADEC criteria.NC = ADEC Natural Conditions ToolAlt = Integral Alternative Population ApproachUPL = Upper Prediction Limit Screen
No surface water compliance samples exceeded ADEC criteria for Ammonia or the following metals: As, Cd, Cr(III), Cr(VI), Hg, Ni, Pb, Se
Table 3-10. Summary of Statistical Tests Performed for Surface Water Permit Compliance Stations, 2008
Station ID Date Sample PurposeSample Event

Niblack Exploration ProjectAnnual Report May 12, 2009
Integral Consulting Inc. Page 1 of 3
Table 3-11. Summary of Statistical Tests Performed for Groundwater Permit Compliance Stations, 2008
Aluminum Copper Lead MercuryTotal Dissolved Dissolved Dissolved
EFF-01 November 2007 11/13/2007 Information Only NC, Alt, UPL -- -- --EFF-01 December 2007 12/16/2007 Information Only NC, Alt, UPL -- -- --EFF-01 January 2008 1/9/2008 Information Only NC, Alt, UPL -- -- --EFF-01 February 2008 2/13/2008 Information Only NC, Alt, UPL -- -- --EFF-01 March 2008 3/17/2008 Information Only NC, Alt, UPL -- -- --EFF-01 April 2008 4/15/2008 Information Only NC, Alt, UPL -- -- --EFF-01 May 2008 5/8/2008 Information Only NC, Alt, UPL -- -- --EFF-01 June 2008 6/27/2008 Information Only NC, Alt, UPL -- -- --EFF-01 July 2008 7/25/2008 Information Only NC, Alt, UPL -- -- --EFF-01 August 2008 8/19/2008 Information Only NC, Alt, UPL -- -- --EFF-01 September 2008 9/9/2008 Information Only NC, Alt, UPL -- -- --EFF-01 October 2008 10/15/2008 Information Only NC, Alt, UPL -- -- --MW-01 September 2007 II 9/30/2007 Compliance NC, Alt, UPL -- -- --MW-01 October 2007 10/16/2007 Compliance NC, Alt, UPL -- -- --MW-01 November 2007 11/12/2007 Compliance NC, Alt, UPL -- -- --MW-01 December 2007 12/14/2007 Compliance NC, Alt, UPL -- -- --MW-01 January 2008 1/92008 Compliance NC, Alt, UPL -- -- --MW-01 February 2008 2/14/2008 Compliance NC, Alt, UPL -- -- --MW-01 March 2008 3/17/2008 Compliance NC, Alt, UPL -- -- --MW-01 April 2008 4/15/2008 Compliance NC, Alt, UPL -- -- --MW-01 May 2008 5/7/2008 Compliance NC, Alt, UPL -- -- --MW-01 June 2008 6/26/2008 Compliance NC, Alt, UPL -- -- --MW-01 July 2008 7/24/2008 Compliance NC, Alt, UPL -- -- --MW-01 August 2008 8/19/2008 Compliance NC, Alt, UPL NC, Alt, UPL NC, Alt, UPL --MW-01 September 2008 9/9/2008 Compliance NC, Alt, UPL -- -- --MW-01 October 2008 10/15/2008 Compliance NC, Alt, UPL -- -- --MW-02 September 2007 II 9/30/2007 Compliance NC, Alt, UPL -- -- --MW-02 October 2007 10/16/2007 Compliance NC, Alt, UPL -- -- --MW-02 November 2007 11/12/2007 Compliance NC, Alt, UPL -- -- < 5 detectedMW-02 December 2007 12/14/2007 Compliance NC, Alt, UPL -- -- --MW-02 January 2008 1/8/2008 Compliance NC, Alt, UPL NC, Alt, UPL NC, Alt, UPL --
Station ID Date Sample PurposeSample Event
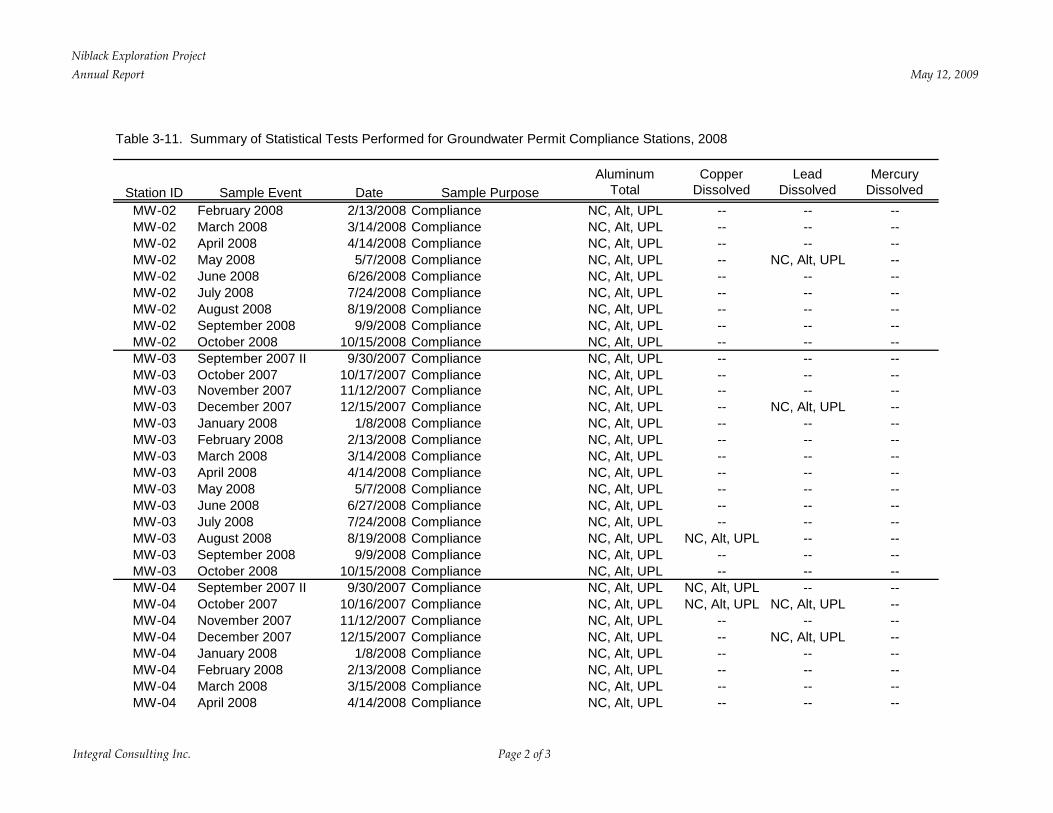
Niblack Exploration ProjectAnnual Report May 12, 2009
Integral Consulting Inc. Page 2 of 3
Table 3-11. Summary of Statistical Tests Performed for Groundwater Permit Compliance Stations, 2008
Aluminum Copper Lead MercuryTotal Dissolved Dissolved DissolvedStation ID Date Sample PurposeSample Event
MW-02 February 2008 2/13/2008 Compliance NC, Alt, UPL -- -- --MW-02 March 2008 3/14/2008 Compliance NC, Alt, UPL -- -- --MW-02 April 2008 4/14/2008 Compliance NC, Alt, UPL -- -- --MW-02 May 2008 5/7/2008 Compliance NC, Alt, UPL -- NC, Alt, UPL --MW-02 June 2008 6/26/2008 Compliance NC, Alt, UPL -- -- --MW-02 July 2008 7/24/2008 Compliance NC, Alt, UPL -- -- --MW-02 August 2008 8/19/2008 Compliance NC, Alt, UPL -- -- --MW-02 September 2008 9/9/2008 Compliance NC, Alt, UPL -- -- --MW-02 October 2008 10/15/2008 Compliance NC, Alt, UPL -- -- --MW-03 September 2007 II 9/30/2007 Compliance NC, Alt, UPL -- -- --MW-03 October 2007 10/17/2007 Compliance NC, Alt, UPL -- -- --MW-03 November 2007 11/12/2007 Compliance NC, Alt, UPL -- -- --MW-03 December 2007 12/15/2007 Compliance NC, Alt, UPL -- NC, Alt, UPL --MW-03 January 2008 1/8/2008 Compliance NC, Alt, UPL -- -- --MW-03 February 2008 2/13/2008 Compliance NC, Alt, UPL -- -- --MW-03 March 2008 3/14/2008 Compliance NC, Alt, UPL -- -- --MW-03 April 2008 4/14/2008 Compliance NC, Alt, UPL -- -- --MW-03 May 2008 5/7/2008 Compliance NC, Alt, UPL -- -- --MW-03 June 2008 6/27/2008 Compliance NC, Alt, UPL -- -- --MW-03 July 2008 7/24/2008 Compliance NC, Alt, UPL -- -- --MW-03 August 2008 8/19/2008 Compliance NC, Alt, UPL NC, Alt, UPL -- --MW-03 September 2008 9/9/2008 Compliance NC, Alt, UPL -- -- --MW-03 October 2008 10/15/2008 Compliance NC, Alt, UPL -- -- --MW-04 September 2007 II 9/30/2007 Compliance NC, Alt, UPL NC, Alt, UPL -- --MW-04 October 2007 10/16/2007 Compliance NC, Alt, UPL NC, Alt, UPL NC, Alt, UPL --MW-04 November 2007 11/12/2007 Compliance NC, Alt, UPL -- -- --MW-04 December 2007 12/15/2007 Compliance NC, Alt, UPL -- NC, Alt, UPL --MW-04 January 2008 1/8/2008 Compliance NC, Alt, UPL -- -- --MW-04 February 2008 2/13/2008 Compliance NC, Alt, UPL -- -- --MW-04 March 2008 3/15/2008 Compliance NC, Alt, UPL -- -- --MW-04 April 2008 4/14/2008 Compliance NC, Alt, UPL -- -- --

Niblack Exploration ProjectAnnual Report May 12, 2009
Integral Consulting Inc. Page 3 of 3
Table 3-11. Summary of Statistical Tests Performed for Groundwater Permit Compliance Stations, 2008
Aluminum Copper Lead MercuryTotal Dissolved Dissolved DissolvedStation ID Date Sample PurposeSample Event
MW-04 May 2008 5/8/2008 Compliance NC, Alt, UPL -- -- --MW-04 June 2008 6/27/2008 Compliance NC, Alt, UPL NC, Alt, UPL -- --MW-04 July 2008 7/24/2008 Compliance NC, Alt, UPL -- -- --MW-04 August 2008 8/19/2008 Compliance NC, Alt, UPL NC, Alt, UPL NC, Alt, UPL --MW-04 September 2008 9/9/2008 Compliance NC, Alt, UPL NC, Alt, UPL NC, Alt, UPL --MW-04 October 2008 10/15/2008 Compliance NC, Alt, UPL -- -- --
Total number of ADEC Criteria Exceedances 68 8 8 1
Notes: No groundwater compliance samples exceeded ADEC criteria for Ammonia or the following metals: As, Cd, Cr(III), Cr(VI), Ni, Se-- = Sample did not exceed ADEC criteria.NC = ADEC Natural Conditions ToolAlt = Integral Alternative Population ApproachUPL = Upper Prediction Limit Screen< 5 detected = Fewer than five referece values detected; cannot run statistical screening tests.