kentucky professional engineers in mining seminar …miningusa.com/pem/ppt/cobb.pdfmining seminar...
TRANSCRIPT

NRC Study:Coal Research and Development to Coal Research and Development to
Support National Energy PolicySupport National Energy Policy
Kentucky Professional Engineers in Mining Seminar
KentuckyGeological SurveyU NIVER SITY O F KENTUC KY
Coal Research and Development to Coal Research and Development to Support National Energy PolicySupport National Energy Policy
Dr. James C. CobbState Geologist and Director


Purpose of the reportThis report focused on the “upstream” side of the coa l industry including: coal reserves, miner health and safety, environmental protection and CO2 management, and mine productivity and optimizing resources.
By 2030 coal production will increase 60 to 70%.
US has more than adequate reserves to accommodate this increase.
Approximately 90 percent of federal R & D goes for “downstream” activities while only 10 percent goes fo r “upstream” activities in the coal cycle.
Source: NRC 2007
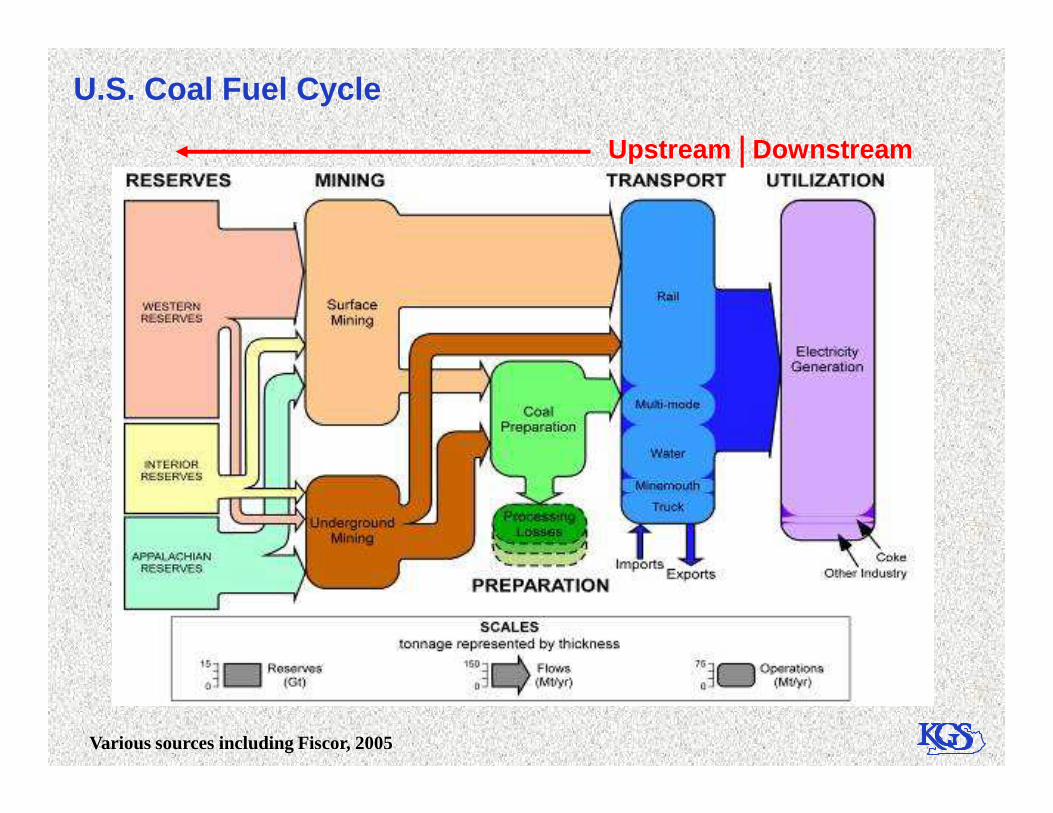
U.S. Coal Fuel Cycle
Upstream Downstream
Various sources including Fiscor, 2005

80%
60%
82%
“Downstream” “Upstream”
Distribution of Federal Funding forCoal-Related R & D
40%
20%
0Utilization& CCS
Transport &Transmission
Safety &Health
ReserveAssessment
Environment/Reclamation
Mining &Processing
0.2%1.8%1.9%4.5%
9%
NRC 2007
“Coal will continue to provide a substantial portion of U.S. energy for at least the next severa l decades, a major increase in federal support for coal R & D is needed to ensure that this natural resource is extracted efficiently, safely, and in a n environmentally responsible manner,” says a new congressionally mandated report from the National Research Council. National Research Council.
“Policymakers also need a more accurate assessment of the extent and location of the nation's coal reserves, the report adds.” It recommends an increase of about $144 million annually in new federal funding across a variety of areas.
Source: NRC 2007

•No new mega-agency like Bureau of Mines
•Greatly improved coordination among federal agencies
•Increase research for federal agencies such as:
OSM
NIOSHNIOSH
MSHA
USGS
Others

Findings and Priority Areas-Research Leading to improvements in:
•Mining workforce and education •Assessments of coal reserves•Improvements in coal mining and
processing•Improvements in worker health and
safety•Improvements in environmental
protection

• Carbon dioxide emissions associated with global climate change pose the greatest constraint on future coal utilization.
• Large-scale demonstrations of carbon management technologies —carbon management technologies —especially carbon capture and sequestration (CCS)—are needed to prove the commercial readiness of technologies.
35
30
25
20
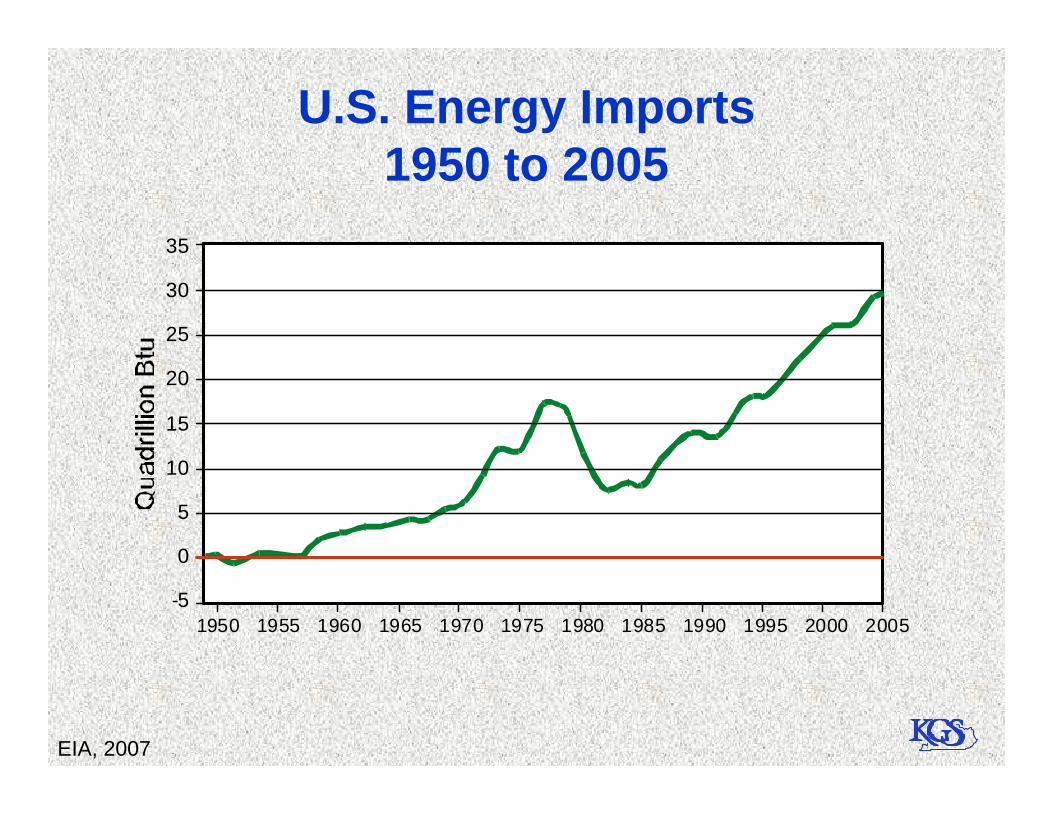
U.S. Energy Imports1950 to 2005
15
10
5
0
-51950 1955 1960 1965 1970 1975 1980 1985 1990 1995 2000 2005
EIA, 2007
35
30
25
20
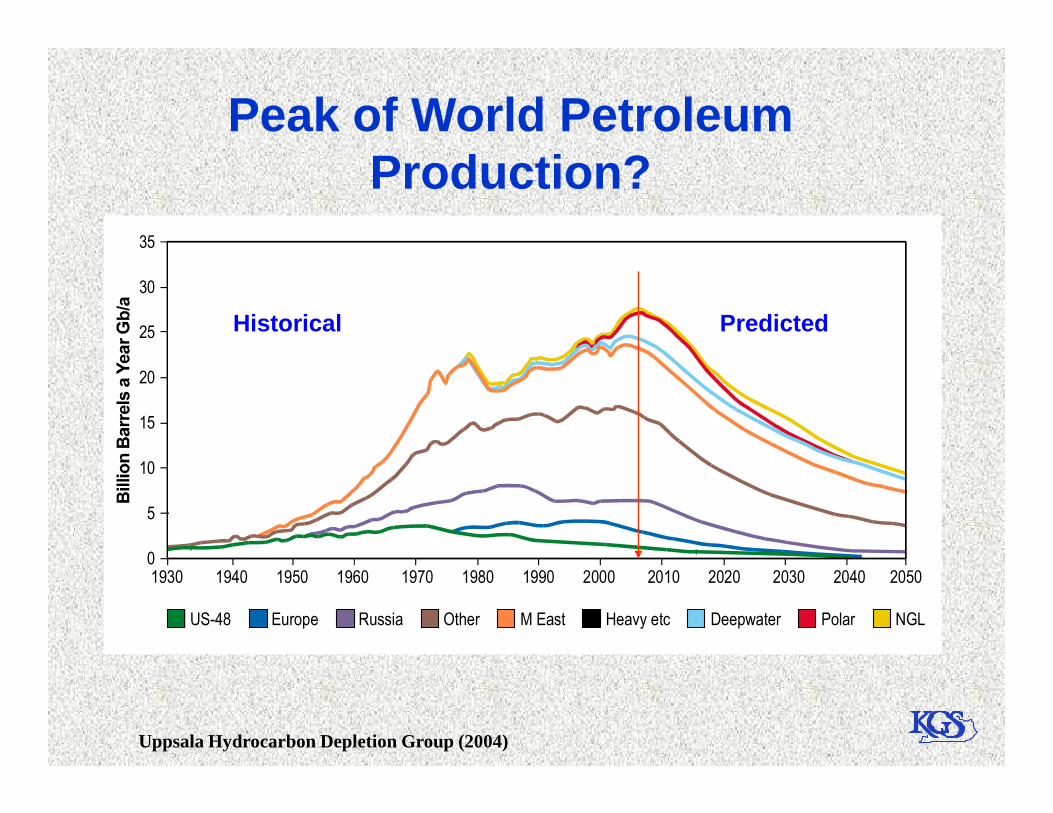
Historical Predicted
Peak of World Petroleum Production?
15
10
5
01930 1940 1950 1960 1970 1980 1990 2000 2010 2020 2030 2040 2050
US-48 Europe Russia Other M East Heavy etc Deepwater Polar NGL
Uppsala Hydrocarbon Depletion Group (2004)

Source: The American Magazine, 2007
Platts and American Magazine

The PastThe Past

10.00
9.00
8.00
7.00
6.00
5.00
4.00
3.00
2.00
1.00
0
1950 1955 1960 1965 1970 1975 1980 1985 1990 1995 2000 2005
Year
Crude Oil
CoalNatural Gas
Prices for fossilfuels
800
600
400
200
0
1950 1960 1970 1980 1990 2000
East of the Mississippi
West of the Mississippi
Domestic Coal Production in U.S.1950-2005
Source: EIA 2006
Year800
700
600
500
400
300
200
100
0
1950 1960 1970 1980 1990 2000
Year
Surface
Underground
Surface and UndergroundCoal Production

5,000
4,500
4,000
3,500
3,000
200,000
180,000
160,000
140,000
120,000
Number of Mines
Production (millions of short tons)
Number of Miners
Trends for U.S. Coal Production,Mines, and Employment
Source: NMA 2006
3,000
2,500
2,000
1,500
1,000
500
0
1970 1975 1980 1985 1990 1995 2000 2005 2010
120,000
100,000
80,000
60,000
40,000
20,000
0

The PresentThe Present

25
20
15
23
19
Sources of U.S. Electrical Energy
15
10
5
0
Coal NaturalGas
Crude Oil1NuclearElectricPower
Biomass2
Hydro-electricPower
3
NGPL4
Geothermal,Solar, Wind
19
11
8
3 3 2 1
Source: EIA 2006 and American Magazine, 2007


Recoverable Reserves at Active Mines (RRAM) 18.9 billion tons
Estimated Recoverable Reserves (ERR) 267.6 billion tons
U.S. Coal Resources and Reserves
Source: EIA (2006)
Demonstrated Reserve Base (DRB) 492.9 billion tons
Identified Resources (from Averitt, 1974) 1700.0 billion tons
Total Resources ( above plus undiscovered resources) 4000.0 billion tons
EIA and NRC 2007

The FutureThe FutureCarbon Capture and Carbon Capture and Carbon Capture and Carbon Capture and
Storage (CCS)Storage (CCS)

2007 Special Session on Energy- $5 million for KGS to investigate CO 2 sequestration, EOR
and EGR in Kentucky.
Illinois BasinIllinois Basin Appalachian Appalachian BasinBasin
Cincinnati Cincinnati ArchArchMississippi Mississippi
RiverRiver
Two major basinsTwo major basinsseparated by an arch.separated by an arch.
WestWest EastEastTabb Fault Tabb Fault
SystemSystemLexington Lexington
Fault SystemFault SystemRough Creek Rough Creek Fault SystemFault System
Kentucky River Kentucky River Fault SystemFault System

Public Opinion of Global Warming
• Generally exaggerated………….. 33%• Generally correct…………………. 29%• Generally underestimated……….. 35%
Gallup Poll Mar. 2007

Cobb, 2006

Methods for storing CO2 in deep underground geological formations
SRCCS Figure TS-7

40
30
20
Non-OECDOECD
Growth2000–2030
Average Growth/Yr.2000–2030
1.6%
2.6%
The Source of Future CO 2 Emissions
Non-OECD
OECD
OECD is the Organization for Economic Cooperation andDevelopment. There are 30 member-countries: U.S.A.,Canada, Austraila, New Zealand, and nearly all of Europe.
1980 1990 2000 2010 2020 2030
10
0
0.6%
ExxonMobil Energy Outlook 2006 and American Magazine

250
200
Ethanol(conventional)
Hybrids
Least Expensive Methods to Cut CO2 Emissions
150
100
50
0
GasNuclear
IGCC-CCSWind
Ethanol(cellulose)
Source: SFA Pacific, JEC Study, American Magazine, 2007


American Public Opinion PollTop Concerns of Americans in 2007:
The war in Iraq .................…………………….35%
Healthcare ………………………….………15%
Job creation ………………………….....15%
Terrorism …………………………….13%
Source: NBC/Wall Street Journal Poll 2007 and American Magazine, 2007
Terrorism …………………………….13%
Illegal immigration …………...8%
Reducing the deficit ……..5%
Environment ………...3%
Energy/cost of gas .2%

Public Opinion on the Environment
Source: Gallup/USA Today and American Magazine, 2007
7%Active
EnvironmentalistSympathetic,but not active
Neutral Unsympathetictoward issue
14% 48% 29%

Thank You!Thank You!


30
25
20
15
10
5
0
2020 US Coal Production
Coal Use for Projected Emissions Scenarios
2020
Source: EIA 2006
CasesA
40
35
30
25
20
15
10
5
0
2020 US Coal Production
CasesB
2030

1,250
1,200
1,150
1,100
1,050
1,000
950
900
850
800
1985 1990 1995 2000 2005
A
Coal Production Forecasts 1982–1989
ActualAEO 1982AEO 1983AEO 1984AEO 1985AEO 1986AEO 1987AEO 1989Trendline1,250
1,200
1,150
Coal Production Forecasts 1990–1995
Predicting Future Coal Production
1982 to 1989
1990 to 1995
Source: EIA 2007
1,250
1,200
1,150
1,100
1,050
1,000
950
900
850
800
1985 1990 1995 2000 2005
C
ActualAEO 1996AEO 1997AEO 1998AEO 1999AEO 2000AEO 2001AEO 2002AEO 2003AEO 2004Trendline
Coal Production Forecasts 1996–2004
1,100
1,050
1,000
950
900
850
800
1985 1990 1995 2000 2005
B
ActualAEO 1990AEO 1991AEO 1992AEO 1993AEO 1994AEO 1995Trendline
1990 to 1995
1996 to 2004

1200
1000
800
600
400
200
0
1950 1960 1970 1980 1990 2000
Year
45
40
35
30
25
20
15
10
5
0
1950 1960 1970 1980 1990 2000
Year
Petroleum
Hydroelectric Power
Biomass
Nuclear Electric Power
Coal
Natural Gas
U.S. Energy Consumption
Coal Production
35
Source: EIA 2006
35
30
25
20
15
1950 1960 1970 1980 1990 2000
Year
Coal as a Percentage ofU.S. Energy Consumption
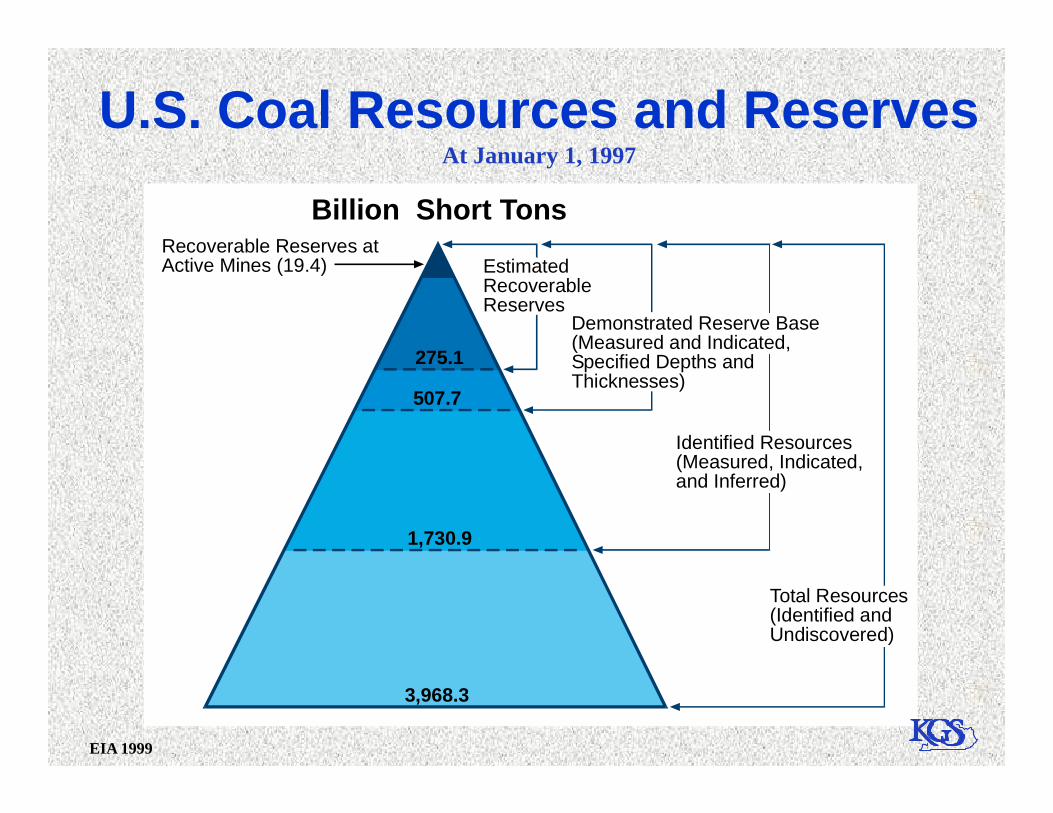
Billion Short Tons
EstimatedRecoverableReserves
Demonstrated Reserve Base(Measured and Indicated,Specified Depths andThicknesses)
Recoverable Reserves atActive Mines (19.4)
275.1
507.7
U.S. Coal Resources and ReservesAt January 1, 1997
Identified Resources(Measured, Indicated,and Inferred)
Total Resources(Identified andUndiscovered)
507.7
1,730.9
3,968.3
EIA 1999