kentucky transportation center
TRANSCRIPT
Audit Template for Inland Port Sustainability
Research ReportKTC -14-11/MTIC1-14-1F
KentuckyTransportation
Center
Our MissionWe provide services to the transportation community through research,
technology transfer and education. We create and participate in partnerships to promote safe and effective transportation systems.
Kentucky Transportation Center176 Oliver H. Raymond Building
Lexington, KY 40506-0281(859) 257-4513
fax (859) 257-1815
www.ktc.uky.edu
© 2014 University of Kentucky, Kentucky Transportation CenterInformation may not be used, reproduced, or republished without our written consent.
Audit Template for Inland Port Sustainability
Prepared for:
11/21/2014
Multimodal Transportation & Infrastructure Consortium by the Kentucky Transportation Center

This Page Left Intentionally Blank.
Authors:
Principal Investigator:
Researcher(s):
Multimodal Transportation and Infrastructure Consortium P.O. Box 5425
Huntington, WV 25703-0425
Phone: (304) 696-2313 • Fax: (304) 696-6088
Audit Template for Inland Port Sustainability
Doug Kreis, PE, MBA, PMP
Sarah McCormack, MSc, CTL Research Engineer
Christopher Van Dyke, MA
Research Analyst
Bryan Gibson, PhD Research Associate
Disclaimer:
The contents of this report reflect the views of the authors, who are responsible for the facts and the accuracy of the information presented herein. This document is disseminated under
the sponsorship of the U.S. Department of Transportation’s University Transportation Centers Program, in the interest of information exchange. The U.S. Government assumes no
liability for the contents or use thereof.

This page left intentionally blank.
1
Table of Contents
ABSTRACT……………………………………………………………………………………………………………………………………………4
ACKNOWLEDGEMENTS ………………………………………………………………………………………………………………………5
LIST OF FIGURES………………………………………………………………………………………………………………………………….7
LIST OF TABLES……………………………………………………………………………………………………………………………………8
EXECUTIVE SUMMARY………………………………………………………………………………………………………………………10
CHAPTER 1:
INTRODUCTION………………………………………………………………………………………………………………………………….....16
CHAPTER 2:
UNDERSTANDING SUSTAINABILITY………………………………………………………………………………………………………..20
Defining Sustainability………………………………………………………………………………………………………………………20 Sustainable Business…………………………………………………………………………………………………………………………21
CHAPTER 3:
UNDERSTANDING PORT SUSTAINABILITY………………………………………………………………………………………………24
Sustainable Ports………………………………………………………………………………………………………………………………24
Target Areas for Port Sustainability…………………………………………………………………………………………………..29
Sustainable Policies…………………………………………………………………………………………………………………………..30 Operational Sustainability………………………………………………………………………………………………………………..38
Sustainable Infrastructure………………………………………………………………………………………………………………..47 Energy Efficiency as Sustainability…………………………………………………….………………………………………………52 Environmental Sustainability……………………………………………..……..……………………………………………………..54 Safety & Security as Sustainability Initiatives…………………………………………………………………………………….58 Efficiency as Sustainability ……………………………………………………………………………………………………………….61
CHAPTER 4:
2012 SITE VISITS ‐ FOCUSING ON TANGIBLE TARGETS & VIEWING SUSTAINBILITY AS ECONOMIC INVESTMENTS…………………………………………………………………………………………………………………………..65
CHAPTER 5:
2013 SITE VISITS – LESSONS LEARNED: FOCUSING ON THE ECONOMIC BOTTOM LINE, WORKING
DIRECTLY WITH INLAND PORT OPERATORS, AND CREATING A PRACTICAL TOOL………………….…..72
CHAPTER 6:
A NEW TARGET ‐ SUPPLY CHAIN SUSTAINABILITY…………………………….……………………………………………………78
CHAPTER 7:
MEASURABLE SUSTAINABILITY CHARACTERISTICS – BACKGROUND CONSIDERATIONS FOR AN AUDIT TEMPLATE OF INLAND PORT SUSTAINABILITY ………………………………………………………………………..83
Regional Sustainability Templates……………………………………………………………………………………………………84
2
General Sustainability Templates……………………………………………………………………………………………………..85
Kentucky Transportation Center’s Audit Template for Inland Port Sustainability……………………………..86
Template Design Challenges Identified by Site Visits with Stakeholders…………………………………………..88
CHAPTER 8:
KTC INLAND PORT SUSTAINABILITY AUDIT TEMPLATE & SELF‐ASSESSMENT TOOL……………………………….90
Sustainability Accounting………………………………………………………………………………………………………………….91
EPA Port Management and ISO Standards………………………………………………………………………………………..95
Creating the Audit Template……………………………………………………...…………………………………………………….99
A Version History of Audit Template Development ………………………………………………………………………..106
Future Directions .………………………………………………………………………………………………………………………….109
The Template (Version 3) ……………………………………………………………………………………………………………….112
Discussion ……………………………………………………………………………………………………………………………………...121
CHAPTER 9:
ADDENDUM: THE EXPANSION OF THE PANAMA CANAL, STRATEGIC IMPORTANCE OF U.S. INLAND WATERWAYS, & SPECIFIC CHALLEGES FOR KY PORTS …………………………………………………………….124
Moving from a Coastal to an Inland Perspective …………………………………………………………………………….124
The Sustainable and Strategic Value of the U.S. Inland Waterway System ……………………….…………..125
The Impact of the Expansion of the Panama Canal ………………………………………………………………………..128
Specific Challenges to Implementation of Port Sustainability in Kentucky ……………………………………..131
APPENDIX A: TECHNICAL MEMO ON AMERICAN COASTAL & INLAND PORT SITE VISITS 2012 ………………………………..135
Executive Summary ……………………………………………………………………………………………………………………….136 Acknowledgements ……………………………………………………………………………………………………………………….138 Port Visits
Port of Norfolk – Norfolk, Virginia………………………………………………………………………………………….139 Port of Savannah – Savannah, Georgia…………………………………………………………………………………..148 Port of Charleston – Charleston, South Carolina ……………………………………………………………………158 Concluding Thoughts – Norfolk, Savannah, Charleston ……………………………………………………….…169 Port of New Orleans – New Orleans, Louisiana ………………………………………………………………………170 Port of Houston – Houston, Texas ………………………………………………………………………………………….178 Port of Mobile – Mobile, Alabama ………………………………………………………………………………………….182 Concluding Thoughts – New Orleans, Houston, Mobile ………………………………………………………….186 Port of Paducah – Paducah, Kentucky …………………………………………………………………………………….188 Port of Memphis – Memphis, Tennessee ……………………………………………………………………………….191 Concluding Thoughts – Paducah, Memphis …………………………………………………………………………….197 Port of Cincinnati –Cincinnati, Ohio ………………………………………………………………………………………..198 Port of Louisville – Louisville, Kentucky ………………………………………………………………………………….201 Port of St. Louis – St. Louis, Missouri ………………………………………………………………………………………204 Concluding Thoughts Louisville, St. Louis ……………………………………………………………………………….206 Discussion – Transferable Initiatives for Inland Ports ……………………………………………………………..207
3
APPENDIX B:
TECHNICAL MEMO ON SECOND ROUND OF INLAND PORT SITE VISITS 2013 ………………………………………213
Acknowledgements ………………………………………………………………………………………………………………………213 Executive Summary ………………………………………………………………………………………………………………………214 Port Visits
Port of Paducah ………………………………………………………………………………………………..………………217 Owensboro Riverport ……………………………………………………………………………………………………….219 Henderson County Riverport Authority ……….………………………………………………………….……….222 Louisville – Jefferson County Riverport International ……………............................................224 Greenup‐Boyd County Riverport Authority ……………………………………………………………………….226 Columbiana County Port Authority ……………………………………………………………………………………229 Weirton Area Port Authority ……………………………………………………………………………………………..232 Eddyville Riverport Authority …………………………………………………………………………………………….235 Hickman‐Fulton County Riverport Authority ……………………………………………………………………..238 Port of Greater Cincinnati Development Authority …………………………………………………………..241
APPENDIX C:
PROMOTIONAL BROCHURE FOR INLAND PORT SUSTAINABILITY PROJECT ...........................................244
APPENDIX D:
KTC INLAND PORT SUSTAINABILITY SELF‐ASSESSMENT TEMPLATE VERSION HISTORY (V1, V2, V3) …….247
APPENDIX E:
PORT TERMINOLOGY ………………………………………………………………………………………………………………………….266
APPENDIX F:
LISTING OF SUSTAINABILITY INITIATIVES ……………………………………………………………………………………………274
WORKS CITED…………………………………………………………………………………………………………………………………280
4
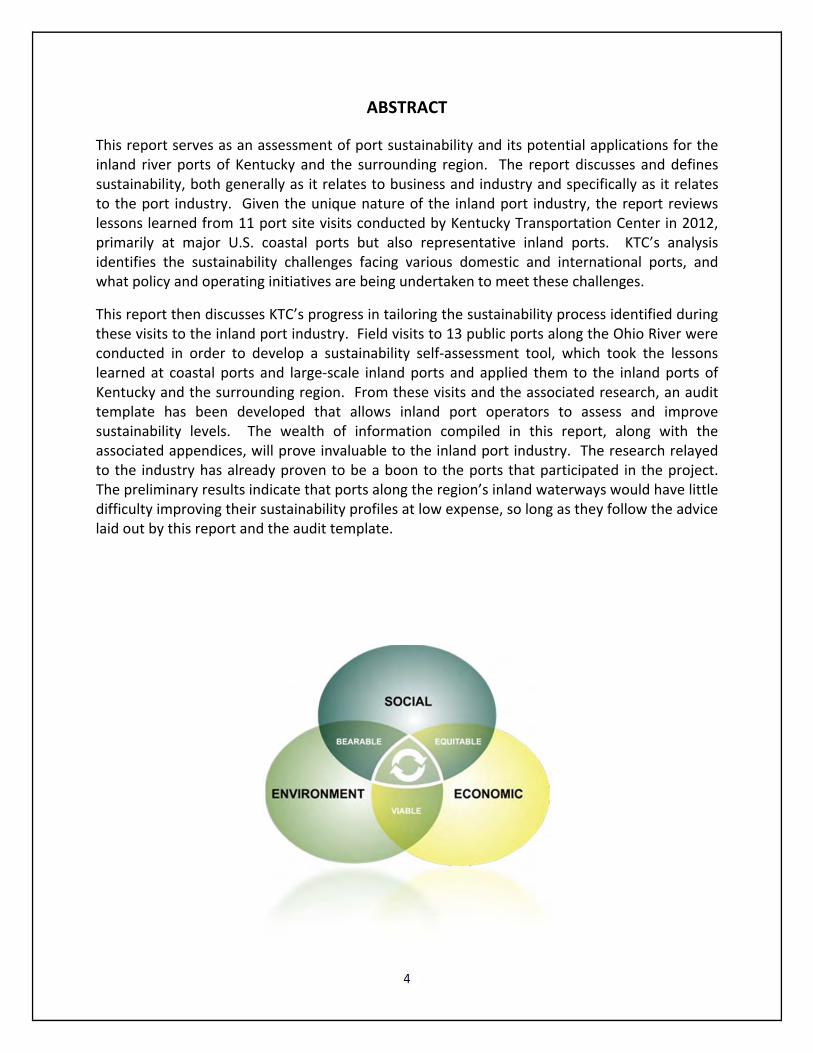
ABSTRACT
This report serves as an assessment of port sustainability and its potential applications for the inland river ports of Kentucky and the surrounding region. The report discusses and defines sustainability, both generally as it relates to business and industry and specifically as it relates to the port industry. Given the unique nature of the inland port industry, the report reviews lessons learned from 11 port site visits conducted by Kentucky Transportation Center in 2012, primarily at major U.S. coastal ports but also representative inland ports. KTC’s analysis identifies the sustainability challenges facing various domestic and international ports, and what policy and operating initiatives are being undertaken to meet these challenges.
This report then discusses KTC’s progress in tailoring the sustainability process identified during these visits to the inland port industry. Field visits to 13 public ports along the Ohio River were conducted in order to develop a sustainability self‐assessment tool, which took the lessons learned at coastal ports and large‐scale inland ports and applied them to the inland ports of Kentucky and the surrounding region. From these visits and the associated research, an audit template has been developed that allows inland port operators to assess and improve sustainability levels. The wealth of information compiled in this report, along with the associated appendices, will prove invaluable to the inland port industry. The research relayed to the industry has already proven to be a boon to the ports that participated in the project. The preliminary results indicate that ports along the region’s inland waterways would have little difficulty improving their sustainability profiles at low expense, so long as they follow the advice laid out by this report and the audit template.
5
Acknowledgements
The Kentucky Transportation Center would like to thank the following people for their significant contributions to the research that went into this report.
Lee Beckman Director of External Affairs, Georgia Port Authority
Ken Canter Port Director, Paducah‐McCraken County Port Authority
Greg Cantrell Vice President, Corporate Development, Port of Louisville
Steve Connor Vice President of Risk Management, South Carolina Port Authority
Greg Curlin Hickman Riverport Authority
BJ Deflice Port Director, Weirton Area Port Authority
Chris Donner Real Estate Development Manager, Port of New Orleans
Patrick Donovan Marshall University
Tracy Drake President, Columbiana County Port Authority
Catherine Dunn Deputy Director of Port Development, Port of New Orleans
Greg Edwards Director of External Affairs, Virginia Port Authority
Jay Hunt Port Director, Eddyville Riverport
Steven Little CEO, Crounse Corporation
MJ Johnson Operator, Weirton Area Port Authority
Janine Moreau Mansour Director of External Affairs, Port of New Orleans
Larry McFall Port Director, Port of Louisville
Barbara Melvin Senior Vice President of External Affairs, South Carolina Port Authority
Greg Menke Seamen’s Church Institute
Patrick Moore Manager of Environmental Stewardship, South Carolina Port Authority
Ed O’Callaghan President Local Operations, Evans Delivery Company
Craig Philip CEO, Ingram Barge
Greg Pritchett Port Director, Henderson County Riverport
6
Lindy Rinaldi Chief of Port Police, South Carolina Port Authority
Ed Riney Port Director, Owensboro Riverport Authority
Alison Skipper Director of Public Relations, South Carolina Port Authority
Nickie Smith Port Director, Greenup‐Boyd County Port Authority
Scott Stewert Port Director, Port of Jeffersonville
Joe Tegart Principle Sales and Marketing, Port of Louisville
Heather Wood Director of Environmental Affairs, Virginia Port Authority
The research team that contributed to this project included: Sarah McCormack, Chris Van Dyke, Doug Kreis, Bryan Gibson, Hugh Deaner, and Shane Stevens.
7
List of Figures
Figure 1: The Triple Bottom Line for Inland Port Sustainability ………………………………………………………….25
Figure 2: The Many Challenges of Port Sustainability at the Port of Cincinnati ………………………………….27
Figure 3: Zones of Port Sustainability Control ……………………………………………………………………………………29
Figure 4: Generalized Stakeholders and Supply Chain for Ports ……………………………………….………………..32
Figure 5: Vessel Speed Reduction Zone at the Port of San Diego ……………………………………….………………33
Figure 6: EPA Plan‐Do‐Check‐Act Flow Chart for EMS Programs …………………………………………….………….37
Figure 7: Sample GRI Certification Table for Reporting Sustainability ……………………………………………..…39
Figure 8: Size of Container Vessels in Operation ....................................................................................50
Figure 9: Sustainable Dredging Practices at the Port Metro Vancouver ……………………………………….……51
Figure 10: Diagram of Craney Island Dredging Project, Port of Norfolk …………………………………………….…51
Figure 11: Greenhouse Gas Pollution Generated: Ports vs. Alternatives ……………………………………………..55
Figure 12: Percentage Breakdown of Port Pollution by Source ……………………………………………………………56
Figure 13: Depiction of Radiation Scanning Technology ……………………………………………………………………..60
Figure 14: Generalized Model of Economic Performance and Sustainability Relationships …………….…80 Figure 15: Comparison of Cargo Efficiency per Transportation Mode ……………………………………………….127
Figure 16: North American Trade Routes via the Panama Canal ……………………………………………………….131

8
List of Tables
Table 1: Job Creation at the Port of Savannah …………………………………………………………………………………22
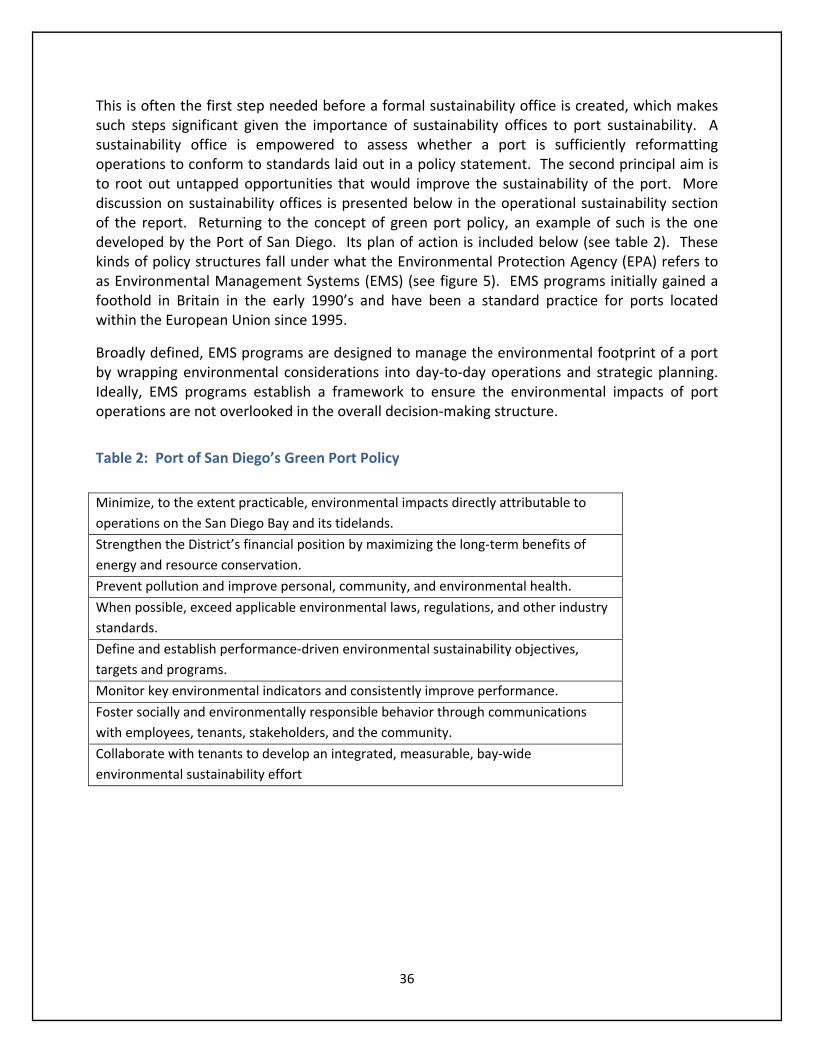
Table 2: Port of San Diego’s Green Port Policy ………………………………………………………………………………..36
Table 3: Dynamics of Port Operational Models ………………………………………………………………………………..46
Table 4: Roadmap to Port Sustainability ……………………………………………..……………………………………………67
Table 5: Potential Economic Benefits of Sustainability ...................................................................…..67
Table 6: Forbes List of the Top 15 Most Sustainable Companies Globally …………………………………………69
Table 7: Progression for Engaging Stakeholders in the Port Sustainability Process ………………….………76
Table 8: Reasons for the Expansion of the Panama Canal ……………………………………………………………..129
Table 9: Stakeholders & Information for Facilitated Sessions on Inland Port Sustainability …………..132

9
This page left intentionally blank.

10
Executive Summary
This report serves as the compilation of the Kentucky Transportation Center’s (KTC) ongoing efforts to develop a better understanding of port sustainability across the U.S., and apply the lessons learned to the inland ports of Kentucky and surrounding regions. The project has delivered pragmatic advice upon which the inland public port industry in Kentucky can act if it so chooses. Implementing sustainability programs at public ports will generate significant financial benefits. This report is a narrative that documents the efforts of KTC researchers to catalog various core concepts related to sustainability, and how the concepts may be applied in a targeted fashion to the inland port industry. The final draft of this report serves two purposes. First, it provides a knowledge base the audience can build off of to improve the operation of inland ports. Secondly, it guides readers through a review of recent literature dealing with port sustainability. By surveying literature, KTC researchers highlighted seven universal target areas that have been defined as critical for ports wanting to develop a robust sustainability program. These target areas include: policy, energy, infrastructure, operations, environment, safety, and efficiency. Not all of these target areas are necessarily applicable for inland river ports, however, the report discusses why policy, operations, and efficiency hold the most promise for benefitting port operations.
After giving an overview of the seven traditional target areas, the report discusses the execution of policies at coastal ports that fall under each area. This is done to determine what strategies are most appropriate for the inland port industry, where the scale of operations for individual facilities is typically must smaller than the coastal operations. Building on this overview, the report delves into the areas of policy, operations, and efficiency to demonstrate their potential for creating a more sustainable port industry. The foregoing investigation wraps up with a discussion of the importance of sustainability for supply chain management – inland ports are frequently key nodal points in a number of supply chains. Many of the initiatives covered in the early sections have emerged from the practices of coastal ports.
Currently, very few studies examine the intersection of sustainability programs and inland ports. Conversely, because of their lengthier history of adopting policies and practices designed to enhance sustainability, a substantial literature exists on sustainability in the context of the coastal port industry. The current report, then, makes a significant contribution to academic literature by opening up a broad discussion about employing sustainable policies and practices at inland ports. Specifically, it pinpoints initiatives from the coastal port industry that could be downscaled and implemented at inland facilities.
KTC researchers undertook a significant amount of fieldwork in 2012 and 2013 to answer the question of why sustainability matters for the future of inland ports. During the summer of 2012, KTC researchers visited 13 ports across the United States. These included deep‐water coastal ports as well as inland river ports. Coastal ports were selected based on their proven success in aggressively implementing sustainability measures to enhance operations. Inland ports were selected based on their stated interest in developing operational models that are sustainable and bolster their financial security.
11
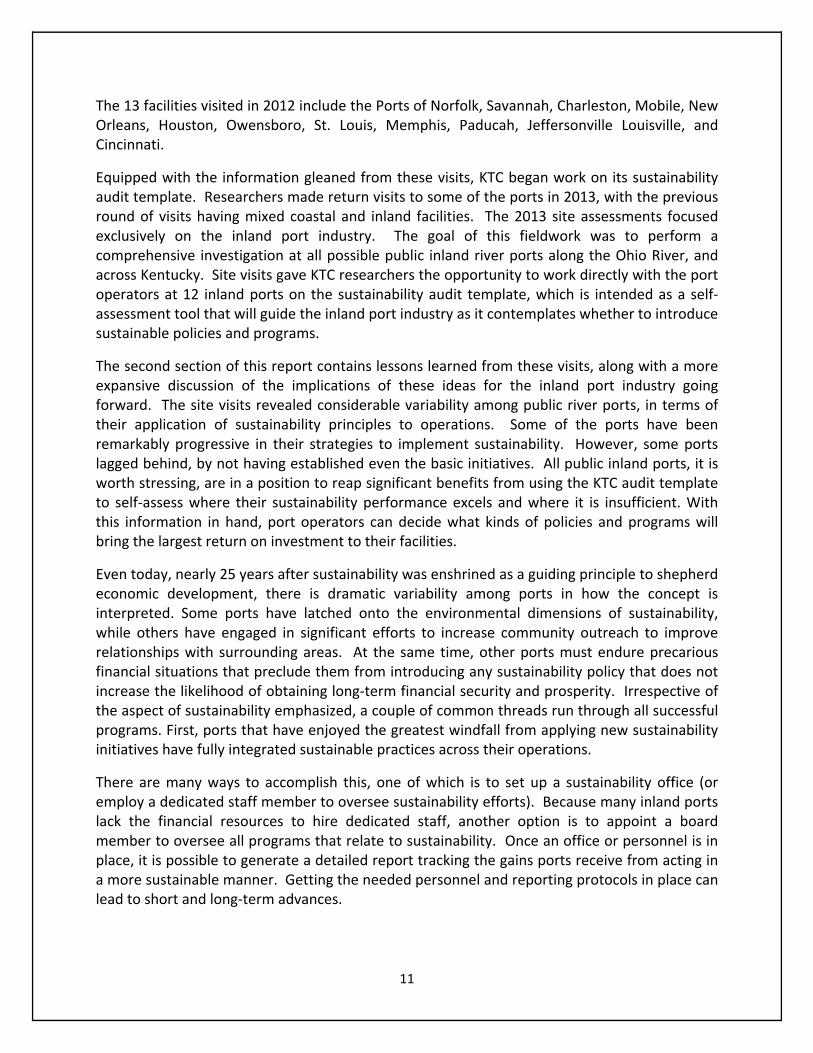
The 13 facilities visited in 2012 include the Ports of Norfolk, Savannah, Charleston, Mobile, New Orleans, Houston, Owensboro, St. Louis, Memphis, Paducah, Jeffersonville Louisville, and Cincinnati.
Equipped with the information gleaned from these visits, KTC began work on its sustainability audit template. Researchers made return visits to some of the ports in 2013, with the previous round of visits having mixed coastal and inland facilities. The 2013 site assessments focused exclusively on the inland port industry. The goal of this fieldwork was to perform a comprehensive investigation at all possible public inland river ports along the Ohio River, and across Kentucky. Site visits gave KTC researchers the opportunity to work directly with the port operators at 12 inland ports on the sustainability audit template, which is intended as a self‐assessment tool that will guide the inland port industry as it contemplates whether to introduce sustainable policies and programs.
The second section of this report contains lessons learned from these visits, along with a more expansive discussion of the implications of these ideas for the inland port industry going forward. The site visits revealed considerable variability among public river ports, in terms of their application of sustainability principles to operations. Some of the ports have been remarkably progressive in their strategies to implement sustainability. However, some ports lagged behind, by not having established even the basic initiatives. All public inland ports, it is worth stressing, are in a position to reap significant benefits from using the KTC audit template to self‐assess where their sustainability performance excels and where it is insufficient. With this information in hand, port operators can decide what kinds of policies and programs will bring the largest return on investment to their facilities.
Even today, nearly 25 years after sustainability was enshrined as a guiding principle to shepherd economic development, there is dramatic variability among ports in how the concept is interpreted. Some ports have latched onto the environmental dimensions of sustainability, while others have engaged in significant efforts to increase community outreach to improve relationships with surrounding areas. At the same time, other ports must endure precarious financial situations that preclude them from introducing any sustainability policy that does not increase the likelihood of obtaining long‐term financial security and prosperity. Irrespective of the aspect of sustainability emphasized, a couple of common threads run through all successful programs. First, ports that have enjoyed the greatest windfall from applying new sustainability initiatives have fully integrated sustainable practices across their operations.
There are many ways to accomplish this, one of which is to set up a sustainability office (or employ a dedicated staff member to oversee sustainability efforts). Because many inland ports lack the financial resources to hire dedicated staff, another option is to appoint a board member to oversee all programs that relate to sustainability. Once an office or personnel is in place, it is possible to generate a detailed report tracking the gains ports receive from acting in a more sustainable manner. Getting the needed personnel and reporting protocols in place can lead to short and long‐term advances.
12
Ports that have invested in personnel or departments exclusively concerned with boosting their overall sustainability have realized the most significant gains. These results bode well for the potential of sustainable policies and practices at inland river ports that are scraping by on tight budgets. Once dedicated personnel have been assigned to oversee a facility’s sustainability, the stage is set to identify areas in which future development can proceed.
One possible route to follow in this regard is to compile a baseline sustainability report whose results will guide future development as well as shape marketing strategies. At this point, some facilities may want to pursue outreach with key stakeholders and supply chain members to collaborate on strategies to attain system‐wide sustainability enhancements. The key message to take away from this discussion is that opening either a sustainability office/department or tasking personnel with managing a port’s sustainability efforts are critical steps that offer a path toward sustained, robust growth. Without conducting a self‐assessment strengths and weaknesses with respect to sustainability, ports do not have a realistic way to move forward.
A second key finding of this report is that enhancing port sustainability cannot be done entirely “in house.” It is not sufficient for only a port facility to pursue new measures to improve sustainability; it also requires buy‐in from stakeholders, surrounding communities, and supply chain members if system‐wide benefits are to be realized. This is an important lesson for inland ports because of their size and financial capacities. In comparison, larger coastal operator ports have developed sustainability programs that are focused on their own operations. A similar model would meet with less success for the inland port industry because this approach is very expensive. In most cases, coastal ports have engaged at some level with outside stakeholders and supply chain members to improve sustainability. Inland ports must pursue a cautious although unflinching set of policies to achieve more sustainable outcomes through collaboration with stakeholders.
There are three reasons for this. First, most air, noise, and light pollution emitted at a port do not originate from a port’s in‐house equipment and facilities (tenants and carriers passing through are the major source). This observation applies to operator ports and landlord ports. Next, because port authorities have complex relationships with supply chain members, clients, communities, governments, and other stakeholders, it is necessary to consult and collaborate with these external agents on sustainability‐centric policy changes. Lastly, inland ports have tight operating margins; introducing new sustainability programs increases the likelihood of satisfying the needs of current clients and offers a persuasive argument to attract new tenants. All evidence indicates that conducting self‐audits and dedicating personnel to oversee sustainability policies is a crucial step toward making substantive changes that are economically beneficial for both the ports and clients.
Whether the port is designated as an operator or landlord also has significant implications for sustainability. Landlord ports, generally speaking, have made less progress toward instituting new sustainability policies than operator ports. It is clear that significant progress in port sustainability highly correlates with the existence of sustainability offices. Landlord ports have the most to gain from dedicating personnel to questions regarding sustainability, because of the limited direct control they have over port operations – any policy changes are made in
13
consultation with tenants given that enforcing new regulations will fall on their shoulders. In the absence of staff members who work on sustainability issues, landlord ports will find it difficult to make strides toward a more sustainable operational model. Without a dedicated sustainability office, landlord ports cannot organize information about sustainability opportunities, provide that information to their clients, and most importantly, motivate them to act on that knowledge. Operator ports, on the other hand, have the authority to execute decisions in a more comprehensive way. This situation alleviates, in a modest fashion, some of the problems that arise when there is no central unit dedicated to sustainability policies.
Ultimately, while we believe the comprehensive analysis and knowledge contained in this report will prove invaluable to the industry, the centerpiece of this project is KTC’s Inland Port Sustainability Audit Template and Self‐Assessment Tool. Chapter six discusses this project’s research on self‐assessment mechanisms, along with goals and design considerations that drove the early template development process. Chapter seven expands on this, providing a detailed overview of the iterative process researchers used to develop the final version of the audit. The final version (3.0) of KTC’s Inland Port Sustainability Audit Template and Self‐Assessment Tool consists of a series of questions covering a variety of topics. These questions reflect the “triple bottom line” approach to sustainability (Elkington 1999).
While issues like environmental protection and remediation are imperative, they are balanced against questions about the community outreach efforts and broader operational profile of ports. A facility can become sustainable by focusing on all three topics. Once port operators have completed the self‐audit, an analysis of the responses will generate recommendations for practical steps to enhance sustainability in a way that boosts efficiency, resiliency, and profitability. The aim of this audit template is to generate actionable guidance. However, it is crucial to note that each inland port is unique with respect to the scale and scope of operations. Given this scenario, KTC researchers designed the template to not embody a prescriptively monolithic vision of sustainability. Instead, it was crafted to supply port‐specific information so that new sustainability policies and measures can be introduced that synchronize with established practices and business models. It is important to note that at each step along the way, the template has been designed with significant input from industry stakeholders. Chapter seven includes the full template, while a comprehensive version history is available for readers in Appendix E.
One point of contention that emerged throughout KTC’s interaction with port operators is the future of barge transport of containers along inland rivers due to the Panama Canal expansion. Although there will be clear implications for coastal ports, there is greater uncertainty over whether the expansion will change the make‐up of barge traffic along the nation’s rivers. Some port representatives expressed considerable optimism over the future prospects of container on vessel, viewing it as potentially catalyzing rapid growth on the inland waterway system. Other officials took a more cautious or dismissive view concerning the topic. They were vocal in arguing the canal expansion was likely to have a sizeable impact on the inland waterways. Although there is not definitive evidence yet for either side, it is critical to note that a number of obstacles will impede the widespread growth of containers on barges/vessels.
14
The first consideration is that post‐Panamax ships (those able to pass through once canal expansion is complete) are unlikely to be routed toward the Gulf of Mexico. If this is the reality, there is little chance that canal expansion will benefit U.S. inland waterways. Another major impediment for container on barge is the physical infrastructure of the inland waterway system. It remains an open question as to whether the system could handle this without significantly disrupting timing and operations, especially concerning lock and dam facilities. A number of small‐scale barge services specializing in container on barge operate successfully, which indicates this strategy is viable for some. However, the scalability of these kinds of operations remains in question.
In addition to the analyses presented and the development of a sustainability audit template, the final goal of this report is to compile a set of best practices that will serve as a foundational knowledge database that inland port officials use to work towards a more sustainable future. The appendices will provide critical supplemental information that will serve as a cornerstone of the database. The appendices have detailed technical memorandums describing the fieldwork conducted by KTC researchers at both coastal and inland ports. The memos give an overview of the 24 site visits, discuss lessons learned and best practices, and include details of port operations. Another supplemental section contains a detailed genealogy of the KTC audit template, describing the iterative process of development and revision. Appendix D offers a condensed version of this report (for readers in a hurry).
This summary report hits on major themes, identifies opportunities for improving inland port sustainability, and presents the sustainability audit template. Taken together, the materials in this report set forth a blueprint for bolstering sustainability at inland river ports, and consequently a way to expand usage of the inland waterway system. Indeed, if the inland waterway is to expand to accommodate the United States’ growing freight movement needs, it is imperative that development happen in a judicious, sustainable manner. Neglecting sustainability and giving in to the status quo will compromise the integrity and functionality of the inland waterways – thus casting doubt on the nation’s future economic security.

15
This page left intentionally blank.
16
“Real sustainability is about simultaneously being profitable and responding to the reality
and the concerns of the world in which you operate.” – John Browne
Chapter 1: Introduction
Evolution of the flow of goods, technology, and information has transformed the port industries. In recent decades, the intensity of activity at U.S. ports has escalated as the rate at which imports and exports moving through them has increased (Cheon and Deakin 2010). This rapid expansion in trade and freight movement poses opportunities and challenges to ports. While it is crucial to the future of national and international trade, the sustainability of ports remains an understudied aspect of the transportation network. While a few studies have looked at the implementation of sustainable practices in the coastal port industry and the sustainability challenges facing coastal ports, researchers have neglected the implications of sustainability for inland waterways and ports. However, because coastal port operations and inland port operations share numerous logistical connections and rely on similar management models, some of the research that has focused on coastal ports can be extended to the inland waterway system. As such, research on costal port sustainability offers insights and lessons that are applicable to inland ports.
This report is the first phase of an investigation into coastal and inland port sustainability. This is part of a larger project that will develop strategies for harnessing sustainability principles, and applying them to Kentucky’s inland waterway port system. The report begins by defining sustainability, why it is a germane topic for the port industry, and an overview of how the concept has been applied in the port industry. After establishing a grounded understanding of why sustainability matters for the future viability of the port industry, this report examines sustainability initiatives that have been implemented at several coastal and inland ports. More details on the specific policies implemented at the coastal and inland ports visited by KTC in the summer of 2012 can also be found in Appendix A. By evaluating the measures ports have taken to improve sustainability, this report can critically assess the potential for such initiatives to enhance the efficiency and profitability of the inland ports of Kentucky and the surrounding region.
17
This report examines, either via review of literature or the conducting of site visits, the port policies and sustainability initiatives of a wide range of ports. Listed below are the ports examined:
Antwerp
Seattle
San Diego
Los Angeles
Long Beach
Oakland
Vancouver
New Orleans
Houston
Mobile
Savannah
Charleston
Norfolk
Huntington
Cincinnati
St. Louis
Memphis
Paducah
Louisville
Jeffersonville
The port industry faces a number of challenges related to sustainability that are not encountered by traditional businesses. Corporate businesses typically approach sustainability with an eye towards boosting profit and performance (economic sustainability). However, port sustainability is a more complex topic, and requires a more balanced approach to the “triple bottom line” (Kassinis and Soteriou 2003). Traditionally, efforts to improve business sustainability have addressed target areas such as policy, operations, infrastructure, safety, energy consumption, environmental conservation and efficiency. While all of these are certainly still important to the discussion of sustainable ports, affecting them is a somewhat different process given this unique nature of the port industry. This is due primarily to three important qualities of ports. First, they are intricately integrated into their communities, both economically and socially. Second, they are fundamentally more complex than the average business organization and have a considerable number of stakeholders. Finally, ports are also vitally important aspects of a wide variety of supply chains. Moreover, not all of the target areas can be altered to result in meaningful adjustments.
18
This report reviews each of the target areas with respect to the port industry, and recommends three areas (operations, energy consumption, and efficiency) that provide the best opportunity for the inland port industry to enhance sustainability. This will entail the industry making a substantial overhaul to its practices, and introducing new sustainably‐oriented policies that will govern their operation. Based on the literature review and information gathered from port visits, this report argues that the most practical and effective method of amplifying inland port sustainability is through a combination of adjustments to operations and supply chain management. Our findings suggest a four‐step approach inland ports can follow to improve their sustainability profile:
1. Identify the sustainability challenges facing the port.
2. Create a sustainability office to address those challenges.
3. Pinpoint “in house,” low‐investment initiatives that improve sustainability and business
performance while not financially burdening the port.
4. Address remaining sustainability challenges by targeting stakeholders in the supply chain.
As the first phase of the Kentucky Transportation Center’s ongoing port sustainability study, this report lays the groundwork to conduct future research. The information that is presented here will assist researchers moving forward as they conduct a series of group facilitating sessions with port operators and other stakeholders, develop a thoroughgoing audit process, implement that audit process as ports are selected for evaluation. The information will also compile findings from audits to arrive at a set of refined recommendations that ports can use to expand their commitment to sustainability (which will bolster their triple bottom line) and competitively position the industry to promote the increased utilization of inland waterways – which offers a mode of transport that is unmatched in terms of the ability to reliably and efficiently move goods throughout the U.S.
Increasing the sustainability of port operations is one part of a broader strategy to enlarge the capacity of the inland waterway system, which is currently underutilized. This has shifted a great deal of business to less sustainable and efficient forms of transportation – such as rail and truck. Identifying methods to bolster port sustainability is one part of a broader, more holistic project that seeks to reposition the inland waterway system as the most viable choice for shippers.

19
This page left intentionally blank.
20
"Achieving sustainable development is perhaps one of the most difficult and one of the most
pressing goals we face. It requires on the part of all of us commitment, action, and
partnerships.”
Mostafa Tolba ‐ Chairman of the Commission on Sustainable Development
Chapter 2: Understanding Sustainability
Defining Sustainability
An incipient definition of sustainable development was formalized in a 1981 White House Council on Environmental Quality report. The report argued that, "if economic development is to be successful over the long term, it must proceed in a way that protects the natural resource base.” It consequently drew a connection between economic development and the depletion of natural resources, which would become a hallmark of later work on sustainability. The 1987 Brundtland Report represented a watershed moment that brought the issue of sustainability into the public’s consciousness. Even today, it remains the most frequently cited work on sustainability. The report defined sustainable development as “development which meets the needs of the current generations without comprising the ability of future generations to take care of their needs” (Brundtland Report, 1987). This definition is more forward than the 1981 report definition from the White House Council on Environmental Quality because it broadened the concept of sustainability. Sustainability, it argued, was unattainable if provisions were not made to ensure intergenerational equity. Current economic development that stymies the ability of future generations to pursue their economic goals is, under this new rubric, fundamentally unsustainable. During the 1990s a new group of researchers reworked the concept of sustainability. They recognized that sustainability was achievable only via the simultaneous balancing of environmental concerns, issues of social equity, and economic growth. John Elkington (1998, 2002) coined the “triple bottom line” concept of sustainability to incorporate economic, social, and environmental concerns. This reorientation came in reaction to previous efforts to link sustainability, narrowly, to environmental protection. Put simply, this definition requires a broadening of an industry’s goals to include ensuring that the present does not come at the expense of the future. While acknowledging the importance of environmental protection, the triple bottom line also stresses the importance of business performance and standards of living as critical to the goals of sustainability (Corbett and Kleindorfer 2001, 105). Moreover, research has demonstrated that the three dimensions of sustainability be highly correlated and mutually reinforcing, which explains why sustainability has become a staple of success in the business world (Pil and Rothenberg 2004, Kassinis and Soteriou 2003).
21
Sustainable Business
An organization that embraces a sustainable approach to business practices will derive many benefits. Sustainable business practices generate growth opportunities, lower costs, increase productivity and reduce overall risk (Tueth, 2010). Growth opportunities are created by, among other things, making the port in question more attractive to potential investors and supply chain members. Costs are lowered by increasing the efficiency of operations and infrastructure. Risk is reduced because conditions at the port are safer and more secure in addition to employees being more educated regarding safety and security. Furthermore, businesses that operate within a sustainable network can also improve their long‐term operational viability, enhance their brand image in the public eye, enjoy more fruitful relationships with stakeholders, and experience more success in recruiting and retaining employees. Moreover, there are a number of ways that applying sustainable business practices has demonstrable benefits for inland water ways and inland ports specifically (Cheon and Deakin 2010, Gilman 2003). Sustainable business practices open up growth opportunities, in the form of new products and services, that satisfy the increasing consumer demand for socially and environmentally sensitive products. One niche that has remained unexploited on the upper Mississippi and Ohio River corridors is container‐on‐barge (COB) transportation. COB could be marketed as a cost‐effective means of moving (some) goods along the inland waterway system that would enable manufacturers to tap into distant markets with greater ease. This scenario could also raise their sustainability profile. One example of COB is the “64 Express” program initiated at the Port of Norfolk in Virginia. The program is operated by the Norfolk Tug Company’s James River Barge Lines, and was a sustainable response to the growing container truck congestion along the Hampton Roads that lead to the Port of Norfolk. These roads run directly through residential neighborhoods, the campus of Old Dominion University, and downtown Norfolk. The “64 Express” program removes a portion of this container traffic from the road and places it on barges which travel along the James River to a distribution center in Richmond, Virginia. Following Teuth (2010), this is an example of positive externality and demonstrates a practical way in which sustainable business practices can foster growth by generating customer satisfaction and loyalty. Numerous studies have indicated inland waterway transport is the most environmentally friendly, cost effective, and safest mode of transportation available. Growing awareness about the benefits of inland waterway transport will doubtlessly spark new initiatives that mirror the “64 Express” in scope, and commitment to sustainability. While many stakeholders in the inland waterway transportation industry remain skeptical about the feasibility of large‐scale COB transport, smaller niche opportunities should not be hastily dismissed. When our investigators spoke with Lee Beckman of the Georgia Port Authority, he stressed the importance of container business for all ports.
22
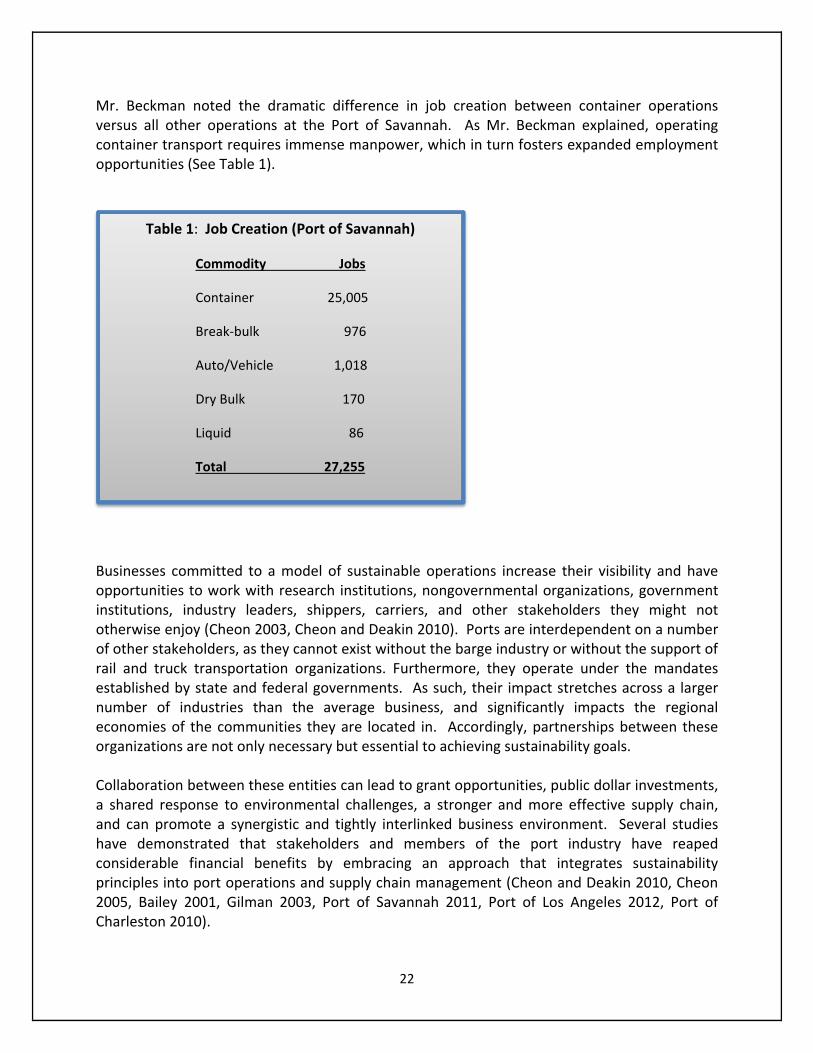
Mr. Beckman noted the dramatic difference in job creation between container operations versus all other operations at the Port of Savannah. As Mr. Beckman explained, operating container transport requires immense manpower, which in turn fosters expanded employment opportunities (See Table 1).
Businesses committed to a model of sustainable operations increase their visibility and have opportunities to work with research institutions, nongovernmental organizations, government institutions, industry leaders, shippers, carriers, and other stakeholders they might not otherwise enjoy (Cheon 2003, Cheon and Deakin 2010). Ports are interdependent on a number of other stakeholders, as they cannot exist without the barge industry or without the support of rail and truck transportation organizations. Furthermore, they operate under the mandates established by state and federal governments. As such, their impact stretches across a larger number of industries than the average business, and significantly impacts the regional economies of the communities they are located in. Accordingly, partnerships between these organizations are not only necessary but essential to achieving sustainability goals. Collaboration between these entities can lead to grant opportunities, public dollar investments, a shared response to environmental challenges, a stronger and more effective supply chain, and can promote a synergistic and tightly interlinked business environment. Several studies have demonstrated that stakeholders and members of the port industry have reaped considerable financial benefits by embracing an approach that integrates sustainability principles into port operations and supply chain management (Cheon and Deakin 2010, Cheon 2005, Bailey 2001, Gilman 2003, Port of Savannah 2011, Port of Los Angeles 2012, Port of Charleston 2010).
Table 1: Job Creation (Port of Savannah)
Commodity Jobs
Container 25,005
Break‐bulk 976
Auto/Vehicle 1,018
Dry Bulk 170
Liquid 86
Total 27,255

23
This page intentionally left blank.
24
"Sustainability means development that meets the needs of the present without
compromising the ability of future generations to meet their own needs.”
‐ World Commission on Environment and Development
Chapter 3: Understanding Port Sustainability
Sustainable Ports
What does sustainability essentially mean for ports specifically, and why is it different than typical business sustainability? Ports are not, strictly speaking, neatly analogous to businesses or corporations which have concrete identities defined as profit‐seeking organizations. More so than many businesses, ports have highly complex organizational structures and multiple identities which define their roles in relation to the larger community which they exist within (Cheon and Deakin 2010). The recent literature on port sustainability suggests that ports have four distinct identities. First, they function as service provision organizations in the manner of a traditional private corporation. Second, ports often serve as regional and national economic network nodes. Third, they are infrastructure systems that facilitate other industry and business, enabling them to operate and grow. Fourth, ports also have an identity of a quasi‐political organization with intricate ties to local and national governance, which is more in line with public organizations.
Often port sustainability is only viewed through the lens as one of the four identities. Typically it is the business performance lens. Recently, however, the American Association of Port Authorities (AAPA) took steps to broaden this view. In October of 2007 the AAPA developed a port sustainability framework. This requires ports to be financially viable, contribute to the economic prosperity of their regions, protect the environment, and accept their important role in the community (AAPA Sustainability Resolutions 2007). Based upon discussions with inland ports, their stakeholders, and investigations into the sustainability initiatives that have proven successful at ports around the country, the framework for sustainability developed by Cheon and Deakins (2010), which they apply to the coastal port industry, is also particularly appropriate for inland ports (See figure 1). As opposed to the traditional generic sustainability template of people, profit, and planet, this framework incorporates the specific manner in which the port industry is affected by these three sustainability principles. Also, due to the complex nature of port sustainability, this framework enables a focus on the intersections between different sustainability spheres rather than the individual spheres themselves. This is a useful rubric because there are inherent tradeoffs involved in pursuing any sustainability initiatives. Improving economic sustainability via the elimination of a recycling program, for example, may come at the cost of environmental sustainability. Likewise, a social outreach program designed to improve community relations may require upfront financial investment while the economic benefits may not be immediately realized.

25
Since inland ports must keep a watchful eye on their fiscal bottom line, this framework provides a useful model to allow them to occupy their own “sustainability space” while remaining attentive to the other “sustainability intersections.” Doing this empowers organizations such as ports to recognize and adopt policies that give them the opportunity to build their sustainability profile in specific areas without sacrificing other important concerns. Following from this model, initial recommendations to inland ports regarding the best strategies to improve sustainability can take an explicitly financial angle. This situation is ideal given the financial constraints facing most of the inland port industry.
Figure 1: The Triple Bottom Line for Inland Port Sustainability
The “A” intersection represents a sustainability perspective focusing on “social and environmental responsibility” and “regional economic influence.” This intersection is typically the identity of public industries that are concerned with environmental impact, and their role in local and national economies. Public ports often adopt this perspective as they attempt to comply with government mandated environmental regulations, or fulfill their roles as port authorities. Although this intersection often becomes the identity of purely public ports, it is not a sustainability model that is likely to be effective for inland waterway ports with tight budgets.
For example, the Port of Norfolk and the Port of Savannah have adopted quasi‐public operating statuses whereby they receive zero money from their state’s general fund. This distinction grants them greater autonomy to pursue business interests and maximize profits while allowing them to maintain operational control. This strategy positions these ports at the “C” intersection of sustainability strategies. As a result, it is no surprise that the Port of Norfolk is financially successful.
Sustainable Inland PortsArea 2) Society &
the Environment Responsibility
Area 1)
Economic Impact Area 3) Business
Performance
D
B A
C
26
Furthermore, due to the fact that the Port Authority of Virginia retains operational control over port directives, they have direct control over policy and a significant interest in designing policies responsive to the social and environmental needs of their communities. Alternatively, because the port operators have financial autonomy, they can be highly responsive to the market and the port’s financial bottom line. Upon considering all of these implications, the ports operational model can be seen as occupying the “D” intersection and fully embracing all of the aspects of port sustainability.
Similar to intersection “A”, intersections “B” and “C” also represent less than optimal inland port sustainability strategies. The intersection between “social and environmental responsibility” and “business performance” (B) is the sustainability perspective often adopted by fully private ports or public landlord ports where operations have been outsourced. Although these strategies integrate environmental responsibility with profit‐seeking goals, the results are suboptimal because they depart from the revised “triple bottom line” emphasis on attending to community needs and economic development. Although this is somewhat understandable from the perspective of private operators, which generally demonstrate less concern towards community development, it is nevertheless an unsustainable approach. While such ports may pay heed to environmental concerns, it is likely to be in response to federal mandates rather than community needs per se. Lastly, the third intersection, labeled “C”, represents a focus on economic impacts and business performance. This was the approach most private businesses traditionally took before environmental issues became a major concern and entered the public consciousness in a significant manner.
Today ports must remain environmentally conscious and work to support regional economic values while preserving financial viability. They have to devise new strategies to keep air and water pollution in check, avoid practices that threaten public health, and reduce their resource consumption. This is a challenging mandate given ports need to have a positive impact on the economy while being an engine of employment growth (see Figure 3). Intersection “D” represents the ideal form of sustainability that ports should aim to achieve. It combines all elements of the “triple bottom line,” and therefore represents a holistic approach to sustainability. While most businesses can achieve their sustainability goals by situating themselves within one of the other three intersections, ports must make an attempt to embrace all of them. This is not to say that all inland port policies must fit neatly into the “D” intersection. In fact, such a mandate is almost certainly unattainable. The point is, however, to set targets and foster a new way of viewing policies, programs, and initiatives for inland ports. This is still a daunting task; however, the evidence from many major coastal ports indicates that such incremental changes to how operations are viewed can lead to significant results over time. Unfortunately, the inland port industry has yet to catch up to the coastal ports in this regard. Therefore, most find themselves at intersection ‘C’, scrambling to comply with new environmental or societal regulations. This is done at the expense of economic performance, because sustainability planning is lacking.
27
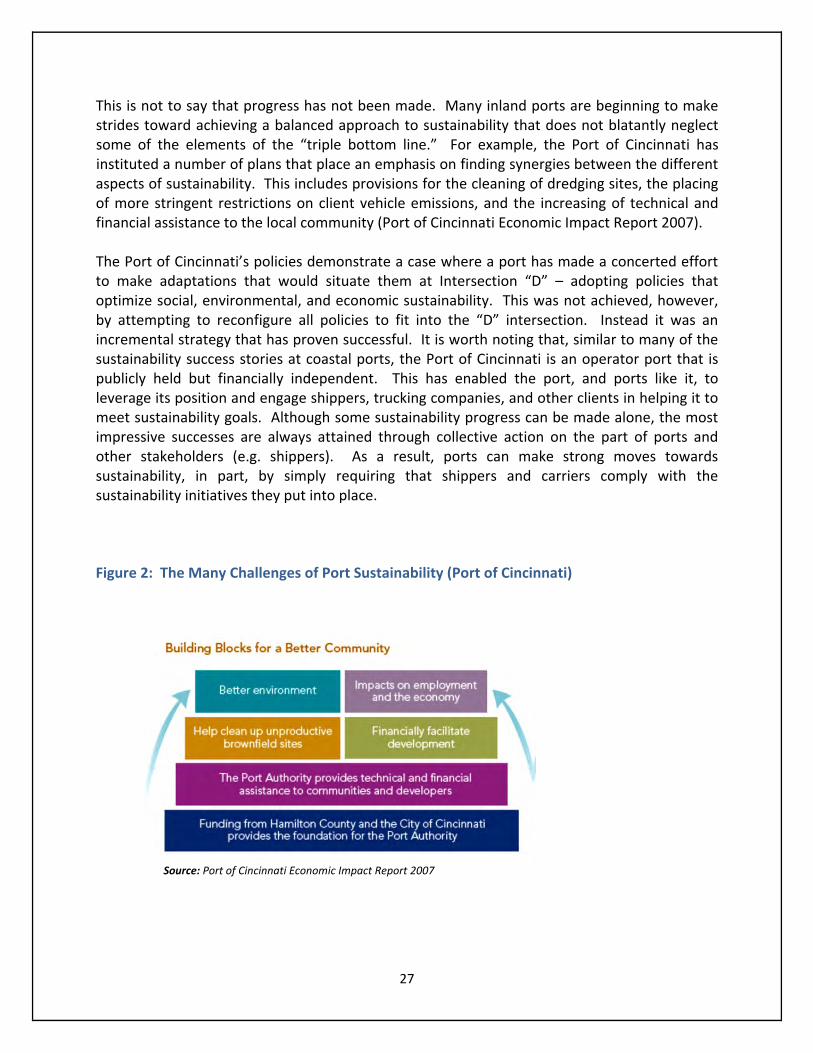
This is not to say that progress has not been made. Many inland ports are beginning to make strides toward achieving a balanced approach to sustainability that does not blatantly neglect some of the elements of the “triple bottom line.” For example, the Port of Cincinnati has instituted a number of plans that place an emphasis on finding synergies between the different aspects of sustainability. This includes provisions for the cleaning of dredging sites, the placing of more stringent restrictions on client vehicle emissions, and the increasing of technical and financial assistance to the local community (Port of Cincinnati Economic Impact Report 2007). The Port of Cincinnati’s policies demonstrate a case where a port has made a concerted effort to make adaptations that would situate them at Intersection “D” – adopting policies that optimize social, environmental, and economic sustainability. This was not achieved, however, by attempting to reconfigure all policies to fit into the “D” intersection. Instead it was an incremental strategy that has proven successful. It is worth noting that, similar to many of the sustainability success stories at coastal ports, the Port of Cincinnati is an operator port that is publicly held but financially independent. This has enabled the port, and ports like it, to leverage its position and engage shippers, trucking companies, and other clients in helping it to meet sustainability goals. Although some sustainability progress can be made alone, the most impressive successes are always attained through collective action on the part of ports and other stakeholders (e.g. shippers). As a result, ports can make strong moves towards sustainability, in part, by simply requiring that shippers and carriers comply with the sustainability initiatives they put into place.
Figure 2: The Many Challenges of Port Sustainability (Port of Cincinnati)
Source: Port of Cincinnati Economic Impact Report 2007
28
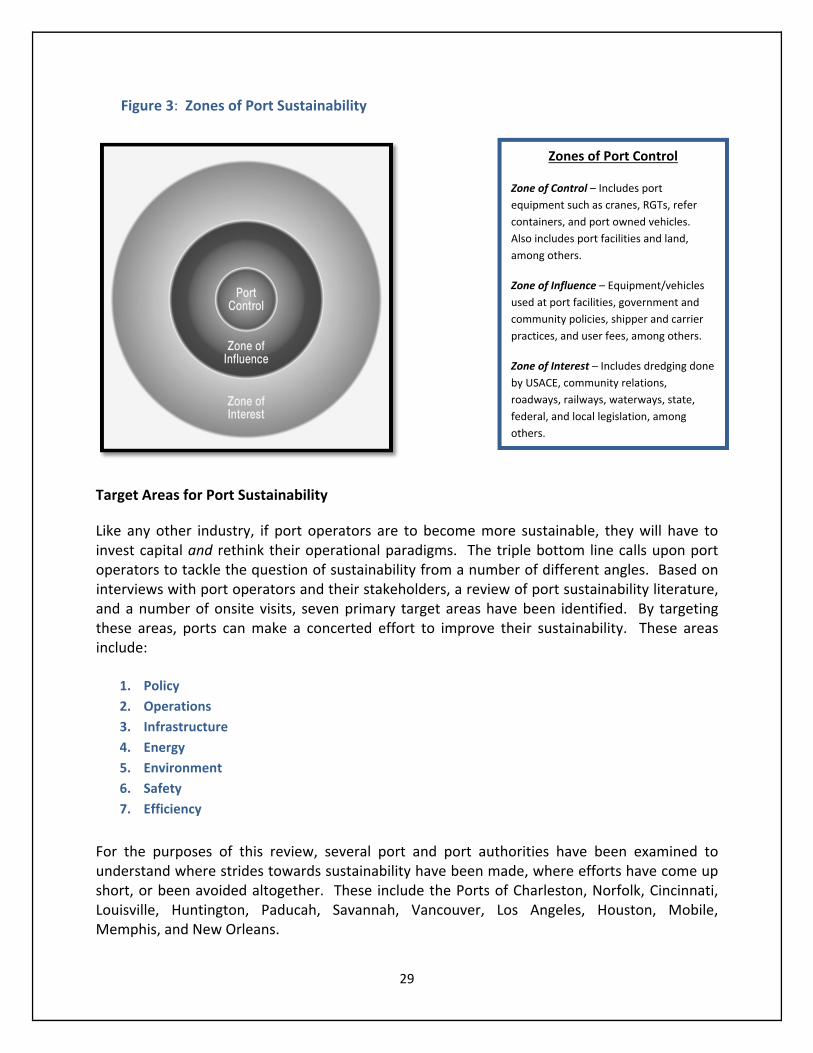
Addressing sustainability on all three fronts, like the Port of Cincinnati has done, is increasingly challenging when the financial bottom line takes precedent over the triple bottom line. Many ports have suffered decreases in revenues due to the recent economic downturn. A significant challenge for inland ports is identifying methods of protecting their economic viability while not abandoning their nascent commitments to sustainability. The solution to this dilemma will almost certainly be found, not in the strict zone of port control, but in the zones of port influence and port interest (see Figure 3). This is due to the fact, discussed in greater detail below, that a great deal of the environmental and societal impact of a port is generated by their supply chain. This includes shippers, carriers, clients, and stakeholders that constitute it. Figure 3 illustrates the three zones over which ports typically exercise some control. The zone of control includes port facilities, the land on which the port sits, and equipment and vehicles ports own (the “zone” over which a port can exert direct, unmediated control). The zone of influence is not directly under port authority; instead, it encompasses equipment and vehicles (privately owned) that are used for port operations, community and government policies, and shipper practices. As the name suggests, the port can assert influence through its own regulations, and apply pressure to entities responsible for making laws and regulations that the port and its customers must abide by. If a port wants to enhance its sustainability, it could do this in part by arguing for the passage of legislation that would mandate the implementation of policies. These are the areas where ports can secure grant money to entice truck operators to upgrade vehicles, impose user fees on containers and break‐bulk, or insist on more sustainable modal splits. It is important to note that most of what defines port sustainability occurs in target areas outside the zone of direct port control. It is important to determine the target areas for improving port sustainability, which of them can be addressed within the zone of control, and which must be addressed along supply chains and among stakeholders. To this end, what follows is an examination of those target areas and how successful sustainable ports have addressed them.
29
Figure 3: Zones of Port Sustainability
Target Areas for Port Sustainability
Like any other industry, if port operators are to become more sustainable, they will have to invest capital and rethink their operational paradigms. The triple bottom line calls upon port operators to tackle the question of sustainability from a number of different angles. Based on interviews with port operators and their stakeholders, a review of port sustainability literature, and a number of onsite visits, seven primary target areas have been identified. By targeting these areas, ports can make a concerted effort to improve their sustainability. These areas include:
1. Policy
2. Operations
3. Infrastructure
4. Energy
5. Environment
6. Safety
7. Efficiency
For the purposes of this review, several port and port authorities have been examined to understand where strides towards sustainability have been made, where efforts have come up short, or been avoided altogether. These include the Ports of Charleston, Norfolk, Cincinnati, Louisville, Huntington, Paducah, Savannah, Vancouver, Los Angeles, Houston, Mobile, Memphis, and New Orleans.
Zones of Port Control
Zone of Control – Includes port
equipment such as cranes, RGTs, refer
containers, and port owned vehicles.
Also includes port facilities and land,
among others.
Zone of Influence – Equipment/vehicles
used at port facilities, government and
community policies, shipper and carrier
practices, and user fees, among others.
Zone of Interest – Includes dredging done
by USACE, community relations,
roadways, railways, waterways, state,
federal, and local legislation, among
others.
30
Sustainable Policies
Within the literature there is a strong argument for prioritizing policies toward “sustainability” as opposed to “environmental” projects. This distinction is not simply a matter of terminology. With respect to environmental performance, there is the commonly held “traditionalist” view, originating from neoclassical environmental economics. This view states that environmental regulation corrects negative externalities, yet simultaneously burdens businesses with additional costs. This traditional perspective advanced by neoclassical economics is challenging for industries such as inland ports, which have both significant environmental impacts (negative externalities) and tight financial budgets. From this vantage point, it seems like ports have little room to strengthen environmental protections without compromising their net income. Sustainability, however, pertains to more than environmental goals. Pursuing a sustainability agenda does not mean that ports will fall into the trap posited by neoclassical economics, whereby environmentally sensitive policies necessarily reduce profit margins. Going sustainable brings a number of benefits that are missed by the traditional perspective. Indeed, opting for sustainable policies can boost the competitive advantage of a port. With a focus on efficiency and improvements in productivity, practicing sustainability can open up new market opportunities and be a source of economic investment (Wagner and Schaltegger 2004). There are three reasons why inland ports should privilege policies geared towards sustainability, as opposed to implementing changes that only seek to address environmental concerns. In other words, this means to favor a sustainability frame over an environmental frame with respect to policy. First, the port industry has more complexity and includes more stakeholders than a typical business. As a result, ports have more of an impact on, and are more impacted by, their regions, governments, and associated communities (See figure 4). Second, ports, like all other industries, are driven by economic considerations. The main premise of the triple bottom line is that sustainability improves the economic bottom line, particularly over the long‐term. A sustainable port operations model not only seeks to improve environmental and regional economic conditions, but it also bolsters the financial performance of the port itself (Port Metro Vancouver – Sustainability Report 2010). This is a nested view of sustainability; policies implemented within the port itself not only generate benefits for the port, but for the surrounding communities. Being sustainable produces positive spillover effects across multiple scales. Third, selling businesses on a plan that improves business performance is considerably easier than pitching the need for environmental protection, which in‐and‐of‐itself does not guarantee a positive return on investment (Bailey 2001). A number of policies have been successfully implemented that provide insight for the best way port operators can move forward with a sustainability agenda.

31
At the outset, it is generally advisable that port operators gradually introduce sustainability initiatives rather than attempting to implement a whole suite of change all at once. Doing the latter is not an effective strategy because ports will be overwhelmed trying to ensure everything is on track. All initiatives should be administered so that they have the best chance to succeed. Early on, it is advisable that port operators focus on low cost, high impact projects, as this strategy establishes proof of concept for sustainability initiatives. A long‐term vision for how these policies will expand port business and visibility should complement the adoption of new initiatives. Without a comprehensive approach to planning, ports lack a feasible way to execute long‐term sustainability initiatives. Planning should be geared towards working out strategies to integrate sustainable practices into all facets of port operation. While careful planning can be tedious, it is a necessity for articulating a long‐term vision to achieve growth, develop regional economies, and affirm that a robust commitment to sustainability will inform all decisions by the port (Labuschagne, Brent, and Erck 2003). There are, of course, different methods of achieving this. One way is for port management to collectively decide what goals they want to pursue with respect to sustainability. After a consensus has been reached, creating a detailed sustainability report that reflects these goals formalizes port management’s recommendations, and lays out a blueprint for the future. A second tactic is to open up a sustainability office that is dedicated to overseeing the implementation of sustainability policies and coordinating action among stakeholders (if there are any policies or regulations that demand their cooperation). Understanding who the relevant stakeholders are is of the utmost importance at this stage. While stakeholders vary from port to port, generally they include: shippers, receivers, shareholders, the U.S. Army Corp of Engineers, the United States Environmental Protection Agency, multiple levels of government (e.g. federal, state, and local), local communities, and employees of the port and various stakeholders. Each group plays an important role in the functioning of individual ports. One common trait shared among ports that have successfully made the “sustainable turn” is that many different stakeholders are included in the process of crafting appropriate guidance and regulations that all parties find amenable, and will pose as little disruption as possible in their day‐to‐day operations.
32
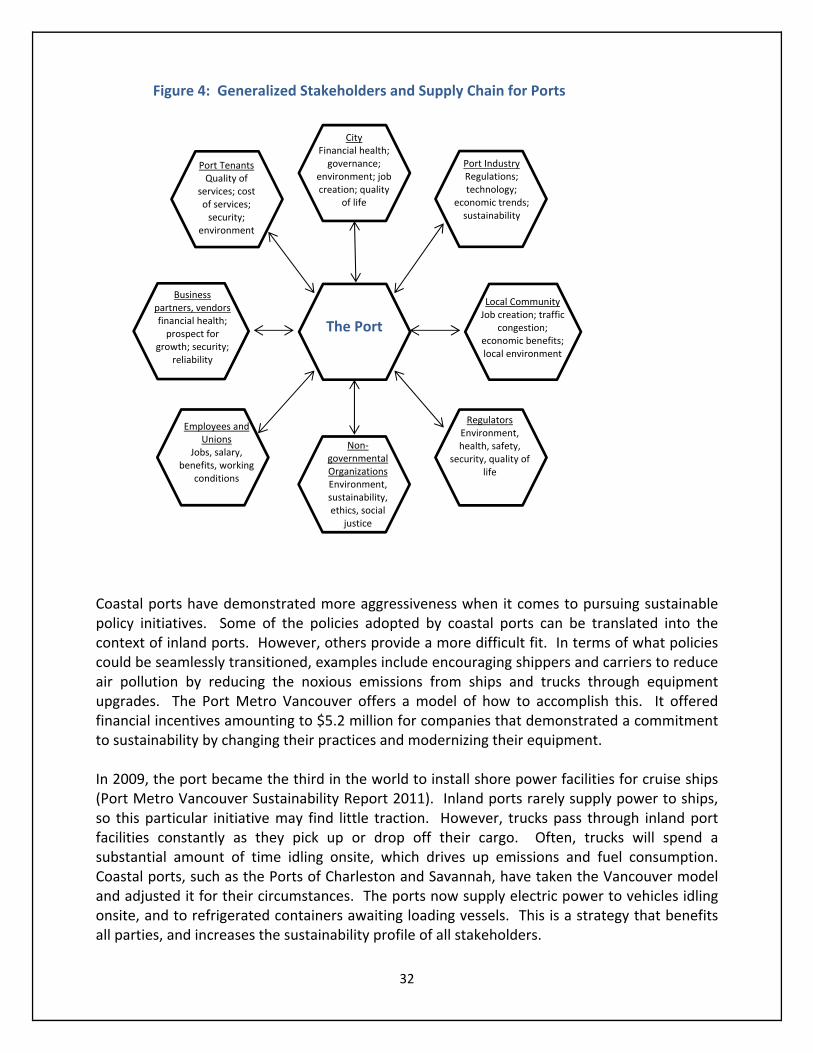
Coastal ports have demonstrated more aggressiveness when it comes to pursuing sustainable policy initiatives. Some of the policies adopted by coastal ports can be translated into the context of inland ports. However, others provide a more difficult fit. In terms of what policies could be seamlessly transitioned, examples include encouraging shippers and carriers to reduce air pollution by reducing the noxious emissions from ships and trucks through equipment upgrades. The Port Metro Vancouver offers a model of how to accomplish this. It offered financial incentives amounting to $5.2 million for companies that demonstrated a commitment to sustainability by changing their practices and modernizing their equipment. In 2009, the port became the third in the world to install shore power facilities for cruise ships (Port Metro Vancouver Sustainability Report 2011). Inland ports rarely supply power to ships, so this particular initiative may find little traction. However, trucks pass through inland port facilities constantly as they pick up or drop off their cargo. Often, trucks will spend a substantial amount of time idling onsite, which drives up emissions and fuel consumption. Coastal ports, such as the Ports of Charleston and Savannah, have taken the Vancouver model and adjusted it for their circumstances. The ports now supply electric power to vehicles idling onsite, and to refrigerated containers awaiting loading vessels. This is a strategy that benefits all parties, and increases the sustainability profile of all stakeholders.
The Port
Business partners, vendors financial health; prospect for
growth; security; reliability
Port IndustryRegulations; technology;
economic trends; sustainability
Local CommunityJob creation; traffic
congestion; economic benefits; local environment
Employees and Unions
Jobs, salary, benefits, working
conditions
Non‐governmental Organizations Environment, sustainability, ethics, social
justice
RegulatorsEnvironment, health, safety,
security, quality of life
Port Tenants Quality of
services; cost of services; security;
environment
CityFinancial health; governance;
environment; job creation; quality
of life
Figure 4: Generalized Stakeholders and Supply Chain for Ports
33
Expanding an initiative like this across a number of inland ports is possible if state and federal funding opportunities can be made available. It is also premature to completely rule out shore power for the tug boats that drive the barges up and down the inland waterway system. Although the feasibility of such an initiative is beyond the scope of this report, the fact that tug boats require considerably less fuel and energy make the possibility reasonable.
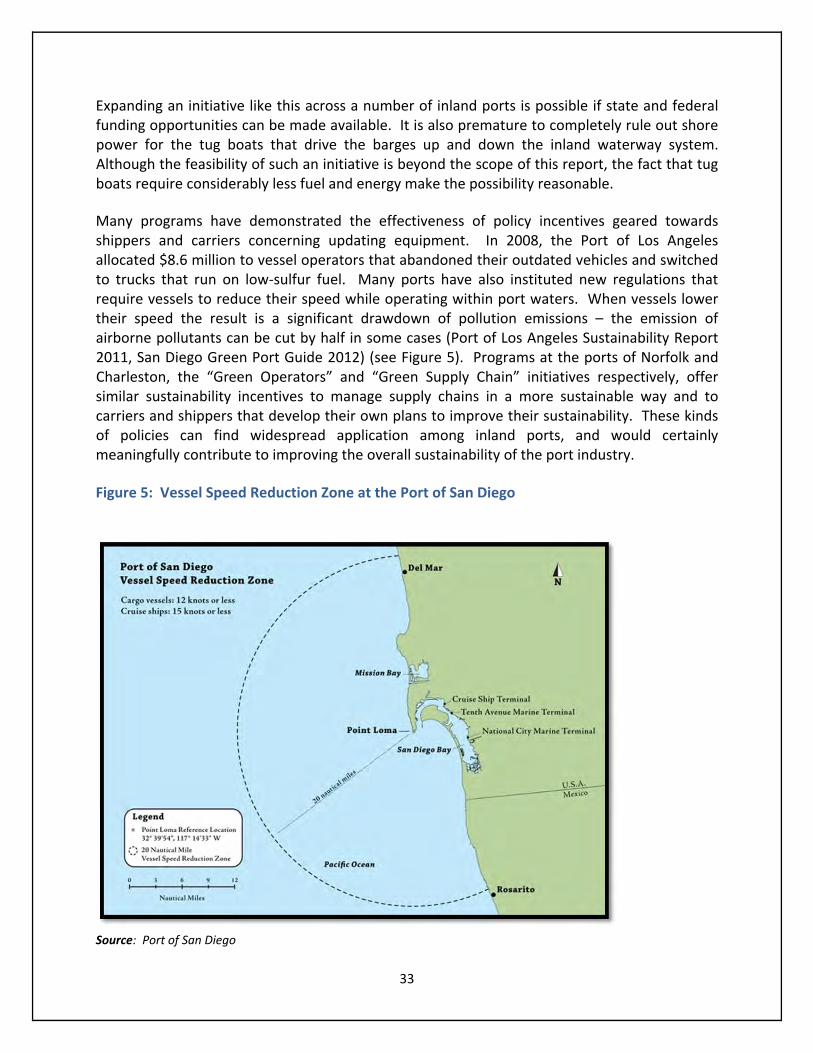
Many programs have demonstrated the effectiveness of policy incentives geared towards shippers and carriers concerning updating equipment. In 2008, the Port of Los Angeles allocated $8.6 million to vessel operators that abandoned their outdated vehicles and switched to trucks that run on low‐sulfur fuel. Many ports have also instituted new regulations that require vessels to reduce their speed while operating within port waters. When vessels lower their speed the result is a significant drawdown of pollution emissions – the emission of airborne pollutants can be cut by half in some cases (Port of Los Angeles Sustainability Report 2011, San Diego Green Port Guide 2012) (see Figure 5). Programs at the ports of Norfolk and Charleston, the “Green Operators” and “Green Supply Chain” initiatives respectively, offer similar sustainability incentives to manage supply chains in a more sustainable way and to carriers and shippers that develop their own plans to improve their sustainability. These kinds of policies can find widespread application among inland ports, and would certainly meaningfully contribute to improving the overall sustainability of the port industry. Figure 5: Vessel Speed Reduction Zone at the Port of San Diego
Source: Port of San Diego
34
In addition to the above discussion, there are also other policy options and regulations that ports can explore. One such possibility is the imposition of user‐fees on trucks, rails, and ships using port facilities, which can be redirected to fund sustainability initiatives. Such programs have been effective at some coastal ports, but they can come at the expense of potentially losing customers to competitors if carriers and shippers are unwilling to pay slightly higher fees, because they cannot envision how sustainably developing ports can secure the financial future of their operations (Leo Beckman, Port of Savannah). While coastal ports have taken the lead on the issue of sustainability, there are a number of excellent examples of inland ports advancing these kinds of initiatives. The Port of Memphis, taking a cue from the Port of Houston, has developed a wide‐ranging sustainability program. Because the Ports of Memphis and Houston work closely from an operational perspective, it makes sense that the port of Memphis has followed Houston’s lead. Thus, despite lacking an office assigned to deal with sustainability issues, Memphis has made significant strides in implementing sustainability initiatives.
In similar fashion, three inland river ports along the Delaware River have adopted a Green Ports Initiative, a collaborative effort designed to meet their sustainability goals. The decision was influenced in part by an increasing level of sustainability emphasis at the Port of Philadelphia. Many inland river ports, such as the Port of St. Louis, focus on policies that manage waste from the ports via recycling requirements and establish limits on the amount of paper waste their offices produce. In addition, container on barge transportation remains an opportunity for ports to become more sustainable. Some inland ports, such as the Port of Paducah, are working to make the mode of transport a reality.
The Port of Paducah is one of the few inland ports in America moving forward with major infrastructure investments that will enable the port to accommodate container on barge. Whether or not substantial container on barge traffic materializes, however, remains a major question without a clear answer. A number of port operators have expressed skepticism that container on barge transport is financially viable. Even so, Paducah River Port officials argue that the expansion of the Panama Canal will eventually divert some intermodal container traffic which will reach as far north as Paducah on the inland waterway system. If this scenario materializes, the port wants to be on the forefront of the container on barge movement, and in a position to handle those containers.
Port officials at Paducah believe that container on barge will become a viable mode of transportation along the inland waterway system, and will eventually yield significant savings for all stakeholders. Based on their forecast, port officials at Paducah have begun upgrading facilities so they can accommodate container on barge transport. Initial steps taken include the purchase of a new gantry crane and laying a concrete foundation able to support the new crane and its load capacity. The estimated cost of the project is $4 million, and port officials estimate it will be complete within a year. The port is relying upon private financing for these upgrades. If container on barge achieves substantial expansion on the inland waterway system, the port is well positioned to take advantage of the situation, while contributing to local and regional economic sustainability.

35
Regardless of the future prospects of container on barge transport, inland waterway shipping of any cargo is more sustainable compared to other modes because barges can move freight with astonishing efficiency. Shipping via inland waterways grants carriers and shippers a significant comparative advantage over companies that rely upon truck and rail to move goods. A simple yet striking example of this efficiency is the fact that one gallon of fuel can move one ton of cargo 514 miles by barge (Figure 11). By comparison, a truck would move the same amount of cargo just 59 miles on a single gallon of fuel (Kentucky Association of Riverports).
Fuel efficiency is one advantage of opting for barge transport. It is worth noting that inland water transport is also significantly safer than overland modes of transport (rail and truck), averaging just one fatality for every 155 truck transport fatalities. By any standard, transport via inland waterways is the most sustainable manner for moving goods (National Waterways Council 2012 ‐ Kruse, Protopapas, and Olson 2012). The future of container traffic on barges remains undecided. However, if a significant portion of that cargo was siphoned off (and moved via inland waterways) it would represent a major step forward for improving the shipping industry’s sustainability (along with the nation’s sustainability) because containers are used to move an overwhelming majority of the commodities. This scenario drives business activity, and eventually the goods find their way into people’s homes.
While coastal ports have made significant progress in becoming a “sustainability hub” for their surrounding communities, inland ports have enjoyed less success. The Ports of Los Angeles, San Diego, Charleston, Savannah, and Houston have initiated policies that enable them to function as sustainability stewards for the local communities they inhabit. Programs of this nature have modest but consequential goals. They are designed to establish ports as spaces in which local residents and businesses can drop off materials for recycling (diverting waste from landfills), gain access to commuter assistance programs, and also learn about why sustainability matters from dedicated sustainability officers.
The Port of Houston, for example, holds a monthly sustainability information session that is available to their tenants and local community. These sessions apprise port customers and the local community of current programs that are oriented toward improving sustainability, and to identify new opportunities. The purpose of these meetings is to preserve a tight relationship with customers and the community, with the goal of improving these relations through their shared concern for sustainability. Another example of such a proactive approach to sustainability is the Port of San Diego’s investment in a commuter assistance program. The intent of this program is to give employees of the port, or employees of businesses that conduct most of their operations at the port, travel to work using a port operated mass transit system.
Lastly, many ports also institute “Green Port Policies” whereby they systematically rewrite their policy statements to ensure that they take into consideration sustainability concerns. Such efforts require little or no upfront investment by the port, but can significantly change how ports view their operations. Reworking policy statements is a useful, and reflective, exercise that gives port officials the chance to identify what they can be doing better to promote sustainability.
36
This is often the first step needed before a formal sustainability office is created, which makes such steps significant given the importance of sustainability offices to port sustainability. A sustainability office is empowered to assess whether a port is sufficiently reformatting operations to conform to standards laid out in a policy statement. The second principal aim is to root out untapped opportunities that would improve the sustainability of the port. More discussion on sustainability offices is presented below in the operational sustainability section of the report. Returning to the concept of green port policy, an example of such is the one developed by the Port of San Diego. Its plan of action is included below (see table 2). These kinds of policy structures fall under what the Environmental Protection Agency (EPA) refers to as Environmental Management Systems (EMS) (see figure 5). EMS programs initially gained a foothold in Britain in the early 1990’s and have been a standard practice for ports located within the European Union since 1995.
Broadly defined, EMS programs are designed to manage the environmental footprint of a port by wrapping environmental considerations into day‐to‐day operations and strategic planning. Ideally, EMS programs establish a framework to ensure the environmental impacts of port operations are not overlooked in the overall decision‐making structure.
Table 2: Port of San Diego’s Green Port Policy
Minimize, to the extent practicable, environmental impacts directly attributable to
operations on the San Diego Bay and its tidelands.
Strengthen the District’s financial position by maximizing the long‐term benefits of
energy and resource conservation.
Prevent pollution and improve personal, community, and environmental health.
When possible, exceed applicable environmental laws, regulations, and other industry
standards.
Define and establish performance‐driven environmental sustainability objectives,
targets and programs.
Monitor key environmental indicators and consistently improve performance.
Foster socially and environmentally responsible behavior through communications
with employees, tenants, stakeholders, and the community.
Collaborate with tenants to develop an integrated, measurable, bay‐wide
environmental sustainability effort
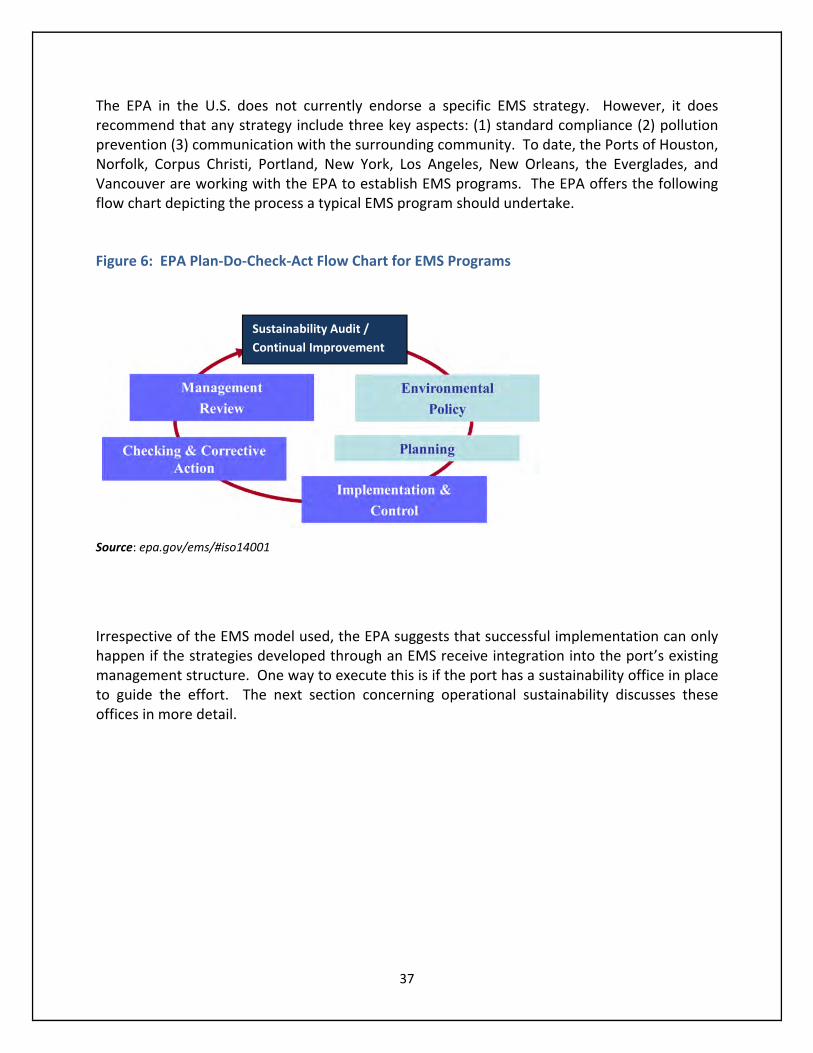
37
The EPA in the U.S. does not currently endorse a specific EMS strategy. However, it does recommend that any strategy include three key aspects: (1) standard compliance (2) pollution prevention (3) communication with the surrounding community. To date, the Ports of Houston, Norfolk, Corpus Christi, Portland, New York, Los Angeles, New Orleans, the Everglades, and Vancouver are working with the EPA to establish EMS programs. The EPA offers the following flow chart depicting the process a typical EMS program should undertake.
Figure 6: EPA Plan‐Do‐Check‐Act Flow Chart for EMS Programs
Source: epa.gov/ems/#iso14001
Irrespective of the EMS model used, the EPA suggests that successful implementation can only happen if the strategies developed through an EMS receive integration into the port’s existing management structure. One way to execute this is if the port has a sustainability office in place to guide the effort. The next section concerning operational sustainability discusses these offices in more detail.
Sustainability Audit /
Continual Improvement
38
Operational Sustainability
Literature reviews indicate there are three key areas in which ports need to excel in order to achieve operational sustainability for inland settings. These areas include: 1) The development of a sustainability audit that is used to guide sustainability initiatives 2) The creation of a sustainability office, which can facilitate sustainability efforts 3) The understanding of how their port status (e.g. operator or landlord port) affects the range of policy choices available to ports to implement sustainable practices.
This section looks at the strategies different ports have used to respond to these three challenges. Many coastal ports (Los Angeles, Long Beach, Oakland, San Diego, Houston, and Vancouver) have adopted the Sustainability Reporting Framework (SRF) developed by the Global Reporting Initiative (GRI) as their sustainability template (see figure 6). The framework provides guidance to organizations about how they can disclose and evaluate their sustainability performance with the aim of making sustainability reporting as routine and transparent as financial reporting. Once a company files a report with GRI, it receives a sustainability grade that is independently certified. This grade can then be included in any kind of official documents (e.g. press releases, annual reports) a company or port may assemble. The GRI has proven successful at bringing together, and keeping informed, the various stakeholders involved in port operations. Given the importance of stakeholder involvement in the process of improving port sustainability, the SRF could prove to be a valuable model for such a resource for the inland port industry. The templates designed for general business would need to be adjusted to accommodate inland port operations (www.globalreporting.org). The ports that have employed sustainability audit templates, like the GRI SRF, rank high globally in terms of their sustainability performance and have benefited from this strong performance by leveraging their sustainability profile into a competitive advantage financially (Port Metro Vancouver Sustainability Report 2010, Port Los Angeles Sustainability Report 2011, Sustainability Report Port Antwerp 2012, Port of Houston Sustainability Report 2011). Later in this report, an audit template for inland port sustainability is laid out which is informed by the GRI SRF, but tailored to suit the inland port industry specifically.
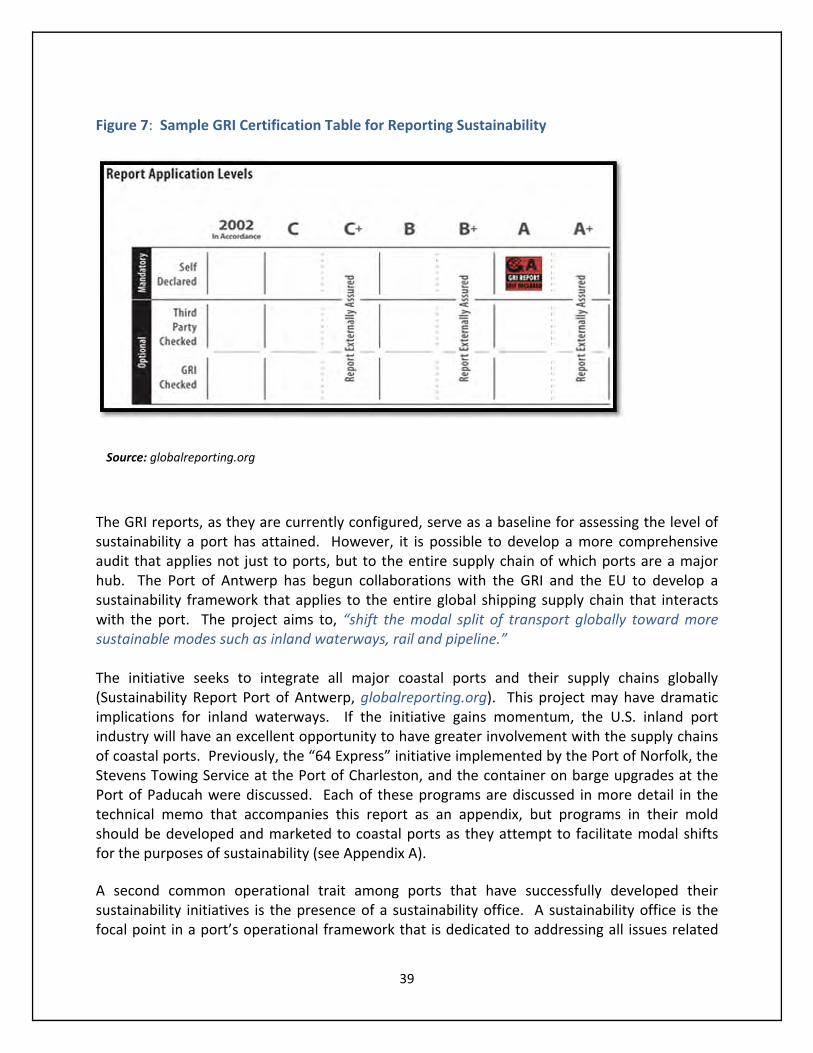
39
Figure 7: Sample GRI Certification Table for Reporting Sustainability
The GRI reports, as they are currently configured, serve as a baseline for assessing the level of sustainability a port has attained. However, it is possible to develop a more comprehensive audit that applies not just to ports, but to the entire supply chain of which ports are a major hub. The Port of Antwerp has begun collaborations with the GRI and the EU to develop a sustainability framework that applies to the entire global shipping supply chain that interacts with the port. The project aims to, “shift the modal split of transport globally toward more sustainable modes such as inland waterways, rail and pipeline.” The initiative seeks to integrate all major coastal ports and their supply chains globally (Sustainability Report Port of Antwerp, globalreporting.org). This project may have dramatic implications for inland waterways. If the initiative gains momentum, the U.S. inland port industry will have an excellent opportunity to have greater involvement with the supply chains of coastal ports. Previously, the “64 Express” initiative implemented by the Port of Norfolk, the Stevens Towing Service at the Port of Charleston, and the container on barge upgrades at the Port of Paducah were discussed. Each of these programs are discussed in more detail in the technical memo that accompanies this report as an appendix, but programs in their mold should be developed and marketed to coastal ports as they attempt to facilitate modal shifts for the purposes of sustainability (see Appendix A).
A second common operational trait among ports that have successfully developed their sustainability initiatives is the presence of a sustainability office. A sustainability office is the focal point in a port’s operational framework that is dedicated to addressing all issues related
Source: globalreporting.org
40
to sustainability. These offices aid in the coordination of sustainability activities among a port, its stakeholders, and its supply chains. During initial efforts to expand a port’s commitment to sustainability, the sustainability office may be an offshoot of an existing department that assumes sustainability responsibilities in addition to the typical activities. One of the first steps a newly created sustainability office must take is familiarizing itself, and key port managers, with the EPA’s report, Environmental Management System Primer for Ports: Advancing Port Sustainability. This should be done while increasing communication with stakeholders about the intent to make a concerted effort to become more sustainable. Another step that occurs early in the process is moving to e‐reporting mechanisms that reduce the use of paper and other office supplies, which constitutes an important gesture demonstrating that all facets of a port’s operations take sustainability seriously (Port of Los Angeles – Sustainability Report 2011). While the optimal setup is for a port to have sustainability office, at the very least it should have a dedicated sustainability officer. The port should then issue an annual sustainability report that tracks the port’s progress (and potential setbacks) on its sustainability goals. These are necessary first steps for improving sustainability. Only one port visited by the KTC research team that lacked a sustainability office had a positive track record on sustainability‐related issues, and took a progressive long‐term view on the methods needed to encourage sustainable practices (Port of Memphis). Clearly, without a staff taking the lead on sustainability, the odds of a port installing robust sustainability initiatives are quite small. It is important to emphasize that the creation of a sustainability office requires minimal investment for the port. However, a sustainability office has the potential to generate significant return on investment if the office can secure funds from grants and other funding sources to subsidize investments. Discussions with port sustainability offices around the U.S. (East Coast area) indicate that the standard protocol for establishing a port sustainability office begins with hiring or naming a sustainability officer or environmental steward. After an office, or an individual, has been exclusively tasked with attending to issues of sustainability, the next step is to develop a sustainability report that inventories all of the port’s sustainability efforts up to that point. From there the office or officer’s responsibilities will vary according to whether the port in question is an operator or a landlord port. In both cases, the office or officer will investigate federal programs that fund sustainability initiatives, and look to similar offices to see what initiatives successfully adopted in those locations might be applicable. In addition, such offices typically conduct sustainability audits as an initial step toward sustainability improvements. At landlord ports the office will largely make recommendations to the port’s tenants, while operator ports will institute new programs directly. For either situation, trucking companies, shippers, rail companies, barge services, and other stakeholders involved in day‐to‐day port operations should be engaged in a dialogue to identify what sustainability opportunities the port can pursue without unnecessarily harming economic performance. Collaboration among all of the stakeholders is unquestionably a key feature of any effort that is serious about gaining a buy‐in from all interested parties. With respect to sustainability and operations, the main

41
difference between landlord ports and operator ports is that the former have considerably less direct control over both, as compared to operator ports (Port of New Orleans ‐ Director of Port Development, World Bank Port Reform Toolkit 2007). Consequently, the ranges of programs available to landlord and operator ports to implement initiatives that deal with sustainability differ as well. Operator ports are generally better equipped to handle and identify sustainability opportunities and implement sustainability initiatives than their landlord counterparts. Operator ports have the advantage of making and implementing decisions about sustainability “in house.” Landlord ports, on the other hand, must seek out and provide information about sustainability initiatives to their tenants and then provide targeted incentives to spur tenant action. However, there is no guarantee these incentives will be sufficient to convince tenants of the benefits of sustainability, particularly if they can operate at the status quo without negative economic repercussions. Moreover, landlord ports are at a particular disadvantage if they lack a dedicated sustainability office, or staff committed to understanding and promoting sustainability initiatives. By instituting a more robust sustainability agenda that is underwritten by devoting resources and personnel in support of it, landlord ports can close the gap that exists between them and operator ports on the sustainability front. Otherwise, in the absence of a dedicated staff or office, the gathering, creating and disseminating of information about sustainability for use by tenants and the port authority itself becomes unmanageable. An example, in the case of the Port of New Orleans, clarifies the distinction between landlord ports and operator ports. New Orleans is a landlord port, making it an outlier among coastal ports. Many coastal ports lease out some of their facilities, operations, and infrastructure to tenants, but few operate entirely in this manner. For example, the Port of Charleston is an operator port but it also leases out two private terminals and the Port of Norfolk outsources day‐to‐day operations management to an organization that was established by the port but operates independently. Both ports are best classified as quasi‐public. The Port of Norfolk, however, may soon delegate these responsibilities to the Maersk Corporation, effectively transforming it into a landlord port.
The Port of New Orleans, on the other hand, currently leases out all of its operations. Therefore, the manner in which it must approach sustainability initiatives differs from approaches available to operator ports. Since the port does not maintain the vast majority of the equipment operating on‐site, port officials’ role in advancing sustainability initiatives involves only recommendation and information provision. They cannot unilaterally impose any kind of sustainability agenda. The Port Authority of New Orleans regularly provides information about sustainability opportunities, grants, and innovation to operators. From there, however, the operators have discretion over whether or not to pursue specific opportunities. This has resulted in the Port of New Orleans lagging behind many of its peers in terms of sustainability. The port currently lacks a sustainability office or a regular sustainability report (Port of New Orleans ‐ Director of Port Development).
42
By contrast, there is the example of the Port of Savannah, which is 100 percent publicly operated by the Georgia Port Authority at all terminals. Due to the direct control the port has over its operations, the Port of Savannah focuses more on upgrading and replacing their own equipment rather than creating incentives for tenants or customers to improve their sustainability independently. This has included updating their on‐site vehicles, lifters, cranes and facilities. To use an example from the inland port industry, the Port of Paducah is an operator port that uses its status to its advantage by making investment decisions that would be off limits to a landlord port. As previously mentioned, recently, the port has pushed forward with an initiative that will upgrade facilities to accommodate container on barge operations despite a lack of public funding, without having to negotiate with tenants and other stakeholders.
Each operating structure (landlord or operator port model) carries with it advantages and disadvantages in terms of port administration and, consequently, how effective a port can be at implementing programs designed to enhance sustainability. Table 3 documents some of the operational and structural differences across the most common varieties of port administration. Many large coastal ports fall under the designation of a public operating port (with the landlord model becoming increasingly dominant), while it is more common for inland ports to function as a private operator port. There are four main port‐operation models, which are based upon the respective responsibilities the public and private sectors assume at a port.
These models include:
1) Public operator port
2) Quasi‐public operator port
3) Landlord port (public and private)
4) Private port (operator and landlord)
Each of these models concerns ports that have different characteristics with respect to the ownership of the infrastructure, equipment, terminal operation and who provides certain port services (World Bank Port Reform Toolkit 2007). While public and quasi‐public operator ports mostly exist to promote public interests, landlord ports attempt to balance public and private interests. At the other end of the spectrum, private ports focus on maximizing the interests of their stakeholders. Public operator ports have the advantage of being able to make decisions about large‐scale infrastructure changes in‐house.
As such, they can implement sustainability policies without negotiating with tenants. Furthermore, decisions related to social sustainability (e.g. job creation and community relations), environmental sustainability (e.g. air quality, energy efficiency initiatives), and economic sustainability are not driven solely by port operators’ desire to increase profit
43
margins, and therefore can be made with public interest in mind. This freedom to make decisions also brings with it a set of disadvantages for public operator ports. First, there is little flexibility to resolve labor disputes because the port administration is the sole employer at the port itself. Second, there is the risk that resources are used inefficiently because public operator ports are under government control, and not guided by market‐driven logic. Third, these ports have limited access to private funding, and market response can be sub‐optimal because they must fulfill public needs. Among the ports visited by the KTC, the Port of Paducah, the Port of Houston, and the Port of Savannah all qualify as public operator ports (see Appendix A) (Association of Kentucky Riverports 2012, Port of Savannah Sustainability Report 2010, Port of Houston – Office of Public Relations).
Quasi‐public operator ports share functional characteristics with operator and landlord ports. Because of this situation, they experience both advantages and disadvantages regarding characteristics of operator and landlord ports. Quasi‐public operator ports are in an advantageous position to institute sustainability initiatives, especially those directly related to infrastructure improvement. They are typically more responsive to market demands, but also have to negotiate with fewer parties (as compared to landlord ports) when developing sustainability policies. However, quasi‐public operator ports also face challenges in the form of conflicts between port authorities and port operators on the question of sustainability. These ports also lack full control over onsite equipment and facilities, which means they cannot unilaterally impose regulations targeting their efficiency and sustainability. Because quasi‐public operator ports are not controlled fully within the public domain, operational imperatives can force port administrators to place private interests ahead of the public interest. These disadvantages all work against creating a robust sustainability program. Among the ports visited by the KTC, the port of Norfolk fits this model (see Appendix A).
The most common port management model, across both private and public ports, is the landlord port. At landlord ports, terminals (and other elements of the infrastructure) are leased to private companies while the port authority retains ownership of the land on which the port is sited. Typically, private companies (e.g. shippers) enter into a concession agreement with the port. This form of agreement establishes a long‐term lease that gives companies the ability to use port facilities in exchange for rent.
The private operator using port facilities is often responsible for providing their own terminal equipment that conforms to pre‐established operational standards. The landlord model presents a mixed bag with respect to successfully instituting changes that improve a port’s sustainability. The principal advantage of using the landlord model is that the port authority can outsource the expenses associated with sustainability upgrades to tenants that lease terminals. However, this is also the main weakness of the landlord model, and speaks to the difficulty of sustainability initiatives taking hold in these environments. While the port itself does not have to pay for equipment or facility upgrades, port authorities must persuade their tenants that such upgrades are vitally necessary, and that achieving a more sustainable form of operations gives private operators a comparative advantage over companies with large shipping bases located at ports uncommitted to sustainability. This can be a tough sell, particularly if tenants cannot expect to realize financial benefits in the near‐term. The Ports of
44
Memphis, New Orleans, Louisville, New York, Antwerp, Rotterdam and Singapore all fall under this categorization (see Appendix A).
The last category of ports discussed in this report, are those that are private. Many of the ports that exist along the inland waterways of the U.S. fall under this category. As their name suggests, private ports are owned and operated by private businesses or shareholders. There are further distinctions to make, however. Private ports can function as wholly private organizations that have been developed in response to specific business opportunities. Some are offshoots of larger corporations that ship large quantities of goods via inland waterways. In these situations, it is financially prudent to own and have access to, a port facility that is entirely dedicated to a particular company’s needs. The remainder of private ports is the outcome of privatizing a formerly public facility, with the mandate that it retain its maritime role. Chuck Knowles, of the Kentucky Transportation Center (KTC), notes that public inland river ports have proven to be just a small portion of the total number of river ports along the inland waterways. Knowles observed in a recent report on inland waterways that KTC has identified “over 300 river ports on both sides of the (Ohio) river. Public ports provide major economic benefits to their local communities through jobs and through other services. In the bigger picture, they are a contributor to the transportation system in moving freight, but they are by no means the major player. I would consider the major players to be the coal‐fired power plants along the river that have coal shipped to them on the barges” (Lane Report, 2012).
This is an important caveat for the inland port industry. Due to the abundance of coal that is shipped along the inland waterways (approximately 20 percent of total volume) many of the coal power plants along the river have constructed private ports at their facilities that allow them to bring the coal directly to the plant from the waterways. In addition to coal‐fired power plants having a stake in the private port market, companies such as Cinbulk Terminals Incorporated (a Cincinnati‐based outfit) have stepped into fill niches in the coal market as well. Cinbulk provides corporations such as Proctor & Gamble with direct access to coal. The company is owned and operated by a small group of shareholders, and is a relatively small operation. However, Cinbulk has proven successful in providing just–in‐time service (of coal deliveries) for one of the world’s largest corporations.
While many public inland ports are operating on tight budgets, Cinbulk has flourished even as the market for coal has diminished. Cinbulk’s coal business is down 600,000 tons per year from only a few years ago. Coal has traditionally been the main commodity handled by the port. As a result, increased competition from natural gas (which has been falling in price) threatens the port’s business model, and consequently its economic sustainability. In response to these concerns, port officials have aggressively diversified the commodities the port handles. To this end, the port elected not to invest in container on barge. Cinbulk investigated container on barge potential – ultimately concluding it is unviable at the present time.

45
Instead, the port has sought to increase its handling of alternative break bulk and aggregate commodities. This entails seeking out opportunities to handle commodities such as pig iron, petroleum coke, rolls of steel sheets, bagged minerals, and palletized cargo. Port administrations have also decided to provide value‐added to the coal they do transport by maintaining onsite coal processing plants, which enables them to sort coal according to size and chemical composition to meet customer demands. This allows the port to leverage a competitive advantage, saving their customers the time and expense involved with coal passing through multiple handlers.
Alternatively, the Port of Norfolk offers a potential future example of the privatization of a formerly public port, should plans to adopt the Maersk Corporation as its sole operator come to pass. In 2010, the Virginia Port Authority entered into a 20‐year lease agreement with Netherlands‐based APM Terminals (a division of the Danish A.P. Moller‐Maersk Group) effectively giving the agency control over all operations at one of the port’s terminals, specifically the APM Terminal located in Portsmouth. The highly automated $450 million terminal is one of the most technologically advanced in the world. In May, 2012 APM submitted a proposal to return to the Commonwealth of Virginia its Portsmouth container terminal and provide additional cash payments in exchange for being granted full control over Hampton Roads’ port operations. The Commonwealth of Virginia is currently considering the proposal (Port of Norfolk – Office of Public Affairs).
As with other port operating schemes, there are advantages and disadvantages to the private port model. Private ports can cater to market imperatives rapidly, which results in high levels of flexibility, placing them in a better position to fortify their economic sustainability. However, because market concerns drive port operations, decisions are made to maximize returns on investment and accordingly the financial bottom line. This is a stance that can be incompatible with promoting a progressive agenda with respect to environmental or social sustainability. Lacking a demand for increased sustainability from their customers, private ports often have little incentive to aggressively pursue policies and initiatives that will set them on a holistically sustainable path (World Bank Port Reform Tool Kit, 2007).
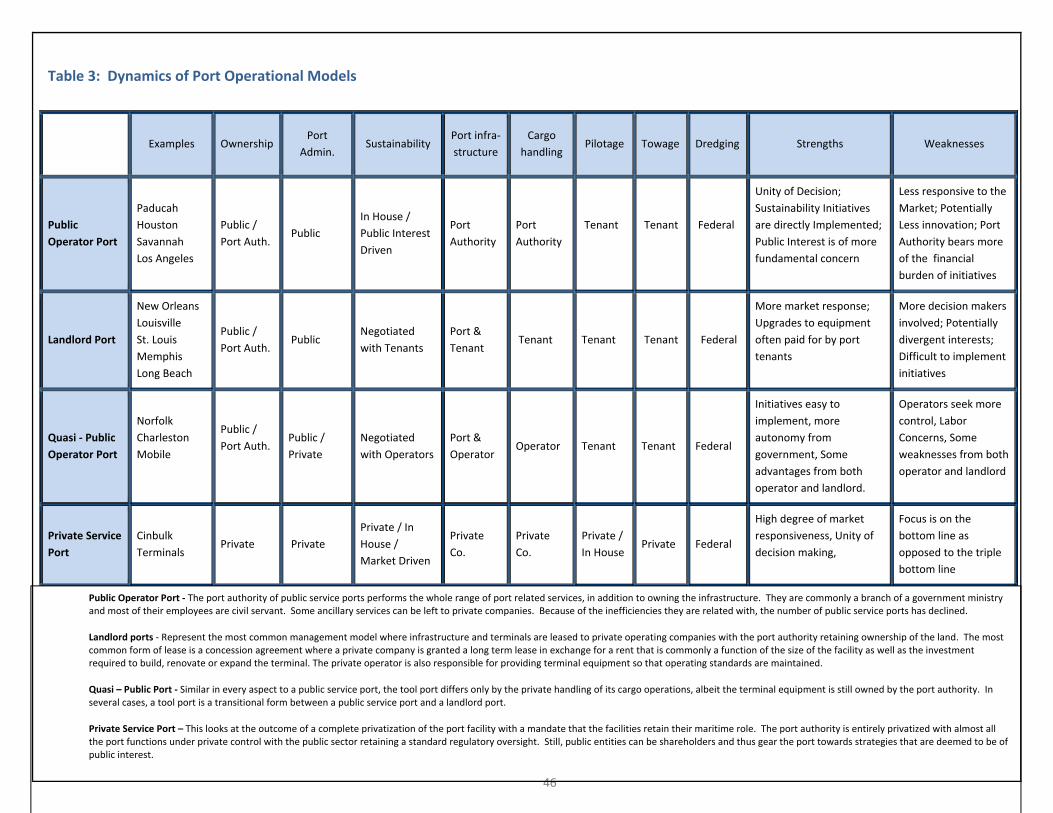
46
Table 3: Dynamics of Port Operational Models
Source: Adapted from The World Bank (2007) Port Reform Toolkit, Second Edition
Examples
Ownership Port
Admin. Sustainability
Port infra‐
structure
Cargo
handling Pilotage Towage Dredging
Strengths
Weaknesses
Public
Operator Port
Paducah
Houston
Savannah
Los Angeles
Public /
Port Auth. Public
In House /
Public Interest
Driven
Port
Authority
Port
Authority
Tenant
Tenant
Federal
Unity of Decision;
Sustainability Initiatives
are directly Implemented;
Public Interest is of more
fundamental concern
Less responsive to the
Market; Potentially
Less innovation; Port
Authority bears more
of the financial
burden of initiatives
Landlord Port
New Orleans
Louisville
St. Louis
Memphis
Long Beach
Public /
Port Auth. Public
Negotiated
with Tenants
Port &
Tenant Tenant
Tenant
Tenant
Federal
More market response;
Upgrades to equipment
often paid for by port
tenants
More decision makers
involved; Potentially
divergent interests;
Difficult to implement
initiatives
Quasi ‐ Public
Operator Port
Norfolk
Charleston
Mobile
Public /
Port Auth.
Public /
Private
Negotiated
with Operators
Port &
Operator Operator Tenant Tenant Federal
Initiatives easy to
implement, more
autonomy from
government, Some
advantages from both
operator and landlord.
Operators seek more
control, Labor
Concerns, Some
weaknesses from both
operator and landlord
Private Service
Port
Cinbulk
Terminals
Private Private
Private / In
House /
Market Driven
Private
Co.
Private
Co.
Private /
In House Private Federal
High degree of market
responsiveness, Unity of
decision making,
Focus is on the
bottom line as
opposed to the triple
bottom line
Public Operator Port ‐ The port authority of public service ports performs the whole range of port related services, in addition to owning the infrastructure. They are commonly a branch of a government ministry and most of their employees are civil servant. Some ancillary services can be left to private companies. Because of the inefficiencies they are related with, the number of public service ports has declined.
Landlord ports ‐ Represent the most common management model where infrastructure and terminals are leased to private operating companies with the port authority retaining ownership of the land. The most common form of lease is a concession agreement where a private company is granted a long term lease in exchange for a rent that is commonly a function of the size of the facility as well as the investment required to build, renovate or expand the terminal. The private operator is also responsible for providing terminal equipment so that operating standards are maintained.
Quasi – Public Port ‐ Similar in every aspect to a public service port, the tool port differs only by the private handling of its cargo operations, albeit the terminal equipment is still owned by the port authority. In several cases, a tool port is a transitional form between a public service port and a landlord port.
Private Service Port – This looks at the outcome of a complete privatization of the port facility with a mandate that the facilities retain their maritime role. The port authority is entirely privatized with almost all the port functions under private control with the public sector retaining a standard regulatory oversight. Still, public entities can be shareholders and thus gear the port towards strategies that are deemed to be of public interest.
46

47
Sustainable Infrastructure
Based on conversations with officials at port authorities, there are three interlocking levels of concern that must be addressed to enhance port infrastructure sustainability:
1) Existing port land, facilities, and equipment
2) Existing tenant facilities and equipment
3) Regional concerns
These levels of concern mirror in many ways the zones of control discussed in the previous structure. Upgrades to existing port infrastructure and tenant infrastructure overlap, and cover many of the same items. The parties responsible for making those upgrades are determined by whether the port in question is an operator or landlord port. Operator ports generally have more control over port infrastructure upgrades, but they also incur a substantial financial burden to do so. The upgrades covered under this heading are improvements to cranes, vehicles, buildings, and other equipment. Sometimes decisions related to dredging fall under this category as well. All ports are situated within specific contexts, or more aptly, regions. Therefore, addressing regional concerns is a salient topic for enhancing port sustainability.
Regional concerns take into account factors such as intermodal connectivity, port expansion, intra‐coastal waterway maintenance, and community interaction. Ports can only exercise limited influence over regional matters; landlord ports are typically able to exert less influence than operator ports. The above listed regional concerns all have a direct bearing on a port’s infrastructure, however, irrespective of whether they are directly influenced by the port. Consequently, how a port handles its relationships with stakeholders and how it interacts within the broader regional socio‐economic context can be as important as how it handles equipment upgrades for improving sustainability.
With respect to existing port facilities, many coastal ports have directed significant investments towards increasing intermodal connectivity. Intermodal connectivity refers to the connections a port has with road, rail, pipe, and air infrastructure. It also encompasses the port’s ability to easily transition materials from one mode to another. A port with a diverse range of intermodal connectivity is more likely to be economically sustainable because it can handle a range of goods passing through its facilities (further, robust connectivity enhances trade flows). However, most ports are not fully diversified in this regard as individual ports typically specialize in particular modal connections. There are several reasons for this, the most important of which is that specialization allows a port to lure and maintain targeted clients. Perhaps more crucially, investing in infrastructure to increase modal splits is financially burdensome, and can threaten the economic standing of a port. Thinking long‐term, however, a solid network of intermodal connections promises to improve the triple bottom line.
48
Building and maintaining intermodal connections requires careful and nuanced supply chain management. However, a port looking to expand its intermodal connections must coordinate with local, federal, and state‐level governments to secure funding for upgrades. During the upgrade process, port administrators must also work with warehouses, transportation providers, shippers, and distribution networks to ensure the investments produce a transportation network that is resilient and meets the needs of all stakeholders. Without orchestrating these changes with all stakeholders, the likelihood of investments paying off decreases substantially (Cheon and Deakin 2010).
A recent example of financial investments successfully expanding a port’s intermodal connectivity is the Lynn Creek Rail Bridge at the Port Metro Vancouver. Constructing this bridge has enabled the port to accommodate longer trains, making rail transport a more efficient option. This scenario decreases the port’s reliance on transportation via trucks, which is the least sustainable method to move freight. An added benefit of the project is the reduction in noise that neighboring communities experience. The use of longer trains decreases the frequency with which they pass in and out of the area because they hold more cargo (Port Metro Vancouver Sustainability Report 2011).
Another instance of a port investing in intermodal connectivity has occurred at Cinbulk Terminals Incorporated, located in Cincinnati, Ohio (the Port of Cincinnati). In 2012 the port began a project aimed at relocating its truck and rail loading yards. Once completed, this will minimize the number of times a commodity is handled before it is shipped from the port. Furthermore, it will reconfigure the port’s modal split, with more cargo being diverted to rail lines and away from trucking. Infrastructure investments such as these are significant in their capacity to bolster the triple bottom line of sustainability.
More traditionally, investments targeting infrastructure sustainability have focused on the direct upgrading of equipment and facilities. A common investment of this type includes switching from diesel‐powered cranes and rubber‐tired gantries to those operating on electric power. Another example is upgrading vehicles to run on electric power, or in the case of landlord ports, providing incentives to tenants that make similar upgrades. Investments of this variety take place at a number of ports across the U.S. and internationally every year. For example, coastal operator ports (such as the Port of Savannah) are investing heavily in upgrading the equipment they own across all aspects of their operations. Other ports (such as the Port of New Orleans) are finding it more difficult to make such large‐scale changes and must focus on smaller, non‐infrastructure based improvements. This is not dissimilar to the situation most inland ports find themselves in.
Inland ports – both operator and landlord – tend to shy away from large‐scale infrastructure investment because of the substantial financial outlays required. When they do make such investments, they usually involve the replacing or upgrading of individual pieces of equipment. One example of such a sustainable infrastructure investment at an inland port is the aforementioned crane renovation currently underway at the Port of Paducah. The port has invested $4 million in crane and terminal upgrades for the purpose of facilitating container on
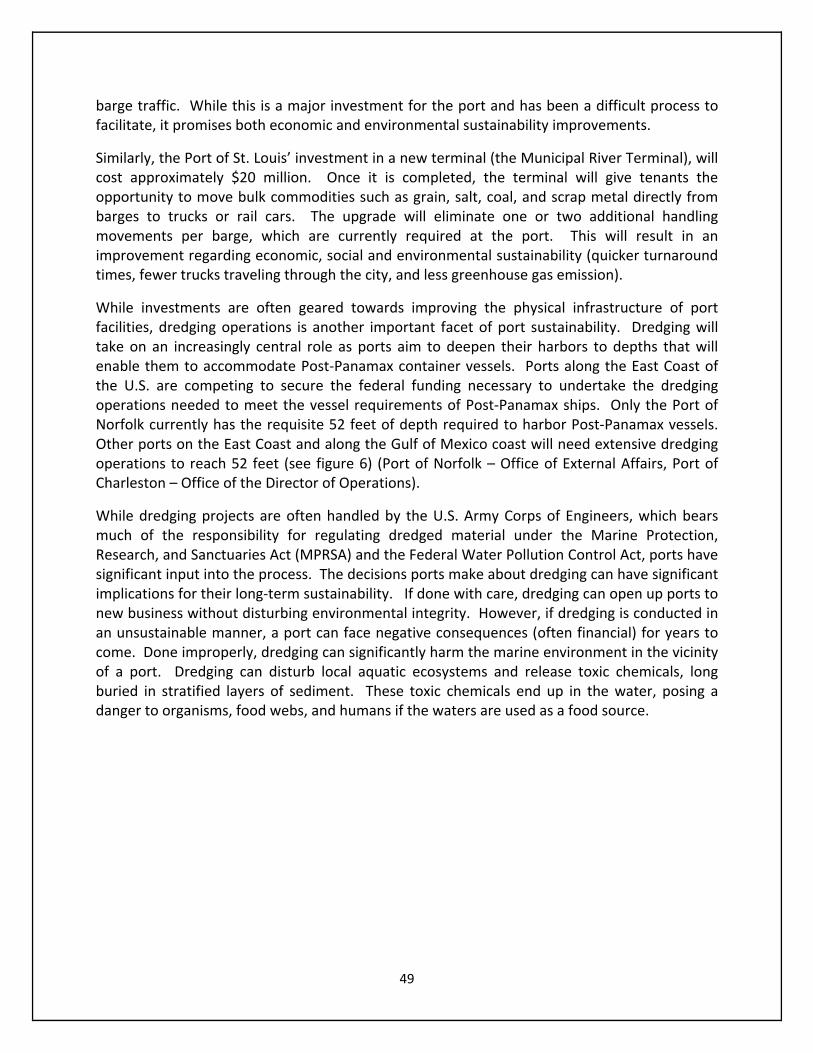
49
barge traffic. While this is a major investment for the port and has been a difficult process to facilitate, it promises both economic and environmental sustainability improvements.
Similarly, the Port of St. Louis’ investment in a new terminal (the Municipal River Terminal), will cost approximately $20 million. Once it is completed, the terminal will give tenants the opportunity to move bulk commodities such as grain, salt, coal, and scrap metal directly from barges to trucks or rail cars. The upgrade will eliminate one or two additional handling movements per barge, which are currently required at the port. This will result in an improvement regarding economic, social and environmental sustainability (quicker turnaround times, fewer trucks traveling through the city, and less greenhouse gas emission).
While investments are often geared towards improving the physical infrastructure of port facilities, dredging operations is another important facet of port sustainability. Dredging will take on an increasingly central role as ports aim to deepen their harbors to depths that will enable them to accommodate Post‐Panamax container vessels. Ports along the East Coast of the U.S. are competing to secure the federal funding necessary to undertake the dredging operations needed to meet the vessel requirements of Post‐Panamax ships. Only the Port of Norfolk currently has the requisite 52 feet of depth required to harbor Post‐Panamax vessels. Other ports on the East Coast and along the Gulf of Mexico coast will need extensive dredging operations to reach 52 feet (see figure 6) (Port of Norfolk – Office of External Affairs, Port of Charleston – Office of the Director of Operations).
While dredging projects are often handled by the U.S. Army Corps of Engineers, which bears much of the responsibility for regulating dredged material under the Marine Protection, Research, and Sanctuaries Act (MPRSA) and the Federal Water Pollution Control Act, ports have significant input into the process. The decisions ports make about dredging can have significant implications for their long‐term sustainability. If done with care, dredging can open up ports to new business without disturbing environmental integrity. However, if dredging is conducted in an unsustainable manner, a port can face negative consequences (often financial) for years to come. Done improperly, dredging can significantly harm the marine environment in the vicinity of a port. Dredging can disturb local aquatic ecosystems and release toxic chemicals, long buried in stratified layers of sediment. These toxic chemicals end up in the water, posing a danger to organisms, food webs, and humans if the waters are used as a food source.

50
Figure 8: Size of Container Vessels in Operation
Source: South Carolina Port Authority
Despite the potential for negative consequences, dredging can yield business advantages to ports by expanding their customer bases, and done correctly or in tandem with other environmental restoration projects, can actually enhance sustainability. For example, the Port Metro Vancouver diverts over 70 percent of the material it dredges to reclamation projects, which reduces surface water pollution (see Figure 5 ‐ Port Metro Vancouver Sustainability Report 2011). Similarly, the Port of Norfolk has repurposed dredge material to create an artificial island (Craney Island) across the bay from its main terminals (see figure 6). Once construction is completed the island will serve as an additional break‐bulk terminal and will have been constructed almost entirely from remnant dredge material excavated during deepening of the Hampton Roads Harbor (Virginia Port Authority).
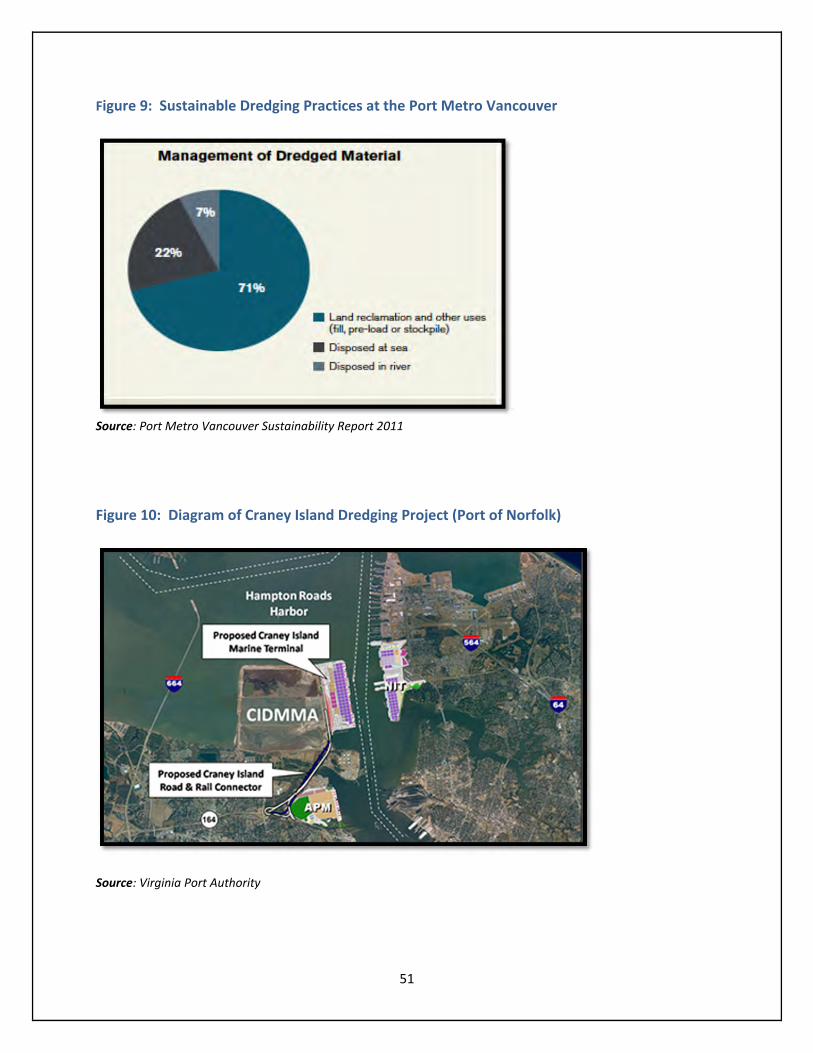
51
Figure 9: Sustainable Dredging Practices at the Port Metro Vancouver
Source: Port Metro Vancouver Sustainability Report 2011
Figure 10: Diagram of Craney Island Dredging Project (Port of Norfolk)
Source: Virginia Port Authority

52
Lastly, any discussion of port infrastructure sustainability is incomplete without mentioning the Panama Canal expansion, and the responses this has elicited from ports along the Eastern Seaboard of the U.S. The main purpose of the expansion is to enlarge the Panama Canal so that it can accommodate larger container vessels. This has spurred ports along the U.S. Eastern Seaboard to make significant infrastructure investments. Included among these investments is dredging to allow for deeper births, the widening of channels, and the retrofitting of terminals to accept the larger vessels.
Most experts agree that the expansion will lead to the larger Panamax ships, which have traditionally serviced the West Coast, to gain a larger presence on the East Coast. While on the West Coast, ports will host the even larger Post‐Panamax vessels. While it is expected that these changes will increase traffic at coastal ports in the Eastern U.S., there is still uncertainty over what impact these changes will have on the inland waterway system. Although there are no guarantees that inland ports will enjoy a boon in traffic, some inland ports have decided to move forward with investments designed to bolster infrastructure, enabling it to facilitate increased traffic. Similar to the previously discussed example of the Port of Paducah’s investment in container‐on‐barge, other inland ports are making infrastructure investments in hopes of increased general traffic. According to a report by the American Association of Port Authorities, U.S. ports plan to spend more than $46 billion over the next five years to prepare for the Panama Canal expansion (AAPA, 2012).
Energy Efficiency as Sustainability
A wide range of options are available to improve the energy sustainability of ports. Some of these options are low‐cost initiatives that will lead to small but meaningful improvements in sustainability. The least expensive options are usually simple measures – switching out traditional incandescent light bulbs with compact fluorescent bulbs in all port facilities. Another option is to install timers on lighting systems to ensure no energy is wasted when facilities go unused.
The Port of Savannah has used photosensitive switches on lighting systems, resulting in a 30 percent savings on lighting costs. Renewable power purchasing programs have also been integrated into the policy plans of ports aiming to increase sustainability. Such programs can be seen in the sustainability reports of the Port of Los Angeles and the Port of Seattle. As a port puts into effect a number of these small energy initiatives, the cumulative effects produce impressive results. For example, Port Metro Vancouver, in its 2011 sustainability report, calculates it has reduced electricity consumption by 13 percent just by installing zone lighting, occupancy sensors, and halogen light bulbs (Port Metro Vancouver – Sustainability Report 2011, Port of Los Angeles Sustainability Report 2011, Port of Seattle Sustainability Report 2011).
Large‐scale energy savings initiatives usually require significantly higher investments. The Port of Antwerp has invested heavily in wind and solar power, building the largest wind farm in Belgium, and creating one of the largest solar arrays in the region. While these investments required substantial financial outlays, the return on investment has been immense. For example, in 2011, the port generated sufficient excess energy to meet the consumption needs

53
of 74,000 families. It sold this energy back to the state, which helped to offset initial expenditures (Port of Antwerp Sustainability Report 2010).
Similarly, Port Metro Vancouver has commissioned research studies to examine the feasibility of recapturing the port’s residual heat, as well as into the potential for converting its biomass waste into electricity (Port Metro Vancouver Sustainability Report 2011). Likewise, the Port of Savannah has invested heavily to upgrade most of its equipment to run on electric power (90 percent of their Rubber Tyred Gantries (RTGs) are now powered by electricity, which has reduced diesel fuel consumption at the port by 70 percent). The port has also electrified its refrigerated container racks, switched to low sulfur diesel engines on trucks, and has upgraded its main offices to achieve LEED silver certification (Georgia Port Authority). Another avenue for furthering energy sustainability is through vehicle upgrades. The Port of Norfolk, for example, invested in two hybrid‐electric locomotives for use on port grounds. They also replaced the gantry cranes with versions that store energy from the movement of containers, which can then be used to generate electricity for use by port facilities (Port of Norfolk – Office of External Affairs).
Such significant investments targeting energy savings, however, place a considerable financial burden on ports. Smaller ports with fewer tenants and less business face difficulties acquiring the funds needed to undertake large‐scale projects. Some inland ports, because they lack the size and revenues of larger coastal ports, are well suited to focus initially on small‐scale projects that gradually trim their energy usage. They should also look to other areas in which smaller investments can produce meaningful improvements in sustainability. While inland ports typically lack the financial resources to completely overhaul their energy consumption practices, this does not exclude them from achieving savings. Most inland ports will simply have to adopt strategies which incrementally reduce their use of energy.
Alternatively, opportunities to create partnerships with utilities companies may offer another route to energy sustainability. For example, the Port of San Diego has set up a collaborative effort with San Diego Gas and Electric to improve energy efficiency, education, and planning. The goal of the collaboration is a long‐term reduction in port energy usage. To achieve this goal the collaboration has received permission from local government to use funds from California utilities customers (under the auspices of the California Public Utilities Commission) to create several projects. These projects include an energy efficiency education program, a program for the tracking of energy usage at port buildings relative to consumption at similar facilities in the region, and a port‐wide energy efficiency audit. The collaboration demonstrates a strong example of a port authority, the private sector, and local government working together to achieve sustainability results not possible by the port alone (Port of San Diego Green Port Program Guide 2011).
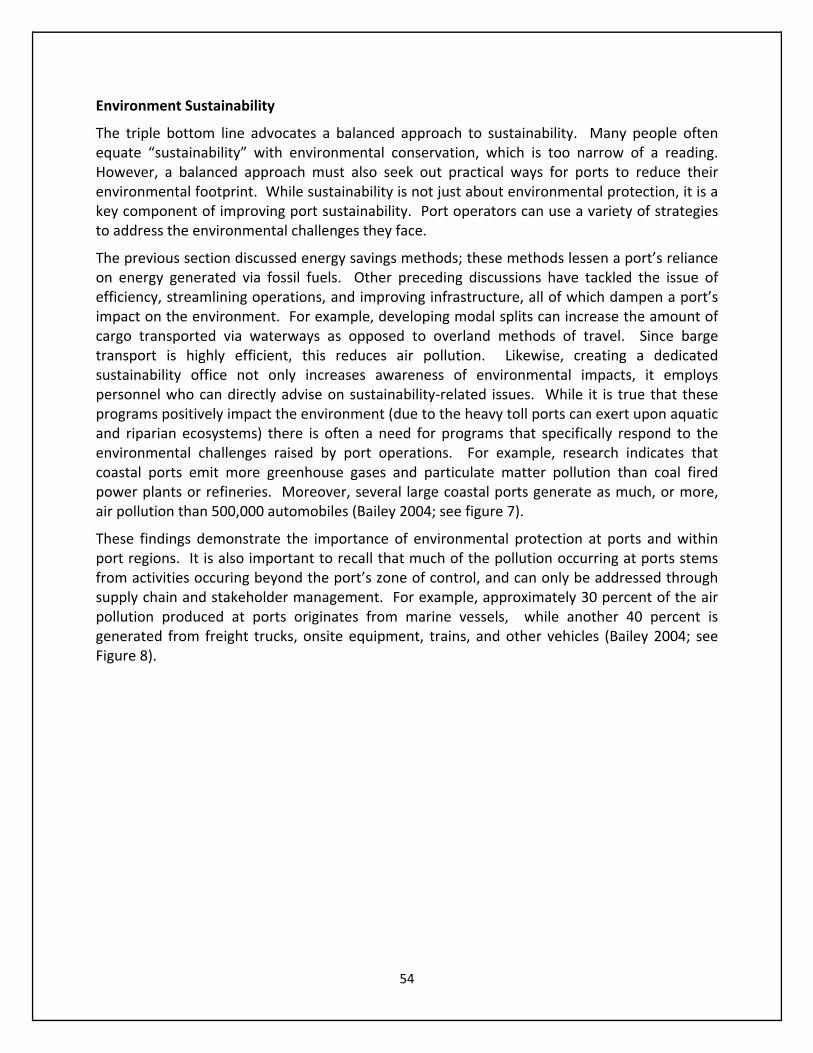
54
Environment Sustainability
The triple bottom line advocates a balanced approach to sustainability. Many people often equate “sustainability” with environmental conservation, which is too narrow of a reading. However, a balanced approach must also seek out practical ways for ports to reduce their environmental footprint. While sustainability is not just about environmental protection, it is a key component of improving port sustainability. Port operators can use a variety of strategies to address the environmental challenges they face.
The previous section discussed energy savings methods; these methods lessen a port’s reliance on energy generated via fossil fuels. Other preceding discussions have tackled the issue of efficiency, streamlining operations, and improving infrastructure, all of which dampen a port’s impact on the environment. For example, developing modal splits can increase the amount of cargo transported via waterways as opposed to overland methods of travel. Since barge transport is highly efficient, this reduces air pollution. Likewise, creating a dedicated sustainability office not only increases awareness of environmental impacts, it employs personnel who can directly advise on sustainability‐related issues. While it is true that these programs positively impact the environment (due to the heavy toll ports can exert upon aquatic and riparian ecosystems) there is often a need for programs that specifically respond to the environmental challenges raised by port operations. For example, research indicates that coastal ports emit more greenhouse gases and particulate matter pollution than coal fired power plants or refineries. Moreover, several large coastal ports generate as much, or more, air pollution than 500,000 automobiles (Bailey 2004; see figure 7).
These findings demonstrate the importance of environmental protection at ports and within port regions. It is also important to recall that much of the pollution occurring at ports stems from activities occuring beyond the port’s zone of control, and can only be addressed through supply chain and stakeholder management. For example, approximately 30 percent of the air pollution produced at ports originates from marine vessels, while another 40 percent is generated from freight trucks, onsite equipment, trains, and other vehicles (Bailey 2004; see Figure 8).
55
Figure 11: Greenhouse Gas Pollution Generated by Ports vs. Refineries, Power Plants & Automobiles
Source: Bailey (2004)
With respect to what measures ports may address “in house,” many coastal ports are dedicated to recycling when possible. This contributes to enhancing the sustainability profiles of these facilities. Inland ports that lack recycling programs are well‐advised to institute them quickly, because it is an inexpensive method of lowering their environmental impact. Recycling programs demand only minor changes in the institutional cultures of ports. Such intiatives encompass a range of activities, from placing recycling containers in offices and cafeterias, to running dedicated programs at warehouses and storage yards and becoming recycling hubs for surrounding communities.
On a similar note, using supplies such as post‐consumer recycled paper can put a significant dent in a port’s environmental footprint. For example, in 2010 the Port of Los Angeles introduced requirements that 100 percent of the paper it consumes contains 30 percent post‐consumer recycled content, and converted nearly 3000kgs of organic waste into compost instead of sending it to landfills (Port of Los Angeles Sustainability Report 2010). The Port of Antwerp, in 2011, started construction on a biomass power plant that converts waste into energy, and promises to lower its greenhouse gas emissions by 20 percent once completed. Combined with its commitment to wind energy, the Port of Antwerp esimates that 85 percent of its electricity supply will be traceable to renewable sources by 2020 (Port of Antwerp –Sustainability report 2012).
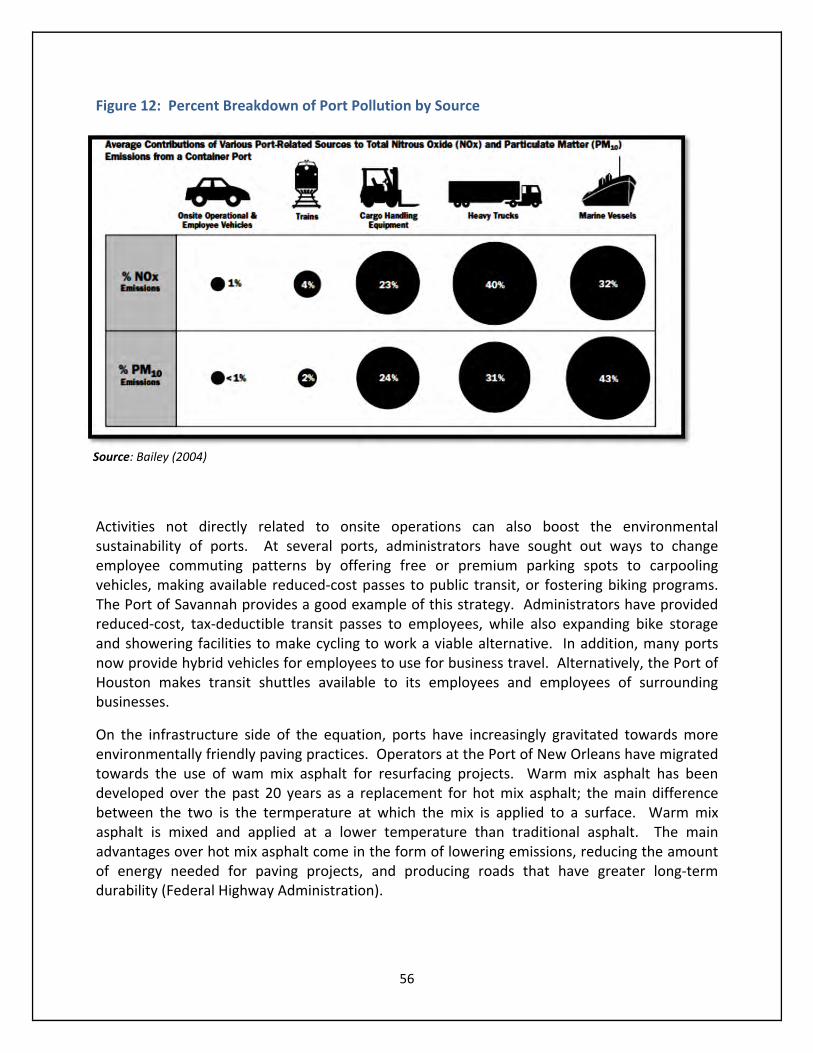
56
Figure 12: Percent Breakdown of Port Pollution by Source
Source: Bailey (2004)
Activities not directly related to onsite operations can also boost the environmental sustainability of ports. At several ports, administrators have sought out ways to change employee commuting patterns by offering free or premium parking spots to carpooling vehicles, making available reduced‐cost passes to public transit, or fostering biking programs. The Port of Savannah provides a good example of this strategy. Administrators have provided reduced‐cost, tax‐deductible transit passes to employees, while also expanding bike storage and showering facilities to make cycling to work a viable alternative. In addition, many ports now provide hybrid vehicles for employees to use for business travel. Alternatively, the Port of Houston makes transit shuttles available to its employees and employees of surrounding businesses.
On the infrastructure side of the equation, ports have increasingly gravitated towards more environmentally friendly paving practices. Operators at the Port of New Orleans have migrated towards the use of wam mix asphalt for resurfacing projects. Warm mix asphalt has been developed over the past 20 years as a replacement for hot mix asphalt; the main difference between the two is the termperature at which the mix is applied to a surface. Warm mix asphalt is mixed and applied at a lower temperature than traditional asphalt. The main advantages over hot mix asphalt come in the form of lowering emissions, reducing the amount of energy needed for paving projects, and producing roads that have greater long‐term durability (Federal Highway Administration).
57
Alternatively, the Port of Savannah has invested in a research program to study the benefits of switching over to a wildlife friendly concrete (ECOncrete) for projects that create structures in direct contact with the water. ECOncrete boasts a lower pH than regular cement, and a distinctive honeycombed surface. The purpose of these features is to attract filter feeders to the area, which purify water, while enhancing the ecological integrity of the aquatic ecosystems in the vicinity of port terminals (Georgia Port Authority – Office of Environmental Stewardship). The measures listed above can be taken by the port authorities themselves, however, there are many challenges that rest outside ports’ zone of control to confront. These challenges deal principally with supply chain management and stakeholder relationships. Ports which have successfully dealt with both sides of this equation share two common traits. First, either through incentives or regulations, they have developed policies in coordination with stakeholders up and down their supply chains. These policies aim to improve environmental sustainability.
The Ports of Antwerp, Los Angeles, and Vancouver, respectively, operate water‐to‐land waste disposal programs, which require that all vessels traveling by sea or inland waterway deposit their waste on land. This dramatically reduces the amount of pollutants entering surface waters. Similarly, many ports have introduced idling and emissions restrictions on trucks and vessles using port facilities. The tightness of these restrictions varies between ports, however. The Ports of Seattle, Savannah, and Vancouver have started intiatives that will install electrical hook‐ups that hybrid trucks may connect to while idling. This provides a small incentive for vehicle operators to invest in such technology, although it is unclear how substantial the return on investment for those operators will be.
Increasingly, ports are forming coalitions with one another to compel actors residing outside their zone of control to adhere to new conventions regarding sustainability. Port Metro Vancouver and the Ports of Seattle, Tacoma, and Los Angeles have shown this strategy is viable. Administrators at these ports have united to impose restrictions that are intended to phase out older truck models. They have also placed mandatory idling limits on newer models (Port Metro Vancouver Sustainability Report 2011). The Ports of Oakland, Los Angeles, and Long Beach have agreed to adopt the standards oulined by the San Pedro Bay Ports Clean Air Action Plan. This places stringent limits on the types of fuel that can be used by shippers and carriers, but coordination extends beyond inter‐port agreements. Ports have begun working with local, regional, and federal government agencies to create an operating environment that strongly encourages stakeholders to proactively adopt a sustainability agenda (Cheon and Deakin 2010).
Coordination with government agencies can be instrumental for implementing policies when stakeholders are reluctant to take initiative on their own. The California Goods Movement Act offers one example of port‐government coordination. This legislation forced transportation industries to convert to low‐sulfur diesel fuels. Prior to this legislation, the Port of Los Angeles had worked unsuccessfully for several years to have stakeholders make this switch. These examples illustrate that coordination between ports, in addition to forming robust relationships between ports and multiple levels of government, that are crucial for bringing about policy changes that will positively benefit the environment.

58
For environmental regulations to be successful, it is crucial that they are enforced with uniformity and fairness. This prevents stakeholders from losing a competitive advantage as customers take their business to ports with less onerous restrictions. In 2009, the Ports of Los Angeles, Oakland, and Long Beach were required by California to impose a user fee on containers. The intent of this regulation was to draw down the level of pollution created by the transportation system. However, this fee instigated a backlash among customers, who quickly relocated to nearby ports that did not require the additional fees. The San Pedro Bay ports arrived at a solution to this problem by working with the state government to develop a new program that treated user fees as a substitute to the typical fees imposed by the state (Cheon and Deakin 2010). This example reinforces the idea that collaboration between ports, and between ports and government agencies, are needed to move efforts to increase port sustainability forward. This scenario will minimize or avoid harmful financial consequences for all stakeholders.
While perhaps not as central to achieving environmental sustainability, programs that raise public awareness of port initiatives designed to foster a more sustainable environment publicize the industry, and the contribution it is making to environmental improvement. These programs relay a positive image of ports to the public, while also addressing environmental concerns, and creating a space for dialogue between the public and the ports. Ports have introduced a variety of initiatives to meet these needs. These include coordinating community events, conducting visits to local schools, offering port tours and educational programs, starting trash collection projects, and promoting social integration within the surrounding communities (Port Metro Vancouver Sustainability Report 2011, Port of Norfolk, Port of Antwerp Sustainability Report 2012, Port of Houston Sustainability Report 2010). In Kentucky, a number of organizations perform this outreach. The Seaman’s Church Institute and the Inland Waterway’s museum in Paducah, for example, emphasize public outreach and educational work, as do barge lines operating in the area (Ingram Barge Incorporated).
Safety and Security as Sustainability Initiatives
Overlooked components of sustainability are the related issues of safety and security, yet these topics are regularly reported upon in most assessments of port sustainability. Many coastal ports systematically coordinate with regulatory agencies such as U.S. Customs, the U.S. Coast Guard, and the Department of Homeland Security to safeguard the cargo that passes through U.S. ports, and to ensure it does not pose an imminent security threat. Likewise, ports stringently monitor the practices of all third party contractors operating on port facilities (Georgia Port Authority. Early monitoring removes the need for regulatory action later on, and safeguards the health and well‐being of personnel working at a port, as well as that of the general public. Similarly, sustainability reports generally integrate emergency response plans and protocols. For inland ports looking to devise more comprehensive emergency response plans, a reliable strategy is to follow the guidelines contained in existing federal response plans as a template.
59
However, it is important that each port appropriately scale their plans. Scalability is important as it matches up responses to the size of an event, and allows individual ports to determine how best they can respond to emergency situations given the size of their facilities (Virginia Port Authority). Because inland ports house smaller operations than coastal ports, scalability is particularly important for crafting appropriate safety and security initiatives. Mundane safety initiatives such as installing smoke detectors, having the requisite firefighting equipment on hand, and emergency planning are small steps ports can take, which can significantly improve response time to accidents or other situations demanding an immediate emergency response.
Many ports have introduced initiatives geared towards improving the health and safety of employees. Port Metro Vancouver and the Port of Los Angeles require their workers to regularly attend training sessions dealing with these issues, and they have also established Health and Safety Committees. For example, Port Metro Vancouver has a safety committee that represents all employees and contractors working at the facility as a way to maintain secure working conditions (Port Metro Vancouver Sustainability Report 2011, Port of Los Angeles Sustainability report 2011). The Port of Houston, in a similar fashion, offers health and wellness programs free of charge to their employees. At first glance, programs like these appear to have little connection to sustainability. Recall that the triple bottom line stresses issues of social equity and wellbeing. If workers do not feel safe at their jobs, or compromise their health by working at them, it negatively affects the overall functioning of a port. Consequently, it is in the financial interest of ports to maintain healthy workforces. A healthy workforce is more likely to keep a port running at the most efficient level possible.
Beyond safety initiatives designed to protect employees, inland ports need to define specific practices for safely handling hazardous materials that move through their facilities (or which are stored there on a semi‐permanent basis). Inland ports can stand to improve significantly in this area. Often, hazardous and toxic cargo remains on barges at ports adjacent to major cities or important thoroughfares without receiving sufficient protection against tampering. While there are gains to be made in this area, it is important to recognize that moving cargo along the inland waterway system remains the safest and most reliable form of transportation.
This is particularly true for hazardous materials shipments. For every one fatality attributable to inland water transport, 155 deaths will result from transportation via trucks (National Waterways Council 2012; Kruse, Protopapas, and Olson 2012). Moreover, barge transportation is far less likely to experience hazardous materials incidents than rail or truck transport. For inland towing, 2.59 gallons of hazardous materials are spilled per million ton‐miles. This compares favorably to rail and truck transportation, which averages 4.89 and 10.41 gallons of spilled hazardous materials per million ton‐miles, respectively. This provides clear evidence that inland ports and the inland waterway system more broadly, offer considerable safety advantages over other modes of transportation. Establishing more robust safety measures will only place further distance between inland waterway transport and other modes of moving goods (Kruse, Protopapas, and Olson 2012).

60
For coastal ports, customs security is of substantial importance. Following the September 11, 2001 terrorist attacks, the International Maritime Organization authored the International Ship and Port Facility Security Code, which took effect on July 1, 2004. The purpose is to obligate ports to introduce a number of precautionary measures designed to enhance their safety and security (International Maritime Organization ISPS Report 2004). The key imperative demanded by these regulations is that all containers arriving or leaving a terminal are scanned for radiation and made subject to random inspections. These random inspections are to be performed on a regular basis. Larger coastal ports have faced logistical problems because of these regulations ‐ radiation scans, along with random inspections, impedes the flow of commerce. To avoid disruptions, ports have devised a number of innovative technologies. For example, Spectroscopic Radiation scanners are now positioned at the entrances and exits of most coastal ports (see Figure 9). Portable x‐ray scanners are now commonplace; they can reliably analyze the contents of containers and detect suspicious materials without having to physically open them.
Figure 13: Depiction of Radiation Scanning Technology
Source: Virginia Port Authority

61
Achieving security goals is also possible by closely monitoring a port’s supply chain. All U.S. coastal ports coordinate with the U.S. Customs Office, which in turn requires updated information from shippers and carriers regarding the origin, destination, and contents of all containers. U.S. Customs communicates this information to ports, which enables them to reduce the number of containers that are graded as a perceived risk, and thus decrease the number that require scanning or manual inspection (Virginia Port Authority – Office of External Affairs, Port of Charleston – Office of Risk Management). International ports, such as the Port of Antwerp, employ the Authorized Economic Operator (AEO) certification, which evaluates the security credentials of shippers and carriers. The World Customs Organization issues AEO credentials. The system is standard convention, and most trusted, for monitoring and evaluating the safety of the international supply chain. Any company interested in receiving AEO credentials has to meet an exhaustive list of security criteria. After being certified, these companies gain a number of benefits when entering ports – shortened wait times, fewer security checks, and lower security fees (Port of Antwerp Sustainability Report 2010).
The U.S. Department of Transportation Maritime Administration (MARAD) administers a variety of programs to enhance security at ports. Further, the MARAD Port Security Grant Program dispenses funds to ports upgrading their security. To date the program has awarded over $388 million dollars to ports to fund the enhancement of security measures. While it is not common to draw a connection between port sustainability and security, running a safe and efficient operation gives ports the room to pursue other sustainability initiatives. Thus, securing a port is a logical precursor to introducing a more far‐reaching sustainability agenda. Very simply stated, an unsecure port is an unsustainable port.
Efficiency as Sustainability
The literature on sustainability abounds with references to efficiency. While the triple bottom line accentuates the importance of improving economic performance, environmental protection, and enhancing social equity, none of these goals are possible without ports operating in an efficient manner. Efficiency is the tie that binds the triple bottom line together ‐ it tightens the connections between the different components of sustainability. While efficiency is possible in the absence of sustainability, sustainability is not possible if port operations are run inefficiently and haphazardly. When businesses lack the sufficient capital to aggressively finance infrastructure or equipment investments, maximizing efficiency offers ports an alternative to make gains in their sustainability profile. Because many inland ports are undercapitalized, they will have to gain ground in efficiency categories to become more sustainable.
62
A number of programs can strengthen a port’s efficiency and its commitment to sustainability. These programs include:
‐ Awarding contracts to local businesses engaged in environmentally friendly practices
‐ Installing electrical hookups for docked vessels, which reduces air pollution and lowers expenses
‐ Integrating environmental management systems into overall business strategies
(Port Metro Vancouver)
Different methods have been used across a variety of industries to measure efficiency, and identify opportunities to improve it. The most common evaluative tools are audit templates, which give organizations the framework to systematically assess their current practices and determine where they can make improvements that will boost their operational efficiency. After identifying areas in which to improve efficiency, a commonly employed method to realize them is through the Eco‐Efficiency Model, popularized in 1992 at the United Nations Conference on Environment and Development (UNCED) by the World Business Council for Sustainable Development (WBCSD).
The Eco‐Efficiency method relies on comparative analysis. This means it does not evaluate the sustainability of a product, practice, or service in absolute terms by using a set of fixed metrics. Instead, it compares the sustainability of one product relative to others. The literature on Eco‐Efficiency attributes great importance to first establishing a basic framework businesses can use to become more sustainable.
This process breaks down into the following steps:
1. Build awareness among management about sustainability. With this knowledge, managers
can better understand the relationship between core business activities and sustainability.
2. Determine what data collection is necessary to evaluate current levels of sustainability
performance.
3. Decide on a set of strategies to improve sustainability based on an audit of current
performance.
4. Publically state the organization’s sustainability goals.
5. Implement an organization‐wide sustainability program that reforms current practices to
achieve the agreed upon goals (Brady et al. 1999)

63
More directly related to port operations, a number of recent studies have investigated if port privatization necessarily leads to efficiency gains. Prior to analysis, many in the port industry intuitively suggested that privatizing operations increases port efficiency. However, this conclusion has been challenged. Heng (2003) demonstrates a U‐shaped relationship between efficiency and privatization, indicating that quasi‐private ports are the most likely to maximize efficiency. While some degree of port privatization heightens efficiency, fully privatizing a port does not produce the largest gains. In some cases, fully privatizing ports can lower efficiency ‐ thus full privatization leads to diminishing returns. Most port authorities recommend turning to private financing, and privatizing some aspects of operation and management. However, it is important that port authorities remain in place to exercise their regulatory functions.
Currently, there is only a small body of literature that discusses inland port efficiency, but it does contain lessons that port operators can draw from if they are interested in running more efficient ports. Programs that 1) streamline the process of loading and unloading barges 2) expedite the movement of goods once unloaded 3) shorten the amount of time goods are held in storage or the time it takes to complete an intermodal transfer, and 4) reduce carrier’s idling period at port facilities all buoy efficiency.
There are a couple of other takeaway messages from this literature. First, whenever possible, programs should not target a single dimension of the triple bottom line. Instead, the greatest efficiency gains are realized when an initiative sets out to improve multiple components of the triple bottom line. For inland ports, it is absolutely crucial that all sustainability initiatives work to improve efficiency so that business performance and profitability benefit. Because these ports suffer from financial constraints, all initiatives must aim to alleviate them. In doing so, it places the ports on a sounder financial footing, which lays the groundwork for future sustainability initiatives.
The second lesson from this literature talks about how running a more efficient and sustainable port is only possible when a port coordinates with multiple stakeholders to ensure all points along a supply chain function seamlessly and with the utmost efficiency. For inland ports, this entails focusing on supply chains centered on the inland waterways and on their role as vital nodes in the supply chains of coastal ports. Because of the interconnections between the inland waterway system and coastal shipping operations, inland ports cannot afford to ignore the role they play in efficiently moving goods to and from coastal ports. What this implies is that while inland ports can independently institute measures to improve their efficiency and sustainability (without attaining the cooperation with all stakeholders, and without devising strategies to increase efficiency throughout the U.S. port system) it is unlikely that ports will operate as an interconnected, sustainable network.
The next chapter expands on the issue of supply chain management, and the role it plays in sustainability. It explores why it is of crucial importance for all ports, whether they operate as central hubs, or as minor links along the chain. Kinks and disruptions in the supply chain can undermine the efforts of individual ports to operate in concert with one another more sustainably.

64
This page left intentionally blank.
65
“Sustainability is about profit...it is the opportunity of the century”
‐ Ben Clarke, Kraft Foods (2008)
Chapter 4
2012 Site Visits, Focusing on Tangible Targets and Sustainability as Economic Investment
Based on the information reviewed in the previous chapters, and upon extensive discussions with industry experts, this report strongly recommends that inland river ports seeking to improve their sustainability direct their energies into three main target areas: 1) Policy; 2) Operations; and 3) Efficiency. Based on the level of investment required to overhaul infrastructure and institute restrictive energy efficiency standards, many inland ports simply lack the capital necessary to pursue these kinds of changes at the moment. Likewise, it would be imprudent to focus narrowly on environmental or safety initiatives because, while beneficial, these would only modestly contribute to bolstering the entirety of the triple bottom line. Moreover, inland ports are well advised to, like their coastal counterparts, view sustainability as an opportunity, not a financial or operational obstacle.
This chapter briefly touches on the reasons why zeroing in on policy initiatives, operational adjustments, and efficiency upgrades are important, and how this will translate into measurable improvements in the triple bottom line of all inland ports. The conclusions derived in this chapter stem from existing literature, and on 13 site visits conducted by a research team from the Kentucky Transportation Center (KTC) in 2012. The purpose of these visits was to directly engage port administrators, and to learn their thoughts (both positive and negative) concerning sustainability initiatives. Furthermore, these visits inform the centerpiece of this report – an audit template than can be used to evaluate the inland port industry of Kentucky and the surrounding regions. Minor revisions to this template would make it applicable to any inland port. Based on site visits, the KTC research team can venture four principal conclusions regarding the status of sustainability initiatives among inland ports.
First, and most strikingly, the inland port industry lags well behind the coastal port industry in terms of adopting and implementing a sustainability agenda. There are several factors which have contributed to this delay. Historically, the inland waterway industry has received less pressure to improve its sustainability because, comparatively, the environmental footprint of inland ports is small compared to their coastal counterparts. Lacking external pressure, ports have not had an incentive to aggressively pursue a more sustainable mode of operation. Moreover, inland port administrators often have an outdated and narrow understanding of what sustainability entails. Typically, they equate sustainability with protecting and conserving environmental resources. While this is certainly one facet of the triple bottom line, the concept of sustainability has grown more ecumenical since the 1990s, when many researchers recognized that businesses needed to find ways to act as responsible environmental stewards, while also maintaining a path to economic growth.
66
Coastal ports, on the other hand, have been quick to embrace the triple bottom line concept. More evidence accumulates each day that demonstrates ports or other businesses can be sustainable and profitable. One way to correct for the misunderstandings about sustainability among inland port administrators is to pursue an aggressive educational outreach program, in order to demonstrate how sustainability can work for them. Indeed, today’s business climate dictates that if products or services can be offered using less energy and fewer resources, while generating less pollution, the business doing so will save money (Brady et al. 1999). Educational outreach will serve as a timely corrective, and assist inland port administrators to develop a modernized understanding of what sustainability is, and how it will benefit their operations.
A second important takeaway from KTC visiting inland ports is that the inland port industry has capital constraints that limit the ability to advance a robust sustainability agenda. This places the inland port industry in an awkward position, because investing in sustainability leads to improved performance (in terms of operational efficiency and profitability). Furthermore, the inland port industry will prove more alluring to shippers, carriers, and coastal ports by adopting a more sustainable way of doing business. As more businesses (or links) in the supply chain increase their sustainability in the coming years, inland ports will need to follow suit to retain their competitiveness.
Investors in the financial community are increasingly gravitating towards companies that express strong commitments toward sustainable practices. This is because, over the long run, they expect companies that act sustainably to provide a better return on investment (Brady et al. 1999). A sustainability audit gives companies, or ports, the template they need to understand where they currently stand on the issue of sustainability, and what results they can expect to see if new sustainability‐oriented policies are put into place. The audit identifies “target areas,” that once improved, will set inland ports on a more sustainable pathway, and consequently one that is also more financially viable (see Table 4). As such, this report suggests that inland ports begin the process of sustainability improvement by performing sustainability audits to identify where their best prospects for sustainable growth lie.
The reasoning behind the decision to advise inland port operators to begin the sustainability process at the self‐assessment/audit template level stems directly from the advice of coastal port sustainability offices. The KTC research team worked in tandem with each coastal sustainability office to develop a roadmap for port sustainability initiatives (see Table 4). This general roadmap established at coastal and inland ports that have seen improvements in sustainability begins with a self‐assessment via audit template which, in turn, provides the information necessary to make the establishing of a sustainability office an effective tool.

67
Following the creation of a sustainability office, introductory level sustainability improvements can be made. It is important to note, however, that the self‐assessment tool utilized in step one will be crucial to informing which improvements to make during this phase. This is due, in part, because each inland port can be dramatically different from one another. As such, each port will need to have conducted its self‐assessment in order to identify which sustainability improvements are appropriate. The audit template also serves the vital purpose of telling inland ports where to begin.
Following the informed improvements made in step three, the next step in the process is to compile those advances into a sustainability report that can serve as both an internal account of where the port currently stands with respect to its sustainability goals, and as an external piece of marketing material designed to favorably position the port to compete for customers and clients seeking sustainability across their supply chains. After this report is published, it can be presented to supply chain members, stakeholders, customers, and clients during facilitated sessions designed to empower inland ports to address more complex sustainability issues that may lie outside of their direct zone of control. Finally, it is recommended that inland ports conduct a secondary sustainability self‐assessment prior to pursuing and future advanced sustainability improvements.
Table 4: Roadmap to Port Sustainability
1. Sustainability Self‐Assessment via Audit Template
2. Establishment of Sustainability Office/Officer
3. Basic Level Sustainability Performance Improvements
4. Publication of Sustainability Performance Report
5. Facilitated Sessions with Supply Chain Members & Stakeholders
6. Secondary Self‐Assessment via Audit Template
7. Advanced Sustainability Performance Improvements
Table 5: Potential Economic Benefits of Sustainability
1. Reduced Operating Costs 2. Improved Production
3. Reduced Liability and Risk
4. Enhanced Brand Image
5. Increased Employee Morale
6. Increased Innovation
7. The Opening of New Markets
8. Better Supply Chain Management
9. Better Relationships with Customers
68
Third, inland ports find themselves in situations coastal ports confronted just a decade ago. Namely, many port administrators are unsure of how to change the culture of their industry with respect to the sustainability agenda. Administrators and sustainability officers at coastal ports provided several recommendations about the best way to begin the process. The first hurdle to overcome is dispelling biases and preconceived notions of what sustainability means. This can be done by “starting small.” The coastal ports with the most successful sustainability programs began by introducing smaller initiatives that could be implemented in a relatively painless and expedient manner.
Starting small is the first step towards thinking and acting big. Representatives from coastal ports also pointed out that starting small is necessary to ease into the transition of becoming sustainable. At the outset, the process of establishing a sustainability program appears overwhelming and undoable. However, by proceeding in graduated steps, with each sustainability initiative building upon previous ones, the probability of achieving success grows. Administrators at East Coast ports noted they could draw on the example of programs developed at ports along the U.S. West Coast, which shifted towards a stronger commitment to sustainability several years before them. Looking at previous examples (regarding what has worked and what has not) can greatly inform inland ports as they move ahead with sustainability agendas. If the inland port industry begins with modest proposals and initiatives, this will lay the foundation for more aggressive actions and investments in the coming years.
Fourth, via the site visits and interviews with industry stakeholders, it is clear that coastal ports have made enough progress to justify focusing on areas such as infrastructure, security, energy, and environmental sustainability (which require larger financial investments). The inland port industry will be better served by looking at the overall trajectory the coastal port industry has taken to implement sustainability programs, and following a similar model. This will entail not just starting with smaller initiatives, but specifically beginning with the target areas of policy, efficiency, and operational sustainability.
After making gains in these areas, inland ports can branch out, and make more capital‐intensive investments that are beyond their current reach. While the example set by the coastal port industry will not provide a set formula to achieve sustainability on these fronts, it offers a rough map inland ports can follow. Inland ports can then improvise to find the solutions that best fit their socio‐economic situations. It is also worth taking a moment to re‐emphasize that there is a need to change current inland port industry levels of both understanding and awareness with respect to the relationship between economic performance and sustainability performance. As recently as twenty years ago, it was commonplace for most businesses and industry to put these two concepts at odds with one another.
However, this is most certainly not the case now. The convergence began with the Bruntland Commission and its redefining of the environmental movement into the sustainability movement (but the widespread embracing of sustainability didn’t begin to experience its current vogue until real business performance advantages started becoming regularly documented).
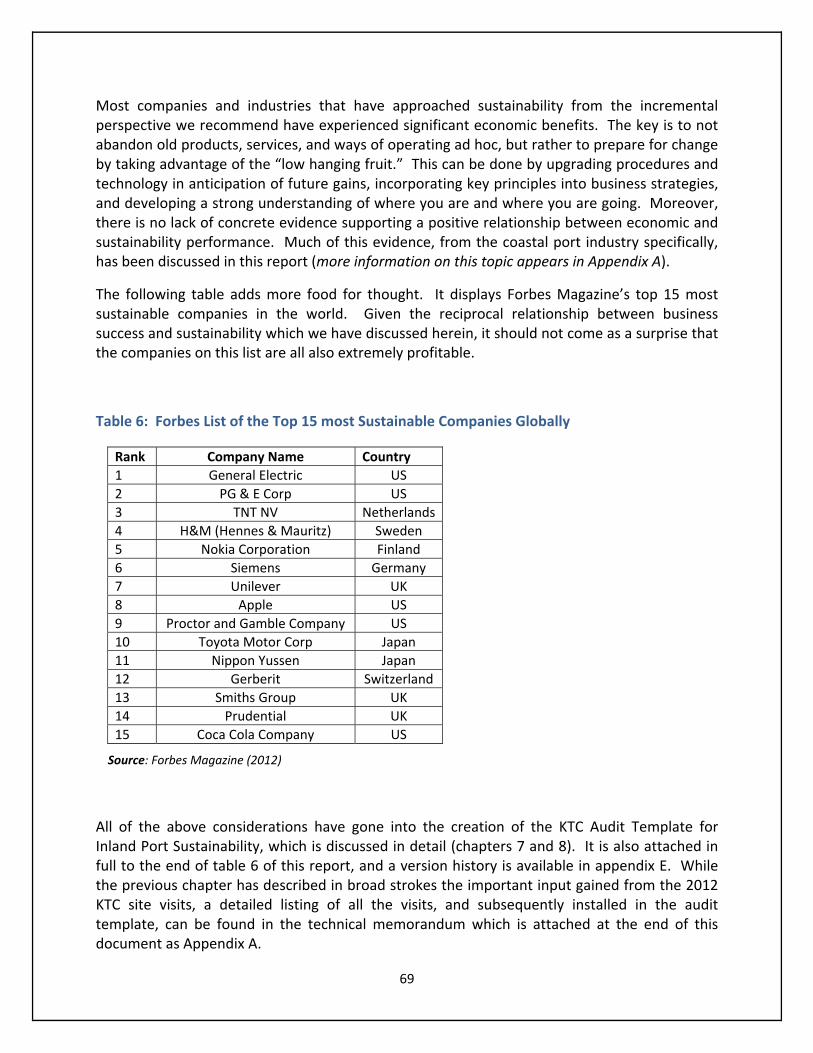
69
Most companies and industries that have approached sustainability from the incremental perspective we recommend have experienced significant economic benefits. The key is to not abandon old products, services, and ways of operating ad hoc, but rather to prepare for change by taking advantage of the “low hanging fruit.” This can be done by upgrading procedures and technology in anticipation of future gains, incorporating key principles into business strategies, and developing a strong understanding of where you are and where you are going. Moreover, there is no lack of concrete evidence supporting a positive relationship between economic and sustainability performance. Much of this evidence, from the coastal port industry specifically, has been discussed in this report (more information on this topic appears in Appendix A).
The following table adds more food for thought. It displays Forbes Magazine’s top 15 most sustainable companies in the world. Given the reciprocal relationship between business success and sustainability which we have discussed herein, it should not come as a surprise that the companies on this list are all also extremely profitable.
Table 6: Forbes List of the Top 15 most Sustainable Companies Globally
Rank Company Name Country
1 General Electric US
2 PG & E Corp US
3 TNT NV Netherlands
4 H&M (Hennes & Mauritz) Sweden
5 Nokia Corporation Finland
6 Siemens Germany
7 Unilever UK
8 Apple US
9 Proctor and Gamble Company US
10 Toyota Motor Corp Japan
11 Nippon Yussen Japan
12 Gerberit Switzerland
13 Smiths Group UK
14 Prudential UK
15 Coca Cola Company US
Source: Forbes Magazine (2012)
All of the above considerations have gone into the creation of the KTC Audit Template for Inland Port Sustainability, which is discussed in detail (chapters 7 and 8). It is also attached in full to the end of table 6 of this report, and a version history is available in appendix E. While the previous chapter has described in broad strokes the important input gained from the 2012 KTC site visits, a detailed listing of all the visits, and subsequently installed in the audit template, can be found in the technical memorandum which is attached at the end of this document as Appendix A.

70
Moreover, a second round of visits was conducted in 2013. These visits were designed to bring the KTC analysis of the first round of visits directly to the inland port operators of Kentucky and the surrounding Ohio River region. Chapter 5 discusses these visits and the insights gained therein.

71
This page left intentionally blank.
72
Chapter 5: 2013 Site Visits – Lessons Learned
Focusing on the Economic Bottom Line, Working Directly with Inland Port Operators, and
Creating a Practical Self‐Assessment Tool
Since this project’s outset, KTC researchers have sought to take lessons learned by the coastal port industry in sustainability and develop methods to apply them to the inland port industry. The first step in the process entailed visiting many coastal ports in 2012, as well as some of the largest inland ports in the U.S. Midwest. Some of the knowledge gained from these visits was discussed in the previous chapter. However, lessons learned are inconsequential unless they are subsequently applied. As such, a principal goal of KTC’s 2013 fieldwork was to engage inland port operators in Kentucky. The purpose of visiting these ports was to a) share information gathered from coastal ports regarding the development of effective sustainability programs, and b) assess where Kentucky’s inland ports currently stand with respect to implementing sustainability policies and programs. Exchanges with Kentucky’s port operators were instrumental for refining KTC’s port sustainability audit template; they also set the stage for future collaborations between the research team and port industry stakeholders.
Although KTC approached the 2013 site visits with substantial knowledge regarding sustainability, researchers knew that before offering final recommendations to inland port operators that it was critical to develop a fuller understanding of the inland port’s operational model. As a result, KTC researchers knew it would be inappropriate to attempt a transfer of knowledge from coastal to inland ports without carefully thinking about how the lessons gleaned from coastal operations could be downscaled and modified to fit the needs of inland port facilities. To identify the best strategies for accomplishing this, KTC researchers traveled extensively during the summer of 2013 to conduct face‐to‐face meetings with officials from every public inland waterway port in Kentucky as well as several additional ports along the Ohio River.
KTC researchers made stops at the following locations:
Paducah‐McCraken County Riverport, Owensboro Riverport, Henderson County Riverport Authority, Louisville‐Jefferson Riverport International, Port of Green‐Boyd County, Columbiana County Port Authority, Weirton Area Port Authority, Eddyville Riverport and Industrial Development Authority, Hickman‐Fulton County Riverport Authority, and Port of Greater Cincinnati Development Authority.
KTC researchers had four objectives going into each visit. First, they wanted to gain insights from port operators about the progress (or lack thereof) that has been made introducing new sustainability practices as well as any challenges they confronted during this process. This was a critical step for several reasons. Although KTC researchers went into the 2013 visits equipped with knowledge about sustainability initiatives put into place at the larger inland ports visited in 2012, less was known about the ability of smaller port operations to adopt robust sustainability measures. The 2013 visits enabled comparisons between large and small inland ports to

73
understand the capabilities of smaller facilities that often operate on restricted budgets. Another reason for the 2013 visits was to deepen researchers understanding of the ports for which the audit template is designed for.
Related to this, KTC researchers were eager to receive input from inland port operators and other industry stakeholders on the early draft of the audit template. Feedback from these individuals was critical to verify the soundness of the approach KTC used as well as the audit’s content. Lastly, the 2013 site visits let researchers expand and refine their list of sustainability best practices, which were then used to ensure the appropriateness of the audit template for small inland port operations.
When compared to the coastal ports and larger inland ports examined in 2012, inland ports that researchers concentrated on in 2013 had fewer resources that could be dedicated to sustainability programs. Despite the limited budgets, all of the port operators KTC spoke with expressed an eagerness to invest in sustainability initiatives. Many have developed small‐scale programs to put them on the path toward achieving long‐term sustainability and financial security. Appendix B documents ongoing and proposed sustainability initiatives in place at inland ports. Broadly speaking, these visits accentuated several key points that ultimately guided KTC’s development of the Audit Template for Inland Waterway Port Sustainability.
One thing quickly became clear to KTC researchers during the 2013 visits – for the sustainability movement to gain momentum among inland port operators it will have to involve cost‐effective and money‐saving measures. Although many officials KTC engaged with in 2012 also emphasized this point, smaller inland ports do not have surplus resources they can dedicate to elaborate programs that fail to yield significant cost savings or increased profitability. Is this possible? Based on the evidence obtained from ports located in Owensboro, Kentucky; Weirton, West Virginia; and Columbiana County, Ohio it quickly became apparent that sustainability could boost the profitability of port operations.
Introducing sustainability initiatives can increase profits by:
1) Improving efficiency
2) Attracting new stakeholders/clients that want to save money and expedite the movement of goods
Officials at the Port of Weirton were particularly enthusiastic about working with KTC researchers because they have already witnessed the pull of sustainability to draw more business to their facilities. The port has retained Parsons Brinckerhoff and the Stevens Institute of Technology to perform studies that assess the effectiveness of sustainable policies and practices, as well as to determine strategies going forward to improve their business model. A key finding of these studies is that adopting a more sustainable approach to operations can pay dividends in a short amount of time. Building off of this work, the Port of Weirton has self‐published a resiliency report. Port officials noted they have already reaped financial benefits
74
from issuing this report at it has attracted new clients away from other distribution networks considered less sustainable and, therefore, less resilient to perturbations.
Three other important lessons were learned from the second round of port site visits, each of which provided valuable best practices for ports seeking to improve their financial sustainability. First, several of the ports visited have shifted to a new business model whereby they become economic development groups (in addition to fulfilling traditional port‐related functions). Ports that have transitioned to this model have shown better financial resilience compared to their peers hewing to a more traditional operational profile. Some ports have had this kind of structure in place for a considerable length of time. For example, the Port of Cincinnati has operated on this model for a long period. It has achieved enough success as an economic development group that it has disengaged from typical port activities. The Columbiana Port Authority has moved in this direction as well. However, in addition to serving as the most influential economic development group in its region, the port continues to act as a critical multimodal transportation hub. The Ports of Louisville and Owensboro have also adopted some aspects of this strategy.
The second critical lesson learned was the importance of facilities establishing themselves as Foreign Trade Zones (FTZ). The FTZ is a geographical area located within or adjacent to a United States Port of Entry. In FTZs, commercial merchandise – both of domestic and foreign origins – receives treatment from U.S. Customs as if it were outside the commerce of the United States. More succinctly, merchandise held in a FTZ is not subject to duties and other ad valorem taxes. The purpose of eliminating tariffs and taxes is to reduce the costs of U.S. based operations participating in international trade. In turn, this gives ports a chance to create new employment and take advantage of capital investment opportunities that result from being designated as an FTZ. Consequently, ports that double as FTZs enjoy significant economic benefits that enhance their financial sustainability. Several of the ports KTC visited in 2013 are classified as FTZs, including: the Ports of Cincinnati, Owensboro, Louisville, and the Columbiana County Port Authority.
Lastly, KTC researchers learned that sustainability and economic success go hand‐in‐hand. Evidence of this came in the form of some inland ports moving to create more efficient intermodal terminals. This approach has been taken at the Ports of Paducah, Hickman, and Louisville, among others. By achieving small but measurable improvements in terminal logistics, ports can raise their efficiency, economic sustainability, and therefore improve the financial bottom lines. Given that port operators are well acquainted with these lessons, it was not surprising that upon reviewing the audit template they universally came out in favor of doing self‐assessment. This was done to identify sustainability gaps so that new policies could be implemented to boost the economic vibrancy of their facilities. Although economic considerations receive much attention on the audit template, this is not to downplay the environmental and social elements of sustainability. These elements appear in various forms, with the overall goal of the audit tool being to develop a synergy between them and economic development. This is done so that port operators can map out a path to achieve a sustainability profile that excels in all three areas.
75
During the twentieth‐century, port operators universally emphasized policies oriented around maximizing economic development. The core tasks of the port industry centered on organizing transportation networks to expand and facilitate the flow of goods while supporting a stable and skilled workforce. Although this objective remains unchanged, the way in which port operators pursue it has. Social and environmental concerns have grown in importance in recent decades. Meanwhile, competitive advantage is no longer assessed purely in economic terms. Increasingly, competitive advantage is evaluated based on social and environmental consideration. Officials at Port of Owensboro and the Weirton Area Port Authority are convinced of this, as many coastal port stakeholders echoed these views. Based on the success of these ports, this study recommends that future economic development planning emphasize sustainability to maintain a balance between people, profit and planet (the professed trinity of sustainable development). Actions undertaken by port authorities can contribute to this balance. However, significant progress is possible only when all stakeholders involved in various aspects of port operations buy into sustainability and modify their operations accordingly.
Going forward, ramping up stakeholder involvement will take on increased importance for achieving sustainable operations at inland port facilities. This is in contrast to coastal ports. Coastal ports certainly have complex stakeholder networks. Because they have more operating capital, they can often implement more sustainability initiatives in‐house without having to rely on contributions from outside entities. Resource‐strapped inland ports lack the financial wherewithal to do this. As such, it is understandable that the public inland ports that have made the most significant strides bolstering sustainability have engaged stakeholder groups and clients. At the Ports of Owensboro, Cincinnati, Columbiana County, and Weirton, outside stakeholders have become quite involved in pushing sustainability initiatives. Representatives from companies within the industry, trade unions, local governments, NGOs, agricultural organizations, transport sectors, and research institutes are all participating in the process to some degree.
Based on interviews with inland port officials, KTC researchers have developed a set of best practices that can persuade more stakeholders to invest in the process of growing port sustainability. First, it is necessary to identify stakeholders. Next, officials need to hold discussions with stakeholders that highlight potential strategies to improve sustainability and determine ways in which stakeholders can contribute to the process. After having conversations with key stakeholders, port officials should identify metrics that can be used to measure the economic, social, and environmental performance of the port.
Once a preliminary list of indicators has been formulated, port officials need to hold facilitated sessions with stakeholders to figure out data needs and methods for quantifying the indicators. During this collaboration, port officials will also ask stakeholders for comments on the initial sustainability report drafts; and they will also be asked to review the final product. By involving stakeholders throughout the process, ports can strengthen their engagement with outside entities and ensure that they have a voice in the process of making operations more sustainable. By fostering inclusive dialogue with the widest number of clients and stakeholders,
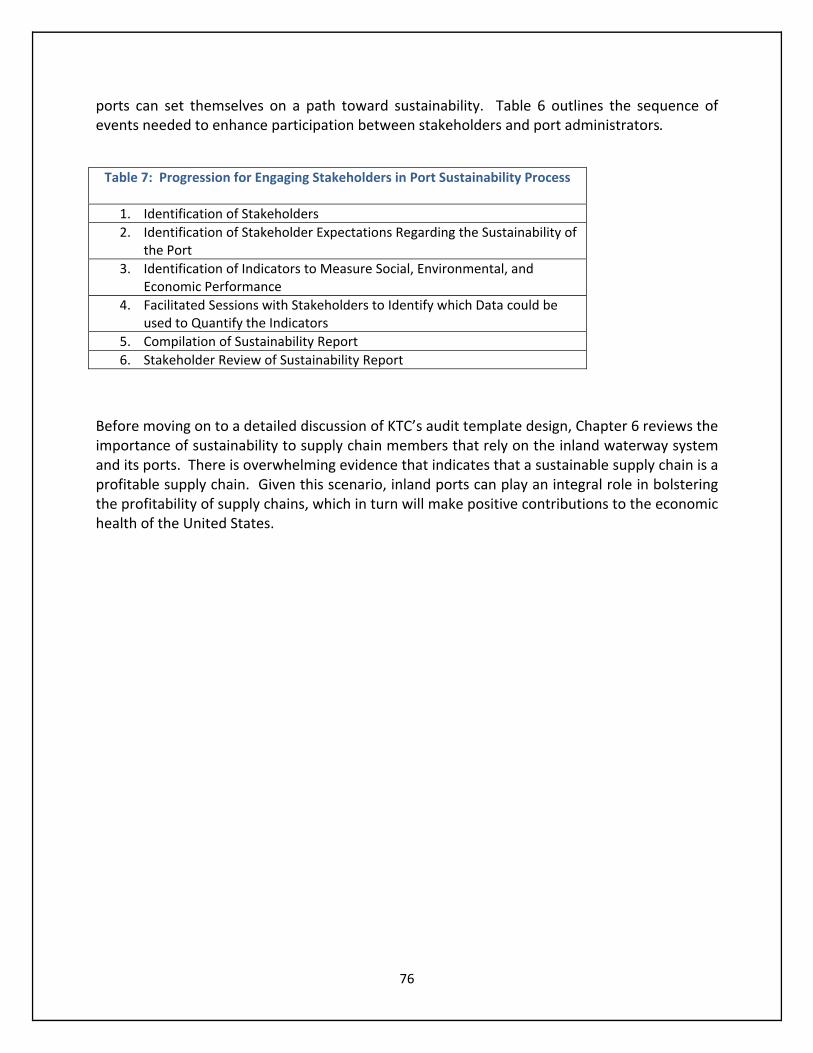
76
ports can set themselves on a path toward sustainability. Table 6 outlines the sequence of events needed to enhance participation between stakeholders and port administrators.
Before moving on to a detailed discussion of KTC’s audit template design, Chapter 6 reviews the importance of sustainability to supply chain members that rely on the inland waterway system and its ports. There is overwhelming evidence that indicates that a sustainable supply chain is a profitable supply chain. Given this scenario, inland ports can play an integral role in bolstering the profitability of supply chains, which in turn will make positive contributions to the economic health of the United States.
Table 7: Progression for Engaging Stakeholders in Port Sustainability Process
1. Identification of Stakeholders
2. Identification of Stakeholder Expectations Regarding the Sustainability of the Port
3. Identification of Indicators to Measure Social, Environmental, and Economic Performance
4. Facilitated Sessions with Stakeholders to Identify which Data could be used to Quantify the Indicators
5. Compilation of Sustainability Report
6. Stakeholder Review of Sustainability Report

77
This page left intentionally blank.

78
“The best supply chains aren't just fast and cost‐effective. They are also agile and adaptable,
and they ensure that all their companies' interests stay aligned.”
Hau Lee ‐ Harvard Business Review
Chapter 6: A New Target ‐ Supply Chain Sustainability
Why is supply chain management important for inland port sustainability? First and foremost, the ports of the inland waterway system are key nodes for U.S. supply chains. The U.S. inland port system consists of more than 12,000 miles of inland waterways, with about 240 lock chambers. Each year more than 566 million tons move through the inland transportation system, more than half of which is coal and petroleum products. Moreover, more than 70 million metric tons of grain, soybeans, and food are transported within the U.S. each year by way of the inland transportation system (ASCE 2012).
Across the United States, this system of inland waterways and marine ports plays a pivotal role in both domestic and international transportation. In 2010, for example, the cargo transported on these waterways and through these ports was valued at over $152 billion. This includes approximately 56 percent of all crude petroleum, 15 percent of all coal, and 24 percent of all other fuel oils, which alone affects the efficiency of every economic sector that relies on energy. Other commodities with significant shares moving by inland water include 22 percent of basic chemicals, 18 percent of agricultural products, and 19 percent of nonmetallic minerals. By 2020, traffic on inland waterways is expected to increase by as much as 51 million tons of freight, an overall increase of 11 percent. By 2040, this increase is expected to exceed 118 million tons, which would result in an overall increase of approximately 25 percent (ASEC 2012).
While efficient supply chains are what drive the U.S. economy, research by the World Health Organization (2004) shows the shipping industry has a decidedly negative impact on air pollution by amplifying the amount of noxious emissions at the local and regional level. Some estimates indicate rising emissions of particulate matter and sulfur originating from the shipping industry negatively affects the health of millions of U.S. residents (Bailey 2007). While ships, trucks, and other on‐shore equipment used at ports exacerbate air pollution, there are other environmental implications to consider. Port activities contribute to marine and freshwater pollution, require large quantities of fuel and electricity to be consumed, generate noise pollution, and degrade the quality of aquatic habitats. Local governments and port authorities can mitigate for some of these effects by installing regulations governing port activity. However, individual terminal operators and individual actors positioned at different points along supply chains play a significant role in determining the magnitude of environmental impacts.

79
When all stakeholders operate collaboratively, the likelihood of sustainability success goes up dramatically. Of late, port operators have received increasing scrutiny from international transportation and logistics companies seeking to understand the social and environmental impacts of their supply chains in order to devise new strategies for making their services more sustainable. Inland ports are important to the supply chains of the U.S. economy, and it is becoming increasingly crucial that the inland port industry focuses more on sustainability than in the past. As the negative environmental social impacts of transportation operations become more fully understood, more pressure is being put on coastal ports, shippers, carriers, customers, and governments to improve the sustainability of their supply chains. As a major link in those chains, inland ports will invariably be receiving increased attention from these entities as they seek to address the environmental and social impacts of supply chains.
Because inland ports are becoming increasingly central to the supply chains of the U.S. economy, it is imperative the inland port industry focus on becoming more sustainable. This report establishes a concise, clear, and consistent template inland ports can use to evaluate the sustainability of their own supply chains, and improve their own sustainability profiles. By doing so, this will increase their attractiveness as links in supply chains. Expressing a greater commitment to sustainability will funnel more customers to the inland port industry, who are in search of long‐term solutions to their shipping needs. The inland port industry must strike an appropriate balance between economic performance and sustainability. While the two are not mutually exclusive for any organization, increasing sustainability performance eventually leads to diminishing returns, and can damage its economic prospects. Figure 12 generalizes the relationship between the economic performance and sustainability performance of inland ports and relates milestones in the sustainability process to points along the performance curves.
When programs are initially adopted to enhance port sustainability, economic performance will generally rise. Thus, economic performance and sustainability performance closely track one another as the overall performance curve ascends. The reason for this initial increase in both measures is that early‐implemented initiatives are often enacted at modest cost, but positively impact the triple bottom line. However, once the most efficient initiatives have been put into place, further investments in infrastructure and equipment grow more expensive, which leads to declining economic performance. Upon reaching this point, the most effective method to improve sustainability is by targeting the sustainability of the supply chain, which involves developing incentives for tenants and imposing stricter guidelines on carriers.
An example of an initiative designed to address sustainability through supply chain management is the collaborative user fee program implemented at the Ports of Los Angeles, Oakland, and Long Beach. An increasingly large environmental footprint at the San Pedro Bay ports led to regulations and expectations for improvement which were beyond the ability of the respective ports to handle. In response the ports have implemented a $50 per TEU container user fee for shippers or carriers that utilize the port. One hundred percent of the fee is reserved for sustainability initiatives. This type of user fee system could work well for inland ports. After the inland port industry in Kentucky and surrounding regions have conducted sustainability audits and implemented the most basic and cost‐effective sustainability initiatives available (such as the creation of a sustainability office), they will find that major sustainability
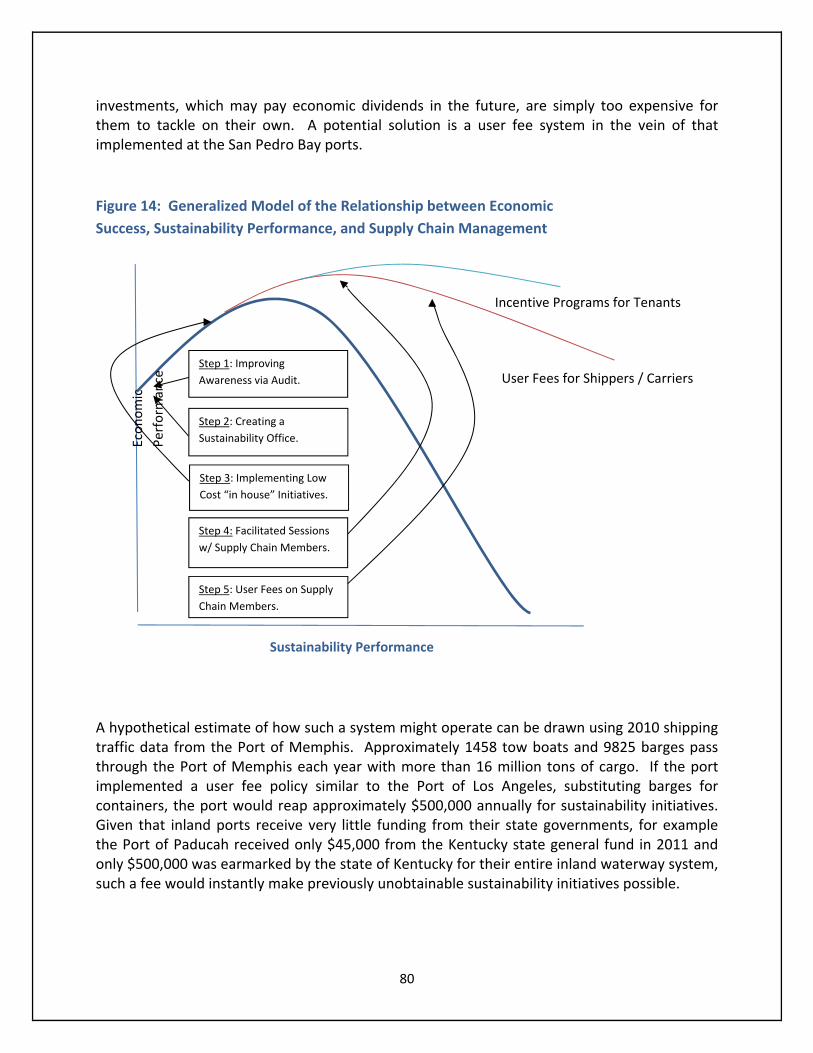
80
investments, which may pay economic dividends in the future, are simply too expensive for them to tackle on their own. A potential solution is a user fee system in the vein of that implemented at the San Pedro Bay ports.
Figure 14: Generalized Model of the Relationship between Economic
Success, Sustainability Performance, and Supply Chain Management
A hypothetical estimate of how such a system might operate can be drawn using 2010 shipping traffic data from the Port of Memphis. Approximately 1458 tow boats and 9825 barges pass through the Port of Memphis each year with more than 16 million tons of cargo. If the port implemented a user fee policy similar to the Port of Los Angeles, substituting barges for containers, the port would reap approximately $500,000 annually for sustainability initiatives. Given that inland ports receive very little funding from their state governments, for example the Port of Paducah received only $45,000 from the Kentucky state general fund in 2011 and only $500,000 was earmarked by the state of Kentucky for their entire inland waterway system, such a fee would instantly make previously unobtainable sustainability initiatives possible.
Economic
Perform
ance
Sustainability Performance
User Fees for Shippers / Carriers
Incentive Programs for Tenants
Step 5: User Fees on Supply
Chain Members.
Step 1: Improving
Awareness via Audit.
Step 2: Creating a
Sustainability Office.
Step 3: Implementing Low
Cost “in house” Initiatives.
Step 4: Facilitated Sessions
w/ Supply Chain Members.
81
It is important to note, however, that historically these initiatives are controversial and have been difficult to implement. This is due primarily to public resistance and lack of understanding. It is often assumed that such fees will lead to shippers choosing alternate, less expensive, ports of call. Cheon and Deakin (2010), however, contend that this relationship has not been empirically demonstrated. The authors point out that the two most commonly cited reasons for predicting such a response from shippers in the case of the San Pedro Bay ports is that (1) the San Pedro Bay ports already have higher fees and charges than any other coastal ports in the world, and (2) shippers now have more flexibility than ever in choosing which U.S. coastal ports to call upon. Fortunately, for the inland port industry neither of these scenarios is applicable. Charges and fees at inland ports are minuscule relative to those at coastal ports, even when one adjusts for scale. Moreover, inland ports do not face nearly the level of competition that coastal ports experience from their peers. Still, for such a program to be successful, it would likely need to be an initiative embraced as a collaborative effort among all inland ports in a particular region. As Cheon and Deakin (2010) further point out, “such initiatives are only achievable through close partnerships among stakeholders in multiple jurisdictions and industry ‐ If a single port sets its own standards without collaborative agreement, the approach is likely to be unsuccessful” (13). For these reasons, the KTC recommends that the inland port industry focus on first increasing its own sustainability awareness through a sustainability audit and addressing cost effective in‐house initiatives. Following this step, and the subsequent establishment of a sustainability office and report, inland port operators can then meet with stakeholders and supply chain members in facilitated sessions to collaborate on an acceptable fee structure. As mentioned, such initiatives can be difficult to implement, and all but impossible prior to arming oneself with a deeper understanding of sustainability first. The audit process for inland ports recommended by KTC begins with a focus on operational and policy initiatives that positively affects all three dimensions of the triple bottom line, while also promoting efficiency regarding facets of port management. During the early phase of sustainability program development, ports should concentrate on its zone of control, and on investments that require minimal financial inputs. After the auditable features resting inside the zone of control have been identified, the next area to address is the sustainability of the supply chain. However, this process should only begin once first level options have been exhausted. It is also important to draw the attention of shippers and carriers to the major sustainability advantages of inland waterway transportation. A prime opportunity to draw such attention is the marketing of sustainability self‐assessment processes.

82
This page left intentionally blank.
83
“An investment in knowledge always pays the best interest.”
‐ Benjamin Franklin
Chapter 7: Measureable Sustainability Characteristics,
Background Considerations for an Audit Template of Inland Port Sustainability
The dimensions of sustainability with the greatest salience for port operation differ between inland and coastal ports, although there is much overlap. Likewise, not all ports will give priority to the same dimensions of sustainability; what is emphasized is contingent upon the situation of individual ports and members of their supply chain. But, again, there will be many commonalities. Table 5 contains the audit template that KTC has designed for implementation at inland ports. The audit template has two major purposes. First, it provides port administrators with a structured, organized framework by which they can assess the sustainability of their own practices. Second, it enables them to understand the level of sustainability attained within their supply chains, and in turn how this is inflected in port practices. If a port can objectively identify its strengths and weaknesses, administrators will have the information to improve sustainability. Furthermore, by conducting this sustainability audit, ports can report in what areas they excel to other entities. This will include coastal ports and international carriers, which view inland ports as vital parts of their own supply chains, thereby increasing their attractiveness to these entities. Before looking at what distinguishes KTC’s Audit Template for Inland Port Sustainability, it is worth revisiting the range of sustainability audit frameworks that have been successfully put into practice. Elements of these audit templates apply to the port industry, and have been incorporated into KTC’s template where appropriate. However, many of these templates are overly broad, and do not contain the questions that are necessary for port administrators to evaluate their facility’s sustainability. What sets the KTC audit template apart from others is that it has been explicitly designed for use by inland ports. It can thus provide specific guidance about what factors are most essential for improving the sustainability performance of terminal operations. Existing audit templates fail to account for the full spectrum of social, economic, environmental, and supply chain issues that impact sustainability, and none are tailored to the needs of inland ports. The KTC audit template, therefore, fills this gap. Inland ports will no longer have to rely on inadequate audit procedures or no template at all. The KTC audit template has been designed to give port administrators an accurate reading of where their facility stands with respect to sustainability, and to empower them to take the first steps toward improving their performance.
84
Regional Sustainability Templates / Initiatives for Coastal Ports
Port of Seattle Green Gateway Initiative
The Port of Seattle enlisted the Herbert Engineering Corporation to conduct an audit of its carbon footprint, as well as the carbon footprints of several other West Coast ports in 2009 and 2011. The audit assessed environmental management systems, reporting transparency, supply chain collaboration, vessel designs, CO2 emissions, shore power provision, waste production, and hazardous chemical management. Following the initial study in 2009, the Port of Seattle implemented several sustainability initiatives. The 2011 report subsequently recognized the Port of Seattle as a leader in port sustainability. In response, the port started the Green Gateways marketing strategy, a program which now brings public visibility to ocean carriers that meet the environmental performance standards established by template criteria. San Pedro Bay Clean Air Action Plan
The San Pedro Bay Clean Air Action Plan is a joint air‐quality improvement plan for the Ports of Los Angeles, Long Beach, and Oakland. The program was inaugurated with an audit that studied ocean going vessels, clean trucks, technology investment programs, cargo handling equipment, harbor craft, and rail sustainability. The audit opened up new funding opportunities to the San Pedro Bay ports, and gave them the leverage to apply pressure to members of their supply chains to improve sustainability standards. Northeast Diesel Collaborative Port
The Northeast Diesel Collaborative Port initiative is a regional collaboration between industry and government agencies, with the goal to reduce emissions originating from marine vessels and port operations. The audit phase focused on diesel emissions, their effect on public health, and clean diesel technology alternatives. The initiative involves several state environmental agencies, EPA regional offices, and a number of private sector companies. The initiative and its audit template are not port specific, however, and are catered toward assessing the sustainability of municipal vehicles, construction equipment, and freight transportation networks. European Union (Eco‐ports Template)
Created and facilitated by a collaborative network of European seaports, a port can self‐designate itself as an “Eco‐Port” after it has completed an audit of environmental management systems based upon ISO 14001. The group also offers a Port Environmental Review System as a standard for a port‐centric EMS system. The audit and certification process was established, and is maintained, by the European Sea Ports Organization (ESPO).
85
General Business / Industry Sustainability Templates / Initiatives
Global Reporting Initiative
The Global Reporting Initiative (GRI) is a non‐profit organization that promotes sustainability. It is currently the universal standard for performing sustainability audits, and has been used to report on sustainability performance around the world. The organization produces four of the world’s most visible standards for sustainability reporting, including: ecological footprint (EFR) reporting, environmental social governance (ESG) reporting, triple bottom line (TBL) reporting, and corporate social responsibility (CSR) reporting. The goal of the GRI is to make sustainability reporting a routine function of all organizations, much like financial reporting. More than 4000 organizations from 60 countries use the GRI template to produce their sustainability reports.
International Organization for Standardization Template
The International Organization for Standardization develops and publishes international standards related to a wide range of issues, industries, products, and concerns. Founded in 1947, the organization is the world’s largest developer of voluntary international standards. Their standard templates cover almost all aspects of technology and business, including agriculture, safety, computers, healthcare, and transportation. The organization has two templates that apply to the port industry – ISO 14001 and ISO 26000. However, both are used to audit coastal ports and their management systems, and have not been designed specifically for inland ports. ISO 14011 is a template for environmental management standards. It provides guidance to organizations on how to minimize their negative impacts on the environment while complying with applicable laws, regulations, and other environmentally oriented requirements. Alternatively, ISO 26000 offers guidance on socially responsible behavior and operations. All ISO standard templates fall under the auspices of voluntary guidance and are not requirements.
Carbon Disclosure Project
The Carbon Disclosure Project is an organization based in the United Kingdom that works with corporations and their stakeholders to disclose greenhouse gas emissions and other measures of environmental performance. These measures, and the risks associated with them, are then stored in a common database. The project allows corporations to audit themselves but is limited to measurements of CO2 emissions. In 2008 the project published emissions data for 1,550 of the world's largest corporations; these organizations account for 26 percent of global greenhouse emissions. Although such numbers are impressive, the actual value of the numbers for investors and NGO’s is contested because they are entirely self‐reported.
86
World Ports Climate Initiative
The World Ports Climate Initiative has developed tools and guidance for coastal ports, including a template for clean air programs and carbon footprint calculation. Projects include: carbon monitoring tools, technical assistance with shore power initiatives, an environmental ship index, cargo‐handling equipment, intermodal transport, and a lease agreement template. As of 2011, the initiative has the participation of 55 major ports from around the globe, including the Ports of Los Angeles, London, Montreal, Vancouver, and Antwerp. The initiative began in 2008 as an outgrowth of the Los Angeles Symposium on Port Sustainability.
International Maritime Organization MARPOL
Annex VI of the International Maritime Organization is a series of international marine environmental conventions designed to minimize marine environmental pollution. As of 2012, there are 150 countries involved with MARPOL.
The Kentucky Transportation Center Audit Template for Inland Port Sustainability
The audit template designed for the inland ports provides a framework to assess the sustainability performance of port operations that is standardized, universal, and tailored to the nature of the inland port industry. A benefit of the audit template is that it benchmarks sustainability performance across the inland port industry. Using a standardized approach establishes a set of common metrics by which individual ports can measure their progress on sustainability. Because all ports use the same measures, individual ports can compare results with other ports bearing commensurate portfolio. Most importantly, ports can develop an understanding of the areas in which they excel, and those in which there is still work to do. As retailers, manufacturers, coastal ports, shippers, and carriers raise their expectations for the level of sustainability that needs to be attained by different elements of their supply chain, inland port administrators will need to create sustainability reports that unambiguously communicates data relevant to sustainability performance. A standardized framework and audit template streamlines the processes through which data is collected and reported to interested parties. With data about their sustainability performance in hand, ports have the potential to market themselves to customers looking for sustainable solutions. The sustainability audit template designed by KTC establishes a performance narrative about the elements of sustainability that are most important to inland port operations. While measures such as carbon emissions are needed to appeal to supply chain partners, inland ports have a relatively small carbon footprint. Measuring carbon emissions alone is not a good proxy for sustainability, at least for inland ports. The audit template responds to this by emphasizing measures such as local impacts on air pollution, water runoff, hazardous materials, and effects on public health.
87
To understand their sustainability performance, inland ports will also need to track and report on the impacts related to the management of water, waste, chemicals, traffic, and noise. There is an array of issues that can potentially affect sustainability performance. Port operators require a method to comprehensively assess a suite of sustainability indicators. The KTC template answers these needs, as it embodies a philosophical approach to sustainability anchored in the triple bottom line concept. It balances immediate economic priorities against environmental and social imperatives. Thus, it gives port administrators the information to plan over the short‐term and long‐term to improve sustainability, while retaining a commitment to elevating overall economic performance. Interviews with coastal and inland port stakeholders inform KTC’s audit template, along with contemporary literature on port sustainability and previous research performed on efforts to improve industry and supply chain sustainability. The design of the audit template has been performed with a number of objectives in mind. First, it enables port administrators to collect and share environmental performance data in a manner that balances the accuracy of data collection against cost and ease of implementation. A template that is cumbersome and lacks clear guidance on data collection procedures would not only discourage port administrators, it would provide nebulous results. Second, the template will give administrators knowledge that translates into tangible economic benefits. It accomplishes this by:
1) Preventing the duplication of efforts to provide sustainability performance data
2) Improving inland ports’ ability to market themselves to potential clients
3) Fostering stronger relationships with stakeholders
4) Clearly identifying opportunities for improving sustainability performance that simultaneously
benefit ports’ economic bottom line
Third, KTC researchers understand many port administrators have limited financial resources at their disposal. Therefore, the KTC template gives administrators feedback needed to develop realistic implementation goals for sustainability programs. Lastly, the template recognizes continuous improvement on the issue of sustainability is of primary importance. The template is thus qualitative in nature. It provides for a general assessment of inland port sustainability performance. KTC’s Audit Template for Inland Port Sustainability is comprised mainly of “yes/no” questions. While this may appear basic, answers to the questions are quite revealing about the current sustainability performance of a port. This sparks awareness among port operators about the challenges facing them and their stakeholders. The audit template represents the first phase of an ongoing effort to aid inland ports as they endeavor to improve sustainability performance. The assessment framework is not cast in stone, and researchers at KTC expect it will evolve as research and data collection moves forward, providing ports with numerous sustainability
88
benefits. Among these benefits will be data collection and provision, updated sustainability manuals, and dissemination of peer performance metrics. Template Design Concerns Identified by Site Visits with Port Stakeholders Interviews with port operators and other stakeholders during the site visits suggested it would be crucial that port operators be equipped to administer the sustainability audit independently. While interviews with coastal port representatives demonstrated they are thoroughly familiar with the concept of sustainability, the level of understanding among inland port administrators is comparatively underdeveloped. As such, the first phase of the audit template process must accentuate ease of implementation. This serves two purposes. It instills the confidence in port administrators needed to perform the audit while also more deeply familiarizing them with the concepts underpinning sustainability. The current audit template, therefore, employs a series of “yes / no” and follow up discussion questions designed to assess a general level of sustainability performance and understanding. In addition, several questions are included to assess the level of data available to inland port operators. As indicated previously, while sustainability templates have been designed for coastal ports, none have been created that directly apply to the inland port industry. Relying upon the same metrics that are used to assess coastal ports is problematic because they are not adapted to the variety of operational frameworks that exist within the inland port industry. While most coastal ports are generally large‐scale operations, there is much more variety in the inland port industry with respect to the size and scope of operations. While coastal ports and inland ports may pursue similar strategies to enhance their sustainability, the specific way in which sustainability initiatives are designed and put into practice will vary considerably. Representatives and stakeholders interviewed by the KTC research team expressed concern that quantitative measurements used to assess the sustainability performance may not offer the best platform to compare the level of performance across differently scaled operations.

89
This page left intentionally blank.

90
Chapter 8: The Kentucky Transportation Center’s Inland Port Sustainability Audit Template & Self‐Assessment Tool
The preceding chapters offered a detailed survey of existing literature on port sustainability, recounted by KTC visits to a number of coastal and inland ports. KTC researchers sought to identify what measures and policies have been used to improve sustainability, and highlight cost‐effective opportunities inland ports can take advantage of to immediately implement a broader range of sustainable practices. While highlighting best practices serves an invaluable purpose, and can provide inland port operators with critical information as they attempt to introduce more robust sustainability measures at their facilities, they require an initial evaluation of their current practices to determine what level of sustainability performance they have achieved. This chapter, accordingly, focuses on the iterative process KTC researchers used to develop a port sustainability audit template inland ports can use to appraise the overall sustainability of their operations. The audit template consists of a series of questions covering a variety of topics. These questions reflect the “triple bottom line” approach to sustainability (Elkington 1999). While issues like environmental protection and remediation are imperative, these issues are balanced against questions about community outreach efforts, as well as their broader operational profile. Only by paying attention to all three issues can a facility become sustainable. Once port operators have completed the audit, an analysis of the responses will yield recommendations for practical steps they can take to enhance the sustainability of their sites in a way that boosts their efficiency, resiliency, and profitability. The aim of the audit template is to generate actionable guidance; however, it is crucial to note that each inland port is unique with respect to the scale and scope of its operations. Given this, KTC researchers designed the template not to embody a prescriptively monolithic vision of sustainability. Instead, it was crafted to supply port‐specific information so that new sustainability policies and measures can be introduced that synchronize with established practices and business models. This chapter is broken into several sections to provide readers with a clear picture of the epistemological underpinnings of the audit template. The next section looks at academic literature on sustainability accounting, sustainability footprint modeling and other national and international standards (such as GRI Guidelines) used to develop the template. As the name suggests, sustainability accounting is a subfield of accounting concerned with identifying appropriate methods to determine whether a corporation (or other organization) is performing in a sustainable manner (e.g. Lamberton 2005). In addition to discussing sustainability accounting, the next section also reviews broad initiatives undertaken by organizations such as the EPA to promote sustainable ports. In 2007, the EPA published guidelines on Environmental Management Systems (EMS) in the context of port operations; the EPA views the adoption of EMS’s as a lynchpin of port sustainability.
91
Once an EMS is in place, ports (irrespective of location) are in a better position to incorporate a broader range of sustainability measures. Lastly, the next section discusses the GRI Guidelines and ISO 14000 family of environmental management standards. Endorsed and issued by the International Organization of Standardization (ISO), these standards constitute best business and environmental management practices. These sources, in addition to the previously discussed meetings with coastal ports, were critical as KTC researchers drafted Version 1.0 of the audit template. The final sections of the chapter introduce the audit template and trace a genealogy of its evolution. While literature reviews and previous meetings with port operators informed the initial audit template, it has subsequently gone through three revisions. Revisions were made based on another round of interviews conducted with inland port operators in the Greater Ohio River Valley during June‐July 2013. Based on conversations with these key personnel, KTC researchers gradually refined the audit template. This has resulted in a final product that is straightforward to fill out, yet more pointed in the questions it collects. Sustainability Accounting Over the past 20 years, a growing body of academic literature has confronted the issue of sustainability, and more specifically sought to develop accounting methods that accurately measure the performance of companies and other entities in the area of sustainability (Lamberton 2005; Schaltegger and Burritt 2010). Although sustainability accounting first emerged during the early 1990s, only recently (as environmental issues have moved the forefront of public consciousness) has this type of accounting gained more traction. Gray (1993) identified three methods that can be used for sustainability accounting:
1) Sustainable cost
2) Natural capital inventory accounting
3) Input‐output analysis
Elkington (1999 and 2004) developed the concept of “triple bottom line” accounting. This form of accounting seeks to communicate via reports, what impacts organizations have economically, environmentally, and socially. The triple bottom line has been criticized on the grounds that its lack of rigor provides businesses and organizations an opportunity to paint an overly sanguine picture of their sustainability performance – i.e. green washing – (Norman and MacDonald 2004). However, the concept and associated accounting methodology has rapidly gained popularity over the past 15 years. It is a common reference point for organizations when they account for, and report, the extent to which they conduct operations in a sustainable and socially responsible manner. On the surface, accounting for sustainability performance appears to be a rather simple exercise. However, difficulties arise over questions about reporting. An organization may have grasp on the aspects of its operations have economic, environmental, and social implications. However, settling on commensurate metrics to quantify the material impact of their business or operational practices introduces complications. Not all performance measures are readily monetized.
92
Debates over ways to monetize sustainability performance remain ongoing in academic literature. Not all accounting methodologies demand the conversion of sustainability performance metrics into monetary units. For example, the Global Reporting Initiative (GRI) Sustainability Reporting Guidelines, which employs a variant of the triple bottom line methodology, uses a variety of incommensurable performance metrics to develop a comprehensive narrative of an organization’s sustainability performance (2011). This set of guidelines uses a number of disparate indicators to measure economic, environmental, and social dimensions of sustainability performance. On the economic front, the GRI framework measures direct economic impacts – monetizing these is uncomplicated. On issues of the environment, GRI Guidelines addresses issues of energy usage, impacts on biodiversity, carbon emissions, supply chain sustainability, and compliance with governmental regulations. Many environmental performance indicators cannot be readily translated into monetary units. For example, monetizing impacts on biodiversity (while possible) is an extremely thorny issue because there is not one strategy that has been widely accepted. As Lamberton (2005, p. 11) writes, the GRI Guidelines urge “that environmental performance indicators be expressed in absolute and relative (or normalized) terms, with the latter method enabling comparisons between organizations.” Lastly, on the social side of sustainability, the GRI framework employs four categories to evaluate organizations’ performance:
‐ Labor practices and work conditions ‐ Human rights ‐ Society ‐ Product responsibility (The latter applies to businesses that manufacture and market products to the consuming public)
The goal of the GRI Guidelines is to increase organizational transparency on the issues that have the most direct bearing on sustainability performance (see below for more details). Monetizing all indicators is not necessarily imperative as performance can be ascertained from metrics that are used. There are in fact strong arguments against monetizing all performance indicators used in sustainability accounting. Schaltegger and Burritt (2010, p 376) observe, that the use of money as the common unit to do sustainability accounting elicits criticism because this practice “is based on different types of measures—historical, current, replacement, net present value. These measures are added together in financial accounting as though they are similar.” They do not yield reliable, comparable information about fair values. They also contend: “An overemphasis on monetary measurement in relation to ecological impacts of an organization can lead to an incomplete picture of opportunities and risks” (ibid). While this only addresses ecological impacts, a similar line of reasoning can be extended regarding many social
93
consequences that elude facile monetization. Many organizational practices can produce social benefits, but there may be no way to estimate the monetary value of these. Knowing the inherently problematic nature of converting all metrics and indicators into a single unit – whether monetary or otherwise – KTC researchers did not want to develop audit template questions with the singular goal of quantifying sustainability performance in a single unit. Not only would this have provoked criticism from port operators and other stakeholders, but also it would have produced an audit template that was glaringly incomplete, one that would have inaccurately accounted for different facets of sustainability performance. KTC researchers incorporated high‐level insights from sustainability accounting without wading into questions of monetization; the contentiousness surrounding monetization was appropriate to avoid. Taking a more qualitative approach with the audit template (see below for an in‐depth overview) increased port operators’ receptiveness to discussing sustainability with researchers from KTC. As such, the definition of sustainability accounting operationalized during this study closely mirrors the one advanced by Schaltegger and Burritt (2010, p. 377). It describes “new information management and accounting methods that attempt to create and provide high quality, relevant information to support corporations [and other organizations] in relation to their sustainable development.” More specifically, sustainability accounting records and analyzes 1) environmentally and socially induced financial impacts 2) ecological and social impacts of a defined economic system 3) the interactions and linkages between social, environmental and economic issues that make up the triple bottom line of sustainability. In this sense, while the audit template does not strictly implement sustainability accounting procedures, it takes the core concepts embedded in sustainability accounting and applies them heuristically, or in a qualitative manner. Future versions of the audit template may incorporate more rigorous calculations, quantification, or attempt to monetize various sustainability indicators. However, at this stage, KTC researchers identified no compelling reasons to take this approach because it likely would have led to a confusing assessment protocol that port operators would be reluctant to apply in practice. Further, because there are no agreed‐upon methods to accomplish monetization across performance indicators, the outcomes of this strategy could be arbitrary. Taking a cue from Schaltegger and Burritt’s ideal of sustainability accounting (2010, p. 381), KTC’s audit template is a “pragmatic goal driven set of tools which attempts to develop measurement tools for different integration levels and methods of environmental, social, and economic accounting.” Discussions later in this chapter demonstrate attempts to assess port operations at the scale of individual ports using the current version of the audit template. A future goal is to enhance integration between multiple targets of analyses, such that an audit will be able to offer a comprehensive view of sustainability performance across ports, supply chains, and intermodal connections, and the entire U.S. inland waterway system. If this comes to fruition, researchers and businesses will be able to pinpoint the strong and weak points of sustainability performance at multiple scales, which will translate into policy recommendations that will aid stakeholders in their efforts to boost profitability and sustainability. Although the audit template has gone through multiple revisions, after KTC receives completed audits, researchers
94
will have a secure foundation on which to base future improvements develop new templates that are fully attuned to the latest developments in sustainability accounting. The future audits envisioned by KTC will set the standard for evaluating the multi‐dimensional sustainability performance of transportation systems and their constituent parts. One promising avenue of development is the recent invention of sustainability footprint models (see Amekudzi et al. 2009). These models could offer an exemplar that guides the creation of audits that estimate sustainability performance by simultaneously integrating information from multiple dimensions of the transportation system. While not strictly a form of sustainability accounting (just as audits are not) sensu stricto an accounting procedure. The sustainability footprint model can place conclusions regarding sustainability performance on sounder quantitative footing, which many port operators and organizations may find appealing because it will let them quickly identify practices that will benefit the bottom line. Concisely, “The sustainability footprint can be characterized as the rate of change of some measure of system performance (e.g., quality of life) as a function of the environmental costs associated with attaining that system performance” (Amekudzi et al 2009, p 344). Extending this model to assess multiple, interacting components of transportation systems can potentially yield a new approach to sustainability auditing that moves beyond using qualitative information. However, this will not compromise the confidentiality of organizations’ practices, an enduring concern for researchers and the organizations being audited. Indeed, the promise of more complex modeling and auditing strategies lies in expanding our capacity to diagnose how fine‐scaled temporal and spatial variations in sustainability performance reverberates through the entire inland waterway system. The current audit template has a fixed frame because it is concerned with individual port performance at a single moment in time. While it is possible to aggregate results and develop a composite narrative about sustainability performance among ports in the Greater Ohio River Valley, the template cannot identify temporal and spatial trends in sustainable business/operational practices. This situation, however, is not an unfavorable feature of the current audit template. It just indicates the research is in its beginning stages, and that there are many possible routes to elaborate. Sustainability auditing, and the emergent area of sustainability footprint modeling, hold great promise for improving our ability to understand the intricate nature of port operations. Sustainability auditing can also show ways in which different sustainable practices are incorporated into daily practice, and more importantly, to highlight what positive benefits result. At this stage of its development, the audit template created by KTC borrows key concepts from sustainability accounting. The audit uses these concepts qualitatively, not quantitatively, to generate an exhaustive method of accounting. The reason for this is very simple. Collecting data that is primarily qualitative informs researchers about the sustainability practices and performance of inland ports. It thus creates a knowledge base upon which future research will be developed. Jumping into quantitative metric creation before fully understanding the nature of the inland port system and individual port operations would surely lead to errant conclusions and spurious evaluation strategies. The best way to think about this

95
is that KTC researchers have plumbed the toolkit offered by sustainability accounting and selected integral concepts ‐ these were subsequently enfolded into the audit template. While there are many directions to go regarding the research, a promising route is to move towards the emergent idea of modeling sustainability footprints. Based on the formulas developed to calculate ecological footprints, the modeling sustainability footprints give researchers and stakeholders a thoroughly quantitative way to understand the systematic consequences of different policy and operational decisions on sustainability performance. Although KTC researchers have not yet attempted quantitative modeling, similar to sustainability auditing, the concept of sustainability footprints has informed the audit template at a qualitative level. Indeed, the audit template investigates port sustainability from a systematic perspective – looking at not just operations contained at the port itself (e.g. water or energy conservation policies), but it also delves into questions about intermodal connectivity and supply chain sustainability. Sustainability is a relational concept. While port operations may adopt a suite of sustainable practices, if other links and nodes in the intermodal transportation network and supply chain do not, then it reduces the overall sustainability of the system and of ports themselves. Fusing foundational concepts from sustainability accounting and sustainability footprint modeling into a qualitative audit template delivers robust and dependable results that will lay the groundwork for future modeling endeavors. By starting at the level of individual port operations and working outward (spatially and temporally) into adjacent supply chains and questions of intermodal connectivity, KTC researchers anticipate that sustainability auditing will become a standard industry practice. As integrated modeling moves ahead (and is made available to a wide range of stakeholders) these organizations will have the ability to rapidly determine the business and sustainability implications of new policies, governmental regulations, and internal operational decisions on overall port performance. While sustainability auditing and sustainability footprint modeling form the basis of KTC’s audit template, researchers also looked to EPA guidance. This includes newly‐issued recommendations to enhance port sustainability – and the ISO, which has established standards to blend environmental management with judicious business practices. These recommendations are described in the following section. EPA Port Management and ISO Standards
If sustainability accounting and sustainability footprint modeling serve as cornerstones for the KTC audit template, acting in support of these is guidance issued by the Environmental Protection Agency (EPA). This deals with developing environmental management systems (EMS), the ISO 14000 family of standards, and the GRI Sustainability Reporting Guidelines. All of these areas aided KTC researchers in selecting the indictors most appropriate for evaluating port sustainability. As it directly addresses port sustainability, the EPA’s new management guidelines cast a longer shadow over audit template design, but the ISO standards have also
96
been instrumental because they provide a blueprint for planning, enacting, and accounting for the efficacy of sustainability measures across many industries.
Their wide acceptance illustrates their currency in the business world. Throughout many industries, the ISO 14000 standards for environmental management and GRI Sustainability Reporting Guidelines are viewed as the definitive sustainability accounting methods, which are critical for putting resilient environmental management practices into place. The remainder of this section looks at the contributions of the GRI Guidelines and EPA guidelines to the audit template. Although the ISO 14000 family of standards were a key reference point, KTC researchers sought to avoid the appearance that the audit template was merely an abbreviated version of ISO 14001 reports. To meet the demands of inland ports demanding a fresh approach, a final template design dealt with concerns of industry stakeholders. While the EPA’s EMS guidance is not concerned entirely with sustainability per se, the recommendations will contribute to managing and reducing the environmental footprints of ports (however, the EPA does make an explicit connection to sustainability, although the emphasis on economic and social issues is muted compared to the focus on environmental quality). It is focused on the environmental side of sustainability. However, several of the elements informed KTC, and shaped questions about the operational aspect of ports found in the audit. EMS gives ports a framework through which it can “incorporate environmental considerations and decision making into [its] day‐to‐day operations and into its strategic planning.” Another benefit of EMS rests in their “structured framework, [which is] designed to achieve continual environmental improvement beyond regulatory compliance” (EPA 2007, p. 1). Once inaugurated, an EMS that is maintained, updated, and operationally enacted will improve port efficiency, reduce costs, and also ameliorate negative impacts on human health and the environment. A robust EMS can meaningfully boost the sustainability performance of ports. Indeed, the main benefits cited by the EPA for implementing an EMS align with the triple bottom line concept of sustainability. The EPA is quick to stress in the EMS guidelines the importance of instituting a “Plan‐Do‐Check‐Act” model. Driving this idea is the conviction that even though a ports operational scope varies greatly depending on location and level of traffic (e.g. coastal ports are sprawling facilities compared to many of the smaller ports serving the Ohio River which see much less traffic). Putting into place a consistent set of procedures tailored to a port’s needs to develop, implement, monitor, and revise environmental programs is to ensure an EMS is an effective tool. As reviewed later, researchers built the audit template based on lessons learned at coastal ports, discussions with larger inland ports, as well as conversations with public inland port operators. What emerged from these meetings was the conclusion that a useful audit template must ask questions catered to the scale and size of a port, but which are also general enough in scope and nature that they could be applied to a wide range of facilities. This finding is consistent with guidelines for EMS prescribed by the EPA. The EPA document briefly touches on why an EMS can benefit port sustainability. Because moving freight via coastal and inland waterways is an environmentally sensitive and efficient mode compared to
97
other modes of transportation, significant growth in this segment is expected over the next 20‐30 years. An EMS can serve as a crucial lynchpin that ensures port officials remain committed to operating sustainably into the future. Senior staff plays “an active role in the EMS, continually assessing the organization’s progress toward its goals, looking for ways to improve management and performance, effectively allocating resources and personnel, and sustaining a commitment to the system through annual reviews and revision” (p. 4). The EPA identifies 13 elements that are needed to develop an EMS. A complete treatment of these elements is beyond the scope of this chapter. However, several of the recommendations contained in the guidelines directly relate to the audit process established by KTC researchers. To perform an effective audit, port operators would greatly benefit from the EMS guidance. This is because it promises to reduce the time needed to complete the assessment, and thus enables personnel to concentrate more on operational changes they might be interested in bringing about to improve sustainability performance. Specifically, Elements 11 and 12 of the EPA’s EMS guidance speak to the audit process. Element 11 involves establishing monitoring and management protocols for operations and activities that have significant environmental impacts. This entails tracking performance and routinely evaluating whether port operations comply with regulations. A number of performance indicators identified by the EPA are found in the audit template. Mostly, these are related to the operational side of ports. Many of the audit questions ask about inputs and outputs because they provide a shorthand way to succinctly gauge a port’s environmental footprint and sustainability. The EPA counsels monitoring items such as: amount of materials processed, amount of energy and water used during operations (and measures that have been taken to reduce usage levels) as well as outputs such as waste, carbon emissions, and heat/light pollution. While the audit template does not directly inquire about emissions, this could be inferred from the amount of traffic a port handles annually. However, the audit does focus on the issue of energy conservation as well as actions taken to reduce (for example) light and noise pollution. In this way, the audit template resonates with the principal concerns encompassed by Element 11 of the EPA guidance. Element 12 of the EPA guidance recommends that ports conduct audits and correct any problems that are identified during that process. Auditing extends the monitoring and measurement activities performed as part of Element 11. However, unlike the KTC audit template which functions more as an inventory of sustainability performance, the EPA suggests that audits serve a corrective purpose. Using audits, ports can identify shortcomings or problems with sustainability performance, identify strategies to remedy those issues, and then via subsequent monitoring determine whether the implemented solutions have proven effective. While the audit template can assist ports in picking out what areas could boost their sustainability performance, at this stage the intent of the audit is not necessarily prescriptive or corrective. Because KTC researchers crafted the audit template (as opposed to it being done in‐house at each port), it makes high‐level assessments. Based on the evaluation, ports can identify ways
98
that operations can be made more sustainable through low‐cost, easily implemented fixes. As research moves forward with this project, there will be an effort to collaborate with ports more closely. This could potentially develop methods to individualize audits so that they produce more targeted information that is highly specific and pertinent to the operations of each port. However, balancing specificity with the collection of generalized, high‐level information is imperative for making an audit template successful and widely applicable. Drilling down too deeply into the operations of individual ports can be problematic from a research perspective because it will obscure system‐wide trends in operations and sustainability performance that demand analysis. This would require scrutiny to reach valid conclusions about ways in which port operations and intermodal transportation can achieve greater sustainability. Clearly, EPA guidelines on EMS at ports were extremely instructive when the initial drafts of the audit template were assembled, particularly for determining specific indicators and measurements to include. Academic work on sustainability accounting is also useful for trying to understand what an audit should attempt to accomplish in the abstract, but no academic literature has applied, in a targeted, empirical manner sustainability accounting to coastal and inland ports. Taken alone, this literature would have been insufficient for creating an effective audit template because of its detachment from empirical case studies. Also, sustainability footprint modeling is still at a nascent stage and has been applied to a small range of sustainability performance indicators (e.g. quality of life). The EPA’s work on EMS provided a much‐needed supplement that helped researchers translate the principles of sustainability accounting and sustainability footprint modeling into a qualitative audit template. This was done so that inland ports could confidently gauge sustainability performance, and which KTC researchers could use to assess the condition of the U.S. inland waterway system. In doing so, strategies can be identified to encourage the expanded use of waterborne freight transport. Although not as central to the project as the EPA guidelines, the GRI Sustainability Reporting Guidelines were another key source of information early on. The GRI’s accounting principles were briefly mentioned in the above material, however, a fuller treatment is necessary. A main advantage of sustainability reporting is that it gives a wide range of organizations an outlet in which to transparently disclose their sustainability performance. The GRI Guidelines (2011) consist of a series of performance indicators which objectively evaluate how well an organization has adopted sustainable practices into their operations. Content of reports will vary by the nature of an organization; thus a report focused on inland ports will look different from one for a consulting firm. The reporting principles, however, remain invariant. As such, organizations are asked to report on the following principles: materiality (which includes a suite of indicators that demonstrate an organization’s economic, environmental, and social impacts, as well as other information that has value for stakeholders and decision makers), stakeholder inclusiveness, sustainability context (which situates an organization’s performance in relationship to sustainability trends at local, regional, and national levels), and completeness (which simply refers to whether the report is reasonably complete – that is, it attempts to convey a sweeping account of an organization’s performance).
99
Further, the GRI Guidelines include recommendations on quality control, as well as methods to decide what information to report. A key suggestion in the guidelines holds that information should be reported consistently across reports as this enables stakeholders to analyze and interpret changes in sustainability performance over time. This was particularly important during KTC’s design on the audit template. While each port is unique, it would be problematic to customize an audit template for each facility. This would inhibit comparison and give port operators an incomplete understanding of sustainability performance at their site. Standardizing the audit template was thus necessary, and it gives port operators the resources to compare sustainability performance on a year‐over‐year basis (and against other ports if operators have the desire to make results public). Finally, the GRI Guidelines emphasize the importance of reporting information in a timely manner. This is accomplished by using clear, understandable language, and taking precautions to guarantee that all information is carefully recorded and analyzed. What KTC researchers took away from the GRI Guidelines is the importance of developing a reporting template (and strategy) all ports can implement, and which appropriately contextualizes sustainability performance. The measures or policies count as sustainable at large coastal ports might be irrelevant for inland ports. As such, the audit template caters to the scale and scope of these facilities so it accurately represents conditions at each site. Creating the Audit Template
The previous section of this chapter provided in‐depth explanations of the conceptual foundations that underpin the current version of the audit template (called Version 3.0). As noted previously, an iterative process of development and revision was used to refine the template. This section comments on the methods used to pull together the audit template. The next section addresses the substantive changes made with each round of revisions. Although Version 3.0 represents a final draft for this phase of research, as discussed earlier, there is still considerable room for improvement and expansion. Initial development of the audit template began in the fall of 2012 after KTC conducted site visits to a number of major coastal and inland ports. The purpose of these visits was to understand how ports actively pursuing a sustainability agenda implemented practical policies and operational models to improve their triple bottom line. One of the challenges confronted early in the development process dealt with questions raised due to the incommensurable scales at which large coastal and inland ports operate, and the scale of operations for many of the ports in the Greater Ohio River Valley. Because large ports manage higher traffic volumes and use different equipment than most of the inland ports, it would have been inappropriate to simply transpose lessons learned and best practices cataloged from major ports to the audit template with the expectation they would be equally valid for smaller facilities.
100
Consequently, KTC researchers deliberately attempted to determine the scale and needs of inland ports. Based on this knowledge, KTC created the audit template so that it would re‐imagine what sustainability would look like in a compressed inland setting. Thus, large‐scale initiatives, such as those undertaken at massive facilities such as the Port of Los Angeles and Port of Long Beach worked as a point of departure, but did not dictate what counted as sustainable in the context of inland ports. Large‐scale coastal ports have immense management systems, whereas inland ports have much less complex management models. Because inland ports often run on tight budgets and enjoy only small profit margins, the likelihood of duplicating the efforts present at massive coastal ports is quite small. Nonetheless, like sustainability accounting and sustainability footprint modeling, knowledge and data collected from coastal and large inland ports were important for early template construction. As with the EPA guidance on EMS’s, seeing the programs facilities adopted were essential for populating the audit template with relevant questions. For example, the Port of Long Beach (recognized as a leader in sustainability), implemented a Green Port Policy, which attempts to infuse sustainable practices into every aspect of port development and operations. Officials at the Port of Long Beach draw on the familiar triple bottom line concept of sustainability, and sustainability programs are framed using this logic. On the environmental front, the port focuses on carrying out policies which can improve air quality, promote greater fuel efficiency, and safeguard local ecologies. Fiscally, the port is committed to increasing profitability and to equitably distributing the financial burden of making improvements and deploying new policies. With respect to social responsibility, the Port of Long Beach has instituted significant community outreach efforts, while seeking to eliminate health risks associated with port operations while creating new employment opportunities. Although previous chapters covered some of the more effective sustainability programs at different ports, repeating this information here serves a valuable purpose. Lessons learned and best practices cannot be inferred from theoretical ideas or conceptual frameworks alone; they are derived from conceptual‐theoretical knowledge along with empirical data gathered at real ports. Figure 1 illustrates the steps that guided template design. First, KTC researchers situated their work within a larger universe of academic literature (sustainability auditing, sustainability footprint modeling). This established conceptual foundations the KTC researchers worked from. With this knowledge they identified programs or initiatives at multiple governmental levels – such as the EPA framework for EMS – created to help ports strengthen their sustainability performance. While documents flowing out of these agencies sometimes offered ample empirical evidence of ports successfully adopting new sustainability initiatives, they typically spotlighted guidance. Guidance works primarily at a conceptual‐theoretical level, but it also functions as a bridge, one that gives ports the advice, footing, and know‐how to implement new programs extracted from conceptual frameworks. Using conceptual‐theoretical knowledge, purely, to inform audit development would have been insufficient because it would have omitted activities and
101
programs taking place at coastal and inland ports. As such, researchers then drilled down to see what unfolded on the ground at ports in terms of sustainability policies. This led them to ask critical questions about where gaps existed between theory and practice, which in turn brought into relief where mismatches occurred (such as where key ideas from conceptual frameworks remained un‐translated into practical actions, or where new programs designed to enhance sustainability had yet to filter into conceptual‐theoretical knowledge). After seeing where practices elided theory, KTC researchers could then revisit theoretical concepts and identify which ones were valuable and should be expressed in the audit template. Further elaboration will clarify this process. Researchers approached empirical data collection with a solid grounding in sustainability concepts. With these data points in hand, they then scrutinized material port operations. This process was iterative; following each port visit KTC researchers would reexamine conceptual‐theoretical assumptions in light of their observations. During subsequent port visits, researchers would refine interview questions based on data obtained from other sites. Researchers then would hone their observations on aspects of port operations that gradually emerged as salient to produce the initial draft of the audit template. As researchers visited more ports and revised their data collection, it produced a “recursive snowball effect.” The term “snowball effect” is often invoked in literature on social science methodology. It denotes, roughly, the process of acquiring interview subjects through referrals. As an interviewer speaks with a larger number of people, they gain knowledge of more contacts they can potentially get in touch with. This widens the effective sampling universe. A “recursive snowball effect” operates similarly. However, it applies mainly to the relationship between conceptual‐theoretical knowledge and knowledge that stems from empirical data. Of course, there is no definite partition between these two strands of knowledge, and they mutually inform one another. Returning to the methodology used here, conceptual‐theoretical knowledge was the starting point and the lens through which observations were made at ports. As researchers collected empirical data, they were able to refract that back upon conceptual‐theoretical frameworks, adjusting them in the process. In turn, conceptual‐theoretical knowledge was refined and enlarged (or narrowed, based on the circumstances). This situation amplified the capacity of KTC researchers to reinterpret empirical data. As the site visits progressed, researchers traced out stronger, more defined connections between conceptual‐theoretical and empirical knowledge. By iteratively revisiting both knowledge frameworks after every port visit, it produced a “recursive snowball effect.” This means the emergent body of knowledge generated through the negotiation and reworking of the empirical and conceptual‐theoretical strands continually deepened and became more tightly integrated. While the “snowball effect” refers to an essentially linear process (and applies to sampling procedures used to access more interviewees – not knowledge creation per se), the “recursive snowball effect” captures the nonlinear and iterative processes involved in enlarging interstitial knowledge (described above). This is done with the purpose of using that information to guide knowledge collection techniques to:
102
1) Assess material practices – i.e. the sustainability performance of ports 2) Develop new conceptual frameworks from data collected during the first step This effect, then, is about more than negotiating and enlarging knowledge. It is about laying groundwork that can be recursively modified through subsequent rounds of data collection, the intent of which is to ultimately enhance the sustainability capabilities of port operations. An iterative process of data collection and theory verification was used to ensure the audit template would be specifically tailored to the needs of smaller inland ports. As data collection progressed, the KTC research team constantly worked to identify effective strategies to convert lessons learned from coastal ports into an audit template for inland ports. After the initial round of port visits wrapped up in August 2012, development on the audit template began in earnest. Version 1.0 was designed to capture the essential aspects of operational and policy sustainability that were instrumental for coastal ports boosting their sustainability performance. However, KTC researchers prioritized operational sustainability in the audit template design because numerous coastal port officials cited this facet of sustainability as critical to not only improving environmental performance, but also increasing profit margins. Many practices that fall under the heading of operational sustainability, coastal port officials noted, simply counted as good business practices that were basically common sense. Avoiding these practices would be detrimental for any port ‐ although doing so would not rise to the level of negligence, it would diminish financial returns. Version 1.0 of the audit template was drafted in conjunction with a summary report that gave an overview of KTC’s findings based on the previous summer’s research. This report was a highly condensed form of the larger report, which the latter meticulously covers all aspects of the KTC fieldwork, and is attached at the end of this report as appendix B. After finalizing Version 1.0 of the audit template in spring 2013, KTC researchers scheduled onsite visits with 11 inland ports located in the Greater Ohio River Valley. This included all seven ports in Kentucky, with additional facilities targeted in Indiana, Ohio, and West Virginia. From May‐August 2013, KTC researchers conducted onsite visits with port operators. In advance of their arrival, KTC researchers sent port officials Version 1.0 of the audit template along with the 30‐page summary report. The template worked as a companion piece to supplement this report. Sending copies of the template in advance was also done to give port operators ample time to review the contents and offer them the opportunity to evaluate whether the template was framed to match their scope and scale of operations. More broadly, submitting the audit template to port operators let KTC researchers more accurately gauge the relevance for inland port operations. The purpose of giving port officials a copy of the summary report was to introduce them to the concept of sustainability, and also to familiarize them with how conducting operations more sustainably could vastly improve their economic bottom line. As noted in earlier chapters, often individuals unfamiliar with sustainability too‐quickly conflate it with environmental protection or stewardship (taken in isolation). The triple bottom line approach, which is the
103
epistemological foundation for much of this work, accentuates robust business performance. Not only does this complement environmental conservations, arguably it is profitability that gives organizations such as ports the financial wherewithal to support a broader range of sustainability initiatives. Over time, these can yield huge monetary dividends while increasing their sustainability performance. Thus, introducing the inland port operators to a more expansive understanding of sustainability (than likely they were exposed to previously) served an important function – increasing their receptivity to the concept of sustainability. If more inland port operators shift towards a sustainable operational model, it is probable the utilization of inland waterways to move freight will expand considerably. Although the KTC research team has been careful to avoid advocating policy or operational adjustments, a key part of its mission as a Tier I UTC is to produce research that has meaningful implications for U.S. transportation systems that will lead to improved functionality and resiliency (sustainability). From a methodological standpoint, adopting the approach described in the above paragraphs was justifiable because it served the dual purpose of increasing officials’ knowledge of sustainability and preparing them to complete the audit template, and also equip them with the concepts needed to critique content and structure. Once KTC researchers arrived for the meetings, port officials were ideally positioned to offer feedback. This was done so the audit template could be fine‐tuned. Similar to the previous stages of data collection, this round of interviews generated a “recursive snowball effect.” Yet, the dynamics contrasted (strongly) with those present during the summer 2012 data collection. This was because, now, the audit template itself functioned as a foundational document that would then be reworked once further empirical data collection had taken place. In this sense, Version 1.0 of the audit template played a role comparable to the conceptual‐theoretical knowledge nexus that was vital during its initial design and development. Because the version sent in advance to port operators had a provisional quality, there was considerable room to polish the template into a more lapidary form. Interestingly, the audit template worked on several levels. Perhaps the most important of which was a data collection instrument. The audit template, at this stage, represented a point at which conceptual and empirical knowledge collided. This unmediated interaction proved to be the best strategy to update the audit template so that revised versions would begin to narrow, and eventually seal off, the gap between conceptual‐theoretical knowledge and empirical data. Like the first round of port visits, KTC researchers would analyze the answers provided for each question on the template. This was done to make a preliminary determination about whether questions succeeded in uncovering essential information about the sustainability profile of the port, along with identifying which questions did not garner useful data points. Independent analysis of question responses was then combined with feedback received from port officials during the interviews. Officials were able to figure out where the audits illuminated operational aspects of their facilities that had previously gone unnoticed, and to
104
whether the knowledge it revealed would prompt a reevaluation of their management strategies in order to strengthen sustainability performance. With each site visit, KTC researchers were able to repeat the iterative process of analyzing the audit responses and interviews to understand how future versions of the audit template could be improved to fit the needs of port operators and meet research expectations. The onsite visits KTC researchers performed during June‐August 2013 were indispensable as they let KTC staff verify or disconfirm assumptions regarding the application/enactment of sustainability principles. Subsequent revisions to the audit template took into consideration: 1) Answers provided by the port officials to audit questions
2) Feedback obtained from written communication and interviews
3) Observational data collected by KTC researchers at ports
This triangulation ensured research outcomes were corroborated by multiple data sources. By triangulating, KTC researchers accelerated the “recursive snowball effect,” which further narrowed the impasse between conceptual‐theoretical knowledge and empirical particulars. This data culminated in Version 2 of the audit template, its fourth iteration. Because researchers carefully followed methodological protocols, they generated three post‐Version 1.0 audit templates based on site visits (conversations with port officials, post‐visit analysis and review). These versions show the “recursive snowball effect” in action. If KTC researchers had not been committed to such a methodological‐analytical model, it would have considerably slowed down the development of later draft versions. Upon concluding Version 2, KTC held one more round of Q&A sessions with port operators at each of the inland ports visited to finalize the template. This process was iterative, with each inland port operator making adjustments to the template. The final version of KTC’s Audit Template for Inland Port Sustainability reshapes the template design to fit more comfortably into general port terminology. It also, and more importantly, adds two sections to the template. During the final discussions with port operators, they identified economic sustainability and stakeholder interaction as important areas that the audit template did not adequately address. As a result, Version 3 of the audit template includes broad sections for both areas. The next section provides a comprehensive account of the changes incorporated as KTC researchers revised the audit template from Version 1.0 through to Version 3.0. However, it is worth closing this section with some reflections on the attitudes and feedback the audit template elicited from port officials. The summary report and audit template received a largely favorable response from port officials. Several port operators made extensive contributions by suggesting line‐by‐line revisions for the audit. Many of these revisions were adopted in later versions. These recommendations improved the usability and usefulness of the audit template.
105
Another area in which insights of port operators were constructive, dealt with helping KTC researchers to rephrase audit questions. This was done to accurately reflect terminology common amongst inland port operators. By eliminating superfluous language and framing questions using accepted terms, future users of the audit template will be able to navigate questions with greater ease. Version 1.0 relied on fieldwork undertaken at coastal ports. KTC researchers unwittingly attempted to use terms of art in the audit that were unfamiliar to the inland port personnel. This mismatch in terminology was also emblematic of the challenge inherent to scaling down the audit template to fit the needs of inland ports. Some terms, like “vessels” and “gantry cranes” are recognized at coastal “blue water” ports, but are rarely – if ever – encountered at inland ports. Likewise, inland ports are often subject to a different set of regulations than coastal ports. Interviews with port officials provided KTC researchers with an important learning moment as they absorbed information about the specific laws and regulations inland ports must comply with. These regulations carry with them unique discursive framings particular to the industry. Following interviews, KTC researchers were better prepared to rephrase or restructure questions to better reflect the regulatory terrain inland ports confront daily. While issues of language and terminology may seem minor or inconsequential, having these issues nailed down is essential if the audit is to gain traction among key stakeholders. Port operators will be disinclined to fill out the audit if it was not designed and written with care – and with the targeted user group in mind. Opting for an iterative process of revision was pivotal because it gave KTC researchers the chance to do corrective revisions on‐the‐fly. Once the necessary changes were added to the audit template, the research team could verify with other port operators (as well as ones that initially recommended a modification) whether the document had been satisfactorily amended. This section has described the methodological strategies used during initial fieldwork and throughout the design of the audit template. KTC researchers rigorously and scrupulously adhered to the methodological toolkit to streamline all phases of fieldwork, and to improve communication with port officials and other stakeholders critical to the inland waterway industry. The final result is Version 3.0 of the audit template, which was distributed to port operators upon completion. Once all of the audits have been returned to the KTC research team, KTC will compile and analyze responses to develop a composite narrative of the state of sustainability programs at inland ports in the Ohio River Valley. The goal of this analysis will be to draw out macro‐level conclusions, which will consist of appraising the system‐wide sustainability of the inland port network. However, researchers also plan to scrutinize audit responses. This will be done to identify blind spots and areas in which individual ports can viably adopt more vigorous sustainability policies and measures to enhance the triple bottom line, while also preparing them for a future in which waterborne freight transport is anticipated to expand rapidly. By doing so, ports will be able to accommodate traffic in a more sustainable manner.
106
A Version History of Audit Template Development (Transformation Process)
Version 1.0 of the audit template emerged from a synthesis of literature reviews, observations, and interviews conducted at coastal and inland ports from May‐August 2012. As noted, KTC researchers were attentive to the unique needs of smaller inland port facilities when they approached template design. Matching template questions to the scale of port operations was a key ingredient to creating a suitable audit. Although the triple bottom line served as a compass during the drafting process, the main objective was to shape the audit template so that it focused on the heart of sustainability. This will then enfold environmental and social concerns into an emphasis on business performance. Appendix C contains Versions 1.0‐3.0 of the audit template. Readers will immediately notice that operational sustainability ranks as the first set of questions on the template. This section is meant to collect basic information on port operational characteristics. There are categories ranging from the most frequently handled commodities, to the average amount of time that is required for a tow boat to dock, unload its cargo, take on any transfers, and then moving towards the next destination. Another issue that draws attention is the wording and framing of questions later in this section. The template asks operators to comment on the number and types of vessels that pass through a facility, along with the number of gantry cranes onsite. While these issues are perfectly relevant for coastal ports with larger operations, they are not as salient for smaller facilities. Similarly, “vessels” is not a term used to describe the ships which utilize inland ports ‐ “barge” or “tow boat” are substituted in later versions of the template as this is the parlance typically used for coastal ports. A final example of the discursive misalignments embedded in this section of template is deploying “impermeable surfaces” to describe large expanses of paved area. Most port operators merely refer to these areas as “paved storage.” The last section touched on the issue of terminology and discourse and how important it is to ensure that template questions speak to port operators by referencing accepted vocabulary. From a content/data‐gathering perspective it is not inaccurate to say phraseology does little to improve results. It demonstrates that KTC researchers, however, are committed to developing collaborative partnerships with port operators on their terms and their grounds. Building this trust is the only way to forge long‐lasting relationships that can, in the end, prove beneficial for all parties involved. KTC researchers will continue to take this approach as future phases of research move ahead as it is the only methodologically‐ and ethically‐sound choice. After investigating operational sustainability, Version 1.0 asks port operators more open‐ended questions about management systems, and whether they work in support of a broader sustainability policy. Starting with Version 2.0, this portion of the audit was removed. Many of the questions remained in the template, however, they were repositioned. Some questions were eliminated entirely (e.g. asking for a description of the port’s sustainability office). Many port operators who gave feedback stressed how important it is to emphasize the operational side of the equation. While management systems are certainly implicated in the operations of
107
any business or organization, moving these questions elsewhere (or making their content implicit in other questions) made sense because it refocused on the issue of port sustainability. Left in the Version 1.0 form, these questions could be perceived as unduly critical, especially if a port has not been able (for whatever reason) to institute measures to improve sustainability performance. Following these questions, the audit is partitioned into a sequence of sections that contain queries regarding environmental sustainability – including topics such as water conservation, energy conservation, waste reduction and recycling programs, noise abatement, supply chain sustainability, and community outreach (ports that have positioned themselves in the eyes of citizens as socially responsible organizations). Many of these questions, although somewhat modified in subsequent versions, remained substantively intact. Significant changes were made only if they dramatically reshaped the content and focus of a particular query. Version 2.0 of the audit template was drafted following onsite port visits in June‐August 2013. One key addition to this iteration of the template is an unambiguous confidentiality statement, contained on every page, which reiterates that all non‐public or proprietary information shared with KTC will not be divulged to other ports or industry stakeholders. This statement, which remains in Version 3, gives KTC the license to aggregate data across a number of ports into a summary or overview documents that may receive public distribution. However, ports will not be identified by name, nor will these reports contain any kind of information that would give readers the opportunity to connect data to a particular inland port. While this is irrelevant from an analytical viewpoint, it serves the vital function of forging mutual trust between KTC and stakeholders that participate in the research. Another significant change in Version 2.0 is a major modification of the Operational Profile section. These modifications were made based on conversations with several port officials who commented that the Version 1.0 Operational Profile was insufficient and gave an imperfect understanding of port operations. Respondents also noted the original version of this section was not structured in an intuitive, orderly way. This scenario hampered their ability to provide accurate answers quickly. To amend these oversights, the KTC research team restructured queries about the principal commodities handled by the ports. Like Version 1.0, this section asks port operators to list the top five commodities that pass through their facilities. It now also inquires about the percentage of each commodity moving inbound and outbound via truck, railroad, and barge. While Version 1.0 asked operators to generalize about turnaround, Version 2.0 makes the point of determining average turnaround time for each of the top five commodities. The reason is that averaging turnaround times across all commodities yields an inconclusive narrative. For instance, some sustainability policies may focus on elements of port operations that are disproportionately affected by the movement of one or two commodities. If this happens, recommendations to introduce new policies will have to be sensitive to the differential capacities of port facilities. Semantic adjustments (discussed
108
in the previous paragraphs) were also made in this section. Substantively, Version 2.0 contains updated queries related to the number of forklifts and cranes facilities own or lease, as these issues have greater relevance given the average scale of operations at inland ports. As noted earlier in this chapter, inland ports are often subject to regulations that are inapplicable to coastal ports. Thus, the second iteration of the audit template asks respondents to describe policies and regulations – especially on the environmental front – that have an impact on ports’ everyday operations. Exhaustively rehearsing all of the transformations implemented in Version 2.0 is beyond the scope of this discussion (readers are invited to perform their own comparisons), but a couple other revisions are worth talking about. These being the section on air quality that was condensed significantly to focus more on processes, and operational aspects that port officials control directly. As such, questions about retrofitting vessels with new engines or other emissions‐cutting technologies were eliminated. Many facilities lack the equipment or financial capacity to measure onsite carbon dioxide emissions regularly, as this question was removed. In Version 2.0 (and also in subsequent revisions) the “Air Quality” section prioritizes issues such as the fuel used to power cranes and forklifts onsite, policies that have been instituted to minimize dust, and whether policy or infrastructure changes have sought to reduce the length of engine idling. Another pronounced change in Version 2.0 is a greatly shortened section on “Community Engagement.” The intent is not to discount the importance of ports reaching out to their surrounding communities, but rather to give port officials the ability to describe – freely – what steps have been taken. Just as sustainability can only be contingently defined, individual ports will vary in their capacity and inclination to do community outreach. Asking more pointed questions (as Version 1.0 did) is a mistake because it gives the impression that only a pre‐defined range of activities identified by KTC researchers are valid. Structurally, and from a design standpoint, the shift from Version 1.0 to Version 2.0 is dramatic. The revisions incorporated to produce Versions 2.1 and 2.2, while still important, were more subtle than those executed during the jump from 1.0 to 2.0. Following the completion of Version 2.0, KTC researchers scheduled teleconferences with officials from several ports to gather more feedback. These interactions were extremely productive, and confirmed that the revisions were appropriate and corrected mistakes that had been noted during the feedback process. Versions 2.1 and 2.2 are not identical, but they are structural very similar. The major revisions made to these iterations involved questions about foreign trade zones. Previous versions of the audit asked for very little information regarding foreign trade zones. Information requested was restricted to whether a port qualified as a foreign trade zone (that is, a simple yes/no question). However, Versions 2.1 and 2.2 elaborate upon this and ask officials for more details. Specifically, in the Operational Model section, the audit asks respondents to describe their foreign trade zone status. This includes there status in the application process, and any subzone relationships that have a major impact on their facility. The other noteworthy change in Versions 2.1 and 2.2 come in the section on “Key Transportation Providers.” These iterations make additional provisions for the types of rail lines
109
that service ports. The audit queries respondents about the short line and Class I rail operators that move freight in and out of their ports. The last round of changes were conducted with direct input from each of the inland port operators visited by KTC in 2013. During facilitated sessions following the completions of Version 2.2 of the audit template, issues of financial sustainability and stakeholder involvement were identified as the areas that most needed addressing. As a result, the final version of the template included sections dedicated to each subject area. Specifically, Version 3 of the template gauges a ports revenue stream and whether or not a port receives public funding to remain viable. The financial sustainability section also determines if the port returns any dividends to the local or state government regarding profits, what the primary costs for the port are, and assesses the ports resiliency in terms of electrical power, water availability, and communications technology. In terms of stakeholder involvement assessment, the template now examines a ports relationship with the local community, regional government, customers, shippers, and community groups. Moreover, issues related to the sustainability preferences of stakeholders are examined as well. Finally, a “concluding thoughts” section now solicits feedback regarding how the port operator views the processes of sustainability and sustainability self‐assessment. While the modifications incorporated into the final two versions of the audit template are minor compared to the revisions that appeared in the second version, they are nonetheless critical to build a detailed operational profile of port facilities and sustainability performance. Making minor changes also attests to the usefulness of the methodological strategies employed by KTC researchers. It demonstrates the iterative cycle (which entails drafting the template) getting feedback, and making revisions based on gathered comments. This process should remain in place as KTC moves into future phases of research, and works to update and improve the content of the audit template. Arguably, this methodological strategy would benefit many of the projects KTC manages whose research outcomes demand prolonged, intense engagement with a wide array of stakeholders – both in the public and private sectors. The importance of talking with stakeholders should not be underestimated. Indeed, as KTC researchers worked through the process, they shifted from working with conceptual, high‐level academic literature (white papers that dispensed insightful knowledge) to meeting with port officials with intimate knowledge of the port industry and the quotidian aspects of port operations. Only by meshing these strands of knowledge into a cohesive synthesis was KTC able to develop and revise a workable audit.
Future Directions
This chapter has provided an exhaustive account of the steps taken to generate KTC’s port sustainability audit template. Beginning from conceptual foundations, researchers identified key issues and metrics that signal whether a port is developing and operating in a sustainable manner. Literature reviews – focused on areas such as sustainability accounting, sustainability

110
footprint modeling, and national and international standards for assessing environmental management systems – were the starting point. To draft the initial version of the audit template, KTC researchers visited a number of large coastal and inland ports during the summer of 2012 to observe what sustainability policies looked like on the ground and to determine best practices. Version 1.0 used data from these sources as a starting point. KTC researchers knew that the inland port industry, because facilities operate on much smaller scales than their coastal counterparts, would require an audit template uniquely tailored to their needs. After sharing Version 1.0 of the template with a number of ports in the Greater Ohio River Valley, KTC researchers made extensive revisions to better serve the inland port community. The final draft (Version 3.0) reflects the considerable revisions that were made during the editing process. As described, the methodological approach deployed by KTC was instrumental to successfully creating a finished product that will serve as a critical information source on the current levels of sustainability performance among ports in the targeted study area. Future research on this project will continue to refine the template and strive to add more quantitative measures. These measures can be analyzed statistically to establish a firmer understanding of what areas require new policy measures, so that ports can outperform their current levels of sustainability. It is important to build a solid understanding of a complex topic, like port sustainability, qualitatively before there is any effort at devising quantitative metrics or indices. Jumping too quickly into the latter activity can lead to errant, misleading results. Once analysis wraps up with the current research phase (after KTC receives and interprets all of the audits it has distributed), researchers will strategize to determine the best path to move forward. While this will certainly entail a shift into quantitative analysis, a long‐term goal of the research team is to develop a Port Sustainability Index (PSI) that will be multi‐faceted and carry out two main functions. First, it will give inland ports a way to self‐assess their sustainability performance (performance will be calculated using a series of evaluative tools and an accompanying scoring system). In this sense, the idea is for the PSI to work similarly to other sustainability assessment tools, like FHWA’s INVEST 1.0 and Greenroads. Each of these systems is used to determine the level of sustainability achieved by highway projects. Developing a comparable method to rate inland port sustainability could prove hugely beneficial as it will provide inland port stakeholders with an objective appraisal of sustainability performance. Whether a certification system is warranted is not clear at this point. Attaching a certification system to the PSI, though possible, could distract from the PSI’s main purpose, which is to expand awareness of the value sustainable operations brings to inland ports and waterborne freight transportation. The second component of the PSI would be a metric that looks at the system‐wide sustainability performance of the U.S. inland waterway system. Arguably, it will be more challenging to develop this, as it must account for a number of variables extending beyond port operations (such as freight movements, system capacity fluctuations, and measures employed
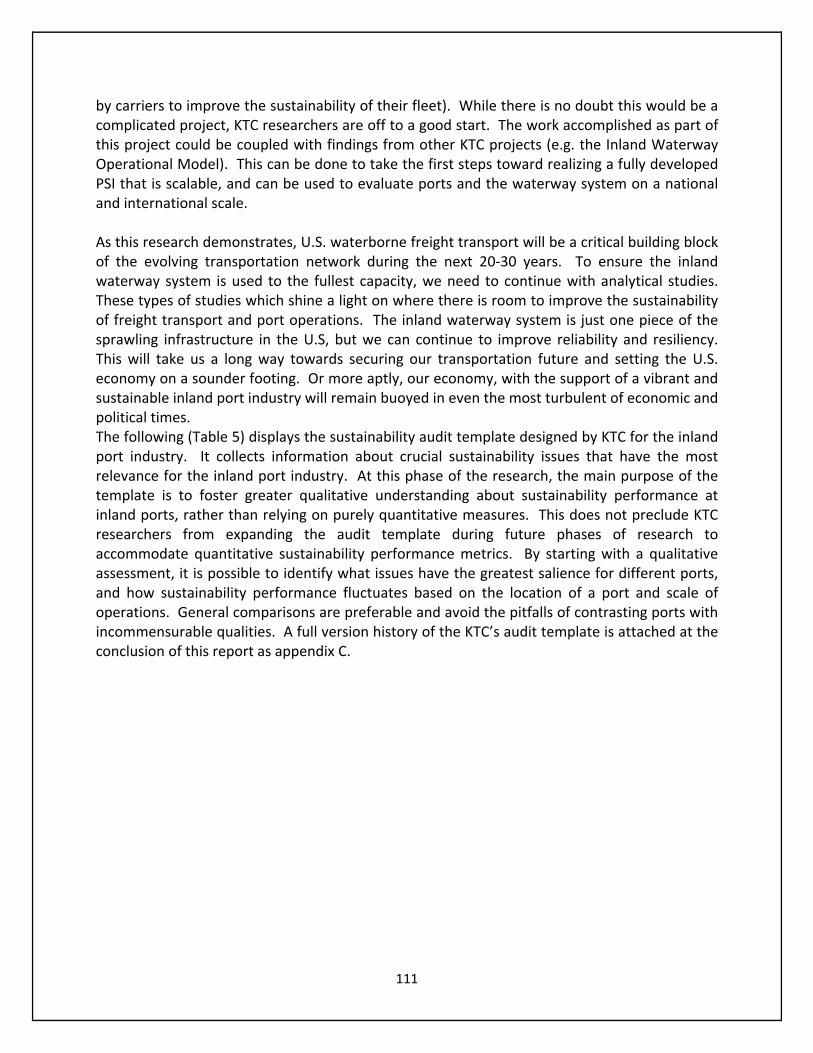
111
by carriers to improve the sustainability of their fleet). While there is no doubt this would be a complicated project, KTC researchers are off to a good start. The work accomplished as part of this project could be coupled with findings from other KTC projects (e.g. the Inland Waterway Operational Model). This can be done to take the first steps toward realizing a fully developed PSI that is scalable, and can be used to evaluate ports and the waterway system on a national and international scale. As this research demonstrates, U.S. waterborne freight transport will be a critical building block of the evolving transportation network during the next 20‐30 years. To ensure the inland waterway system is used to the fullest capacity, we need to continue with analytical studies. These types of studies which shine a light on where there is room to improve the sustainability of freight transport and port operations. The inland waterway system is just one piece of the sprawling infrastructure in the U.S, but we can continue to improve reliability and resiliency. This will take us a long way towards securing our transportation future and setting the U.S. economy on a sounder footing. Or more aptly, our economy, with the support of a vibrant and sustainable inland port industry will remain buoyed in even the most turbulent of economic and political times. The following (Table 5) displays the sustainability audit template designed by KTC for the inland port industry. It collects information about crucial sustainability issues that have the most relevance for the inland port industry. At this phase of the research, the main purpose of the template is to foster greater qualitative understanding about sustainability performance at inland ports, rather than relying on purely quantitative measures. This does not preclude KTC researchers from expanding the audit template during future phases of research to accommodate quantitative sustainability performance metrics. By starting with a qualitative assessment, it is possible to identify what issues have the greatest salience for different ports, and how sustainability performance fluctuates based on the location of a port and scale of operations. General comparisons are preferable and avoid the pitfalls of contrasting ports with incommensurable qualities. A full version history of the KTC’s audit template is attached at the conclusion of this report as appendix C.
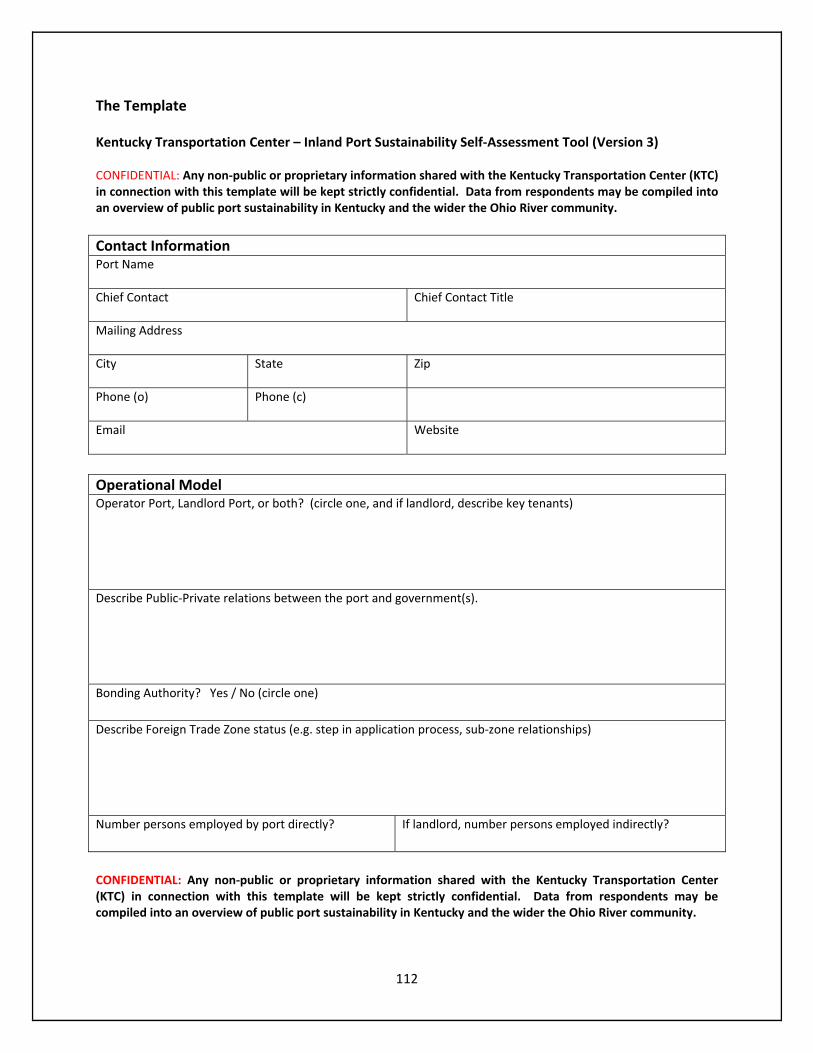
112
The Template Kentucky Transportation Center – Inland Port Sustainability Self‐Assessment Tool (Version 3) CONFIDENTIAL: Any non‐public or proprietary information shared with the Kentucky Transportation Center (KTC) in connection with this template will be kept strictly confidential. Data from respondents may be compiled into an overview of public port sustainability in Kentucky and the wider the Ohio River community.
Contact Information Port Name
Chief Contact
Chief Contact Title
Mailing Address
City
State
Zip
Phone (o)
Phone (c)
Website
Operational Model Operator Port, Landlord Port, or both? (circle one, and if landlord, describe key tenants)
Describe Public‐Private relations between the port and government(s).
Bonding Authority? Yes / No (circle one)
Describe Foreign Trade Zone status (e.g. step in application process, sub‐zone relationships)
Number persons employed by port directly?
If landlord, number persons employed indirectly?
CONFIDENTIAL: Any non‐public or proprietary information shared with the Kentucky Transportation Center (KTC) in connection with this template will be kept strictly confidential. Data from respondents may be compiled into an overview of public port sustainability in Kentucky and the wider the Ohio River community.
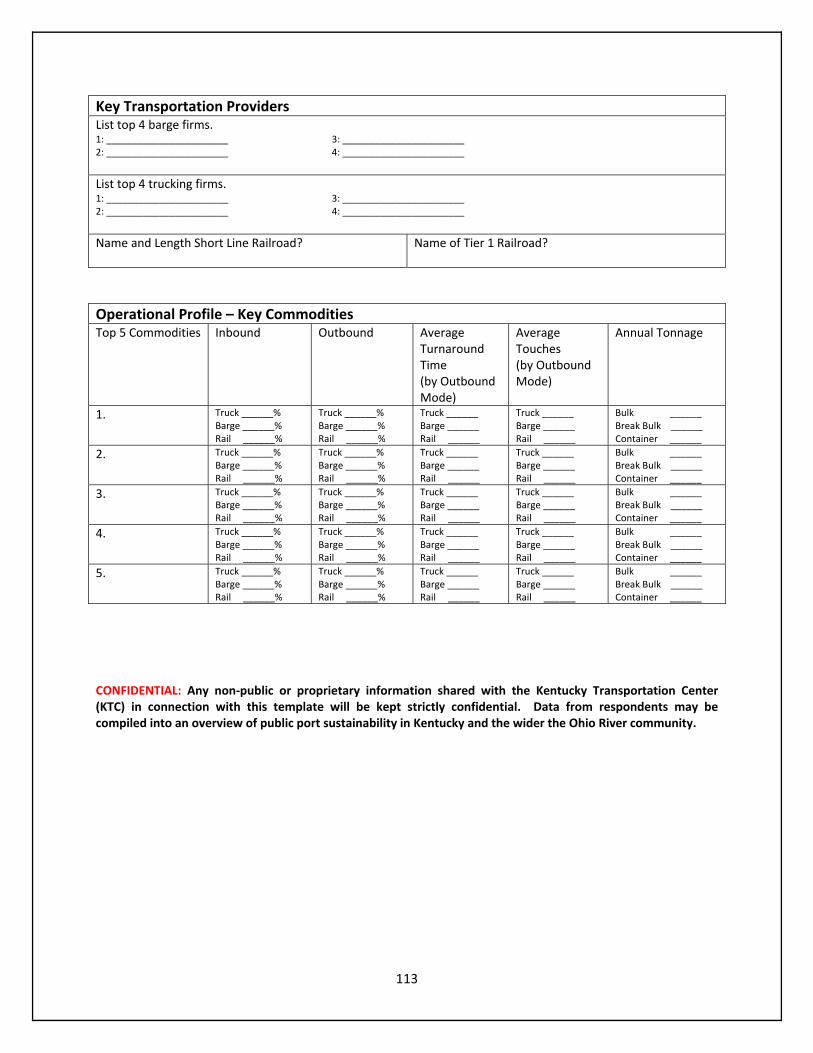
113
Key Transportation Providers List top 4 barge firms. 1: _______________________ 3: _______________________ 2: _______________________ 4: _______________________
List top 4 trucking firms. 1: _______________________ 3: _______________________ 2: _______________________ 4: _______________________
Name and Length Short Line Railroad?
Name of Tier 1 Railroad?
Operational Profile – Key Commodities Top 5 Commodities Inbound Outbound Average
Turnaround Time (by Outbound Mode)
Average Touches (by Outbound Mode)
Annual Tonnage
1. Truck ______% Barge ______% Rail ______%
Truck ______%Barge ______% Rail ______%
Truck ______Barge ______ Rail ______
Truck ______ Barge ______ Rail ______
Bulk ______Break Bulk ______ Container ______
2. Truck ______% Barge ______% Rail ______%
Truck ______%Barge ______% Rail ______%
Truck ______Barge ______ Rail ______
Truck ______ Barge ______ Rail ______
Bulk ______Break Bulk ______ Container ______
3. Truck ______% Barge ______% Rail ______%
Truck ______%Barge ______% Rail ______%
Truck ______Barge ______ Rail ______
Truck ______ Barge ______ Rail ______
Bulk ______Break Bulk ______ Container ______
4. Truck ______% Barge ______% Rail ______%
Truck ______%Barge ______% Rail ______%
Truck ______Barge ______ Rail ______
Truck ______ Barge ______ Rail ______
Bulk ______Break Bulk ______ Container ______
5. Truck ______% Barge ______% Rail ______%
Truck ______%Barge ______% Rail ______%
Truck ______Barge ______ Rail ______
Truck ______ Barge ______ Rail ______
Bulk ______Break Bulk ______ Container ______
CONFIDENTIAL: Any non‐public or proprietary information shared with the Kentucky Transportation Center (KTC) in connection with this template will be kept strictly confidential. Data from respondents may be compiled into an overview of public port sustainability in Kentucky and the wider the Ohio River community.
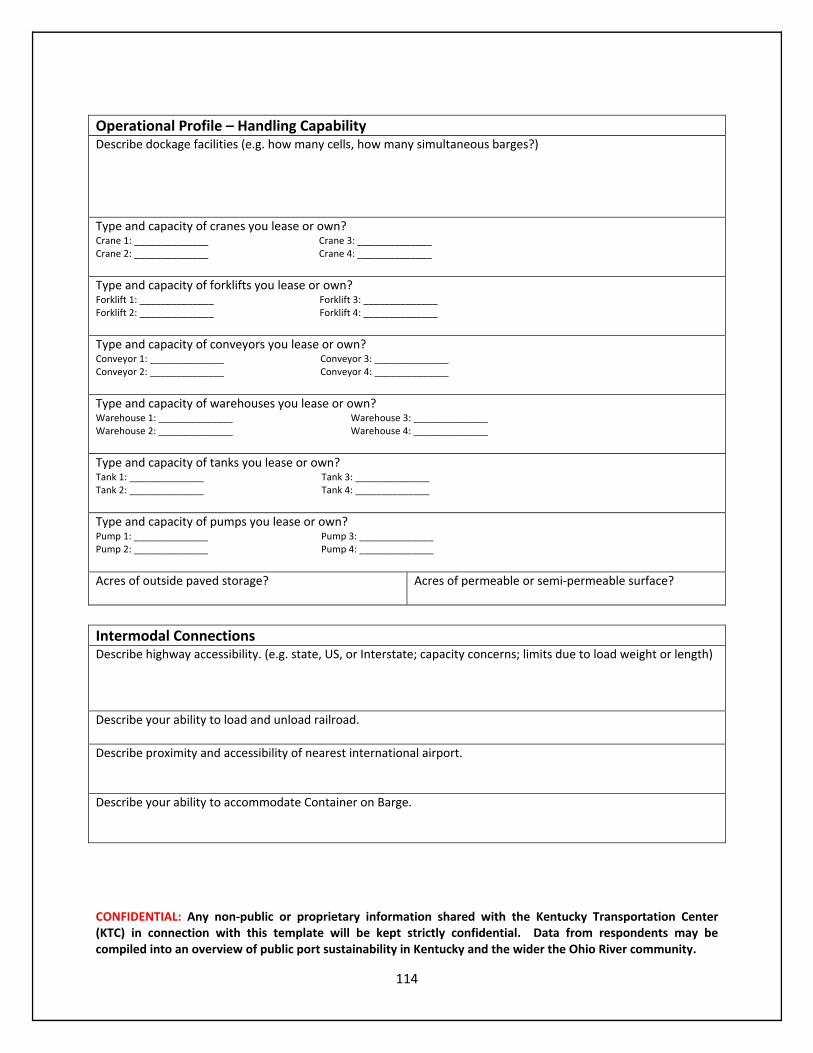
114
Operational Profile – Handling Capability Describe dockage facilities (e.g. how many cells, how many simultaneous barges?)
Type and capacity of cranes you lease or own?Crane 1: ______________ Crane 3: ______________ Crane 2: ______________ Crane 4: ______________
Type and capacity of forklifts you lease or own?Forklift 1: ______________ Forklift 3: ______________ Forklift 2: ______________ Forklift 4: ______________
Type and capacity of conveyors you lease or own?Conveyor 1: ______________ Conveyor 3: ______________ Conveyor 2: ______________ Conveyor 4: ______________
Type and capacity of warehouses you lease or own?Warehouse 1: ______________ Warehouse 3: ______________ Warehouse 2: ______________ Warehouse 4: ______________
Type and capacity of tanks you lease or own?Tank 1: ______________ Tank 3: ______________ Tank 2: ______________ Tank 4: ______________
Type and capacity of pumps you lease or own?Pump 1: ______________ Pump 3: ______________ Pump 2: ______________ Pump 4: ______________
Acres of outside paved storage?
Acres of permeable or semi‐permeable surface?
Intermodal Connections Describe highway accessibility. (e.g. state, US, or Interstate; capacity concerns; limits due to load weight or length)
Describe your ability to load and unload railroad.
Describe proximity and accessibility of nearest international airport.
Describe your ability to accommodate Container on Barge.
CONFIDENTIAL: Any non‐public or proprietary information shared with the Kentucky Transportation Center (KTC) in connection with this template will be kept strictly confidential. Data from respondents may be compiled into an overview of public port sustainability in Kentucky and the wider the Ohio River community.

115
Environmental Regulation / Policy Describe any air quality permits.
Describe any storm‐water discharge permits.
Describe any brownfield‐related permits.
Does your company have a program for educating employs on becoming more sustainable? If so, please describe.
Air Quality Check box to indicate fuel type. Crane 1: ___ diesel ___ electric ___ other (specify: ) Crane 2: ___ diesel ___ electric ___ other (specify: ) Crane 3: ___ diesel ___ electric ___ other (specify: ) Crane 4: ___ diesel ___ electric ___ other (specify: ) Forklift 1: ___ diesel ___ electric ___ propane ___ other (specify: ) Forklift 2: ___ diesel ___ electric ___ propane ___ other (specify: ) Forklift 3: ___ diesel ___ electric ___ propane ___ other (specify: ) Forklift 4: ___ diesel ___ electric ___ propane ___ other (specify: )
Describe efforts to minimize dust. (e.g. related to roads, conveyors, vehicle washing)
Describe process or infrastructure changes that have reduced engine idling times.
Do towboats have access to shore power?
CONFIDENTIAL: Any non‐public or proprietary information shared with the Kentucky Transportation Center (KTC) in connection with this template will be kept strictly confidential. Data from respondents may be compiled into an overview of public port sustainability in Kentucky and the wider the Ohio River community.

116
Water Conservation How is water being used at facility? (e.g. domestic, dust suppression, manufacturing)
Describe any processes or practices for managing storm water run‐off.
Describe systems for the reuse of gray water.
Describe procedures for recycling or disposing of wastewater discharged by barges or towboats.
Energy Conservation Conducted energy audit? Yes / No (circle one)
Average monthly electricity consumption? Highest – Lowest –
Electricity rate per Kw?
Describe use of renewable energy (e.g. solar, wind).
Number of outdoor light stanchions?
Number of bulbs per stanchion?
Type of bulbs in stanchions?
Wattage of bulbs in stanchions?
Describe use of automated lighting. If you use photo‐sensors, do lights burn all night long?
Describe use of LED lighting.
Does your facility purchase ENERGY STAR qualified equipment?
Solid Waste Reduction, Recycling and Disposal Describe procedures for recycling dredge material.
Describe procedures for recycling material generated by barges. (e.g. pallets)
Describe procedures for recycling office waste.
CONFIDENTIAL: Any non‐public or proprietary information shared with the Kentucky Transportation Center (KTC) in connection with this template will be kept strictly confidential. Data from respondents may be compiled into an overview of public port sustainability in Kentucky and the wider the Ohio River community.
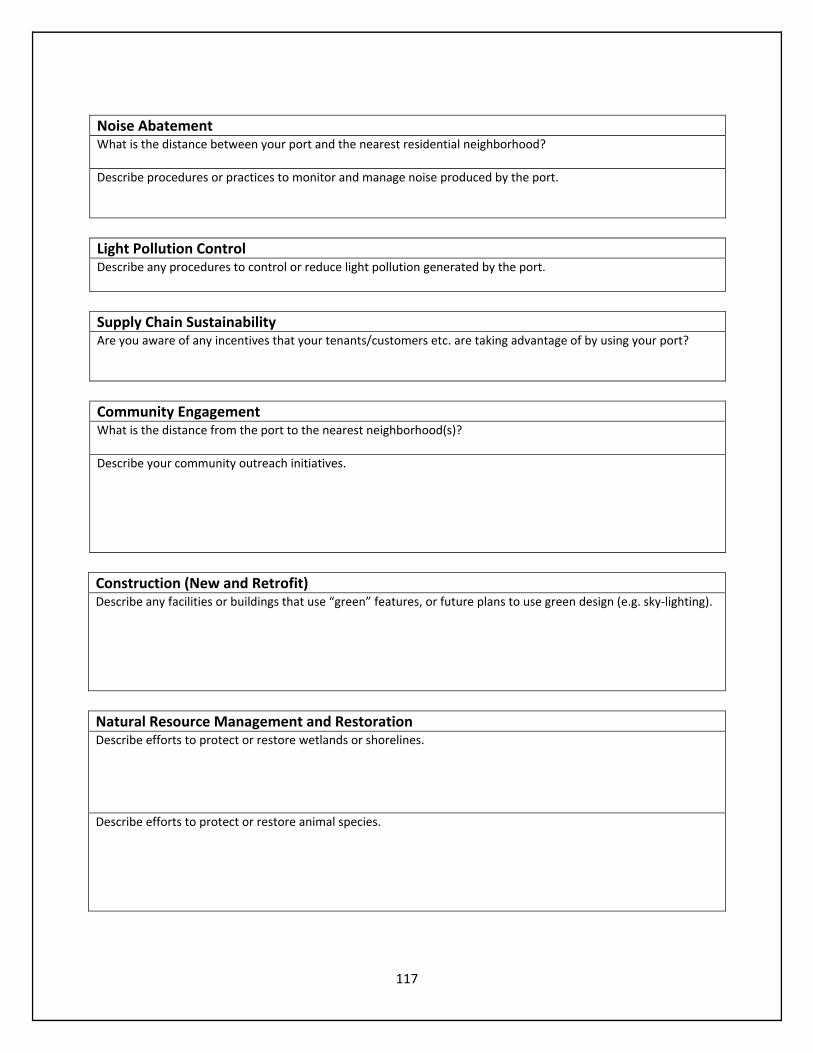
117
Noise Abatement What is the distance between your port and the nearest residential neighborhood?
Describe procedures or practices to monitor and manage noise produced by the port.
Light Pollution Control Describe any procedures to control or reduce light pollution generated by the port.
Supply Chain Sustainability Are you aware of any incentives that your tenants/customers etc. are taking advantage of by using your port?
Community Engagement What is the distance from the port to the nearest neighborhood(s)?
Describe your community outreach initiatives.
Construction (New and Retrofit) Describe any facilities or buildings that use “green” features, or future plans to use green design (e.g. sky‐lighting).
Natural Resource Management and Restoration Describe efforts to protect or restore wetlands or shorelines.
Describe efforts to protect or restore animal species.
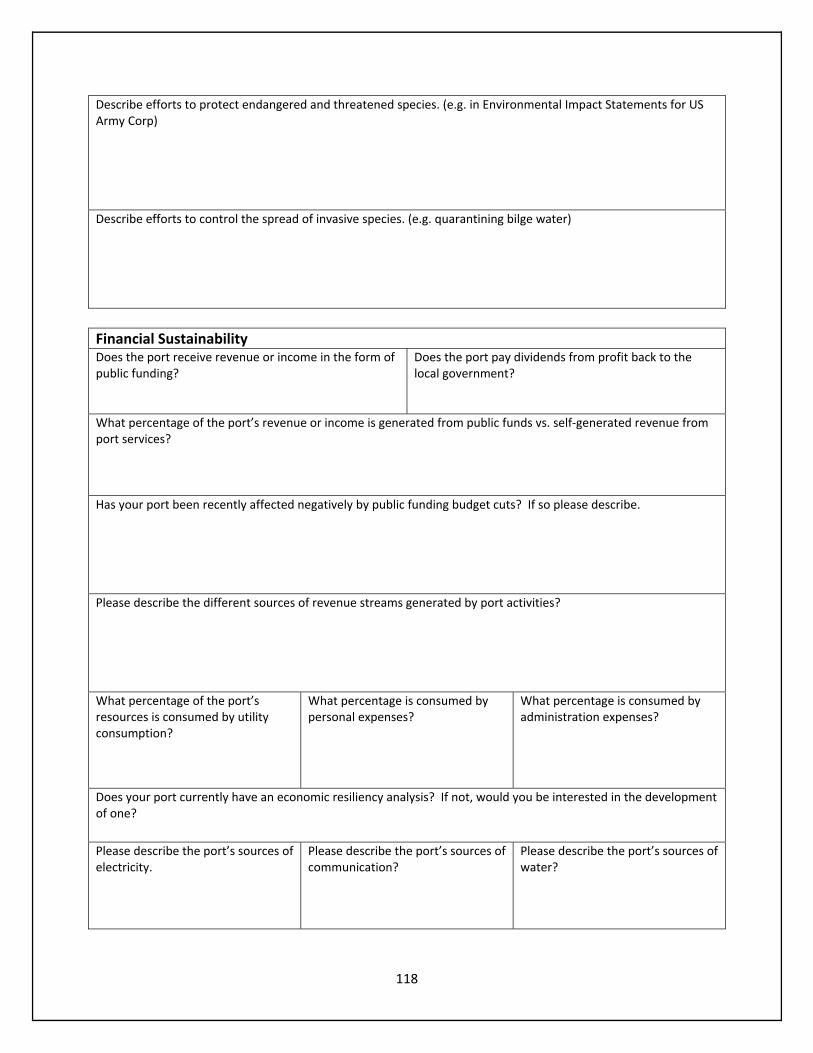
118
Describe efforts to protect endangered and threatened species. (e.g. in Environmental Impact Statements for US Army Corp)
Describe efforts to control the spread of invasive species. (e.g. quarantining bilge water)
Financial Sustainability Does the port receive revenue or income in the form of public funding?
Does the port pay dividends from profit back to the local government?
What percentage of the port’s revenue or income is generated from public funds vs. self‐generated revenue from port services?
Has your port been recently affected negatively by public funding budget cuts? If so please describe.
Please describe the different sources of revenue streams generated by port activities?
What percentage of the port’s resources is consumed by utility consumption?
What percentage is consumed by personal expenses?
What percentage is consumed by administration expenses?
Does your port currently have an economic resiliency analysis? If not, would you be interested in the development of one?
Please describe the port’s sources of electricity.
Please describe the port’s sources of communication?
Please describe the port’s sources of water?
119
Are there redundant sources of each? If so, please list.
Stakeholder Involvement Given the opportunity to bring stakeholders and members of the port’s supply chain into the sustainability performance improvement process at the port, list which of these entities you would seek to involve in the process.
1. 2. 3. 4. 5. 6.
7.8. 9. 10. 11. 12.
Have you received any of the following to improve the port’s sustainability profile?
Customers___________________________________Clients______________________________________ Local Community Groups_______________________ Shippers_____________________________________
Local Government_____________________________Regional Government__________________________ Non‐Governmental Organizations________________ Supply Chain Members_________________________
Do you believe that your customers/clients/tenants would respond favorably to a sustainability report describing the port’s sustainability improvements and advantages?
Which aspect of sustainability do you believe your customers/clients/tenants would most favorably respond to? (Economic, Environmental, Social)
Concluding Thoughts Which aspect of potential sustainability improvement is the most intriguing to you? Environmental Performance ___ Economic Performance ___ Social Performance ___
Please briefly explain why.
Which deliverable from the port sustainability audit process is the most intriguing to you? Results from Self‐Assessment Tool ___ Development of a Sustainability Office/Officer ___ Publication of a Sustainability Report ___ Facilitated Sessions with Stakeholders ___

120
Please briefly explain why.

121
Discussion
This report and the audit template represent the final deliverable of the Kentucky Transportation Center’s Inland Port Sustainability Project. The report has developed a framework for which the inland port industry can use to deepen its understanding of the important concepts underwriting sustainability. The information compiled within this report and the included audit template will empower inland ports to begin the process of collecting and sharing important information regarding their sustainability performance, the sustainability performance of their shippers and carriers, and the sustainability of the supply chains of which they are included. The stakeholders that inland ports do business with are increasingly pressed for information on sustainability performance, and want the same information from the members of their supply chains (which includes inland ports). As demand grows for more sustainable business practices, the inland port industry will have to respond. Only by collecting information on their current sustainability performance can they identify areas regarding underperformance, and then develop corrective policies. Likewise, inland ports would benefit by publicizing areas in which they excel. The KTC’s Audit Template for Inland Port Sustainability will help to expedite the process of data collection and sharing. Furthermore, the template will:
1. Refine inland port administrators’ concept of sustainability.
2. Offer the tools that inland port administrators need to assess the sustainability performance
of their operations, enabling them to pinpoint areas in which they are currently exceeding,
and locate shortcomings.
3. Provide inland ports the means to compare their sustainability performance against other
inland ports, coastal ports, and a wide range of other industries that have completed
sustainability audits.
4. Identify what elements of inland ports’ sustainability performance are attributable to internal
operations, and which are affected by activities taking place within their supply chain.
5. Make inland port administrators more knowledgeable about sustainability performance
attributes they should look for in shippers, carriers, and other stakeholders.
The audit template was designed to reflect the concerns identified directly by port stakeholders. The questions have been formulated based on discussions with the port operators themselves, relationships built with stakeholders, a review of the relevant academic literature, and an analysis of sustainability initiatives that have previously yielded successful results for both coastal and inland ports. The organization of the audit template stresses that all decisions about sustainability initiatives bring with them a set of potential economic costs and benefits. Port administrators can thus transparently weigh the costs and benefits of strengthening sustainability performance. The template also provides guidance, and directs inland port administrators to information sources that they can use to address problem areas highlighted by the audit. By keeping questions simple and focused, and by designing the

122
template to access attainable information, the template can be self‐administered, which builds a framework for more detailed and refined analyses in the future. The audit does not emphasize quantitative data collections because the project is designed to assess the current perceptions of sustainability in the inland port industry, and the extent to which knowledge about sustainability affects management and decision‐making. Later phases of this project may focus on developing quantitative performance metrics, but for now we are satisfied with providing the port industry with a tool to begin the sustainability process. The first steps to improving sustainability are universally considered the most difficult. Finding a starting point can be intimidating. The KTC Inland Port Sustainability Report and Self‐Assessment Tool provide this starting point. This report will serve as a stepping‐stone, giving port administrators the information to decide what course to pursue with respect to installing new sustainability programs. It is recommended that operators use this information to begin the process of establishing a sustainability office, and hiring personnel dedicated to overseeing a port’s sustainability performance. Once this new personnel is in place, the port will have the means to communicate information about the port’s sustainability performance to shippers, carriers, coastal ports, multiple levels of government, and other key stakeholders. Ports can use the information obtained from the audit to determine any gaps in data collection that need to be filled to more thoroughly assess sustainability performance. It is recommended that ports participate in formal meetings with stakeholders to discuss audit findings, and to potentially work out collaborative agreements that enable stakeholders and port administrators to devise an orchestrated response to lingering sustainability challenges. Supplied with a far‐reaching understanding of their own sustainability performance, and the concept of sustainability more generally, port administrators can move forward with confidence knowing they have the knowledge to build a more sustainable port that will be an instrumental, viable, and resilient link in the U.S. inland waterway system for years to come.

123
This page left intentionally blank.

124
Chapter 9: Addendum ‐ The Expansion of the Panama Canal, the Strategic Importance of the
U.S. Inland Waterway System, and Challenges Specific to Kentucky Ports
Moving from a Coastal to an Inland Perspective
There are a number of reasons why inland river ports have lagged behind coastal ports in developing sustainability programs. One reason is that inland river ports deal with considerably less traffic than coastal facilities. Because of this, they produce less pollution than coastal ports. Nonetheless, inland ports are key links in a number of supply chains (they are connected to coastal facilities and their stakeholders as well). Even so, sustainability initiatives have been prioritized at coastal ports. Most port officials – along with their stakeholders – continue to search out new policy implementation strategies to transition to a more sustainable way of operating.
As coastal ports and private interests become more focused on their own sustainability and the sustainability of their supply chains, inland ports and waterways will grow in importance. Inland port operational sustainability will be more scrutinized than they are currently. As a result, pressure is being applied on the inland port industry to adopt some of the policies, programs, and initiatives of their larger coastal brethren. However, while the impulse to become more sustainable is well placed, it would be misleading to assume that policies at coastal ports will translate perfectly to small inland river ports. Thus, any recommendations to improve sustainability must meet three requirements. First, sustainability initiatives for inland ports must positively impact the financial bottom line or, at the very least, be financially neutral. Second, any sustainability advice given to inland ports needs to first focus on improving the port’s information capabilities regarding the relationship between their operations, policies and sustainability impact. Finally, any sustainability recommendations need to focus on minimizing upfront investment costs to the ports themselves.
This means that sustainability initiatives appropriate for the inland port industry will differ substantially from most of the programs and investments taking place at coastal ports. Coastal ports, however, do offer many lessons the inland port industry can draw upon. A number of sustainability programs in place at coastal ports could be translated to the inland context with only minor adjustments. More importantly, however, is coastal ports’ overwhelmingly positive experiences with engaging sustainability. Inland ports can take a cue from coastal ports, which did not improve their sustainability with large, one‐time investments. Coastal ports became more sustainable by assigning dedicated personnel to investigate and implement strategies that would gradually enhance their sustainability.
Sustainability does not look the same everywhere, as coastal ports were early to recognize this. Developing a comprehensive strategy requires having a full understanding of local economic, environmental, and social pressures – this is a perspective that will greatly benefit inland ports as they move forward. Based on this knowledge, ports can determine what sustainability initiatives offer the appropriate balance of financial, environmental, and social returns on investment.
125
The Sustainable and Strategic Value of the U.S. Inland Waterway System
Sustainability has become a growing concern for businesses and industries globally. Large and small industries alike now strive to present themselves as conscientious stewards of the environment, that work to improve the livelihoods of people in the local communities. Businesses, however, do not want to sacrifice their profitability merely to portray themselves as behaving in a sustainable manner. So far, this report has devoted a great deal of space to discussing what sustainability means for the coastal and inland port industries, respectively. But it is worth stepping back to discuss the strategic value of the inland waterway system to the U.S. economy. Because it plays such a critical role in preserving economic security and fostering development, it is essential that the U.S. inland waterway system be in good condition. The current state of locks, dams, and other key elements of riverine infrastructure is extremely precarious.
The American Society of Civil Engineers (ASCE) in their 2012 annual report graded the physical infrastructure of the inland waterway system at a “D‐”. The report cites aging locks and dams as a primary cause for concern. Without new investments, regarding waterways infrastructure, their ability to accept new traffic will diminish. Indeed, the inland waterway’s functionality is intimately tied to locks and dams – most of which are in a poor state of repair. The original lifespan of the locks and dams, upon completion, was estimated at 50 years. Of the locks still used in the U.S. today, 30 were constructed in the nineteenth‐century and another 92 are over 75‐years‐old. The USACE recently noted that nearly 50 percent of existing locks are functionally obsolete, and 80 percent are beyond their planned design life (American Society of Civil Engineers, 2006).
The state of disrepair concerning inland waterways infrastructure is currently not sustainable over the long‐term. Without corrective action, it is unclear whether the inland waterways can handle significant upticks in traffic. It is beyond the scope of this report to recommend infrastructure changes that will support an expansion of freight movement, but it is important to consider that gains made in port sustainability could be negated by infrastructure that imposes delays and creates supply chain bottlenecks. The maintenance of the inland waterways continues to be a key concern for the industry and related stakeholders. However, with tight budgets and the depletion of the Inland Waterways Trust Fund, the future remains uncertain despite the enormous benefits that can be realized by expanding inland waterway usage.
Economists predict that the U.S. economy will double in size between now and 2025 (Bureau of Transportation Statistics, 2006). The lifeblood of the U.S. economy is the domestic transportation infrastructure that consists of a complex network of roads, railways, and inland waterways. Given, however, that the rail and road transportation networks are rapidly nearing capacity, it is predicted that the use of inland waterway systems must increase to realize these predictions about U.S. economic growth. Transport via truck, for instance, presently accounts for over 30 percent of the traffic on the interstate system. This share is projected to increase significantly over the next twenty years. By 2020, projected increases in truck volumes of 62

126
percent and rail freight volumes of 44 percent will begin to strain the U.S. freight transportation system (Jackson and Troxell 2007).
As road and rail networks become more congested and approach maximum capacity, the industry will need to increasingly look toward the inland waterways to satisfy shipping needs. Currently, the inland waterway accounts for approximately 11 percent of total domestic freight movement, behind road and rail respectively (USDOT 2009). Although railways and highways are quickly approaching capacity, the inland waterway system has substantial room to grow without bumping up against capacity limits. The principal commodities moved via inland waterways include: coal, petroleum, farm products, chemicals and crude materials such as aggregates for construction and other minerals. As such, the inland waterways are of considerable strategic importance for the U.S. economy. The total annual volume of freight moved on the inland waterways is approximately 630 million tons, with 20 percent of all coal shipped moving along the inland waterways. From the perspective of energy security, coal generates over half of all electricity generated in America. This highlights the importance of the inland waterways in securing the country’s energy future (USDOT 2009).
The inland waterways system not only provides an alternative manner of transport, it is also the most sustainable way to move commodities. The inland waterway system has a significant comparative advantage over rail and highways with respect to the amount of energy consumed during shipment. For example, one gallon of fuel can move one ton of cargo 514 miles by barge (See Figure 11). Conversely, one gallon of fuel can move the same amount of cargo just 59 miles when carried by a truck (Kentucky Association of Riverports). Marine fuel efficiency rates are better than rates achieved for rail or road. Crucially, inland water transport is also noticeably safer (averaging one fatality per 155 truck transport fatalities) than alternative modes of shipment. Inland waterway transportation is an exemplar of sustainability. Used judiciously, it strengthens the triple bottom line of ports and supply chain stakeholders alike (National Waterways Council 2012; Kruse, Protopapas, and Olson 2012).
Aside from the above, there are several other sustainability benefits obtained through inland waterway transportation. Compared to overland modes of routing, there is a smaller probability of hazardous materials experiencing an accidental release when they are moved via barges. Annually, inland towing spills 2.59 gallons of hazardous materials per million ton‐miles. This figure is higher for rail and truck, which average 4.89 and 10.41 gallons, respectively, per million ton‐miles (Kruse, Protopapas, and Olson 2012). Transporting goods on inland waterways is comparably resource neutral compared to other modes. In other words, there is less infrastructure expense borne by the inland waterways movement. For example, if all waterborne freight were diverted to highways, it would place heightened stress on roads (reducing their expected life span) and motivate the construction of new routes to accommodate increased usage. It would require, also, significant investments to build new bridges, ramps, weigh stations, and other components essential for facilitating shipments.
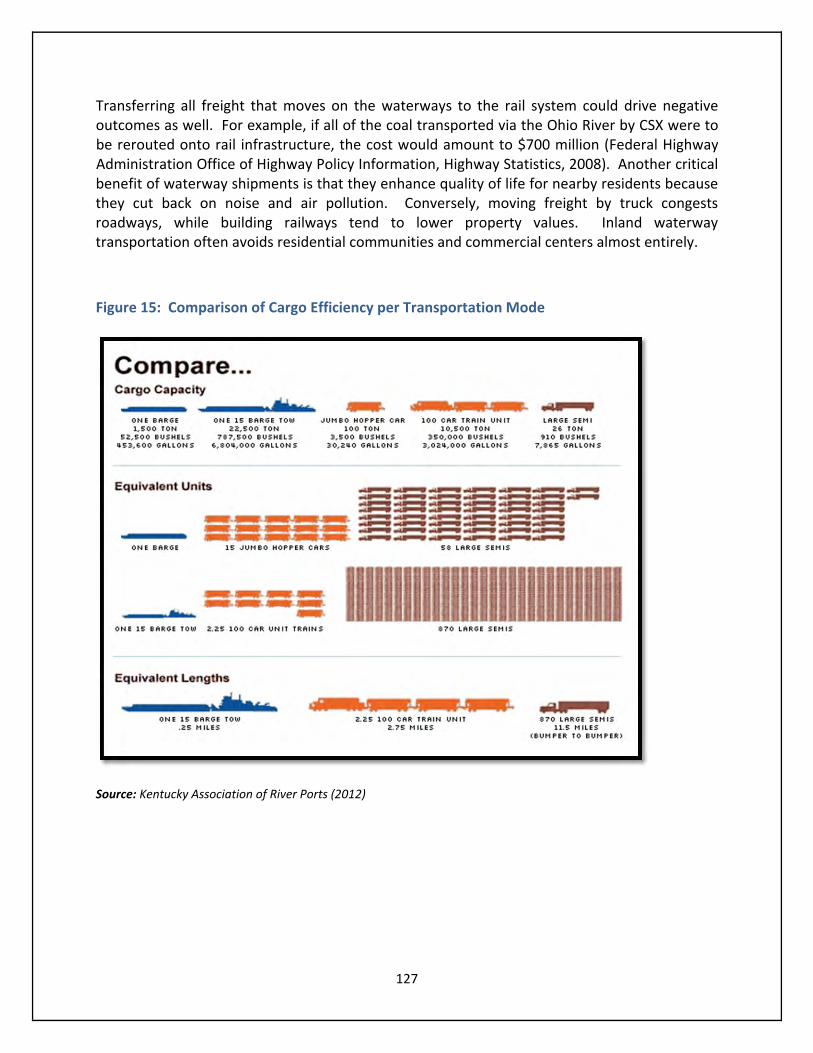
127
Transferring all freight that moves on the waterways to the rail system could drive negative outcomes as well. For example, if all of the coal transported via the Ohio River by CSX were to be rerouted onto rail infrastructure, the cost would amount to $700 million (Federal Highway Administration Office of Highway Policy Information, Highway Statistics, 2008). Another critical benefit of waterway shipments is that they enhance quality of life for nearby residents because they cut back on noise and air pollution. Conversely, moving freight by truck congests roadways, while building railways tend to lower property values. Inland waterway transportation often avoids residential communities and commercial centers almost entirely.
Figure 15: Comparison of Cargo Efficiency per Transportation Mode
Source: Kentucky Association of River Ports (2012)
128
The inland waterways are a huge contributor to the economic vitality of Kentucky and surrounding regions. Of all the nation’s inland waterway systems, the Mississippi River system is by far the most important and active. Of the nearly one billion tons of commodities shipped via America’s waterways in 2010, over 90 million passed through Kentucky’s waterways – a large number because Kentucky contains nearly 1,100 miles of navigable waterways and links everything from the Great Lakes, Canada, Mexico, and the coastal ports of New Orleans and Mobile.
The primary value of inland waterway transportation lies in the volume of material a single barge can transport. For instance, a fully‐loaded, covered hopper barge moving wheat contains enough raw materials to produce 2.5 million loaves of bread. A fully‐loaded barge transporting gasoline stores enough to satisfy the annual gasoline demand of approximately 2,500 people (National Waterways Council 2012). Furthermore, the amount of cargo currently transported on inland waterways is the equivalent to the quantity shipped by 51,000,000 truck trips annually. Diverting all of the current waterway freight traffic to the nation’s highways would add 742 trucks (to the current 887) per day per lane on a typical interstate (U.S. Army Corps of Engineers Navigation Data Center 2009). Together, the environmental, social and economic benefits of waterway transportation revealed by the numbers illustrate the immense value of both the inland waterways and the inland port industry.
The Impact of the Panama Canal Expansion
Although mentioned previously in this report, it is worth reflecting on the potential role the Panama Canal expansion will have in shaping the future of coastal and inland port industries. Since opening in 1914, the Panama Canal has improved the speed of international trade. To date, over 957,000 vessels (carrying close to 8.5 billon tons of cargo) have passed through the Canal. Annually, 13,000 ships transit the canal, which works out to an average of 35 per day. While the canal handles all forms of commodities (such as grain and petroleum), loaded containers account for the majority of cargo moving through. Overall, approximately 12 percent of all American trade has a connection to the Panama Canal (Rodrique, 2011). Despite significant capacity, growth in traffic has increasingly strained the capacity. Presently, the Panama Canal can accommodate any vessel up to 965 feet in length, 106 feet wide, and a draft up to 39.5 feet. Many ships operating today exceed these dimensions. However, the canal is closed off to them, which delays the flow of goods. To resolve this problem, Panama Canal authorities proposed a $5.25 billion expansion in 2006 (Rodrique 2011).
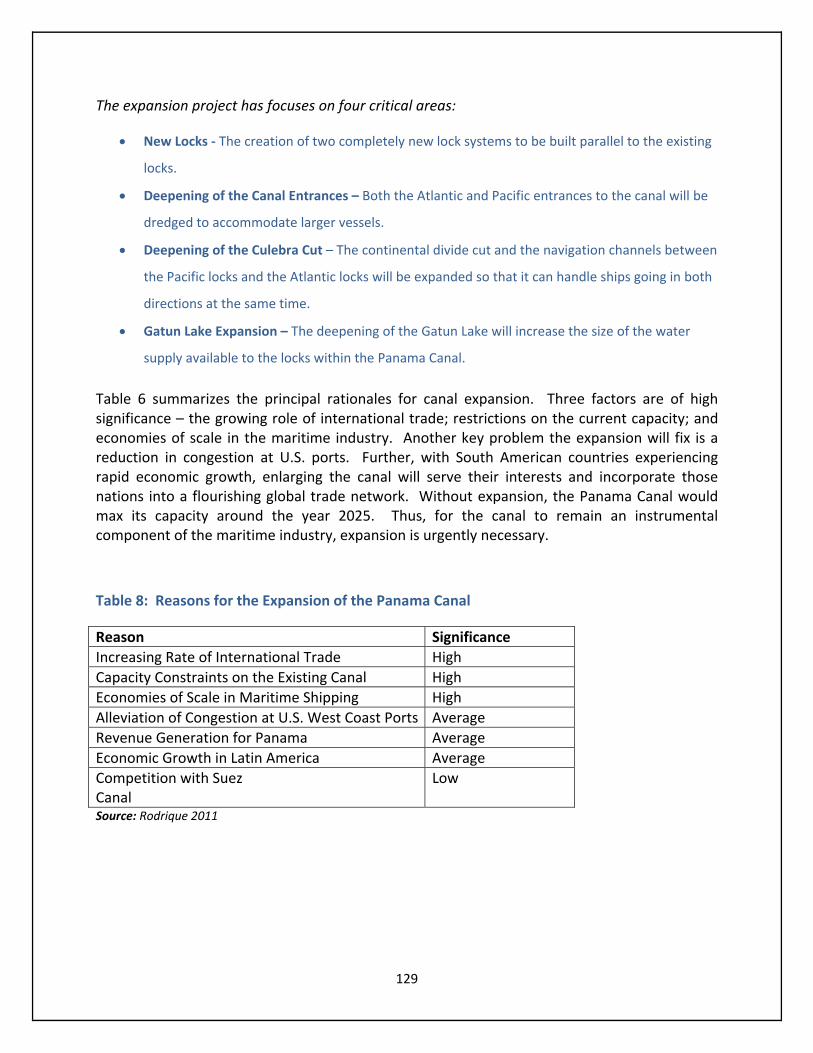
129
The expansion project has focuses on four critical areas:
New Locks ‐ The creation of two completely new lock systems to be built parallel to the existing
locks.
Deepening of the Canal Entrances – Both the Atlantic and Pacific entrances to the canal will be
dredged to accommodate larger vessels.
Deepening of the Culebra Cut – The continental divide cut and the navigation channels between
the Pacific locks and the Atlantic locks will be expanded so that it can handle ships going in both
directions at the same time.
Gatun Lake Expansion – The deepening of the Gatun Lake will increase the size of the water
supply available to the locks within the Panama Canal.
Table 6 summarizes the principal rationales for canal expansion. Three factors are of high significance – the growing role of international trade; restrictions on the current capacity; and economies of scale in the maritime industry. Another key problem the expansion will fix is a reduction in congestion at U.S. ports. Further, with South American countries experiencing rapid economic growth, enlarging the canal will serve their interests and incorporate those nations into a flourishing global trade network. Without expansion, the Panama Canal would max its capacity around the year 2025. Thus, for the canal to remain an instrumental component of the maritime industry, expansion is urgently necessary.
Table 8: Reasons for the Expansion of the Panama Canal
Reason Significance
Increasing Rate of International Trade High
Capacity Constraints on the Existing Canal High
Economies of Scale in Maritime Shipping High
Alleviation of Congestion at U.S. West Coast Ports Average
Revenue Generation for Panama Average
Economic Growth in Latin America Average
Competition with Suez Canal
Low
Source: Rodrique 2011
130
Many stakeholders in the U.S. coastal and inland port industries have questions on the domestic implications of the Panama Canal expansion. However, there is no clear answer at the moment. Currently, much of the freight that arrives in the U.S. does so at ports dotting the West Coast. Included among these are the Ports of Long Beach, Oakland, Seattle, and Vancouver. After goods are unloaded, they make the journey to the Midwest and East Coast. This is accomplished using a combination of road and rail networks designated as the North American Landbridge. The increased proliferation of shipments moving on the Landbridge was a primary catalyst that drove the push to expand the Panama Canal – it has generated competition and has reconfigured the geography of global maritime shipping. But with growing concerns about the long‐term reliability of the Landbridge, in addition to rapidly expanding trade between China and the U.S., multiple industry stakeholders expressed an interest in opening up all‐water routes between Pacific Asia and the American East Coast. The Panama Canal expansion will accomplish this goal.
Although the final outcome of the expansion remains uncertain, experts have identified a number of impacts likely to follow after the project is completed. It is probable that expansion will be a net positive for inland ports and the inland waterway system. Some of these benefits will be direct (e.g. producing an uptick in container on barge movement along the major U.S. waterways), while others will be indirect (e.g. increasing congestion along surface transportation corridors, which will make the waterways a more attractive shipping option). The increased use of transcontinental rail moving freight across the U.S. has resulted from the Panama Canal lacking the capacity to receive and process the largest shipping vessels operating today. Because of this, larger vessels leave the points of departure in Pacific Asia and take a direct route to the West Coast, because the ports there can accommodate them. Once docked, cargo is removed and shipped via railways and highways to East Coast markets (Figure 12). After the Panama Canal expansion is finished, an increase in traffic along north‐south running rail and road networks is probable. The most viable solution to alleviate congestion on those routes will be the inland waterway system.
With respect to container on barge, this is an uncommon practice on the U.S. inland waterways. Although some stakeholders expressed optimism that the expansion would prompt an increase in container on barge traffic, many of the officials that KTC researchers spoke with were more skeptical. Stakeholders who argue that the Panama Canal expansion will ignite container on barge traffic use the following line of reason. The expansion will increase container traffic, which will arrive at U.S. ports. Because the growth in container traffic will be so quick, existing rail and highway networks will lack the capacity to efficiently and economically move freight to the destination. This decline in efficiency will offer an incentive to invest in container on barge.
Some ports are confident enough in the future of container on barge that they have moved ahead with investments and infrastructure upgrades that will let them handle shipments in this form. But it is critical to stress that container on barge is unlikely to grow exponentially in the near term. For the time being, container on barge will likely remain a niche market. Investments, when they occur, will be conservative until port officials get a better sense of how this mode of shipment will fair over the long‐term.

131
Figure 16: North American Trade Route through the Panama Canal
Source: Rodrique 2011
Specific Challenges to Implementation of Port Sustainability in Kentucky,
& the Importance of Facilitated Sessions
Before concluding, it is useful to reflect on some of the challenges facing inland river ports in Kentucky as they aim to become more sustainable. Like much of the inland port industry, facilities in Kentucky do not have a high awareness of sustainability, although port officials expressed a readiness to move toward more sustainable operating models if resources allow. To date, most of the ports in Kentucky have not significantly progressed toward comprehensively instituting sustainability programs. This research, although geared toward understanding where there are opportunities for improvement in sustainability at inland ports, also proved beneficial because it has increased port officials’ awareness of sustainability and the importance of thinking more sustainably as they move forward. Discussions with key stakeholders in Kentucky’s port industry indicated they did not have sustainability at the top of their agenda, but they were interested in adopting new policies if it would lead to operational benefits. The audit template created by KTC researchers is as much about education as it is self‐assessment. By taking an inventory of their practices and policies, the audit can give port
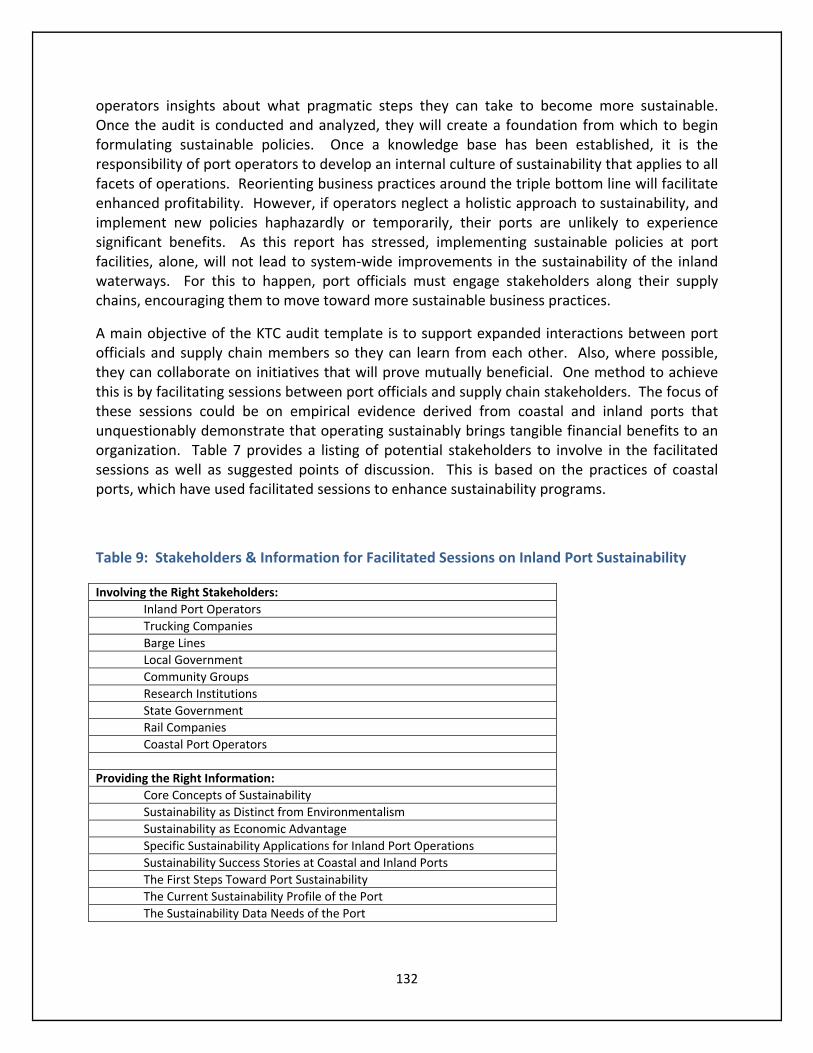
132
operators insights about what pragmatic steps they can take to become more sustainable. Once the audit is conducted and analyzed, they will create a foundation from which to begin formulating sustainable policies. Once a knowledge base has been established, it is the responsibility of port operators to develop an internal culture of sustainability that applies to all facets of operations. Reorienting business practices around the triple bottom line will facilitate enhanced profitability. However, if operators neglect a holistic approach to sustainability, and implement new policies haphazardly or temporarily, their ports are unlikely to experience significant benefits. As this report has stressed, implementing sustainable policies at port facilities, alone, will not lead to system‐wide improvements in the sustainability of the inland waterways. For this to happen, port officials must engage stakeholders along their supply chains, encouraging them to move toward more sustainable business practices.
A main objective of the KTC audit template is to support expanded interactions between port officials and supply chain members so they can learn from each other. Also, where possible, they can collaborate on initiatives that will prove mutually beneficial. One method to achieve this is by facilitating sessions between port officials and supply chain stakeholders. The focus of these sessions could be on empirical evidence derived from coastal and inland ports that unquestionably demonstrate that operating sustainably brings tangible financial benefits to an organization. Table 7 provides a listing of potential stakeholders to involve in the facilitated sessions as well as suggested points of discussion. This is based on the practices of coastal ports, which have used facilitated sessions to enhance sustainability programs.
Table 9: Stakeholders & Information for Facilitated Sessions on Inland Port Sustainability
Involving the Right Stakeholders:
Inland Port Operators
Trucking Companies
Barge Lines
Local Government
Community Groups
Research Institutions
State Government
Rail Companies
Coastal Port Operators
Providing the Right Information:
Core Concepts of Sustainability
Sustainability as Distinct from Environmentalism
Sustainability as Economic Advantage
Specific Sustainability Applications for Inland Port Operations
Sustainability Success Stories at Coastal and Inland Ports
The First Steps Toward Port Sustainability
The Current Sustainability Profile of the Port
The Sustainability Data Needs of the Port
133
Coastal ports have a specific organizational structure for their facilitated sessions. This structure can be applied to sessions targeting inland ports as well. Most officials recommend basing preliminary or introductory sessions around class‐based presentations that offer relevant material for port operators, or newly installed staff members tasked with managing sustainability initiatives. After completing this, the next step entails developing collaborative facilitated sessions that bring all stakeholders together for roundtable discussions that focuses on what public ports can do moving towards a sustainable operational model.
Likewise, another key point of discussion is to understand what policies are feasible given the current business and economic climates. The expected outcome of this process is a preliminary blueprint to forge more sustainable port futures. Once roundtable discussions wrap up, the next step is to develop tailored workshops that focus on the missions of individual ports, their business plans, and where sustainability can profitably be worked into both. Reframing mission statements and business plans to incorporate a sustainability framework is the first step toward growing more sustainable. Participants in workshops will have access to information from other ports (local, regional, and national) that have installed sustainability programs. Learning by example will help port officials determine what works, and what does not work, for their particular facilities. The final objective of the workshop is to address ways in which sustainable initiatives can enhance the triple bottom line of economic, social and environmental benefits.
The most pressing challenges to improve the sustainability of Kentucky’s ports are – raising awareness among port officials and supply chain stakeholders regarding business opportunities that can emerge by operating sustainably, gaining access to the financial resources needed to implement programs that bolster port sustainability, and emphasizing the importance of involving all supply chain members in roundtable discussions and policy formulation. Port operators would benefit greatly from seminars, collaborative discussions, and workshops focused on sustainability. These educational forums offer the greatest potential to move forward, aggressively, with a robust sustainability agenda.
Though sustainability encompasses topics such as social, economic, and environmental considerations to attract port operators, it is necessary to highlight the economic advantages of adopting sustainability initiatives, especially early in the process. If they can envision the financial rewards associated with acting sustainably, they will be more likely to move in that direction. In other words, sustainability and profitability must become synonymous in the minds of port officials – making this connection will indelibly forge the concepts of sustainability and economic value. Because the management teams of most inland ports are small (generally less than five people), introducing new programs is challenging. However, using a graduated approach that starts with education and works through the self‐assessment process, there are significant opportunities for inland ports to make substantive changes to how they conduct business. While this transformation will not happen overnight, the research presented here will bring inland ports a step closer to a more sustainable, vibrant, and prosperous future.

134
This page left intentionally blank.
135
Appendix A – Technical Memo on Site Visits to American Coastal and Inland Ports
Contents
I.) Executive Summary
II.) Acknowledgements
III.) Port Visits 1. Port of Norfolk – Norfolk, Virginia 2. Port of Savannah – Savannah, Georgia 3. Port of Charleston – Charleston, South Carolina 4. Concluding Thoughts – Norfolk, Savannah, Charleston 5. Port of New Orleans – New Orleans, Louisiana 6. Port of Houston – Houston, Texas 7. Port of Mobile – Mobile, Alabama 8. Concluding Thoughts – New Orleans, Houston, Mobile 9. Port of Paducah – Paducah, Kentucky 10. Port of Memphis – Memphis, Tennessee 11. Concluding Thoughts – Paducah, Memphis 12. Port of Cincinnati –Cincinnati, Ohio 13. Port of Louisville – Louisville, Kentucky 14. Port of St. Louis – St. Louis, Missouri 15. Concluding Thoughts Louisville, St. Louis
IV.) Discussion – Transferable Initiatives for Inland Ports

136
I. Executive Summary
This technical memorandum summarizes the information and knowledge attained by the Kentucky Transportation Center (KTC) during a series of eleven port visits that took place between July 10, 2012 and August 22, 2012. The sites visited included both deep water coastal ports and inland river ports. The 11 ports visited were the ports of Norfolk, Savannah, Charleston, Mobile, New Orleans, Houston, St. Louis, Memphis, Paducah, Louisville, and Cincinnati. The following summary recaps these visits and details a significant amount of diversity among the approaches that the various ports have applied to the pursuit of sustainability. While some of the ports visited have adopted progressive strategies toward sustainability, others have yet to implement even the most basic initiatives. Moreover, the sustainability approaches that have been taken exhibit considerable variation as well. Some ports have emphasized the environmental dimensions of sustainability, while others have sought to improve sustainability through substantial efforts via community outreach and community relations. Meanwhile, others have financial bottom lines that preclude initiatives that go beyond strict economic sustainability.
Regardless of the approach, however, a common thread runs through all of these approaches: successfully implementing sustainability programs requires having a sustainability office (or officer) and creating a sustainability report that tracks progress of a port regarding sustainability‐related issues. Not only is the creation of such an office a necessary condition for sustainability improvement, it is often a sufficient condition as well. Regardless of the port type, those that have invested in the creation of a dedicated sustainability office have made important strides concerning their sustainability profiles. Many ports have done so much with very little financial investments of their own. All of this certainly bodes well for the promise of improved sustainability concerning inland river ports with tight budgets.
In addition to the previous distinctions, whether the port is either an operator or landlord port has significant implications for port sustainability. In general, ports that operate as landlords have made less progress toward sustainability than operator ports. Making significant progress on sustainability highly correlates with the existence of sustainability offices. Landlord ports have the most incentive to pursue a sustainability agenda because of the limited direct control they have over port operations, and their need to liaison with their tenants. At landlord ports that don’t have provisions for sustainability offices, progress on sustainability was remarkably small. This is a major hurdle facing landlord ports. Often, they lack the organization capacity to adequately address sustainability issues. Without a dedicated sustainability office, they are unable to organize information about sustainability opportunities, provide that information to their clients, and most importantly, motivate them to act on that knowledge. Operator ports, on the other hand, can make decisions more comprehensively, which modestly alleviates some of the drawbacks of not having a centralized unit dedicated to sustainability.
The topics of the Panama Canal expansion and container on barge transport were common areas of discussion at many of the visited ports. They were also the subjects that elicited divergent points of view. Some of the representatives we spoke with were exceptionally
137
optimistic about the prospects of container on barge, and saw the expansion of the Panama Canal as the catalyst that would accelerate expansion on the inland waterway system. Others, however, were dismissive of this mode of transport and made strong arguments for why the canal expansion would have little impact on the inland waterways. Which side proves to be right may depend as much on perception as reality, but a considerable number of obstacles remain in the path of container on barge as the post‐Panamax ships (those facilitated by the Panama Canal expansion) do not appear to be destined for the Gulf of Mexico and, thereby, the inland waterway system. Still yet, there are a number of examples where small scale container on barge services filled niches and were operating successfully, which indicates the method is viable on small scales. The visits provided a wealth of information, which is summarized in the following report. Moreover, while the visits made it clear that the sustainability challenges facing individual ports vary greatly, they suggested initiatives that can have a significant impact if adopted on a widespread basis. What follows recounts the many lessons learned from these visits and the Kentucky Transportation Center is thankful to the gracious port authority representatives that welcomed us into their ports to discuss sustainability with them and see it in action.
138
II. Acknowledgements
The Kentucky Transportation Center would like to thank the following people for their significant contributions to the research that went into this technical memo.
Lee Beckman ‐ Director of External Affairs, Georgia Port Authority
Greg Cantrell ‐ Vice President, Corporate Development, Port of Louisville
Steve Connor ‐ Vice President of Risk Management, South Carolina Port Authority
Chris Donner ‐ Real Estate Development Manager, Port of New Orleans
Catherine Dunn ‐ Deputy Director of Port Development, Port of New Orleans
Greg Edwards ‐ Director of External Affairs, Virginia Port Authority
Janine Moreau Mansour ‐ Director of External Affairs, Port of New Orleans
Barbara Melvin ‐ Senior Vice President if External Affairs, South Carolina Port Authority
Patrick Moore ‐ Manager of Environmental Stewardship, South Carolina Port Authority
Ed O’Callaghan ‐ President Local Operations, Evans Delivery Company
Lindy Rinaldi ‐ Chief of Port Police, South Carolina Port Authority
Alison Skipper ‐ Director of Public Relations, South Carolina Port Authority
Joe Tegart ‐ Principle Sales and Marketing, Port of Louisville
Heather Wood ‐ Director of Environmental Affairs, Virginia Port Authority
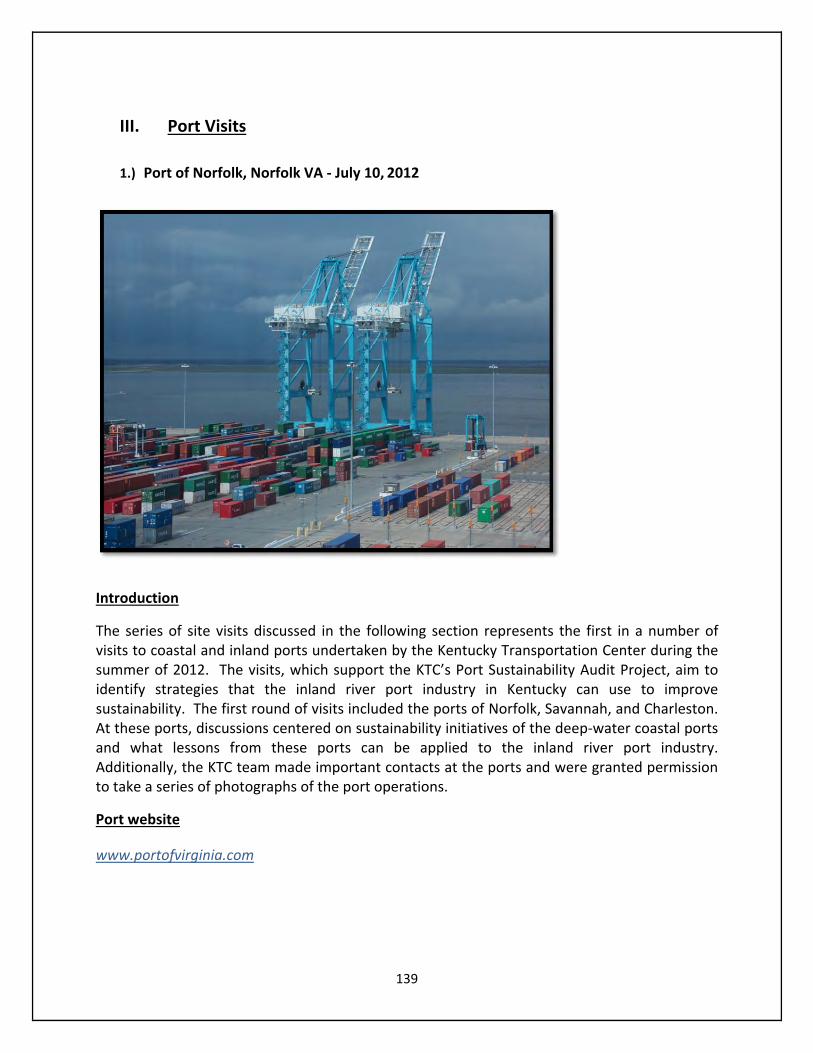
139
III. Port Visits
1.) Port of Norfolk, Norfolk VA ‐ July 10, 2012
Introduction
The series of site visits discussed in the following section represents the first in a number of visits to coastal and inland ports undertaken by the Kentucky Transportation Center during the summer of 2012. The visits, which support the KTC’s Port Sustainability Audit Project, aim to identify strategies that the inland river port industry in Kentucky can use to improve sustainability. The first round of visits included the ports of Norfolk, Savannah, and Charleston. At these ports, discussions centered on sustainability initiatives of the deep‐water coastal ports and what lessons from these ports can be applied to the inland river port industry. Additionally, the KTC team made important contacts at the ports and were granted permission to take a series of photographs of the port operations.
Port website
www.portofvirginia.com
140
Summary
On July 10th researchers of the Kentucky Transportation Center met with Greg Edwards (Director of External Affairs – Virginia Port Authority), Heather Wood (Directory of Environmental Affairs – Virginia Port Authority), and Ed O’Callaghan (President, Local Services – Evans Delivery Service). The visit provided the team with its first tour of coastal port facilities. This provided the KTC team with a great deal of information on the port’s activities, sustainability initiatives, security, and relationship with the state of Virginia and the city of Norfolk. In addition, the team from KTC was permitted to take some photographs of the facilities. Aside from a plethora of general port sustainability information, three specific discussion topics are of note.
These included: (1) 64 Express Program, which is the container on barge program in operation at the port (2) what sustainability approaches an operator port can easily pursue (3) the expected impacts from the Panama Canal Expansion. The visit also offered a first look into the day–to‐day operations of a sustainability office and provided the KTC team with a tour of the facilities.
Principles:
Greg Edwards – Director of External Affairs, Virginia Port Authority
Heather Wood – Director of Environmental Affairs, Virginia Port Authority
Ed O’Callaghan – President Local Operations, Evans Delivery Company
Particulars:
Tour of the Port of Norfolk’s international shipping Terminals, trucking
terminals, rail terminals, and container dock.
Meeting with Greg Edwards.
Meeting with Heather Wood & Ed O’Callaghan.
Photography of the port and activities.
Heather Wood – Director of Environmental Affairs
Our discussion with the Port of Norfolk’s Director of Environmental Affairs focused on the many sustainability programs that the port has in place, and is currently working to implement. Chief among these include such programs as the GO Program, the Air and Water Quality Initiative, Clean the Bay Day, and the 64 Express Program. These programs and others are discussed in detail in the following section.
141
GO (Green Operators) Program
The GO Program employs funding from federal grants (primarily the Federal Reinvestment and Recovery Act) to provide incentives for truck operators to retrofit older vehicles with more emissions‐efficient engines and recognize the achievements operators that do so. Operators that conform to the Green Operators Program initiatives are recognized with a green operator tag which provides a number of benefits at the port facility. These benefits include quicker access onto and off of the port facilities, reductions in certain user‐fees, and recognition in the community as a green company. In addition to Federal funding, matching funding for this program was provided by the Virginia Department of Environmental Quality.
http://portofvirginia.com/media/13349/va%20clean%20diesel%20program%20overview_final.pdf
GO program (Operator Point of View, Ed O’Callaghan)
A key consideration for any sustainability initiative is the port tenant and customer reception. If a program is not well received, it will contribute little to improving a port’s sustainability. This can be especially true of landlord ports, but is also a significant consideration for operator ports such as the Port of Norfolk. The GO Program has been successfully received at the port itself, and among some of its largest operators. The Evans Delivery Service is one of the larger trucking organizations doing business with the Port of Norfolk, with over 1350 tractors and 80 terminals. In accordance with the GO Program, the company retrofitted 56 independent owner‐operator trucks with emissions‐efficient engines in less than three years. Convincing the first companies to become involved in such programs is often the most difficult part of sustainability initiatives. According to the Port of Norfolk representatives, the Evans Company has been instrumental in promoting the program to other interested companies. As a result, the GO Program now includes twelve port shipping companies.
64 Express Program (www.64express.com)
This program is operated by the Norfolk Tug Company’s James River Barge Lines. This program is notable because it represents one of the few containers on barge programs currently operating in America. The program is a sustainability response to the growing container truck congestion along the Hampton Roads that lead to and from the Port of Norfolk. The roadways run through residential neighborhoods, the campus of Old Dominion University, downtown Norfolk, and finally out to the interstate. The program takes a portion of this container traffic off of these roads and places it on barges, which then travel along the James River to a distribution center in Richmond, VA. The project has been in service since December 1, 2008. It is marketed as “Trucking on Water,” allowing “importers and exporters to forego congested roadways.” In addition to the positive sustainability impact the program has on the community, in terms of traffic congestion relief, the program also provides a positive environmental impact. The tugboats used in the operation burn ultra‐low sulfur fuel in IMO compliant engines. For every container moved via barge, it is estimated that the project reduces diesel fuel consumed by nearly 31 gallons. Moreover, the program stands as an important proof of concept for container on barge transportation.

142
Air and Water Quality Initiative
In 2005, diesel fuel emission from cargo handling equipment produced approximately 25 percent of the greenhouse gas emissions from the Port of Norfolk. Via the programs discussed above, and a switch to ultra‐low sulfur diesel for all port equipment, the port has reduced their GHG emissions by 30 percent from 2005 – 2010. Furthermore, in 2008 the port received a $750,000 grant from the EPA to purchase two hybrid locomotives for on‐site use.
143
Identifying Opportunities
While there are many particulars regarding sustainability programs at a port, it is also important to understand the process making additional changes entails. For the Port of Norfolk, this process usually begins with the identification of grant opportunities, followed by the developing of programs to take advantage of those opportunities, and finally the “selling” of those programs to the companies operating at the port. Along these lines, the Port of Norfolk focuses more on incentivizing their stakeholders to improve their sustainability, rather than making large on‐site changes to the port facilities themselves. This differs somewhat from the measures implemented in Savannah and Charleston, where a much greater emphasis is placed on “in house” upgrades to the port operations and facilities. Ultimately, sustainability decisions are based upon economic realities concerning funding availability that drives the decisions about which programs port authorities pursue. For the Port of Norfolk, large scale “in house” upgrades are not economically sustainable options.
Clean the Bay Day
The Virginia Port Authority organizes an annual “Clean the Bay Day.” This year marked the 25th anniversary of the program. The event is voluntary, which involves organizing the community to help clean the marine debris at the port and bay areas. This includes shoreline litter from the roadways, clogged storm drains, creeks, rivers, and wetlands.
Greg Edwards – Director of External Affairs, Port of Norfolk (Operator Port)
The Port of Virginia is an operator port (rather than a landlord port), and the decision‐making process with respect to sustainability initiatives has been smoother compared to other types of ports. As an operator port, the Port of Virginia can execute new policies with greater ease. At a landlord port, for example, if one wishes to develop a new policy that aides vehicle retrofits there is an additional step. This step involves negotiations among different operators at the port. For instance, one port operator may have already retrofitted all of his vehicles, and would prefer the money be used differently. Another operator may see the program as favoritism. Because the Port of Norfolk is an operator port they can make such decisions “in house” and enact them across the board with little need to campaign. Moreover, often times what benefits a private shipping company operating a port may improve the welfare of the community or even the port itself. With operator ports, however, what is good for the operator is by definition good for the port.

144
Customs and Coast Guard
Like all coastal ports, the Port of Norfolk has an intricate relationship with the U.S. Coast Guard. Shippers delivering to the port apply to Customs, and have their cargo assigned a grade based upon a risk assessment. Risk assessment determines the amount of scrutiny a shipment receives once it arrives at the port, and the level of security it is exposed to. In addition, a Customs Office is present at the port and conducts both random and targeted examinations of containers. Finally, all containers leaving the port must pass through radiation scanners whether they leave via barge, rail, or truck.
Sources: Port of Norfolk
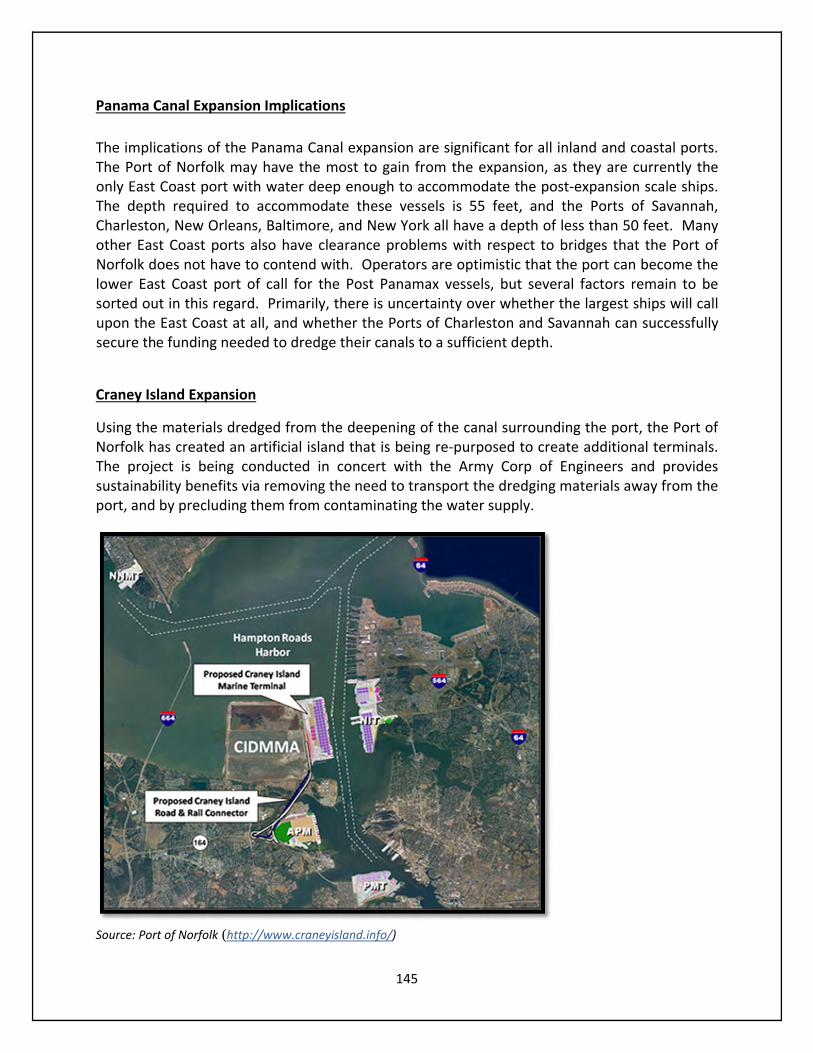
145
Panama Canal Expansion Implications
The implications of the Panama Canal expansion are significant for all inland and coastal ports. The Port of Norfolk may have the most to gain from the expansion, as they are currently the only East Coast port with water deep enough to accommodate the post‐expansion scale ships. The depth required to accommodate these vessels is 55 feet, and the Ports of Savannah, Charleston, New Orleans, Baltimore, and New York all have a depth of less than 50 feet. Many other East Coast ports also have clearance problems with respect to bridges that the Port of Norfolk does not have to contend with. Operators are optimistic that the port can become the lower East Coast port of call for the Post Panamax vessels, but several factors remain to be sorted out in this regard. Primarily, there is uncertainty over whether the largest ships will call upon the East Coast at all, and whether the Ports of Charleston and Savannah can successfully secure the funding needed to dredge their canals to a sufficient depth.
Craney Island Expansion
Using the materials dredged from the deepening of the canal surrounding the port, the Port of Norfolk has created an artificial island that is being re‐purposed to create additional terminals. The project is being conducted in concert with the Army Corp of Engineers and provides sustainability benefits via removing the need to transport the dredging materials away from the port, and by precluding them from contaminating the water supply.
Source: Port of Norfolk (http://www.craneyisland.info/)
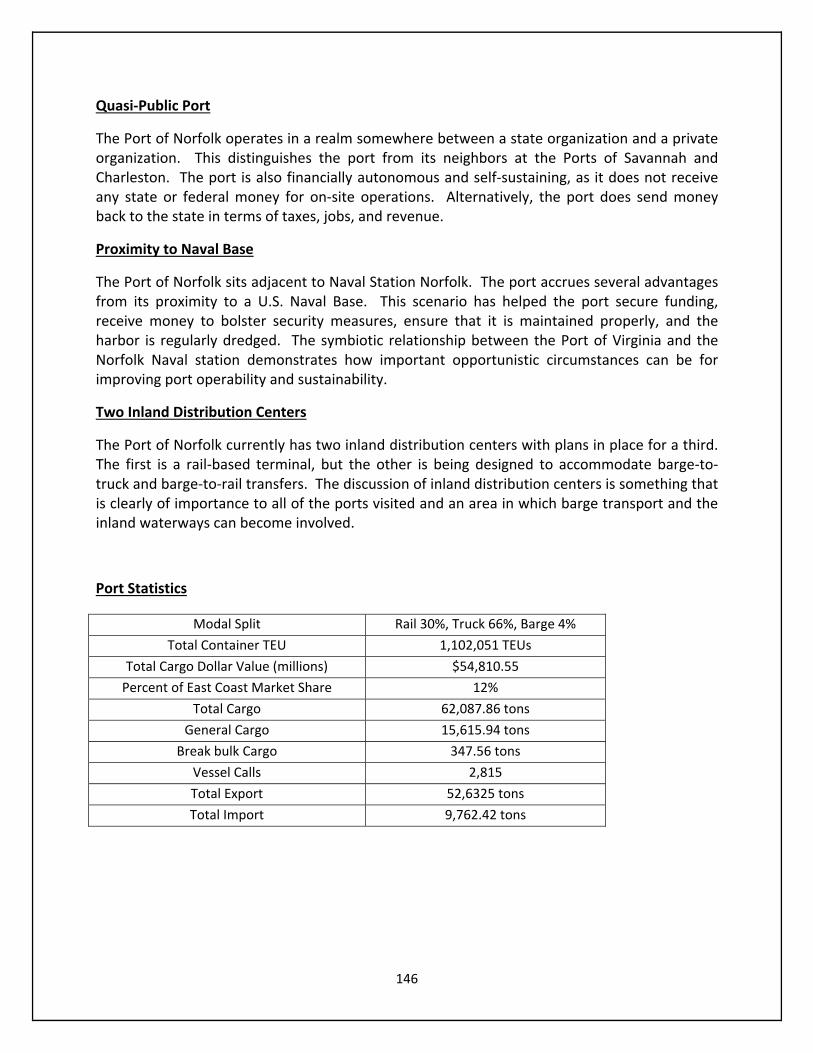
146
Quasi‐Public Port
The Port of Norfolk operates in a realm somewhere between a state organization and a private organization. This distinguishes the port from its neighbors at the Ports of Savannah and Charleston. The port is also financially autonomous and self‐sustaining, as it does not receive any state or federal money for on‐site operations. Alternatively, the port does send money back to the state in terms of taxes, jobs, and revenue.
Proximity to Naval Base
The Port of Norfolk sits adjacent to Naval Station Norfolk. The port accrues several advantages from its proximity to a U.S. Naval Base. This scenario has helped the port secure funding, receive money to bolster security measures, ensure that it is maintained properly, and the harbor is regularly dredged. The symbiotic relationship between the Port of Virginia and the Norfolk Naval station demonstrates how important opportunistic circumstances can be for improving port operability and sustainability.
Two Inland Distribution Centers
The Port of Norfolk currently has two inland distribution centers with plans in place for a third. The first is a rail‐based terminal, but the other is being designed to accommodate barge‐to‐truck and barge‐to‐rail transfers. The discussion of inland distribution centers is something that is clearly of importance to all of the ports visited and an area in which barge transport and the inland waterways can become involved.
Port Statistics
Modal Split Rail 30%, Truck 66%, Barge 4%
Total Container TEU 1,102,051 TEUs
Total Cargo Dollar Value (millions) $54,810.55
Percent of East Coast Market Share 12%
Total Cargo 62,087.86 tons
General Cargo 15,615.94 tons
Break bulk Cargo 347.56 tons
Vessel Calls 2,815
Total Export 52,6325 tons
Total Import 9,762.42 tons
147
Addendum
▪ The team took a series of photographs of the port from atop a catwalk above the international terminal tower.
▪ The team contacted Norfolk Tug Company and discussed the 64 Express Program over the telephone.
▪ Contact information was exchanged with the principles, as well as thank‐you correspondence. Additional information was sent via e‐mail from Mr. Edwards and Ms. Wood.
▪ The Port of Norfolk does not have a sustainability report yet. The team did acquire their fiscal report and information on various specific sustainability programs.

148
2.) Port of Savannah, Savannah GA ‐ July 12, 2012
Port website
http://www.gaports.com/
Summary
On July 12th KTC researchers met with Lee Beckman, the Director of External Affairs for the Georgia Port Authority. The meeting began with a tour of the port terminal and facilities. This was followed by an interview session and presentation. The Port of Savannah’s sustainability initiatives fundamentally differ from those in place at the Port of Norfolk. While the Port of Norfolk has focused on using funds to aid and entice those using the port to improve the sustainability of equipment, the Port of Savannah has focused more on upgrading and replacing their own equipment. This includes on‐site vehicles, lifters, cranes and containers, among others.
Principles
Lee Beckman – Director of External Affairs, Georgia Port Authority
Particulars
Took a detailed tour of all the port facilities. The Port of Savannah is concentrated into one terminal location, so this tour was very thorough.

149
Met with Mr. Beckman and interviewed him about the Port of Savannah in general and their sustainability operations specifically.
We were also provided with a presentation on the port and their sustainability operations.
Lee Beckman – Director of External Affairs, Georgia Port Authority
Electric RTGs (rubber‐tired gantry cranes)
The Port of Savannah is proactively switching their equipment from diesel to electric power. The port has converted four of its six RTG’s to run on electric power 90 percent of the time. This equipment operates on diesel only when moving between container rows. Further, the port has a model in place that will electrify all of their 169 RTGs by 2022. In addition to the obvious environmental benefits, electric RTG’s are also more reliable than diesel‐powered versions, resulting in less down‐time and lower maintenance costs.
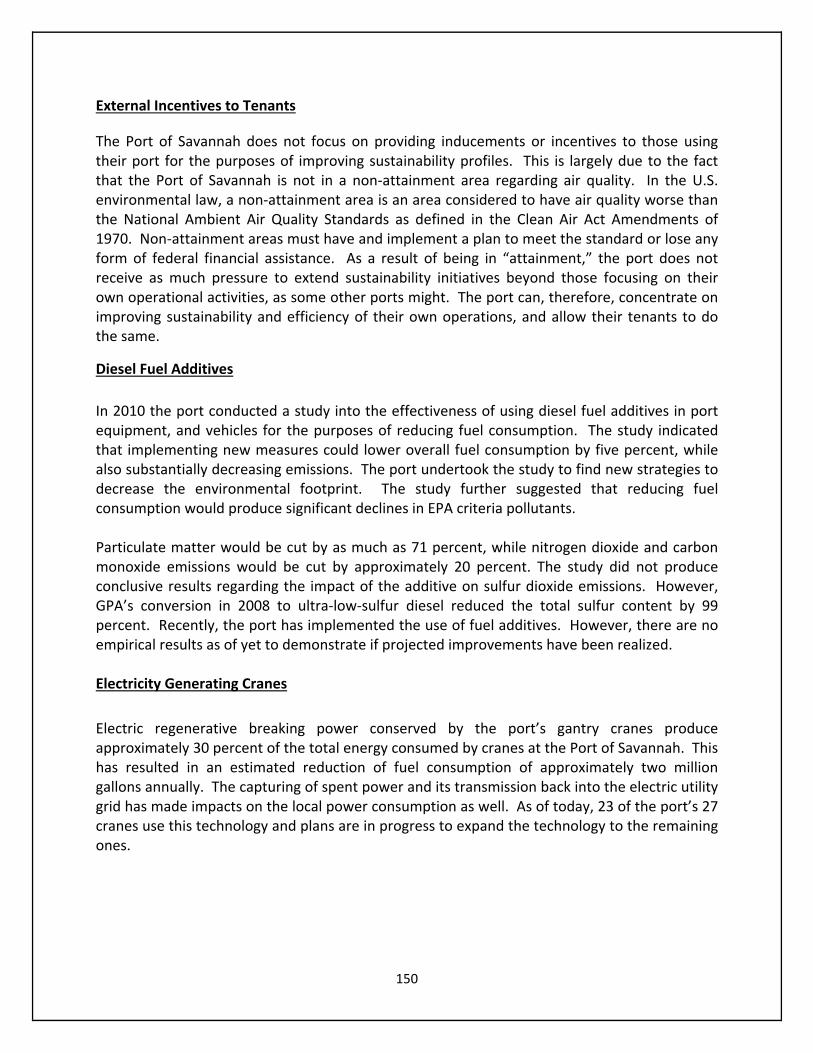
150
External Incentives to Tenants
The Port of Savannah does not focus on providing inducements or incentives to those using their port for the purposes of improving sustainability profiles. This is largely due to the fact that the Port of Savannah is not in a non‐attainment area regarding air quality. In the U.S. environmental law, a non‐attainment area is an area considered to have air quality worse than the National Ambient Air Quality Standards as defined in the Clean Air Act Amendments of 1970. Non‐attainment areas must have and implement a plan to meet the standard or lose any form of federal financial assistance. As a result of being in “attainment,” the port does not receive as much pressure to extend sustainability initiatives beyond those focusing on their own operational activities, as some other ports might. The port can, therefore, concentrate on improving sustainability and efficiency of their own operations, and allow their tenants to do the same.
Diesel Fuel Additives
In 2010 the port conducted a study into the effectiveness of using diesel fuel additives in port equipment, and vehicles for the purposes of reducing fuel consumption. The study indicated that implementing new measures could lower overall fuel consumption by five percent, while also substantially decreasing emissions. The port undertook the study to find new strategies to decrease the environmental footprint. The study further suggested that reducing fuel consumption would produce significant declines in EPA criteria pollutants. Particulate matter would be cut by as much as 71 percent, while nitrogen dioxide and carbon monoxide emissions would be cut by approximately 20 percent. The study did not produce conclusive results regarding the impact of the additive on sulfur dioxide emissions. However, GPA’s conversion in 2008 to ultra‐low‐sulfur diesel reduced the total sulfur content by 99 percent. Recently, the port has implemented the use of fuel additives. However, there are no empirical results as of yet to demonstrate if projected improvements have been realized. Electricity Generating Cranes
Electric regenerative breaking power conserved by the port’s gantry cranes produce approximately 30 percent of the total energy consumed by cranes at the Port of Savannah. This has resulted in an estimated reduction of fuel consumption of approximately two million gallons annually. The capturing of spent power and its transmission back into the electric utility grid has made impacts on the local power consumption as well. As of today, 23 of the port’s 27 cranes use this technology and plans are in progress to expand the technology to the remaining ones.
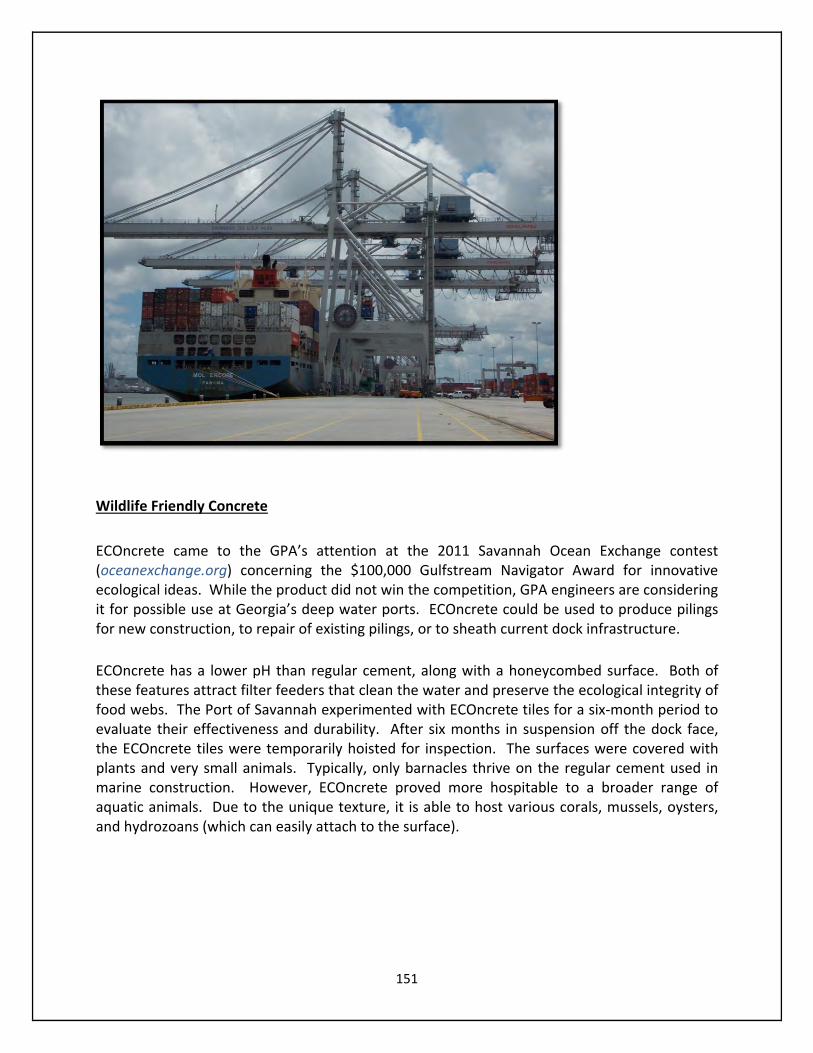
151
Wildlife Friendly Concrete
ECOncrete came to the GPA’s attention at the 2011 Savannah Ocean Exchange contest (oceanexchange.org) concerning the $100,000 Gulfstream Navigator Award for innovative ecological ideas. While the product did not win the competition, GPA engineers are considering it for possible use at Georgia’s deep water ports. ECOncrete could be used to produce pilings for new construction, to repair of existing pilings, or to sheath current dock infrastructure.
ECOncrete has a lower pH than regular cement, along with a honeycombed surface. Both of these features attract filter feeders that clean the water and preserve the ecological integrity of food webs. The Port of Savannah experimented with ECOncrete tiles for a six‐month period to evaluate their effectiveness and durability. After six months in suspension off the dock face, the ECOncrete tiles were temporarily hoisted for inspection. The surfaces were covered with plants and very small animals. Typically, only barnacles thrive on the regular cement used in marine construction. However, ECOncrete proved more hospitable to a broader range of aquatic animals. Due to the unique texture, it is able to host various corals, mussels, oysters, and hydrozoans (which can easily attach to the surface).

152
Electric Powered Refrigerated Containers
The Port of Savannah is the number one reefer (refrigerated cargo) export terminal on the East and Gulf Coasts. As a result, they have targeted this area with sustainability initiatives. The port recently converted all 64 of their refrigerated container racks from fuel to electric power, lowering average diesel fuel consumption by 3.4 million gallons annually. Before electrified refrigerated container racks were brought online in 2008, diesel generators powered refrigerated containers. For every ten electrified refrigerator racks placed into service, the port saves about 540,000 gallons of diesel fuel.
Electric Hook ups for Idling “Refer” Trucks
The Port of Savannah has installed a number of electrical hook ups, primarily for trucks carrying refrigerated containers that idle on‐site while waiting to be unloaded. Previously, these trucks would idle on diesel fuel and consumed substantially more fuel than a typical idling truck.

153
Total Electric Benefit
Through the GPA’s crane electrification, use of refrigerated container racks, and RTG repower project the Port of Savannah will reduce the annual fuel consumption by 4.5 million gallons.
The Importance of an Economic Impact Study
An economic impact study can be a powerful tool for any port, and it has been integral to the Port of Savannah’s success in securing federal and state resources. The University of Georgia’s Terry College of Business has compiled economic impact studies for the Port of Savannah since 2004, which provides information on the output, income, state GDP, value added, employment, state tax, local tax, and federal impacts of the port’s yearly activities. The Port of Savannah’s Director of Legislative affairs recommended to the KTC research team that arming oneself with such information is a powerful tool when dealing with political leadership. Selected information compiled by the Terry College of Business for the Port of Savannah’s Economic Impact Study is included below.
These figures demonstrate that continued emphasis on imports and exports through GA ports results in jobs, higher incomes, greater production of goods and services, revenue for government, support and support growth of agriculture, manufacturing and logistics, wholesale/distribution centers and warehousing clusters. It is clear that the Port of Savannah feels much of the funding they had been able to secure recently would not have been possible without the economic impact studies.
Economic Statistics ‐ Port of Savannah
$66.9 billion in Total Impact (9.5% of Georgia’s Total Economic Output)
$32.4 billion in Value Added to Georgia State GDP (7.8% of Total State GDP)
$18.5 billion Total Personal Income Impact
$4.5 billion in Federal Tax Impact
$1.4 billion in State Tax Impact
$1.1 billion in Local Tax Impact
8.3% of total employment or 1 job in 12 is in some way dependent on ports
352,146 Full and Part Time Jobs are created at the port

154
2009 EPA Grant
A $250,000 grant from the U.S. Environmental Protection Agency in the spring of 2009 allowed the port to retrofit 80 pieces of port‐owned cargo‐handling equipment. The retrofitting includes engine exhaust enhancements of diesel oxidation catalysts and crankcase filtration systems. This process was distributed under the Diesel Admissions Reduction Act. This grant helped fund the conversion to port‐owned, diesel‐powered handling equipment, so that they run on Ultra Low Sulfur Diesel fuel. This has reduced greenhouse gas emissions by 34 percent. Centralized Location
In contrast to the Port of Charleston, the Port of Savannah was unique among the many ports visited during the summer of 2012, in that it was far more centralized than the competitors. Unlike Houston, New Orleans, Charleston, and others, the Port of Savannah is not spread out along a river or waterfront. The port has essentially one main terminal, but that terminal is extremely large in scale. This affords the port a number of benefits, of which sustainability is one. Since the port is highly centralized, there is very little port traffic moving through the urban and residential areas of the city, which aids in community relations, and in lowering environmental impact. Summary of Additional Sustainability Initiatives
The following is a brief summary of a number of smaller sustainability initiatives implemented at the Port of Savannah. (1) TICO Terminal Services (one of the vendors leasing trucks to the Georgia Port Authority at the Garden City Terminal), has upgraded 15 fleet units due for replacement with Tier 3 engines. The new engines emit 57 percent less nitrogen oxide and 40 percent less particulate matter than their predecessors. (2) Wash pad areas for cleaning refrigerated containers now use run‐off water collected and processed at a nearby wastewater treatment facility. (3) The port has introduced single stream recycling, allowing for a variety of recycling activities, and removing 545 tons from their waste stream annually. (4) Technology to remotely schedule on/off system operations and track usage has been implemented with the goal of minimizing light pollution and wasted energy. (5) The port is currently conducting research on alternative fuel vehicles. Specifically, it is investing in compressed natural gas to replace 68 diesel‐powered jockey trucks. (6) Outdoor lighting has been upgraded with photosensitive switches, which has yielded approximately 30 percent savings on lighting cost. (7) Air filtering systems have been installed at strategic locations in the yards, and several office buildings have been upgraded to LEED Silver certification levels.
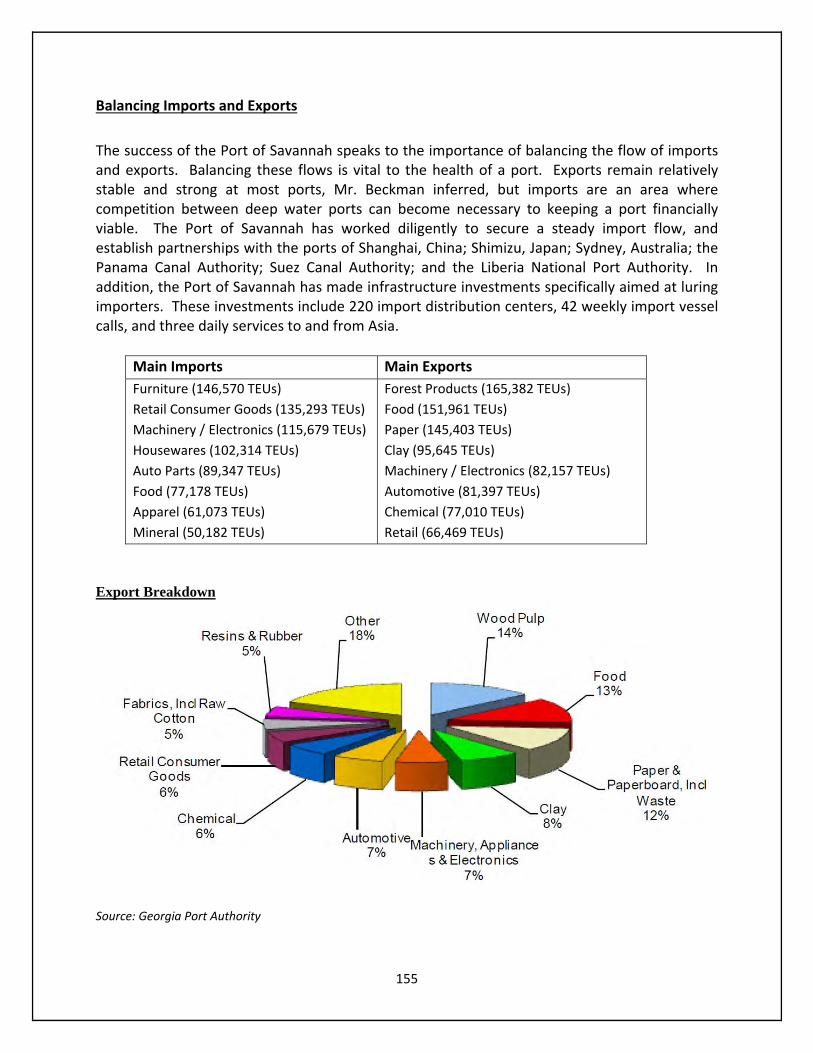
155
Balancing Imports and Exports
The success of the Port of Savannah speaks to the importance of balancing the flow of imports and exports. Balancing these flows is vital to the health of a port. Exports remain relatively stable and strong at most ports, Mr. Beckman inferred, but imports are an area where competition between deep water ports can become necessary to keeping a port financially viable. The Port of Savannah has worked diligently to secure a steady import flow, and establish partnerships with the ports of Shanghai, China; Shimizu, Japan; Sydney, Australia; the Panama Canal Authority; Suez Canal Authority; and the Liberia National Port Authority. In addition, the Port of Savannah has made infrastructure investments specifically aimed at luring importers. These investments include 220 import distribution centers, 42 weekly import vessel calls, and three daily services to and from Asia.
Main Imports Main Exports
Furniture (146,570 TEUs)
Retail Consumer Goods (135,293 TEUs)
Machinery / Electronics (115,679 TEUs)
Housewares (102,314 TEUs)
Auto Parts (89,347 TEUs)
Food (77,178 TEUs)
Apparel (61,073 TEUs)
Mineral (50,182 TEUs)
Forest Products (165,382 TEUs)
Food (151,961 TEUs)
Paper (145,403 TEUs)
Clay (95,645 TEUs)
Machinery / Electronics (82,157 TEUs)
Automotive (81,397 TEUs)
Chemical (77,010 TEUs)
Retail (66,469 TEUs)
Export Breakdown
Source: Georgia Port Authority
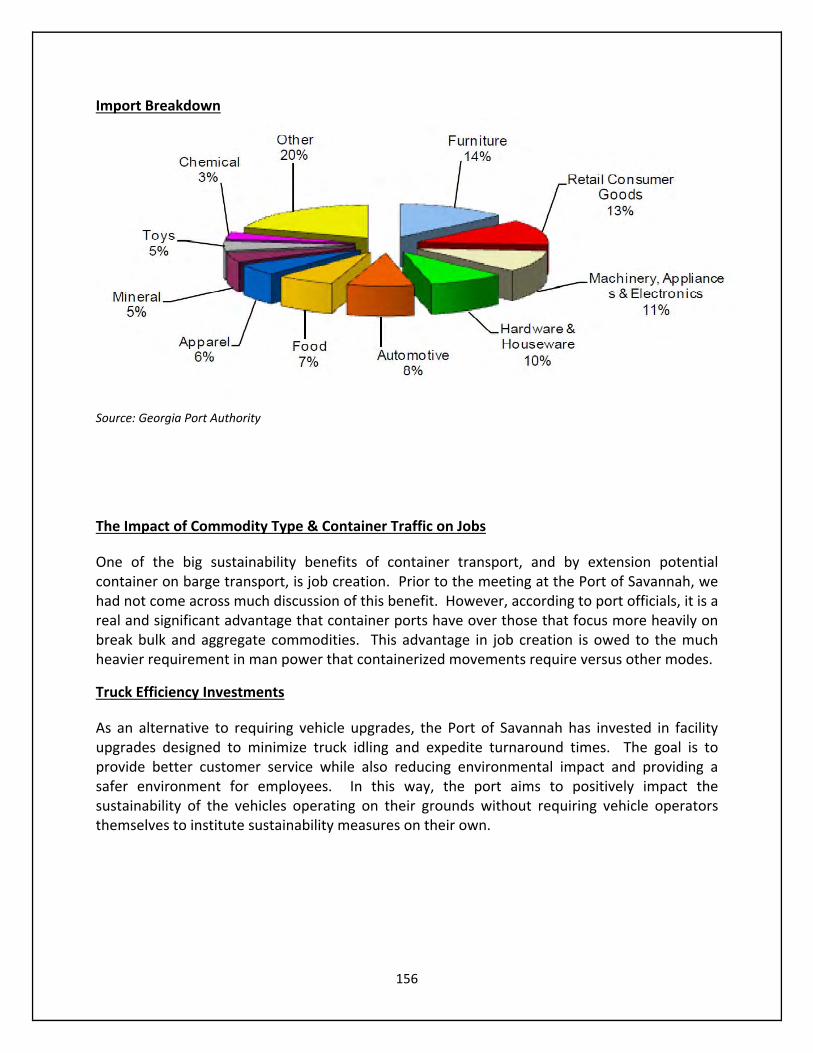
156
Import Breakdown
Source: Georgia Port Authority
The Impact of Commodity Type & Container Traffic on Jobs
One of the big sustainability benefits of container transport, and by extension potential container on barge transport, is job creation. Prior to the meeting at the Port of Savannah, we had not come across much discussion of this benefit. However, according to port officials, it is a real and significant advantage that container ports have over those that focus more heavily on break bulk and aggregate commodities. This advantage in job creation is owed to the much heavier requirement in man power that containerized movements require versus other modes.
Truck Efficiency Investments
As an alternative to requiring vehicle upgrades, the Port of Savannah has invested in facility upgrades designed to minimize truck idling and expedite turnaround times. The goal is to provide better customer service while also reducing environmental impact and providing a safer environment for employees. In this way, the port aims to positively impact the sustainability of the vehicles operating on their grounds without requiring vehicle operators themselves to institute sustainability measures on their own.
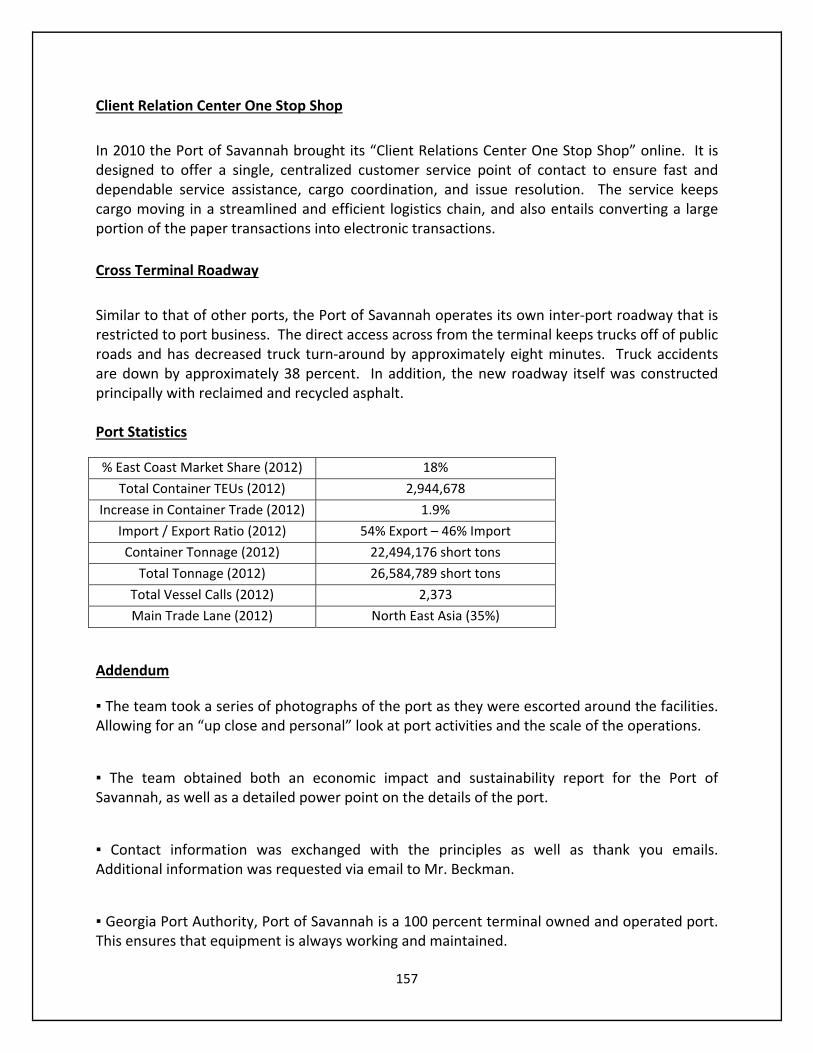
157
Client Relation Center One Stop Shop
In 2010 the Port of Savannah brought its “Client Relations Center One Stop Shop” online. It is designed to offer a single, centralized customer service point of contact to ensure fast and dependable service assistance, cargo coordination, and issue resolution. The service keeps cargo moving in a streamlined and efficient logistics chain, and also entails converting a large portion of the paper transactions into electronic transactions.
Cross Terminal Roadway
Similar to that of other ports, the Port of Savannah operates its own inter‐port roadway that is restricted to port business. The direct access across from the terminal keeps trucks off of public roads and has decreased truck turn‐around by approximately eight minutes. Truck accidents are down by approximately 38 percent. In addition, the new roadway itself was constructed principally with reclaimed and recycled asphalt.
Port Statistics
% East Coast Market Share (2012) 18%
Total Container TEUs (2012) 2,944,678
Increase in Container Trade (2012) 1.9%
Import / Export Ratio (2012) 54% Export – 46% Import
Container Tonnage (2012) 22,494,176 short tons
Total Tonnage (2012) 26,584,789 short tons
Total Vessel Calls (2012) 2,373
Main Trade Lane (2012) North East Asia (35%)
Addendum
▪ The team took a series of photographs of the port as they were escorted around the facilities. Allowing for an “up close and personal” look at port activities and the scale of the operations.
▪ The team obtained both an economic impact and sustainability report for the Port of Savannah, as well as a detailed power point on the details of the port.
▪ Contact information was exchanged with the principles as well as thank you emails. Additional information was requested via email to Mr. Beckman.
▪ Georgia Port Authority, Port of Savannah is a 100 percent terminal owned and operated port. This ensures that equipment is always working and maintained.
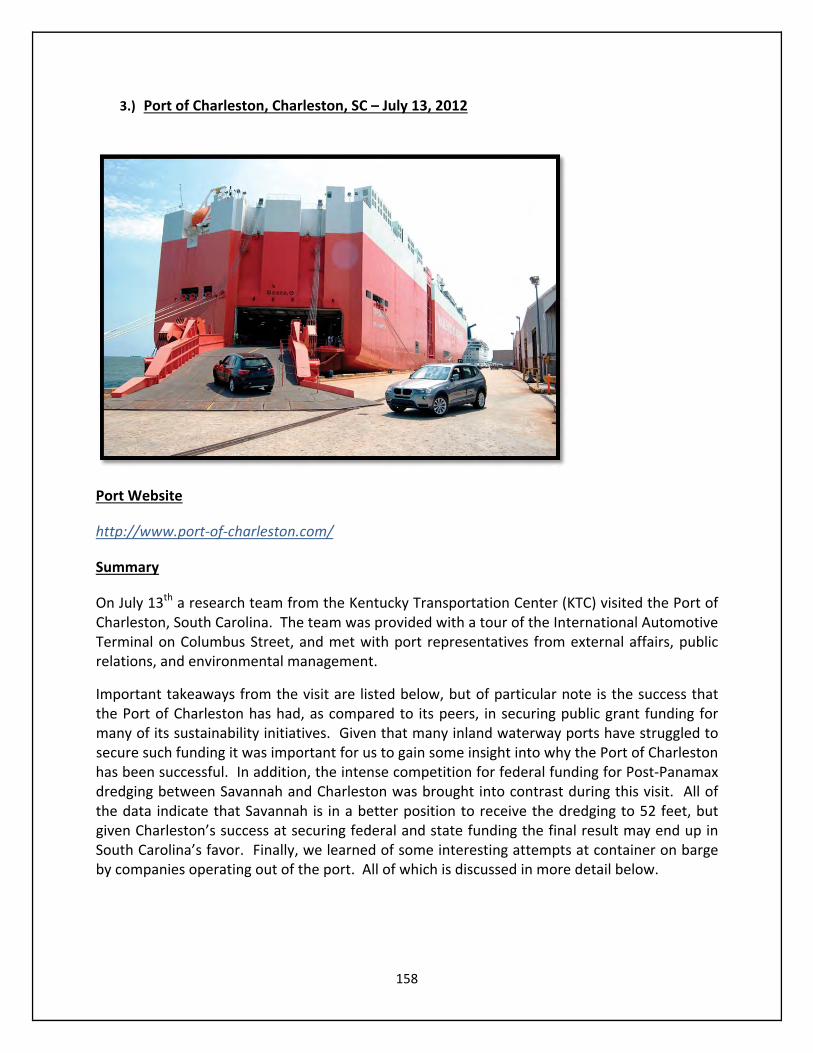
158
3.) Port of Charleston, Charleston, SC – July 13, 2012
Port Website
http://www.port‐of‐charleston.com/
Summary
On July 13th a research team from the Kentucky Transportation Center (KTC) visited the Port of Charleston, South Carolina. The team was provided with a tour of the International Automotive Terminal on Columbus Street, and met with port representatives from external affairs, public relations, and environmental management.
Important takeaways from the visit are listed below, but of particular note is the success that the Port of Charleston has had, as compared to its peers, in securing public grant funding for many of its sustainability initiatives. Given that many inland waterway ports have struggled to secure such funding it was important for us to gain some insight into why the Port of Charleston has been successful. In addition, the intense competition for federal funding for Post‐Panamax dredging between Savannah and Charleston was brought into contrast during this visit. All of the data indicate that Savannah is in a better position to receive the dredging to 52 feet, but given Charleston’s success at securing federal and state funding the final result may end up in South Carolina’s favor. Finally, we learned of some interesting attempts at container on barge by companies operating out of the port. All of which is discussed in more detail below.
159
Principles
Alison Skipper – Director of Public Relations, South Carolina Port Authority
Barbara Melvin – Senior Vice President of External Affairs, South Carolina Port
Authority
Patrick Moore – Manager of Environmental Stewardship, South Carolina Port
Authority
Steve Connor – Vice President of Security, Risk Management, and Administration,
South Carolina Port Authority
Lindy Rinaldi – Chief of Port Police, South Carolina Port Authority
Particulars
Tour of International Container Terminal & Automotive Terminal
Discussion of General Port Information with Alison Skipper
Discussion of Sustainability Initiatives with Patrick Moore
Discussion of Customs Affairs with Lindy Rinaldi
Discussion of Risk Management with Steve Connor
Presentation on Dredging activities with Barbara Melvin
Alison Skipper – Director of Public Relations, South Carolina Port Authority
Barbara Melvin – Senior Vice President of External Affairs, South Carolina Port Authority
Layout of Port Terminals
One of the main structural impediments for the Port of South Carolina, and one which detracts from environmental and community sustainability, is that the port has developed on top of a major metropolitan area. As a result, the port is significantly more spread out than many of its east coast peers and lacks a centralized location. Several of the port’s terminals are located at different locations around the city. This requires increased truck and rail traffic to move materials. All of which necessarily contributes to increased congestion and emissions.
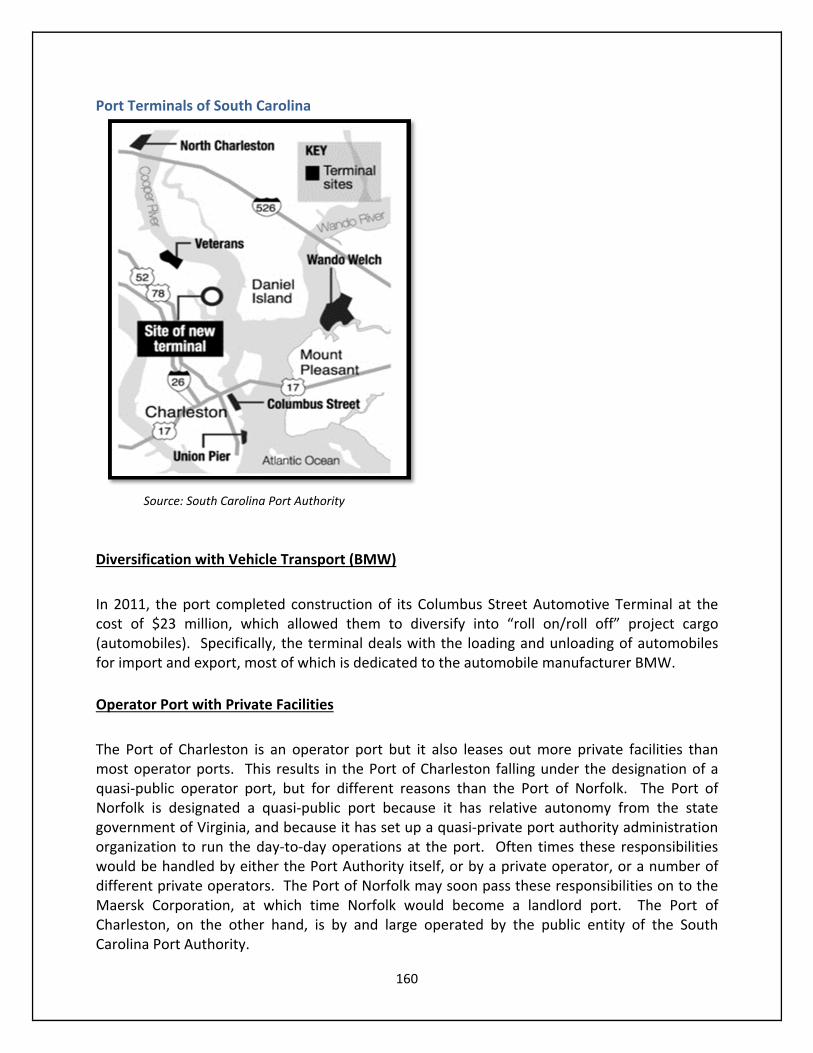
160
Port Terminals of South Carolina
Source: South Carolina Port Authority
Diversification with Vehicle Transport (BMW)
In 2011, the port completed construction of its Columbus Street Automotive Terminal at the cost of $23 million, which allowed them to diversify into “roll on/roll off” project cargo (automobiles). Specifically, the terminal deals with the loading and unloading of automobiles for import and export, most of which is dedicated to the automobile manufacturer BMW.
Operator Port with Private Facilities
The Port of Charleston is an operator port but it also leases out more private facilities than most operator ports. This results in the Port of Charleston falling under the designation of a quasi‐public operator port, but for different reasons than the Port of Norfolk. The Port of Norfolk is designated a quasi‐public port because it has relative autonomy from the state government of Virginia, and because it has set up a quasi‐private port authority administration organization to run the day‐to‐day operations at the port. Often times these responsibilities would be handled by either the Port Authority itself, or by a private operator, or a number of different private operators. The Port of Norfolk may soon pass these responsibilities on to the Maersk Corporation, at which time Norfolk would become a landlord port. The Port of Charleston, on the other hand, is by and large operated by the public entity of the South Carolina Port Authority.
161
It does, however, also lease some of its venue to private operators which handle operations at those sites. By contrast, there is also the example of the Port of Savannah which is fully publicly operated by the Georgia Port Authority at all of their terminals. Each operating structure brings with it certain advantages and disadvantages with respect to port administration, and therefore, port sustainability. Some of these general strengths and weaknesses are discussed below, as well as examples from the three ports previously mentioned. The following page displays a table illustrating some of these differences across the most common setups for port operation.
Public Operator Port
Advantages
(1) Infrastructure Development and cargo handling operations are the responsibility of the same organization (unity of command) (2) Sustainability Initiatives can be decided upon and implemented by the port authority alone (3) Decisions related to social sustainability (job creation / community relations), environmental sustainability (air quality / noise pollution / energy efficiency), and economic sustainability can be made with public interest in mind.
Disadvantages
(1) Potential for inflexibility in labor disputes as the port administration is also the sole employer (2) Potential for inefficient use of resources due to government control as opposed to market control (3) Limited access to private funding (4) Sub‐optimal market response.
Quasi‐Public Operator Port
Advantages
(1) Investments in the port infrastructure decided by the port authority and public sector (2) Operations handled by single operator established by port authority (3) More responsive to market demands (4) Provides an intermediary for labor negotiations (5) Sustainability initiatives can be promoted by the port Authority and implemented via a single operator, which has a stake in port authority interests.
Disadvantages
(1) Port Authority and port operator can find themselves in conflicting situations (2) Private operators do not own major equipment, therefore they can tend to function solely as labor pools and not develop strong interests in port success (3) Operations control is sometimes outsourced to a fully private shipping company in which cases private interests may trump public interests.

162
Landlord Port
Advantages
(1) A single private entity, or group of private entities, executes cargo handling operations (2) more responsive to market requirements (3) port authority retains control over general requirements and regulations.
Disadvantages
(1) Port Authority can provide information regarding sustainability or other policy
opportunities but the individual operators must elect to implement them (2) Competition
within the port between operators can undermine best interest of Port Authority as a whole.
Private Port
Advantages
(1) Maximum response to market demands (2) High flexibility with respect to investment and operations (3) No direct government interference (4) Streamlined operations and decision making.
Disadvantages
(1) Operations and goals may run counter to community and government interests (2) Potential for monopolistic behavior (3) Favoritism of preferred clients and tenants (4) Sustainability issues viewed solely through economic lens.
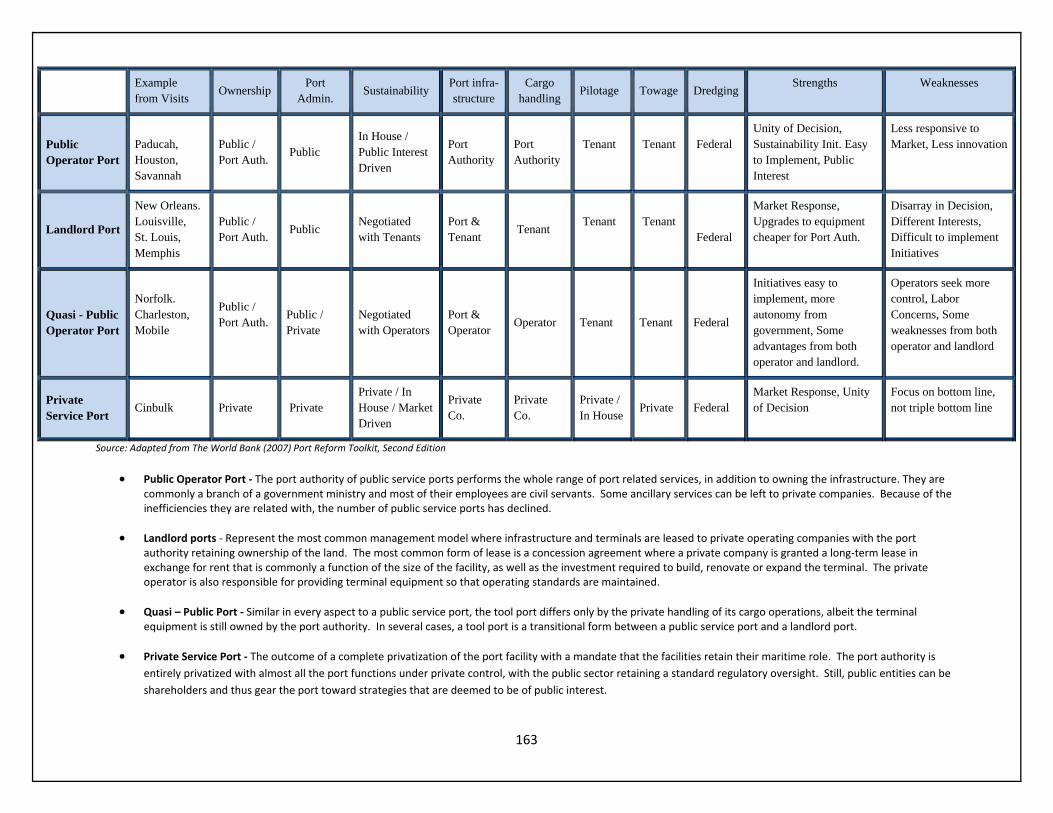
163
Source: Adapted from The World Bank (2007) Port Reform Toolkit, Second Edition
Public Operator Port ‐ The port authority of public service ports performs the whole range of port related services, in addition to owning the infrastructure. They are commonly a branch of a government ministry and most of their employees are civil servants. Some ancillary services can be left to private companies. Because of the inefficiencies they are related with, the number of public service ports has declined.
Landlord ports ‐ Represent the most common management model where infrastructure and terminals are leased to private operating companies with the port authority retaining ownership of the land. The most common form of lease is a concession agreement where a private company is granted a long‐term lease in exchange for rent that is commonly a function of the size of the facility, as well as the investment required to build, renovate or expand the terminal. The private operator is also responsible for providing terminal equipment so that operating standards are maintained.
Quasi – Public Port ‐ Similar in every aspect to a public service port, the tool port differs only by the private handling of its cargo operations, albeit the terminal equipment is still owned by the port authority. In several cases, a tool port is a transitional form between a public service port and a landlord port.
Private Service Port ‐ The outcome of a complete privatization of the port facility with a mandate that the facilities retain their maritime role. The port authority is
entirely privatized with almost all the port functions under private control, with the public sector retaining a standard regulatory oversight. Still, public entities can be
shareholders and thus gear the port toward strategies that are deemed to be of public interest.
Example from Visits
Ownership Port
Admin. Sustainability
Port infra-structure
Cargo handling
Pilotage Towage DredgingStrengths Weaknesses
Public Operator Port
Paducah, Houston, Savannah
Public / Port Auth.
Public In House / Public Interest Driven
Port Authority
Port Authority
Tenant
Tenant
Federal
Unity of Decision, Sustainability Init. Easy to Implement, Public Interest
Less responsive to Market, Less innovation
Landlord Port
New Orleans. Louisville, St. Louis, Memphis
Public / Port Auth.
Public Negotiated with Tenants
Port & Tenant
Tenant Tenant
Tenant
Federal
Market Response, Upgrades to equipment cheaper for Port Auth.
Disarray in Decision, Different Interests, Difficult to implement Initiatives
Quasi - Public Operator Port
Norfolk. Charleston, Mobile
Public / Port Auth.
Public / Private
Negotiated with Operators
Port & Operator
Operator Tenant Tenant Federal
Initiatives easy to implement, more autonomy from government, Some advantages from both operator and landlord.
Operators seek more control, Labor Concerns, Some weaknesses from both operator and landlord
Private Service Port
Cinbulk Private Private
Private / In House / Market Driven
Private Co.
Private Co.
Private / In House
Private Federal Market Response, Unity of Decision
Focus on bottom line, not triple bottom line
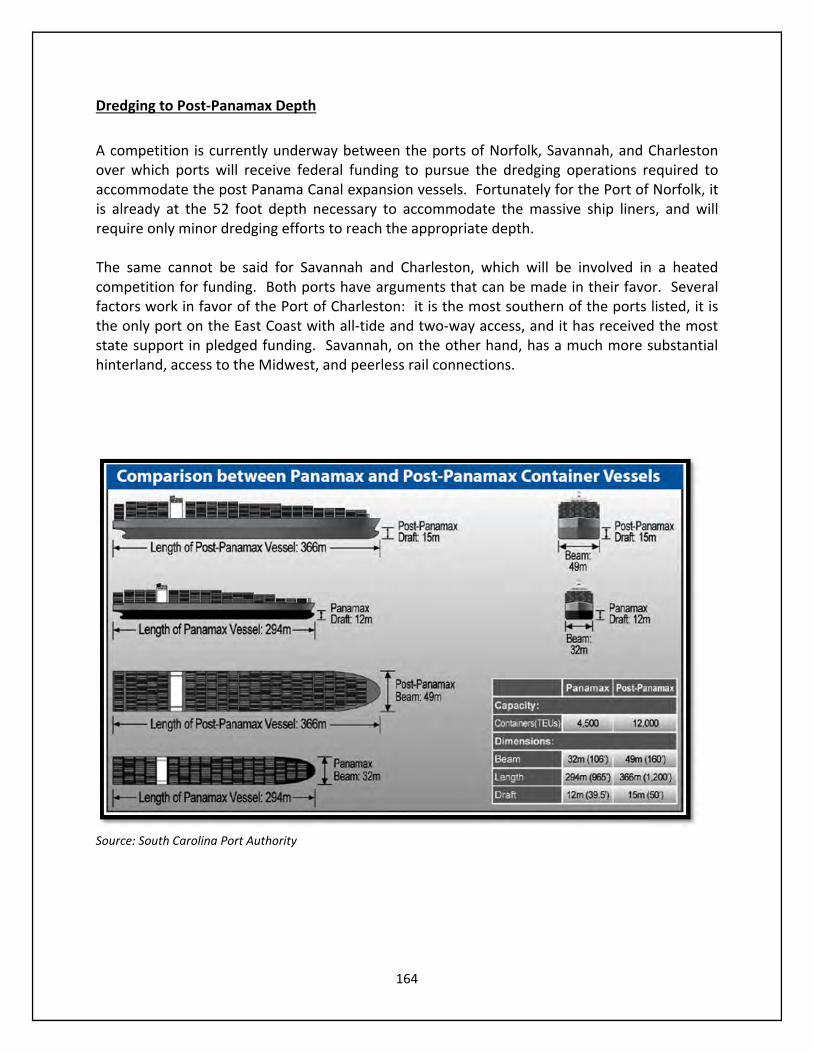
164
Dredging to Post‐Panamax Depth
A competition is currently underway between the ports of Norfolk, Savannah, and Charleston over which ports will receive federal funding to pursue the dredging operations required to accommodate the post Panama Canal expansion vessels. Fortunately for the Port of Norfolk, it is already at the 52 foot depth necessary to accommodate the massive ship liners, and will require only minor dredging efforts to reach the appropriate depth. The same cannot be said for Savannah and Charleston, which will be involved in a heated competition for funding. Both ports have arguments that can be made in their favor. Several factors work in favor of the Port of Charleston: it is the most southern of the ports listed, it is the only port on the East Coast with all‐tide and two‐way access, and it has received the most state support in pledged funding. Savannah, on the other hand, has a much more substantial hinterland, access to the Midwest, and peerless rail connections.
Source: South Carolina Port Authority
165
Sustainability Via Efficiency
The Port of Charleston was named the most efficient in North America for 2011 by the American Association of Port Authorities. The port averages 43 moves per hour (per dockside crane) and has a 22 minute truck turnaround time. The port was rated 60 percent more productive than its West Coast peers. Efficiency is one of the more readily available methods of improving sustainability, and the Port of Charleston provides a significant example of efficiency in action.
Financial Sustainability
The Port of South Carolina has been financially self‐supporting for more than 30 years. During this time, it has been fully independent of state funding and state taxpayer dollars. Further, the port has plans to implement $1.3 billion in capital projects that will be fully funded by the port’s own profits.
Stephens Towing / McCalister Towing
Stevens Towing and McAlister Towing each operate container on barge transport services out of the Port of Charleston. Although neither service runs along inland waterways, the companies transport a substantial number of containers along coastal waters in the surrounding regions. In addition, each company also runs inland waterways services for traditional barge commodities such as finished steel, scrap iron, coal, wood chips, and agricultural products.
Carolinks (Carolina Linkages) Inland Container on Barge
Originally called Carolinks, a local barge company, worked to create an inland waterway container on barge service that ran from the Port of Charleston to a distribution center in Lake Marion, South Carolina. The plans were cancelled as a result of the long and costly permit process required by the Federal Regulatory Commission. Bringing the service and distribution center into operation would have taken several years, and the company decided it did not warrant the time based on uncertainty involved with the project. Another major hurdle was considerable community and environmental blowback regarding the facility. It was to be located on the Cooper River, and many argued it would have negative impacts on the surrounding environment.
166
Foreign Trade Zone (FTZ)
The benefits of being in a Foreign Trade Zone (FTZ) are substantial for any port, whether it is an inland or deep water port. Given that many inland waterway ports lack this specification, further investigation is warranted to understand the impact this has on their economic sustainability. Some of the benefits of being located in a FTZ, according to port officials, include: duty reduction on finished products, duty elimination on exports that are unfinished, duty deferral on imports until exported, deferral of duties on capital equipment, reduced delivery times, and reduced merchandise processing fees.
Patrick Moore – Manager of Environmental Stewardship, South Carolina Port Authority
Air Quality Sustainability
Although the city of Charleston is not in a non‐attainment area, substantial investments in air quality have been made by the Port of Charleston. In March of 2007, the port voluntarily signed an agreement with the South Carolina Department of Health and Environmental Control (DHEC), creating a partnership to reduce port‐related air impacts. This partnership stipulated several goals that the port and its tenants need to meet. The following sections discuss the initiatives that the Port of Charleston has implemented to reach those goals.
Electrification, Cleaner Fuels, and Efficiency
As part of the above agreement, several steps have been taken by the port in recent years. In April of 2008, the port replaced four 1980’s era diesel powered cranes with four new electric powered post‐Panamax cranes. In September of 2007, the port switched all of its on‐site equipment to Ultra Low Sulfur Diesel (ULSD). In addition, the port worked with several tenants who also voluntarily made the switch to the cleaner fuel. The port has an exemplary record with respect to efficiency. This has improved the environmental sustainability of the facility. Currently, the port averages 40 container moves per hour, a rate well in excess of the industry average. As such, ships stay at berth for less time, cranes operate for less time, and the idle time of trucks on‐site is reduced. All of this adds up to considerable environmental sustainability advantages.
167
Contractor Guidelines
The Port of South Carolina has devised a set of Best Management Practices for the construction of any new port facilities. The requirements for any construction bids now include that: (1) all non‐road equipment producing between 100 and 750 horsepower be low‐emissions vehicles that conform to the federal tier 2 standards (2) all diesel engines not active must be turned off and not allowed to idle (3) all equipment and vehicles must be registered and approved by the port prior to commencing work (4) a dust control plan must be developed and implemented by any contractors. Air Emissions Inventory
In September of 2008, the port completed the first air emissions inventory of existing terminals on the East Coast. The report was an important step in determining which funding sources to apply for, and which of those opportunities to pursue. This step is also one that is readily available to inland river ports. The process by which the Port of Charleston undertook to inventory their air emissions is laid out in the following port guide.
http://www.port‐of‐charleston.com/About/publications/portguide.asp
2008 DERA Grant
The Port of South Carolina was awarded a $1.7 million 2008 DERA grant for a project designed to reduce air emissions originating from both on‐terminal cargo handling equipment and over‐the‐road trucks. The project consisted of: (1) repowering 21 on terminal Rubber Tired Gantry (RTG) cranes, over half of the fleet, which converted them from tier 0 to tier 3 engines, and (2) the implementing of a trucking rebate program aimed at assisting trucking companies (as well as operators) for installing EPA certified retrofit, and idle reducing technology on 70 trucks.
2009 ARRA DERA Grant
The port also was awarded nearly $2 million in federal funding under ARRA DERA as part of a $3.5 million project designed to reduce port related diesel emissions. The project resulted in: (1) converting 35 container handlers from tier 0 to tier 3 engines (2) a partnership with Stevens Towing to repower the propulsion and auxiliary engines of its tug boats from tier 0 to tier 3 engines (3) a partnership with Marinex Construction to repower a dredge pump engine from tier 0 to tier 3 (4) a partnership with Evans Delivery Company to install diesel multi‐stage filers on local drayage trucks.
168
Drayage Truck Replacement Program (STACS Initiative)
In 2011 The South Carolina Port Authority was the first port‐related entity on the East Coast to launch a truck replacement program. The Seaport Truck Air Cleanup (STACS) program is a voluntary truck replacement program that provides truck owners with a financial incentive to replace pre‐1994 model trucks with models produced after 2004. As an incentive, eligible truck owners can receive $10,000 plus the scrap value of their old truck, which can be put towards the purchase of newer and cleaner models. The Port of Charleston, EPA, and South Carolina Department of Health and Environmental Control fund this program. According to the port’s most recent survey, the program has the potential to reduce air emissions by as much as 60 percent.
Securing Grant Dollars
As discussed above, the Port of Charleston has done an unusually effective job of securing public grant money for sustainability initiatives, especially compared to other facilities such as the Port of New Orleans (which has struggled to secure funding). This raises the question about why Charleston has been so successful. Port officials indicated several factors have been instrumental. First, the port has proactively sought the funding, and has offered very aggressive incentives to their tenants for participating in the located opportunities. Second, the port has been supported by the city of Charleston, and the state of South Carolina regarding bids for funding, often finding matching funds from these sources. Lastly, the Port of Charleston was one of the first ports on the East Coast to follow the lead of the West Coast ports in establishing a dedicated sustainability office, which has been instrumental for success. Steve Connor – Vice President of Security, South Carolina Port Authority
Lindy Rinaldi – Chief of Port Police, South Carolina Port Authority
Security at the Port Facilities
At the Port of Charleston facilities, the Port Police control access to the facilities and preside over any security matters that arise on the property.
Security on the Port Channels
On the port channels, the U.S. Coast Guard has authority and presides over security matters. As a branch of the U.S. Armed forces, the Coast Guard is charged with maintaining maritime

169
security and safety. This includes unauthorized boat entries, accidents, toxic spills, or rescue scenarios. In addition, occasionally the Coast Guard will board ships and inspect the cargo.
Port Statistics
Percent of East Coast Market Share 9%
Total TEUs 1,381,349
Trade Lanes % N. Europe 34%, N. Asia 24%, India 12%, S. America 10%
Position in Port Hierarchy 8th largest U.S. Seaport
Economic Impact $44.8 billion Statewide
Total Cargo (2011) $58 billion
Total Containers (2011) 1.38 million TEUs
State Employment (2011) 260,800 jobs
4.) Concluding Notes (Visit 1 – Norfolk, Charleston, Savannah)
The first three port visits revealed significant lessons about the implementation of sustainability measures at the respective facilities. First, the differences in sustainability strategies between the port of Norfolk and the ports of Savannah and Charleston were clearly defined. At Norfolk the focus was on incentivizing and aiding outside operators to achieve sustainability goals. In its most basic form this strategy centered on the use of federal grants to subsidize those operators that wished to upgrade their equipment. Financial incentives could be distributed to operators that chose to upgrade equipment; granting those who upgraded operational privileges that would improve their bottom lines and incentivize operator buy‐in. These incentives can include quicker access to and from the facilities, access to more efficient processing units, favored status for new contracts and opportunities, avoidance of some user fees, or simply access to the facility.
At the ports of Savannah and Charleston, however, the strategy was focused much more on “in house” changes. These changes included upgrading of port‐owned equipment from diesel to electricity, along with other infrastructure investments. These differences likely suggest something about the financial capabilities of the ports to tackle their sustainability concerns, with Norfolk likely choosing to address the supply chain links as a result of it being a more cost effective solution. Second to mention is the process by which all sustainability initiatives begin (namely with the identification of federal or state grants that can be used to potentially fund them) which stands out as a crucial aspect of the port sustainability process. To this end, it is also crucial to have dedicated efforts guiding this process and staying informed. Having noted this, it is very important that this process of identifying opportunities be established and strengthened at Kentucky’s inland river ports, giving them the ability to compete for sustainability opportunities that they may currently be unaware even exist.

170
Third, the 64 Express initiative at the Port of Norfolk provides strong preliminary evidence that container on barge on inland waterways is financially viable and can be part of a broader sustainability strategy. Moving containers on the inland waterways should be a major goal of the industry. If this example can be duplicated, if only along small portions of the river system, it would be a major boon for ports and shipping operators. The evidence from the Port of Savannah indicates that container shipping produces more job creation than bulk of aggregate transport, which improves the sustainability of the community. Container shipments increase the demand for workers because they require manual handling, which is not required with aggregate and bulk materials. It is clear that inland waterways around major cities provide the infrastructure needed to sustainably move large quantities of goods. Inland waterways are vital because they reduce shipper reliance on roadways that are congested, unsustainable, and increasingly falling into disrepair.
4.) Port of New Orleans, New Orleans, LA – August 2, 2012
Port Website
http://www.portno.com/
Summary
On August 2nd, 2012 a research team from the Kentucky Transportation Center (KTC) met with Catherine Dunn, Janine Moreau and Chris Donner from the Port of New Orleans. The meeting
171
began with a tour of the port terminal and facilities, and was followed by an interview session and presentation.
There is a saying in the port industry that we’ve heard at many of our visits, “if you’ve seen one port, you’ve seen one port.” This certainly seems have borne true in our experience. As such, at each stop along our site visits there seems to be a few takeaway messages that stand out. At the Port of New Orleans, one of these messages was the close relationship that the port has with the inland waterway barge industry and movement of non‐containerized cargo. The other was the positive contribution having a sustainability office, or at least an officer, can have on the success of sustainability initiatives, and the overall sustainability profile of a port.
The Port of New Orleans lacked such an office or officer, and the duties of such were assigned to other offices. This was not lost on the port officials we met with, however, as they were quick to point out the short coming and were not happy about the situation. This was a topic however, they mentioned moving towards to work on. It was also interesting to note that, as a landlord port, the Port of New Orleans seemed to have more need for organization than that of a typical operator port.
Principles
Janine Moreau Mansour – Director of External Affairs, Port of New Orleans
Catherine Dunn – Deputy Director of Port Development, Port of New Orleans
Chris Donner – Real Estate Development Manager, Port of New Orleans
Particulars
Mrs. Moreau provided a tour of port facilities and operations.
Meeting with Ms. Dunn regarding port sustainability initiatives.
Discussed specific sustainability initiatives relating to real estate with Mr. Donner.
Meeting with Mrs. Moreau regarding port operations.
We were also provided with a short presentation on the port.
Catherine Dunn – Deputy Director of Port Development, Port of New Orleans
Landlord vs. Operator Port
The Port of New Orleans is a landlord port, which makes it an outlier among the deep water ports KTC visited. The others were considered operator ports. As a landlord port, however, the manner in which it must approach sustainability initiatives differs from approaches available to operator ports. Since the port does not maintain the vast majority of the equipment operating on‐site, port officials’ role in advancing sustainability initiatives involves only recommendations and information provision. They cannot unilaterally impose any type of sustainability agenda.
172
The Port Authority of New Orleans regularly provides information about sustainability opportunities, grants, and innovation to operators. From there, however, the operators have discretion over whether or not to pursue specific opportunities.
Environmental Management Office
Officials recognize that the Port of New Orleans could push more aggressively to enhance the sustainability of their operations. One of the road blocks thus far had been the lack of a dedicated Environmental Management Office and staff. This office is currently in the planning stages, and responsibilities would include: (1) finding possible funding opportunities (2) informing tenants of funding opportunities (3) motivating these tenants to participate in such opportunities (4) acting as a monitor of fund usage and program participation by tenants.
Additional plans for the office are as follows:
‐ Allocate necessary resources to execute effective EMS attended training workshop ‐ Engage in port‐based EMS activities ‐ Continually evaluate, improve activities, and practices, to preserve and protect the environment ‐ Comply with applicable environmental laws, regulations and other policies ‐ Employ responsible and sound methods to prevent pollution ‐ Foster employee awareness and sensitivity as stewards of the environment ‐ Ensure a safe and secure environment for employees and the community ‐ Adopt performance objectives for activities addressed in the EMS ‐ Communicate and share information with necessary bodies ‐ Participate in site visits, and related efforts
Chris Donner ‐ Real Estate Development Manager, Port of New Orleans
Electric RTGs (rubber‐tired gantry cranes), Lifters, Cranes
Despite being a landlord port, the port of New Orleans has made sustainability upgrades to their equipment. The port has converted four dockside gantry cranes, six rubber tired gantry cranes, and a portion of their on‐site vehicles from diesel to electric power. Further, all of the port vehicles have been upgraded to use fuel additives, which have led to a 5 percent reduction in fuel consumption.
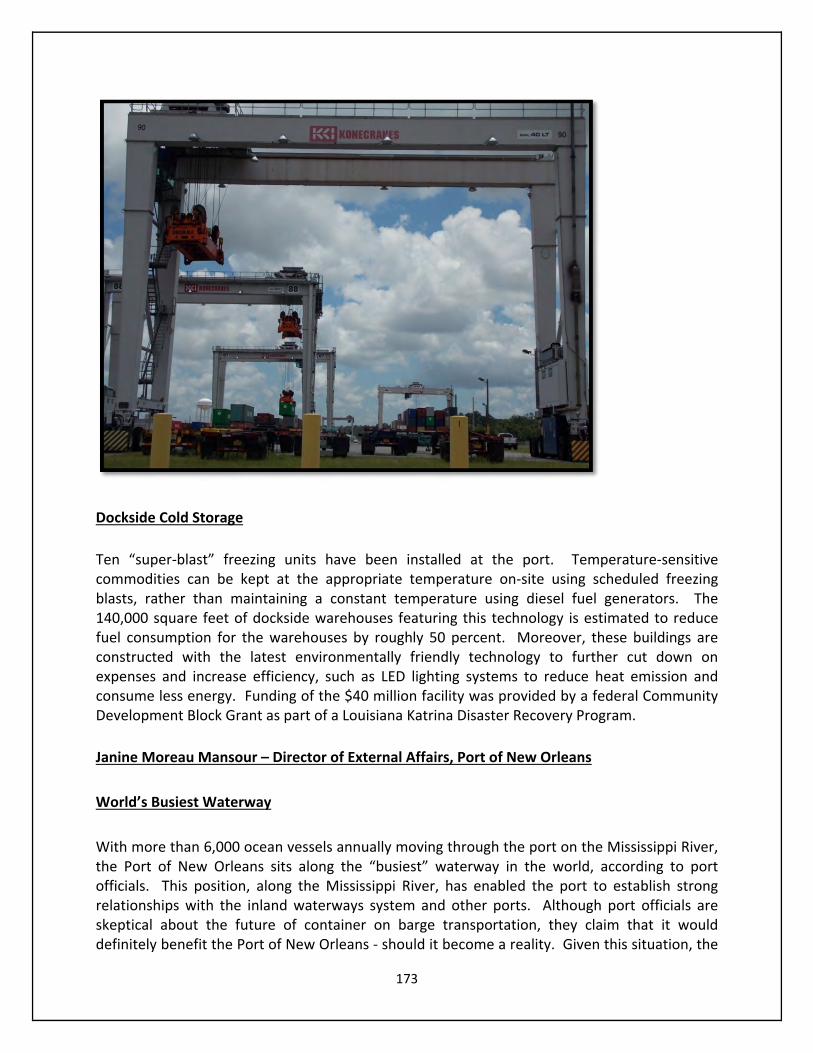
173
Dockside Cold Storage
Ten “super‐blast” freezing units have been installed at the port. Temperature‐sensitive commodities can be kept at the appropriate temperature on‐site using scheduled freezing blasts, rather than maintaining a constant temperature using diesel fuel generators. The 140,000 square feet of dockside warehouses featuring this technology is estimated to reduce fuel consumption for the warehouses by roughly 50 percent. Moreover, these buildings are constructed with the latest environmentally friendly technology to further cut down on expenses and increase efficiency, such as LED lighting systems to reduce heat emission and consume less energy. Funding of the $40 million facility was provided by a federal Community Development Block Grant as part of a Louisiana Katrina Disaster Recovery Program.
Janine Moreau Mansour – Director of External Affairs, Port of New Orleans
World’s Busiest Waterway
With more than 6,000 ocean vessels annually moving through the port on the Mississippi River, the Port of New Orleans sits along the “busiest” waterway in the world, according to port officials. This position, along the Mississippi River, has enabled the port to establish strong relationships with the inland waterways system and other ports. Although port officials are skeptical about the future of container on barge transportation, they claim that it would definitely benefit the Port of New Orleans ‐ should it become a reality. Given this situation, the

174
Port of New Orleans may prove to be an important ally of any inland waterway efforts to realize container on barge transport.
The Importance of an Economic Impact Study Many coastal ports conduct economic impact studies to advance their long‐term goals, and to assist in securing funding. The Port of New Orleans had economist Jim Richards assemble an economic impact study. According to the 2012 report:
‐ 164,000 jobs supported by port, generating $8 billion in earnings ($17 billion in spending) ‐ 400,000 (or 1 in 5 jobs supported by port and related industries) ‐ $20 billion in personal earnings ‐ $800 million in state taxes ‐ $228 million on local taxes
These numbers indicate the continued emphasis on imports and exports Louisiana ports have produced: more employment opportunities, higher incomes, expansion of the production of goods and services, increased government revenue, support of the growth of agriculture and manufacturing, and the creation of more wholesale/distribution centers and warehousing clusters.
Balancing Imports and Exports
As in Savannah, port officials acknowledge the importance of balancing imports and exports. Consequently, the port has gone to great lengths to ensure that this balance remains near parity. The following list lays out many of the initiatives put in place, which are designed to encourage balance:
The Foreign Trade Zone, where foreign merchandise may be brought in to the
country without being immediately subject to U.S Custom regulations and taxes.
This is vital to any international port.
The port has established partnerships with the Shanghai, Yangshan, Shimizu,
Indonesia, Russia, Mexico, Malaysia, Thailand, and Brazil container port terminals.
The port has expanded to accommodate an average of 2,000 vessel calls per year as
of 2012.
In 2011 the port’s main terminal, the Napoleon Avenue Container Terminal,
upgraded its infrastructure, increasing capacity to approximately 500,000 containers
per year.
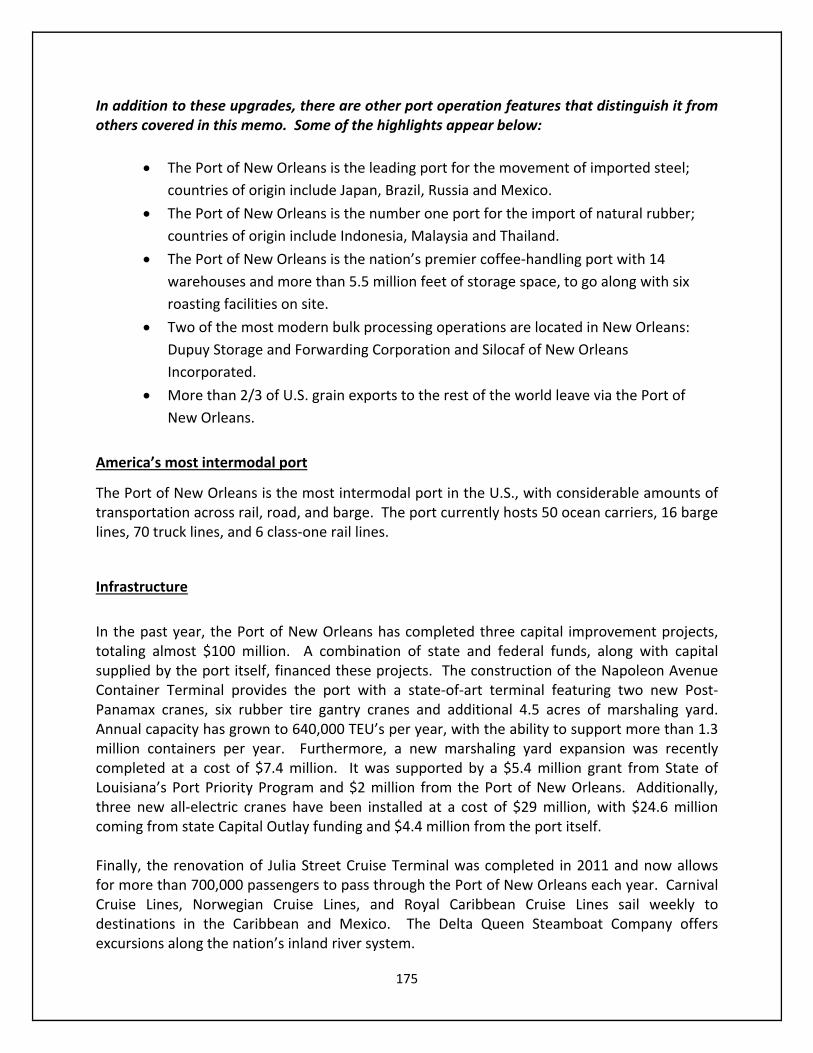
175
In addition to these upgrades, there are other port operation features that distinguish it from others covered in this memo. Some of the highlights appear below:
The Port of New Orleans is the leading port for the movement of imported steel;
countries of origin include Japan, Brazil, Russia and Mexico.
The Port of New Orleans is the number one port for the import of natural rubber;
countries of origin include Indonesia, Malaysia and Thailand.
The Port of New Orleans is the nation’s premier coffee‐handling port with 14
warehouses and more than 5.5 million feet of storage space, to go along with six
roasting facilities on site.
Two of the most modern bulk processing operations are located in New Orleans:
Dupuy Storage and Forwarding Corporation and Silocaf of New Orleans
Incorporated.
More than 2/3 of U.S. grain exports to the rest of the world leave via the Port of
New Orleans.
America’s most intermodal port
The Port of New Orleans is the most intermodal port in the U.S., with considerable amounts of transportation across rail, road, and barge. The port currently hosts 50 ocean carriers, 16 barge lines, 70 truck lines, and 6 class‐one rail lines.
Infrastructure
In the past year, the Port of New Orleans has completed three capital improvement projects, totaling almost $100 million. A combination of state and federal funds, along with capital supplied by the port itself, financed these projects. The construction of the Napoleon Avenue Container Terminal provides the port with a state‐of‐art terminal featuring two new Post‐Panamax cranes, six rubber tire gantry cranes and additional 4.5 acres of marshaling yard. Annual capacity has grown to 640,000 TEU’s per year, with the ability to support more than 1.3 million containers per year. Furthermore, a new marshaling yard expansion was recently completed at a cost of $7.4 million. It was supported by a $5.4 million grant from State of Louisiana’s Port Priority Program and $2 million from the Port of New Orleans. Additionally, three new all‐electric cranes have been installed at a cost of $29 million, with $24.6 million coming from state Capital Outlay funding and $4.4 million from the port itself. Finally, the renovation of Julia Street Cruise Terminal was completed in 2011 and now allows for more than 700,000 passengers to pass through the Port of New Orleans each year. Carnival Cruise Lines, Norwegian Cruise Lines, and Royal Caribbean Cruise Lines sail weekly to destinations in the Caribbean and Mexico. The Delta Queen Steamboat Company offers excursions along the nation’s inland river system.
176
This expansion into the cruise travel industry was a sustainability initiative targeted to help the port diversify. This initiative improved the port’s economic viability during the recent economic downturn.
Technology Website
The website, www.portno.com, contains an interactive tool called CRESCENT – Computerized Reporting and Expediting of Shipments to Control Essential New Orleans Trade. It offers information to potential new business partners via online business and marketing tools that provide information about the port and facilities, commercial corridors within the state, work force, utilities, transportation, and global carrier services. The website also cuts down considerably on the amount of paper waste produced by the port offices.
Cruise Line Port of Call
The cruise industry has substantially buoyed the economic sustainability of the port, particularly during the leanest moments, including the current economic downturn. As the port has invested more heavily in the cruise industry it has seen substantial returns and now more than 700,000 passengers sail through the Port of New Orleans each year. Carnival Cruise Lines, Norwegian Cruise Lines and Royal Caribbean Cruise Lines sail weekly to destinations in the Caribbean and Mexico and the Delta Queen Steamboat Company offers excursions along the nation’s inland river system. The port’s diversification into passenger transport demonstrates economic sustainability can be achieved through expanding its range of operations.

177
Port Statistics
Main Commodities Import (2011) Steel, Coffee, Forest Products, Rubber, Copper
Main Commodities Export (2011) Containerized Cargo
Vessel Calls per year (2011) ~ 2,000
Main Trading Partners (2011) American Midwest, Europe, Asia
Job Generation (2011) 400,000
Total Earnings (2011) $8 billion
Total Spending (2011) $17 billion
Total Tax Revenue (2011) $800 million
Addendum
The team took a series of photographs as they were escorted around the facilities, allowing for a close look at port activities and the scale of operations. Contact information was exchanged with the principles, as well as thank‐you emails. Additional information was requested via email and provided. Among this information was the Port of New Orleans’ 2020 Master Plan. The plan establishes a blueprint for long‐term growth, while outlining a business strategy to address immediate needs over the next decade. It contains some of the information discussed herein.
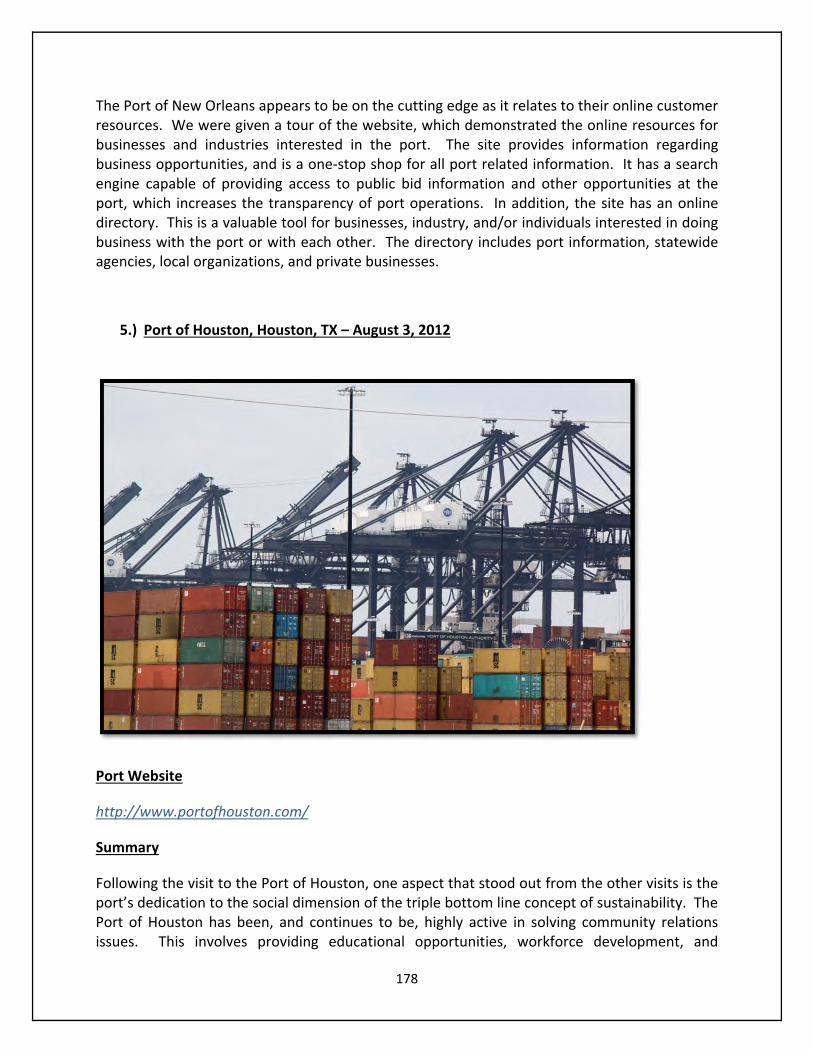
178
The Port of New Orleans appears to be on the cutting edge as it relates to their online customer resources. We were given a tour of the website, which demonstrated the online resources for businesses and industries interested in the port. The site provides information regarding business opportunities, and is a one‐stop shop for all port related information. It has a search engine capable of providing access to public bid information and other opportunities at the port, which increases the transparency of port operations. In addition, the site has an online directory. This is a valuable tool for businesses, industry, and/or individuals interested in doing business with the port or with each other. The directory includes port information, statewide agencies, local organizations, and private businesses.
5.) Port of Houston, Houston, TX – August 3, 2012
Port Website
http://www.portofhouston.com/
Summary
Following the visit to the Port of Houston, one aspect that stood out from the other visits is the port’s dedication to the social dimension of the triple bottom line concept of sustainability. The Port of Houston has been, and continues to be, highly active in solving community relations issues. This involves providing educational opportunities, workforce development, and
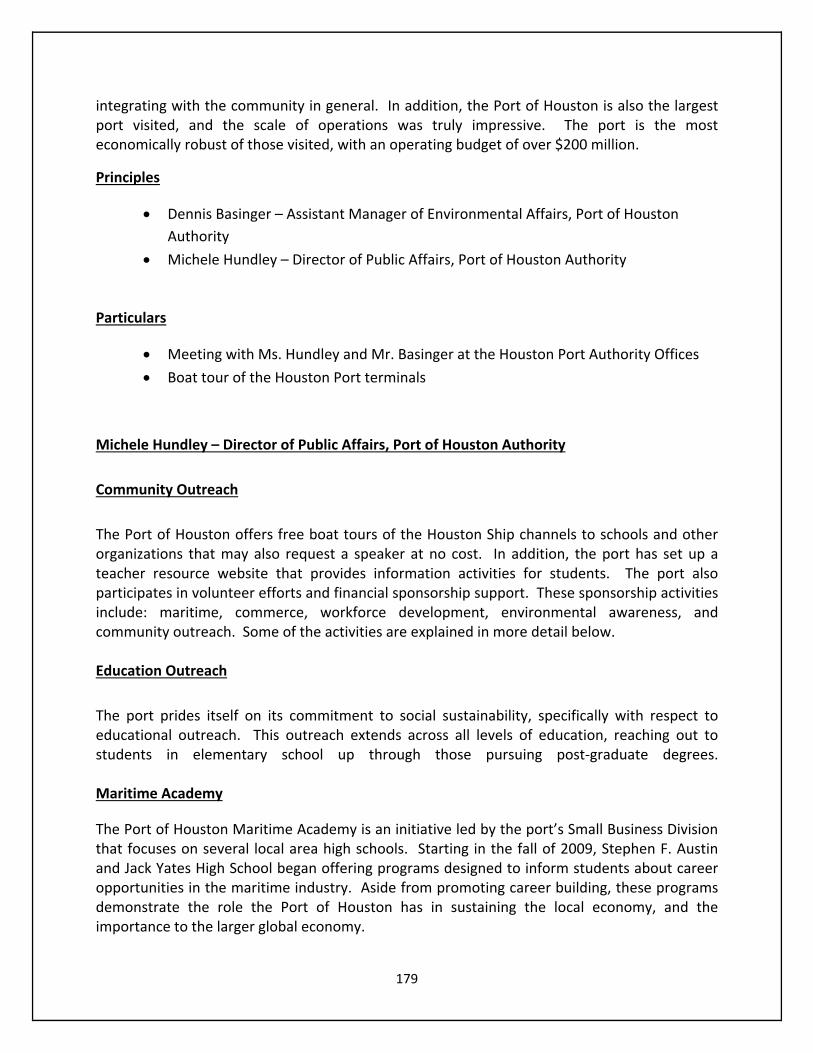
179
integrating with the community in general. In addition, the Port of Houston is also the largest port visited, and the scale of operations was truly impressive. The port is the most economically robust of those visited, with an operating budget of over $200 million.
Principles
Dennis Basinger – Assistant Manager of Environmental Affairs, Port of Houston
Authority
Michele Hundley – Director of Public Affairs, Port of Houston Authority
Particulars
Meeting with Ms. Hundley and Mr. Basinger at the Houston Port Authority Offices
Boat tour of the Houston Port terminals
Michele Hundley – Director of Public Affairs, Port of Houston Authority
Community Outreach
The Port of Houston offers free boat tours of the Houston Ship channels to schools and other organizations that may also request a speaker at no cost. In addition, the port has set up a teacher resource website that provides information activities for students. The port also participates in volunteer efforts and financial sponsorship support. These sponsorship activities include: maritime, commerce, workforce development, environmental awareness, and community outreach. Some of the activities are explained in more detail below. Education Outreach
The port prides itself on its commitment to social sustainability, specifically with respect to educational outreach. This outreach extends across all levels of education, reaching out to students in elementary school up through those pursuing post‐graduate degrees. Maritime Academy
The Port of Houston Maritime Academy is an initiative led by the port’s Small Business Division that focuses on several local area high schools. Starting in the fall of 2009, Stephen F. Austin and Jack Yates High School began offering programs designed to inform students about career opportunities in the maritime industry. Aside from promoting career building, these programs demonstrate the role the Port of Houston has in sustaining the local economy, and the importance to the larger global economy.
180
Texas Southern University, Maritime Transportation MGT & Security Degree Program
The Port of Houston has partnered with Texas Southern University to offer a degree program in Transportation Management and Security. The program focuses on matters related to freight, logistics, security, and environment. The port also helps to subsidize full and partial scholarships for the program.
International Maritime and Energy Center of Houston
The port is currently constructing its International Maritime and Energy Center. Once the center is completed, it will be the centerpiece of a community center located on the edge of the port property. The center will also serve as a museum, along with an educational and workforce development hub.
Reducing Noise & Light Pollution
Recently, the Port of Houston has addressed issues related to noise and light pollution. A local community near the Houston Bayport Container Terminal voiced concerned over noise associated regarding containers being dropped off via cranes, and the warning horns that announced when RTG’s backed up at the facility. The ports responded by holding several town hall meetings to demonstrate their desire to resolve the problems and develop solutions. In fact, it appears as though the Port of Houston is very proactive in working with local communities in situations like this. In this particular case, three solutions were devised to address the community’s concerns. First, the RTG’s were fitted with specialized alarms that create an isolated wave of sound in a focused area right behind them. Second, the port offered to pay for anyone in the community to upgrade their front doors and windows to sound cancelling technology. Third, the port moved to the special type of LED light (diode) that produced a yellow hue and substantially less ambient light. College Intern Program Since 2004, the Port of Houston has offered local university students work experience at the port through its internship program. The program is very competitive, and usually starts as classes end in May. The program then continues until the fall. Often times, interns that excel at their positions have been offered full‐time jobs at the port following the summer internships. Bayport Cruise Terminal The Port of Houston was unique among the coastal ports we visited in offering a free public boat tour of the shipping channel. Approximately 40,000 people traveled on 532 tours during 2011, and many schools and educational programs take advantage of the program. The primary benefit of the boat tour program is the increased (public) visibility it has brought to the port.
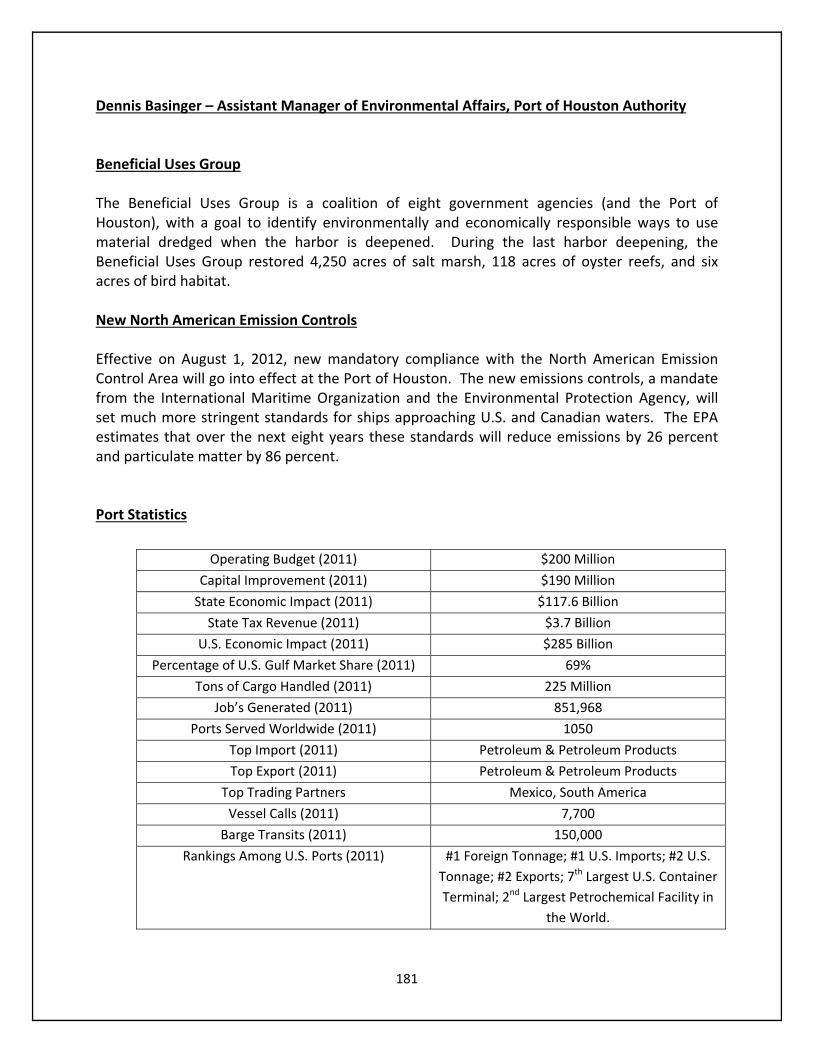
181
Dennis Basinger – Assistant Manager of Environmental Affairs, Port of Houston Authority Beneficial Uses Group The Beneficial Uses Group is a coalition of eight government agencies (and the Port of Houston), with a goal to identify environmentally and economically responsible ways to use material dredged when the harbor is deepened. During the last harbor deepening, the Beneficial Uses Group restored 4,250 acres of salt marsh, 118 acres of oyster reefs, and six acres of bird habitat. New North American Emission Controls Effective on August 1, 2012, new mandatory compliance with the North American Emission Control Area will go into effect at the Port of Houston. The new emissions controls, a mandate from the International Maritime Organization and the Environmental Protection Agency, will set much more stringent standards for ships approaching U.S. and Canadian waters. The EPA estimates that over the next eight years these standards will reduce emissions by 26 percent and particulate matter by 86 percent.
Port Statistics
Operating Budget (2011) $200 Million
Capital Improvement (2011) $190 Million
State Economic Impact (2011) $117.6 Billion
State Tax Revenue (2011) $3.7 Billion
U.S. Economic Impact (2011) $285 Billion
Percentage of U.S. Gulf Market Share (2011) 69%
Tons of Cargo Handled (2011) 225 Million
Job’s Generated (2011) 851,968
Ports Served Worldwide (2011) 1050
Top Import (2011) Petroleum & Petroleum Products
Top Export (2011) Petroleum & Petroleum Products
Top Trading Partners Mexico, South America
Vessel Calls (2011) 7,700
Barge Transits (2011) 150,000
Rankings Among U.S. Ports (2011) #1 Foreign Tonnage; #1 U.S. Imports; #2 U.S.
Tonnage; #2 Exports; 7th Largest U.S. Container
Terminal; 2nd Largest Petrochemical Facility in
the World.
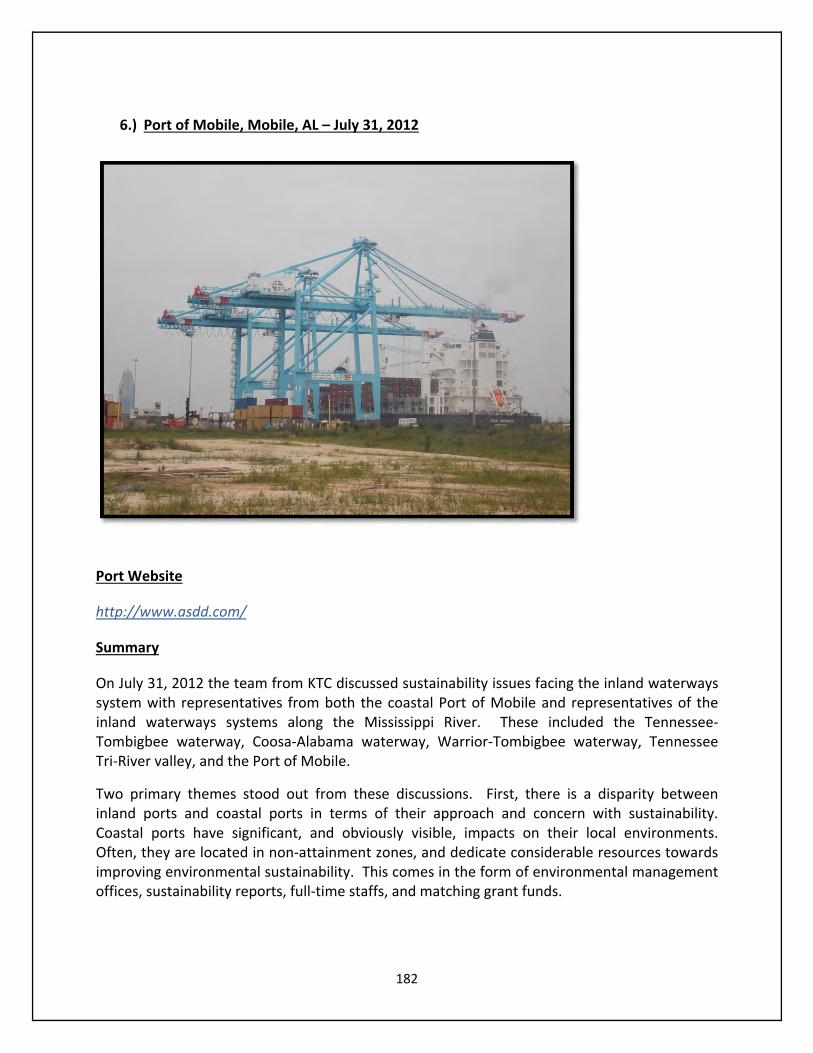
182
6.) Port of Mobile, Mobile, AL – July 31, 2012
Port Website
http://www.asdd.com/
Summary
On July 31, 2012 the team from KTC discussed sustainability issues facing the inland waterways system with representatives from both the coastal Port of Mobile and representatives of the inland waterways systems along the Mississippi River. These included the Tennessee‐Tombigbee waterway, Coosa‐Alabama waterway, Warrior‐Tombigbee waterway, Tennessee Tri‐River valley, and the Port of Mobile.
Two primary themes stood out from these discussions. First, there is a disparity between inland ports and coastal ports in terms of their approach and concern with sustainability. Coastal ports have significant, and obviously visible, impacts on their local environments. Often, they are located in non‐attainment zones, and dedicate considerable resources towards improving environmental sustainability. This comes in the form of environmental management offices, sustainability reports, full‐time staffs, and matching grant funds.

183
The inland port industry, on the other hand, concerns itself foremost with economic sustainability. Any environmental sustainability initiatives are geared towards improving the overall efficiency of ports.
Principles
Cline Jones – Executive Director, Tennessee River Valley Association
Judith Adams – Vice President, Marketing, Alabama State Port Authority
Bruce Windham – Administrator, Tennessee‐Tombigbee Waterway Development
Authority
Bill Houston – Executive Director, Tri Rivers Waterway Development Association
Jerry Sailors – President, Coosa‐Alabama River Improvement Association, INC.
Lawrence Marrihew – President, Warrior‐Tombigbee Waterway Association
Particulars
Meeting with Cline Jones, Bruce Windham, Bill Houston, Jerry Sailors, and Lawrence
Marrihew.
Port tour with Judith Adams, who is Vice President of External Affairs.
Overview
The Port Authority of Alabama is part of the Coalition of Alabama Waterway Associations (CAWA), which works to (1) promote increasing the usage of Alabama’s five congressionally authorized waterways, inlands ports, and the Port of Mobile (2) enhance inland waterway infrastructure to support a thriving economy (3) expand local, regional and national awareness of inland waterways as an optimal location for domestic and international commerce and trade (3) educate government, business leaders, and general public about multiple economic, environmental and community impacts of utilizing waterways (4) study new technologies, COB, environmental programs and other beneficial ideas that will support long‐ term inland waterway usage.
Economic Sustainability
In October 2010, ASPA approved a port‐wide infrastructure investment program to help stimulate the economy and implement efficient transportation solutions. The program included building a new interchange and intermodal rail yards, a new warehouse and cargo yard improvements to serve the steel industry, cargo terminal improvements to accommodate regional exports, deep water oil‐field and gas‐field production industries, and to secure deep water land to open up possibilities for future public seaport expansions. Currently, the Port of Mobile has completed some Post‐Panamax infrastructural investments and has built a new
184
turning basin. These infrastructure changes, along with the port’s 45 foot channel, enable it to handle large vessels. At the port, 98,694 short tons of steel were offloaded in June 2011. This was done at the Pinto Terminal from the first Post‐Panamax vessel processed by ASPA. This represented the largest steel shipment ever delivered to the port. The ASPA received a $12 million TIGER grant to fund an Intermodal Container Transfer Facility (ICTF) that will connect APM Terminals Mobile and its containerized imports and exports to the five Class 1 railroads. The ICTF will provide a more sustainable, efficient and cost‐effective methods of transport that will give the port the ability to reach critical regions in the Midwest that have previously been inaccessible. From an environmental standpoint, this translates into 275 million fewer vehicles causing congestion and pollution. Environmental Sustainability In October, 2011, ASPA received a $953,921 grant from the Diesel Emission Reduction Act of 2010 to improve air quality by rapid deployment of clean diesel technologies. $1.5 million will be used to repower a current 198 GM diesel‐electric switching locomotive with state of the art GenSet technology that will utilize EPA certified off‐road industrial diesel engines that meet the agency’s locomotive emission regulations for 2012 under Tier 3. According to a study sponsored by the ASPA, increasing the use of Alabama waterways will significantly reduce truck congestion and damage to public roads. The 22 million tons of cargo transported annually by barge on the Alabama waterways, removes approximately 880,000 trucks from the road. This scenario saves $24.3 million in road maintenance costs annually. ASPA has implemented a biodiesel program to lower greenhouse gas emissions, which requires all of the port’s compression ignition equipment (eight locomotive engines, three cranes, four reach stackers and over 100 compression ignition vehicles/equipment) to utilize a B‐20 blend of biodiesel. The equipment emits cleaner exhaust, and reduces noxious odors and smoke. There was also an increase in throttle response, as well as a significant reduction in gallon per hour usage – which equates to overall less fuel expenditure. Community and Environmental Sustainability As part of the ASPA port expansion, wetland mitigation resulted in the creation of three tidal marsh complexes. These are monitored twice per year for the organic content of sediment, vegetation density and composition, invasive species, and macro‐fauna. The health of fisheries located in the marshes and adjacent tidal creeks is also assessed regularly. The results are evaluated against criteria set forth in the wetland permit, which entails comparing the health of the mitigated site to a reference marsh at Deer River. Container on Barge The Alabama Freight Mobility Study expressed support for container on barge transport on Alabama waterways. The Alabama State Port Authority, in 2010, conducted the study to
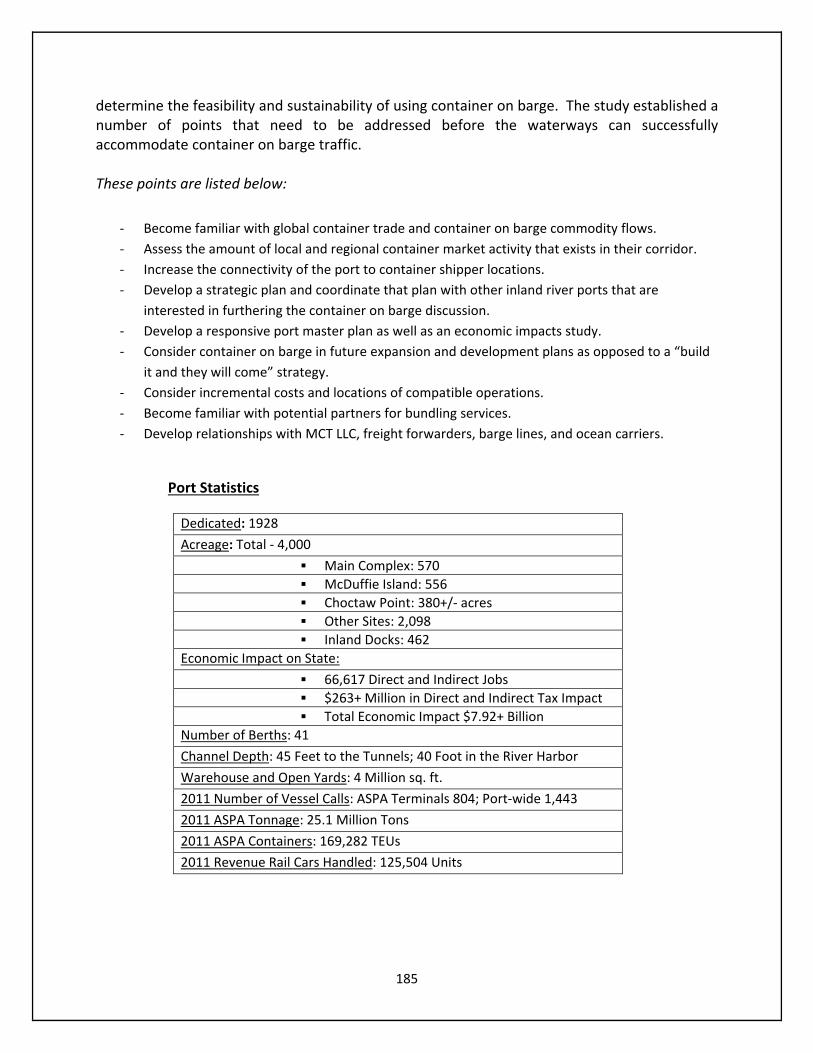
185
determine the feasibility and sustainability of using container on barge. The study established a number of points that need to be addressed before the waterways can successfully accommodate container on barge traffic. These points are listed below:
‐ Become familiar with global container trade and container on barge commodity flows.
‐ Assess the amount of local and regional container market activity that exists in their corridor.
‐ Increase the connectivity of the port to container shipper locations.
‐ Develop a strategic plan and coordinate that plan with other inland river ports that are
interested in furthering the container on barge discussion.
‐ Develop a responsive port master plan as well as an economic impacts study.
‐ Consider container on barge in future expansion and development plans as opposed to a “build
it and they will come” strategy.
‐ Consider incremental costs and locations of compatible operations.
‐ Become familiar with potential partners for bundling services.
‐ Develop relationships with MCT LLC, freight forwarders, barge lines, and ocean carriers.
Port Statistics
Dedicated: 1928
Acreage: Total ‐ 4,000
Main Complex: 570
McDuffie Island: 556
Choctaw Point: 380+/‐ acres
Other Sites: 2,098
Inland Docks: 462
Economic Impact on State:
66,617 Direct and Indirect Jobs
$263+ Million in Direct and Indirect Tax Impact
Total Economic Impact $7.92+ Billion
Number of Berths: 41
Channel Depth: 45 Feet to the Tunnels; 40 Foot in the River Harbor
Warehouse and Open Yards: 4 Million sq. ft.
2011 Number of Vessel Calls: ASPA Terminals 804; Port‐wide 1,443
2011 ASPA Tonnage: 25.1 Million Tons
2011 ASPA Containers: 169,282 TEUs
2011 Revenue Rail Cars Handled: 125,504 Units
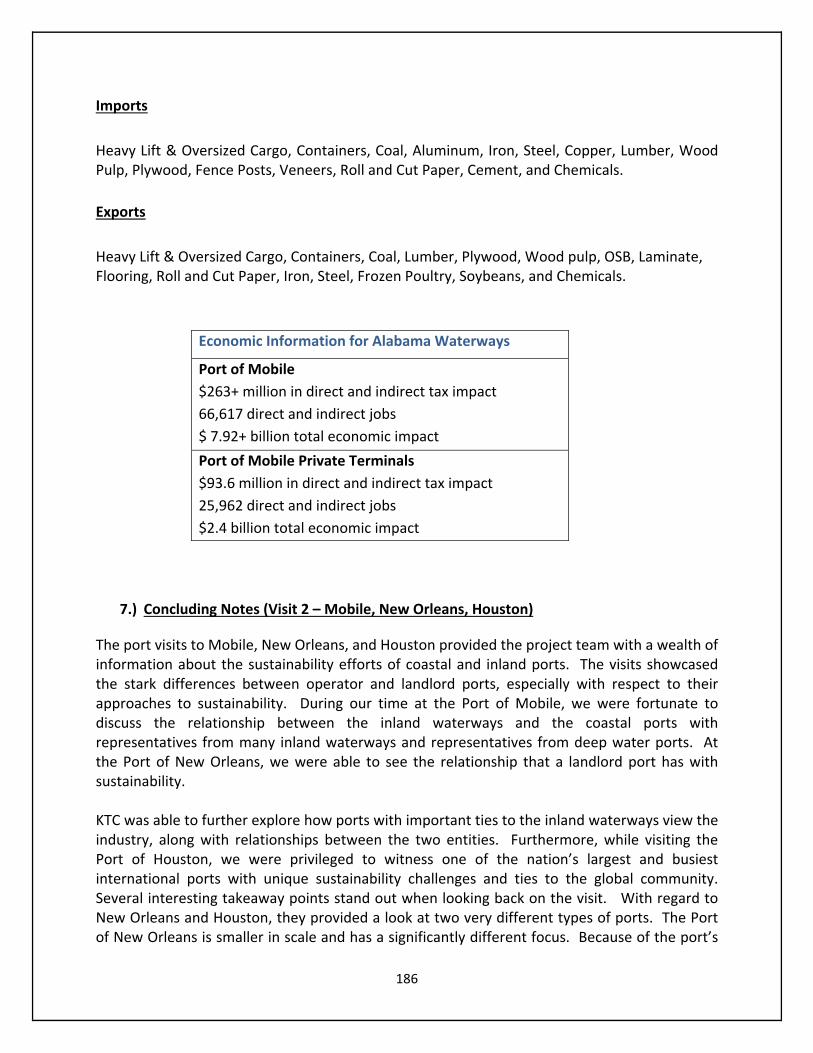
186
Imports
Heavy Lift & Oversized Cargo, Containers, Coal, Aluminum, Iron, Steel, Copper, Lumber, Wood Pulp, Plywood, Fence Posts, Veneers, Roll and Cut Paper, Cement, and Chemicals.
Exports
Heavy Lift & Oversized Cargo, Containers, Coal, Lumber, Plywood, Wood pulp, OSB, Laminate, Flooring, Roll and Cut Paper, Iron, Steel, Frozen Poultry, Soybeans, and Chemicals.
Economic Information for Alabama Waterways
Port of Mobile
$263+ million in direct and indirect tax impact
66,617 direct and indirect jobs
$ 7.92+ billion total economic impact
Port of Mobile Private Terminals
$93.6 million in direct and indirect tax impact
25,962 direct and indirect jobs
$2.4 billion total economic impact
7.) Concluding Notes (Visit 2 – Mobile, New Orleans, Houston)
The port visits to Mobile, New Orleans, and Houston provided the project team with a wealth of information about the sustainability efforts of coastal and inland ports. The visits showcased the stark differences between operator and landlord ports, especially with respect to their approaches to sustainability. During our time at the Port of Mobile, we were fortunate to discuss the relationship between the inland waterways and the coastal ports with representatives from many inland waterways and representatives from deep water ports. At the Port of New Orleans, we were able to see the relationship that a landlord port has with sustainability. KTC was able to further explore how ports with important ties to the inland waterways view the industry, along with relationships between the two entities. Furthermore, while visiting the Port of Houston, we were privileged to witness one of the nation’s largest and busiest international ports with unique sustainability challenges and ties to the global community. Several interesting takeaway points stand out when looking back on the visit. With regard to New Orleans and Houston, they provided a look at two very different types of ports. The Port of New Orleans is smaller in scale and has a significantly different focus. Because of the port’s
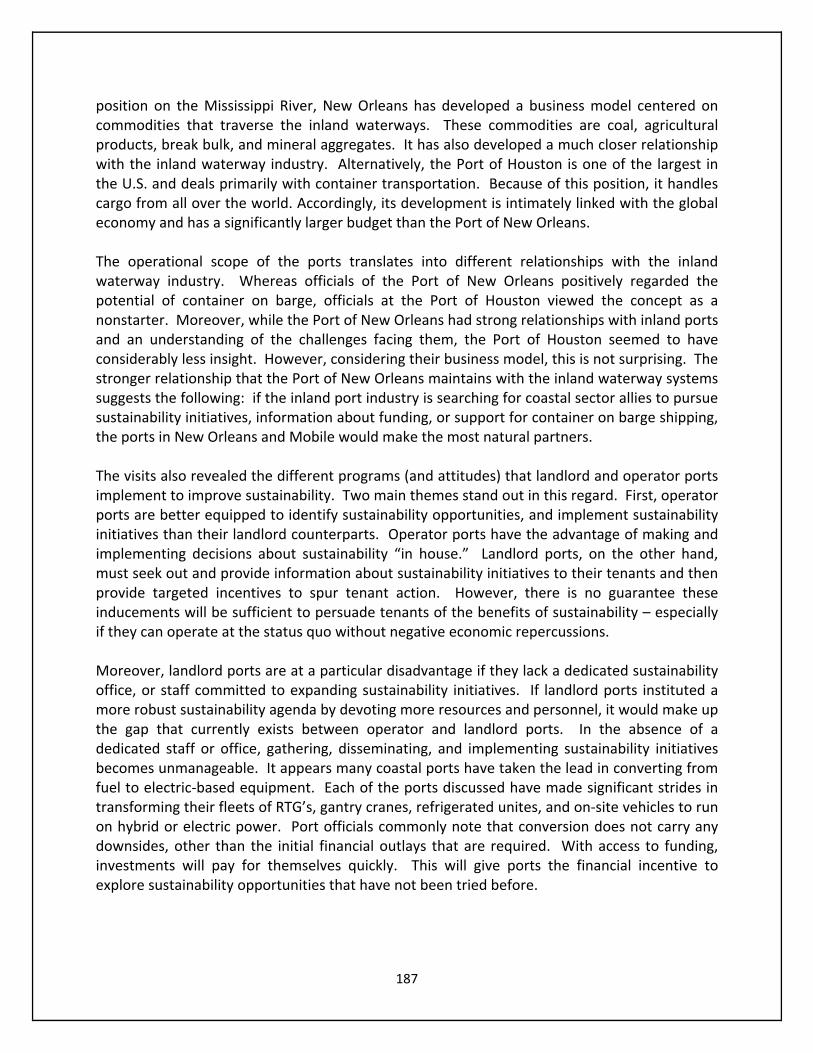
187
position on the Mississippi River, New Orleans has developed a business model centered on commodities that traverse the inland waterways. These commodities are coal, agricultural products, break bulk, and mineral aggregates. It has also developed a much closer relationship with the inland waterway industry. Alternatively, the Port of Houston is one of the largest in the U.S. and deals primarily with container transportation. Because of this position, it handles cargo from all over the world. Accordingly, its development is intimately linked with the global economy and has a significantly larger budget than the Port of New Orleans. The operational scope of the ports translates into different relationships with the inland waterway industry. Whereas officials of the Port of New Orleans positively regarded the potential of container on barge, officials at the Port of Houston viewed the concept as a nonstarter. Moreover, while the Port of New Orleans had strong relationships with inland ports and an understanding of the challenges facing them, the Port of Houston seemed to have considerably less insight. However, considering their business model, this is not surprising. The stronger relationship that the Port of New Orleans maintains with the inland waterway systems suggests the following: if the inland port industry is searching for coastal sector allies to pursue sustainability initiatives, information about funding, or support for container on barge shipping, the ports in New Orleans and Mobile would make the most natural partners. The visits also revealed the different programs (and attitudes) that landlord and operator ports implement to improve sustainability. Two main themes stand out in this regard. First, operator ports are better equipped to identify sustainability opportunities, and implement sustainability initiatives than their landlord counterparts. Operator ports have the advantage of making and implementing decisions about sustainability “in house.” Landlord ports, on the other hand, must seek out and provide information about sustainability initiatives to their tenants and then provide targeted incentives to spur tenant action. However, there is no guarantee these inducements will be sufficient to persuade tenants of the benefits of sustainability – especially if they can operate at the status quo without negative economic repercussions. Moreover, landlord ports are at a particular disadvantage if they lack a dedicated sustainability office, or staff committed to expanding sustainability initiatives. If landlord ports instituted a more robust sustainability agenda by devoting more resources and personnel, it would make up the gap that currently exists between operator and landlord ports. In the absence of a dedicated staff or office, gathering, disseminating, and implementing sustainability initiatives becomes unmanageable. It appears many coastal ports have taken the lead in converting from fuel to electric‐based equipment. Each of the ports discussed have made significant strides in transforming their fleets of RTG’s, gantry cranes, refrigerated unites, and on‐site vehicles to run on hybrid or electric power. Port officials commonly note that conversion does not carry any downsides, other than the initial financial outlays that are required. With access to funding, investments will pay for themselves quickly. This will give ports the financial incentive to explore sustainability opportunities that have not been tried before.
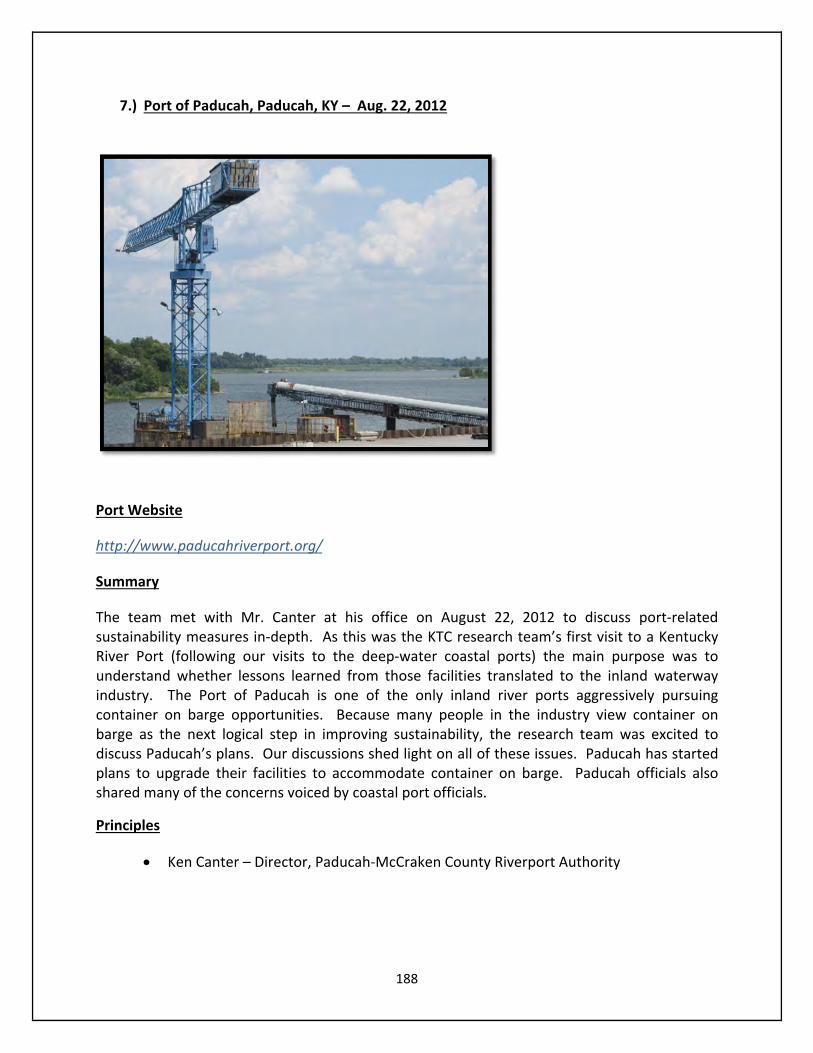
188
7.) Port of Paducah, Paducah, KY – Aug. 22, 2012
Port Website
http://www.paducahriverport.org/
Summary
The team met with Mr. Canter at his office on August 22, 2012 to discuss port‐related sustainability measures in‐depth. As this was the KTC research team’s first visit to a Kentucky River Port (following our visits to the deep‐water coastal ports) the main purpose was to understand whether lessons learned from those facilities translated to the inland waterway industry. The Port of Paducah is one of the only inland river ports aggressively pursuing container on barge opportunities. Because many people in the industry view container on barge as the next logical step in improving sustainability, the research team was excited to discuss Paducah’s plans. Our discussions shed light on all of these issues. Paducah has started plans to upgrade their facilities to accommodate container on barge. Paducah officials also shared many of the concerns voiced by coastal port officials.
Principles
Ken Canter – Director, Paducah‐McCraken County Riverport Authority
189
Particulars
Meeting with Ken Canter, Port Director at Paducah McCracken County River Port
Offices.
Container on Barge (COB)
The Port of Paducah is one of the few inland ports in America moving forward with major infrastructure investments that will enable the accommodation of container on barge ‐ should the need arise. Whether or not substantial container on barge traffic materializes, however, remains a major question without a clear answer. Even if there is no expansion in this area, the port has been in need of a new crane (which is in the process of construction). Under a worst‐case scenario, where container on barge activity does not flourish, the port has equipped itself with new equipment that will assist with handling traditional cargo.
Potential for COB
Paducah River Port officials expect that along with the expansion of the Panama Canal, eventually some of the intermodal container traffic will reach as far north as Paducah on the inland waterway system. If this becomes a reality, the port wants to be in a position to handle those containers. This will require a large financial investment from the port. The Port of Paducah believes that container on barge will eventually become a reality once the service is operational, as the savings will drive the market. Lacking presently is the momentum of a reliable service running from point A to point B. Successful implementation of container on barge may require that barge companies underwrite potential routes to ensure the service runs consistently and reliably.
During the first years of service, it is unlikely container on barge activity would be healthy enough to generate enough business to turn a profit. This situation necessitates the need for financial underwriting. Therefore, if barge companies were to offset costs via subsidies during the startup period, it would allow industries to: 1) utilize container, (2) see the benefits (3) allow for more confidence, potentially setting the stage for growth.
Upgrade for COB
The upgrades, to the Paducah – McCracken County River Port, will enable them to facilitate container on barge transport. This includes purchasing a new gantry crane, and laying a concrete foundation that can support the new crane and the crane’s increased load capacity. Paducah has unsuccessfully applied for TIGER grants in the past (total of four) to help offset the upgrade costs. In 2012, they elected to move ahead with plans to become a container on barge port through private financing. The estimated cost of the project is $4 million, and the estimated time until completion is one year. The cost is broken down as follows: $1.4 million for a 45‐50 ton container‐handling gantry crane and $1.8 million for the high‐capacity concrete foundation needed to support the weight of the new crane at full capacity (approximately 200 tons).
190
Safety / Security Benefits of COB through Paducah
Similar to other ports, the Port of Paducah emphasizes that expanded use of waterways that will prevent trains and trucks from having to traverse major metropolitan areas. This will alleviate traffic congestion, reduce the environmental impacts of shipping, and enhance the sustainability of the industry. Moreover, use of waterways and port infrastructure offers a safer way to transport hazardous materials. This is due to barges remaining on the waterways and away from residential and commercial centers.
Advantage of Operator Ports vs. Landlord Ports
The Port of Paducah is an operator port. As has been the case with other operator ports we visited, Mr. Canter noted the advantages operator ports have over landlord ports in terms of implementing sustainability initiatives. Operator ports have the ability to make, for example, investment decisions autonomously. According to representatives at the Port of Paducah, being a public port offers an advantage over privation. This is because it ensures that all business is public knowledge, and the port is able to operate without favorites being played. This specifically refers to the sense of certain shippers/operators gaining privileges by doing something sustainable, which might leave smaller operators and shippers in a bad position if they do not have the capital to finance improvements. Similarly, no operator can set policies at the port which might disadvantage other shipping companies. It also allows the port to go forward with initiatives (such as the upgrade to facilitate COB) based upon their own decisions as opposed to having to negotiate with various other interests.
Foreign Trade Zone (FTZ)
In addition to operational and infrastructure concerns, Mr. Canter discussed the importance of a FTZ to the success of any container on barge activities for the port. Currently, the Port of Paducah is not designated a FTZ. The port sponsored a study, however, examining the costs and benefits of becoming an FTZ, and whether this would improve Western Kentucky economic development. MSC Strategies, LLC performed this study. The results indicated that the move would be very advantageous to the port and community. The advantages come in the form of drawing more businesses to the port and allowing the port to be a hub for shipping companies without attaching taxes and tariffs to commodities as they are loaded or unloaded at the port. Essentially, with a FTZ in place, commodities would not have taxes levied on them until reaching their final destination. This would increase the attractiveness of the services provided in Paducah. Moreover, the certification would only require a $150,000 investment. Despite this number, the port has not been able to convince surrounding counties to invest in the project.
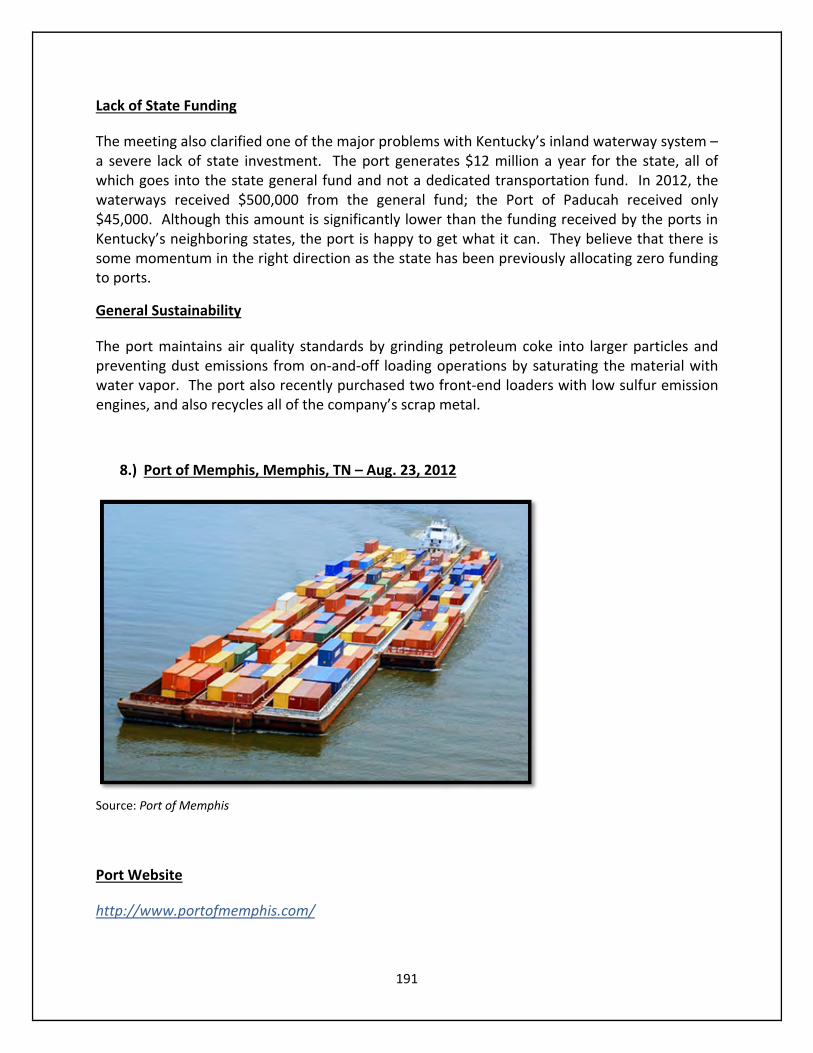
191
Lack of State Funding
The meeting also clarified one of the major problems with Kentucky’s inland waterway system – a severe lack of state investment. The port generates $12 million a year for the state, all of which goes into the state general fund and not a dedicated transportation fund. In 2012, the waterways received $500,000 from the general fund; the Port of Paducah received only $45,000. Although this amount is significantly lower than the funding received by the ports in Kentucky’s neighboring states, the port is happy to get what it can. They believe that there is some momentum in the right direction as the state has been previously allocating zero funding to ports.
General Sustainability
The port maintains air quality standards by grinding petroleum coke into larger particles and preventing dust emissions from on‐and‐off loading operations by saturating the material with water vapor. The port also recently purchased two front‐end loaders with low sulfur emission engines, and also recycles all of the company’s scrap metal.
8.) Port of Memphis, Memphis, TN – Aug. 23, 2012
Source: Port of Memphis
Port Website
http://www.portofmemphis.com/
192
Summary
On August 23rd, 2012 a research team from the Kentucky Transportation Center met with Mr. Randy Richardson from the Port of Memphis. Two main points of discussion were developed during the meeting. First, the Port of Memphis is a large‐scale river port that has first‐hand experience with container on barge transportation via the now‐defunct Osprey Barge Line. Second, the discussion countered the optimism regarding the future of container on barge expressed by officials in Paducah. Contrary to the viewpoint provided by Mr. Canter in Paducah, Mr. Richardson was skeptical that container on barge movements will account for a significant portion of traffic along the inland waterway system in the immediate future.
Principles
Randy Richardson – Executive Director, International Port of Memphis
Particulars
Meeting with Randy Richardson at the Memphis Port Authority Offices
Tour of Port Operations
Randy Richardson ‐ Executive Director, Port of Memphis
FTZ & Homeland Security
The Port of Memphis is a designated Foreign Trade Zone (FTZ). It has also been selected by the Department of Homeland Security as a “best practices” model for high‐tech security measures. The port was awarded funding to implement technology solutions. This technology involves improving GPS satellite tracking and mobile radiation detection units, and improving preparedness and response to natural disasters and terrorist attacks ‐ due to its strategic location and logistical importance.
Valero Petroleum
The port houses the Valero petroleum refinery, which is the only refinery in Tennessee. The refinery has a pipeline that carries jet fuel from the port directly to Memphis International Airport. Having the refinery located on‐site has increased port sustainability because of the increase in diversification it has brought to operations.

193
Commodities
The main commodities that pass through the Port of Memphis:
Coal
Food and Farm Products
Petroleum
Crude Material
Chemicals
Manufactures Goods
The Importance of an Economic Impact Study
The meeting with representatives from the Port of Memphis also echoed sentiments articulated in Houston and Savannah, as to the importance of an Economic Impact Study. The Port of Memphis has employed Tulane University to provide them with an Economic Impact Study that demonstrates the port’s importance to local and federal economies. The report builds a persuasive case that the Port of Memphis generates substantial economic activity for the city of Memphis (and Shelby County), and that the economic sustainability of the area is directly tied to the port’s fortunes:
‐ 15,700 jobs supported within Shelby County (5,162 jobs directly employed by ports which is 10,529 indirect jobs)
‐ Average annual total economic impact of the International Port of Memphis (and the region) is approximately 6.7 billion dollars
‐ 32.4 million in taxes to the local government
Environmental Management
Since 2000, the Port of Memphis has upgraded motors and engines of all port‐owned cargo‐handling equipment with engine exhaust enhancements, including diesel oxidation catalysts and crankcase filtration systems. The port successfully lobbied for a grant (distributed under the Diesel Emissions Reduction) to finance these important sustainability improvements. The port’s economic impact study contributed to the success of the grant bid, according to port representatives. In addition to the emissions improvements, the grant also paid to convert port‐owned, diesel‐powered cargo handling equipment to Ultra Low Sulfur Diesel Fuels (ULSD), which lowered noxious emissions by 34 percent.

194
Sustainability Office Like many of the inland river ports, the Port of Memphis lacks an environmental management/sustainability office or manager. The executive director, however, has been proactive in searching out and responding to sustainability grant opportunities in the area. Also, the executive director has distributed this information to port distributors and tenants. The port representatives credit the close relationship with deep‐water coastal ports for the proactive approach that the tenants are willing to accept. Coastal ports exist on a massive scale. They impact the surrounding region significantly, and also impact most non‐attainment zones. Therefore, they must adhere to relatively stringent sustainability protocols. The Port of Memphis has, therefore, focused on mirroring much of their development pathway in hopes of remaining a major partner with them. All grants that become available to the Port of Memphis’ coastal partners are investigated for possible application at the Memphis port. Tenants of the port are often sponsored by the port authority should they choose to pursue any such opportunities. Focus on Rail Mode
The Port of Memphis is served by five Class 1 railroads, which positions them as an extremely attractive inland port destination for shipments originating from deep‐water coastal ports. Rail lines contribute to the port’s sustainability profile because of the efficiency with which they transport cargo (one ton of cargo can travel 500 miles on a single gallon of fuel). Further, rail transport reduces overall traffic congestion, energy demand, and emissions. This allows for quick loading, unloading, and fewer touches.
195
Osprey Line
The Osprey Line was a container on barge service that ran from 2004‐2010 between Memphis and Houston, Texas. The service ran between the Port of Memphis and the Port of Houston. It was fairly successful until the economic downturn forced them out of business. One of the major issues that the service faced, however, is that even in the best of times commodities were typically only going down the river and not regularly coming up. This largely negated the competitive advantage over rail and road transport. Once rail lines made the decision to lower cargo rates along the Mississippi River Corridor, Osprey was no longer able to compete ‐ sealing its fate.
Commodity Flows and Container on Barge
The experience the Port of Memphis had with container on barge transport involved regular traffic going upriver, but very little coming downriver. As a result, while full containers moved northwards, many containers made the journey southward empty. The representatives at the Port of Memphis stated, “They were pushing air.” This curtailed the savings that container on barge could offer to potential customers already utilizing other transportation networks, such as rail and truck. It also meant that the edge in sustainability is lessened as more fuel is being spent moving empty containers down the river. This, as much as anything else, in Mr. Richardson’s eyes made container on barge a situation where it “looked good on paper” but was not financially tenable. This is not to say, however, that there was not a litany of other roadblocks related to the successful implementation of the service. During our meeting, many problems associated with container on barge were detailed. Some of which are discussed in the following information.
Economies of Scale and Modal Switches
The handling costs of transporting increase as the number of “touches” increases. This means that every time a commodity is transferred from one mode of transport to another, overall transport costs rise. Since container on barge introduces more “touches” at ports, inefficiencies develop. The representatives at the Port of Memphis pointed out that most ports have the technology to move a container from a ship to a rail car or truck in one “touch.” However, the same cannot be said of barges. According to the Port of Memphis, there have been instances when this hindrance has been overcome. One example relates to Hong Kong, where the barges come out into the coastal waters and load up containers directly from ship liners. Given the established infrastructure at U.S. coastal ports, this process is unlikely to work. Perception
In addition to the real challenges facing container on barge transport, a major obstacle is customer perception. Most customers, according to port representatives, view transportation via barges along rivers as a substandard method for container commodities. Of primary
196
concern is the commodities would suffer increased exposure to the elements, and potentially be susceptible to water damage. Further, there is a perception that “just in time” supply chains would be unsuited to the increased travel time and sometimes‐inconsistent travel patterns associated with barge transportation. Modernization has led to businesses warehousing products less frequently. They prefer to order products directly from distribution centers, which makes barge transport an impractical option when goods are needed in one or two days.
Barge Design
Although we previously heard from representatives at the Port of Paducah that containers could be loaded onto barges with ease, those at the Port of Memphis described numerous problems that arise from placing containers on barges. First, given that barges were not designed specifically with containers in mind, loading increases visibility problems for the pilothouses on towboats that move barges up and down the rivers. Specifically, the pilothouses don’t sit up high enough for the captains to see over the stacked containers on barges. Often, containers are filled with significant quantities of air, and do not weigh as much as aggregates or break bulk loaded barges. This produces less draft, meaning the barges do not submerge as deeply in the water. With containers stacked high, a visual obstruction results. Barge / Container Weight
Containers move a considerable amount of “dead” air. Therefore, container‐loaded barges are considerably lighter than typical barge tows. Towboats are not specifically configured to move container on barge cargo. As a result, towboats moving container on barge cargo are massively overpowered and use excessive amounts of fuel relative to the weight they are pushing – creating a net negative for sustainability. While this does result in containers moving quicker as compared to traditional barge tows, the speed is still considerably slower that alternative modes such as rail and road, making them an impractical shipping option.
Post Panamax Ships & Ports with Hinterlands
When the announcement of the expansion of the Panama Canal was announced, the inland river industry immediately viewed it as an opportunity for container on barge to finally gain traction in the U.S. However, evidence suggests that the ports equipped to handle large Post‐Panamax (the 15,000 TEU ships that will soon be able to pass through the canal) will not be those in the Gulf of Mexico. These ships will likely call on ports with expansive hinterlands for distribution purposes. They will also likely prefer to call on ports that allow for efficient entrance and exit. As a result, the impact on the inland river system may be non‐existent and business as usual will continue.
197
Small Movements or Large Corporations
Port of Memphis representatives conceded that container on barge might be effective for small movements or a practical option for large corporations. Small movements in niche markets (exemplified by the 64 Express Program in Norfolk) can be effective at addressing specific sustainability concerns, or to serve the specific interests of individual companies. Port representatives also pointed out that large individual corporations with large supply orders and direct access to barges could establish relationships with container barge companies that offered comparative advantages. Concluding Notes (Visit 3 ‐ Paducah, Memphis)
The visits to Paducah and Memphis presented an excellent counterpoint to one another, and provided two starkly different views on the potential of container on barge (COB). In Paducah, there is a sense of optimism so strong that port officials have decided to be the first port on the inland waterways system to install equipment dedicated to facilitating the barge loading and unloading of containers. These investments are not small in terms of the port’s operating capital. On the other side of the debate surrounding container on barge, were the representatives from the Port of Memphis. The Memphis officials were less optimistic than most regarding the potential for container on barge, which is likely due to their previous experience with the now defunct Osprey Line. The Port of Paducah is aggressively optimistic and the Port of Memphis cautiously pessimistic, which means the reality likely lies somewhere in the middle.
Too many structural and perceptual challenges face COB for large scale corridor‐wide service to be a reality in the near future. Perception and ingrained business practices will need to be changed, more inland ports with the ability to facilitate containers will need to be created, shipping companies will need to offer regular services, the infrastructure of the inland waterway system will need to be repaired, and federal and state dollars will need to be invested. If container on barge is to become a reality at any point, the momentum must begin somewhere. The Port of Paducah and the small niche services operating at various ports around the country may be that launching point, if they can find the appropriate niches and clients for the service. It is also important to note that, if nothing else, the decisions made at the Port of Paducah have created a buzz within the industry that extends to the major coastal ports KTC visited.
However, a major challenge for the Port of Paducah’s COB hopes (and to those of any port wishing to follow their example) is gaining Foreign Trade Zone status for port operations. Companies moving containerized cargo are unlikely to make modal switches at inland ports where they will be subject to customs duties and other ad valorem taxes. Unless these potential inland port hubs for COB offer FTZ advantages, shippers will simply transfer their cargo to rail or truck at the FTZ of the coastal port. Shippers will then unload at their final destination. For the inland port system to gain any benefit from container on barge, FTZ’s must first be in place.

198
Finally, the impressive sustainability profile displayed at the Port of Memphis (despite the lack of a sustainability office and the Port of Paducah’s limited efforts toward environmental sustainability) deserve discussion. The Port of Paducah, like most inland river ports, has no sustainability office or report. This is largely due to the port experiencing little pressure to invest in sustainability programs or seek out opportunities. This also opens up the opportunity for some significant and low investment improvements in sustainability for the port. A port must begin with measures such as efficiency in energy, equipment upgrades, and the creation of a dedicated sustainability unit to seek out and implement opportunities.
Alternatively, the Port of Memphis (in relation to many of its peers) has an impressive array of sustainability programs in effect. These programs exist, despite lacking a dedicated sustainability office. This is due, in fact, to the port following closely in the footsteps of its coastal port partners, who have sustainability offices and have taken progressive approaches to sustainability. The Port of Memphis approach is an example that could work well for many of Kentucky’s inland river ports that lack the necessary offices and resources to achieve progress in sustainability.
9.) Port of Cincinnati (CINBULK Terminals) Cincinnati, Ohio – Aug. 20, 2012
Port Website
http://www.cinbulk.com/
199
Summary
This Port of Cincinnati and Cinbulk Terminals, both owned and operated by the same group, were the first to become a fully private port. It provided more insight into the scale and operations of an inland river port. Jack Weiss and Ronald Hodel represented Cinbulk Terminals. The major takeaway point from the visit was a deeper understanding of how sustainability can be facilitated via diversification strategies. Port officials did not express optimism about the prospect of container on barge. This issue is explored in more detail below.
Principles
Jack Weiss – President Cinbulk Terminals & Port of Cincinnati
Ronald Hodel – Environmental, Health, and Safety Coordinator, Cinbulk Terminals
Particulars
Tour of Operations and Facilities
Discussion of Operations with Jack Weiss
Discussion of Sustainability Concerns and Initiatives with Bill Houston
Photography of Site
Jack Weiss – President Cinbulk Terminals & Port of Cincinnati
Private Port
Cinbulk Terminals was the first fully privately owned and operated port the research team visited. This port offered an alternate perspective from which to view the river port industry. Even more so than is the case with operator ports, private ports have leeway in determining initiatives. This leeway, Mr. Weiss attested, gives them a considerable advantage over public ports. As a private port, Cinbulk can negotiate terms with customers, reinvest fully into their business, apply for and accept public money at their own discretion, and pursue new directions extremely quickly.
Economic Sustainability through Diversification
Mr. Weiss discussed challenges the port has faced with respect to remaining economically sustainable as the economy has taken a downturn, and energy preferences have shifted away from coal to natural gas. The port’s coal business is down 600,000 tons per year from a decade ago. Because coal has been the main commodity handled by the port, this raises concerns about the port’s economic sustainability. In response to these concerns, port officials decided to aggressively diversify the commodities it handles. To this end, the port elected not to invest in container on barge but to actively seek alternative break bulk and aggregate commodity
200
flow, and to provide value added to the coal they move. The alternative commodity flows include pig iron, petroleum coke, rolls of steel sheets, bagged minerals, and palletized cargo.
Targeted Coal Processing
Cinbulk has set up several coal processing plants on their port site which enables them to provide exactly the type of coal a customer needs. Cinbulk processes and divides their coal by grain, size, and chemical composition. This lets the port maintain a competitive advantage over their competitors because it can supply a customer with the precise grain and chemical compositions requested. Cinbulk can provide customers with exactly what they need for all of their refineries, which saves the customer from going through multiple handlers.
“Just in Time” Delivery for Proctor and Gamble
Another method that the port has undertaken to increase economic sustainability is to provide “just in time” coal delivery to the Proctor and Gamble facilities in Cincinnati, Ohio. The port delivers coal by truck every 45 minutes, seven days a week, to the company. This arrangement was set up after Proctor and Gamble expressed it did not want multiple coal trucks queued up at their facilities. Under the current arrangement, only one truck is ever on Proctor and Gamble’s site at one time.
Owning the Commodity
Another advantage of being a private port, according to Mr. Weiss, is that the port was able to make the decision to purchase and own all of the coal they transport. Moreover, by owning the coal they transport, the port is able to decide how to refine it, who to sell it to, and when to sell it. This increases their flexibility and profit margins.
Container on Barge
The Port of Cincinnati has elected to stay out of the container on barge business presently. As recently as August 2012, the port decided against a proposal brought to them by a private business looking to use container on barge. This proposal was for the transportation of soybeans from the Ohio River down the Mississippi River, out into the Gulf, then to Asia. The port did a thorough economic feasibility study and elected not to become involved in the venture.
Carpet Recycling Program
Utilizing a $200,000 federal TIGER grant and matching the funds themselves, Cinbulk operates a carpet recycling operation that collects and processes post‐consumer and post‐industrial carpets and carpet pads. They collect carpet from Cincinnati, Dayton, Columbus, and Louisville and ship it to a company in Georgia. At that point the used carpet is converted into plastic pellets that can then be used for a variety of different industrial needs. Each year, roughly 2.5 million tons of waste carpet reaches landfills in America, which accounts for almost 3 percent of total landfill space. The project is profit‐neutral for the port but it remains active.
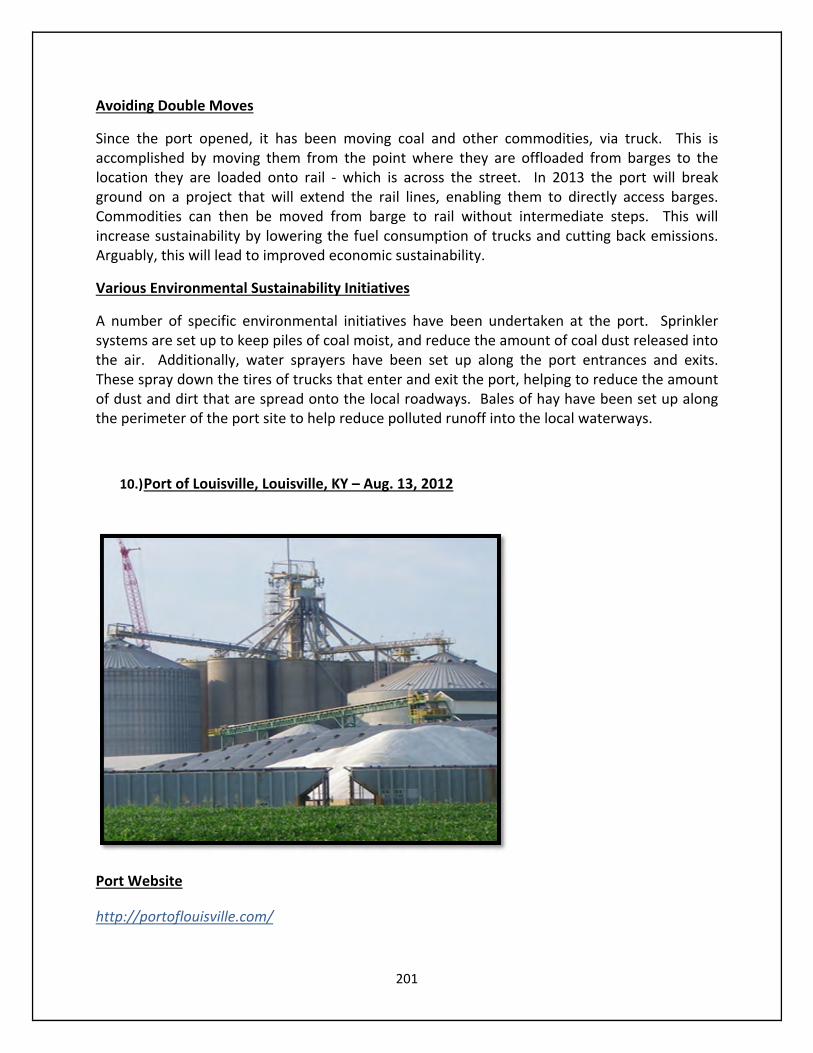
201
Avoiding Double Moves
Since the port opened, it has been moving coal and other commodities, via truck. This is accomplished by moving them from the point where they are offloaded from barges to the location they are loaded onto rail ‐ which is across the street. In 2013 the port will break ground on a project that will extend the rail lines, enabling them to directly access barges. Commodities can then be moved from barge to rail without intermediate steps. This will increase sustainability by lowering the fuel consumption of trucks and cutting back emissions. Arguably, this will lead to improved economic sustainability.
Various Environmental Sustainability Initiatives
A number of specific environmental initiatives have been undertaken at the port. Sprinkler systems are set up to keep piles of coal moist, and reduce the amount of coal dust released into the air. Additionally, water sprayers have been set up along the port entrances and exits. These spray down the tires of trucks that enter and exit the port, helping to reduce the amount of dust and dirt that are spread onto the local roadways. Bales of hay have been set up along the perimeter of the port site to help reduce polluted runoff into the local waterways.
10.) Port of Louisville, Louisville, KY – Aug. 13, 2012
Port Website
http://portoflouisville.com/
202
Summary
On August 13th, 2012 the research team from the Kentucky Transportation Center (KTC) met with the director of marketing, and the vice president of corporate development (Port of Louisville, located in Kentucky). The port has initiated little in the way of sustainability projects or practices. Also of note, the port representatives admittedly had little sense of where to procure information regarding sustainability initiatives or the funding to put them into practice, thus highlighting the need for sustainability initiative sharing.
Principles
Joe Tegart – Principle Sales and Marketing, Port of Louisville
Greg Cantrell ‐ Vice President, Corporate Development, Port of Louisville
Particulars
Meeting with Joe Tegart and Greg Cantrell at Port of Louisville main offices.
Tour of port facilities.
FTZ & Industrial Park
The Port of Louisville is a fully recognized foreign trade zone with all of the financial incentives that go along with it for importers and exporters of raw materials, semi‐finished, and finished goods.
Coal Terminal
The Port of Louisville has a coal terminal that features 260,000 net tons of ground storage capacity. The two barging fleet areas have a total capacity of 60 barges. In addition, the coal terminal has the ability to unload 2,000 tons of coal per hour, and has access to three separate railroads.
Rail and Road
The Jefferson River port terminal is one of the few inland industrial ports in the nation with access to single‐line haul (via three railroads). The port features rail access to CSX, Norfolk Southern, and Paducah & Louisville. In addition, a new four‐lane highway connects the river port to the interstate system less than five minutes away.
Lack of Available Information
A key point that arose during meetings at the Port of Louisville, which was the difficulty the small port had encountered with identifying sustainability opportunities in the form of grants and government programs. Port officials acknowledged they had done little in the way of investigating, researching, or pursuing sustainability opportunities. Much of this can be attributed to three areas. First, the port officials had a very nebulous understanding of the
203
concept of sustainability. Second, they lacked a sustainability office, officer, or even someone from an alternate department that handled sustainability issues. This contributed to the third problem of not knowing where to find information about sustainability programs, or how the port could benefit from developing sustainability initiatives. As a landlord port, these responsibilities would typically fall to the port authority to fulfill. There is not a person at the port that currently does so, however.
Lack of Public Funding
The representatives from the Port of Louisville lamented the funding and organizational apparatus available to the public ports in Kentucky. Compared to the level of funding available to competitor ports in Indiana and other proximate states, Kentucky does not provide substantial funding to the inland waterway system. The representatives from the port explained that the inland waterways in Kentucky had received $500,000 in funding from the state general fund in 2012, and that the Port of Louisville had received zero funding from that allotment. The problem with this point of view, however, is that all of the ports we visited during the summer of 2012 operated independently of public funding.
Whether the ports were private business or state port authorities, they are generally self‐sufficient. One method which might assist some of the inland river ports in Kentucky (in terms of economic sustainability) is development financing.
Development Financing
The Port of Louisville, and other ports in Kentucky, would benefit greatly from being permitted to facilitate development financing. Development financing is something that landlord ports typically already do for the tenants located directly on their property. It involves the use of a bonding authority to build or expand a facility on behalf of a private company. The company then repays the bond through a lease agreement. Companies treat the cost as an operating expense rather than a capital investment, improving balance sheet ratios and conserving capital for other needs. The Indiana Port Authority obtained statutory changes during the 2003 legislative session that allows the agency to offer development financing to firms statewide, not just to port tenants.
The Port Authority of Cincinnati also has enjoyed this flexibility for several years. Statewide development financing authority could be what river ports in Kentucky need to compete for companies (with ports in neighboring states) that already operate under this model. Often, development financing can serve as a “tie breaking” economic incentive to solidify agreements with companies that might otherwise locate in another state or not pursue a project. Given that the port’s neighbors are already employing the strategy, Kentucky needs to investigate this option.
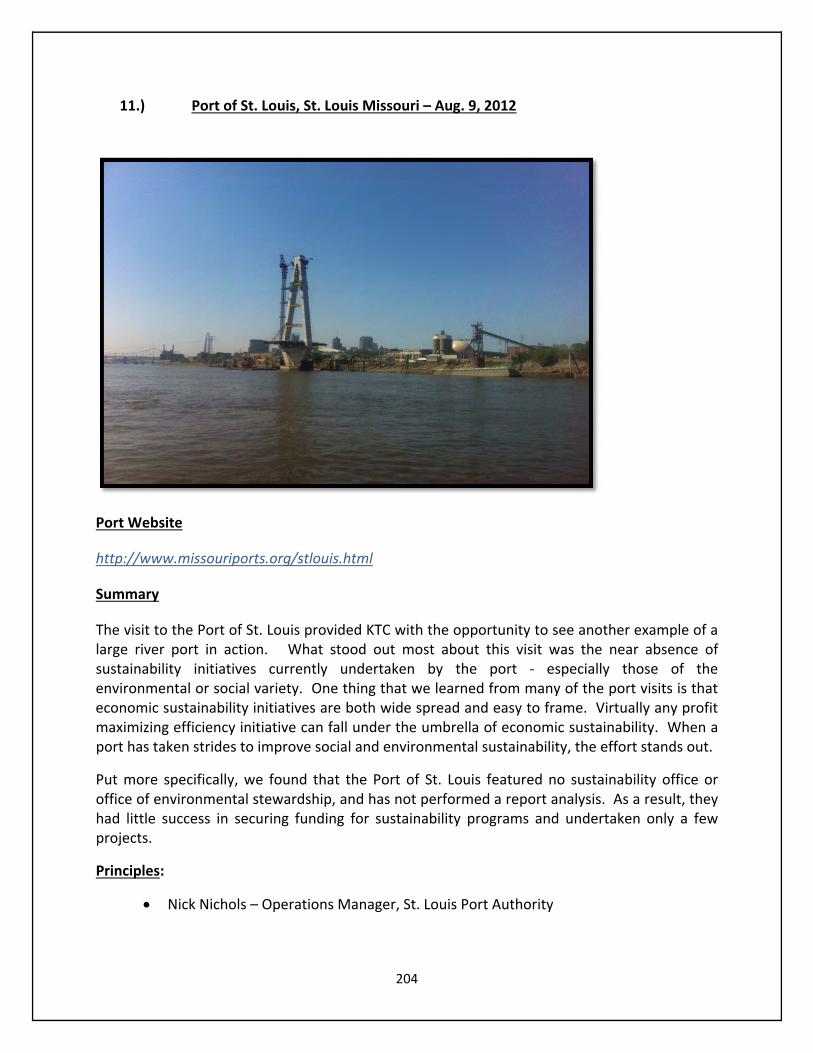
204
11.) Port of St. Louis, St. Louis Missouri – Aug. 9, 2012
Port Website
http://www.missouriports.org/stlouis.html
Summary
The visit to the Port of St. Louis provided KTC with the opportunity to see another example of a large river port in action. What stood out most about this visit was the near absence of sustainability initiatives currently undertaken by the port ‐ especially those of the environmental or social variety. One thing that we learned from many of the port visits is that economic sustainability initiatives are both wide spread and easy to frame. Virtually any profit maximizing efficiency initiative can fall under the umbrella of economic sustainability. When a port has taken strides to improve social and environmental sustainability, the effort stands out.
Put more specifically, we found that the Port of St. Louis featured no sustainability office or office of environmental stewardship, and has not performed a report analysis. As a result, they had little success in securing funding for sustainability programs and undertaken only a few projects.
Principles:
Nick Nichols – Operations Manager, St. Louis Port Authority
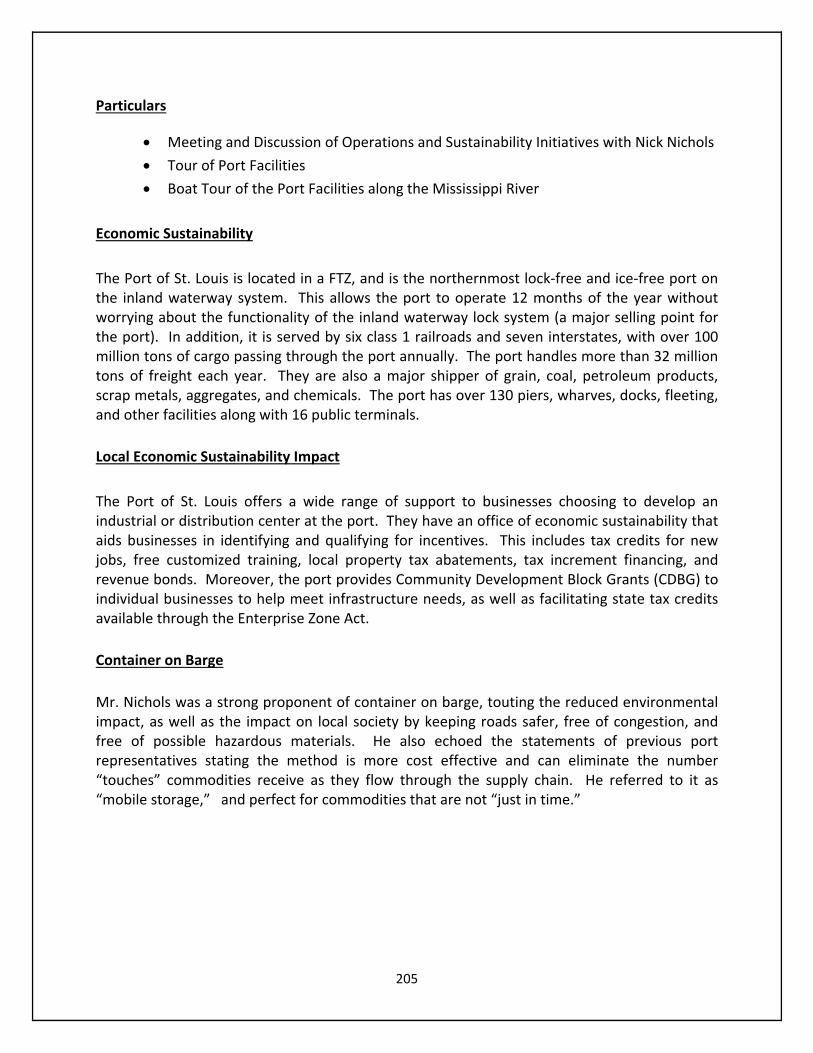
205
Particulars
Meeting and Discussion of Operations and Sustainability Initiatives with Nick Nichols
Tour of Port Facilities
Boat Tour of the Port Facilities along the Mississippi River
Economic Sustainability
The Port of St. Louis is located in a FTZ, and is the northernmost lock‐free and ice‐free port on the inland waterway system. This allows the port to operate 12 months of the year without worrying about the functionality of the inland waterway lock system (a major selling point for the port). In addition, it is served by six class 1 railroads and seven interstates, with over 100 million tons of cargo passing through the port annually. The port handles more than 32 million tons of freight each year. They are also a major shipper of grain, coal, petroleum products, scrap metals, aggregates, and chemicals. The port has over 130 piers, wharves, docks, fleeting, and other facilities along with 16 public terminals.
Local Economic Sustainability Impact
The Port of St. Louis offers a wide range of support to businesses choosing to develop an industrial or distribution center at the port. They have an office of economic sustainability that aids businesses in identifying and qualifying for incentives. This includes tax credits for new jobs, free customized training, local property tax abatements, tax increment financing, and revenue bonds. Moreover, the port provides Community Development Block Grants (CDBG) to individual businesses to help meet infrastructure needs, as well as facilitating state tax credits available through the Enterprise Zone Act.
Container on Barge
Mr. Nichols was a strong proponent of container on barge, touting the reduced environmental impact, as well as the impact on local society by keeping roads safer, free of congestion, and free of possible hazardous materials. He also echoed the statements of previous port representatives stating the method is more cost effective and can eliminate the number “touches” commodities receive as they flow through the supply chain. He referred to it as “mobile storage,” and perfect for commodities that are not “just in time.”
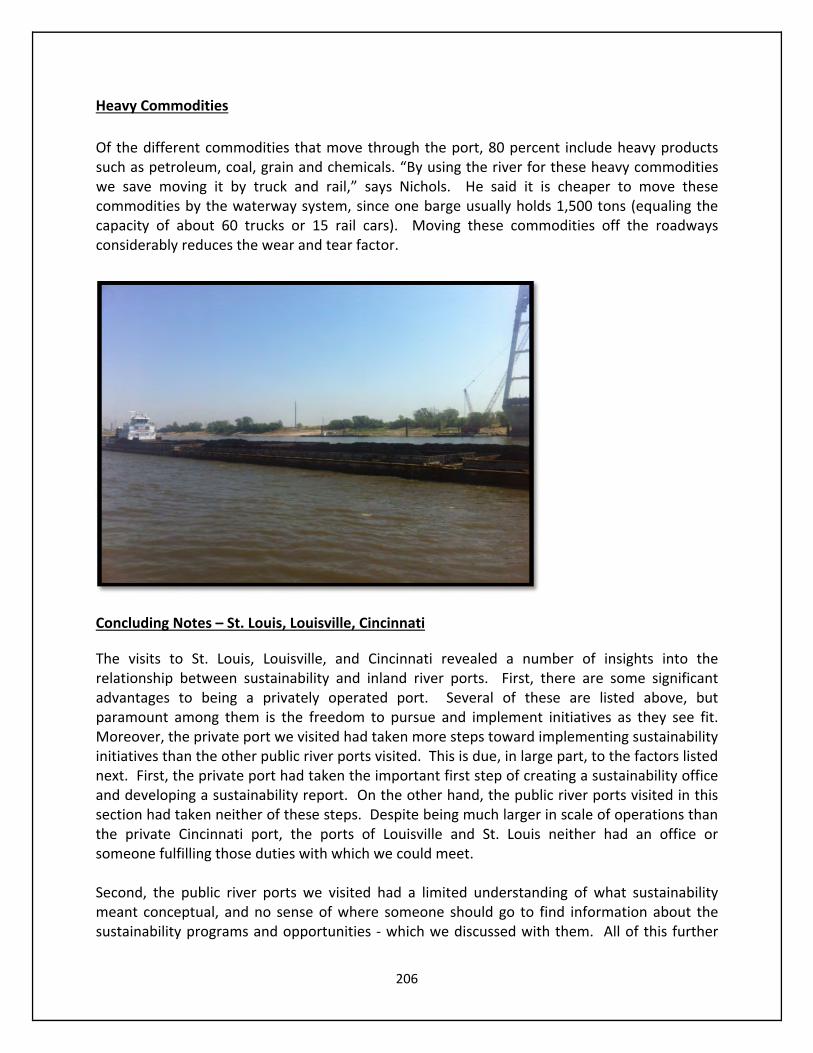
206
Heavy Commodities
Of the different commodities that move through the port, 80 percent include heavy products such as petroleum, coal, grain and chemicals. “By using the river for these heavy commodities we save moving it by truck and rail,” says Nichols. He said it is cheaper to move these commodities by the waterway system, since one barge usually holds 1,500 tons (equaling the capacity of about 60 trucks or 15 rail cars). Moving these commodities off the roadways considerably reduces the wear and tear factor.
Concluding Notes – St. Louis, Louisville, Cincinnati
The visits to St. Louis, Louisville, and Cincinnati revealed a number of insights into the relationship between sustainability and inland river ports. First, there are some significant advantages to being a privately operated port. Several of these are listed above, but paramount among them is the freedom to pursue and implement initiatives as they see fit. Moreover, the private port we visited had taken more steps toward implementing sustainability initiatives than the other public river ports visited. This is due, in large part, to the factors listed next. First, the private port had taken the important first step of creating a sustainability office and developing a sustainability report. On the other hand, the public river ports visited in this section had taken neither of these steps. Despite being much larger in scale of operations than the private Cincinnati port, the ports of Louisville and St. Louis neither had an office or someone fulfilling those duties with which we could meet. Second, the public river ports we visited had a limited understanding of what sustainability meant conceptual, and no sense of where someone should go to find information about the sustainability programs and opportunities ‐ which we discussed with them. All of this further
207
underlines the importance of dedicated sustainability offices, and calls for some type of centralized sustainability information source for Kentucky’s river ports. If the port landlords or operators are unable to provide this important information to tenants and customers, then one of two developments are needed. The ports can have an information session designed to bring in operators of the river ports and inform them on how to create a sustainability office (and where to get information for their clients and tenants), or the creation of an auxiliary office that can provide this service to tenants, operators, and port authorities externally. Either way, the need for information (from grant opportunities to innovative methods for controlling waste water runoff) is readily apparent. In addition, the visits to St. Louis, Cincinnati, and Louisville demonstrated that diversification can be an important ally for ports in terms of economic sustainability. While many in the public river port industry are looking to container on barge and waterway infrastructure upgrades as the panacea for the struggling industry, a lesson in diversification and creating exploitable niches from private ports would be beneficial as well. The private port KTC research liaised with in Cincinnati had been approached earlier with container on barge, only to decide that diversification of commodities and value added post‐processing were more reliable solutions to the economic hardships facing them and the industry at large. By diversifying away from strictly coal, and developing the ability to process coal in a number of ways on‐site, the port was able to create niches for itself and see profits actually increase. This is not to say that container‐on‐barge is not a potentially fruitful avenue for public ports, or private ports for that matter, but it does demonstrate that in these early stages it will be important to view it as tailored to fill specific niches. Cinbulk, due to its ability to post‐process specific types of coal and to deliver it routinely, has set up a “just in time” delivery system with Proctor and Gamble in Cincinnati. Similar relationships, whereby heavy containerized commodities are delivered via barge to specific large scale industries in a just in time manner, could follow this design. While most of the experts KTC met over the series of 15 port visits were apprehensive to the more general concepts of container on barge, virtually all agreed it could work in such niches and potentially expand from there. Discussion – Transferable Initiatives for Inland Ports
The number of individual sustainability initiatives displayed by the ports discussed in this technical memorandum is quite lengthy, but those that can be properly transferred to the ports of the inland waterways occupy a much smaller space. Initiatives that require substantial up front financial investments on the part of the ports are likely inappropriate for inland ports. Similarly, many of the programs detailed above respond to issues specific to the ports in question. There are, however, a number of lessons that the inland waterways can learn from the coastal and inland ports discussed above. It is to this discussion that the conclusion of this memorandum will now turn. The following section discusses the initiatives that can be readily adopted by inland ports that can make significant impacts in their sustainability profiles, and are feasible for inland ports to implement.

208
Sustainability Office & Sustainability Report It is highly recommended that all inland river ports develop a sustainability office, or at the very least a sustainability officer along with a yearly sustainability report. This should be seen as a necessary first step in the process of improving sustainability. Only one port visited by the KTC research team lacked a sustainability office (Memphis) that could be considered successful in terms of sustainability. Moreover, the creation of a sustainability office is a low investment for ports with the potential for major returns ‐ in terms of recognizing and securing grants and other funding sources for sustainability investments. The results from the KTC site visits indicate that the preferred method for establishing a port sustainability office is to begin by establishing a sustainability officer or an environmental steward. These titles are largely interchangeable but “sustainability officer” more aptly encompasses everything the position entails. The next step is the creation of a sustainability report, which inventories all of the port’s sustainability efforts up to that point. From there the office or officer’s responsibilities will differ dependent upon whether the port is considered an operator or a landlord port. In either case, the office will investigate federal programs to aid sustainability initiatives, and look to similar offices at other ports to research what initiatives might be applicable to their situation. At landlord ports the office will largely make recommendations to the port’s tenants, while operator ports will seek to apply initiatives directly. In both cases, trucking companies, shipping companies, rail companies, and barge services should be brought into the process and provided opportunities to invest in sustainability. Niche Container on Barge Service Operations like 64 Express in Virginia and the inland distribution centers in South Carolina, demonstrate that container on barge can work in specific niches. The Osprey Line, on the other hand, indicates that the infrastructure for large scale container on barge service is not yet present. With investments currently made at ports like Paducah, other inland ports should investigate opportunities to work with barge companies to fill niches in transportation corridors with container on barge services. This is another area where sustainability offices can focus their attention. Diversification The ports of Cincinnati, New Orleans, and Charleston demonstrate the importance of diversification for economic sustainability. Cinbulk Terminals would not be in operation, if not for diversification into both alternatives to coal and alternative forms of coal. Likewise, the port of New Orleans and Charleston would have struggled mightily had they not invested heavily in passenger cruise ship terminals. It is recommended that an area of focus for inland port sustainability offices be “diversification opportunities” which can range from niche container on barge opportunities to commodity diversification and processing.

209
Not only is there economic sustainability benefits to diversification, there are also environmental benefits. Chief among these is modal diversification of all types of cargo. Diversifying into barge from rail, or into rail from truck for that matter, is an environmental sustainability enhancement. Likewise, moving hazardous materials off of highways and onto waterways is an improvement concerning social sustainability. Supply Chain / Tenant Sustainability Motivating tenants, clients, and customers to embrace sustainability initiatives (often at some cost to them) can be a difficult proposition for ports. For inland river ports, however, it is a necessary process to improve sustainability. The GO Program established at the Port of Norfolk delivers a good blueprint for inland ports looking to provide such motivation to those it does business with. The port began with an economic impact study and sustainability report. The port used them to secure funding from the federal government under the Federal Reinvestment and Recovery Act. They then allocated that funding to provide incentives for truck operators to retrofit older vehicles with more emissions‐friendly engines. The port did not, however, levy any penalties or limit access to companies that did not participate in the retro‐fittings. Instead, the port publicly recognized the companies that participated. It was conveyed upon them a number of benefits for going through the process; easier and quicker access on and off port property, and preferred involvement in other programs offered by the port. Most importantly, the port provided the companies with information and facilitated their involvement in the program. All of which refers back to the main point of having an established and dedicated sustainability office. Low Investment In House Environmental Sustainability By creating a sustainability office, becoming aware of opportunities, and providing those opportunities to tenants and clients, a port can reap sustainability benefits with very little monetary investment of their own. There are, however, many low investment/high impact initiatives that can be implemented “in house.” One of the most promising initiatives comes in the form of diesel fuel additives. Investments regarding conversions from diesel fuel to electric powered equipment and vehicles may be cost prohibitive for smaller inland river ports with tight financial bottom lines, but investments in diesel fuel additives that reduce the sulfur content of air emissions are relatively low cost and pay for themselves. In 2010, the Port of Savannah conducted a study into the effectiveness of diesel fuel additives for their equipment and vehicles. As of 2012, the program has demonstrated an overall reduction in fuel consumption of approximately five percent. In addition to this, there was an environmental sustainability benefit of reducing sulfur dioxide emissions by approximately 20 percent. This example demonstrates that such initiatives can simultaneously improve environmental sustainability while also positively impacting the financial bottom line. These types of programs are ideal for the inland river port industry.
210
In addition, there are litanies of other low cost initiatives that are available, and have been implemented by ports with sustainability offices in place to identify them. Such programs include: LED lighting, timed lighting systems, electric outlets for idling equipment or vehicles, and efficient placement of cargo to avoid multiple moves. Moreover, the EPA offers a variety of grants to fund the retrofitting of current equipment and vehicles under the Diesel Admissions Reduction Act. The creation of a sustainability office and the documentation of progress in a sustainability report, are vital to the hopes of securing funding. Finally, visits to private ports have demonstrated the impact that small and innovative projects can have for sustainability. Small upgrades such as installing sprinkler systems to wash tires of trucks as they enter or leave a port, misters to keep coal and other particulate commodities saturated, bales of hay to collect waste water runoff, repurposing runoff water to be used at wash pads, and converting from paper to electronic transactions, cost little to implement and generate big sustainability payoffs. In addition, small investments such as these can be compiled into a sustainability report. This information can be used to securing funding for future, more costly, projects. Efficiency Initiatives Efficiency improvements serve the purposes of improving social, economic, and environmental sustainability. As such, they are some of the most effective improvements that a port can make, especially if it is seeking a cost‐effective manner. The visits to a wide variety of ports over the course of 2012 demonstrated a number of efficiency initiatives. Among the most common are (1) facility layouts that eliminate multiple loading and unloading of commodities (2) lighting technology that responds to conditions. Foreign Trade Zones (FTZ) Foreign Trade Zones should be a priority for any river ports in Kentucky or the surrounding region that are not currently designated as such. The certification required to qualify for a FTZ is approximately $150,000 (which is a steep cost for some inland river ports). However, there are funding opportunities to pursue at the county, state and federal levels. From a sustainability perspective, being designated a FTZ increases the likelihood that a port can support some form of niche container on barge service. Economic Impact Report Securing funding for economic, social, or environmental sustainability initiatives is difficult for ports ‐ even in the most fortunate of circumstances. The inland waterway industry has found itself consistently having low visibility problems in terms of federal and state support. The infrastructure of the entire inland waterways system is in disrepair, and in desperate need of funding. A total of 90 percent of the locks and dams on the U.S. inland waterways system experienced some type of unscheduled delay in 2009. According to the U.S. Army Corp of Engineers, maintaining existing levels of unscheduled delays will require almost $13 billion in
211
cumulative investments by 2020. Current funding levels can only support $7 billion in investments. Given the current state of the waterway system, the vast majority of funding goes directly to lock and dam maintenance. If inland ports hope to receive any funding for sustainability initiatives, they will have to present powerful arguments in the form of both sustainability reports and economic impact studies. This information can demonstrate they have successful plans for sustainability and are important aspects of local and national economies. Coastal Partners as Mentors The Port of Memphis provides a strong example of an inland river port following coastal ports in terms of sustainability initiatives. The port representatives explained to the KTC research team that although they do not have a sustainability office, operations managers work closely with the sustainability offices of the Ports of Mobile and Houston to make sure that their tenants and shippers are aware of sustainability requirements. Moreover, the Port of Memphis has also implemented a number of sustainability initiatives at their facilities based upon results from the Ports of Mobile and Houston. A fruitful avenue for some of the smaller inland river ports in Kentucky (and the surrounding region) might be to establish a relationship with the sustainability offices of a major coastal port. This can be done to develop a port sustainability mentoring program, where they could learn about sustainability programs that might suit their specific needs.

212
This page left intentionally blank.
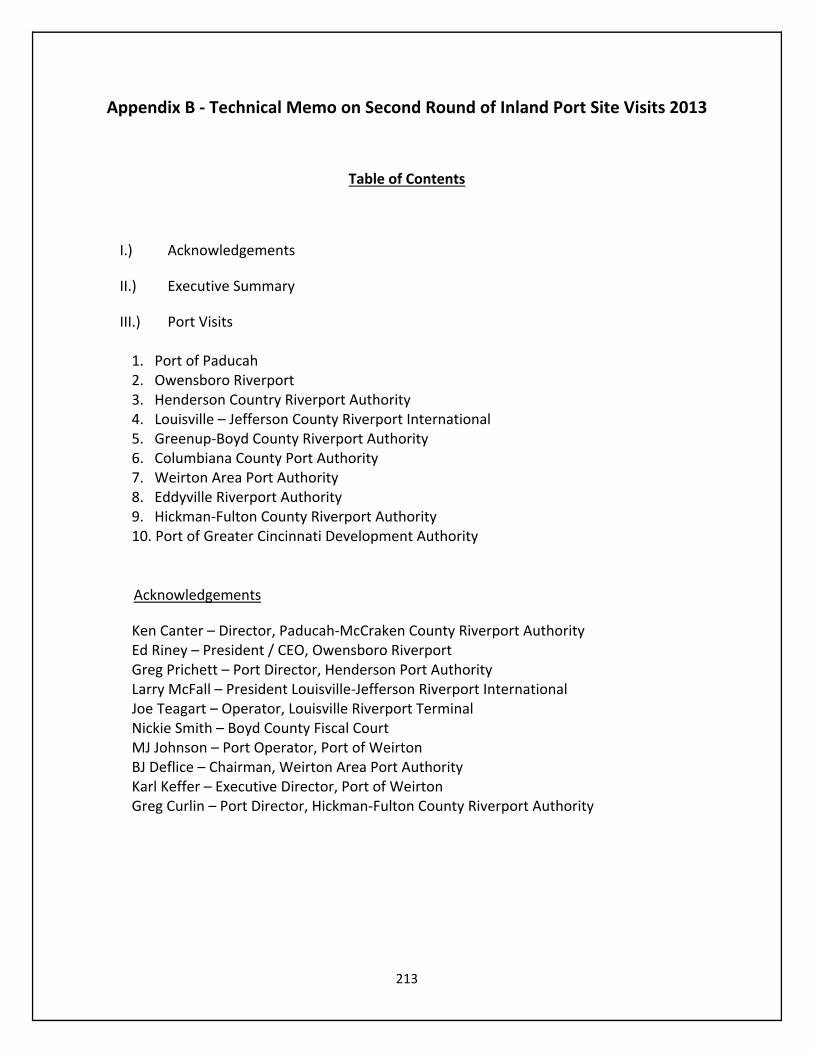
213
Appendix B ‐ Technical Memo on Second Round of Inland Port Site Visits 2013
Table of Contents
I.) Acknowledgements
II.) Executive Summary
III.) Port Visits
1. Port of Paducah 2. Owensboro Riverport 3. Henderson Country Riverport Authority 4. Louisville – Jefferson County Riverport International 5. Greenup‐Boyd County Riverport Authority 6. Columbiana County Port Authority 7. Weirton Area Port Authority 8. Eddyville Riverport Authority 9. Hickman‐Fulton County Riverport Authority 10. Port of Greater Cincinnati Development Authority
Acknowledgements
Ken Canter – Director, Paducah‐McCraken County Riverport Authority Ed Riney – President / CEO, Owensboro Riverport Greg Prichett – Port Director, Henderson Port Authority Larry McFall – President Louisville‐Jefferson Riverport International Joe Teagart – Operator, Louisville Riverport Terminal Nickie Smith – Boyd County Fiscal Court MJ Johnson – Port Operator, Port of Weirton BJ Deflice – Chairman, Weirton Area Port Authority Karl Keffer – Executive Director, Port of Weirton Greg Curlin – Port Director, Hickman‐Fulton County Riverport Authority
214
Executive Summary
A guiding principle of the KTC’s Inland Port Sustainability Project has, since its inception, been to take lessons learned by the coastal port industry and apply them to the inland port industry. A fundamental step in accomplishing this goal was the 2012 site visits to coastal ports along the U.S. East Coast, and many of the largest inland ports in the region. The previous technical memo discussed many lessons KTC learned while conducting field work. It was fundamental to learn these lessons, and equally important that the project deliver them to the inland port industry of Kentucky in an effective manner.
While this may seem to be a simple task upon first reflection, it is critical to understand the nature of the inland port industry before attempting to provide recommendations. As a result, KTC set out to tailor the lessons learned from the coastal port industry directly to the inland port industry. To accomplish this goal, KTC conducted a second series of site visits in 2013. From May‐September, researchers from KTC visited every public inland port in Kentucky (and several more along the Ohio River). These included: Paducah‐McCraken County Riverport, Owensboro Riverport, Henderson County Riverport Authority, Louisville‐Jefferson Riverport International, Port of Green‐Boyd County, Columbiana County Port Authority, Weirton Area Port Authority, Eddyville Riverport and Industrial Development Authority, Hickman‐Fulton County Riverport Authority, and the Port of Greater Cincinnati Development Authority.
The purpose of these site visits was threefold. First, we sought (in much the same manner as with the phase 1 site visits) to receive input and gain insight into the sustainability progress and challenges at the inland ports we visited. This was a vital step for many reasons. Primarily, because we wanted to compare the sustainability performance demonstrated at larger inland ports (regarding phase 1) to smaller inland ports in Kentucky. It was also necessary in order to develop a deeper understanding of the ports for which the audit template would ultimately be assessing.
A second, but equally important goal was to solicit direct input from the inland port operators and stakeholders regarding the initial draft of the audit template. The ultimate purpose was to verify that the self‐assessment tool would be of practical use to the ports it was designed for. Finally, these visits provided the project with a much broader list of best practices from which to build the foundation of the audit template, along with building working relationships with the inland port operators in Kentucky, Ohio, and West Virginia. In terms of the comparison to larger inland ports, and to even greater extent coastal ports, the inland ports visited in 2013 had considerably fewer resources dedicated to sustainability initiatives. Despite this situation, however, all of the ports visited were eager to invest in sustainability. Many had begun the process of becoming more sustainable. Moreover, these ports were eager to work with the KTC to develop the KTC’s Audit Template for Inland Port Sustainability.
Evidence from the 2013 site visits indicated that cost effectiveness would be pivotal to the potential for a sustainability movement to gain momentum within the inland port industry. This was a common thread running through each of the 2013 site visits. While this theme was apparent during the project’s first round of site visits in 2012, the discussions that took place in

215
the most recent visits drove home the point. Visits to ports such as those in Owensboro (KY), Weirton (WV), and Columbiana County (OH) provided KTC evidence that sustainability can be profitable. Moreover, there is also strong evidence that sustainability may not only improve profitability via the mechanism of efficiency, but also by making the port more appealing to potential clients and customers.
The Port of Weirton, for example, was particularly enthusiastic about working with KTC on this project, because the port has already seen the power of sustainability to draw or deter business. Over the past few years, the port has retained the Parsons Brinckerhoff and Stevens Institute of Technology in order to conduct various economic and strategic studies. Among other results, a primary finding was that sustainability can pay dividends in a short amount of time. As a result, the port recently self‐published a resiliency report, compiled with the Parsons Brinckerhoff and Stevens Institute of Technology, which is thematically similar to this report. Port operators in Weirton expressed that they have already seen the financial benefits of the report, primarily with respect to luring clients away from other distribution networks.
Three other important lessons were learned from the second round of port site visits, which provided valuable best practices for ports seeking to improve financial sustainability. First, several of the ports visited have adopted the business model of becoming “economic development groups” in addition to their more traditional roles. In each case, the ports that have moved in this direction have proven to be more financially successful than their peers. This business model has been adopted at some ports for quite some time. The Port of Cincinnati has operated for a long period of time, successfully as an economic development group, that no longer engages in traditional port activities. A less extreme example can be seen at the Columbiana Port Authority, which fulfills both a traditional port role as a multimodal transportation hub, as well as functioning as the most influential economic development group in the region. Similar instances of this business strategy were employed at the ports of Louisville and Owensboro.
Second, in addition to adopting roles as economic developers, some of the inland ports visited had established themselves as Foreign Trade Zones (FTZ). A FTZ is a geographical area (in or adjacent to a U.S. port of entry) where commercial merchandise, both domestic and foreign, receives the same custom treatment as if it were outside the commerce of the U.S. In other words, merchandise of every description may be held in a FTZ without being subject to custom duties and other ad valorem taxes. This tariff and tax relief is designed to lower the costs of operations based in the U.S., and engaged in international trade. This creates and retains employment and capital investment opportunities that result from those operations. This affords ports that have attained the designation significant economic benefits, and enhanced financial sustainability. The inland ports visited by KTC that currently have this distinction include the Port of Cincinnati, the Port of Owensboro, the Port of Louisville, and the Columbiana County Port Authority.
Third, further demonstrating that sustainability and economic success go hand in hand, is the movement at some inland ports to create more efficient intermodal terminals. This approach can be seen in action at the ports of Paducah, Hickman, and Louisville, among others. In terms

216
of economic sustainability and efficiency, small improvements in terminal logistics can have lasting impacts on financial bottom lines.
Given the above three factors, it is no surprise that upon reviewing our audit template, the inland port operators consulted by KTC were universally in favor of implementing more features that assessed economic sustainability. This is not to say that environmental and social concerns have been given diminished weight within the KTC Audit Template for Inland Port Sustainability. It simply means that a synergy between those concerns and economic development has become a focal point of the tool. In the Twentieth Century, the main emphasis of port policy was almost universally on economic development. The core tasks of the port industry were to organize the varied and constantly expanding flow of goods as efficiently as possible, while assuring a high level of stable, skilled employment. This core task has not changed, but social and environmental concerns have become significantly more important during the last few decades.
Competitive advantage is no longer limited to the economic sphere; increasingly it is sought in a wider social and environmental context. Ports such as the Port of Owensboro and the Weirton Area Port Authority are convinced of this. Similarly, it is difficult (if not impossible) to find a coastal port that would disagree. Based upon the recent successes of these ports, this research project has found that further economic development of the inland port industry needs to be accompanied with a clear sustainable policy ‐ maintaining a balance between economy, people and environment (people, profit and planet). A port authority can enhance this balance.
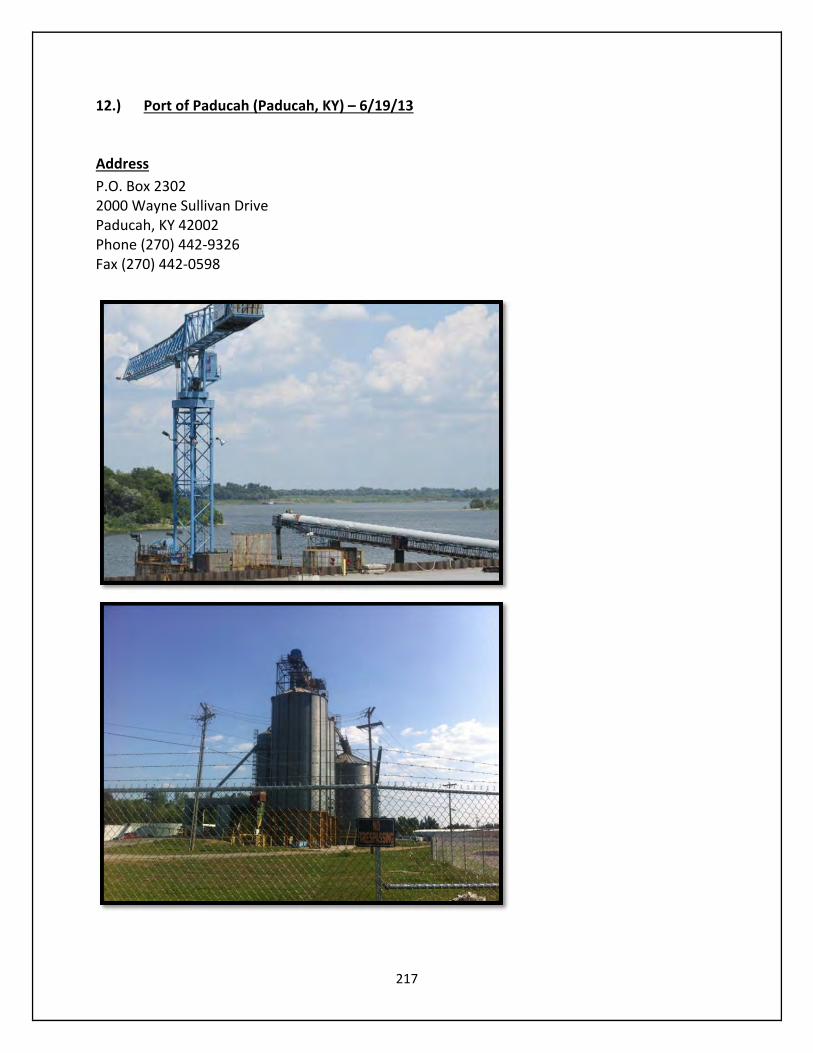
217
12.) Port of Paducah (Paducah, KY) – 6/19/13
Address
P.O. Box 2302 2000 Wayne Sullivan Drive Paducah, KY 42002 Phone (270) 442‐9326 Fax (270) 442‐0598

218
Port Website
http://www.paducahriverport.org/
Summary
The team met with Mr. Canter at his office on July 16th, 2013 to discuss port‐related sustainability measures in‐depth. This was the research team’s second visit to Paducah McCracken County Public River Port. Our discussion provided the opportunity to introduce Mr. Canter to the first draft of the sustainability audit template, and solicit his feedback.
Principles
Ken Canter – Director, Paducah‐McCraken County Riverport Authority
Particulars
Many of the topics covered during our first visit to Paducah were revisited. These topics include Container on Barge services, and the necessary upgrades to accommodate such services, in addition to the advantages of operator and landlord ports, the foreign trade zone status. Of interest was the topic of the crane with the capacity to provide container on barge service.
Crane Unveiling of 2013
The Port of Paducah will begin operations of its new Container‐on‐Barge ready crane in November of 2013. KTC has been invited to attend the ribbon cutting ceremony. Following on from our visit to Paducah, Mr. Canter provided insight and feedback on the development of the Sustainability Audit Template.
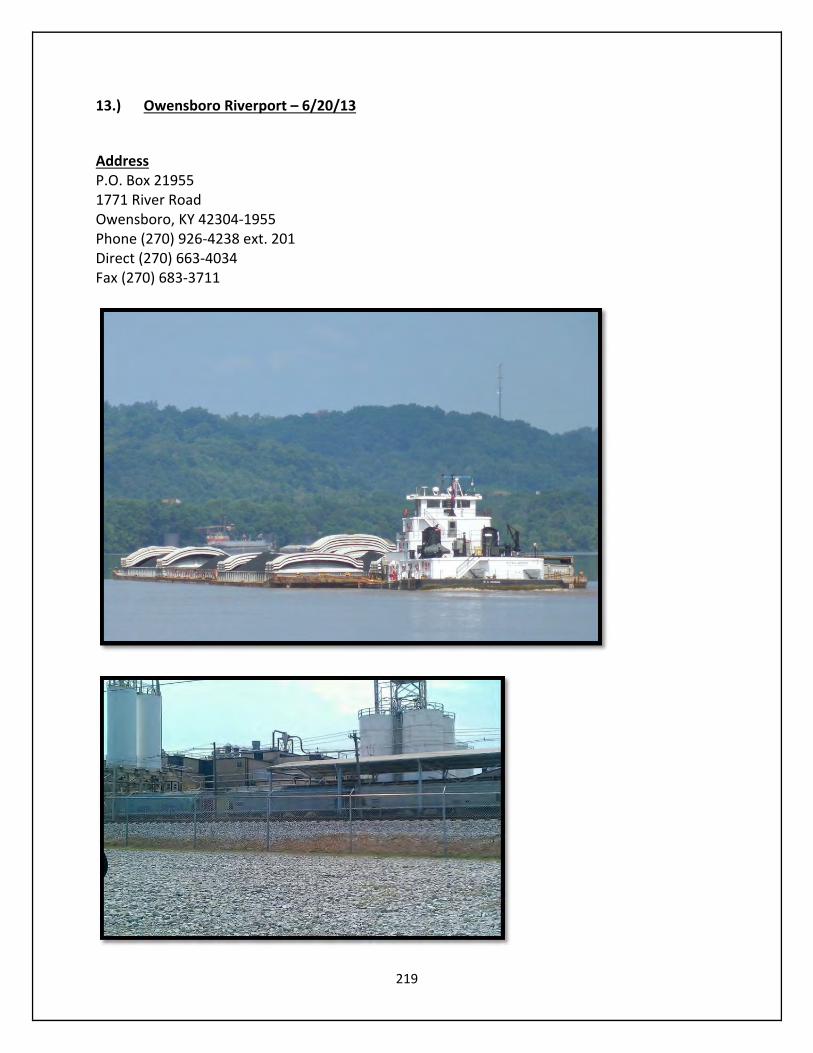
219
13.) Owensboro Riverport – 6/20/13
Address P.O. Box 21955 1771 River Road Owensboro, KY 42304‐1955 Phone (270) 926‐4238 ext. 201 Direct (270) 663‐4034 Fax (270) 683‐3711

220
Port Website www.OwensboroRiverport.com
Summary
On July 20th, 2013 the research team from the Kentucky Transportation Center met with Mr. Ed Riney, who is president of the Owensboro Riverport. Three main points of discussion developed during the meeting. First, the Port of Owensboro has become the largest public riverport in the state of Kentucky. Mr. Riney attributes this directly to the port being operated like a private business. A trait that, in Mr. Riney’s opinion, is not universal among public riverports in Kentucky. Second, the discussion countered the optimism regarding the future of container on barge expressed by officials in Paducah. Contrary to the viewpoint provided by Mr. Canter in Paducah, Mr. Riney was skeptical that container on barge movements will account for a significant portion of traffic along the inland waterway system in the immediate future.
Principles
Ed Riney –President / CEO, Owensboro Riverport
Particulars
Meeting with Ed Riney, CEO of Owensboro Riverport.
Tour of port facility and warehousing services.
The Importance of Running a Port like a Business
Mr. Riney was brought into the CEO position at the Owensboro Riverport, after a long and successful career as a business man in areas unrelated to the port industry. His career had, up until his tenure with the riverport, not overlapped with transportation. What Mr. Riney brought the Owensboro Riverport, is a private business mentality that has improved the financial bottom line tremendously.
Since the inland port industry is dealing with tight financial constraints, Mr. Riney’s business acumen was a key aspect that KTC sought to draw insight from. To this end, we asked Mr. Riney to discuss with us why he believed the Owensboro Riverport had become the most financially successful inland port in Kentucky. It was his belief that this is due to operating the port like a private business. Most public inland ports are operated as public government entities, with the goal being to serve a function ‐ as opposed to turning a profit. As a result, often public river ports rely upon government funding to offset financial shortfalls. The Owensboro Riverport operates under the assumption that this is unacceptable, and actually pays dividends back to the local government from their profits.

221
The Competitive Advantage of Port Sustainability
Mr. Riney was particularly interested in discussing the potential for sustainability to become a talking point for the inland port industry and the inland waterway industry. According to Mr. Riney, this is an aspect of inland waterway transportation that is not widely marketed to potential customers, especially considering that transportation along inland waterways is the most economically, socially, and environmentally sustainable method of transportation available. Mr. Riney discussed the Owensboro Riverport’s recent efforts to create marketing materials that will be sent to stakeholders demonstrating these facts.
The Importance of Inter‐Port Cooperation & the Indiana Port System
An additional point of conversation with Mr. Riney was the importance of developing and fostering a more cooperative relationship among inland ports in Kentucky (similar to the system in place regarding the state of Indiana). Mr. Riney was quick to add that the Kentucky Association of Riverports has aided tremendously in this regard recently.
Largest Public Riverport in KY & Public Dividends
The Owensboro Riverport is the largest inland port in Kentucky concerning volume. It is also the most profitable. During our discussion with Mr. Riney about this point, we discussed the importance that the KTC’s sustainability audit template includes a section on economic performance, and whether a port receives public funding or pays back a dividend to the state or local government.
Lack of Container on Barge Optimism
Mr. Riney was less than optimistic about the future potential for container on barge transportation along the inland waterways system. This was due, primarily, to his view that the Panama Canal expansion would logistically change very little in terms of container traffic across the U.S. He believes that there are currently far more pressing concerns for the inland port industry than container on barge.
Tour of Facilities
The KTC research team received a personal tour of the port operations and facilities from Mr. Riney. The excursion included a tour of the warehousing facilities, port terminal, administrative offices, and multimodal facilities.
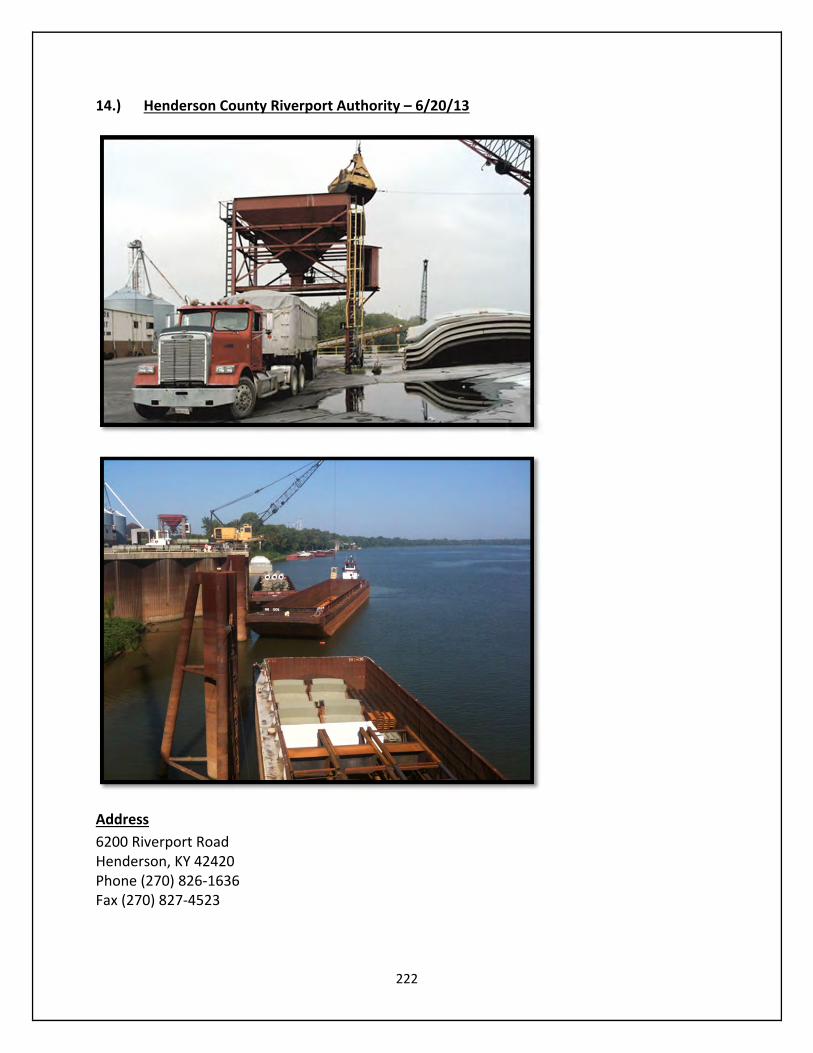
222
14.) Henderson County Riverport Authority – 6/20/13
Address
6200 Riverport Road Henderson, KY 42420 Phone (270) 826‐1636 Fax (270) 827‐4523
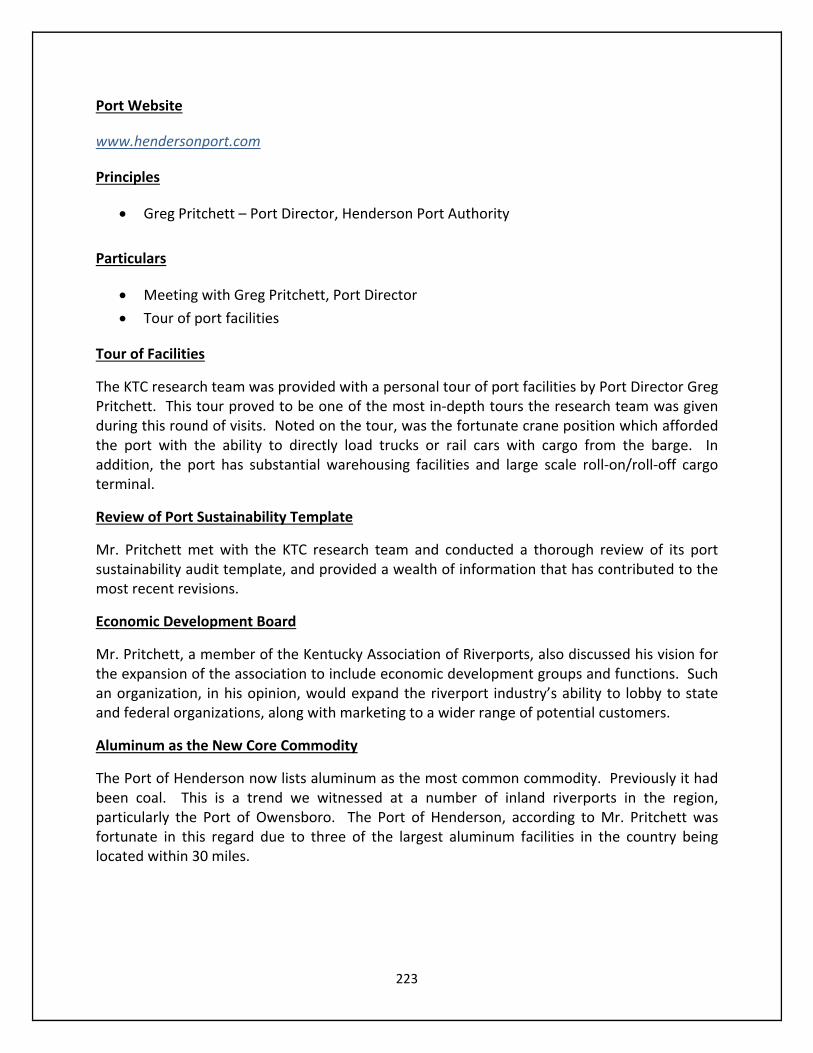
223
Port Website
www.hendersonport.com
Principles
Greg Pritchett – Port Director, Henderson Port Authority
Particulars
Meeting with Greg Pritchett, Port Director
Tour of port facilities
Tour of Facilities
The KTC research team was provided with a personal tour of port facilities by Port Director Greg Pritchett. This tour proved to be one of the most in‐depth tours the research team was given during this round of visits. Noted on the tour, was the fortunate crane position which afforded the port with the ability to directly load trucks or rail cars with cargo from the barge. In addition, the port has substantial warehousing facilities and large scale roll‐on/roll‐off cargo terminal.
Review of Port Sustainability Template
Mr. Pritchett met with the KTC research team and conducted a thorough review of its port sustainability audit template, and provided a wealth of information that has contributed to the most recent revisions.
Economic Development Board
Mr. Pritchett, a member of the Kentucky Association of Riverports, also discussed his vision for the expansion of the association to include economic development groups and functions. Such an organization, in his opinion, would expand the riverport industry’s ability to lobby to state and federal organizations, along with marketing to a wider range of potential customers.
Aluminum as the New Core Commodity
The Port of Henderson now lists aluminum as the most common commodity. Previously it had been coal. This is a trend we witnessed at a number of inland riverports in the region, particularly the Port of Owensboro. The Port of Henderson, according to Mr. Pritchett was fortunate in this regard due to three of the largest aluminum facilities in the country being located within 30 miles.
224
Other Major Commodities for the Port of Henderson
1. Bulk fertilizers
2. Zinc and other metals from Mexico and Canada
3. Graphite from petroleum coke
4. Coal
Optimism for Container on Barge
Like many of the port operators visited by the KTC, Mr. Pritchett is optimistic about the future on container on barge for the ports of Kentucky. Although, it should be noted that due to location, Mr. Pritchett does not foresee the Port of Henderson becoming involved in that aspect of the industry. Mr. Pritchett envisions container on barge being viable for the ports of Paducah and Hickman ‐ due to their location further west and near the Mississippi River. This could also work, perhaps, for ports in metropolitan areas such as the Port of Louisville.
15.) Louisville – Jefferson Riverport International – 6/27/13
Address
P.O. Box 58010 6900 Riverport Drive Louisville, KY 40258 Phone (502) 935‐6024 Fax (502) 935‐6050
225
Port Website
www.jeffersonriverport.com
Principles:
Larry McFall – President Louisville‐Jefferson Riverport International
Joe Teagart – Operator, Louisville Riverport Terminal
Particulars
Meeting with Larry McFall and Joe Teagart.
Tour of port facility and business park.
Financial Sustainability
The Port of Louisville has adopted the business model of becoming economic development groups in addition to the more traditional role as intermodal facility. In addition, the port has also established itself as a Foreign Trade Zone.

226
Foreign Trade Zone
A Foreign Trade Zone (FTZ) is a geographical area, in (or adjacent to) a United States port of entry. This is where commercial merchandise, both domestic and foreign receive the same treatment from customs, if it were outside the commerce of the United States. In other words, merchandise of every description may be held in a FTZ without being subject to customs and other ad valorem taxes. This tariff and tax relief is designed to lower the costs of U.S. based operations engaged in international trade, and thereby create and retain the employment and capital investment opportunities that result from those operations. This affords ports that have attained the designation significant economic benefits and enhanced financial sustainability. The Port of Louisville views this distinction as crucial to their success. Efficient Intermodal Terminals
The movement at some inland ports to create more efficient intermodal terminals is fairly common. The Port of Louisville discussed with us their ongoing efforts to upgrade and manipulate their intermodal terminal to improve efficiency.
16.) Port of Greenup‐Boyd County – 7/8/13
Address
2800 Louisa Street P.O. Box 423 Catlettsburg, KY 41129

227
Port Website
http://www.kentuckyriverports.com/
Principles
Nickie Smith – Boyd County Fiscal Court
Particulars
Meeting with Nickie Smith
Tour of port facility and business park
Absence of a Dedicated Port Director/Operator
The Port of Greenup‐Boyd County differs from its cohorts along the Ohio River, in that it does not employ a dedicated port operator. Instead, the port is directed by the Boyd County Fiscal Court Executive (Nickie Smith).
Strengths of the Port
The ports location offers excellent highway connections. Further development of port facilities is supported by four separate counties, and rail service to the port is well established.

228
Services Provided by the Port
Barge discharge to truck, ability to handle break bulk and granular commodities, truck to storage facilities, and rail service to industries on site are services provided.
Sustainability Pressure from the Surrounding Region
The port has recently experienced pressure from the surrounding region to improve its sustainability performance. As a result, the port has begun to make small changes to infrastructure and operations. The port has not, however, conducted a self‐assessment or created a dedicated sustainability officer.
Site Infrastructure
The Greenup‐Boyd County Riverport Authority owns 14 developed acres at the present site, plus 15 undeveloped acres downstream from the current site. This equates to a total of 29 acres with 1,120 feet of river frontage. In addition to this acreage, the counties of Greenup and Boyd jointly own 20 acres. Greenup County owns an additional 15 acres, all of which are in the immediate vicinity of the operating port facilities.
Permit Restriction on Coal
The port and county‐owned acreage at the site has a permit operating restriction stating that no coal (or coal derivative commodity) can be handled on the site.
On‐site Industries
Industries that own land within the industrial park at the port site include: Vesuvius USA, Great Lakes Minerals, General Concrete and Appalachian Fuels. An additional 90 acres of undeveloped land is located immediately upstream from the port site, and is privately owned.
Future Potential without Coal Restrictions
Greenup‐Boyd also owns an additional 15 acres of undeveloped land downstream from the existing site. This property was purchased to allow for a second operating location in the future, without coal‐related restrictions.

229
17.) Columbiana County Port Authority / Wellsville Intermodal Facility – 7/9/13
Port Website
http://www.ccpa‐ohioriver.com/

230
Principles
Tracy Drake – President / CEO, Columbiana County Port Authority
Larry Heck – Port Operator, Wellsville Intermodal Facility
Particulars
Meeting with Tracy Drake, at Columbiana Port Authority Central Office.
Meeting with Larry Heck at Wellsville Intermodal Facility.
Tour of Wellsville Intermodal Facility.
Shale Oil / Natural Gas Boom for Northern Inland Ports
Of primary interest from the visit to the Columbiana County Port Authority is a distinction that appears to be developing between ports slightly north of Kentucky, and Kentucky ports. This distinction relates to the future use of the ports in the transportation of shale oil and materials related to the industry. While this is setting up to be a huge boon for these more northern ports (and is a central topic of conversation), in Kentucky it has been a non‐issue. It is possible that some Kentucky ports could become more involved.
Investment in Locks and Dams Remains Paramount
Mr. Drake lamented the current state of disrepair regarding the lock and dam system along the inland waterways. Mr. Drake views the situation as by far the most important concern facing the inland waterway industries.
The Importance of Unifying Lobbying / Marketing Efforts
The port operator, Tracy Drake, also stressed the importance of bringing together port operators with economic development groups to form united coalitions ‐ to improve lobbying and awareness issues.
Pessimism toward Container on Barge
Like many inland port operators, Mr. Drake was very pessimistic about the potential for container on barge. However, he was quick to add that he had not looked into the matter much.
231
Background
The Columbiana County Port Authority was created in 1977 by the county commissioners. The initial base of operation was a 50 acre site on the Ohio River in East Liverpool which was purchased by the state and turned over to the Port Authority. Today, in addition to the base site in East Liverpool, the Columbiana County Port Authority owns and leases out three industrial plant complexes: three rail/truck cargo transfer facilities, a bank data operations center, a regional railroad, and a fiber optic network in Mahoning and Columbiana Counties. Additionally, the Columbiana County Port Authority owns and leases property in two industrial parks (the World Trade Park in Leetonia and the Intermodal Facility in Wellsville). The East Liverpool base site, the World Trade Park and the Intermodal Facility all are designated as FTZs. The Columbiana County Port Authority has two primary responsibilities, which are (1) facilitation of cargo movement on the Ohio River, and (2) promotion of economic development in Columbiana County.
Regional Advantages
Ohio’s inland river system provides access to the Gulf of Mexico via both the Mississippi River and the Tennessee Tombigbee Waterway. The Port of New Orleans in Louisiana serves the Mississippi. The Port of Mobile, Alabama serves the Tennessee Tombigbee Waterway. North America’s fastest growing trade partner is South America, which is on the “all water route.” The widening of the Panama Canal will open up the Gulf Coastal Ports, to Asian originated container traffic. The Cleveland‐Pittsburgh corridor is the fourth largest population market in the U.S. and the only major market geographically centered in the middle of five of the U.S.’s major population markets (plus those in Canada).
Intermodal Connections
Columbiana County is served by two class 1 rail lines (NS and CSX) and the Port Authority’s regional railroad (Youngstown and Southeastern). State Route 7 (which contains four lanes) and State Route 11 provide interstate access forty miles to the north (I‐76/80) and forty miles to the south (I‐70). The US 30 road provides a direct east‐west route to Pittsburgh and Canton. There are 11 cargo terminals on the Ohio River, including the Port Authority’s new state‐of‐the‐art Intermodal Facility (rail, truck and barge) located in Wellsville.
Site Facilities
The Columbiana County Port Authority includes several operations facilities, warehouses, and terminals. These include:
The Ferro Site – This area was formerly used for light manufacturing. The office area has 10 offices, lunch room, three restrooms, computer room, conference room, two storage rooms, lab, front entry, and two furnace rooms. The shop area has four restrooms, general shop area, machine shop, two rack storage areas, two computer rooms, maintenance area, two offices, warehouse, and a packing/shipping area.
232
Eljer Plant Facility – This is a 250,000 square foot facility. It has a high bay warehouse with multiple docks, along with 20 acres of vacant land, plus a building on 10 acres (rail served).
Wellsville Intermodal Facility / Pier 48 Stevedoring ‐ handles marine operations at the Wellsville Intermodal Facility under contract with the port authority, including a 60‐ton bridge crane.
World Trade Park – This is a 126 acre industrial park (former green field) high‐ground and semi‐rural location with scenic vistas (zoned industrial). It is “Full Environmental Compliance Designated Foreign Trade Zone #181.”
18.) Port of Weirton – 7/9/13

233
Port Website
http://wapainc.org/
Summary
The July 9th visit to the Port of Weirton was part of an effort to reach into the upper Ohio River basin. This visit was conducted along with sites visits to Wellsville, East Liverpool, and the Huntington port district. The Port of Weirton was particularly enthusiastic about the KTC research into port sustainability, and has provided a great deal of assistance to the project since our initial meeting. This enthusiasm likely emanates from the fact that over the last few years, the port has retained Parsons Brinckerhoff and Stevens Institute of Technology to conduct various sustainability studies.
During our meeting at Weirton, it was notable that the chairman of the port authority attended (among several others, including members of outside safety and sustainability consultant teams employed recently by the port). Having reviewed our research findings in advance of the meeting, the officials endorsed our findings and shared summaries of their initiatives. Of note here is that the Port of Weirton’s Resiliency report, compiled by themselves and the Stevens Institute, is thematically remarkably similar to the KTC’s Inland Port Sustainability Report.
The port representatives made several references to questions of jurisdiction, such as that arise in the case of "public‐private" port organizations in West Virginia. They were also very concerned with issues of safety and community relations, which are both well represented topics in our report. This is likely part of the reason they have been so eager to work with us.
Principles
MJ Johnson – Port Operator, Port of Weirton
BJ Deflice – Chairman, Weirton Area Port Authority
Karl Keffer – Executive Director, Port of Weirton
Particulars
Meeting with MJ Johnson, BJ Deflice and Karl Keffer at Port of Weirton Office Facility.
Tour of Port Facility.
Resiliency Report
The Weirton Area Port Authority (WAPA) was the only inland riverport visited to already have in place a similar study to the KTC’s Inland Port Sustainability Report. Commissioned in 2013, the WAPA “Port Resiliency Strategy Report” was compiled by the Steven Institute of Technology.
234
The report is a review of the impact of developing a port district at the WAPA site, and the repurposing of the area’s 20th century steel industry infrastructure to support this effort.
Potential for Shale Oil
The Steven Institute also analyzed the potential for transporting oil and gas from the Macellus and Utica fields to Weirton Port’s marine terminal. The material would then be sent out via rail and barge to processing destinations.
Economic Impact Study
The WAPA resiliency report also addressed the economic impact that the port could potentially have on the surrounding region.
Stevens Institute Findings
The report provides WAPA with the basis and understanding to develop its 5‐year projections, and anticipate alternatives should disruptions occur in the transportation flow. The report also indicates the following:
Capacity projections of the transportation hub are quickly maximized, and the economic potential of the Northern Panhandle region could be enhanced by transportation infrastructure improvements (road, rail, and waterways).
A realistic “Resiliency Plan” is critical, since a loss of any main transport route will quickly impact or debilitate the entire transportation flow. This would create critical supply chain fulfillment situations and major economic losses.
The port’s activities will contribute more than $150 million to the regional economy within the 5‐year projections, without any consideration that the area is in a boon oil/gas region. The activity could result in a higher economic contribution.
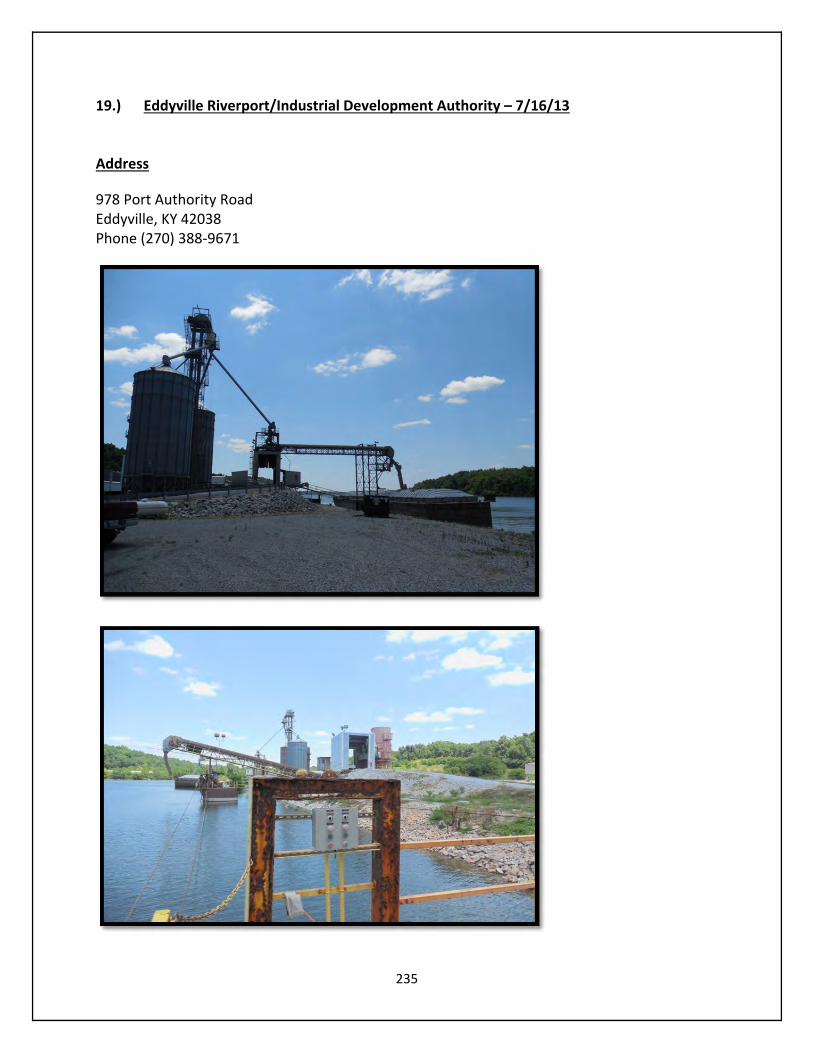
235
19.) Eddyville Riverport/Industrial Development Authority – 7/16/13
Address
978 Port Authority Road Eddyville, KY 42038 Phone (270) 388‐9671
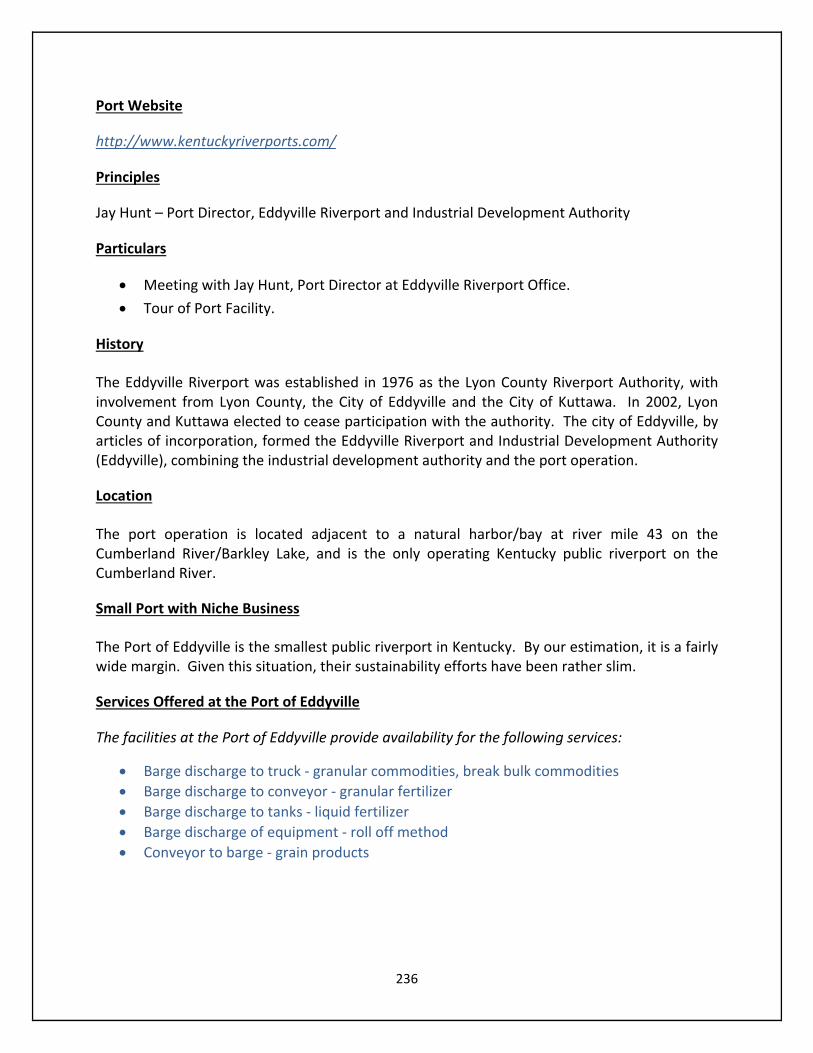
236
Port Website
http://www.kentuckyriverports.com/
Principles
Jay Hunt – Port Director, Eddyville Riverport and Industrial Development Authority
Particulars
Meeting with Jay Hunt, Port Director at Eddyville Riverport Office.
Tour of Port Facility.
History
The Eddyville Riverport was established in 1976 as the Lyon County Riverport Authority, with involvement from Lyon County, the City of Eddyville and the City of Kuttawa. In 2002, Lyon County and Kuttawa elected to cease participation with the authority. The city of Eddyville, by articles of incorporation, formed the Eddyville Riverport and Industrial Development Authority (Eddyville), combining the industrial development authority and the port operation.
Location
The port operation is located adjacent to a natural harbor/bay at river mile 43 on the Cumberland River/Barkley Lake, and is the only operating Kentucky public riverport on the Cumberland River.
Small Port with Niche Business
The Port of Eddyville is the smallest public riverport in Kentucky. By our estimation, it is a fairly wide margin. Given this situation, their sustainability efforts have been rather slim.
Services Offered at the Port of Eddyville
The facilities at the Port of Eddyville provide availability for the following services:
Barge discharge to truck ‐ granular commodities, break bulk commodities
Barge discharge to conveyor ‐ granular fertilizer
Barge discharge to tanks ‐ liquid fertilizer
Barge discharge of equipment ‐ roll off method
Conveyor to barge ‐ grain products
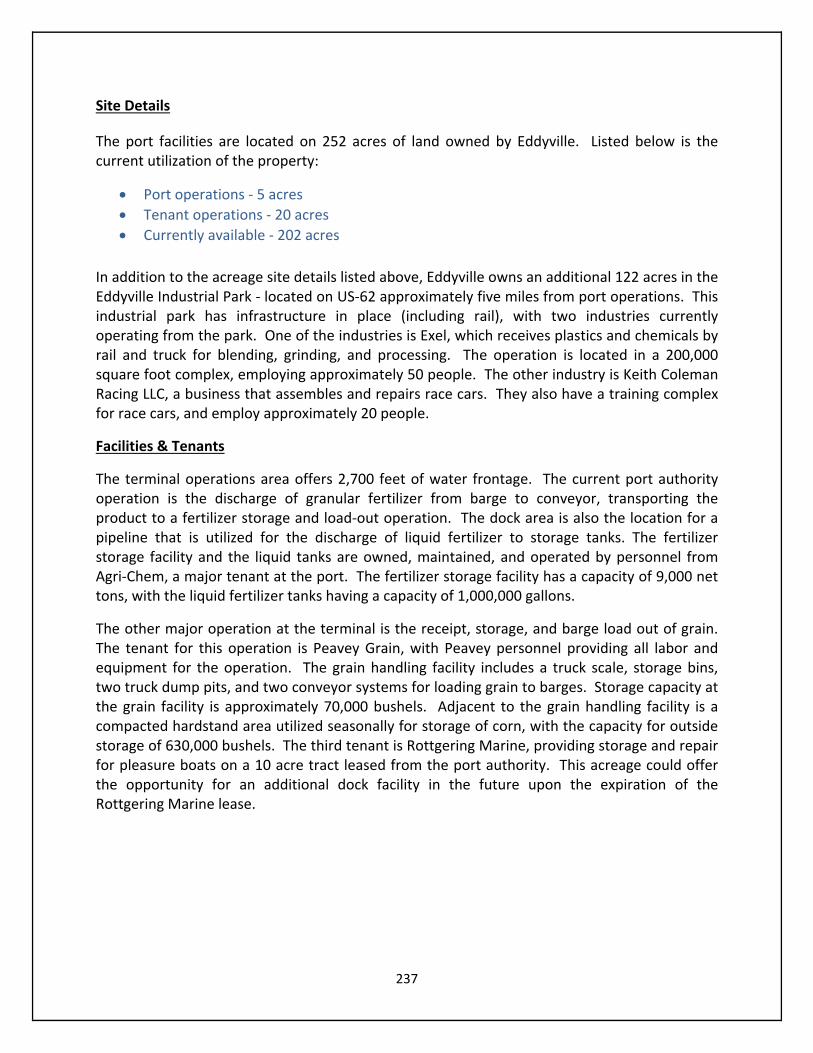
237
Site Details
The port facilities are located on 252 acres of land owned by Eddyville. Listed below is the current utilization of the property:
Port operations ‐ 5 acres
Tenant operations ‐ 20 acres
Currently available ‐ 202 acres
In addition to the acreage site details listed above, Eddyville owns an additional 122 acres in the Eddyville Industrial Park ‐ located on US‐62 approximately five miles from port operations. This industrial park has infrastructure in place (including rail), with two industries currently operating from the park. One of the industries is Exel, which receives plastics and chemicals by rail and truck for blending, grinding, and processing. The operation is located in a 200,000 square foot complex, employing approximately 50 people. The other industry is Keith Coleman Racing LLC, a business that assembles and repairs race cars. They also have a training complex for race cars, and employ approximately 20 people.
Facilities & Tenants
The terminal operations area offers 2,700 feet of water frontage. The current port authority operation is the discharge of granular fertilizer from barge to conveyor, transporting the product to a fertilizer storage and load‐out operation. The dock area is also the location for a pipeline that is utilized for the discharge of liquid fertilizer to storage tanks. The fertilizer storage facility and the liquid tanks are owned, maintained, and operated by personnel from Agri‐Chem, a major tenant at the port. The fertilizer storage facility has a capacity of 9,000 net tons, with the liquid fertilizer tanks having a capacity of 1,000,000 gallons.
The other major operation at the terminal is the receipt, storage, and barge load out of grain. The tenant for this operation is Peavey Grain, with Peavey personnel providing all labor and equipment for the operation. The grain handling facility includes a truck scale, storage bins, two truck dump pits, and two conveyor systems for loading grain to barges. Storage capacity at the grain facility is approximately 70,000 bushels. Adjacent to the grain handling facility is a compacted hardstand area utilized seasonally for storage of corn, with the capacity for outside storage of 630,000 bushels. The third tenant is Rottgering Marine, providing storage and repair for pleasure boats on a 10 acre tract leased from the port authority. This acreage could offer the opportunity for an additional dock facility in the future upon the expiration of the Rottgering Marine lease.
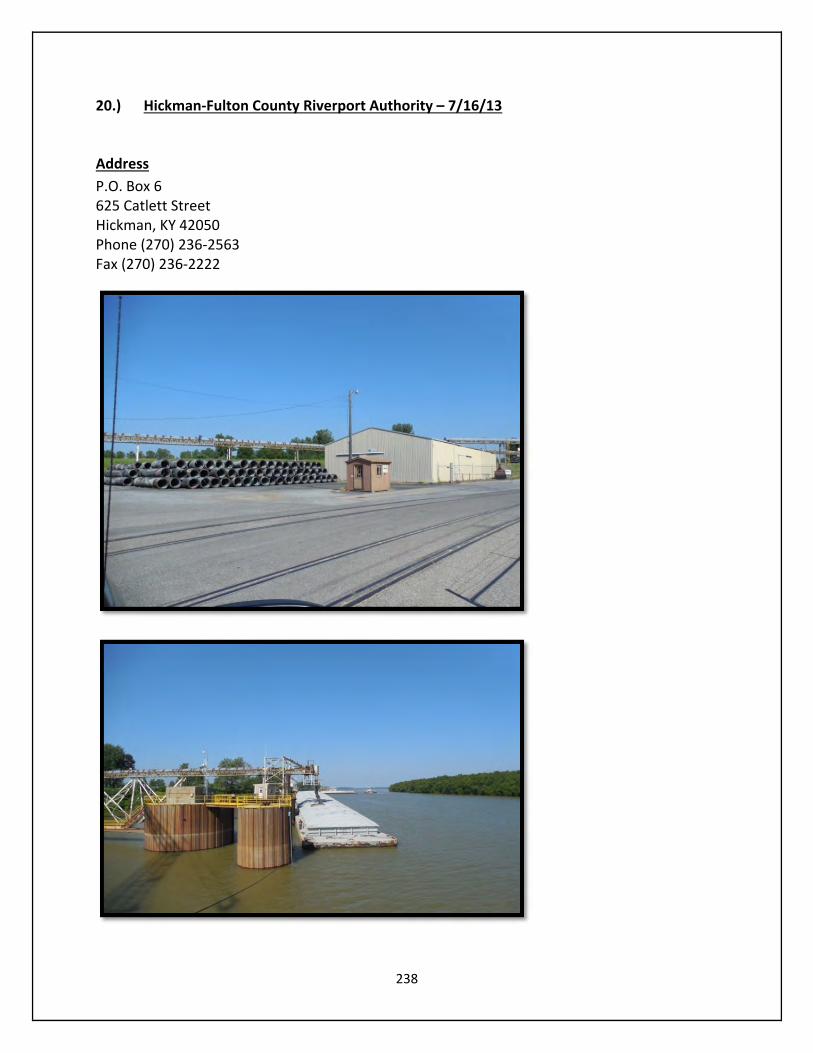
238
20.) Hickman‐Fulton County Riverport Authority – 7/16/13
Address
P.O. Box 6 625 Catlett Street Hickman, KY 42050 Phone (270) 236‐2563 Fax (270) 236‐2222
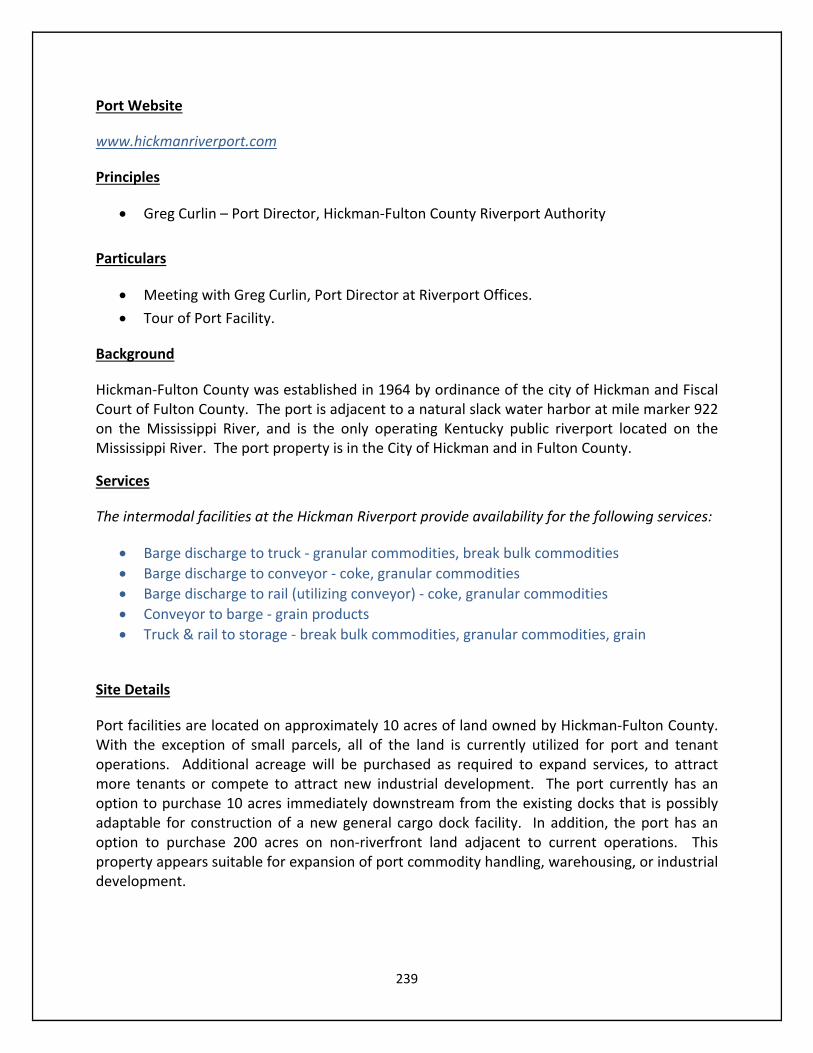
239
Port Website
www.hickmanriverport.com
Principles
Greg Curlin – Port Director, Hickman‐Fulton County Riverport Authority
Particulars
Meeting with Greg Curlin, Port Director at Riverport Offices.
Tour of Port Facility.
Background
Hickman‐Fulton County was established in 1964 by ordinance of the city of Hickman and Fiscal Court of Fulton County. The port is adjacent to a natural slack water harbor at mile marker 922 on the Mississippi River, and is the only operating Kentucky public riverport located on the Mississippi River. The port property is in the City of Hickman and in Fulton County.
Services
The intermodal facilities at the Hickman Riverport provide availability for the following services:
Barge discharge to truck ‐ granular commodities, break bulk commodities
Barge discharge to conveyor ‐ coke, granular commodities
Barge discharge to rail (utilizing conveyor) ‐ coke, granular commodities
Conveyor to barge ‐ grain products
Truck & rail to storage ‐ break bulk commodities, granular commodities, grain
Site Details
Port facilities are located on approximately 10 acres of land owned by Hickman‐Fulton County. With the exception of small parcels, all of the land is currently utilized for port and tenant operations. Additional acreage will be purchased as required to expand services, to attract more tenants or compete to attract new industrial development. The port currently has an option to purchase 10 acres immediately downstream from the existing docks that is possibly adaptable for construction of a new general cargo dock facility. In addition, the port has an option to purchase 200 acres on non‐riverfront land adjacent to current operations. This property appears suitable for expansion of port commodity handling, warehousing, or industrial development.
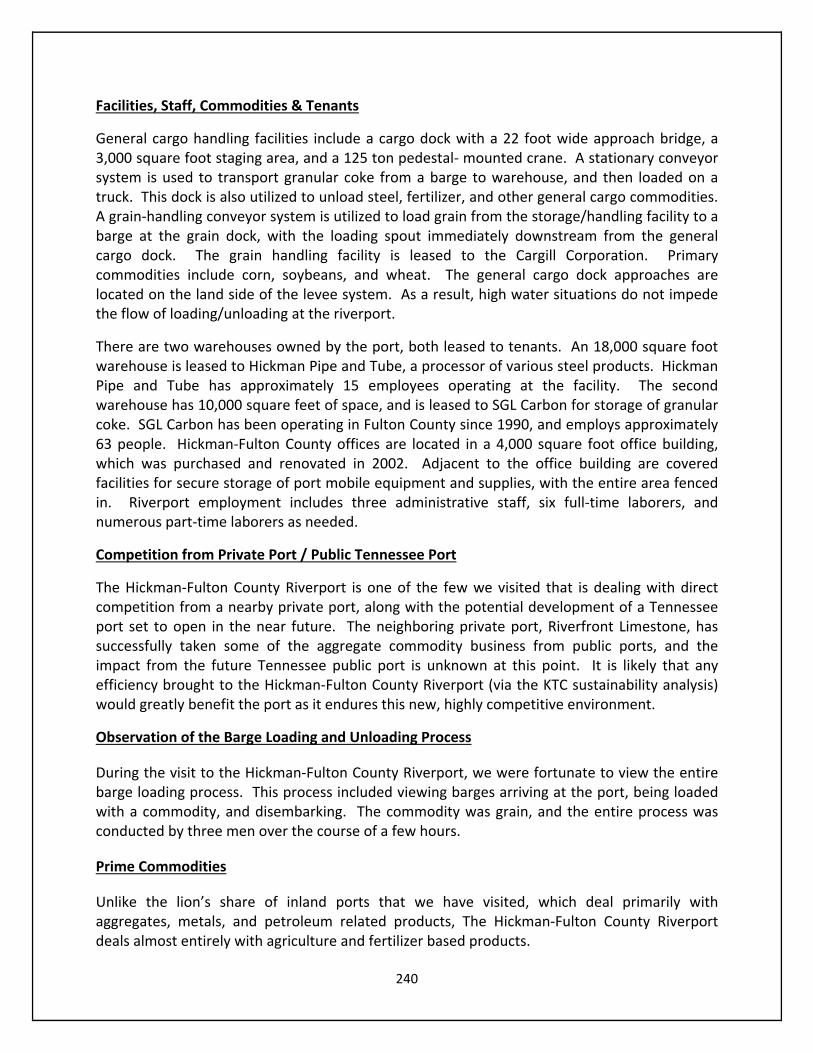
240
Facilities, Staff, Commodities & Tenants
General cargo handling facilities include a cargo dock with a 22 foot wide approach bridge, a 3,000 square foot staging area, and a 125 ton pedestal‐ mounted crane. A stationary conveyor system is used to transport granular coke from a barge to warehouse, and then loaded on a truck. This dock is also utilized to unload steel, fertilizer, and other general cargo commodities. A grain‐handling conveyor system is utilized to load grain from the storage/handling facility to a barge at the grain dock, with the loading spout immediately downstream from the general cargo dock. The grain handling facility is leased to the Cargill Corporation. Primary commodities include corn, soybeans, and wheat. The general cargo dock approaches are located on the land side of the levee system. As a result, high water situations do not impede the flow of loading/unloading at the riverport.
There are two warehouses owned by the port, both leased to tenants. An 18,000 square foot warehouse is leased to Hickman Pipe and Tube, a processor of various steel products. Hickman Pipe and Tube has approximately 15 employees operating at the facility. The second warehouse has 10,000 square feet of space, and is leased to SGL Carbon for storage of granular coke. SGL Carbon has been operating in Fulton County since 1990, and employs approximately 63 people. Hickman‐Fulton County offices are located in a 4,000 square foot office building, which was purchased and renovated in 2002. Adjacent to the office building are covered facilities for secure storage of port mobile equipment and supplies, with the entire area fenced in. Riverport employment includes three administrative staff, six full‐time laborers, and numerous part‐time laborers as needed.
Competition from Private Port / Public Tennessee Port
The Hickman‐Fulton County Riverport is one of the few we visited that is dealing with direct competition from a nearby private port, along with the potential development of a Tennessee port set to open in the near future. The neighboring private port, Riverfront Limestone, has successfully taken some of the aggregate commodity business from public ports, and the impact from the future Tennessee public port is unknown at this point. It is likely that any efficiency brought to the Hickman‐Fulton County Riverport (via the KTC sustainability analysis) would greatly benefit the port as it endures this new, highly competitive environment.
Observation of the Barge Loading and Unloading Process
During the visit to the Hickman‐Fulton County Riverport, we were fortunate to view the entire barge loading process. This process included viewing barges arriving at the port, being loaded with a commodity, and disembarking. The commodity was grain, and the entire process was conducted by three men over the course of a few hours.
Prime Commodities
Unlike the lion’s share of inland ports that we have visited, which deal primarily with aggregates, metals, and petroleum related products, The Hickman‐Fulton County Riverport deals almost entirely with agriculture and fertilizer based products.
241
21.) Port of Greater Cincinnati Development Authority – 7/24/13
Address
299 East Sixth Street, Suite 2A Cincinnati, Ohio 45202 Tel: 513.621.3000 Fax: 513.621.1080
Port Website
http://www.cincinnatiport.org/
Principles
Melissa Johnson ‐ Director of Transportation & Logistics, Port of Greater Cincinnati Development Authority
Particulars
Meeting with Melissa Johnson, at the Port of Greater Cincinnati Development Authority.
242
Efforts to Develop a Larger Port District
The port authority is currently seeking to expand its district to include as far north as Madison, Indiana and Portsmouth, Ohio ‐ and as far south as Greenup and Boyd Counties in Kentucky. The goal is similar to the strategy employed at the Port of Huntington, which is currently now the largest inland port in America. Ms. Johnson pointed to the success in Huntington, as well as the eminent expansion of the Panama Canal as reasons for seeking expansion.
Economic Development as a Primary Focus
While many of the inland ports visited by KTC are in the process of getting into the economic development game, the Port of Cincinnati has been there for some time. In fact, the port is now more of an economic development group than a terminal operator. This fact can be seen clearly in the title (Port of Greater Cincinnati Development Authority). Since 2000, the port authority has issued more than $700 million in revenue bonds to fund a wide variety of economic projects in Cincinnati and Hamilton County. The designation as a port authority provides the Port of Cincinnati with innovative financing options that they can tailor to the needs of a project and development entity. With strong public finance and policy practice, the port authority has broad development‐related powers under state law, including the ability to issue tax‐exempt bonds. The public finance team at the port authority can serve as the central point of contact, investigating and procuring local/state/federal business‐retention and expansion incentives, and has access to grant funding.

243
This page left intentionally blank.
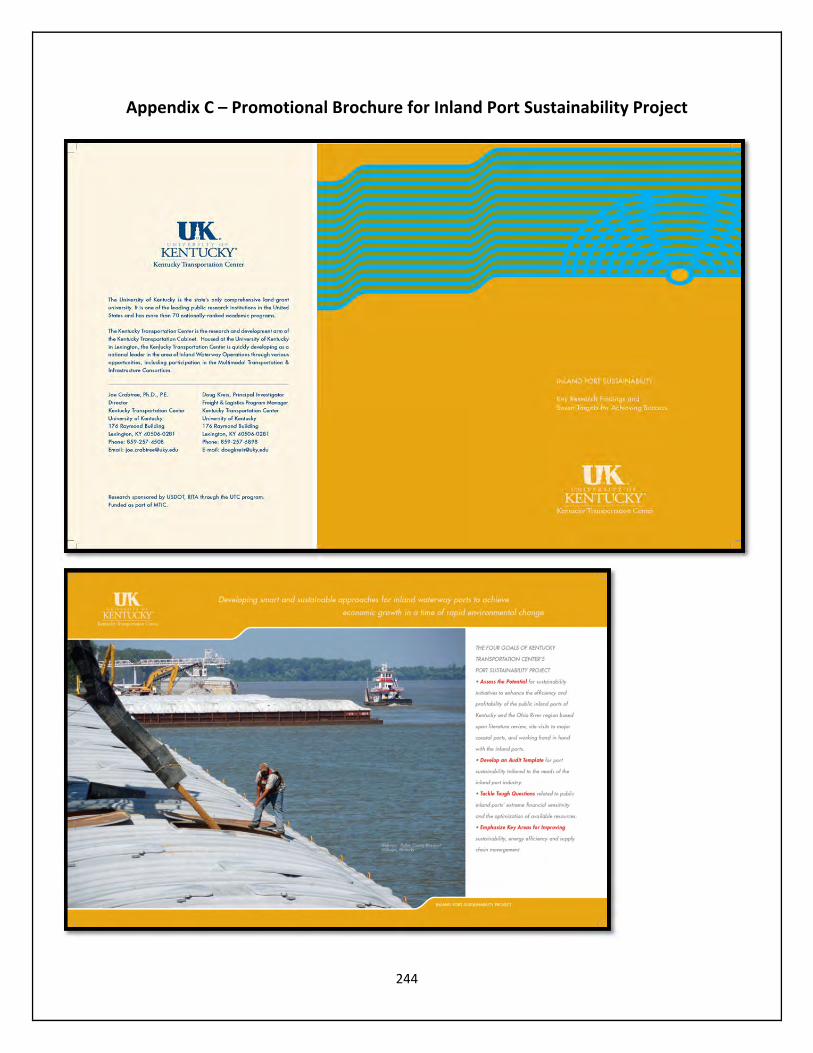
244
Appendix C – Promotional Brochure for Inland Port Sustainability Project
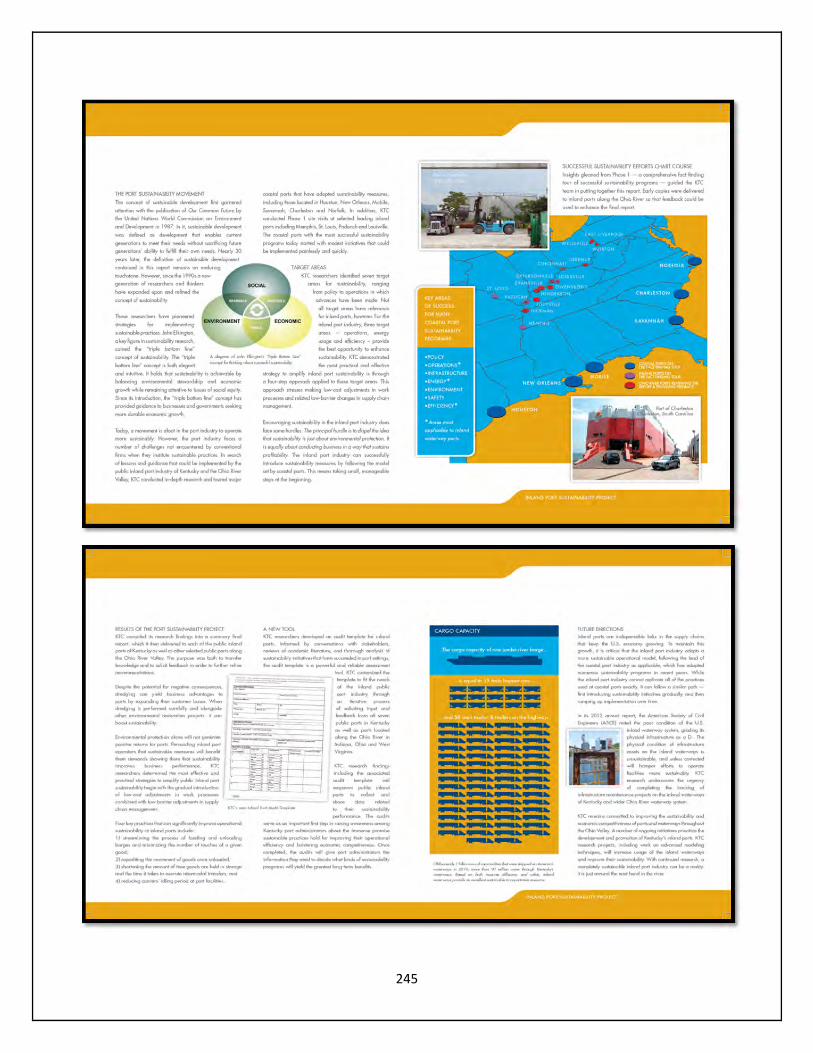
245

246
This page left intentionally blank.
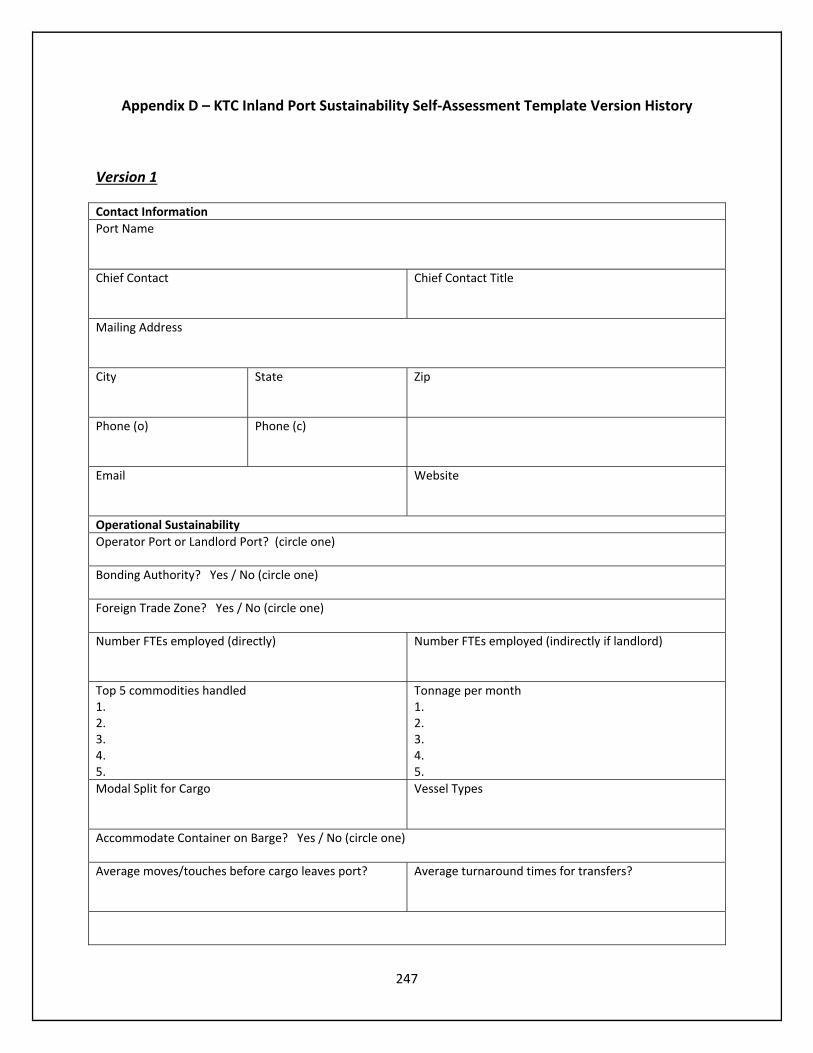
247
Appendix D – KTC Inland Port Sustainability Self‐Assessment Template Version History
Version 1
Contact Information
Port Name
Chief Contact
Chief Contact Title
Mailing Address
City
State
Zip
Phone (o)
Phone (c)
Website
Operational Sustainability
Operator Port or Landlord Port? (circle one)
Bonding Authority? Yes / No (circle one)
Foreign Trade Zone? Yes / No (circle one)
Number FTEs employed (directly) Number FTEs employed (indirectly if landlord)
Top 5 commodities handled 1. 2. 3. 4. 5.
Tonnage per month1. 2. 3. 4. 5.
Modal Split for Cargo
Vessel Types
Accommodate Container on Barge? Yes / No (circle one)
Average moves/touches before cargo leaves port?
Average turnaround times for transfers?
248
Operational Sustainability (continued)
Number and types of vessels?
Number and types of truck tractors?
Number of gantry cranes?
Number of rubber‐tyred gantry cranes? Power source of RTGs?
Acres of impermeable surface? Acres of permeable or semi‐permeable surface?
Management Systems
Describe your sustainability office, or any individual designated to engage environmental issues (even if informal interest).
Do you compile a sustainability report? (If yes, please attach a copy.)
Describe your port’s environmental management systems to reduce, reuse, or recycle energy, water, or waste.
Air Quality
Describe use of ultralow sulfur diesel, biodiesel, compressed natural gas, or other cleaner burning fuel.
Describe efforts to measure and/or target CO2 or other airborne emissions.
When replacing powered equipment, describe efforts to seek out and acquire efficient models that save fuel and minimize emissions.
Describe efforts to ‘repower’ vehicles and vessels by swapping old engines for more efficient and cleaner‐running new ones.
249
Describe efforts to retrofit older vehicles and vessels with emissions controls and after‐treatments in order to reduce exhaust emissions.
Describe process or infrastructure changes that have reduced engine idling times.
Describe use of public roadways during loading, unloading and marshaling of trucks.
Do you provide shore power to vessels?
Water Conservation
Monthly water consumption?
Describe any processes or practices for managing storm water run‐off.
Describe systems for the reuse of gray water.
Describe procedures for recycling or disposing of wastewater discharged by vessels.
Energy Conservation
Conducted energy audit? (If yes, please attach a copy)
Monthly electricity consumption? Electricity rate per Kw?
Monthly hot water consumption? Hot water heat source?
Describe use of renewable energy (e.g. solar, wind).
Describe any purchase of green energy.
Number of outdoor light stanchions?
Number of bulbs per stanchion?
Type of bulbs in stanchions? Wattage of bulbs in stanchions?

250
Energy Conservation (continued)
Describe use of LED lighting.
Describe use of automated lighting.
Solid Waste Reduction, Recycling and Disposal
Describe procedures for recycling office waste.
Describe procedure for recycling waste produced in operations or tenant operations.
Describe procedures for recycling dredge material.
Describe procedures for recycling material generated by vessels.
Noise Abatement
Describe procedures or practices to monitor and manage noise produced by the port.
Light Pollution Control
Describe any procedures to control or reduce light pollution generated by the port.
Supply Chain Sustainability
Describe any sustainability‐related measures used to qualify or discount suppliers, contractors, shippers, or carriers.
251
Community Engagement
Describe your community outreach initiatives.
Describe onsite facilities for community recreation and/or education.
Describe your website, and use of social media.
Describe tire rinsing stations or other efforts at dust suppression for reducing impacts on local communities.
Construction (New and Retrofit)
Describe any facilities or buildings that have incorporated LEED design features.
Describe energy efficiency initiatives – retrofits and new construction.
Describe efforts to reduce water runoff.

252
Natural Resource Management and Restoration
Describe efforts to protect or restore wetlands or shorelines.
Describe efforts to protect endangered and threatened species.
Describe efforts to control the spread of invasive species (e.g. quarantining bilge water).
Final Thoughts
Describe any sustainability initiatives you have considered but not implemented and explain your reasoning.

253
Version 2
Contact Information
Port Name
Chief Contact
Chief Contact Title
Mailing Address
City
State
Zip
Phone (o)
Phone (c)
Website
Operational Model
Operator Port or Landlord Port? (circle one)
Bonding Authority? Yes / No (circle one)
Foreign Trade Zone? Yes / No (circle one)
Number full time equivalent employees (direct)
Number full time equivalent employees (indirect)
Operational Profile
Top 5 Commodities Inbound Outbound Turnaround Times (avg.)
Annual Tonnage
1. Truck ______% Barge ______% RR ______%
Truck ______%Barge ______% RR ______%
2. Truck ______% Barge ______% RR ______%
Truck ______%Barge ______% RR ______%
3. Truck ______% Barge ______% RR ______%
Truck ______%Barge ______% RR ______%
4. Truck ______% Barge ______% RR ______%
Truck ______%Barge ______% RR ______%
5. Truck ______% Barge ______% RR ______%
Truck ______%Barge ______% RR ______%

254
Operational Profile (continued)
Type and capacity of forklifts you lease or own?Forklift 1: ______________ Forklift 3: ______________ Forklift 2: ______________ Forklift 4: ______________
Type and capacity of cranes you lease or own?Crane 1: ______________ Crane 3: ______________ Crane 2: ______________ Crane 4: ______________
Acres of outside paved storage?
Acres of permeable or semi‐permeable surface?
Average moves/touches before cargo leaves port?
Do you have a crane to accommodate Container on Barge? Yes / No (circle one)
Environmental Regulation / Policy
Describe any air quality permits.
Describe any storm water discharge permits.
Describe any brownfield‐related permits.
Air Quality
Check box to indicate fuel type. Crane 1: ___ diesel ___ electric ___ other (specify: ) Crane 2: ___ diesel ___ electric ___ other (specify: ) Crane 3: ___ diesel ___ electric ___ other (specify: ) Crane 4: ___ diesel ___ electric ___ other (specify: ) Forklift 1: ___ diesel ___ electric ___ propane ___ other (specify: ) Forklift 2: ___ diesel ___ electric ___ propane ___ other (specify: ) Forklift 3: ___ diesel ___ electric ___ propane ___ other (specify: ) Forklift 4: ___ diesel ___ electric ___ propane ___ other (specify: )
Describe efforts to minimize dust. (e.g. related to roads, conveyors, vehicle washing)
Describe process or infrastructure changes that have reduced engine idling times.
Do towboats have access to shore power?
255
Water Conservation
How is water being used at facility? (e.g. domestic, dust suppression, manufacturing)
Describe any processes or practices for managing storm water run‐off.
Describe systems for the reuse of gray water.
Describe procedures for recycling or disposing of wastewater discharged by barges or towboats.
Energy Conservation
Conducted energy audit?
Monthly electricity consumption? Highest – Lowest –
Electricity rate per Kw?
Describe use of renewable energy (e.g. solar, wind).
Number of outdoor light stanchions?
Number of bulbs per stanchion?
Type of bulbs in stanchions?
Wattage of bulbs in stanchions?
Describe use of automated lighting. If you use photo‐sensors, do lights burn all night long?
Describe use of LED lighting.
Solid Waste Reduction, Recycling and Disposal
Describe procedures for recycling dredge material.
Describe procedures for recycling material generated by barges. (e.g. pallets)
Describe procedures for recycling office waste.
Noise Abatement
What is the distance between your port and the nearest residential neighborhood?
Describe procedures or practices to monitor and manage noise produced by the port.
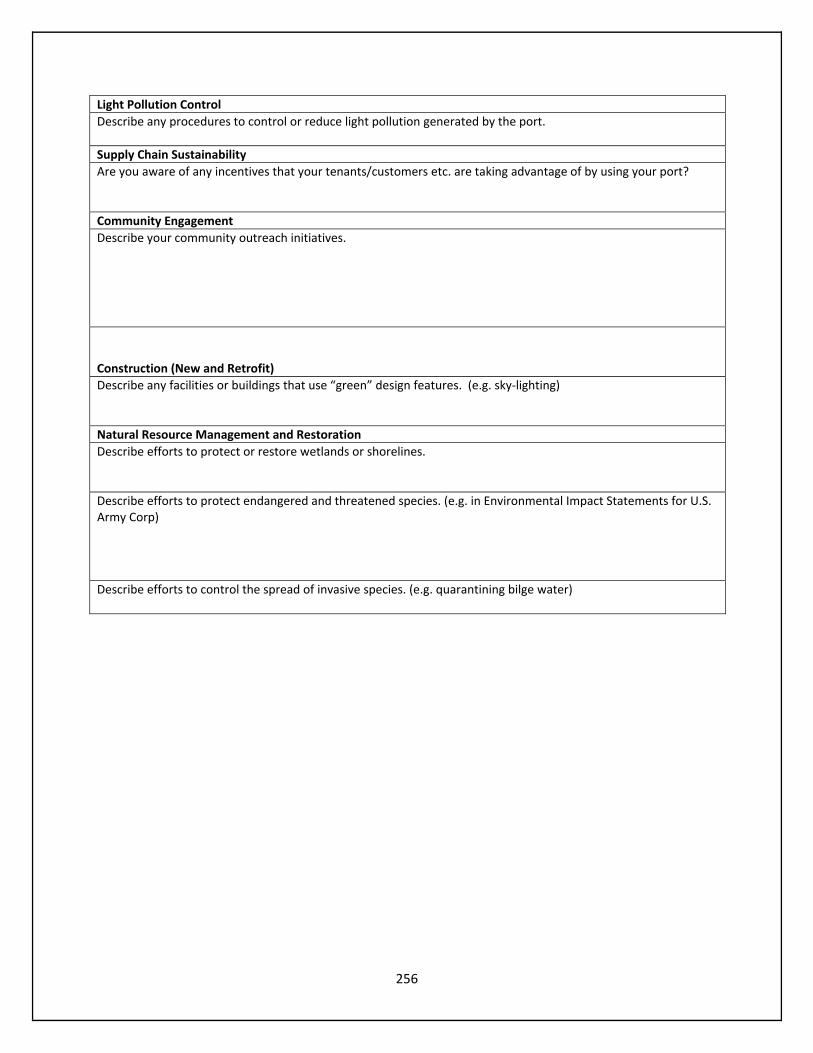
256
Light Pollution Control
Describe any procedures to control or reduce light pollution generated by the port.
Supply Chain Sustainability
Are you aware of any incentives that your tenants/customers etc. are taking advantage of by using your port?
Community Engagement
Describe your community outreach initiatives.
Construction (New and Retrofit)
Describe any facilities or buildings that use “green” design features. (e.g. sky‐lighting)
Natural Resource Management and Restoration
Describe efforts to protect or restore wetlands or shorelines.
Describe efforts to protect endangered and threatened species. (e.g. in Environmental Impact Statements for U.S. Army Corp)
Describe efforts to control the spread of invasive species. (e.g. quarantining bilge water)

257
Version 3
Contact Information
Port Name
Chief Contact
Chief Contact Title
Mailing Address
City
State
Zip
Phone (o)
Phone (c)
Website
Operational Model
Operator Port, Landlord Port, or both? (circle one, and if landlord, describe key tenants)
Describe public‐private relations between the port and government(s).
Bonding Authority? Yes / No (circle one)
Describe Foreign Trade Zone status (e.g. step in application process, sub‐zone relationships)
Number persons employed by port directly?
If landlord, number persons employed indirectly?
Key Transportation Providers
List top 4 barge firms. 1: _______________________ 3: _______________________ 2: _______________________ 4: _______________________
List top 4 trucking firms. 1: _______________________ 3: _______________________ 2: _______________________ 4: _______________________
Name and Length Short Line Railroad?
Name of Tier 1 Railroad?
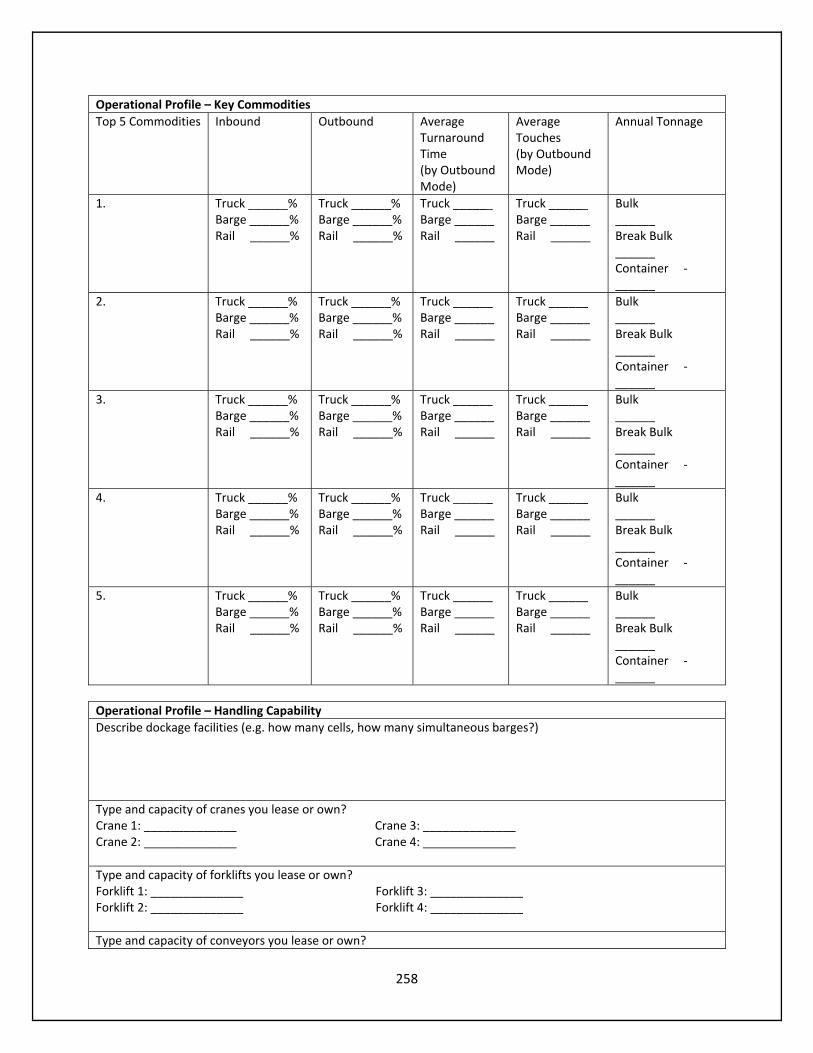
258
Operational Profile – Key Commodities
Top 5 Commodities Inbound Outbound Average Turnaround Time (by Outbound Mode)
Average Touches (by Outbound Mode)
Annual Tonnage
1. Truck ______% Barge ______% Rail ______%
Truck ______%Barge ______% Rail ______%
Truck ______Barge ______ Rail ______
Truck ______ Barge ______ Rail ______
Bulk ______ Break Bulk ______ Container ‐______
2. Truck ______% Barge ______% Rail ______%
Truck ______%Barge ______% Rail ______%
Truck ______Barge ______ Rail ______
Truck ______ Barge ______ Rail ______
Bulk ______ Break Bulk ______ Container ‐______
3. Truck ______% Barge ______% Rail ______%
Truck ______%Barge ______% Rail ______%
Truck ______Barge ______ Rail ______
Truck ______ Barge ______ Rail ______
Bulk ______ Break Bulk ______ Container ‐______
4. Truck ______% Barge ______% Rail ______%
Truck ______%Barge ______% Rail ______%
Truck ______Barge ______ Rail ______
Truck ______ Barge ______ Rail ______
Bulk ______ Break Bulk ______ Container ‐______
5. Truck ______% Barge ______% Rail ______%
Truck ______%Barge ______% Rail ______%
Truck ______Barge ______ Rail ______
Truck ______ Barge ______ Rail ______
Bulk ______ Break Bulk ______ Container ‐______
Operational Profile – Handling Capability
Describe dockage facilities (e.g. how many cells, how many simultaneous barges?)
Type and capacity of cranes you lease or own?Crane 1: ______________ Crane 3: ______________ Crane 2: ______________ Crane 4: ______________
Type and capacity of forklifts you lease or own?Forklift 1: ______________ Forklift 3: ______________ Forklift 2: ______________ Forklift 4: ______________
Type and capacity of conveyors you lease or own?

259
Conveyor 1: ______________ Conveyor 3: ______________Conveyor 2: ______________ Conveyor 4: ______________
Type and capacity of warehouses you lease or own?Warehouse 1: ______________ Warehouse 3: ______________ Warehouse 2: ______________ Warehouse 4: ______________
Type and capacity of tanks you lease or own?Tank 1: ______________ Tank 3: ______________ Tank 2: ______________ Tank 4: ______________
Type and capacity of pumps you lease or own?Pump 1: ______________ Pump 3: ______________ Pump 2: ______________ Pump 4: ______________
Acres of outside paved storage?
Acres of permeable or semi‐permeable surface?
Intermodal Connections
Describe highway accessibility. (e.g. state, US, or Interstate; capacity concerns; limits due to load weight or length)
Describe your ability to load and unload railroad.
Describe proximity and accessibility of nearest international airport.
Describe your ability to accommodate Container on Barge.
Environmental Regulation / Policy
Describe any air quality permits.
Describe any storm‐water discharge permits.
Describe any brownfield‐related permits.
Does your company have a program for educating employees on becoming more sustainable? If so, please describe.

260
Air Quality
Check box to indicate fuel type. Crane 1: ___ diesel ___ electric ___ other (specify: ) Crane 2: ___ diesel ___ electric ___ other (specify: ) Crane 3: ___ diesel ___ electric ___ other (specify: ) Crane 4: ___ diesel ___ electric ___ other (specify: ) Forklift 1: ___ diesel ___ electric ___ propane ___ other (specify: ) Forklift 2: ___ diesel ___ electric ___ propane ___ other (specify: ) Forklift 3: ___ diesel ___ electric ___ propane ___ other (specify: ) Forklift 4: ___ diesel ___ electric ___ propane ___ other (specify: )
Describe efforts to minimize dust. (e.g. related to roads, conveyors, vehicle washing)
Describe process or infrastructure changes that have reduced engine idling times.
Do towboats have access to shore power?
Water Conservation
How is water being used at facility? (e.g. domestic, dust suppression, manufacturing)
Describe any processes or practices for managing storm water run‐off.
Describe systems for the reuse of gray water.
Describe procedures for recycling or disposing of wastewater discharged by barges or towboats.
Energy Conservation
Conducted energy audit? Yes / No (circle one)
Average monthly electricity consumption? Highest – Lowest –
Electricity rate per Kw?
Describe use of renewable energy (e.g. solar, wind).

261
Number of outdoor light stanchions?
Number of bulbs per stanchion?
Type of bulbs in stanchions?
Wattage of bulbs in stanchions?
Describe use of automated lighting. If you use photo‐sensors, do lights burn all night long?
Describe use of LED lighting.
Does your facility purchase ENERGY STAR qualified equipment?
Solid Waste Reduction, Recycling and Disposal
Describe procedures for recycling dredge material.
Describe procedures for recycling material generated by barges. (e.g. pallets)
Describe procedures for recycling office waste.
Noise Abatement
What is the distance between your port and the nearest residential neighborhood?
Describe procedures or practices to monitor and manage noise produced by the port.
Light Pollution Control
Describe any procedures to control or reduce light pollution generated by the port.
Supply Chain Sustainability
Are you aware of any incentives that your tenants/customers etc. are taking advantage of by using your port?
Community Engagement
What is the distance from the port to the nearest neighborhood(s)?
Describe your community outreach initiatives.

262
Construction (New and Retrofit)
Describe any facilities or buildings that use “green” features, or future plans to use green design (e.g. sky‐lighting).
Natural Resource Management and Restoration
Describe efforts to protect or restore wetlands or shorelines.
Describe efforts to protect or restore animal species.
Describe efforts to protect endangered and threatened species. (e.g. in Environmental Impact Statements for U.S. Army Corp)
Describe efforts to control the spread of invasive species. (e.g. quarantining bilge water)
Financial Sustainability
Does the port receive revenue or income in the form of public funding?
Does the port pay dividends from profit back to the local government?
What percentage of the port’s revenue or income is generated from public funds vs. self‐generated revenue from port services?
Has your port been recently affected negatively by public funding budget cuts? If so please describe.
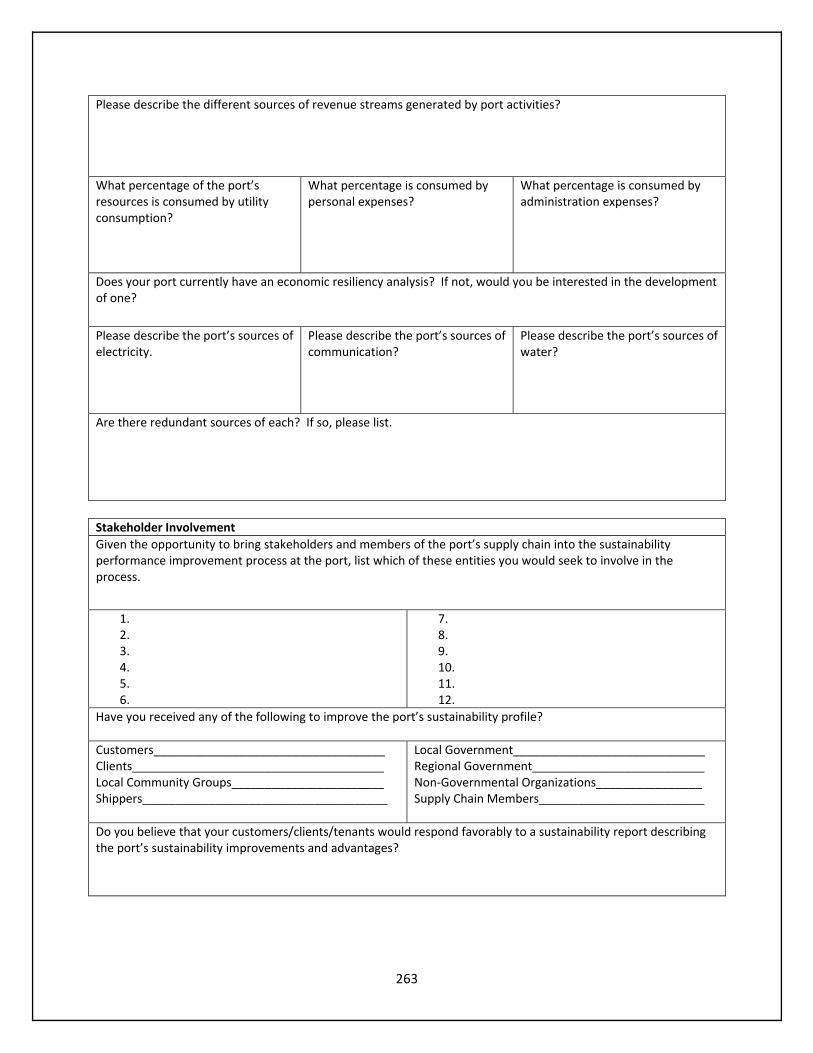
263
Please describe the different sources of revenue streams generated by port activities?
What percentage of the port’s resources is consumed by utility consumption?
What percentage is consumed by personal expenses?
What percentage is consumed by administration expenses?
Does your port currently have an economic resiliency analysis? If not, would you be interested in the development of one?
Please describe the port’s sources of electricity.
Please describe the port’s sources of communication?
Please describe the port’s sources of water?
Are there redundant sources of each? If so, please list.
Stakeholder Involvement
Given the opportunity to bring stakeholders and members of the port’s supply chain into the sustainability performance improvement process at the port, list which of these entities you would seek to involve in the process.
1. 2. 3. 4. 5. 6.
7.8. 9. 10. 11. 12.
Have you received any of the following to improve the port’s sustainability profile?
Customers___________________________________Clients______________________________________ Local Community Groups_______________________ Shippers_____________________________________
Local Government_____________________________Regional Government__________________________ Non‐Governmental Organizations________________ Supply Chain Members_________________________
Do you believe that your customers/clients/tenants would respond favorably to a sustainability report describing the port’s sustainability improvements and advantages?
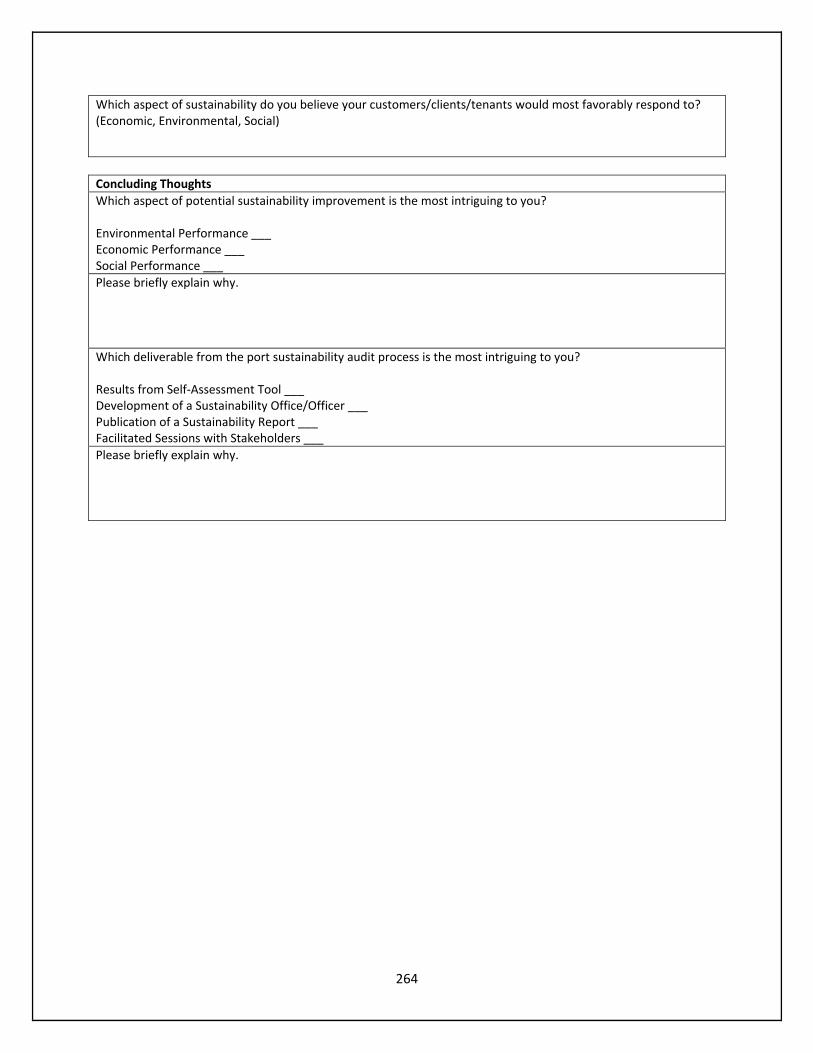
264
Which aspect of sustainability do you believe your customers/clients/tenants would most favorably respond to? (Economic, Environmental, Social)
Concluding Thoughts
Which aspect of potential sustainability improvement is the most intriguing to you? Environmental Performance ___ Economic Performance ___ Social Performance ___
Please briefly explain why.
Which deliverable from the port sustainability audit process is the most intriguing to you? Results from Self‐Assessment Tool ___ Development of a Sustainability Office/Officer ___ Publication of a Sustainability Report ___ Facilitated Sessions with Stakeholders ___
Please briefly explain why.

265
This page left intentionally blank.
266
Appendix E – Port Terminology
(Source:PortofNewOrleans,GeorgiaPortAuthority,VirginiaPortAuthority)
ABS: The American Bureau of Shipping is a U.S. classification society that certifies if a ship is in compliance with standard rules of construction and maintenance.
Anchorage: Port charge relating to a vessel moored at approved anchorage site in a harbor.
Apron: The area immediately in front of or behind a wharf shed on which cargo is lifted. On the "front apron," cargo is unloaded from or loaded onto a ship. Behind the shed, cargo moves over the "rear apron" into and out of railroad cars.
Backhaul: To haul a shipment back over part of a route which it has already traveled; a marine transportation carrier’s return movement of cargo, usually opposite from the direction of its primary cargo distribution.
Barge: A large, flat‐bottomed boat used to carry cargo from a port to shallow‐draft waterways. Barges have no locomotion and are pushed by towboats. A single, standard barge can hold 1,500 tons of cargo or as much as either 15 railroad cars or 60 trucks can carry. A barge is 200 feet long, 35 feet wide and has a draft of nine feet. Barges carry dry bulk (grain, coal, lumber, gravel, etc.) and liquid bulk (petroleum, vegetable oils, molasses, etc.).
Berth: (verb) To bring a ship to a berth. (noun) (The wharf space at which a ship docks) A wharf may have two or three berths, depending on the length of incoming ships.
Bill of lading: A contract between a shipper and carrier listing the terms for moving freight between specified points.
Board of Commissioners: The members of the governing board of a port authority are called commissioners. Members of a Board of Commissioners can be elected or appointed and usually serve for several years.
Bollard: A line‐securing device on a wharf around which mooring and berthing lines are fastened.
Bonded warehouse: Is a building designated by U.S. Customs authorities for storage of goods without payment of duties to Customs until the goods are removed.
Box: Slang term for a container.
Breakbulk cargo: Non‐containerized general cargo stored in boxes, bales, pallets or other units to be loaded onto or discharged from ships or other forms of transportation(See also: bulk and container). Examples include iron, steel, machinery, linerboard and woodpulp.
Bulk cargo: Loose cargo (dry or liquid) that is loaded (shoveled, scooped, forked, mechanically conveyed or pumped) in volume directly into a ship’s hold (e.g., grain, coal and oil).
Bulkhead: A structure used to protect against shifting cargo and/or to separate the load.
Buoys: Floats that warn of hazards such as rocks or shallow ground, to help ships maneuver through unfamiliar harbors.
Cabotage: Shipment of cargo between a nation’s ports is also called coastwise trade. The U.S. and some other countries require such trade to be carried on domestic ships only.
Capacity: The available space for, or ability to handle, freight.
Captive cargo port: When most of a port’s inbound cargoes are being shipped short distances and most of its export products come from nearby areas, the port is called a captive cargo port (Contrast with a transit port).
Cargo: The freight (goods, products) carried by a ship, barge, train, truck or plane.
Carrier: An individual, partnership or corporation engaged in the business of transporting goods or passengers (See also: ocean carrier).
Cartage: Originally the process of transporting by cart. Today, the term is used for trucking or trucking fees.
267
Chandlers: Like a hotel at sea, a ship needs many supplies to operate and serve its crew‐‐ groceries; paper products; engine parts; electronics; hardware and others. A chandler sells these supplies to the ship’s agent. Originally, chandlers (candle makers) provided illumination to ships. Over time they expanded the variety of products they could provide to ships.
Channels of distribution: The routes by which products are transported from origin to destination. This includes the physical routes, as well as the different companies involved in ultimately delivering the goods to buyers.
Chock: A piece of wood or other material put next to cargo to prevent it from shifting.
Civil service: Some U.S., state, city and parish government jobs are protected under civil service systems which are designed to provide a degree of security to employees and to deter nepotism, political patronage and arbitrary treatment of workers.
Clerks: When cargo is unloaded from a ship, a clerk checks the actual count of the goods (number of boxes, drums, bundles, pipes, etc.) versus the amount listed on the ship’s manifest. He will note shortages, overages or damage. This is used to make claims if needed.
Common carrier: Trucking, railroad or barge lines that are licensed to transport goods or people nationwide are called common carriers.
Conference rate: Rates arrived at by conference of carriers applicable to water transportation.
Consignment: A shipment of goods. The buyer of this shipment is called the consignee; the seller of the goods is called the consignor.
Consolidated Freight Station or Container Freight Station (CFS): Location on terminal grounds where stuffing and stripping of containers is conducted.
Consolidator: The person or firm that consolidates (combines) cargo from a number of shippers into a container that will deliver the goods to several buyers.
Container: A box made of aluminum, steel or fiberglass used to transport cargo by ship, rail, truck or barge. Common dimensions are 20' x 8’ x 8' (called a TEU or twenty‐foot equivalent unit) or 40' x 8' x 8', called an FEU. Variations are collapsible containers, tank containers (for liquids) and "rag tops" (open‐topped containers covered by a tarpaulin for cargo that sticks above the top of a closed box). In the container industry, containers are usually simply called boxes.
Container freight station: The facility for stuffing and stripping a container of its cargo, especially for movement by railroad.
Container chassis: A piece of equipment specifically designed for the movement of containers by highway to and from container terminals.
Container crane: Usually, a rail‐mounted gantry crane located on a wharf for the purpose of loading and unloading containers on vessels.
Container terminal: A specialized facility where ocean container vessels dock to discharge and load containers, equipped with cranes with a safe lifting capacity of 35‐40 tons, with booms having an outreach of up to 120 feet in order to reach the outside cells of vessels. Most such cranes operate on rail tracks and have articulating rail trucks on each of their four legs, enabling them to traverse along the terminal and work various bays on the vessel and for more than one crane to work a single vessel simultaneously. Most terminals have direct rail access and container storage areas, and are served by highway carriers.
Containerization: The technique of using a container to store, protect and handle cargo while it is in transit. This shipping method has both greatly expedited the speed at which cargo is moved from origin to destination and lowered shipping costs.
Container on Flat Car (COFC): A container placed directly on a railroad flatcar without chassis.
Contraband: Goods prohibited in trade (such as weapons going to Iran, anything to Cuba) (Smuggled goods).
Corps of Engineers: This department of the U. S. Army is responsible for flood protection and providing safe navigation channels. The Corps builds and maintains the levees, flood walls and spillways that keep major rivers out of low lying communities. The Corps is vital to keeping navigation channels open by dredging sand, silt and gravel that accumulate on river and harbor bottoms.
Craft: A boat, ship or airplane.
Customs: A duty or tax on imported goods. These fees are a major bonus to the economy. In 1999, for example, the U. S. Customs Department collected over $22 billion in fees nationally, which went into the U.S. Treasury. The Customs Department also works to prevent the importation of illegal drugs and contraband.
268
Customs broker: This person prepares the needed documentation for importing goods (just as a freight forwarder does for exports). The broker is licensed by the Treasury Department to clear goods through U.S. Customs. Performs duties related to documentation, cargo clearance, coordination of inland and ocean transportation, dockside inspection of cargo, etc. (Also known as a customhouse broker)
Dead Weight Tonnage (DWT): Maximum weight of a vessel including the vessel, cargo, and ballast.
Deadhead: When a truck returning from a delivery has no return freight on the back haul, it is said to be in deadhead.
Deck barge: Transports heavy or oversize cargoes mounted to its top deck instead of inside a hold. Machinery, appliances, project cargoes and even recreational vehicles move on deck barges.
Demurrage: A penalty fee assessed when cargo isn’t moved off a wharf before the free time allowance ends.
Dock: To bring in a vessel to tie up at a wharf berth (One parks a car, but docks a ship) (noun) ‐ A dock is a structure built along, or at an angle from, a navigable waterway so that vessels may lie alongside to receive or discharge cargo. Sometimes, the whole wharf is informally called a dock.
Dockage: A charge by a port authority for the length of water frontage used by a vessel tied up at a wharf.
Draft: The depth of a loaded vessel in the water taken from the level of the waterline to the lowest point of the hull of the vessel; depth of water, or distance between the bottom of the ship and waterline.
Drayage: Transport by truck for short distances; e.g. from wharf to warehouse.
Dredge: (noun) A waterborne machine that removes unwanted silt accumulations from the bottom of a waterway (verb). The process of removing sediment from harbor or river bottoms for safety purposes and to allow for deeper vessels.
Dry bulk: Minerals or grains stored in loose piles moving without mark or count.
Dunnage: Wood or other material used in stowing ship cargo to prevent movement.
Duty: A government tax on imported merchandise.
Electronic Data Interchange (EDI): The exchange of information through an electronic format. Electronic commerce has been under intensive development in the transportation industry to achieve a competitive advantage in international markets.
Elevator: A complex including storage facilities, computerized loading, inspection rooms and docks to load and unload dry bulk cargo such as grain or green coffee.
Export packers: Firms that securely pack export products into a container to crate to protect the cargo from damage during an ocean voyage.
Feeder service: Ocean transport system involving use of centralized ports to assemble and disseminate cargo to and from ports within a geographic area. Commodities are transported between major ports and then transferred to feeder vessels for further transport to a number of additional ports.
Fender piles: The wooden or plastic pilings on the outer edge of the wharf function like the fenders on a car. They are there to absorb the shock of a ship as it docks at the wharf and to protect the structural pilings that actually support the wharf. Fender piles are also called sacrifice piles since they are designed to be discarded after they are broken.
Fleeting: This area is where barges, towboats and tugs are berthed until they are needed. The operation of building or dismantling barge tows.
Foreign Trade Zone (FTZ) ‐ Known in some countries as a free zone, a foreign trade zone (FTZ) is a site within the USA (in or near a U.S. Customs port of entry) where foreign and domestic goods are held until they ready to be released into international commerce. If the final product is imported into the U.S., duties and taxes are not due until the goods are release into the U.S. market. Merchandise may enter a FTZ without a formal Customs entry or the payment of Customs duties or government excise taxes. In the zone, goods may be: stored; tested; sampled; repackaged or relabeled; cleaned; combined with other products; repaired or assembled, etc.
Freight: Merchandise hauled by transportation lines.
Freight forwarder: An individual or company that prepares the documentation and coordinates the movement and storage of export cargoes. See also Customs house broker.
Gantry crane: Track‐mounted, shoreside crane utilized in the loading and unloading of breakbulk cargo, containers and heavy lift cargo.
269
General cargo: Consists of both containerized and breakbulk goods, in contrast to bulk cargo. (See: breakbulk, container, bulk, dry bulk). General cargo operations produce more jobs than bulk handling.
Grain elevator: The facility, at which bulk grain is unloaded, weighed, cleaned, blended and exported.
Gross tonnage: The sum of container, breakbulk and bulk tonnage.
Harbor: A port of haven where ships may anchor.
Heavy hauler: A truck equipped to transport unusually heavy cargoes (steel slabs, bulldozers, transformers, boats, heavy machinery, etc.)
Heavy lift: Very heavy cargoes that require specialized equipment to move the products to and from ship/truck/rail/barge and terminals. This "heavy lift" machinery may be installed aboard a ship designed just for such transport. Shore cranes, floating cranes and lift trucks may also adapted for such heavy lifts.
Home port: Port from which a cruise ship loads passengers and begins its itinerary, and to which it returns to disembark passengers upon conclusion of voyage (Sometimes referred to as "embarkation port" and "turn around port”).
hopper car: A freight car used for handling dry bulks, with a top that can be opened, and one or more openings on the bottom through which the cargo is dumped.
Hostler (or hustler): A tractor, usually unlicensed, for moving containers within a yard (employee who drives the tractor for the purpose of moving cargo within a container yard).
Interchange: Point of entry/exit for trucks delivering and picking up containerized cargo (the point where pick‐ups and deposits of containers in storage area or yard are assigned).
I.L.A.: International Longshoremen’s Association, which operates on the East and Gulf Coasts. See labor unions and longshoremen.
I.L.W.U.: International Longshore and Warehouse Union, which operates on the West Coast. See labor unions and longshoremen.
intermodal shipment: When more than one mode of transportation is used to ship cargo from origin to destination, it is called intermodal transportation. For example, boxes of hot sauce from Louisiana are stuffed into metal boxes called containers at the factory. That container is put onto a truck chassis (or a railroad flat car) and moved to a port. There the container is lifted off the vehicle and lifted onto a ship. At the receiving port, the process is reversed. Intermodal transportation uses few laborers and speeds up the delivery time.
IMX: This is transportation shorthand for intermodal exchange. In an IMX yard, containers can be lifted from truck chassis to rail intermodal cars or vice versa.
ISO: International Organization for Standardization. Worldwide organization formed to promote development of standards to facilitate the international carriage and exchange of goods and services (Governs construction specifications for ISO container).
JIT: The abbreviation for "just in time," which is a way to minimize warehousing costs by having cargo shipped to arrive just in time for its use. This inventory control method depends on extremely reliable transportation.
Labor union: An organization of workers formed to serve members’ collective interests with regard to wages and working conditions. The maritime unions within ports can include locals of the larger union, such as the General Longshore Workers; Clerks and Checkers; Sack‐sewers, Sweepers, Water boys and Coopers; Dock Loaders and Unloaders of Freight Cars and Barges; Dray Clerks, Weighers and Samplers; plus the Seafarer’s International Union; the National Maritime Union; the Marine Engineers’ Beneficial Association and the Teamsters. Some laborers don’t belong to a union.
Landlord port: At a landlord port, the port authority builds the wharves, which it then rents or leases to a terminal operator (usually a stevedoring company). The operator invests in cargo‐handling equipment (forklifts, cranes, etc.), and hires longshore laborers to operate such lift machinery and negotiates contracts with ocean carriers (steamship services) to handle the unloading and loading of ship cargoes.
LASH: These 900‐foot‐long ships carry small barges inside the vessel. LASH stands for Lighter Aboard Ship. Just as cargo is transported by barge from the shallower parts of the Mississippi River to the Port of New Orleans for export aboard ocean‐going ships, LASH barges are lifted into these unusual ships. Overseas, the ship can discharge clusters of barges in the open waters. Then several towboats will assemble the barges into tows bound for various ports and inland waterways, without the ship having to spend time traveling to each port.
Launch service: Companies that offer "water‐taxi" service to ships at anchor.
270
LCL: The acronym for "less than container load." It refers to a partial container load that is usually consolidated with other goods to fill a container.
Length Overall (LOA): Linear measurement of a vessel from bow to stern.
Lift On‐Lift Off (LO/LO): Cargo handling technique involving transfer of commodities to and from the ship using shoreside cranes or the gear of a ship.
LTL: Means a shipment that is "less than truckload". Cargoes from different sources are usually consolidated to save costs.
Long ton: A long ton equals 2240 pounds.
Longshoremen: Dock workers who load and unload ships, or perform administrative tasks associated with the loading or unloading of cargo. They may or may not be members of labor unions. Longshore gangs are hired by stevedoring firms to work the ships. Longshoremen are also called stevedores.
Manifest: The ship captain’s list of individual goods that make up the cargo.
Marine surveyor: Person who inspects a ship hull or cargo for damage or quality.
Master: The officer in charge of the ship. "Captain" is a courtesy title often given to a master.
Maritime: (adjective) Located on or near the sea (Commerce or navigation by sea). The maritime industry includes people working for transportation (ship, rail, truck and towboat/barge) companies, freight forwarders and customs brokers; stevedoring companies; labor unions; chandlers; warehouses; ship building and repair firms; importers/exporters; pilot associations, etc.
Marshaling yard: This is a container parking lot, or any open area where containers are stored in a precise order according to the ship loading plan. Containers terminals may use a grounded or wheeled layout. If the cargo box is placed directly on the ground, it is called a grounded operation. If the box is on a chassis/trailer, it is a wheeled operation.
Mean low water (MLW): Lowest average level water reaches on an outgoing tide.
Mean high water (MHW): Highest average level water reaches on an outgoing tide.
Mooring dolphin: A cluster of pilings to which a boat or barge ties up.
Motor ship (MS) or motor vessel (MV): A ship propelled by internal‐combustion engines.
NVOCC: A non‐vessel‐owning common carrier that buys space aboard a ship to get a lower volume rate. An NVOCC then sells that space to various small shippers, consolidates their freight, issues bills of lading and books space aboard a ship.
Neo‐bulk cargo: Uniformly packaged goods, such as wood pulp bales, which stow as solidly as bulk, but are handled as general cargoes.
Ocean carrier: Diesel‐fueled vessels have replaced the old steamships of the past, although many people still refer to modern diesel ships as steamships. Likewise, the person who represents the ship in port is still often called a steamship agent. (See: steamship agent)
On‐dock rail: Direct shipside rail service. Includes the ability to load and unload containers/breakbulk directly from rail car to vessel.
On‐terminal rail: Rail service and trackage provided by a railroad within a designated terminal area.
Operating port: At an operational port like Charleston, South Carolina, the port authority builds the wharves, owns the cranes and cargo‐handling equipment and hires the labor to move cargo in the sheds and yards. A stevedore hires longshore labor to lift cargo between the ship and the dock, where the port’s laborers pick it up and bring it to the storage site. (See landlord port.)
Pallet: A short wooden, metal or plastic platform on which package cargo is placed (then handled by a forklift truck).
Pier: A structure which just out into a waterway from the shore, for mooring vessels and cargo handling. This is sometimes called a finger pier.
Piggyback: A rail transport mode where a loaded truck trailer is shipped on a rail flatcar.
Pilot: A licensed navigational guide with thorough knowledge of a particular section of a waterway whose occupation is to steep ships along a coast or into and out of a harbor. Local pilots board the ship to advise the captain and navigator of local navigation conditions (difficult currents; hidden wrecks, etc.).
271
Port: This term is used both for the harbor area where ships are docked and for the agency (port authority), which administers use of public wharves and port properties.
Port‐of‐call: Port at which cruise ship makes a stop along its itinerary. Calls may range from five to 24 hours. This is sometimes referred to as "transit port" and "destination port." (See also: home port)
Project cargo: The materials and equipment to assemble a special project overseas, such as a factory or highway.
Quay: A wharf, which parallels the waterline.
Railhead: End of the railroad line, or point in the area of operations at which cargo is loaded and unloaded.
Railyard: A rail terminal at which occur traditional railroad activities for sorting and redistribution of railcars and cargo.
Reefer: A container with refrigeration for transporting frozen foods (meat, ice cream, fruit, etc.)
Refrigeration or reefer units: The protective cooling of perishable freight by ice, liquid nitrogen, or mechanical devices
Ro/ro: Short for roll on/roll/off. A ro/ro ship is designed with ramps that can be lowered to the dock so cars, buses, trucks or other vehicles can drive into the belly of the ship, rather than be lifted aboard. A ro/ro ship, like a container ship, has a quick turnaround time of about 12 hours.
Rubber‐Tired Gantry (RTG): Traveling crane used for the movement and positioning of containers in a container field. RTG's may also be used for loading and unloading containers from rail cars.
Sheddage: Regardless of the length of stay, a vessel is charged a one‐time fee for use of shed space and/or marginal (waterside) rail track space. The charge is based on the length of a vessel.
Short ton: A short ton equals 2,000. Lifting capacity and cargo measurements are designated in short tons.
Spreader: A device for lifting containers by their corner posts. The spreader bar on a container crane is telescopic to allow lifting various length containers.
Steamship: Today, ships that transport cargo overseas are powered by diesel fuel instead of steam. Many people still use the term "steamship," but the more modern term for the service is "ocean carrier" and for the ship itself, "motor vessel."
Steamship agent: The local representative who acts as a liaison among ship owners, local port authorities, terminals and supply/service companies. An agent handles all details for getting the ship into port; having it unloaded and loaded; inspected and out to sea quickly. An agent arranges for pilots; tug services; stevedores; inspections, etc., as well as, seeing that a ship is supplied with food, water, mail, medical services, etc. A steamship agency does not own the ship.
Steamship company: A business that owns ships operating via international trade.
Steamship line: A steamship (ocean carrier) service running on a particular international route. Examples: NSCSA (National Shipping Company of Saudi Arabia), American President Lines (APL), Maersk Sealand, Evergreen, etc.
Stevedores: Labor management companies that provide equipment and hire workers to transfer cargo between ships and docks. Stevedore companies may also serve as terminal operators. The laborers hired by the stevedoring firms are called stevedores or longshoremen.
Straddle carrier: Container terminal equipment, which is motorized and runs on rubber tires. It can straddle a single row of containers and is primarily used to move containers around the terminal, but also to transport containers to and from the transtainer and load/unload containers from truck chassis.
Stripping: This is the process of removing cargo from a container.
Stuffing: The process of packing a container with loose cargo prior to inland or ocean shipment.
Tank barges: They are used for transporting bulk liquids (such as petroleum, chemicals, molasses, vegetable oils and liquefied gases).
Tariff: Schedule, system of duties imposed by a government on the import/export of goods; also, the charges, rates and rules of a transportation company as listed in published industry tables.
Terminal: The place where cargo is handled is called a terminal (or a wharf).
Terminal operator: The company that operates cargo handling activities on a wharf. A terminal operator oversees unloading cargo from ship to dock, checking the quantity of cargoes versus the ship’s manifest (list of goods), transferring of the cargo into the shed, checking documents authorizing a trucker to pick up cargo, overseeing the loading/unloading of railroad cars, etc.
272
Toplift: A piece of equipment similar to a forklift that lifts from above rather than below (used to handle containers in the storage yard to and from storage stacks, trucks and railcars).
Towboat: A snub‐nosed boat with push knees used for pushing barges. A small towboat (called a push boat) may push one or two barges around the harbor. A large towboat is used to push from 5 to 40 barges in a tow is called a line boat. From the Port of New Orleans, line boats deliver cargo to Mid‐America via the 14,500‐mile waterway system flowing through the Crescent City.
Tractor‐trailer: Some trucks are a solid unit, such as a van, but many have three main units. The front section where the driver sits is called the cab or the tractor (because it pulls a load). Cargo is loaded into the metal box (container), which is loaded onto the wheel base called a chassis or a trailer. These big trucks are often also called 18‐wheelers.
Trailer On Flat Car (TOFC): A container placed on a chassis that is in turn placed on a railroad car.
Tramp: A ship operating with no fixed route or published schedule.
Transit port: When the majority of cargoes moving through a port aren’t coming from or destined for the local market, the port is called a transit (or through) port.
Transit shed: The shed on a wharf is designed to protect cargoes from weather damage and is used only for short‐term storage. Warehouses are operated by private firms that house goods for longer periods.
Transshipment: The unloading of cargo at a port or point where it is then reloaded, sometimes into another mode of transportation, for transfer to a final destination.
Transtainer: A type of crane used in the handling of containers, which is motorized, mounted on rubber tires and can straddle at least four railway tracks (some up to six) with a lifting capacity of 35 tons for loading and unloading containers to and from railway cards.
Trucks: Heavy automotive vehicles used to transport cargo. In the maritime industry, cargo is often carried by tractor‐trailers. The tractor is the front part of the vehicle, also called a cab. The trailer is the detachable wheeled chassis behind the tractor, on which containers or other cargoes are placed. (See: common carrier; heavy hauler; drayage)
Tugboat: Strong v‐hull shaped boat used for maneuvering ships into and out of port and to carry supplies. A ship is too powerful to pull up to the wharf by itself. It cuts power and lets the tug nudge it in. Generally barges are pushed by towboats, not tugs.
Twenty Foot Equivalent Unit (TEU): A unit of measurement equal to the space occupied by a standard twenty foot container. (used in stating the capacity of container vessel or storage area) One 40 ft. Container is equal to two TEU's.
U. S. Army Corps of Engineers: See Corps of Engineers.
U. S. Customs: See Customs.
Vessel: A ship or large boat.
Vessel operator: A firm that charters vessels for its service requirements, which are handled by their own offices or appointed agents at ports of call. Vessel operators also handle the operation of vessels on behalf of owners.
Warehouse: A place in which goods or merchandise is stored.
Way bill: The document used to identify the shipper and consignee, present the routing, describe the goods, present the applicable rate, show the weight of the shipment, and make other useful information notations.
Wharf: The place at which ships tie up to unload and load cargo. The wharf typically has front and rear loading docks (aprons), a transit shed, open (unshedded) storage areas, truck bays, and rail tracks.
Wharfage fee: A charge assessed by a pier or wharf owner for handling incoming or outgoing cargo.
Yard: a system of tracks within a certain area used for making up trains, storing cars, placing cars to be loaded or unloaded, etc.

273
This page left intentionally blank.
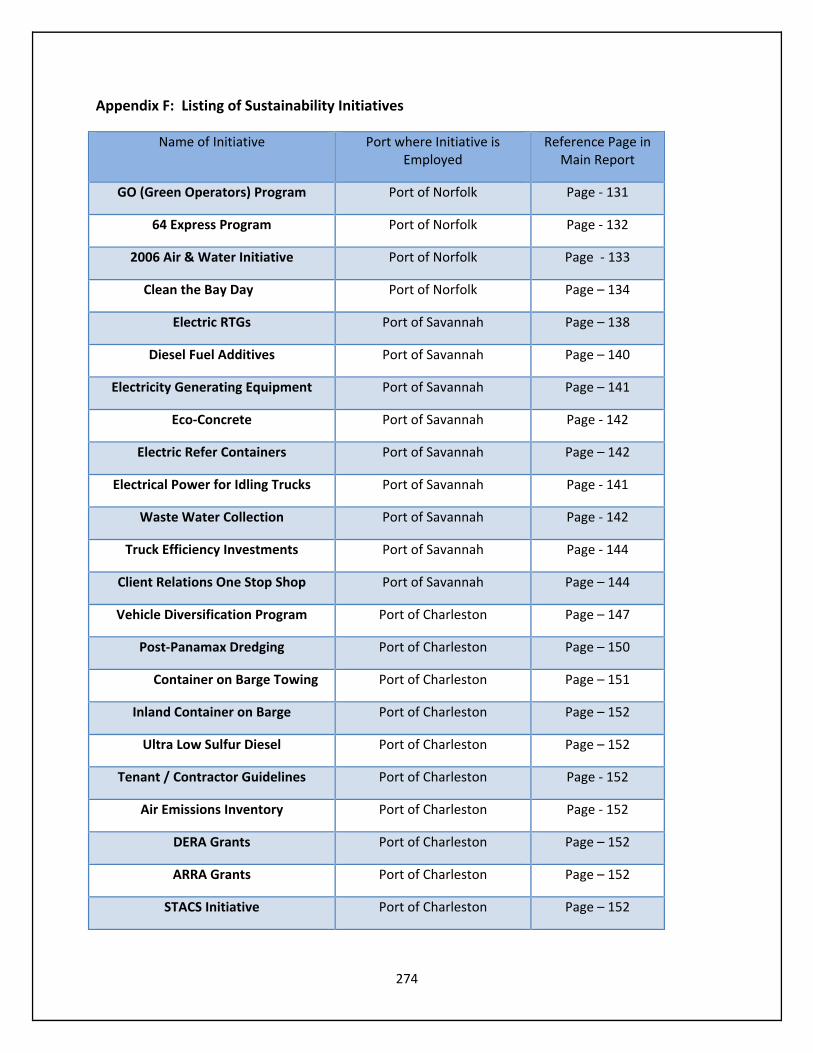
274
Appendix F: Listing of Sustainability Initiatives
Name of Initiative Port where Initiative is Employed
Reference Page in Main Report
GO (Green Operators) Program Port of Norfolk Page ‐ 131
64 Express Program Port of Norfolk Page ‐ 132
2006 Air & Water Initiative Port of Norfolk Page ‐ 133
Clean the Bay Day Port of Norfolk Page – 134
Electric RTGs Port of Savannah Page – 138
Diesel Fuel Additives Port of Savannah Page – 140
Electricity Generating Equipment Port of Savannah Page – 141
Eco‐Concrete Port of Savannah Page ‐ 142
Electric Refer Containers Port of Savannah Page – 142
Electrical Power for Idling Trucks Port of Savannah Page ‐ 141
Waste Water Collection Port of Savannah Page ‐ 142
Truck Efficiency Investments Port of Savannah Page ‐ 144
Client Relations One Stop Shop Port of Savannah Page – 144
Vehicle Diversification Program Port of Charleston Page – 147
Post‐Panamax Dredging Port of Charleston Page – 150
Container on Barge Towing Port of Charleston Page – 151
Inland Container on Barge Port of Charleston Page – 152
Ultra Low Sulfur Diesel Port of Charleston Page – 152
Tenant / Contractor Guidelines Port of Charleston Page ‐ 152
Air Emissions Inventory Port of Charleston Page ‐ 152
DERA Grants Port of Charleston Page – 152
ARRA Grants Port of Charleston Page – 152
STACS Initiative Port of Charleston Page – 152
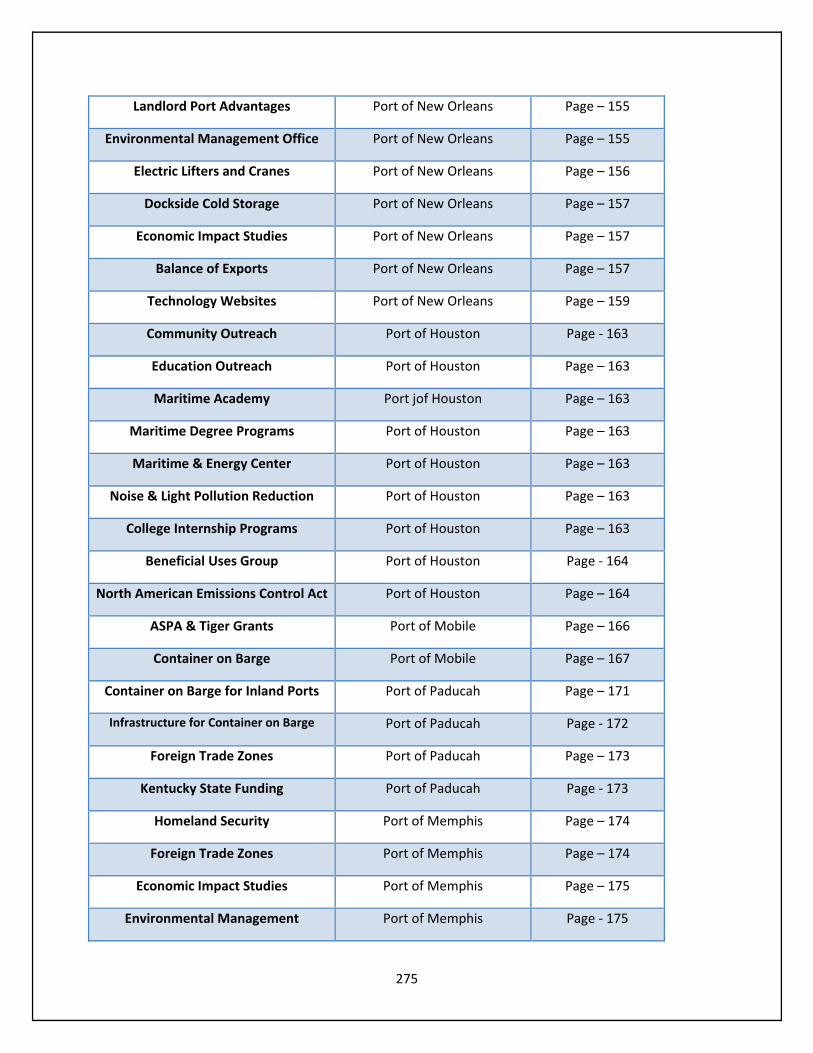
275
Landlord Port Advantages Port of New Orleans Page – 155
Environmental Management Office Port of New Orleans Page – 155
Electric Lifters and Cranes Port of New Orleans Page – 156
Dockside Cold Storage Port of New Orleans Page – 157
Economic Impact Studies Port of New Orleans Page – 157
Balance of Exports Port of New Orleans Page – 157
Technology Websites Port of New Orleans Page – 159
Community Outreach Port of Houston Page ‐ 163
Education Outreach Port of Houston Page – 163
Maritime Academy Port jof Houston Page – 163
Maritime Degree Programs Port of Houston Page – 163
Maritime & Energy Center Port of Houston Page – 163
Noise & Light Pollution Reduction Port of Houston Page – 163
College Internship Programs Port of Houston Page – 163
Beneficial Uses Group Port of Houston Page ‐ 164
North American Emissions Control Act Port of Houston Page – 164
ASPA & Tiger Grants Port of Mobile Page – 166
Container on Barge Port of Mobile Page – 167
Container on Barge for Inland Ports Port of Paducah Page – 171
Infrastructure for Container on Barge Port of Paducah Page ‐ 172
Foreign Trade Zones Port of Paducah Page – 173
Kentucky State Funding Port of Paducah Page ‐ 173
Homeland Security Port of Memphis Page – 174
Foreign Trade Zones Port of Memphis Page – 174
Economic Impact Studies Port of Memphis Page – 175
Environmental Management Port of Memphis Page ‐ 175

276
Sustainability Offices Port of Memphis Page ‐ 176
Osprey Line Port of Memphis Page – 176
Modal Switches Port of Memphis Page – 177
Barge Design Considerations Port of Memphis Page – 178
Panama Canal Expansion Port of Memphis Page – 178
Private Port Advantages Port of Cincinnati Page – 182
Diversification Port of Cincinnati Page – 182
Targeted Coal Processing Port of Cincinnati Page – 182
Just in Time Delivery Port of Cincinnati Page – 183
Recycling Programs Port of Cincinnati Page – 183
Limiting Touches Port of Cincinnati Page – 183
Foreign Trade Zones Port of Louisville Page – 184
Public Funding Port of Louisville Page – 185
Development Financing Port of Louisville Page – 185
Local Economic Impact Port of St. Louis Page – 187
Container on Barge Port of St. Louis Page – 187
Heavy Commodities Port of St. Louis Page – 187
Sustainability Office/Report Multiple Page – 189
Niche Container on Barge Multiple Page – 189
Diversification Multiple Page ‐ 190
Supply Chain Sustainability Multiple Page ‐ 190
Low Cost Initiatives Multiple Page – 191
Efficiencies Multiple Page – 191
Foreign Trade Zones Multiple Page – 191
Economic Impact Reports Multiple Page – 191
Costal Partners as Mentors Multiple Page ‐ 192
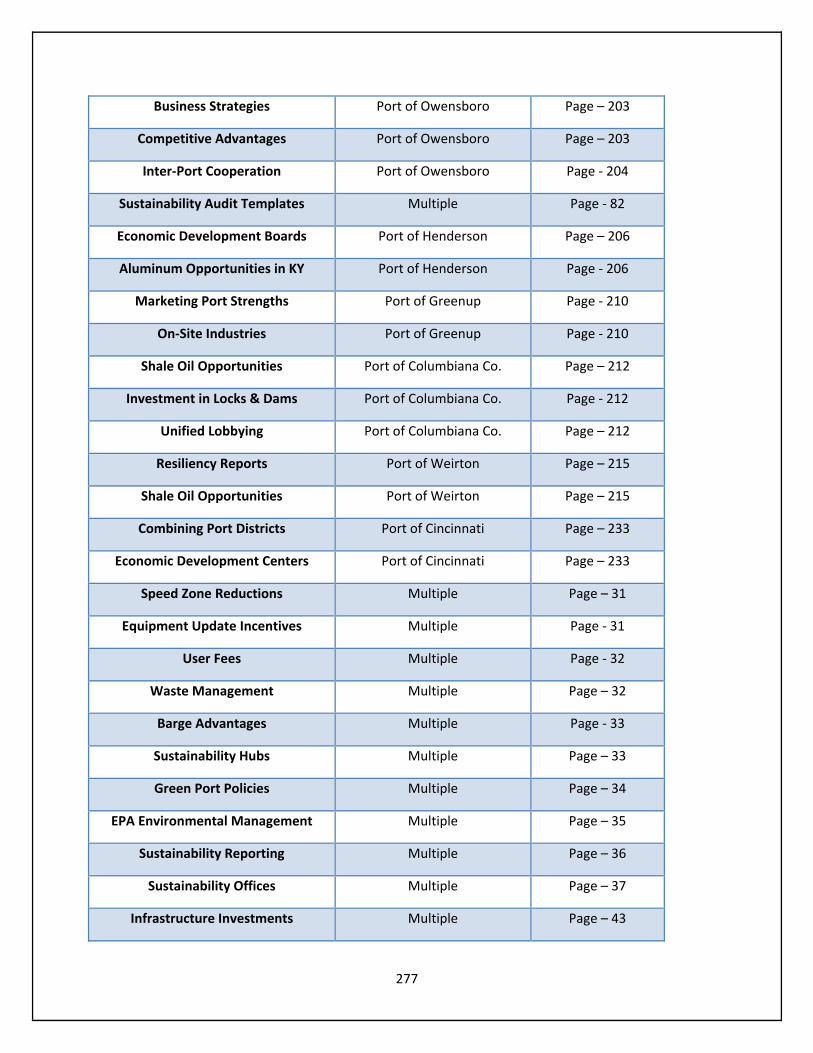
277
Business Strategies Port of Owensboro Page – 203
Competitive Advantages Port of Owensboro Page – 203
Inter‐Port Cooperation Port of Owensboro Page ‐ 204
Sustainability Audit Templates Multiple Page ‐ 82
Economic Development Boards Port of Henderson Page – 206
Aluminum Opportunities in KY Port of Henderson Page ‐ 206
Marketing Port Strengths Port of Greenup Page ‐ 210
On‐Site Industries Port of Greenup Page ‐ 210
Shale Oil Opportunities Port of Columbiana Co. Page – 212
Investment in Locks & Dams Port of Columbiana Co. Page ‐ 212
Unified Lobbying Port of Columbiana Co. Page – 212
Resiliency Reports Port of Weirton Page – 215
Shale Oil Opportunities Port of Weirton Page – 215
Combining Port Districts Port of Cincinnati Page – 233
Economic Development Centers Port of Cincinnati Page – 233
Speed Zone Reductions Multiple Page – 31
Equipment Update Incentives Multiple Page ‐ 31
User Fees Multiple Page ‐ 32
Waste Management Multiple Page – 32
Barge Advantages Multiple Page ‐ 33
Sustainability Hubs Multiple Page – 33
Green Port Policies Multiple Page – 34
EPA Environmental Management Multiple Page – 35
Sustainability Reporting Multiple Page – 36
Sustainability Offices Multiple Page – 37
Infrastructure Investments Multiple Page – 43
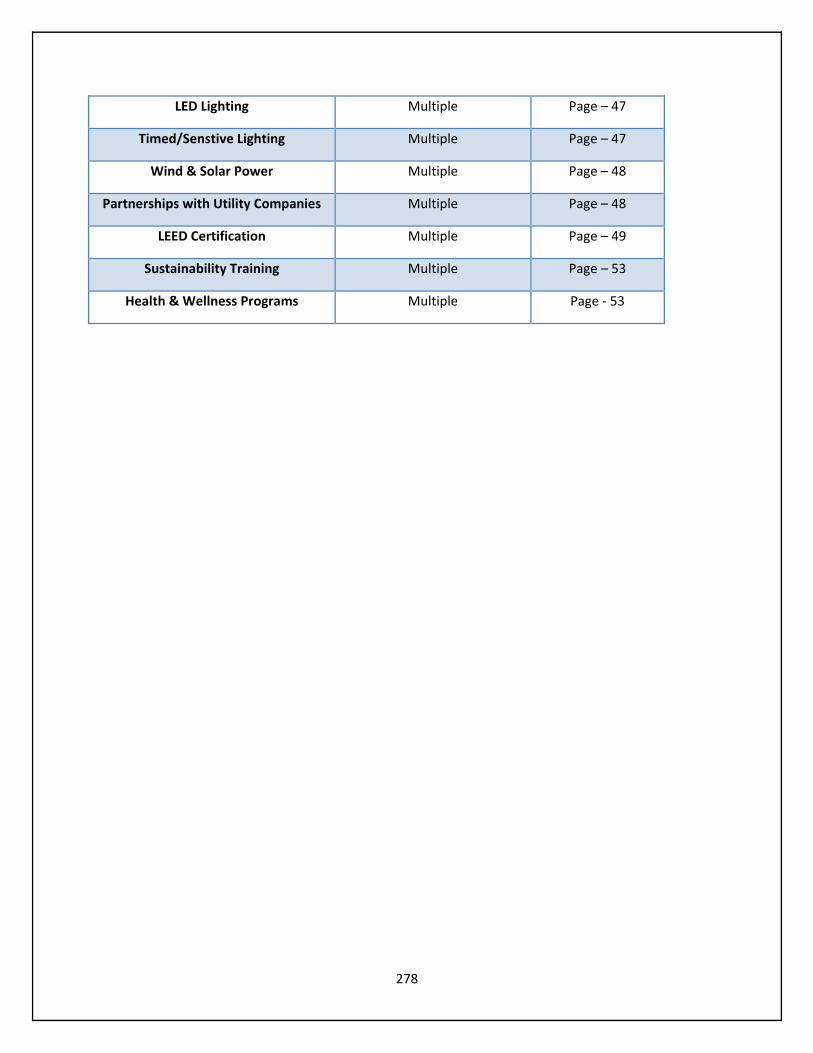
278
LED Lighting Multiple Page – 47
Timed/Senstive Lighting Multiple Page – 47
Wind & Solar Power Multiple Page – 48
Partnerships with Utility Companies Multiple Page – 48
LEED Certification Multiple Page – 49
Sustainability Training Multiple Page – 53
Health & Wellness Programs Multiple Page ‐ 53

279
This page left intentionally blank.

280
Works Cited
Amekudzi, A. A., Jotin Khisty, C., & Khayesi, M. (2009). Using the sustainability footprint model to assess development impacts of transportation systems. Transportation Research Part A: Policy and Practice, 43(4), 339‐348.
American Society of Civil Engineers. (2012) Failure to Act: The Economic Impact of Current Investment Trends in Airports, Inland Waterways, and Marine Ports Infrastructure.
Anastasopoulos, Despina. (2011) “How Will Greek Ports Become Green Ports?” Geo‐Eco‐Marina. Vol. 17, pp. 73 – 87.
Bailey, Diane, Thomas Plenys, Gina Soloman, Todd Campbell, Gail Ruderman Feuer, Julie Masters, and Bella Tonkongy. 2002. Harboring Pollution: The Dirty Truth about U.S. Ports.
Barrett, Scott. (1991) “Environmental Regulation for Competitive Advantage.” Business Strategy Review. Vol. 2, pp. 1 – 15.
Blonigen, Bruce and Wendy Wilson. (2006) New Measures of Port Efficiency Using International Trade Data.
Brady, Kevin, Patrice Henson, and James Fava. (1999) “Sustainability, Eco‐Efficiency, Life‐Cycle Management, and Business Strategy” Environmental Quality Management. Spring, pp. 33 – 54.
Business for Social Responsibility. (2011) Extending Supply Chain Sustainability Metrics to Terminal Operations.
Business for Social Responsibility. (2012) Assessing Terminal Operator Environmental Performance: Assessment Tool Pilot Results.
Cheon, Sanghyun. (2008) “Productive Efficiency of World Container Ports: A Global Perspective.” Transportation Research Record. pp. 10 – 18.
Cheon, Sanghyun, David Dowall, and Dong‐Wook Song. (2009) “Typology of Long‐Term Port Efficiency Improvement Paths: Malmquist Total Factor Productivity for World Container Ports.” Journal of Infrastructure Systems. Vol. 15, pp. 340 – 359.
Cheon, Sanghyun and Elizabeth Deakin. (2010) “Supply Chain Coordination for Port Sustainability: Lessons for New Institutional Design.” Transportation Research Record.
Christmann, Petra. (2000) “Effects of Best Practices of Environmental Management on Cost
Advantage: the Role of Complementary Assets.” Academy of Management Journal. Vol
43, pp. 663 – 680.
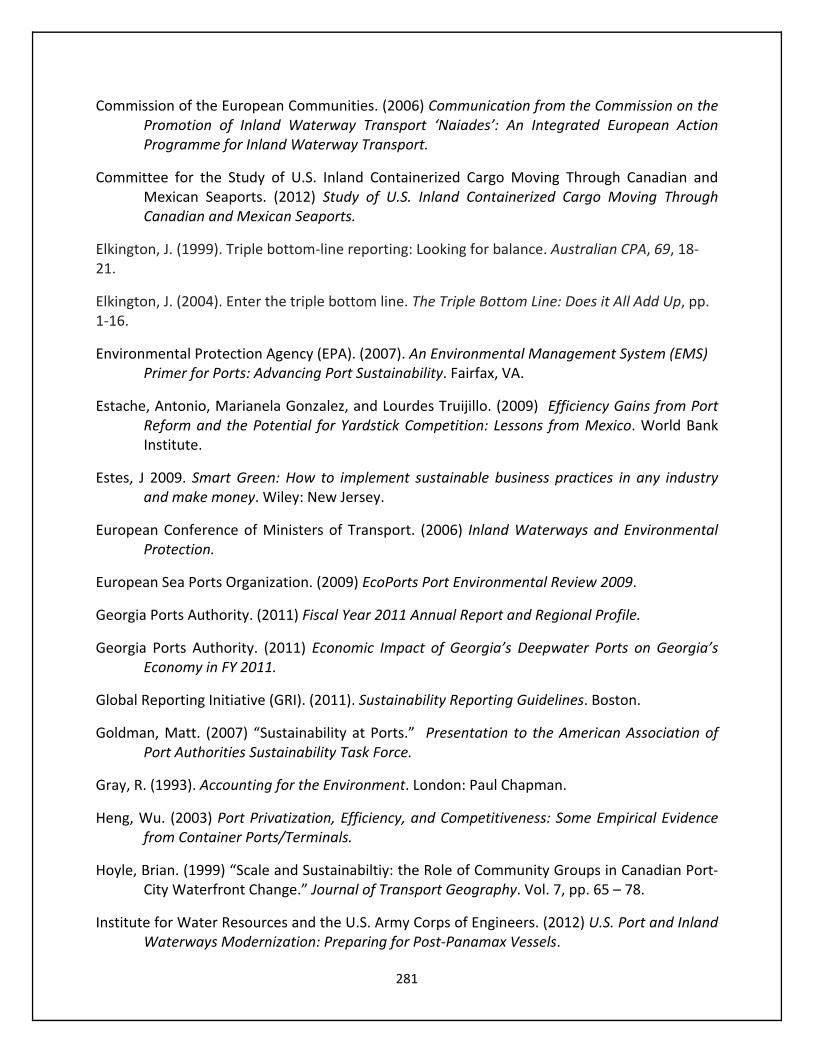
281
Commission of the European Communities. (2006) Communication from the Commission on the Promotion of Inland Waterway Transport ‘Naiades’: An Integrated European Action Programme for Inland Waterway Transport.
Committee for the Study of U.S. Inland Containerized Cargo Moving Through Canadian and Mexican Seaports. (2012) Study of U.S. Inland Containerized Cargo Moving Through Canadian and Mexican Seaports.
Elkington, J. (1999). Triple bottom‐line reporting: Looking for balance. Australian CPA, 69, 18‐21.
Elkington, J. (2004). Enter the triple bottom line. The Triple Bottom Line: Does it All Add Up, pp. 1‐16.
Environmental Protection Agency (EPA). (2007). An Environmental Management System (EMS) Primer for Ports: Advancing Port Sustainability. Fairfax, VA.
Estache, Antonio, Marianela Gonzalez, and Lourdes Truijillo. (2009) Efficiency Gains from Port Reform and the Potential for Yardstick Competition: Lessons from Mexico. World Bank Institute.
Estes, J 2009. Smart Green: How to implement sustainable business practices in any industry and make money. Wiley: New Jersey.
European Conference of Ministers of Transport. (2006) Inland Waterways and Environmental Protection.
European Sea Ports Organization. (2009) EcoPorts Port Environmental Review 2009.
Georgia Ports Authority. (2011) Fiscal Year 2011 Annual Report and Regional Profile.
Georgia Ports Authority. (2011) Economic Impact of Georgia’s Deepwater Ports on Georgia’s Economy in FY 2011.
Global Reporting Initiative (GRI). (2011). Sustainability Reporting Guidelines. Boston.
Goldman, Matt. (2007) “Sustainability at Ports.” Presentation to the American Association of Port Authorities Sustainability Task Force.
Gray, R. (1993). Accounting for the Environment. London: Paul Chapman.
Heng, Wu. (2003) Port Privatization, Efficiency, and Competitiveness: Some Empirical Evidence from Container Ports/Terminals.
Hoyle, Brian. (1999) “Scale and Sustainabiltiy: the Role of Community Groups in Canadian Port‐City Waterfront Change.” Journal of Transport Geography. Vol. 7, pp. 65 – 78.
Institute for Water Resources and the U.S. Army Corps of Engineers. (2012) U.S. Port and Inland Waterways Modernization: Preparing for Post‐Panamax Vessels.
282
Jackson, Donald and John Troxell. (2007) “Leveraging the Strategic Value of the U.S. Inland Waterway System.” USAWC Strategy Research Project.
King, Andrew and Michael Lenox. (2001) “Does it Really Pay to be Green? Accounting for Strategy Selection in the Relationship Between Environmental and Financial Performance.” Journal of Industrial Ecology. Vol. 5, pp. 67 – 85.
Gilman, Sidney. 2003. “Sustainability and National Policy in UK Port Development.” Maritime Policy Management. 275 – 291.
Kassinis, George and Andreas Soteriou. (2003) “Greening the Service Profit Chain: The Impact of Environmental Management Practices.” Journal of Production and Operations Management. Vol. 12, pp. 386 – 403.
Labuschange, Carin, Alan Brent, and Ron van Erck. (2003) “Assessing the Sustainability Performance of Industries.” Journal of Cleaner Production. Vol. 23, pp. 1 – 37.
Lamberton, G. (2005). Sustainability accounting—a brief history and conceptual framework. Accounting Forum, 29(1), 7‐26.
Loucks, O.L., Erekson, O.H., Bol, J.W., Gorman, R.F., Johnson, P.C. and Krehbiel, T.C. 1999. Sustainability Perspectives for Resources and Business. Lewis Publishers.: Boca Raton.
Norman, W., & MacDonald, C. (2004). Getting to the bottom of "triple bottom line". Business Ethics Quarterly, 14(2) 243‐262.
Los Angeles Harbor Department. (2008) “Port of Los Angeles Sustainability Assessment and Plan Formulation.”
Port of Antwerp. (2010) A Sustainability Report for the 21st Century.
Port of Greater Cincinnati Development Authority. (2007) Economic Impact on Greater Cincinnati of Projects Assisted by the Port of Greater Cincinnati Development Authority.
Port of Houston Authority. (2009) 2009 Sustainability Report for the Year Ending December 31, 2009.
Port Metro Vancouver (2010) The Way Forward, Our First Sustainability Report.
Port of Los Angeles. (2010) Carbon Foot‐printing for Ports Guidance Document.
Port of Los Angeles. (2011) Port of Los Angeles Sustainability Report 2011.
Port of San Deigo. (2012) Green Port Program Year in Review 2011 – 2012.
Port of Seattle. (2010) Port of Seattle Environmental Report to the Community.
283
Pil, Fritz and Sandra Rothenberg. (2001) “Lean, Green, and the Quest for Superior Environmental Performance.” Production and Operations Management. Vol. 10, pp. 228 – 243.
Rohaes, Jozef and Gyozo Simongati. (2007) “The Role of Inland Waterway Navigation in a Sustainable Transport System.” Transport. Vol 24, pp. 148 – 153.
Schaltegger, Stefan and Marcus Wagner. (2006) Managing and Measuring the Business Case for Sustainability: Capturing the Relationship between Sustainability Performance, Business Competitiveness and Economic Performance. Greenleaf Publishing.
Schaltegger, Stefan and Terje Synnestvedt. (2002) “The Link Between ‘Green’ and Economic Success: Environmental Management as the Crucial Trigger Between Environmental and Economic Performance.” Journal of Environmental Management. Vol. 65, pp. 339 – 346.
Schaltegger, S., & Burritt, R. L. (2010). Sustainability accounting for companies: Catchphrase or decision support for business leaders?. Journal of World Business, 45(4), 375‐384.
Shaltegger, Stefan and Marcus Wagner. (2011) “Sustainable Entrepreneurship and Sustainability Innovation: Categories and Interactions.” Business Strategy and the Environment. Vol. 20, pp. 222 – 237.
Springett, Delyse. (2003) “An Incitement to Discourse: Benchmarking as a Springboard to Sustainable Development.” Business Strategy and the Environment. Vol. 12, pp. 1 – 11.
Stead, Jean and Edward Stead. (1995) “Eco‐Enterprise Strategy: Standing for Sustainability.” Journal of Business Ethics. Vol. 24, pp. 313 – 329.
Texas Transportation Institute. (2008) A modal comparison of freight transportation effects on the general public.
Tongzon, Jose. (1999) “Efficiency Measurement of Selected Australian and Other International Ports using Data Envelope Analysis.” Transportations Research Part A. Vol. 35, pp. 107 – 122.
Tongzon, Jose. (1994) “Determinants of Port Performance and Efficiency.” Transportations Research Part A. Vol. 29, pp. 245 – 252.
Tueth, M (2010). Fundamentals of sustainable business: a guide for the next 100 years. Hackensack: New Jersey.
United States World Commission on Environment and Development. (1987) “Our Common Future.”.
US Department of Transportation, the Research and Innovative Technology Administration, and the Bureau of Transportation Statistics. (2006) Freight in America: A New National Picture (Washington, DC. U.S. Department of Transportation, January
284
United States Environmental Protection Agency. 2007. “An Environmental Management System Primer for Ports: Advancing Port Sustainability.”
Wagner, Marcus and Stefan Schaltegger. (2004). “How Does Sustainabiltiy Performance Relate to Business Competitiveness?” Sustainability Performance and Business Competitiveness. Greenleaf Publishing.
Zairi, Mohamed and John Peters. (2002) “The Impact of Social Responsibility on Business Performance.” Mangerial Auditing Journal, Vol. 17 Issue 4 pp. 174 – 178.