kentucky traumatic brain & spinal cord injury surveillance ... · kentucky traumatic brain...
TRANSCRIPT

1
Kentucky Traumatic Brain & Spinal Cord Injury Surveillance Project
Fiscal Year 2009 Final Report
1 July 2009
This project is located at the Kentucky Injury Prevention and Research Center, University of Kentucky, and funded by the Kentucky Traumatic Brain Injury Trust Fund
under the Cabinet for Health and Family Services Department of Aging and Independent Living.

2
FOR MORE INFORMATION This report was prepared by Shannon Beaven and Michael Singleton of the Kentucky Injury Prevention and Research Center (Director: Dr. Julia Costich), with funding from the Kentucky Traumatic Brain Injury Trust Fund Board. Data requests, questions, or other correspondence should be directed to the address/phone numbers below. Address: 333 Waller Avenue, Suite 206 Lexington, KY 40504 Telephone: (859) 257-4750 Fax: (859) 257-3909 E-mail: [email protected]
3
FIGURES AND TABLES Figures Page 1. Number of TBI cases by county 17 2. Age-adjusted incidence rate of TBI by county 18 3. Number of cases listed in Tennessee TBI registry for Kentucky
residents, by county 19 4. Number of ABI cases by county 20 5. Age-adjusted incidence rate of ABI by county 21 6. Mechanism of injury for self-pay TBI 22 7. Mechanism of injury for TBI having ‘Commercial Insurance’ as
primary payer 22 8. Mechanism of injury for TBI having ‘Government’ as primary payer 23 9. Mechanism of injury for TBI having ‘Worker’s Compensation’ as
primary payer 23 10. Mechanism of injury for TBI having ‘HMO’ as primary payer 24

4
Tables Page 1. TBI by age 25 2. TBI by gender 25 3. Leading causes of TBI, all ages 25 4. Leading causes of TBI for ages 0-4 26 5. Leading causes of TBI for ages 5-14 26 6. Leading causes of TBI for ages 15-24 26 7. Leading causes of TBI for ages 25-44 27 8. Leading causes of TBI for ages 45-64 27 9. Leading causes of TBI for ages 65+ 27 10. Incidence of TBI by county, sorted by county name 28 11. Incidence of TBI by county, sorted by frequency 29 12. Incidence of TBI by county, sorted by age-adjusted rate 30 13. Hospital discharges by disposition for non-fatal TBI 31 14. Length of stay for hospitalized TBI 31 15. Barrell Matrix Type I/II/III TBI by mechanism for non-fatal TBI 31 16. Primary payers for hospitalized TBI 32 17. Work related TBI 32 18. Overall Injury Severity Score (ISS) for non-fatal TBI by
mechanism 32 19. ABI by age 33 20. ABI by gender 33 21. Incidence of ABI by county, sorted by county name 34 22. Incidence of ABI by county, sorted by frequency 35 23. Incidence of ABI by county, sorted by age-adjusted rate 36 24. Causes of ABI 37 25. Anoxia/hypoxia by age group 37 26. Exposure to toxic substances by age group 37 27. Injury-related causes of ABI 38 28. Length of stay for hospitalized ABI 38 29. Hospital discharge disposition for non-fatal ABI 38 30. Primary payers for hospitalized ABI 39 31. Work related ABI 39 32. SCI by age 39 33. SCI by gender 39 34. Leading causes of SCI, all ages 40 35. Length of stay for hospitalized SCI 40 36. Hospital discharge disposition for non-fatal SCI 40 37. Primary payers for hospitalized SCI 41 38. Work related SCI 41

5
Introduction In 2006, traumatic brain injury (TBI) was a factor in the deaths of 985 Kentuckians, as well as the live discharges of 3,552 Kentuckians from licensed, acute-care hospitals across the state. TBI played a role in the death or hospitalization of over 12 state residents per day. Acquired brain injury (ABI) was diagnosed in 1,485 deaths and 3,689 live discharges (more than 14 ABI per day), and spinal cord injury (SCI) was reported in 61 deaths and 195 live discharges, or almost 5 SCI per week. See Tables 1, 19 and 32 for details. Our results indicate a need to focus prevention efforts on the following causes and target populations:
Motor vehicle traffic crashes (TBI and SCI), especially among ages 15-24 Falls (TBI and SCI), especially among ages 0-4 and 65 and older Anoxia/hypoxia (ABI), especially among ages 45 and older Exposure to toxic substances (ABI), especially among ages 25-44
Motor vehicle traffic crashes in persons aged 15-24, and falls in persons aged 65 and older, again emerged as the leading causes of TBI. Anoxia/hypoxia was most common among persons aged 65 and older, whereas exposure to toxic substances was greatest among those aged 25-44. Overall, these two were the cause of 99% of fatal ABI and 95% of nonfatal, hospitalized ABI. Geographically, rates of TBI and ABI were both highest in eastern Kentucky. The west-central part of the state is also high for TBI, and the western part is high for ABI. Furthermore, the following counties have been identified as top priorities for prevention activities and programs. These counties have ranked in the top quarter of Kentucky counties in terms of both the number of cases reported and the age-adjusted rate per 100,000 residents in at least four out of the last five years and can be considered excellent candidates for an in-depth pilot study leading to interventions to prevent and control TBI and ABI:
TBI: Letcher and Perry ABI: McCracken, Hopkins, Knox, and Perry SCI: There were not enough total reported cases of SCI statewide to
support a reliable geographic analysis.

6
Jefferson county would also be a good choice for an in-depth pilot study as it represented 19% of all TBI in 2006 and had an age-adjusted rate that was higher than the statewide rate, and over 50% higher than the rate for Fayette county, which had the second highest number of TBI. Methods Data collection Data used for surveillance were all received electronically. Hospital Discharge Data files from the Kentucky Office of Health Policy are routinely received by the Kentucky Injury Prevention and Research Center (KIPRC) for surveillance purposes. The National Center for Health Statistics’ Multiple Cause of Death File (NCHS Death) was obtained through the state Vital Statistics Registrar, as this data set contains information on up to 20 supplemental causes of death, whereas the Kentucky computerized death certificate data file generally includes only the external cause of injury (E-code) for trauma cases. In addition to these data sets, we were able to obtain data on Kentucky residents treated in Tennessee from that state’s TBI registry. We have reported the number of TBI identified on that dataset. However, those cases were not included in the data linkage or in the final count or rates. Traumatic brain injury case definition The Centers for Disease Control and Prevention (CDC) have established standards for TBI case identification (CDC, 1995). Hospitals commonly use ICD-9 codes for injury coding. For death certificates, state and federal authorities use ICD-10 codes. The following ICD-9 diagnosis codes (n-codes) were used for identifying TBI in HDD:
Fracture of vault or base of skull: 800.0-801.9 Other, unqualified, and multiple fractures of skull: 803.0-804.9 Intracranial injury, including concussion, cerebral laceration, subdural
hemorrhage, unspecified intracranial injury, etc: 850.0-854.1 Head injury, unspecified: 959.01
ICD-10 codes were used to identify TBI in NCHS Death records:
Open wound of head: S01.0-S01.9 Fracture of skull and facial bones: S02.0-S02.1, S02.3, S02.7-S02.9 Intracranial injury: S06.0, S06.2-S06.9 Crushing injury of head: S07.0-S07.1, S07.8-S07.9 Other unspecified injuries of head: S09.7-S09.9 Open wounds involving head with neck: T01.0 Fractures involving head with neck: T02.0

7
Crushing injuries involving head with neck: T04.0 Injuries of brain and cranial nerve with injuries of nerves and spinal cord at
neck level: T06.0 Sequelae of injuries of head: T90.1-T90.2, T90.4-T90.5, T90.8-T90.9
If one or more of these codes was found in any of the diagnosis code fields in HDD or NCHS Death, the record was determined to be a TBI. Acquired brain injury case definition In addition to CDC-defined TBI, there are many brain injuries that have non-traumatic etiologies. These we have classified as ABI. Because these diagnoses are not included in the CDC definition of TBI, they have been linked and analyzed separately. These conditions were also identified by ICD-9 diagnosis codes, as follows:
Anoxia/Hypoxia: 348.1, 668.2, 669.4, 768.1, 768.5, 768.6, 768.9, 799.0, 994.1, 994.7, 997.0
Allergy/Anaphylaxis: 995.0, 999.4, 999.5 Acute Medical Clinical Incidents: 320.0-320.9, 321.0-321.8 Toxic Substances: 964.2, 967.0-967.9, 968.0-968.9, 980.0-980.9, 985,
986, 988.0-988.2, 989.0, 995.4, 995.5, 998.0
The following ICD-10 codes were used to identify ABI in NCHS Death records:
Anoxia/Hypoxia: G93.1, O29.2, O74.3, O75.4, O89.2, P20.1, P21.0, P21.1, P21.9, R09.0, T71, T75.1
Allergy/Anaphylaxis: T78.0, T78.2, T80.5, T80.6, T88.1, T88.6 Acute Medical Clinical Incidents: G00.0, G00.1, G00.2, G00.3, G00.8,
G01, G07, G02.0, G02.1, G02.8, G04.2, G04.8, G05.0, G05.1, G06.2 Toxic Substances: G03.8, G03.9, G97.1, G97.2, G97.8, G97.9, N14.3,
R29.1, T40.5, T41.0, T41.1, T41.2, T41.3, T41.4, T42.3, T42.4, T42.6, T42.7, T45.5, T49.0, T51.0, T51.1, T51.2, T51.3, T51.8, T51.9, T56.1, T56.2, T56.3, T56.4, T56.5, T56.6, T56.7, T56.8, T57.0, T57.2, T57.3, T57.8, T58, T60.4, T61.9, T62.0, T62.1, T62.2, T62.8, T62.8, T64, T65.0, T65.8, T65.9, T81.1, T88.2, T88.5
If one or more of these codes was found in any of the diagnosis code fields in HDD or NCHS Death, the record was classified as an ABI. Spinal cord injury case definition The CDC defines SCI by the following ICD-9 diagnosis codes (CDC, 1995):
Fracture of vertebral column with spinal cord injury: 806.0-806.9 Spinal cord injury without evidence of spinal bone injury: 952.0-952.9

8
The following ICD-10 codes were used to identify SCI in NCHS Death records:
Fracture of neck: S12.0-S12.2, S12.7, S12.9 Fracture of thoracic vertebra and thoracic spine: S22.0-S22.1 Fracture of lumbar spine: S32.0, S32.7 Injury of nerves and spinal cord at neck level: S14.0-S14.1 Injury of nerves and spinal cord at thorax level: S24.0-S24.1 Injury of nerves and lumbar spinal cord at abdomen, lower back, and
pelvis level: S34.0-S34.1, S34.3 Fracture of spine, level unspecified: T08 Injury of nerves and spinal cord involving other multiple body regions:
T06.1 Injury of spinal cord, level unspecified: T09.3 Sequelae of injury of spinal cord: T91.3
For this report, SCI records had to contain one of these codes in one of the first three diagnosis code fields in HDD or NCHS Death data. Eliminating duplicate records Probabilistic data linkage (PDL) has been described in scholarly depth by Jaro (1995, 1989). Briefly, PDL is a statistical method for matching records in unrelated databases. By comparing the frequencies of all individuals’ characteristics, such as age, birth date, and zip code, the data linkage software decides which records in the different databases probably pertain to the same person. Thus, we avoid counting these cases more than once when calculating incidence. Standardized variables were created from variables necessary for linkage. These included dates (of injury, admission, discharge, death, birth), geographic variables (resident county, resident state, zip codes), and demographic characteristics (age, gender, race, martial status) and others (hospital ID, TBI indicator, cause of injury). Self match: As a first step, we matched each file against itself to determine the extent of duplication of cases within the datasets. We found that less than 0.5% of the HDD records, and almost none of the NCHS death records, appeared to be a duplicate. In other words, duplication of cases within the datasets appeared to be minimal. File linkages and master dataset: Next we linked the HDD and NCHS death datasets. We then created a master dataset containing two sections: one for the HDD portion of the record and one for the NCHS death portion. For example, if a case was identified by data linkage in both the HDD and NCHS Death files, the master file would contain a single record with an HDD and a NCHS Death

9
portion. If it was found in the HDD only, the master file would contain a single record with only the HDD portion populated, and so on. Create analytical file: From the master dataset we created a simplified dataset from which the tables and figures in this report were derived. In doing so we made several choices which we outline briefly here. First, we defined a master record to represent a TBI, ABI, or SCI case if there was a TBI, ABI, or SCI diagnosis on either of the two files. Second, we declared a master record to represent a fatality if there was an NCHS death record present, or if there was a HDD record with a patient disposition indicating death. Third, we established rules of precedence for the data source. For fatalities, if a NCHS death record was found its values were used to populate the analytical file. If a death was indicated on the HDD but no death record was found, then the HDD files were used to populate the analytical file. Using these rules we reduced the master file to an analytical file with a single value for each data element (age, gender, diagnosis codes, etc.). Incidence rates Crude incidence rates were calculated for each injury type by dividing the number of injuries by 4,206,074, the estimated 2006 population of Kentucky according to the Kentucky State Data Center, and then multiplying by 100,000. This figure represents the number of TBI, ABI, or SCI that occurred per 100,000 residents of Kentucky. Age-adjusted rates were calculated using the Year 2000 Standard Population. Data analysis All data analysis, including mapping, was performed using SAS Version 9.1.
10
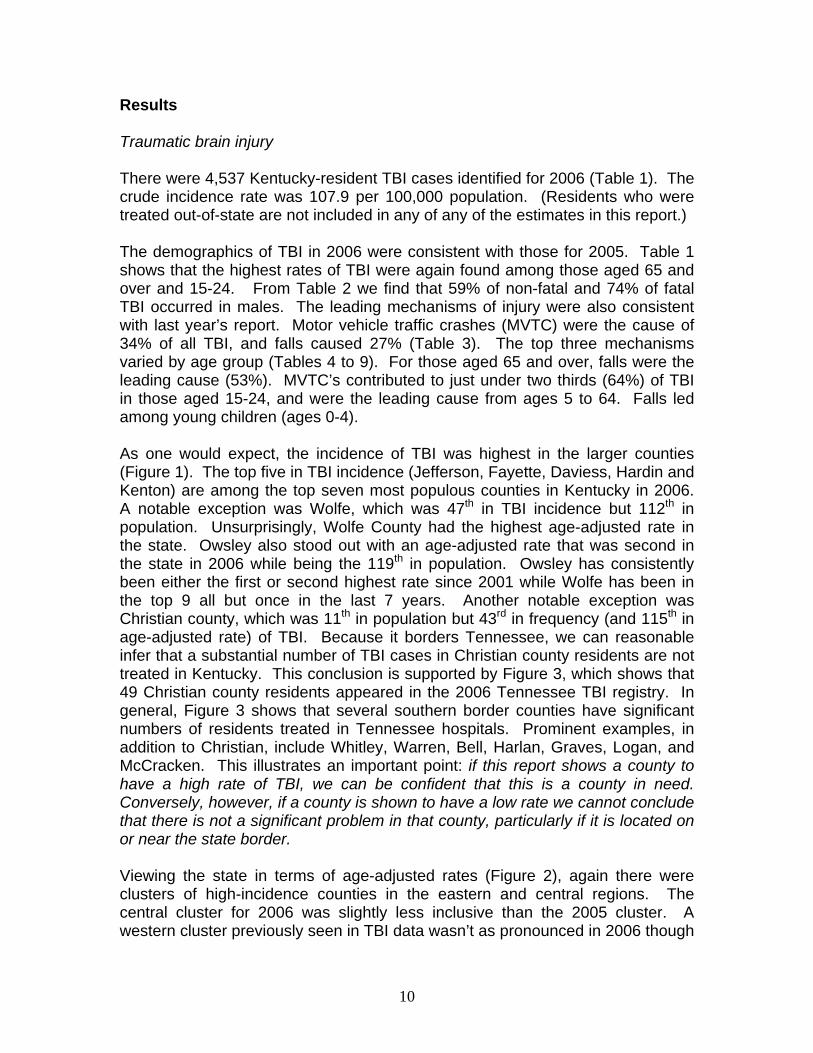
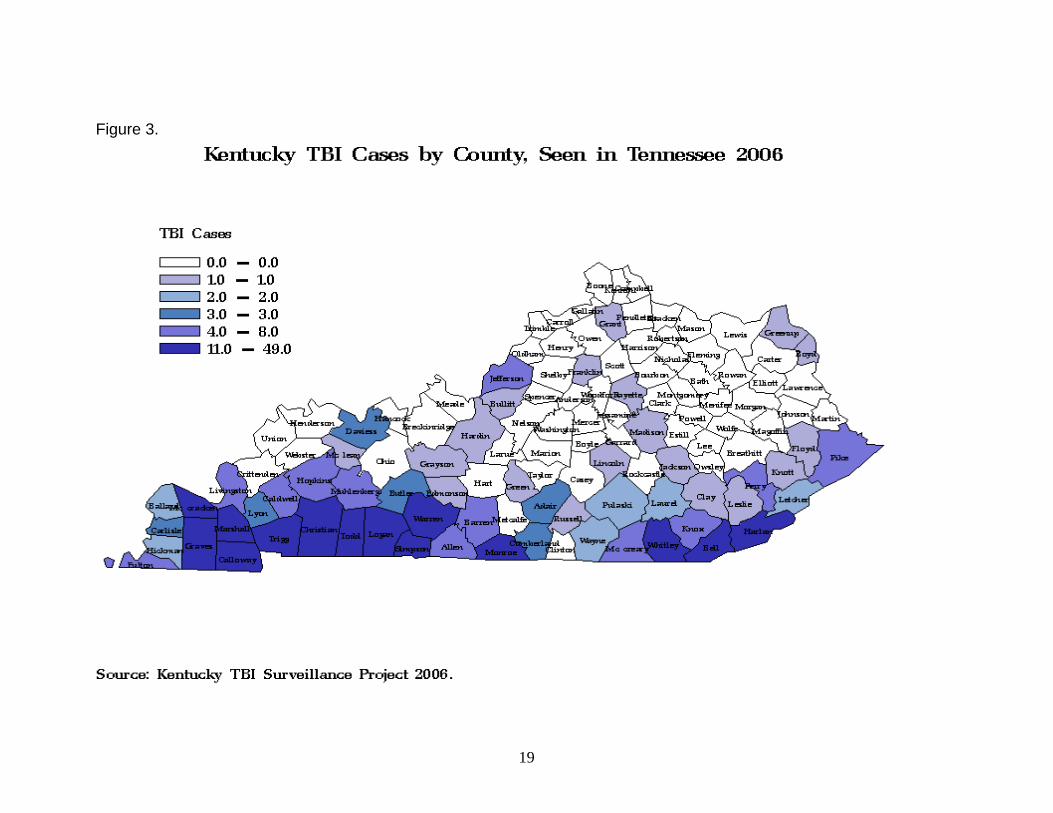
Results Traumatic brain injury There were 4,537 Kentucky-resident TBI cases identified for 2006 (Table 1). The crude incidence rate was 107.9 per 100,000 population. (Residents who were treated out-of-state are not included in any of any of the estimates in this report.) The demographics of TBI in 2006 were consistent with those for 2005. Table 1 shows that the highest rates of TBI were again found among those aged 65 and over and 15-24. From Table 2 we find that 59% of non-fatal and 74% of fatal TBI occurred in males. The leading mechanisms of injury were also consistent with last year’s report. Motor vehicle traffic crashes (MVTC) were the cause of 34% of all TBI, and falls caused 27% (Table 3). The top three mechanisms varied by age group (Tables 4 to 9). For those aged 65 and over, falls were the leading cause (53%). MVTC’s contributed to just under two thirds (64%) of TBI in those aged 15-24, and were the leading cause from ages 5 to 64. Falls led among young children (ages 0-4). As one would expect, the incidence of TBI was highest in the larger counties (Figure 1). The top five in TBI incidence (Jefferson, Fayette, Daviess, Hardin and Kenton) are among the top seven most populous counties in Kentucky in 2006. A notable exception was Wolfe, which was 47th in TBI incidence but 112th in population. Unsurprisingly, Wolfe County had the highest age-adjusted rate in the state. Owsley also stood out with an age-adjusted rate that was second in the state in 2006 while being the 119th in population. Owsley has consistently been either the first or second highest rate since 2001 while Wolfe has been in the top 9 all but once in the last 7 years. Another notable exception was Christian county, which was 11th in population but 43rd in frequency (and 115th in age-adjusted rate) of TBI. Because it borders Tennessee, we can reasonable infer that a substantial number of TBI cases in Christian county residents are not treated in Kentucky. This conclusion is supported by Figure 3, which shows that 49 Christian county residents appeared in the 2006 Tennessee TBI registry. In general, Figure 3 shows that several southern border counties have significant numbers of residents treated in Tennessee hospitals. Prominent examples, in addition to Christian, include Whitley, Warren, Bell, Harlan, Graves, Logan, and McCracken. This illustrates an important point: if this report shows a county to have a high rate of TBI, we can be confident that this is a county in need. Conversely, however, if a county is shown to have a low rate we cannot conclude that there is not a significant problem in that county, particularly if it is located on or near the state border. Viewing the state in terms of age-adjusted rates (Figure 2), again there were clusters of high-incidence counties in the eastern and central regions. The central cluster for 2006 was slightly less inclusive than the 2005 cluster. A western cluster previously seen in TBI data wasn’t as pronounced in 2006 though

11
this does not take into account the cases seen in Tennessee. One useful way of determining priority counties is to find those that ranked among the top thirty in both frequency and age-adjusted rate of TBI. For 2006 there were nine such counties: Clay, Grayson, Knox, Laurel, Letcher, Lincoln, Perry, Pike, and Taylor. Tables 10 through 12 show the frequency and rates of TBI by county, ranked in order by county, frequency, and age-adjusted rate respectively. The length of stay (LOS) for hospitalized TBI (n=3,552) ranged from 1 day to 300 days. The mean LOS was 6.9 days with a median LOS of 4 days (Table 14). Table 13 indicates that 1,241 non-fatal TBI discharges had a disposition other than “routine”. The three most frequent non-routine discharges were “skilled nursing facility”, “home health”, and “inpatient – other short term hospital”. A total of 774 discharges had one of these three dispositions. Table 15 presents an analysis of TBI in terms defined by the Barell Injury Diagnosis Matrix (Barell et al 2002). The definitions are as follows:
A Type I TBI is one in which there is “recorded evidence of an intracranial injury or a moderate or a prolonged loss of consciousness (LOC), Shaken Infant Syndrome, or injuries to the optic nerve pathways.”
A Type 2 TBI is one in which there is “no recorded evidence of intracranial injury, and LOC of less than one hour, or LOC of unknown duration, or unspecified level of consciousness.”
A Type 3 TBI is one in which there is “no evidence of intracranial injury and no LOC.”
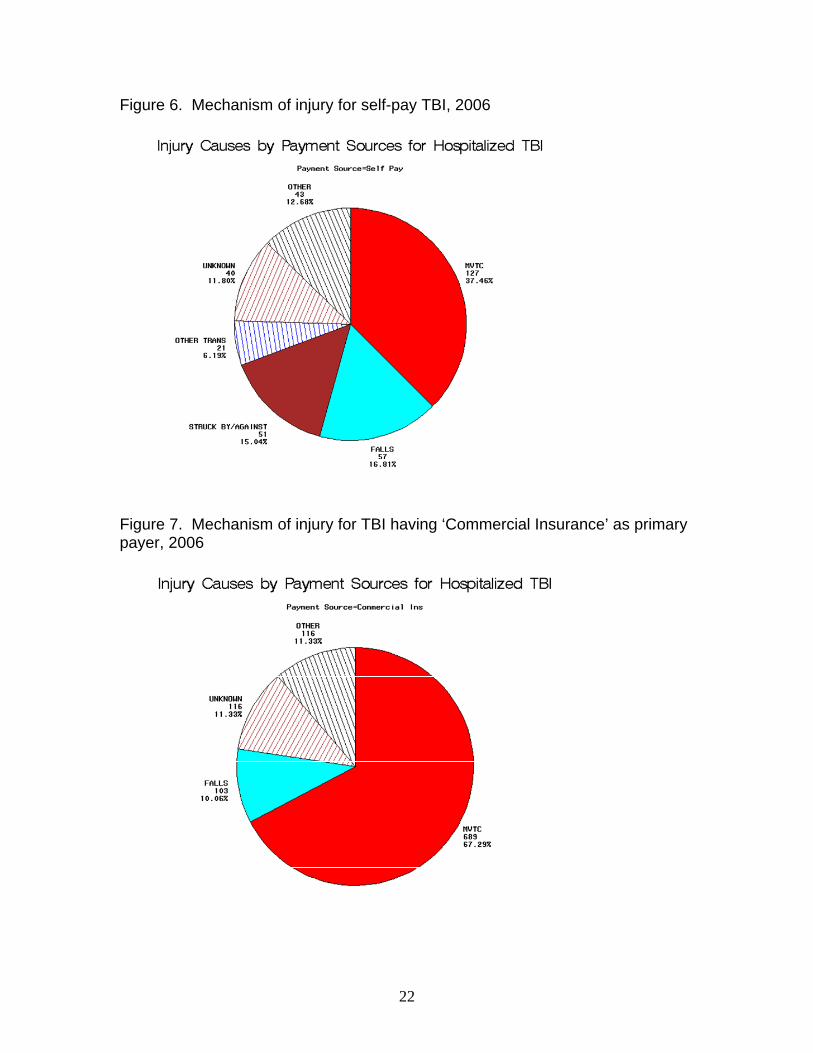
From this Table we see that 1,814 (75%) non-fatal TBI discharges had a principal diagnosis indicating a “Type I” TBI. Falls were the highest contributor to these types of injuries (Type I TBI). Table 17 shows that 35 fatal TBI’s were work related and 135 non-fatal TBI’s involved work related incidents. The length of stay for work related, non-fatal TBI’s varied from 1 to 135 days and had a mean of 8.8 days. Government (42%) or commercial (27%) sources were the primary payers billed for acute care charges in 69% of nonfatal TBI, based on discharges identified from the HDD (Table 16). Commercial payers were billed almost $56 million in 2006, and government payers almost $43 million. These charges show large increases in both commercial and government payer charges when compared to 2005 totals. Please note that the amount billed by the hospital will generally be larger than the amount actually paid after adjudication of the claim. Figures 6 through 10 demonstrate that the leading mechanism of TBI varies according to the primary insurance source billed. For example, MVTC was the mechanism of injury in 67% of TBI for which ‘Commercial Insurance’ was the primary payer billed. Falls were the leading mechanism of TBI when

12
“Government” was the primary payer, at 50%. These insurers should be viewed as stakeholders in programs to prevent those injuries that result in a substantial portion of their claims. Table 18 shows that over half (1,861) of non-fatal TBI discharges had an injury severity score (ISS) of “severe” or “critical”. It must be noted that ISS is based on injuries to six designated body regions, not only head injuries. It is therefore possible for a high ISS to result from, for example, a relatively mild head injury plus major injuries to the torso and/or lower extremities. So a high ISS does not necessarily indicate a severe head injury. Looking only at the injury score associated with the head region, just over 4 out of 10 non-fatal TBI discharges were given an injury score of severe or higher. This score is specific to the head region and does not include injuries to other body regions. Acquired brain injury There were 5,174 ABI cases for Kentucky residents identified in 2006 (Table 19). The crude incidence rate for 2006 was 123.0 per 100,000 population. These numbers appear to be quite an increase in both rate and number of cases of ABI for 2006 versus 2005 (3,796 total ABI cases with a rate of 91.0 per 100,000). The increase can be found in non-fatal ABI, specifically Anoxia/Hypoxia cases. This may be attributed to a change in diagnosis coding made between 2005/2006 and may not be indicative of an actual jump in cases but instead reflect a more accurate coding of ABI. Further investigation of this increase and the coding change is necessary to draw any conclusions. ABI was skewed toward the middle and older age groups, with 90% occurring in persons aged 25 and older, compared to 77% of TBI (Table 19). Also in contrast to TBI, of which 62% occurred in males, ABI affected the genders in closer to equal proportions (Table 20). Over two thirds (71%) of ABI were nonfatal, compared to 78% of TBI. As shown in Table 24, nearly all ABI (99% of fatal and 94% of nonfatal, hospitalized) were a result of either anoxia/hypoxia or exposure to toxic substances (ETS). Anoxia/hypoxia tends to affect older people (ages 45 and over) considerably more often than younger people, where as ETS affects persons 15 and older, and is most common among persons aged 25-44 (Tables 25 and 26). Asphyxia was the leading cause in both fatal and non-fatal anoxia/hypoxia. Complications related to medical care was the second leading cause in nonfatal anoxia/hypoxia. These complications were much less common in fatal cases. Alcohol and drugs were involved in most of the nonfatal ETS. Drugs were common in fatal ETS as well, as were carbon monoxide poisoning and postoperative shock. Among those ABI discharges that were reported to have some relationship with an injury (i.e., included an E-code), two thirds (66%) of the non-fatal cases were

13
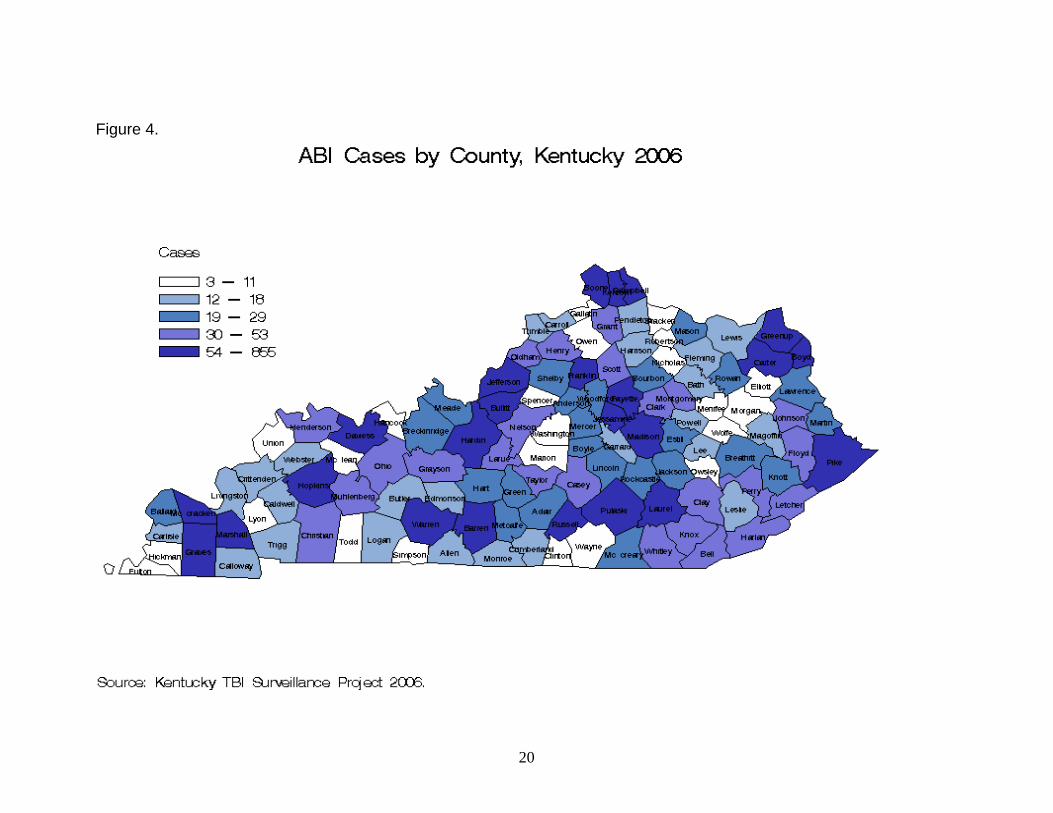
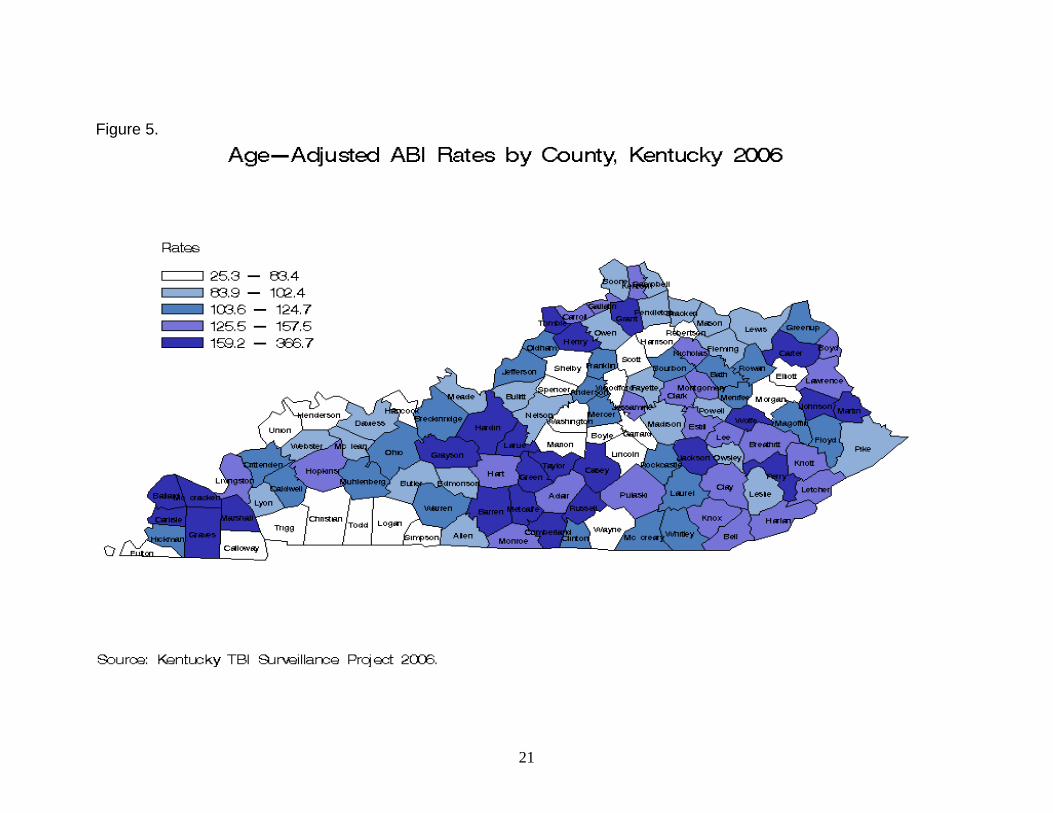
poisonings. Poisoning, suffocation or drowning were indicated in over 7 out of 10 of the fatal, injury-related ABI (Table 27). (Note that we are making a distinction here between “injury-related” and traumatic, with trauma being considered one of several forms of injury. ABI is, by the statutory definition, non-traumatic). In general, as with TBI, the more populous counties had high numbers of ABI (Figure 4). However, with the exception of Hardin (5th), the ten most populous counties did not appear in the top forty counties when ranked by age-adjusted rate. Hardin was the sole county found in this category in 2005 as well though ranked 31st in age-adjusted rate for the year. The counties with the highest rates were concentrated in central Kentucky with another cluster showing in the western region (Figure 5). Eastern Kentucky, though not showing the highest rates, does show high rates over a larger area. As with TBI, we located the counties that ranked among the top thirty in both frequency and age-adjusted rate of ABI. There were 12 counties that met both criteria in 2006: Barren, Boyd, Carter, Graves, Grayson, Hardin, Marshall, McCracken, Perry, Pulaski, Russell and Taylor. These can be considered leading candidates for further study and intervention. Tables 21 through 23 show the frequency and rates of ABI cases by county, ranked in order by county, frequency, and age-adjusted rate respectively. The length of stay (LOS) for hospitalized ABI patients varied from 1 day to 378 days. The mean LOS was 8.3 days with a median of 5 days (Table 28). Table 29 indicates that 48% of ABI discharges were other than “routine” – i.e., to destinations other than the home. The three most frequent non-routine discharges were “skilled nursing facility”, “home health”, and “inpatient – other type of facility”. Government (61%) or commercial (14%) sources were the primary payer billed for hospital charges in three quarters of non-fatal ABI, based on discharges identified from the HDD (Table 30). Government payers were billed almost $74 million in 2006, and commercial payers close to $18 million. Spinal cord injury SCI patients often are readmitted for problems stemming from the original injury. In an effort to avoid double counting in such cases, for SCI we looked only at the first three listed diagnosis codes. There were 256 SCI cases for Kentucky residents identified in 2006 (Table 32). The crude incidence rate was 6.1 per 100,000 population. Age groups 65 and over had the highest age-specific rates (14.3 per 100,000) of SCI (Table 32). Persons aged 15-64 had lower rates but were similar across the groups. Males had nearly double the SCI rate of females, and had almost two thirds of both fatal and non-fatal SCI (Table 33).
14
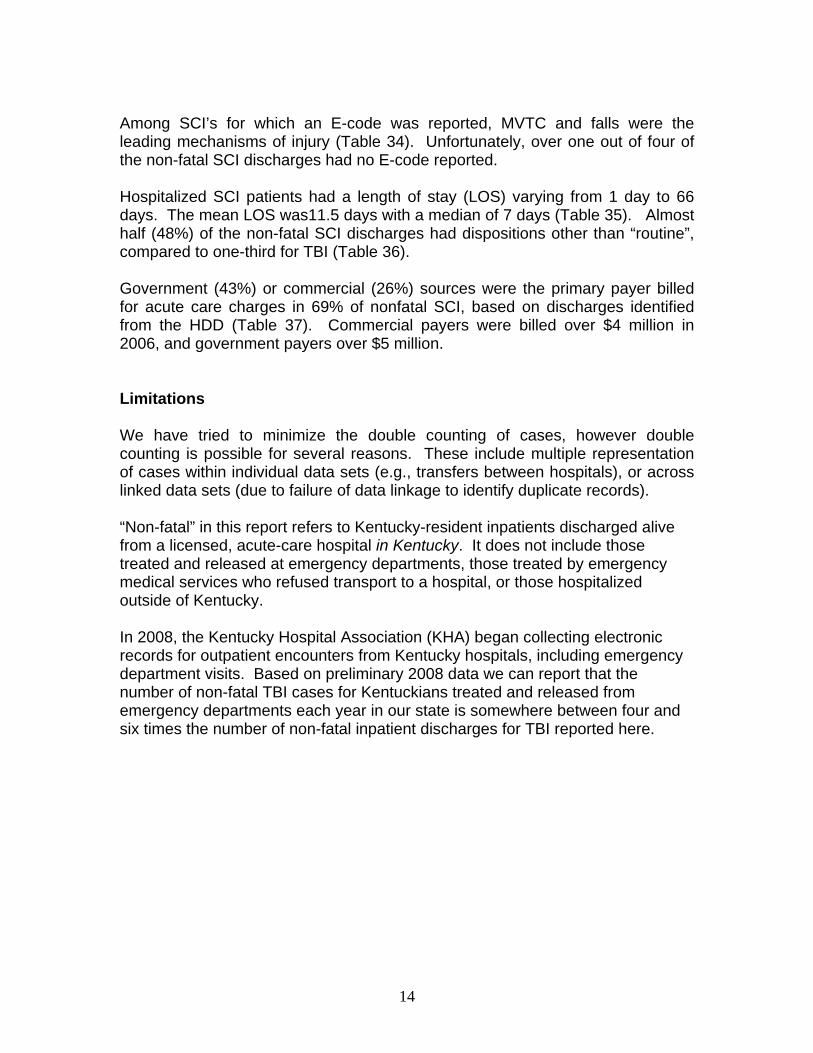
Among SCI’s for which an E-code was reported, MVTC and falls were the leading mechanisms of injury (Table 34). Unfortunately, over one out of four of the non-fatal SCI discharges had no E-code reported. Hospitalized SCI patients had a length of stay (LOS) varying from 1 day to 66 days. The mean LOS was11.5 days with a median of 7 days (Table 35). Almost half (48%) of the non-fatal SCI discharges had dispositions other than “routine”, compared to one-third for TBI (Table 36). Government (43%) or commercial (26%) sources were the primary payer billed for acute care charges in 69% of nonfatal SCI, based on discharges identified from the HDD (Table 37). Commercial payers were billed over $4 million in 2006, and government payers over $5 million. Limitations We have tried to minimize the double counting of cases, however double counting is possible for several reasons. These include multiple representation of cases within individual data sets (e.g., transfers between hospitals), or across linked data sets (due to failure of data linkage to identify duplicate records). “Non-fatal” in this report refers to Kentucky-resident inpatients discharged alive from a licensed, acute-care hospital in Kentucky. It does not include those treated and released at emergency departments, those treated by emergency medical services who refused transport to a hospital, or those hospitalized outside of Kentucky. In 2008, the Kentucky Hospital Association (KHA) began collecting electronic records for outpatient encounters from Kentucky hospitals, including emergency department visits. Based on preliminary 2008 data we can report that the number of non-fatal TBI cases for Kentuckians treated and released from emergency departments each year in our state is somewhere between four and six times the number of non-fatal inpatient discharges for TBI reported here.

15
References Dryden DM, Saunders LD, Rowe BH, May LA, Yiannakoulias N, Svenson LW, Schopflocher DP, Voaklander DC. The epidemiology of traumatic spinal cord injury in Alberta, Canada. Can J Neurol Sci, 2003; 30(2): 113-121. Jaro M. Advances in record-linkage methodology as applied to matching the 1985 census of Tampa, Florida. Journal of the American Statistical Association, 1989; 84(406): 16-21. Jaro M. Probabilistic linkage of large public health data files. Statistics in Medicine, 1995; 14: 491-498. PMIC. International Classification of Diseases: 9th Revision, Clinical Modification (5th Edition). Los Angeles, California: Practice Management Information Corporation, 1998. Sekhon LHS, Fehlings MG. Epidemiology, demographics, and pathophysiology of acute spinal cord injury. Spine, 2001; 26(24S): S2-S12. Singleton M. Deaths of Kentucky Residents Due to Unintentional Poisoning and Poisoning of Undetermined Intent. http://www.kiprc.uky.edu/projects/State_inj_surveillance/pubs.htm Kentucky Injury Prevention and Research Center, August 2003. Thomas C, Butler J, Davies M, Johnson R. State Injury Indicators Report, Second Edition – 1999 Data. Atlanta (GA): Centers for Disease Control and Prevention, National Center for Injury Prevention and Control, 2004. CDC. Thurman DJ, Sniezek JE, Johnson D, Greenspan A, Smith SM. Guidelines for Surveillance of Central Nervous System Injury. Atlanta: Centers for Injury Prevention and Control, 1995. CDC. Traumatic brain injury—Colorado, Missouri, Oklahoma, and Utah, 1990-1993. MMWR, 1997; 46(1): 8-11. CDC. Recommended Framework for Presenting Injury Mortality Data. MMWR 1997; 46 (No. RR-14). CDC. Unintentional and Undetermined Poisoning Deaths – 11 States, 1990-2001. MMWR 2004;53:233-237.

16
References Thurman DJ, Alverson C, Dunn KA, Guerrero J, Sniezek JE. Traumatic brain injury in the United States: a public health perspective. Journal of Head Trauma Rehabilitation, 1999; 14(6): 602-615. Barell V, Aharonson-Daniel L, Fingerhut LA, Mackenzie EJ, Ziv A, Boyko V, Abargel A, Avitzour M, Heruti R. An introduction to the Barell body region by nature of injury diagnosis matrix. Injury Prevention, June 2002 v8 i2 p91(6). WHO. International Statistical Classification of Diseases and Related Health Problems – 10 Revision. Geneva, Switzerland: World Health Organization, 1992.

17
Figure 1.

18
Figure 2.
19
Figure 3.
20
Figure 4.
21
Figure 5.
22
Figure 6. Mechanism of injury for self-pay TBI, 2006
Figure 7. Mechanism of injury for TBI having ‘Commercial Insurance’ as primary payer, 2006

23
Figure 8. Mechanism of injury for TBI having ‘Government’ as primary payer, 2006
Figure 9. Mechanism of injury for TBI having ‘Worker’s Compensation’ as primary payer, 2006

24
Figure 10. Mechanism of injury for TBI having ‘HMO’ as primary payer, 2006

25
TABLES Table 1. TBI by age, 2006
Age Number Percent Rate Number Percent Rate Number Percent Rate0-4 8 5.4 2.9 140 94.6 50.8 148 100.0 53.75-14 18 10.2 3.3 159 89.8 29.0 177 100.0 32.315-24 159 22.1 28.4 559 77.9 99.9 718 100.0 128.325-44 278 25.4 23.3 815 74.6 68.4 1,093 100.0 91.745-64 223 23.9 20.4 712 76.1 65.2 935 100.0 85.665+ 299 20.4 55.6 1167 79.6 217.2 1,466 100.0 272.8Total 985 21.7 23.4 3,552 78.3 84.4 4,537 100.0 107.9
TotalFatal Non-fatal
Table 2. TBI by gender, 2006
Age Number Percent Rate Number Percent Rate Number Percent RateMale 731 26.0 35.5 2,078 74.0 100.8 2,809 100.0 136.3Female 254 14.7 11.8 1,474 85.3 68.7 1,728 100.0 80.6Total 985 21.7 23.4 3,552 78.3 84.4 4,537 100.0 107.9
TotalFatal Non-fatal
Table 3. Leading causes of TBI, all ages, 2006
Mechanism of Injury Number Pct. Rate Number Pct. Rate Number Pct. RateMotor vehicle traffic crash 334 21.6 7.9 1,211 78.4 28.8 1,545 100.0 36.7Fall 171 13.8 4.1 1,068 86.2 25.4 1,239 100.0 29.5Firearm 328 95.6 7.8 15 4.4 0.4 343 100.0 8.2Non-traffic land transport 38 18.2 0.9 171 81.8 4.1 209 100.0 5.0Struck by object or person 5 2.7 0.1 182 97.3 4.3 187 100.0 4.4Non-traffic pedal cycle 4 11.4 0.1 31 88.6 0.7 35 100.0 0.8Machinery 9 47.4 0.2 10 52.6 0.2 19 100.0 0.5Other 55 26.4 1.3 153 73.6 3.6 208 100.0 4.9Unknown (missing E-code) 41 5.5 1.0 711 94.5 16.9 752 100.0 17.9Total 985 21.7 23.4 3,552 78.3 84.4 4,537 100.0 107.9
TotalFatal Non-fatal

26
Table 4. Leading causes of TBI for ages 0-4, 2006
Mechanism of Injury Number Percent Number Percent Number PercentFall 0 0.0 45 32.1 45 30.4Motor vehicle traffic crash 4 50.0 25 17.9 29 19.6Struck by or against object or person 0 0.0 12 8.6 12 8.1Non-traffic land transportation 0 0.0 4 2.9 4 2.7Other (including non-specific codes) 4 50.0 29 20.7 33 22.3Unknown (missing E-code) 0 0.0 25 17.9 25 16.9Total 8 100.0 140 100.0 148 100.0
Fatal Non-fatal Total
Table 5. Leading causes of TBI for ages 5-14, 2006
Mechanism of Injury Number Percent Number Percent Number PercentMotor vehicle traffic crash 12 66.7 63 39.6 75 42.4Fall 0 0.0 26 16.4 26 14.7Non-traffic land transportation 3 16.7 17 10.7 20 11.3Other pedal cycle 0 0.0 15 9.4 15 8.5Struck by or against object or person 0 0.0 12 7.5 12 6.8Firearm 2 11.1 0 0.0 2 1.1Other (including non-specific codes) 1 5.6 7 4.4 8 4.5Unknown (missing E-code) 0 0.0 19 11.9 19 10.7Total 18 100.0 159 100.0 177 100.0
Fatal Non-fatal Total
Table 6. Leading causes of TBI for ages 15-24, 2006
Mechanism of Injury Number Percent Number Percent Number PercentMotor vehicle traffic crash 96 60.4 363 64.9 459 63.9Firearm 47 29.6 1 0.2 48 6.7Non-traffic land transportation 10 6.3 54 9.7 64 8.9Fall 1 0.6 33 5.9 34 4.7Struck by or against object or person 0 0.0 35 6.3 35 4.9Other (including non-specific codes) 5 3.1 27 4.8 32 4.5Unknown (missing E-code) 0 0.0 46 8.2 46 6.4Total 159 100.0 559 100.0 718 100.0
Fatal Non-fatal Total

27
Table 7. Leading causes of TBI for ages 25-44, 2006
Mechanism of Injury Number Percent Number Percent Number PercentMotor vehicle traffic crash 112 40.3 425 52.1 537 49.1Firearm 122 43.9 7 0.9 129 11.8Fall 7 2.5 110 13.5 117 10.7Struck by or against object or person 3 1.1 61 7.5 64 5.9Non-traffic land transportation 11 4.0 51 6.3 62 5.7Machinery 4 1.4 3 0.4 7 0.6Other (including non-specific codes) 18 6.5 47 5.8 65 5.9Unknown (missing E-code) 1 0.4 111 13.6 112 10.2Total 278 100.0 815 100.0 1,093 100.0
Fatal Non-fatal Total
Table 8. Leading causes of TBI for ages 45-64, 2006
Mechanism of Injury Number Percent Number Percent Number PercentMotor vehicle traffic crash 63 28.3 225 31.6 288 30.8Fall 28 12.6 208 29.2 236 25.2Firearm 96 43.0 3 0.4 99 10.6Struck by or against object or person 1 0.4 48 6.7 49 5.2Non-traffic land transportation 8 3.6 32 4.5 40 4.3Other (including non-specific codes) 19 8.5 44 6.2 63 6.7Unknown (missing E-code) 8 3.6 152 21.3 160 17.1Total 223 100.0 712 100.0 935 100.0
Fatal Non-fatal Total
Table 9. Leading causes of TBI for ages 65+, 2006
Mechanism of Injury Number Percent Number Percent Number PercentFall 135 45.2 646 55.4 781 53.3Motor vehicle traffic crash 47 15.7 110 9.4 157 10.7Firearm 61 20.4 3 0.3 64 4.4Struck by or against object or person 1 0.3 14 1.2 15 1.0Non-traffic land transportation 6 2.0 13 1.1 19 1.3Other (including non-specific codes) 17 5.7 23 2.0 40 2.7Unknown (missing E-code) 32 10.7 358 30.7 390 26.6Total 299 100.0 1,167 100.0 1,466 100.0
Fatal Non-fatal Total

28
Table 10. Incidence of TBI by county, sorted by county name, 2006
County Freq Percent
Age- Adjusted
RateCrude Rate County Freq Percent
Age- Adjusted
RateCrude Rate County Freq Percent
Age- Adjusted
RateCrude Rate
Adair 17 0.4 90.0 96.3 Grant 24 0.5 99.9 96.9 McLean 12 0.3 104.7 121.9Allen 10 0.2 52.3 53.2 Graves 40 0.9 99.6 105.6 Meade 23 0.5 100.6 82.2Anderson 21 0.5 102.0 100.6 Grayson 49 1.1 193.7 192.7 Menifee 13 0.3 187.5 191.5Ballard * - - - Green 14 0.3 122.7 120.3 Mercer 22 0.5 101.5 100.8Barren 32 0.7 73.7 78.6 Greenup 17 0.4 41.8 45.5 Metcalfe 17 0.4 164.7 164.5Bath 12 0.3 99.7 102.5 Hancock 10 0.2 125.8 115.8 Monroe 16 0.4 134.6 135.9Bell 30 0.7 100.1 101.5 Hardin 119 2.6 126.4 122.6 Montgomery 31 0.7 124.4 124.6Boone 63 1.4 73.0 57.2 Harlan 26 0.6 80.5 82.0 Morgan 5 0.1 34.3 35.0Bourbon 19 0.4 101.2 95.8 Harrison 28 0.6 150.8 150.6 Muhlenberg 32 0.7 92.0 101.4Boyd 37 0.8 66.8 74.9 Hart 24 0.5 129.3 129.4 Nelson 56 1.2 138.5 133.0Boyle 34 0.7 107.0 119.5 Henderson 32 0.7 67.8 70.1 Nicholas 8 0.2 116.2 115.0Bracken 13 0.3 147.0 150.2 Henry 28 0.6 186.8 174.7 Ohio 27 0.6 107.2 113.2Breathitt 35 0.8 221.8 219.8 Hickman 5 0.1 113.9 100.5 Oldham 56 1.2 117.8 101.3Breckinridge 31 0.7 170.2 161.2 Hopkins 36 0.8 70.8 76.9 Owen 9 0.2 71.2 78.8Bullitt 61 1.3 90.1 83.7 Jackson 21 0.5 142.8 152.1 Owsley 15 0.3 325.7 319.8Butler 10 0.2 73.0 74.6 Jefferson 870 19.2 120.6 124.0 Pendleton 6 0.1 42.9 39.1Caldwell 7 0.2 47.1 54.2 Jessamine 49 1.1 117.1 109.4 Perry 79 1.7 260.6 265.5Calloway 26 0.6 59.0 73.4 Johnson 25 0.6 104.8 103.4 Pike 97 2.1 146.1 145.1Campbell 56 1.2 61.7 64.5 Kenton 119 2.6 82.4 76.8 Powell 18 0.4 134.3 130.2Carlisle 5 0.1 96.5 94.0 Knott 36 0.8 210.1 205.3 Pulaski 82 1.8 130.1 137.2Carroll 16 0.4 152.1 152.1 Knox 48 1.1 150.1 147.6 Robertson 5 0.1 181.5 214.4Carter 24 0.5 86.7 87.7 Larue 19 0.4 139.6 137.8 Rockcastle 27 0.6 158.3 160.2Casey 19 0.4 117.5 116.4 Laurel 79 1.7 141.6 138.6 Rowan 27 0.6 127.1 121.4Christian 28 0.6 43.9 41.8 Lawrence 13 0.3 83.6 79.7 Russell 24 0.5 133.6 139.7Clark 42 0.9 119.9 119.1 Lee 22 0.5 277.7 287.7 Scott 30 0.7 72.4 72.1Clay 47 1.0 191.8 195.4 Leslie 16 0.4 132.6 133.6 Shelby 40 0.9 106.6 100.7Clinton 25 0.6 268.2 261.3 Letcher 60 1.3 243.0 244.7 Simpson 7 0.2 38.2 40.7Crittenden 6 0.1 59.3 66.2 Lewis 10 0.2 68.6 71.4 Spencer 21 0.5 154.5 127.5Cumberland 11 0.2 128.0 156.1 Lincoln 41 0.9 166.0 161.7 Taylor 43 0.9 169.7 181.2Daviess 120 2.6 123.1 128.2 Livingston 15 0.3 138.9 153.1 Todd 7 0.2 56.6 57.8Edmonson 11 0.2 90.0 91.3 Logan 13 0.3 50.4 47.5 Trigg 10 0.2 69.4 74.6Elliott * - - - Lyon 6 0.1 56.9 72.5 Trimble 21 0.5 231.1 231.4Estill 22 0.5 144.4 145.1 Madison 77 1.7 98.1 97.5 Union 7 0.2 46.8 45.5Fayette 206 4.5 78.5 76.1 Magoffin 14 0.3 106.8 104.1 Warren 68 1.5 69.7 67.2Fleming 22 0.5 159.1 150.9 Marion 20 0.4 103.8 105.4 Washington 11 0.2 98.7 96.1Floyd 49 1.1 114.2 115.9 Marshall 25 0.6 70.1 79.9 Wayne 28 0.6 139.5 136.6Franklin 45 1.0 89.9 93.4 Martin 13 0.3 107.1 107.5 Webster 12 0.3 85.2 85.2Fulton 7 0.2 93.4 100.7 Mason 25 0.6 137.0 144.8 Whitley 46 1.0 117.1 120.6Gallatin 9 0.2 115.8 110.4 McCracken 69 1.5 93.9 106.2 Wolfe 27 0.6 385.8 380.6Garrard 16 0.4 93.8 94.5 McCreary 23 0.5 135.3 132.5 Woodford 21 0.5 92.0 86.1* At least one but fewer than five- Percentage or rate suppressed to prevent disclosure of the value on which it was based

29
Table 11. Incidence of TBI by county, sorted by frequency, 2006
County Freq Percent
Age- Adjusted
RateCrude Rate County Freq Percent
Age- Adjusted
RateCrude Rate County Freq Percent
Age- Adjusted
RateCrude Rate
Jefferson 870 19.2 120.6 124.0 Bell 30 0.7 100.1 101.5 Garrard 16 0.4 93.8 94.5Fayette 206 4.5 78.5 76.1 Scott 30 0.7 72.4 72.1 Leslie 16 0.4 132.6 133.6Daviess 120 2.6 123.1 128.2 Christian 28 0.6 43.9 41.8 Monroe 16 0.4 134.6 135.9Hardin 119 2.6 126.4 122.6 Harrison 28 0.6 150.8 150.6 Livingston 15 0.3 138.9 153.1Kenton 119 2.6 82.4 76.8 Henry 28 0.6 186.8 174.7 Owsley 15 0.3 325.7 319.8Pike 97 2.1 146.1 145.1 Wayne 28 0.6 139.5 136.6 Green 14 0.3 122.7 120.3Pulaski 82 1.8 130.1 137.2 Ohio 27 0.6 107.2 113.2 Magoffin 14 0.3 106.8 104.1Laurel 79 1.7 141.6 138.6 Rockcastle 27 0.6 158.3 160.2 Bracken 13 0.3 147.0 150.2Perry 79 1.7 260.6 265.5 Rowan 27 0.6 127.1 121.4 Lawrence 13 0.3 83.6 79.7Madison 77 1.7 98.1 97.5 Wolfe 27 0.6 385.8 380.6 Logan 13 0.3 50.4 47.5McCracken 69 1.5 93.9 106.2 Calloway 26 0.6 59.0 73.4 Martin 13 0.3 107.1 107.5Warren 68 1.5 69.7 67.2 Harlan 26 0.6 80.5 82.0 Menifee 13 0.3 187.5 191.5Boone 63 1.4 73.0 57.2 Clinton 25 0.6 268.2 261.3 Bath 12 0.3 99.7 102.5Bullitt 61 1.3 90.1 83.7 Johnson 25 0.6 104.8 103.4 McLean 12 0.3 104.7 121.9Letcher 60 1.3 243.0 244.7 Marshall 25 0.6 70.1 79.9 Webster 12 0.3 85.2 85.2Campbell 56 1.2 61.7 64.5 Mason 25 0.6 137.0 144.8 Cumberland 11 0.2 128.0 156.1Nelson 56 1.2 138.5 133.0 Carter 24 0.5 86.7 87.7 Edmonson 11 0.2 90.0 91.3Oldham 56 1.2 117.8 101.3 Grant 24 0.5 99.9 96.9 Washington 11 0.2 98.7 96.1Floyd 49 1.1 114.2 115.9 Hart 24 0.5 129.3 129.4 Allen 10 0.2 52.3 53.2Grayson 49 1.1 193.7 192.7 Russell 24 0.5 133.6 139.7 Butler 10 0.2 73.0 74.6Jessamine 49 1.1 117.1 109.4 McCreary 23 0.5 135.3 132.5 Hancock 10 0.2 125.8 115.8Knox 48 1.1 150.1 147.6 Meade 23 0.5 100.6 82.2 Lewis 10 0.2 68.6 71.4Clay 47 1.0 191.8 195.4 Estill 22 0.5 144.4 145.1 Trigg 10 0.2 69.4 74.6Whitley 46 1.0 117.1 120.6 Fleming 22 0.5 159.1 150.9 Gallatin 9 0.2 115.8 110.4Franklin 45 1.0 89.9 93.4 Lee 22 0.5 277.7 287.7 Owen 9 0.2 71.2 78.8Taylor 43 0.9 169.7 181.2 Mercer 22 0.5 101.5 100.8 Nicholas 8 0.2 116.2 115.0Clark 42 0.9 119.9 119.1 Anderson 21 0.5 102.0 100.6 Caldwell 7 0.2 47.1 54.2Lincoln 41 0.9 166.0 161.7 Jackson 21 0.5 142.8 152.1 Fulton 7 0.2 93.4 100.7Graves 40 0.9 99.6 105.6 Spencer 21 0.5 154.5 127.5 Simpson 7 0.2 38.2 40.7Shelby 40 0.9 106.6 100.7 Trimble 21 0.5 231.1 231.4 Todd 7 0.2 56.6 57.8Boyd 37 0.8 66.8 74.9 Woodford 21 0.5 92.0 86.1 Union 7 0.2 46.8 45.5Hopkins 36 0.8 70.8 76.9 Marion 20 0.4 103.8 105.4 Crittenden 6 0.1 59.3 66.2Knott 36 0.8 210.1 205.3 Bourbon 19 0.4 101.2 95.8 Lyon 6 0.1 56.9 72.5Breathitt 35 0.8 221.8 219.8 Casey 19 0.4 117.5 116.4 Pendleton 6 0.1 42.9 39.1Boyle 34 0.7 107.0 119.5 Larue 19 0.4 139.6 137.8 Carlisle 5 0.1 96.5 94.0Barren 32 0.7 73.7 78.6 Powell 18 0.4 134.3 130.2 Hickman 5 0.1 113.9 100.5Henderson 32 0.7 67.8 70.1 Adair 17 0.4 90.0 96.3 Morgan 5 0.1 34.3 35.0Muhlenberg 32 0.7 92.0 101.4 Greenup 17 0.4 41.8 45.5 Robertson 5 0.1 181.5 214.4Breckinridge 31 0.7 170.2 161.2 Metcalfe 17 0.4 164.7 164.5 Elliott * - - -Montgomery 31 0.7 124.4 124.6 Carroll 16 0.4 152.1 152.1 Ballard * - - -* At least one but fewer than five- Percentage or rate suppressed to prevent disclosure of the value on which it was based

30
Table 12. Incidence of TBI by county, sorted by age-adjusted rate, 2006
County Freq Percent
Age- Adjusted
RateCrude Rate County Freq Percent
Age- Adjusted
RateCrude Rate County Freq Percent
Age- Adjusted
RateCrude Rate
Wolfe 27 0.6 385.8 380.6 Hart 24 0.5 129.3 129.4 Woodford 21 0.5 92.0 86.1Owsley 15 0.3 325.7 319.8 Cumberland 11 0.2 128.0 156.1 Muhlenberg 32 0.7 92.0 101.4Lee 22 0.5 277.7 287.7 Rowan 27 0.6 127.1 121.4 Bullitt 61 1.3 90.1 83.7Clinton 25 0.6 268.2 261.3 Hardin 119 2.6 126.4 122.6 Adair 17 0.4 90.0 96.3Perry 79 1.7 260.6 265.5 Hancock 10 0.2 125.8 115.8 Edmonson 11 0.2 90.0 91.3Letcher 60 1.3 243.0 244.7 Montgomery 31 0.7 124.4 124.6 Franklin 45 1.0 89.9 93.4Trimble 21 0.5 231.1 231.4 Daviess 120 2.6 123.1 128.2 Carter 24 0.5 86.7 87.7Breathitt 35 0.8 221.8 219.8 Green 14 0.3 122.7 120.3 Webster 12 0.3 85.2 85.2Knott 36 0.8 210.1 205.3 Jefferson 870 19.2 120.6 124.0 Lawrence 13 0.3 83.6 79.7Grayson 49 1.1 193.7 192.7 Clark 42 0.9 119.9 119.1 Kenton 119 2.6 82.4 76.8Clay 47 1.0 191.8 195.4 Oldham 56 1.2 117.8 101.3 Harlan 26 0.6 80.5 82.0Menifee 13 0.3 187.5 191.5 Casey 19 0.4 117.5 116.4 Fayette 206 4.5 78.5 76.1Henry 28 0.6 186.8 174.7 Jessamine 49 1.1 117.1 109.4 Barren 32 0.7 73.7 78.6Robertson 5 0.1 181.5 214.4 Whitley 46 1.0 117.1 120.6 Butler 10 0.2 73.0 74.6Breckinridge 31 0.7 170.2 161.2 Nicholas 8 0.2 116.2 115.0 Boone 63 1.4 73.0 57.2Taylor 43 0.9 169.7 181.2 Gallatin 9 0.2 115.8 110.4 Scott 30 0.7 72.4 72.1Lincoln 41 0.9 166.0 161.7 Floyd 49 1.1 114.2 115.9 Owen 9 0.2 71.2 78.8Metcalfe 17 0.4 164.7 164.5 Hickman 5 0.1 113.9 100.5 Hopkins 36 0.8 70.8 76.9Fleming 22 0.5 159.1 150.9 Ohio 27 0.6 107.2 113.2 Marshall 25 0.6 70.1 79.9Rockcastle 27 0.6 158.3 160.2 Martin 13 0.3 107.1 107.5 Warren 68 1.5 69.7 67.2Spencer 21 0.5 154.5 127.5 Boyle 34 0.7 107.0 119.5 Trigg 10 0.2 69.4 74.6Carroll 16 0.4 152.1 152.1 Magoffin 14 0.3 106.8 104.1 Lewis 10 0.2 68.6 71.4Harrison 28 0.6 150.8 150.6 Shelby 40 0.9 106.6 100.7 Henderson 32 0.7 67.8 70.1Knox 48 1.1 150.1 147.6 Johnson 25 0.6 104.8 103.4 Boyd 37 0.8 66.8 74.9Bracken 13 0.3 147.0 150.2 McLean 12 0.3 104.7 121.9 Campbell 56 1.2 61.7 64.5Pike 97 2.1 146.1 145.1 Marion 20 0.4 103.8 105.4 Crittenden 6 0.1 59.3 66.2Estill 22 0.5 144.4 145.1 Anderson 21 0.5 102.0 100.6 Calloway 26 0.6 59.0 73.4Jackson 21 0.5 142.8 152.1 Mercer 22 0.5 101.5 100.8 Lyon 6 0.1 56.9 72.5Laurel 79 1.7 141.6 138.6 Bourbon 19 0.4 101.2 95.8 Todd 7 0.2 56.6 57.8Larue 19 0.4 139.6 137.8 Meade 23 0.5 100.6 82.2 Allen 10 0.2 52.3 53.2Wayne 28 0.6 139.5 136.6 Bell 30 0.7 100.1 101.5 Logan 13 0.3 50.4 47.5Livingston 15 0.3 138.9 153.1 Grant 24 0.5 99.9 96.9 Elliott * - - -Nelson 56 1.2 138.5 133.0 Bath 12 0.3 99.7 102.5 Caldwell 7 0.2 47.1 54.2Mason 25 0.6 137.0 144.8 Graves 40 0.9 99.6 105.6 Union 7 0.2 46.8 45.5McCreary 23 0.5 135.3 132.5 Washington 11 0.2 98.7 96.1 Christian 28 0.6 43.9 41.8Monroe 16 0.4 134.6 135.9 Madison 77 1.7 98.1 97.5 Pendleton 6 0.1 42.9 39.1Powell 18 0.4 134.3 130.2 Carlisle 5 0.1 96.5 94.0 Greenup 17 0.4 41.8 45.5Russell 24 0.5 133.6 139.7 McCracken 69 1.5 93.9 106.2 Simpson 7 0.2 38.2 40.7Leslie 16 0.4 132.6 133.6 Garrard 16 0.4 93.8 94.5 Ballard * - - -Pulaski 82 1.8 130.1 137.2 Fulton 7 0.2 93.4 100.7 Morgan 5 0.1 34.3 35.0* At least one but fewer than five- Percentage or rate suppressed to prevent disclosure of the value on which it was based

31
Table 13. Hospital discharges by disposition for non-fatal TBI, 2006 Discharge Disposition Number PercentRoutine discharge (home/self care) 2,311 65.1Skilled nursing facility (SNF) 389 11.0Home health 298 8.4Inpatient-other short-term hospital 87 2.4Intermediate care facility (ICF) 34 1.0Inpatient-other type facility 64 1.8Other 369 10.4Total 3,552 100.0 Table 14. Length of stay for non-fatal TBI, 2006 Length of Stay Number Percent*1 day 581 16.4More than one day but less than 1 week 1896 53.41 week to less than 2 weeks 622 17.52 weeks to less than 3 weeks 219 6.23 weeks to less than 4 weeks 117 3.34 weeks or more 117 3.3Total 3552 100.0*Percent of hospitalized TBI Table 15. Barrell Matrix Type I/II/III TBI by mechanism for non-fatal TBI, 2006
Injury Mechanism Number Percent Number Percent Number Percent Number Percent TotalMotor vehicle traffic crash 516 28.4 157 37.7 15 19.2 37 29.4 725Falls 664 36.6 108 26.0 31 39.7 43 34.1 846
Non-traffic land transportation
88 4.9 39 9.4 3 3.8 2 1.6 132
Struck by or against object or person
87 4.8 33 7.9 9 11.5 12 9.5 141
Non-traffic pedal cycle 20 1.1 5 1.2 1 1.3 0 0.0 26
Firearm 38 2.1 1 0.2 2 2.6 0 0.0 41
Other 91 5.0 11 2.6 5 6.4 13 10.3 120
Unknown 310 17.1 62 14.9 12 15.4 19 15.1 403
Total 1,814 100.0 416 100.0 78 100.0 126 100.0 2,434
Type I Type II Type III Other
Type of TBI

32
Table 16. Primary payers for hospitalized TBI, 2006 (Hospital Discharge Dataset only)
PayerNumber of Discharges
Percent of Discharges
Total Hospital Charges
Government 1,490 41.9 42,789,251$ Commercial Ins 965 27.2 55,828,242$ Self Pay 320 9.0 14,386,013$ Workers Compensation 111 3.1 5,778,315$ HMO 197 5.5 7,142,542$ Other 469 13.2 16,139,968$ Total 3,552 100.0 142,064,331$ Table 17. Work related TBI, 2006 Work Related NumberFatalities 35Non-Fatal 135Total Work Related 170 Table 18. Overall Injury Severity Score (ISS) for non-fatal TBI by mechanism, 2006
Injury Mechanism Number Percent Number Percent Number Percent Number Percent Number Percent TotalMotor vehicle traffic crash 246 33.5 322 44.5 426 27.8 199 60.3 18 7.7 1,211Falls 227 30.9 177 24.4 522 34.1 60 18.2 82 35.2 1,068Non-traffic land transportation
32 4.4 48 6.6 66 4.3 24 7.3 1 0.4 171
Struck by or against object or person
51 6.9 36 5.0 80 5.2 4 1.2 11 4.7 182
Firearm 0 0.0 1 0.1 10 0.7 4 1.2 0 0.0 15Non-traffic pedal cycle 5 0.7 8 1.1 16 1.0 2 0.6 0 0.0 31Other 32 4.4 30 4.1 85 5.6 1 0.3 15 6.4 163Unknown 141 19.2 102 14.1 326 21.3 36 10.9 106 45.5 711Total 734 100.0 724 100.0 1,531 100.0 330 100.0 233 100.0 3,552
Unknown
Injury Severity Score
Mild Moderate Severe Critical

33
Table 19. ABI by age, 2006
Age Number Percent Rate Number Percent Rate Number Percent Rate0-4 53 41.1 19.2 76 58.9 27.6 129 100.0 46.85-14 12 12.9 2.2 81 87.1 14.8 93 100.0 17.015-24 87 27.8 15.6 226 72.2 40.4 313 100.0 55.925-44 316 29.0 26.5 773 71.0 64.8 1,089 100.0 91.345-64 382 25.9 35.0 1,093 74.1 100.0 1,475 100.0 135.065+ 635 30.6 118.2 1,440 69.4 268.0 2,075 100.0 386.2Total 1,485 28.7 35.3 3,689 71.3 87.7 5,174 100.0 123.0
Fatal Non-fatal Total
Table 20. ABI by gender, 2006
Age Number Percent Rate Number Percent Rate Number Percent RateMale 860 34.6 41.7 1,624 65.4 78.8 2,484 100.0 120.5Female 625 23.2 29.1 2,065 76.8 96.3 2,690 100.0 125.4Total 1,485 28.7 35.3 3,689 71.3 87.7 5,174 100.0 123.0
TotalFatal Non-fatal

34
Table 21. Incidence of ABI by county, sorted by county name, 2006
County Freq Percent
Age- Adjusted
RateCrude Rate County Freq Percent
Age- Adjusted
RateCrude Rate County Freq Percent
Age- Adjusted
RateCrude Rate
Adair 29 0.6 155.4 164.3 Grant 39 0.8 161.3 157.5 McLean 10 0.2 90.5 101.6Allen 18 0.3 88.4 95.8 Graves 67 1.3 160.8 176.9 Meade 23 0.4 100.4 82.2Anderson 25 0.5 124.2 119.7 Grayson 53 1.0 199.3 208.5 Menifee 9 0.2 108.3 132.6Ballard 27 0.5 271.3 327.5 Green 24 0.5 179.3 206.2 Mercer 24 0.5 107.0 110.0Barren 87 1.7 188.2 213.6 Greenup 54 1.0 122.2 144.5 Metcalfe 25 0.5 212.4 241.9Bath 16 0.3 120.7 136.7 Hancock 5 0.1 58.3 57.9 Monroe 18 0.3 129.3 152.9Bell 39 0.8 126.0 132.0 Hardin 200 3.9 215.3 206.0 Montgomery 41 0.8 156.7 164.7Boone 81 1.6 83.9 73.6 Harlan 44 0.9 134.9 138.8 Morgan 10 0.2 70.9 69.9Bourbon 25 0.5 117.9 126.0 Harrison 15 0.3 80.6 80.7 Muhlenberg 45 0.9 123.0 142.6Boyd 83 1.6 151.1 168.1 Hart 28 0.5 142.6 151.0 Nelson 43 0.8 101.6 102.1Boyle 27 0.5 83.4 94.9 Henderson 30 0.6 62.1 65.7 Nicholas 10 0.2 136.3 143.7Bracken 8 0.2 86.4 92.4 Henry 30 0.6 186.3 187.2 Ohio 31 0.6 119.2 130.0Breathitt 25 0.5 149.8 157.0 Hickman 5 0.1 105.4 100.5 Oldham 47 0.9 117.0 85.0Breckinridge 24 0.5 115.4 124.8 Hopkins 73 1.4 137.7 155.9 Owen 10 0.2 86.3 87.5Bullitt 60 1.2 87.3 82.4 Jackson 25 0.5 185.4 181.0 Owsley 5 0.1 90.5 106.6Butler 13 0.3 91.9 97.0 Jefferson 855 16.5 115.0 121.9 Pendleton 14 0.3 96.8 91.3Caldwell 17 0.3 118.3 131.6 Jessamine 60 1.2 143.1 134.0 Perry 50 1.0 162.9 168.1Calloway 16 0.3 43.2 45.2 Johnson 45 0.9 185.5 186.0 Pike 66 1.3 95.0 98.7Campbell 91 1.8 102.4 104.8 Kenton 198 3.8 131.3 127.8 Powell 12 0.2 87.7 86.8Carlisle 15 0.3 253.3 282.1 Knott 23 0.4 136.0 131.2 Pulaski 98 1.9 153.4 164.0Carroll 15 0.3 132.8 142.6 Knox 43 0.8 127.3 132.2 Robertson 0 0 0 0Carter 55 1.1 193.1 201.0 Larue 33 0.6 205.8 239.3 Rockcastle 19 0.4 103.6 112.7Casey 36 0.7 197.6 220.5 Laurel 66 1.3 116.6 115.8 Rowan 24 0.5 117.9 107.9Christian 47 0.9 77.4 70.2 Lawrence 26 0.5 157.5 159.3 Russell 75 1.4 366.7 436.7Clark 51 1.0 137.8 144.6 Lee 12 0.2 141.0 156.9 Scott 31 0.6 81.9 74.5Clay 34 0.7 148.1 141.4 Leslie 12 0.2 95.2 100.2 Shelby 22 0.4 57.2 55.4Clinton 10 0.2 105.7 104.5 Letcher 34 0.7 130.0 138.7 Simpson 11 0.2 64.6 64.0Crittenden 12 0.2 116.3 132.3 Lewis 15 0.3 101.9 107.1 Spencer 11 0.2 76.2 66.8Cumberland 16 0.3 213.0 227.1 Lincoln 19 0.4 72.4 74.9 Taylor 48 0.9 181.2 202.3Daviess 84 1.6 86.5 89.7 Livingston 16 0.3 147.2 163.3 Todd * - - -Edmonson 13 0.3 95.4 107.8 Logan 17 0.3 58.6 62.1 Trigg 13 0.3 77.3 97.0Elliott 6 0.1 68.0 83.5 Lyon 8 0.2 89.8 96.7 Trimble 15 0.3 162.6 165.3Estill 19 0.4 125.5 125.3 Madison 64 1.2 87.5 81.0 Union 10 0.2 78.3 65.1Fayette 255 4.9 98.2 94.2 Magoffin 15 0.3 110.3 111.5 Warren 103 2.0 104.9 101.7Fleming 15 0.3 98.2 102.9 Marion 11 0.2 57.4 58.0 Washington 6 0.1 49.7 52.4Floyd 50 1.0 115.6 118.3 Marshall 86 1.7 227.0 275.0 Wayne 9 0.2 40.2 43.9Franklin 54 1.0 110.1 112.1 Martin 19 0.4 159.2 157.1 Webster 14 0.3 94.6 99.4Fulton 7 0.1 81.6 100.7 Mason 19 0.4 100.6 110.0 Whitley 50 1.0 124.7 131.1Gallatin 10 0.2 128.3 122.7 McCracken 155 3.0 200.1 238.6 Wolfe 11 0.2 166.3 155.0Garrard 12 0.2 69.4 70.9 McCreary 19 0.4 105.5 109.5 Woodford 19 0.4 73.9 77.9* At least one but fewer than five- Percentage or rate suppressed to prevent disclosure of the value on which it was based

35
Table 22. Incidence of ABI by county, sorted by frequency, 2006
County Freq Percent
Age- Adjusted
RateCrude Rate County Freq Percent
Age- Adjusted
RateCrude Rate County Freq Percent
Age- Adjusted
RateCrude Rate
Jefferson 855 16.5 115.0 121.9 Casey 36 0.7 197.6 220.5 Carlisle 15 0.3 253.3 282.1Fayette 255 4.9 98.2 94.2 Clay 34 0.7 148.1 141.4 Carroll 15 0.3 132.8 142.6Hardin 200 3.9 215.3 206.0 Letcher 34 0.7 130.0 138.7 Fleming 15 0.3 98.2 102.9Kenton 198 3.8 131.3 127.8 Larue 33 0.6 205.8 239.3 Harrison 15 0.3 80.6 80.7McCracken 155 3.0 200.1 238.6 Ohio 31 0.6 119.2 130.0 Lewis 15 0.3 101.9 107.1Warren 103 2.0 104.9 101.7 Scott 31 0.6 81.9 74.5 Magoffin 15 0.3 110.3 111.5Pulaski 98 1.9 153.4 164.0 Henderson 30 0.6 62.1 65.7 Trimble 15 0.3 162.6 165.3Campbell 91 1.8 102.4 104.8 Henry 30 0.6 186.3 187.2 Pendleton 14 0.3 96.8 91.3Barren 87 1.7 188.2 213.6 Adair 29 0.6 155.4 164.3 Webster 14 0.3 94.6 99.4Marshall 86 1.7 227.0 275.0 Hart 28 0.5 142.6 151.0 Butler 13 0.3 91.9 97.0Daviess 84 1.6 86.5 89.7 Ballard 27 0.5 271.3 327.5 Edmonson 13 0.3 95.4 107.8Boyd 83 1.6 151.1 168.1 Boyle 27 0.5 83.4 94.9 Trigg 13 0.3 77.3 97.0Boone 81 1.6 83.9 73.6 Lawrence 26 0.5 157.5 159.3 Crittenden 12 0.2 116.3 132.3Russell 75 1.4 366.7 436.7 Anderson 25 0.5 124.2 119.7 Garrard 12 0.2 69.4 70.9Hopkins 73 1.4 137.7 155.9 Bourbon 25 0.5 117.9 126.0 Lee 12 0.2 141.0 156.9Graves 67 1.3 160.8 176.9 Breathitt 25 0.5 149.8 157.0 Leslie 12 0.2 95.2 100.2Laurel 66 1.3 116.6 115.8 Jackson 25 0.5 185.4 181.0 Powell 12 0.2 87.7 86.8Pike 66 1.3 95.0 98.7 Metcalfe 25 0.5 212.4 241.9 Marion 11 0.2 57.4 58.0Madison 64 1.2 87.5 81.0 Breckinridge 24 0.5 115.4 124.8 Simpson 11 0.2 64.6 64.0Bullitt 60 1.2 87.3 82.4 Green 24 0.5 179.3 206.2 Spencer 11 0.2 76.2 66.8Jessamine 60 1.2 143.1 134.0 Mercer 24 0.5 107.0 110.0 Wolfe 11 0.2 166.3 155.0Carter 55 1.1 193.1 201.0 Rowan 24 0.5 117.9 107.9 Clinton 10 0.2 105.7 104.5Franklin 54 1.0 110.1 112.1 Knott 23 0.4 136.0 131.2 Gallatin 10 0.2 128.3 122.7Greenup 54 1.0 122.2 144.5 Meade 23 0.4 100.4 82.2 McLean 10 0.2 90.5 101.6Grayson 53 1.0 199.3 208.5 Shelby 22 0.4 57.2 55.4 Morgan 10 0.2 70.9 69.9Clark 51 1.0 137.8 144.6 Estill 19 0.4 125.5 125.3 Nicholas 10 0.2 136.3 143.7Floyd 50 1.0 115.6 118.3 Lincoln 19 0.4 72.4 74.9 Owen 10 0.2 86.3 87.5Perry 50 1.0 162.9 168.1 McCreary 19 0.4 105.5 109.5 Union 10 0.2 78.3 65.1Whitley 50 1.0 124.7 131.1 Martin 19 0.4 159.2 157.1 Menifee 9 0.2 108.3 132.6Taylor 48 0.9 181.2 202.3 Mason 19 0.4 100.6 110.0 Wayne 9 0.2 40.2 43.9Christian 47 0.9 77.4 70.2 Rockcastle 19 0.4 103.6 112.7 Bracken 8 0.2 86.4 92.4Oldham 47 0.9 117.0 85.0 Woodford 19 0.4 73.9 77.9 Lyon 8 0.2 89.8 96.7Johnson 45 0.9 185.5 186.0 Allen 18 0.3 88.4 95.8 Fulton 7 0.1 81.6 100.7Muhlenberg 45 0.9 123.0 142.6 Monroe 18 0.3 129.3 152.9 Elliott 6 0.1 68.0 83.5Harlan 44 0.9 134.9 138.8 Caldwell 17 0.3 118.3 131.6 Washington 6 0.1 49.7 52.4Knox 43 0.8 127.3 132.2 Logan 17 0.3 58.6 62.1 Hancock 5 0.1 58.3 57.9Nelson 43 0.8 101.6 102.1 Bath 16 0.3 120.7 136.7 Hickman 5 0.1 105.4 100.5Montgomery 41 0.8 156.7 164.7 Calloway 16 0.3 43.2 45.2 Owsley 5 0.1 90.5 106.6Bell 39 0.8 126.0 132.0 Cumberland 16 0.3 213.0 227.1 Todd * - - -Grant 39 0.8 161.3 157.5 Livingston 16 0.3 147.2 163.3 Robertson 0 0 0 0* At least one but fewer than five- Percentage or rate suppressed to prevent disclosure of the value on which it was based

36
Table 23. Incidence of ABI by county, sorted by age-adjusted rate, 2006
County Freq Percent
Age- Adjusted
RateCrude Rate County Freq Percent
Age- Adjusted
RateCrude Rate County Freq Percent
Age- Adjusted
RateCrude Rate
Russell 75 1.4 366.7 436.7 Carroll 15 0.3 132.8 142.6 Edmonson 13 0.3 95.4 107.8Ballard 27 0.5 271.3 327.5 Kenton 198 3.8 131.3 127.8 Leslie 12 0.2 95.2 100.2Carlisle 15 0.3 253.3 282.1 Letcher 34 0.7 130.0 138.7 Pike 66 1.3 95.0 98.7Marshall 86 1.7 227.0 275.0 Monroe 18 0.3 129.3 152.9 Webster 14 0.3 94.6 99.4Hardin 200 3.9 215.3 206.0 Gallatin 10 0.2 128.3 122.7 Butler 13 0.3 91.9 97.0Cumberland 16 0.3 213.0 227.1 Knox 43 0.8 127.3 132.2 Owsley 5 0.1 90.5 106.6Metcalfe 25 0.5 212.4 241.9 Bell 39 0.8 126.0 132.0 McLean 10 0.2 90.5 101.6Larue 33 0.6 205.8 239.3 Estill 19 0.4 125.5 125.3 Lyon 8 0.2 89.8 96.7McCracken 155 3.0 200.1 238.6 Whitley 50 1.0 124.7 131.1 Allen 18 0.3 88.4 95.8Grayson 53 1.0 199.3 208.5 Anderson 25 0.5 124.2 119.7 Powell 12 0.2 87.7 86.8Casey 36 0.7 197.6 220.5 Muhlenberg 45 0.9 123.0 142.6 Madison 64 1.2 87.5 81.0Carter 55 1.1 193.1 201.0 Greenup 54 1.0 122.2 144.5 Bullitt 60 1.2 87.3 82.4Barren 87 1.7 188.2 213.6 Bath 16 0.3 120.7 136.7 Daviess 84 1.6 86.5 89.7Henry 30 0.6 186.3 187.2 Ohio 31 0.6 119.2 130.0 Bracken 8 0.2 86.4 92.4Johnson 45 0.9 185.5 186.0 Caldwell 17 0.3 118.3 131.6 Owen 10 0.2 86.3 87.5Jackson 25 0.5 185.4 181.0 Rowan 24 0.5 117.9 107.9 Boone 81 1.6 83.9 73.6Taylor 48 0.9 181.2 202.3 Bourbon 25 0.5 117.9 126.0 Boyle 27 0.5 83.4 94.9Green 24 0.5 179.3 206.2 Oldham 47 0.9 117.0 85.0 Scott 31 0.6 81.9 74.5Wolfe 11 0.2 166.3 155.0 Laurel 66 1.3 116.6 115.8 Fulton 7 0.1 81.6 100.7Perry 50 1.0 162.9 168.1 Crittenden 12 0.2 116.3 132.3 Harrison 15 0.3 80.6 80.7Trimble 15 0.3 162.6 165.3 Floyd 50 1.0 115.6 118.3 Union 10 0.2 78.3 65.1Grant 39 0.8 161.3 157.5 Breckinridge 24 0.5 115.4 124.8 Christian 47 0.9 77.4 70.2Graves 67 1.3 160.8 176.9 Jefferson 855 16.5 115.0 121.9 Trigg 13 0.3 77.3 97.0Martin 19 0.4 159.2 157.1 Magoffin 15 0.3 110.3 111.5 Spencer 11 0.2 76.2 66.8Lawrence 26 0.5 157.5 159.3 Franklin 54 1.0 110.1 112.1 Woodford 19 0.4 73.9 77.9Montgomery 41 0.8 156.7 164.7 Menifee 9 0.2 108.3 132.6 Lincoln 19 0.4 72.4 74.9Adair 29 0.6 155.4 164.3 Mercer 24 0.5 107.0 110.0 Morgan 10 0.2 70.9 69.9Pulaski 98 1.9 153.4 164.0 Clinton 10 0.2 105.7 104.5 Garrard 12 0.2 69.4 70.9Boyd 83 1.6 151.1 168.1 McCreary 19 0.4 105.5 109.5 Elliott 6 0.1 68.0 83.5Breathitt 25 0.5 149.8 157.0 Hickman 5 0.1 105.4 100.5 Simpson 11 0.2 64.6 64.0Clay 34 0.7 148.1 141.4 Warren 103 2.0 104.9 101.7 Henderson 30 0.6 62.1 65.7Livingston 16 0.3 147.2 163.3 Rockcastle 19 0.4 103.6 112.7 Logan 17 0.3 58.6 62.1Jessamine 60 1.2 143.1 134.0 Campbell 91 1.8 102.4 104.8 Hancock 5 0.1 58.3 57.9Hart 28 0.5 142.6 151.0 Lewis 15 0.3 101.9 107.1 Marion 11 0.2 57.4 58.0Lee 12 0.2 141.0 156.9 Nelson 43 0.8 101.6 102.1 Shelby 22 0.4 57.2 55.4Clark 51 1.0 137.8 144.6 Mason 19 0.4 100.6 110.0 Washington 6 0.1 49.7 52.4Hopkins 73 1.4 137.7 155.9 Meade 23 0.4 100.4 82.2 Calloway 16 0.3 43.2 45.2Nicholas 10 0.2 136.3 143.7 Fleming 15 0.3 98.2 102.9 Wayne 9 0.2 40.2 43.9Knott 23 0.4 136.0 131.2 Fayette 255 4.9 98.2 94.2 Todd * - - -Harlan 44 0.9 134.9 138.8 Pendleton 14 0.3 96.8 91.3 Robertson 0 0 0 0* At least one but fewer than five- Percentage or rate suppressed to prevent disclosure of the value on which it was based

37
Table 24. Causes of ABI (based on diagnosis code), 2006
ABI Category Number Percent Number PercentAnoxia/hypoxia 1179 79.2 2424 65.2Exposure to toxic substances 300 20.2 1066 28.7Allergy/anaphylaxis 4 0.3 147 4.0Acute medical clinical incidents 5 0.3 78 2.1
Fatal Non-fatal
* Because there are multiple diagnoses and/or causes of death listed for each individual, it is possible for the same case to fall into more than one ABI category. Therefore, the column sums in this table are slightly higher than the total number of ABI cases shown in previous tables. Table 25. Anoxia/hypoxia by age group, 2006
Age Number Percent Rate Number Percent Rate Number Percent Rate0-4 46 56.8 16.7 35 43.2 12.7 81 100.0 29.45-14 9 24.3 1.6 28 75.7 5.1 37 100.0 6.715-24 57 43.8 10.2 73 56.2 13.0 130 100.0 23.225-44 184 37.7 15.4 304 62.3 25.5 488 100.0 40.945-64 302 29.2 27.6 732 70.8 67.0 1,034 100.0 94.665+ 581 31.7 108.1 1,252 68.3 233.0 1,833 100.0 341.2Total 1,179 32.7 28.0 2,424 67.3 57.6 3,603 100.0 85.7
TotalFatal Non-fatal
Table 26. Exposure to toxic substances by age group, 2006
Age Number Percent Rate Number Percent Rate Number Percent Rate0-4 6 15.8 2.2 32 84.2 11.6 38 100.0 13.85-14 3 6.3 0.5 45 93.8 8.2 48 100.0 8.815-24 31 17.9 5.5 142 82.1 25.4 173 100.0 30.925-44 132 23.5 11.1 429 76.5 36.0 561 100.0 47.145-64 78 22.2 7.1 274 77.8 25.1 352 100.0 32.265+ 50 25.8 9.3 144 74.2 26.8 194 100.0 36.1Total 300 22.0 7.1 1,066 78.0 25.3 1,366 100.0 32.5
Fatal Non-fatal Total

38
Table 27. Injury-related causes of ABI (based on E-code), 2006
Mechanism of Injury Number Percent Rate Number Percent Rate Number Percent Rate
Poisoning 253 22.6 6.0 864 77.4 20.5 1,117 100.0 26.6Suffocation 191 88.4 4.5 25 11.6 0.6 216 100.0 5.1Drowning 61 83.6 1.5 12 16.4 0.3 73 100.0 1.7Falls 25 9.5 0.6 239 90.5 5.7 264 100.0 6.3Motor vehicle traffic crash 51 55.4 1.2 41 44.6 1.0 92 100.0 2.2Fire/burn 21 75.0 0.5 7 25.0 0.2 28 100.0 0.7Other 47 27.6 1.1 123 72.4 2.9 170 100.0 4.0Total 649 33.1 15.4 1,311 66.9 31.2 1,960 100.0 46.6
TotalNon-fatalFatal
Table 28. Length of stay for non-fatal ABI, 2006 Length of Stay Number Percent*1 day 509 13.8More than one day but less than 1 week 1811 49.11 week to less than 2 weeks 853 23.12 weeks to less than 3 weeks 291 7.93 weeks to less than 4 weeks 108 2.94 weeks or more 117 3.2Total 3689 100.0*Percent of hospitalized ABI Table 29. Hospital discharge disposition for nonfatal ABI, 2006 Discharge Disposition Number PercentRoutine discharge (home/self care) 1,933 52.4Skilled nursing facility (SNF) 571 15.5Home health 423 11.5Inpatient-other type facility 127 3.4Inpatient-other short-term hospital 126 3.4Intermediate care facility (ICF) 42 1.1Other 467 12.7Total 3,689 100.0

39
Table 30. Primary payers for hospitalized ABI, 2006 (Hospital Discharge Dataset only)
PayerNumber of Discharges
Percent of Discharges
Total Hospital Charges
Government 2,260 61.3 $ 73,936,648 Commercial Insurance 513 13.9 $ 18,681,998 Self Pay 237 6.4 $ 4,938,442 Workers Compensation 31 0.8 $ 1,242,086 HMO 235 6.4 $ 6,727,381 Other 413 11.2 $ 20,347,441 Total 3,689 100.0 125,873,996$ Table 31. Work related ABI, 2006 Work Related NumberFatalities 22Non-Fatal 33Total Work Related 55 Table 32. SCI by age, 2006
Age Number Percent Rate Number Percent Rate Number Percent Rate0-4 1 25.0 0.4 4 80.0 1.5 5 100.0 1.85-14 2 66.7 0.4 3 60.0 0.5 5 100.0 0.915-24 4 16.0 0.7 25 86.2 4.5 29 100.0 5.225-44 12 19.7 1.0 61 83.6 5.1 73 100.0 6.145-64 9 15.5 0.8 58 86.6 5.3 67 100.0 6.165+ 33 75.0 6.1 44 57.1 8.2 77 100.0 14.3Total 61 23.8 1.5 195 76.2 4.6 256 100.0 6.1
Fatal Non-fatal Total
Table 33. SCI by gender, 2006
Age Number Percent Rate Number Percent Rate Number Percent RateMale 38 23.5 1.8 124 76.5 6.0 162 100.0 7.9Female 23 24.5 1.1 71 75.5 3.3 94 100.0 4.4Total 61 23.8 1.5 195 76.2 4.6 256 100.0 6.1
Fatal Non-fatal Total

40
Table 34. Leading causes of SCI, all ages, 2006
Mechanism of Injury Number Percent Rate Number Percent Rate Number Percent RateMotor vehicle traffic crash 25 30.1 0.6 58 69.9 1.4 83 100.0 2.0Fall 9 16.1 0.2 47 83.9 1.1 56 100.0 1.3Non-traffic land transportation 1 10.0 0.0 9 90.0 0.2 10 100.0 0.2Struck by or against object or person 0 0.0 0.0 10 100.0 0.2 10 100.0 0.2Firearm 4 33.3 0.1 8 66.7 0.2 12 100.0 0.3Other 9 50.0 0.2 9 50.0 0.2 18 100.0 0.4Unknown (missing E-code) 13 19.4 0.3 54 80.6 1.3 67 100.0 1.6Total 61 23.8 1.5 195 76.2 4.6 256 100.0 6.1
Fatal Non-fatal Total
Table 35. Length of stay for non-fatal SCI, 2006 Length of Stay Number Percent*1 day 11 5.6More than one day but less than 1 week 71 36.41 week to less than 2 weeks 62 31.82 weeks to less than 3 weeks 16 8.23 weeks to less than 4 weeks 17 8.74 weeks or more 18 9.2Total 195 100.0*Percent of hospitalized SCI Table 36. Hospital discharge disposition for non-fatal SCI, 2006 Discharge Disposition Number PercentRoutine discharge (home/self care) 102 52.3Home health 21 10.8Skilled nursing facility (SNF) 9 4.6Inpatient-other short-term hospital 6 3.1Inpatient-other type facility 4 2.1Other 53 27.2Total 195 100.0

41
Table 37. Primary payers for hospitalized SCI, 2006 (Hospital Discharge Dataset only)
PayerNumber of Discharges
Percent of Discharges
Total Hospital Discharges
Government 84 43.1 5,367,289$ Commercial Ins 51 26.2 4,571,106$ Workers Compensation 14 7.2 1,940,397$ Self Pay 12 6.2 2,193,032$ HMO 9 4.6 559,182$ Other 25 12.8 2,887,264$ Total 195 100.0 $12,150,981 Table 38. Work related SCI, 2006 Work Related NumberFatalities 1Non-Fatal 17Total Work Related 18

42