kenya hiv estimates - naccnacc.or.ke/.../12/hiv-estimates-report-kenya-20182.pdf · the hiv...
TRANSCRIPT
KENYA HIV ESTIMATES REPORT 2018
NATIONAL AIDS CONTROL COUNCIL


KENYA HIV ESTIMATESREPORT 2018
October 2018
www.nacc.or.ke


Kenya HIV Estimates Report, 2018 i
Table of Contents
Foreword ..................................................................................................................................................................... 1
Preface ......................................................................................................................................................................... 2
Acknowledgement ..................................................................................................................................................... 3
Executive Summary ..................................................................................................................................................... 4
Adult HIV Prevalence ............................................................................................................................................ 4
HIV prevalence among males and females aged 15 to 24 years.......................................................................... 5
Annual New HIV Infections ................................................................................................................................... 5
Trends in HIV Incidence and New HIV Infections ................................................................................................. 5
Treatment Needs .................................................................................................................................................. 6
Deaths averted/Lives Saved Due to ART .............................................................................................................. 6
People Living with HIV .......................................................................................................................................... 6
AIDS related deaths .............................................................................................................................................. 6
Orphans and Vulnerable Children ........................................................................................................................ 7
A call to sustained action towards ‘Zero New Infections, Zero AIDS-related deaths and Zero discrimination’ ....7
Conclusion ........................................................................................................................................................... 7
Background ................................................................................................................................................................. 8
Methods ...................................................................................................................................................................... 9
Results ....................................................................................................................................................................... 12
Adult HIV Prevalence .......................................................................................................................................... 12
Youth HIV Prevalence ......................................................................................................................................... 13
Adults aged 15+ living with HIV ........................................................................................................................ 13
Youth aged 15-24 years living with HIV .............................................................................................................. 14
Children 0-14 years living with HIV ..................................................................................................................... 14
Annual New Adult HIV Infections ....................................................................................................................... 15
Annual New HIV Infections among Youth Aged 15-24 years ............................................................................. 16
Annual New HIV Infections among Children Aged 0-14 years ........................................................................... 16
Annual AIDS-related Deaths among Adults Aged 15+ ...................................................................................... 17
Annual AIDS-related Deaths among Youth Aged 15-24 years ........................................................................... 17
Annual AIDS-related Deaths among Children Aged 0-14 years......................................................................... 17
Need for and Coverage of Treatment ................................................................................................................ 18
Impact ................................................................................................................................................................. 19
County HIV Estimates ......................................................................................................................................... 20
Conclusion ......................................................................................................................................................... 20
Annexes ..................................................................................................................................................................... 23
Annex Table 1. Indicators for Adults 15+ (2000-2017) ....................................................................................... 23
Annex Table 2. Indictors for children .................................................................................................................. 23
Annex Table 3. Treatment Indictors .................................................................................................................... 23
Annex Figure 1. Spectrum Estimate of All-Cause Mortality Compared to Vital Statistics ..................................25
Annex Figure 2. Spectrum estimates of prevalence by age compared to survey estimates .............................. 25
Annex Figure 3. Distribution of HIV+ Adults not on ART in 2012 ...................................................................... 26
Kenya HIV Estimates Report, 2018ii
List of Figures and Tables
Figures
Figure 1. HIV Prevalence Trend for Adults (15-49 years) ........................................................................................... 13
Figure 2. HIV Prevalence Trend for Youth (15-24 years) ............................................................................................ 13
Figure 3. Adults aged 15+ living with HIV across the counties ................................................................................. 14
Figure 4. Youth aged 15-24 years living with HIV across the counties ...................................................................... 14
Figure 5. Children aged 0-14 years living with HIV across the counties ................................................................... 15
Figure 6. Trend of Adult 15+ HIV Incidence Rates .................................................................................................... 15
Figure 7. Annual New HIV Infections among Youth Aged 15-24 Years across the Counties .................................... 16
Figure 8. Annual New HIV Infections among Children Aged 0-14 Years across the Counties .................................. 16
Figure 9. Annual AIDS-related Deaths among Adults aged 15+ across the Counties .............................................. 17
Figure 10. Annual AIDS-related Deaths among Youth Aged 15-24 years across the Counties ................................ 17
Figure 11. Annual AIDS-related Deaths among Youth Aged 0-14 years across the Counties .................................. 18
Figure 12. Cumulative HIV Related Deaths Averted by ART ..................................................................................... 18
Figure 13. Cumulative HIV Related Deaths Averted by ART ..................................................................................... 19
Figure 14. Cumulative number of Child Infections Averted by PMTCT .................................................................... 19
Tables
Table 1: National HIV estimates for 2017 .................................................................................................................. 12
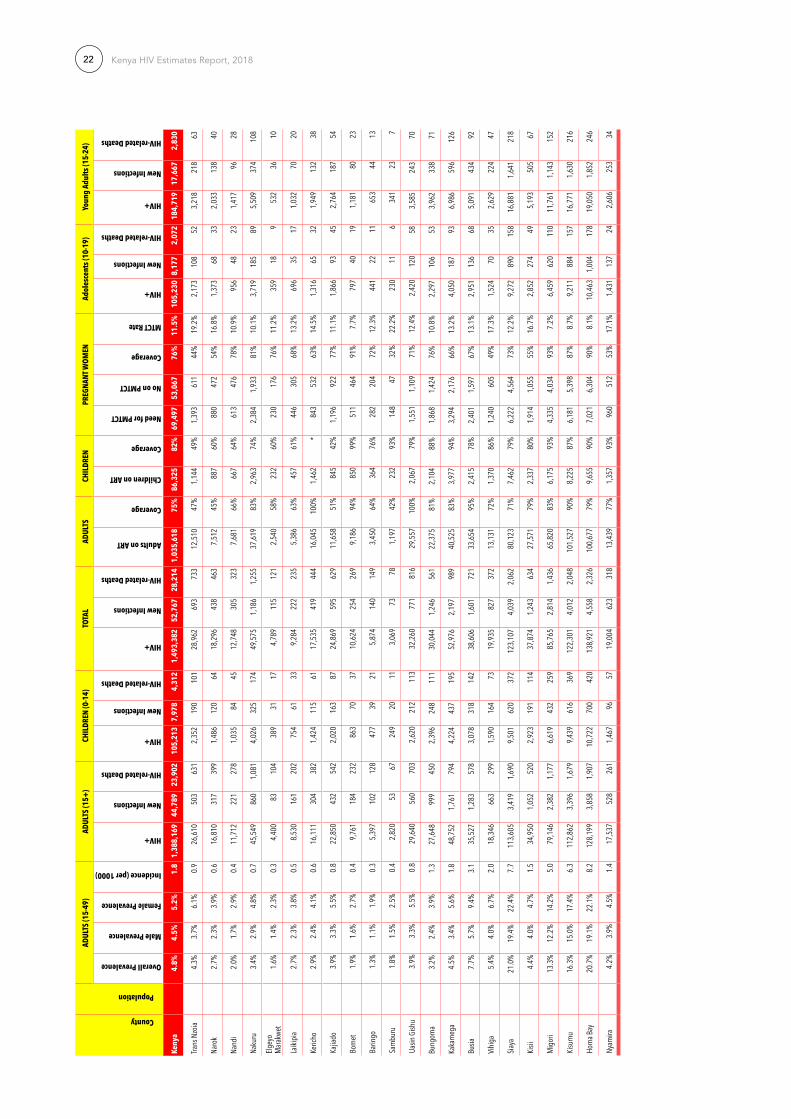
Table 2. County HIV Estimates for 2018 .................................................................................................................... 21
Kenya HIV Estimates Report, 2018 1
Foreword
The Ministry of Health has adopted an evidence-informed approach for advocacy, planning, and budgeting at the National and County levels for the HIV and AIDS response. Understanding trends in the HIV epidemic and the burden in different counties is an important step in this approach. The successful implementation of the HIV prevention and treatment programme has shown positive results, with Kenya’s 2017 HIV estimates clearly indicating a decline in the trajectory of the HIV epidemic.
This 2018 HIV Estimates Report aims to provide an improved understanding of the HIV epidemic in Kenya, and offers important insights into the impact of various interventions. The estimates have been derived from many important data sources and benefit from national consultation and review with key stakeholders from the government, national and international organizations. The highlights of this report include a gradual decline in adult HIV incidence to an estimated 0.19% in 2018. When prevention programs achieve heightened awareness, significant changes in behaviour will occur. This is expected to lead to a significant reduction in the need for PMTCT services, as well as a reduction in the number of new HIV infections. There is therefore an urgent need to scale up prevention programmes in an effort to continue reducing HIV incidence. A positive outcome of treatment scale up is the reduction in mortality, and a corresponding reduction
in the number of AIDS orphans. Although prevalence has modesty decline to about 4.9%, a combination of increased awareness, scale up of prevention and treatment programs will lead to a sustained decline of HIV prevalence in Kenya. However, the wide geographic variation in HIV burden directs us to redouble our efforts and commitment to further reduce the burden of HIV and AIDS.
In this regard the Ministry of Health has put in place frameworks complete with accompanying policies to ensure that HIV and AIDS Response is comprehensively addressed. These include the Kenya Health Sector Strategic and Investment Plan which has captured critical indicators on HIV and AIDS. The Kenya Health Policy, 2014–2030 gives directions to ensure significant improvement in overall status of health in Kenya in line with the Constitution of Kenya 2010, the country’s long-term development agenda, Vision 2030 and global commitments including those on HIV to ensure that the country attains the highest possible standards of health. This is energized by the current efforts towards Universal Health Coverage, one of the big four development agenda in which HIV and AIDS is also catered for.
The HIV Estimates were developed by the HIV Estimates Task Team with experts from different institutions under the overall coordination and leadership of the National AIDS Control Council. I give particular thanks all the experts from these institutions. I am sure that this report will be useful to programme managers, epidemiologists and researchers across the country.
Peter K. Tum, OGW Principal Secretary, Ministry of Health

Kenya HIV Estimates Report, 20182
Preface
The National AIDS Control Council in consultation with national and international epidemiologists, demographers, public health experts and monitoring and evaluation specialists undertake an annual exercise to estimate the HIV burden in the country. Avenir Health and UNAIDS continue to provide technical support to this process. The estimates are based on data from Kenya Demographic Health Surveys, Kenya AIDS Indicator Surveys, HIV Sentinel Surveillance among pregnant women, data from programmes and the national census. The estimates use the Estimation and Projection Package and Spectrum tools as recommended by the UNAIDS Reference Group on Estimates, Modelling and Projections.
The HIV Estimates bring forth a sound reflection on the existing nature of HIV burden and trajectory of the HIV epidemic in the form of prevalence, new infections, AIDS orphans and related deaths. With
adult (15-49 years) HIV prevalence estimated at about 4.9% in 2017 and approximately 1.5 million people living with HIV, Kenya has succeeded in reducing the epidemic through focused interventions. However, a third of the Counties contribute 75% of the total national new HIV infections, and some Counties have hyper-endemic prevalence levels that compare to southern African countries. The details of these and other indicators are provided in this report. The robust estimates generated for Kenya and its 47 Counties are a rich resource for county level planning, estimating the resource needs and developing strategies for scaling up high impact interventions.
Although Kenya’s progression in the AIDS response is unambiguous, the gains need to be capitalised.
Kenya must sustain its efforts and move forward in achieving national and international targets. Considering the varied nature of the epidemic across the counties, and endeavouring to implement a range of essential HIV programmes on a population wide scale based on a sound evidence base, can Kenya meet the challenge of realising zero new infections?
In order to achieve this goal and free future generations from AIDS, we require leadership, political commitment, civil society participation, knowledge capital generation, financial resources, innovations in developing new and affordable medicines and preventive technologies. We also need to tackle the fundamental drivers of the epidemic, particularly gender inequality, poverty, stigma and discrimination in family and health service settings. Doing so, will ensure we achieve our goals.
Dr. Kioko Jackson K. OGWDirector of Medical Services, Ministry of Health
Kenya has succeeded in reducing the epidemic through focused interventions. However, a third of the Counties contribute 75% of the total national new HIV infections, and some Counties have hyper-endemic prevalence levels that compare to southern African countries.

Kenya HIV Estimates Report, 2018 3
Acknowledgement
It is with pleasure that we launch the 2018 Kenya HIV Estimates Report; a product of hard work, resilience, and renewed commitment to ending AIDS by 2030. The 2017 Kenya HIV Estimates Report seeks to provide insight into the HIV epidemic in Kenya, and offers critical input into the impact of key interventions. The Report has been developed through concerted efforts of a multi-sectoral team, guided by the requisite legal framework, and in line with best practice.
The National AIDS Control Council wishes to acknowledge and appreciate the contribution of the Strategic Information Working Group who include; The National AIDS Control Council (NACC); National and STIs Control Program (NASCOP); Health Management Information Systems (HMIS); Kenya National Bureau of Statistics (KNBS); Kenya’s Universities (KU, UON, Strathmore); United Nations Programme on HIV and AIDS (UNAIDS); United Nations Children Fund (UNICEF); World Health Organization (WHO); the U.S. Centres for Disease Control and Prevention (CDC), Kenya AIDS NGOs Consortium (KANCO); National Empowerment Network of People Living with HIV/AIDS in Kenya(NEPHAK); University of California South Francisco (UCSF – Global Programs)and Africa Health Foundation (AHF) among others.
We give special thanks to the core members of the HIV Estimates Task Team members involved in the estimates process. Joshua Gitonga and Kennedy Mutai from NACC; Dr Joyce Wamicwe and Dorcas Mangoli from NASCOP; Henry Damisoni from UNAIDS; Richard Banda from WHO; Peter Young, Dr Davis Kimanga, and Dr Samwel Mwalili from CDC, Dr Nelson Owuor from UON, Dr Winnie Mutuku from KU, Felix Humwa and Agnes Natukunda from UCSF, Wellington Mbithi from UNICEF, Leonard Yosi from KEMSA, Dorothy Mutemi from AHF.
We also wish to acknowledge the consultant Dr Charles Oyaya and his support team including Fred Opundo, Mary Warinda, Bryan Tumwa, Mercy Oyaya and Evelyn Makena for compiling the report and Peter Cheseret for design. We extend our appreciation to John Stover from Avenir Health and Jeff Eaton of Imperial College London for their guidance and technical support, and UNAIDS for their financial and technical support during this process.
My special appreciation goes to Mr Joshua Gitonga and Dr Joyce Wamicwe for their contributions in coordinating the Strategic Information Working Group and disseminating the results.
Dr. Nduku Kilonzo Chief Executive Officer, National AIDS Control Council

Kenya HIV Estimates Report, 20184
The National HIV&AIDS estimates process, led by the Ministry of Health, is designed to describe the impact of the HIV and AIDS epidemic at national and county levels. It estimates HIV and AIDS prevalence and incidence, AIDS-related deaths, the impact of care and treatment on HIV and AIDS prevalence, and the number of pregnant women and children affected by HIV and AIDS and the current number of HIV and AIDS orphans.
The 2018 national and county HIV&AIDS estimates were generated using the Estimation and Projection Package (EPP) and Spectrum software recommended by the UNAIDS Reference Group on Estimates, Modeling and Projections. The software uses data collected from antenatal clinic surveillance, population based surveys including the Kenya AIDS Indicator Survey II (KAIS II) and HIV program data to estimate the prevalence of HIV and AIDS, and its impact on the population.
The 2018 estimates report presents updated HIV estimates for the calendar year 2017, the last year for which programme data were available. Because the data, methods and software are continuously evolving, the prevalence estimates from different reports are not directly comparable. Only the estimates produced by a single curve or model can be meaningfully compared to assess changes in HIV prevalence, and describe trends in the epidemic. This report presents trend data from 2000 to 2017 in the current EPP and Spectrum software.
Executive Summary
For this report, two sets of estimates were prepared. The National estimates projected indicators for all of Kenya by fitting prevalence curves to surveillance and survey data for regions corresponding to the eight former provinces of Kenya. The County estimates produced separate data for each of the counties by disaggregating the regional prevalence curves using data from each county. The county estimates may be aggregated to produce National estimates.
Adult HIV PrevalenceIn 2017, the National adult HIV prevalence rate was estimated at 4.9% with prevalence higher among women (5.2%) than men (4.5%). Although the Spectrum results show a continued decline in HIV prevalence among the adult population aged 15-49 years over a period of time, the decline has been modest since 2010. Kenya’s HIV epidemic is geographically diverse, ranging from a prevalence of 21.0% in Siaya County in former Nyanza region to approximately 0.1% in Wajir County in former North Eastern region. In descending order, Counties with the highest adult HIV prevalence in 2017 included Siaya 21.0%; Homa Bay 20.7%; Kisumu 16.3%; Migori 13.3%; Busia 7.7%; Nairobi 6.1%; Vihiga 54.%; Kitui 4.5%, Kakamega 4.5%; Kisii 4.4%, Tans Nzoia 4.3%; Muranga 4.2%; Nyamira 4.2%; Makueni 4.2%; Mombasa 4.1%; Taita Taveta 4.1%; and Kiambu 4.0%. . These new estimates confirm a decline in HIV prevalence among both men and women at both national and county levels.

Kenya HIV Estimates Report, 2018 5
COUNTY PrEVALENCE (%)
Siaya 21.0%Homa Bay 20.7% Kisumu 16.3% Migori 13.3%Busia 7.7%Nairobi 6.1%
184,718 males and females aged 15 to 24 years living with HIV.
COUNTY PrEVALENCE (%)
Vihiga 5.4%Kitui 4.5%Kakamega 4.5% Kisii 4.4%Tans Nzoia 4.3% Muranga 4.2%
Counties with the highest adult HIV prevalence in 2018
COUNTY PrEVALENCE (%)
Nyamira 4.2%Makueni 4.2%Mombasa 4.1%Taita Taveta 4.1% Kiambu 4.0%
Annual New HIV Infections in 2018
Approximately
52,800 new infections across all ages
44,800 among adults aged 15+ years and
8,000 among children aged <14 years
HIV prevalence among males and females aged 15 to 24 yearsNational HIV prevalence among males and females aged 15-24 years was estimated at 1.34% and 2.61% in 2017 respectively, and overall HIV prevalence was 1.98%, which means 184,718 young adults living with HIV in 2017.
Annual New HIV InfectionsIn 2017 there were approximately 52,800 new infections across all ages; 44,800 among adults aged 15+ years and 8,000 among children aged <14 years
Of the estimated total new infections (52,800) in 2017, Nairobi contributed 7,159 new infections; Homa Bay (4,558); Kisumu (4,012); Siaya (4,039); and Migori (2,814). Together these counties contributed about 43% of the estimated total new infections and 38.0% of the new infections among children in 2017. For young people 15-24 years the following counties had more than 1,000 new HIV infections, Homa Bay (1,852), Kisumu
(1,630), Siaya (1,641), Migori (1,143), and Nairobi (2,587). Young women in the age group 15-24 accounted for a third of all new HIV adult infections.
Trends in HIV Incidence and New HIV InfectionsKenya has continued to see a sharp decline in HIV incidence among adults aged 15-49 from 0.35% in 2010to 0.19% in 2017 possibly due to the scale up of various prevention and treatment programmes. In terms of absolute numbers, the new HIV infections among all ages declined from 77,200 in 2010 to 52,800 in 2017, indicating a 32% decline in the number of new annual HIV infections at national level, in spite of population growth. Annual new HIV infections among adult aged 15+ also declined from 63,700 in 2010 to 44,800 in 2017, a 30% decline. Among children, new infections declined from 13,500 in 2010 to 8,000 in 2017, which shows 41% decline over the period. Among young people aged 15-24 years, new infections
Kenya HIV Estimates Report, 20186
declined from 28,800 in 2010 to 17,700 in 2017, which shows 39% decrease over the period.
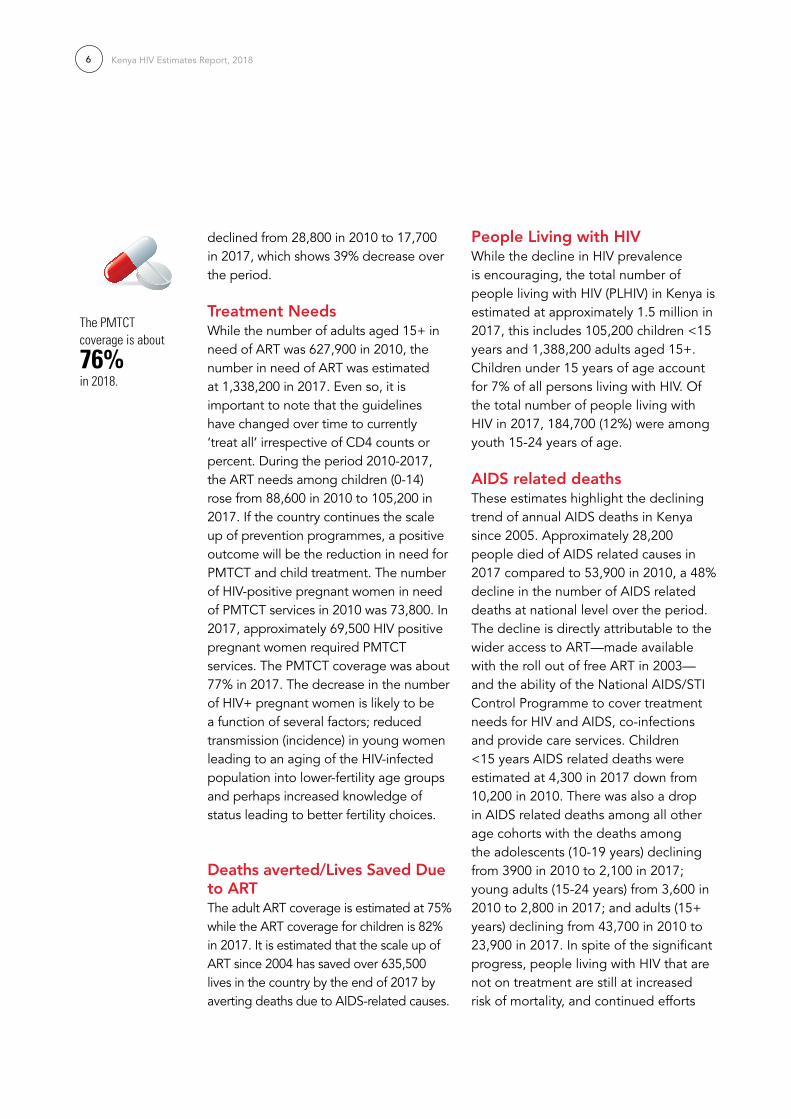
Treatment NeedsWhile the number of adults aged 15+ in need of ART was 627,900 in 2010, the number in need of ART was estimated at 1,338,200 in 2017. Even so, it is important to note that the guidelines have changed over time to currently ‘treat all’ irrespective of CD4 counts or percent. During the period 2010-2017, the ART needs among children (0-14) rose from 88,600 in 2010 to 105,200 in 2017. If the country continues the scale up of prevention programmes, a positive outcome will be the reduction in need for PMTCT and child treatment. The number of HIV-positive pregnant women in need of PMTCT services in 2010 was 73,800. In 2017, approximately 69,500 HIV positive pregnant women required PMTCT services. The PMTCT coverage was about 77% in 2017. The decrease in the number of HIV+ pregnant women is likely to be a function of several factors; reduced transmission (incidence) in young women leading to an aging of the HIV-infected population into lower-fertility age groups and perhaps increased knowledge of status leading to better fertility choices.
Deaths averted/Lives Saved Due to ArTThe adult ART coverage is estimated at 75% while the ART coverage for children is 82% in 2017. It is estimated that the scale up of ART since 2004 has saved over 635,500 lives in the country by the end of 2017 by averting deaths due to AIDS-related causes.
People Living with HIVWhile the decline in HIV prevalence is encouraging, the total number of people living with HIV (PLHIV) in Kenya is estimated at approximately 1.5 million in 2017, this includes 105,200 children <15 years and 1,388,200 adults aged 15+. Children under 15 years of age account for 7% of all persons living with HIV. Of the total number of people living with HIV in 2017, 184,700 (12%) were among youth 15-24 years of age.
AIDS related deathsThese estimates highlight the declining trend of annual AIDS deaths in Kenya since 2005. Approximately 28,200 people died of AIDS related causes in 2017 compared to 53,900 in 2010, a 48% decline in the number of AIDS related deaths at national level over the period. The decline is directly attributable to the wider access to ART—made available with the roll out of free ART in 2003—and the ability of the National AIDS/STI Control Programme to cover treatment needs for HIV and AIDS, co-infections and provide care services. Children <15 years AIDS related deaths were estimated at 4,300 in 2017 down from 10,200 in 2010. There was also a drop in AIDS related deaths among all other age cohorts with the deaths among the adolescents (10-19 years) declining from 3900 in 2010 to 2,100 in 2017; young adults (15-24 years) from 3,600 in 2010 to 2,800 in 2017; and adults (15+ years) declining from 43,700 in 2010 to 23,900 in 2017. In spite of the significant progress, people living with HIV that are not on treatment are still at increased risk of mortality, and continued efforts
The PMTCT coverage is about
76% in 2018.

Kenya HIV Estimates Report, 2018 7
are needed to ensure everyone who is infected accesses treatment.
Estimates of adult AIDS related deaths are based on several assumptions and additional datasets that include: estimates of the number of adults and children who are living with HIV, and estimates of survival from the time of infection to the time of death for both adults and children living with HIV, with or without treatment. AIDS deaths are estimated based on the latest global evidence on survival time, with and without treatment, and globally recognized methods and models are used to calculate this specific indicator.
Orphans and Vulnerable ChildrenThe number of total orphans is estimated to have slightly declined from 2.3 million children in 2010 to 2.0 million orphans in 2017. The number of all AIDS orphans also declined from 998,000 children in 2010 to 581,400 in 2017.
A call to sustained action towards ‘Zero New Infections, Zero AIDS-related deaths and Zero discrimination’The evidence presented above shows that Kenya is on track to achieve the global targets of ‘Zero New Infections, Zero AIDS-related deaths and Zero discrimination’. Sustaining prevention focus and intensity in the areas where significant declines in HIV incidence have been achieved is critical to consolidate these gains. Emerging epidemics must be addressed effectively, and prevention efforts intensified in high prevalence areas. With increasing treatment coverage
and a decline in AIDS-related deaths, a significant number of people are likely to require first and second line ART treatment in the coming years. A major challenge for the HIV programme will be to ensure that the treatment requirements of people living with HIV are fully met without sacrificing the needs of prevention or the quality of treatment programmes.
Conclusion In conclusion, despite progress by Kenya in advancing towards National targets as reflected in the 2018 HIV estimates report, much remains to be done to halt and reverse HIV. In absolute terms, a large proportion of Kenya’s population is infected with or affected by HIV. The spread of the epidemic must be halted, with zero new infections the principal target for epidemic control. The vision of eliminating the impact of the AIDS epidemic can be realized through scale up of evidence-based interventions such as PrEP, voluntary medical male circumcision. Improved strategic information, through improved surveillance of recent infections, treatment initiation, viral suppression, drug resistance, and deaths among people living with HIV can help programme planners better target interventions where they are most needed. Data presented through Kenya HIV Estimates Report 2018 should act as a primary step to catalyse continued action.
While the number of adults aged 15+ in need of ART was 627,900 in 2010, the number in need of ART was estimated at 1,338,200 in 2017.

Kenya HIV Estimates Report, 20188
Kenya has a number of information sources for HIV prevalence levels and trends. Four national surveys, the Kenya Demographic and Health Survey of 20031 (KDHS 2003), the Kenya AIDS Indicator Survey 20072 (KAIS 2007), the Kenya Demographic and Health Survey of 2008/93, the Kenya AIDS Indicator Survey 20124 and the Kenya Demographic and Health Survey of 2014 provide good estimates of national prevalence and the trends between the years. Antenatal clinic surveillance has been conducted from 1990 to 2011, starting with 13 sentinel surveillance sites and expanding to 44 sites in the last round. Routine HIV testing among pregnant women at PMTCT sites has now reached high coverage and being used in the estimates process to inform national trends in HIV prevalence. The new estimates for 2017 are based on the four national surveys, sentinel surveillance data through 2011 and routine ANC data from 2013 through 2017.
Kenya produces annual estimates of HIV prevalence and key indicators. The last HIV Estimates Report 2018 was prepared in 20165. This Kenya HIV Estimates Report 2018 aims to provide an improved understanding of the HIV epidemic in Kenya, and offers important insights into the impact of various
1 Central Bureau of Statistics (CBS) [Kenya], Ministry of Health (MOH) {Kenya], and ORC Macro. 2004. Kenya Demographic and Health Survey 2003. Calverton, Maryland” CBS, MOH and ORC Macro
2 National AIDS and STD Control Programme, Ministry of Health, Kenya. July 2008. Kenya AIDS Indicator Survey 2007: Preliminary Report. Nairobi, Kenya.
3 KNBS [Kenya] 2009. Kenya Demographic and Health Survey 2008-09 Preliminary Report. Calverton, Maryland. KNBS, NACC, NASCOP, NPHLS, KEMRI, NCAPD, ICF Macro, September 2009.
4 National AIDS and STI Control Programme, Kenya AIDS Indicator Survey 2012, Preliminary Report, September 2013
5 National AIDS Control Council (NACC) and National AIDS & STIs Control Programme (NASCOP). Kenya HIV Estimates 2015. Nairo-bi, Kenya
interventions. The report describes the process used to prepare national estimates for 2017 and the results for key indicators and brings forth a sound reflection on the existing nature of HIV burden and trajectory of the HIV epidemic in the form of prevalence, new infections, AIDS orphans and related deaths. The estimates use the Estimation and Projection Package and Spectrum tools as recommended by the UNAIDS Reference Group on Estimates, Modelling and Projections.
Background
Routine HIV testing among pregnant women at PMTCT sites has now reached high coverage and being used in the estimates process to inform national trends in HIV prevalence.

Kenya HIV Estimates Report, 2018 9
The methods used to estimate national HIV prevalence in Kenya have changed over time in response to the data available. Before the first national survey, smooth prevalence curves were fit to individual surveillance sites to determine trends at those sites, and then these trends were aggregated by weighting them by the population represented by each site. When the first National survey became available the national trend was adjusted to match the survey findings in 20036. Now that four surveys are available they can be used to adjust not only the level but also the trend in prevalence from 2003 to 2012. Over the years, there has been an increase in coverage and quality of routine testing data among pregnant women attending PMTCT sites. In 2017, the Kenya HIV Estimates Team evaluated the quality and completeness of routine ANC data and recommended the use of these data from 2013 onwards to adjust the trend of HIV prevalence. The national projection was validated by comparing the estimated total mortality with deaths estimates from vital statistics (adjusted for undercount) (Annex Figure 1) and by comparing the estimated age-specific prevalence with survey estimates (Annex Figure 2).
Annual fluctuations in surveillance and survey data are smoothed by fitting a curve to individual observations. Although the final curve may not be an exact match for the point estimates from any one survey, it should ideally lie within
6 National AIDS Control Council (NACC) and National AIDS and STD Control Programme (NASCOP) 2007. National HIV Preva-lence in Kenya. Nairobi: NACC and NASCOP.
the confidence bounds of all survey estimates.
UNAIDS has supported the development of a number of tools to make national estimates. For Kenya the relevant tools are the Estimation and Projection Package (EPP) and Spectrum (several years ago EPP was integrated directly into Spectrum package)7,8. EPP is used to fit smooth prevalence curves to surveillance and survey data separately for the former eight regions (former provinces). The incidence implied by the regional prevalence curves is then transferred to Spectrum where it is combined with additional information on the age structure of incidence and program coverage (ART, PMTCT, cotrimoxazole for children) to estimate indicators of interest such as the number of people living with HIV, the number of new infections, AIDS deaths and the need for ART, PMTCT and cotrimoxazole. These regional estimates are then aggregated to create national figures.
Treatment need was derived by combining the estimated number of new adult HIV infections with information about progression in CD4 counts, the mother-to-child transmission rate and service statistics to estimate the need for services. For adult ART, eligibility for treatment was defined based on evolving national treatment guidelines as: a CD4 count of less than 200 cells/
7 Stover J, Brown T, Marston M. Updates to the Spectrum/Estima-tion and Projection Package (EPP) model to estimate HIV trends for adults and children (2012) Sex Trans Infect 2012;88:i11-ii16. doi:10.1136/sextrans-2012-050640
8 Futures Institute, AIM: A Computer Program for Making HIV/AIDS Projections and Examining The Demographic and Social Impacts of AIDS, Glastonbury, CT: Futures Institute, January 2014.
Methods

Kenya HIV Estimates Report, 201810
μl through 2006, less than 250 cells/μl from 2007-2009, CD4 count of less than 350 cells/μl in 2010-2014, CD4 count of less than 500 cells/μl in 2014-2016, and “treat all” irrespective of CD4 count from 2016 onwards9. Spectrum tracks adults living with HIV by CD4 count based on assumed rates of progression to lower CD4 counts, AIDS mortality by CD4 count and initiation of ART10. The parameters of the model were set to reproduce the CD4 count distribution of the population living with HIV who were not on ART, as reported by the 2012 KAIS (Annex Figure 3).
For children, eligibility has three different criteria: age, CD4 count and CD4 percent thresholds. The first is age (in months) by which all HIV positive children are eligible or started on ART. Again based on evolving national treatment guidelines, the recommend age thresholds have changed from 0 to 12 months in 2009, 24 months in 2012, 120 months in 2014 and now “treat all” (180 months) from 2016 onwards. The second is, CD4 count by four age groups and by year based on WHO guidelines for the corresponding years. The third is CD4 percent by age based on WHO guidelines. Children are considered eligible for treatment if they meet any one of the three criteria11. The child model in Spectrum follows children from HIV infection to death based on survival patterns, which are dependent on time of infection (peripartum, 6-12 months, 13-24 months, >24 months)12.
9 Ministry of Health, National AIDS & STI Control Programme. Guidelines on Use of Antiretroviral Drugs for Treating and Pre-venting HIV Infection in Kenya 2016. Nairobi, Kenya: NASCOP, July 2016. Print.
10 Futures Institute, AIM: A Computer Program for Making HIV/AIDS Projections and Examining The Demographic and Social Impacts of AIDS, Glastonbury, CT: Futures Institute, January 2014.
11 Quick Start Guide for Spectrum 2018. UNAIDS, December 2017.12 Futures Institute, AIM: A Computer Program for Making HIV/
AIDS Projections and Examining The Demographic and Social Impacts of AIDS, Glastonbury, CT: Futures Institute, January 2014.
Spectrum calculates the number of children infected through mother-to-child transmission using program data on the number of women receiving PMTCT services by regimen and timing of ART initiation among pregnant women, estimated breastfeeding patterns in the HIV-infected population, and the latest estimates of the probability of transmission for each scenario13.
There are uncertainties inherent in these estimates based on the error of measuring HIV prevalence through population surveys and the uncertainty in the assumptions used for time of progression, the distribution of new infections by age and sex, mother-to-child transmission rates, and the effectiveness of treatment. In order to quantify this uncertainty, Spectrum performs 1000 Monte Carlo simulations using randomly selected values for these assumptions with ranges indicated by the sources as well as the uncertainty in incidence estimates estimated by EPP. The results provide plausibility bounds around each estimate.
To measure the impact of treatment in terms of lives saved, we used Spectrum to compare this scenario to a hypothetical scenario in which no one was ever placed on ART. The difference in the number of AIDS deaths between the two projections is the estimated impact of treatment. A similar approach was used to measure the impact of PMTCT scale-up.
There were global changes in the child model structure with the adjustment applied to estimates for earlier years. New evidence from recent population-
13 Rollins N, Mahy M, Becquet R, Kuhn L, Creek T, Mofenson L. Es-timates of peripartum and postnatal mother-to-child transmission probabilities of HIV for use in Spectrum and other popula-tion-based models Sex Trans Infect 2012;88:i44-i51.

Kenya HIV Estimates Report, 2018 11
based HIV impact assessment (PHIA) surveys in three countries (Malawi, Zambia, Zimbabwe) suggested that estimated child prevalence was lower than empirical results14. Consequently, updates were done to the Spectrum model in 2017 to fully capture transmission from women who seroconvert during breastfeeding. In previous models, duration of risk of HIV incidence among breastfeeding women only lasted for 12 months; while in the revised model duration of risk of HIV incidence among breastfeeding women extended to full duration of breastfeeding. This results in more children becoming infected during breastfeeding, and consequently increase in new child HIV infections and children living with HIV.
In 2017, an update was introduced to Spectrum to allow adjustment on the percentage of women who were already on ART at the time they became pregnant or started ART during the current pregnancy who are still on ART at the time of delivery (a change from previous versions that used monthly drop-out rates). For 2018 estimates, we used an assumption of 85% retention rate based on results from the 2017 Cohort Analysis. The adjustment in retention rates results in increased MTCT rate (all other factors remaining constant) since women who dropout have a transmission rate of about 30% (similar to women with unknown HIV status/women not on ART) compared to 2% for those on ART.
Like in 2016, this year a single set of regional projections were prepared. The regional estimates have been aggregated
14 Malawi, Zambia and Zimbabwe: PHIA surveys results. phia.icap.columbia.edu
to produce national estimates, and also used to disaggregate the regional indicators to the county levels.
County estimates of key indicators were prepared by disaggregating the regional total to the Counties within each region (former province). Separate Spectrum files were prepared for each region and prevalence trends were fit to surveillance and survey data. Population projections for each region were based on total fertility rates and mortality indicators from KDHS and adjusted to match census estimates by region.
For each of the key indicators the regional estimates were distributed to each county on the basis of that county’s proportion of the total.
Estimates of prevalence by County were prepared by examining surveillance and survey cluster data from 2003 to 2017. For each County the prevalence trend was determined by one of five options: 1) overall average across all data points, 2) a linear trend fit to all data points, 3) the most recent value, 4) the latest KAIS estimate or 5) the latest KDHS estimate. The prevalence estimate for 2017 for each County was multiplied by the population 15-49 in the County to estimate the number of adults living with HIV aged 15-49. The number of adults living with HIV aged 15+ in each County was adjusted so that the total across all Counties in a province would equal the provincial total estimated by Spectrum. Values for other indicators were first distributed by County according to the number of HIV+ adults and then adjusted to match the regional totals.

Kenya HIV Estimates Report, 201812
results
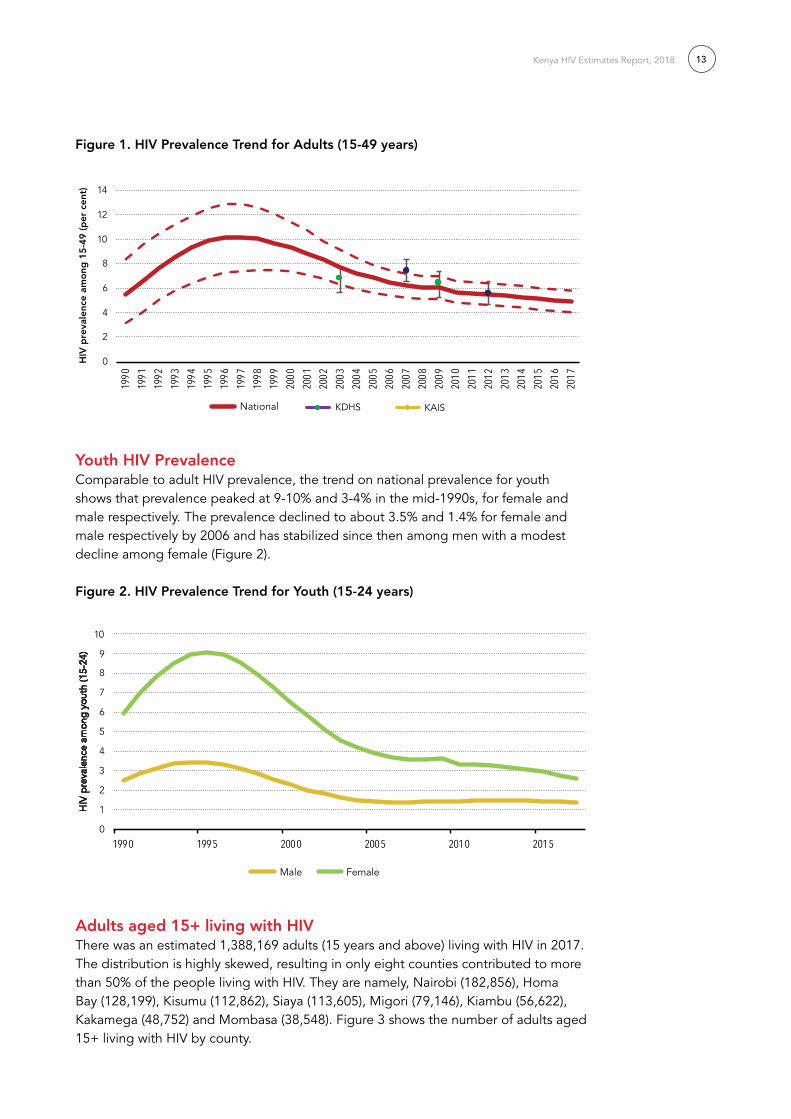
Adult HIV PrevalenceAdult HIV prevalence is the percentage of adults 15-49 living with HIV. The national prevalence trend indicates that prevalence peaked at 10-11% in the mid-1990s, declined to about 6% by 2006 and has been relatively stable at that level for several years, with a modest decline in recent years (Figure 1). In 2017, the National HIV prevalence rate was estimated at 4.9% with prevalence higher among women (5.2%) than men (4.5%).
Table 1 shows the results for key indicators for 2017. The updated estimates for people living with HIV for all ages are similar to those produced previously.
Table 1: National HIV estimates for 2017
Indicator 2017
People living with HIV (all ages) 1.5 (1.3 – 1.8) million
Annual new HIV infections (all ages) 52,800 (33,400 – 77,500)
Annual AIDS-related deaths (all ages) 28,200 (18,100 – 45,300)
HIV prevalence (adults aged 15-49) 4.85% (4.02 – 5.80%)
HIV incidence (adults 15-49) 0.19% (0.13 – 0.29%)
Adult 15+ living with HIV 1,388,200 (1,167,000 – 1,645,900)
Annual new HIV infections (Adult 15+) 44,800 (28,800 – 67,100)
Annual AIDS-related deaths (Adult 15+) 23,900 (15,400 – 39,000)
Adult 15+ on ART; ART coverage (%) 1,035,615 (75%)
Children (0-14 years) living with HIV 105,200 (73,800 – 134,000)
Annual new HIV infections (Children 0-14) 8,000 (3,500 – 13,000)
Annual AIDS-related deaths (Children 0-14) 4,300 (2,100 – 7,500)
Children (0-14) on treatment; ART coverage (%) 86,323 (84%)
HIV prevalence (young adults 15-24); male 1.34% (0.71 – 1.91%)
HIV prevalence (young adults 15-24); female 2.61% (1.34 – 3.98%)
Annual new HIV infections (young adults 15-24); male 5,200 (1,100 – 8,600)
Annual new HIV infections (young adults 15-24); female 12,500 (7,200 – 18,800)
Annual AIDS deaths (young adults 15-24) 2,800 (1,700 – 4,700)
Adolescents living with HIV (10-19) 105,200 (62,800 – 147,700)
Annual new HIV infections (adolescents 10-19) 8,200 (2,400 – 15,900)
Annual AIDS deaths (adolescents 10-19) 2,100 (1,200 – 3,200)
Mothers needing PMTCT 69,500 (31,800 – 106,800)
Mothers on PMTCT; PMTCT coverage (%) 53,236 (77%)
EMTCT rate 11.5%
Kenya HIV Estimates Report, 2018 13
Figure 1. HIV Prevalence Trend for Adults (15-49 years)
Youth HIV Prevalence Comparable to adult HIV prevalence, the trend on national prevalence for youth shows that prevalence peaked at 9-10% and 3-4% in the mid-1990s, for female and male respectively. The prevalence declined to about 3.5% and 1.4% for female and male respectively by 2006 and has stabilized since then among men with a modest decline among female (Figure 2).
Figure 2. HIV Prevalence Trend for Youth (15-24 years)
Adults aged 15+ living with HIV There was an estimated 1,388,169 adults (15 years and above) living with HIV in 2017. The distribution is highly skewed, resulting in only eight counties contributed to more than 50% of the people living with HIV. They are namely, Nairobi (182,856), Homa Bay (128,199), Kisumu (112,862), Siaya (113,605), Migori (79,146), Kiambu (56,622), Kakamega (48,752) and Mombasa (38,548). Figure 3 shows the number of adults aged 15+ living with HIV by county.
0
1
2
3
4
5
6
7
8
9
10
1990 1995 2000 2005 2010 2015
HIV
pre
vale
nce
amo
ng y
out
h (1
5-24
)
Trends of prevalence (youth 15-24)
Male Female
0
2
4
6
8
10
12
14
1990
1991
1992
1993
1994
1995
1996
1997
1998
1999
2000
2001
2002
2003
2004
2005
2006
2007
2008
2009
2010
2011
2012
2013
2014
2015
2016
2017
National Prevalence Trend
National
HIV
pre
vale
nce
amo
ng 1
5-4
9 (p
er c
ent)
KDHS KAIS

Kenya HIV Estimates Report, 201814
Figure 3. Adults aged 15+ living with HIV across the counties
Youth aged 15-24 years living with HIVOf the total number of people living with HIV in 2017, 184,719 (12%) were among youth 15-24 years of age. Youth with HIV were concentrated in the high prevalence counties in Kenya. Counties with high burden were Nairobi (24,918) Homa Bay (19,050), Siaya (16,881), Kisumu (16,771), Migori (11,761) Kakamega (6,986) and Nakuru (5,509) contribute to 55% of youth living with HIV in 2017. Figure 4 shows the number of youth aged 15-24 years living with HIV.
Figure 4. Youth aged 15-24 years living with HIV across the counties
Children 0-14 years living with HIVOf the total number of people living with HIV in 2017, 105,213 (6%) were among children 0-14 years of age. Half of the children(50%) living with HIV were from 7 out of the 47 counties, namely, Homa Bay (10,722), Siaya (9,501), Kisumu (9,439), Nairobi (8,137), Migori (6,161), Kakamega (4,224) and Nakuru (4,026). Figure 5 shows the number of children aged 0-14 years living with HIV.
0
20,000
40,000
60,000
80,000
100,000
120,000
140,000
160,000
180,000
200,000
Nairo
biHo
ma B
aySia
yaKis
umu
Migo
riKia
mbu
Kaka
meg
aNa
kuru
Mom
basa
Busia Kis
iiKil
ifiUa
sin Gi
shu
Muran
g'aMa
chak
osBu
ngom
aTra
ns N
zoia
Kitui
Kajia
doMa
kuen
iMe
ruTu
rkana
Nyer
iVih
igaKw
aleNy
amira
Narok
Keric
hoNy
anda
rua
Kiriny
aga
Nand
iEm
buBo
met
Taita
Tave
taLa
ikipi
aTh
araka
Nith
iW
est Po
kot
Barin
goElg
eyo M
arakw
etIsi
oloSa
mbur
uLa
muMa
rsabit
Garis
saTa
na Ri
ver
Mand
era
Waji
r
0
5,000
10,000
15,000
20,000
25,000
30,000
Nairo
biHo
ma B
aySia
yaKis
umu
Migo
riKa
kam
ega
Naku
ruKia
mbu
Kisii
Busia
Mom
basa
Bung
oma
Kilifi
Uasin
Gish
uMa
chak
osKit
uiTra
ns N
zoia
Maku
eni
Meru
Kajia
doMu
rang'a
Vihiga
Nyam
iraTu
rkana
Kwale
Narok
Nyer
iKe
richo
Nyan
daru
aNa
ndi
Kiriny
aga
Embu
Bom
etTa
ita Ta
veta
Laiki
pia
Thara
ka N
ithi
West
Poko
tBa
ringo
Garis
saElg
eyo M
arakw
etIsi
oloSa
mbur
uMa
rsabit
Lamu
Tana
Rive
rMa
nder
aW
ajir
Kenya HIV Estimates Report, 2018 15
Figure 5. Children aged 0-14 years living with HIV across the counties
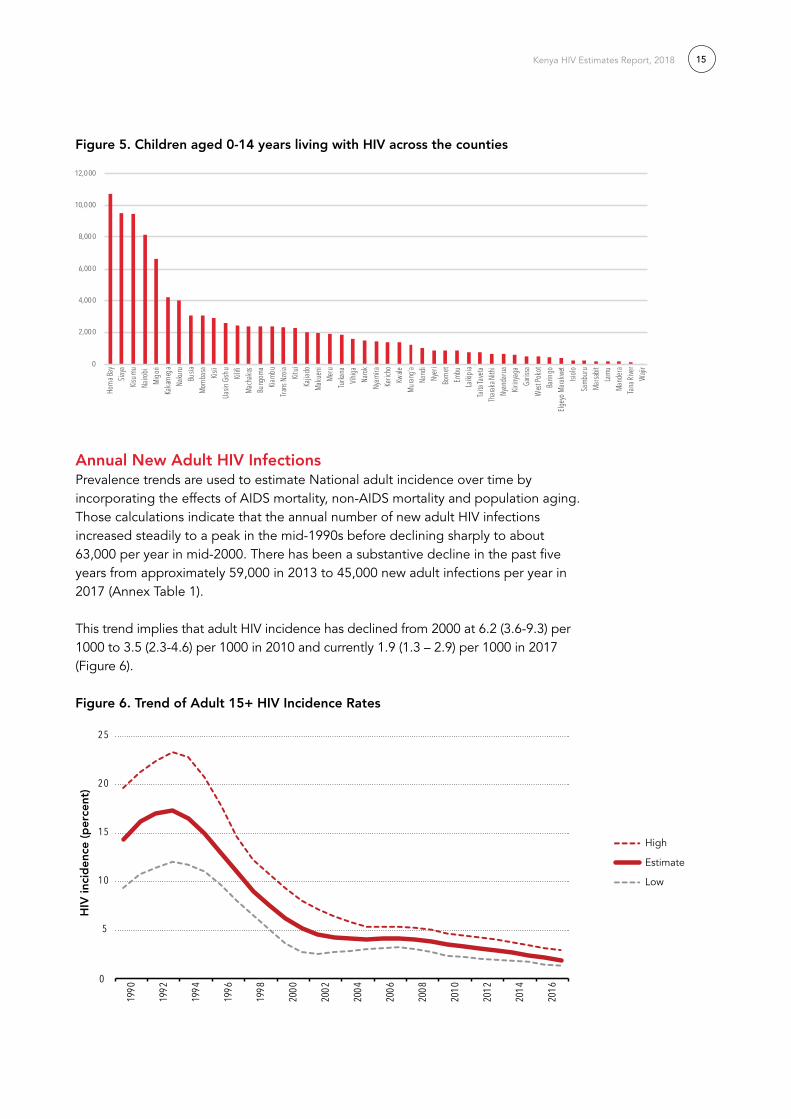
Annual New Adult HIV InfectionsPrevalence trends are used to estimate National adult incidence over time by incorporating the effects of AIDS mortality, non-AIDS mortality and population aging. Those calculations indicate that the annual number of new adult HIV infections increased steadily to a peak in the mid-1990s before declining sharply to about 63,000 per year in mid-2000. There has been a substantive decline in the past five years from approximately 59,000 in 2013 to 45,000 new adult infections per year in 2017 (Annex Table 1).
This trend implies that adult HIV incidence has declined from 2000 at 6.2 (3.6-9.3) per 1000 to 3.5 (2.3-4.6) per 1000 in 2010 and currently 1.9 (1.3 – 2.9) per 1000 in 2017 (Figure 6).
Figure 6. Trend of Adult 15+ HIV Incidence rates
0
2,000
4,000
6,000
8,000
10,000
12,000
Homa
Bay
Siaya
Kisum
uNa
irobi
Migo
riKa
kame
gaNa
kuru
Busia
Momb
asa
Kisii
Uasin
Gish
uKil
ifiMa
chak
osBu
ngom
aKia
mbu
Trans
Nzoi
aKit
uiKa
jiado
Maku
eni
Meru
Turka
naVih
igaNa
rokNy
amira
Keric
hoKw
aleMu
rang'a
Nand
iNy
eriBo
met
Embu
Laiki
piaTa
ita Ta
veta
Thara
ka N
ithi
Nyan
daru
aKir
inyag
aGa
rissa
West P
okot
Barin
goElg
eyo M
arakw
etIsi
oloSa
mbur
uMa
rsabit
Lamu
Mand
eraTa
na Ri
ver
Wajir
5
0
10
15
20
25
1990
1992
1994
1996
1998
2000
2002
2004
2006
2008
2010
2012
2014
2016
HIV
inci
den
ce (p
erce
nt)
Estimate
High
Low

Kenya HIV Estimates Report, 201816
Annual New HIV Infections among Youth Aged 15-24 yearsIn 2017, new infections in Kenya were 52,767, with young people contributing 17,667 (33%). HIV infections among youth are concentrated in the high prevalence counties in Kenya. Counties with high number of HIV infections are Nairobi (2,587), Homa Bay (1,852), Siaya (1,641), Kisumu (1,630), Migori (1,143), Kiambu (730), Kakamega (596) and Mombasa (562), which contribute to 61% of new infections among youth aged 15-24 years in 2017. Figure 7 shows the annual new HIV infections among youth aged 15-24 years across the counties.
Figure 7. Annual New HIV Infections among Youth Aged 15-24 Years across the Counties
Annual New HIV Infections among Children Aged 0-14 yearsThere were 7,978 new HIV infections among children aged 0-14 years in Kenya which was about 15% of all total new HIV infections in 2017. These new HIV infections among the children were concentrated in the high prevalence counties in Kenya. Counties with high HIV infections were Homa Bay (700), Nairobi (660), Siaya (620), Kisumu (616), Kakamega (437), Migori (432), Nakuru (325), and Busia (318) and contribute to 51% of new infections among children aged 0-14 years in 2017. Figure 8 shows the annual new HIV infections among children aged 0-14 years across the counties.
Figure 8. Annual New HIV Infections among Children Aged 0-14 Years across the Counties
0
500
1,000
1,500
2,000
2,500
3,000
Nairo
biHo
ma B
aySi
aya
Kisu
mu
Mig
ori
Kiam
buKa
kam
ega
Mom
basa
Kisii
Kilif
iBu
siaM
uran
g'a
Naku
ruBu
ngom
aM
acha
kos
Kitu
iNy
eri
Kwale
Mak
ueni
Nyam
iraM
eru
Uasin
Gish
uVi
higa
Tran
s Nzo
iaNy
anda
rua
Kajia
doKi
rinya
gaTu
rkan
aTa
ita Ta
veta
Naro
kKe
richo
Embu
Nand
iTh
arak
a Nith
iBo
met
Laiki
pia
Wes
t Pok
otBa
ringo
Elge
yo M
arak
wet
Lam
uIsi
olo
Tana
Rive
rM
arsa
bit
Sam
buru
Garis
saM
ande
raW
ajir
0
100
200
300
400
500
600
700
800
Hom
a Bay
Nairo
biSia
yaKis
umu
Kaka
meg
aMi
gori
Naku
ruBu
siaMo
mba
saBu
ngom
aUa
sin Gi
shu
Kilifi
Kisii
Trans
Nzo
iaMa
chak
osKit
uiVih
igaKa
jiado
Turka
naMa
kuen
iMe
ruKia
mbu
Narok
Keric
hoKw
aleNy
amira
Nand
iMu
rang'a
Bom
etEm
buLa
ikipi
aTa
ita Ta
veta
Garis
saTh
araka
Nith
iNy
eri
West
Poko
tBa
ringo
Nyan
daru
aKir
inyag
aElg
eyo M
arakw
etSa
mbur
uIsi
oloMa
nder
aMa
rsabit
Lamu
Tana
Rive
rW
ajir

Kenya HIV Estimates Report, 2018 17
Annual AIDS-related Deaths among Adults Aged 15+Annual AIDS-related deaths in Kenya were 28,214 in 2017. Of the annual deaths, 23,902 (851%) were adults aged 15 years and over. About half of these deaths (52%) occurred in nine of the 47 counties, namely, Nairobi (2,232) Homa Bay (1,907), Siaya (1,690), Kisumu (1,679), Migori (1,177) Kiambu (1,096), Nakuru (1,081) Kakamega (794) and Uasin Gishu (703). Figure 9 shows the number of annual AIDS-related deaths among adults aged 15+ across the counties.
Figure 9. Annual AIDS-related Deaths among Adults aged 15+ across the Counties
Annual AIDS-related Deaths among Youth Aged 15-24 yearsThere were 2,830 AIDS-related deaths among youth aged 15-24 years in Kenya which was about 10% of all total AIDS-related deaths in 2017. About 54.% of these deaths occurred in nine of the 47 counties, namely, Nairobi (294) Homa Bay (246), Siaya (248), Kisumu (216), Migori (152), Kakamega (126); Nakuru (108), Busia (92) and Mombasa (79). Figure 10 shows the number of annual AIDS-related deaths among youth aged 15-24 years across the counties.
Figure 10. Annual AIDS-related Deaths among Youth Aged 15-24 years across the Counties
Annual AIDS-related Deaths among Children Aged 0-14 yearsThere were 4,312 AIDS-related deaths among children aged 0-14 years in Kenya which was about 15% of all total AIDS-related deaths in 2017. About 56% of these deaths occurred in nine of the 47 counties, namely, Homa Bay (420), Nairobi (380), Siaya (372), Kisumu (369), Migori (259), Kakamega (195), Nakuru (174), Busia (142) and Mombasa (124). Figure 11 shows the number of annual AIDS-related deaths among children aged 0-14 years across the counties.
0
500
1,000
1,500
2,000
2,500
Nairo
biHo
ma B
aySia
yaKis
umu
Migo
riKia
mbu
Naku
ruKa
kam
ega
Uasin
Gish
uMo
mba
saTra
ns N
zoia
Busia
Muran
g'aKa
jiado
Mach
akos
Kisii
Kilifi
Kitui
Turka
naBu
ngom
aMa
kuen
iMe
ruNa
rokNy
eri
Keric
hoKw
aleVih
igaNy
anda
rua
Nand
iKir
inyag
aNy
amira
Bom
etLa
ikipi
aEm
buTa
ita Ta
veta
Thara
ka N
ithi
Garis
saW
est Po
kot
Barin
goElg
eyo M
arakw
etSa
mbur
uIsi
oloMa
nder
aMa
rsabit
Lamu
Tana
Rive
rW
ajir
0
50
100
150
200
250
300
350
Nairo
biHo
ma B
aySi
aya
Kisu
mu
Mig
ori
Kaka
meg
aNa
kuru
Busia
Mom
basa
Kiam
buBu
ngom
aUa
sin G
ishu
Kisii
Mac
hako
sTr
ans N
zoia
Kilif
iKi
tui
Kajia
doM
akue
niM
eru
Turk
ana
Vihi
gaNa
rok
Mur
ang'
aKe
richo
Kwale
Garis
saNy
amira
Nyer
iNa
ndi
Embu
Bom
etNy
anda
rua
Laiki
pia
Taita
Tave
taKi
rinya
gaTh
arak
a Nith
iW
est P
okot
Barin
goM
ande
raEl
geyo
Mar
akwe
tIsi
olo
Sam
buru
Mar
sabi
tLa
mu
Tana
Rive
rW
ajir
15-24
Kenya HIV Estimates Report, 201818
Figure 11. Annual AIDS-related Deaths among Youth Aged 0-14 years across the Counties
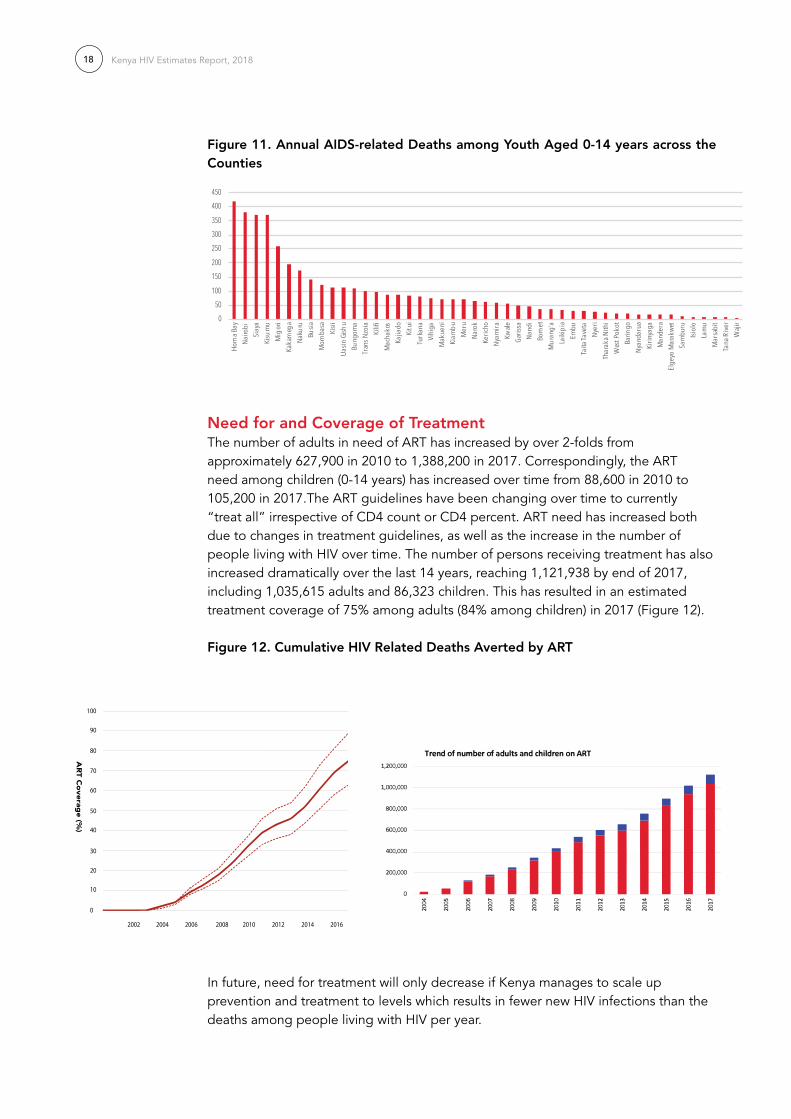
Need for and Coverage of TreatmentThe number of adults in need of ART has increased by over 2-folds from approximately 627,900 in 2010 to 1,388,200 in 2017. Correspondingly, the ART need among children (0-14 years) has increased over time from 88,600 in 2010 to 105,200 in 2017.The ART guidelines have been changing over time to currently “treat all” irrespective of CD4 count or CD4 percent. ART need has increased both due to changes in treatment guidelines, as well as the increase in the number of people living with HIV over time. The number of persons receiving treatment has also increased dramatically over the last 14 years, reaching 1,121,938 by end of 2017, including 1,035,615 adults and 86,323 children. This has resulted in an estimated treatment coverage of 75% among adults (84% among children) in 2017 (Figure 12).
Figure 12. Cumulative HIV related Deaths Averted by ArT
In future, need for treatment will only decrease if Kenya manages to scale up prevention and treatment to levels which results in fewer new HIV infections than the deaths among people living with HIV per year.
050
100
150200
250300350
400450
Hom
a Bay
Nairo
biSi
aya
Kisu
mu
Mig
ori
Kaka
meg
aNa
kuru
Busia
Mom
basa
Kisii
Uasin
Gish
uBu
ngom
aTr
ans N
zoia
Kilif
iM
acha
kos
Kajia
doKi
tui
Turk
ana
Vihi
gaM
akue
niKi
ambu
Mer
uNa
rok
Keric
hoNy
amira
Kwale
Garis
saNa
ndi
Bom
etM
uran
g'a
Laiki
pia
Embu
Taita
Tave
taNy
eri
Thar
aka N
ithi
Wes
t Pok
otBa
ringo
Nyan
daru
aKi
rinya
gaM
ande
raEl
geyo
Mar
akwe
tSa
mbu
ruIsi
olo
Lam
uM
arsa
bit
Tana
Rive
rW
ajir
0
10
20
30
40
50
60
70
80
90
100
2002 2004 2006 2008 2010 2012 2014 2016
AR
T Coverag
e (%)
Kenya HIV Estimates Report, 2018 19
HIV-positive pregnant women in need of PMTCT services has decreased over time from 83,200 in 2005 to 69,500 in 2017; while the PMTCT coverage has increased over time from about 23% to 76% in the same time period. With the scale-up of PMTCT services, there has been a significant decline in EMTCT rate (final transmission rate including breastfeeding) from about 29.7% in 2005 to 11.5% in 2017.
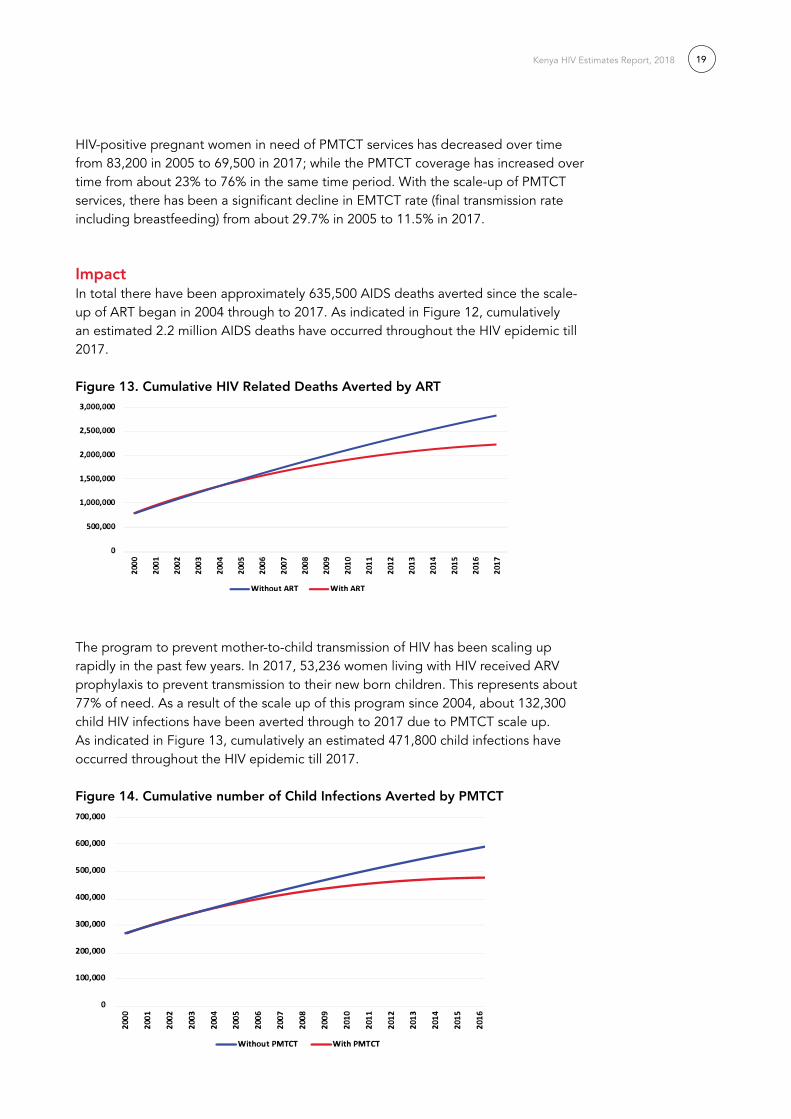
ImpactIn total there have been approximately 635,500 AIDS deaths averted since the scale-up of ART began in 2004 through to 2017. As indicated in Figure 12, cumulatively an estimated 2.2 million AIDS deaths have occurred throughout the HIV epidemic till 2017.
Figure 13. Cumulative HIV related Deaths Averted by ArT
The program to prevent mother-to-child transmission of HIV has been scaling up rapidly in the past few years. In 2017, 53,236 women living with HIV received ARV prophylaxis to prevent transmission to their new born children. This represents about 77% of need. As a result of the scale up of this program since 2004, about 132,300 child HIV infections have been averted through to 2017 due to PMTCT scale up. As indicated in Figure 13, cumulatively an estimated 471,800 child infections have occurred throughout the HIV epidemic till 2017.
Figure 14. Cumulative number of Child Infections Averted by PMTCT

Kenya HIV Estimates Report, 201820
Annex Table 1, 2, and 3 below show the full set of indicators.
County HIV EstimatesCounty estimates are summarized in Table 2. Counties HIV epidemic is geographically diverse, with the incidence rates for 2017 ranging from 0.82% in Homa Bay County in former Nyanza region to almost zero incidence reported in Wajir County in former North Eastern region.
A call to sustained action towards ‘Zero New Infections, Zero AIDS-related deaths and Zero discrimination’
The evidence presented above shows that Kenya continues to make progress towards the global targets of ‘Zero New Infections, Zero AIDS-related deaths and Zero discrimination’. Sustaining prevention focus and intensity in the areas where significant declines in HIV incidence have been achieved is critical to consolidate these gains. Emerging epidemics must be addressed effectively, and prevention efforts intensified in high prevalence areas. With increasing treatment coverage and a decline in AIDS-related deaths, a significant number of people are likely to require first and second line ART treatment in the coming years. A major challenge for the HIV programme will be to ensure that the treatment requirements of people living with HIV are fully met without sacrificing the needs of prevention or the quality of treatment programmes.
Conclusion The 2017 estimates show promising progress in ART treatment coverage, reductions in new infections among adults and children, and decreasing deaths due to HIV. The epidemic continues to be highly skewed, with a few counties contributing most of the annual new HIV infections, thus the strategy laid out in the 2014 prevention revolution roadmap, which advocated for tailoring prevention for the geographic distribution of disease is still valid.
Despite progress by Kenya in advancing towards National targets as reflected in the 2017 HIV estimates, much remains to be done to halt and reverse HIV. In absolute terms, a large proportion of Kenya’s population is infected with or affected by HIV. The number of new infections per year continues to outpace the number of deaths among HIV-infected persons, resulting in a net annual increase in the size of the infected population. The spread of the epidemic must be halted, with zero new infections the principal target for epidemic control. The vision of eliminating the impact of the AIDS epidemic can be realized through scale up of evidence-based interventions such as treatment, PrEP, voluntary medical male circumcision. Improved strategic information, through improved surveillance of recent infections, treatment initiation, viral suppression, drug resistance, and deaths among people living with HIV can help programme planners better target interventions where they are most needed. Data presented through Kenya HIV Estimates 2018 should act as a primary step to catalyse continued action.

Kenya HIV Estimates Report, 2018 21
Tab
le 2
. Co
unty
HIV
Est
imat
es f
or
2017
County
Population
ADUL
TS (1
5-49
)AD
ULTS
(15+
)CH
ILDR
EN (0
-14)
TOTA
LAD
ULTS
CHIL
DREN
PREG
NANT
WO
MEN
Adol
esce
nts (
10-1
9)Yo
ung
Adul
ts (1
5-24
)
Overall Prevalence
Male Prevalence
Female Prevalence
Incidence (per 1000)
HIV+
New Infections
HIV-related Deaths
HIV+
New Infections
HIV-related Deaths
HIV+
New Infections
HIV-related Deaths
Adults on ART
Coverage
Children on ART
Coverage
Need for PMTCT
No on PMTCT
Coverage
MTCT Rate
HIV+
New Infections
HIV-related Deaths
HIV+
New Infections
HIV-related Deaths
Keny
a4.
8%4.
5%5.
2%1.
81,
388,
169
44,7
8923
,902
105,
213
7,97
84,
312
1,49
3,38
252
,767
28,2
141,
035,
618
75%
86,3
2582
%69
,497
53,0
6776
%11
.5%
105,
230
8,17
72,
072
184,
719
17,6
672,
830
Nairo
bi 6.1
%4.7
%7.5
%2.2
182,8
566,4
992,2
328,1
3766
038
019
0,993
7,159
2,612
140,7
2477
%7,6
1194
%7,8
097,0
5690
%8.5
%10
,604
1,222
155
24,91
82,5
8729
4
Mom
basa
4.1%
2.5%
5.9%
1.938
,548
1,490
654
3,051
248
124
41,59
91,7
3877
741
,748
*2,6
3086
%1,9
681,9
7010
0%3.4
%3,1
6428
967
4,702
562
79
Kwale
3.8%
2.3%
5.4%
1.617
,877
691
303
1,415
115
5719
,292
806
361
7,286
41%
785
55%
913
445
49%
11.5%
1,467
134
312,1
8126
137
Kilifi
3.8%
2.3%
5.4%
1.630
,597
1,183
519
2,422
197
9833
,019
1,380
617
21,22
469
%2,2
3392
%1,5
621,0
8169
%8.3
%2,5
1122
953
3,732
446
63
Lam
u3.0
%1.8
%4.3
%1.3
2,445
9541
194
168
2,638
110
4995
439
%99
51%
125
9677
%7.1
%20
118
429
836
5
Taita
Tave
ta4.1
%2.5
%5.8
%1.7
9,462
366
160
749
6130
10,21
142
719
14,7
1050
%35
247
%48
317
737
%13
.4%77
771
161,1
5413
819
Tana
Rive
r1.3
%0.8
%1.8
%0.5
2,071
8035
164
137
2,235
9342
657
32%
7445
%10
625
24%
15.4%
170
164
253
304
Garis
sa0.8
%0.3
%1.4
%0.0
2,356
014
453
255
502,8
8855
193
1,296
55%
7113
%18
831
16%
28.2%
577
032
641
036
Man
dera
0.2%
0.1%
0.3%
0.00
805
049
182
1917
987
1966
445
55%
3921
%64
35%
31.4%
197
011
219
012
Waji
r0.1
%0.0
3%0.2
%0.0
0026
20
1659
66
321
621
194
74%
915
%21
00%
32.6%
640
471
04
Embu
2.8%
1.6%
3.8%
1.19,8
6636
319
385
566
3110
,721
429
225
7,846
80%
747
87%
432
302
70%
12.9%
847
3518
1,241
112
23
Mars
abit
1.4%
0.8%
1.8%
0.52,3
7287
4620
616
82,5
7710
354
1,155
49%
160
78%
104
2928
%23
.3%20
48
429
827
6
Meru
2.4%
1.4%
3.3%
0.922
,090
813
432
1,914
147
7024
,005
960
503
17,28
378
%1,6
4986
%96
655
858
%15
.9%1,8
9679
402,7
7825
152
Isiolo
3.2%
1.9%
4.3%
1.32,8
8910
657
250
199
3,139
126
661,9
7268
%24
899
%12
656
44%
19.2%
248
105
363
337
Mak
ueni
4.2%
2.5%
5.7%
1.622
,621
832
443
1,960
151
7224
,581
983
515
15,84
170
%1,7
1988
%99
054
655
%16
.5%1,9
4281
412,8
4525
753
Kitui
4.5%
2.7%
6.1%
1.726
,375
970
516
2,286
176
8428
,661
1,146
600
17,25
765
%2,0
0388
%1,1
5461
553
%17
.0%2,2
6495
483,3
1729
962
Mac
hako
s3.8
%2.2
%5.1
%1.4
27,69
51,0
1954
22,4
0018
588
30,09
51,2
0363
022
,712
82%
2,148
90%
1,211
979
81%
10.2%
2,377
9950
3,483
314
65
Thara
ka N
ithi
3.2%
1.9%
4.4%
1.27,7
7928
615
267
452
258,4
5333
817
76,0
2277
%50
775
%34
013
239
%20
.6%66
828
1497
888
18
Nyeri
3.7%
1.9%
5.5%
1.820
,559
952
398
869
5126
21,42
81,0
0342
412
,643
61%
732
84%
548
442
81%
13.5%
910
8116
1,949
265
28
Nyan
daru
a3.5
%1.9
%5.2
%1.8
15,35
571
129
764
938
1916
,005
749
316
5,944
39%
539
83%
410
340
83%
12.7%
680
6012
1,456
198
21
Kiam
bu4.0
%2.1
%5.9
%2.2
56,62
22,6
231,0
962,3
9413
971
59,01
62,7
631,1
6634
,417
61%
1,972
82%
1,510
1,836
*6.2
%2,5
0722
243
5,369
730
77
Mur
ang’a
4.2%
2.2%
6.2%
2.029
,144
1,350
564
1,232
7236
30,37
61,4
2260
012
,922
44%
935
76%
777
460
59%
20.4%
1,290
114
222,7
6337
640
Kiriny
aga
3.1%
1.7%
4.6%
1.613
,893
644
269
588
3417
14,48
167
828
69,0
7465
%62
5*
371
307
83%
12.7%
615
5411
1,317
179
19
Wes
t Pok
ot1.6
%1.3
%2.2
%0.3
5,524
104
131
488
3921
6,012
144
152
3,164
57%
478
98%
289
130
45%
19.0%
451
2211
668
4513
Turka
na3.2
%2.7
%4.5
%0.7
21,34
340
350
61,8
8715
281
23,23
055
658
84,9
4523
%71
338
%1,1
1753
148
%18
.3%1,7
4387
422,5
8217
551
Kenya HIV Estimates Report, 201822
County
Population
ADUL
TS (1
5-49
)AD
ULTS
(15+
)CH
ILDR
EN (0
-14)
TOTA
LAD
ULTS
CHIL
DREN
PREG
NANT
WO
MEN
Adol
esce
nts (
10-1
9)Yo
ung
Adul
ts (1
5-24
)
Overall Prevalence
Male Prevalence
Female Prevalence
Incidence (per 1000)
HIV+
New Infections
HIV-related Deaths
HIV+
New Infections
HIV-related Deaths
HIV+
New Infections
HIV-related Deaths
Adults on ART
Coverage
Children on ART
Coverage
Need for PMTCT
No on PMTCT
Coverage
MTCT Rate
HIV+
New Infections
HIV-related Deaths
HIV+
New Infections
HIV-related Deaths
Keny
a4.
8%4.
5%5.
2%1.
81,
388,
169
44,7
8923
,902
105,
213
7,97
84,
312
1,49
3,38
252
,767
28,2
141,
035,
618
75%
86,3
2582
%69
,497
53,0
6776
%11
.5%
105,
230
8,17
72,
072
184,
719
17,6
672,
830
Trans
Nzo
ia4.3
%3.7
%6.1
%0.9
26,61
050
363
12,3
5219
010
128
,962
693
733
12,51
047
%1,1
4449
%1,3
9361
144
%19
.2%2,1
7310
852
3,218
218
63
Naro
k2.7
%2.3
%3.9
%0.6
16,81
031
739
91,4
8612
064
18,29
643
846
37,5
1245
%88
760
%88
047
254
%16
.8%1,3
7368
332,0
3313
840
Nand
i2.0
%1.7
%2.9
%0.4
11,71
222
127
81,0
3584
4512
,748
305
323
7,681
66%
667
64%
613
476
78%
10.9%
956
4823
1,417
9628
Naku
ru3.4
%2.9
%4.8
%0.7
45,54
986
01,0
814,0
2632
517
449
,575
1,186
1,255
37,61
983
%2,9
6374
%2,3
841,9
3381
%10
.1%3,7
1918
589
5,509
374
108
Elgey
o M
arakw
et1.6
%1.4
%2.3
%0.3
4,400
8310
438
931
174,7
8911
512
12,5
4058
%23
260
%23
017
676
%11
.2%35
918
953
236
10
Laiki
pia2.7
%2.3
%3.8
%0.5
8,530
161
202
754
6133
9,284
222
235
5,386
63%
457
61%
446
305
68%
13.2%
696
3517
1,032
7020
Keric
ho2.9
%2.4
%4.1
%0.6
16,11
130
438
21,4
2411
561
17,53
541
944
416
,045
100%
1,462
*84
353
263
%14
.5%1,3
1665
321,9
4913
238
Kajia
do3.9
%3.3
%5.5
%0.8
22,85
043
254
22,0
2016
387
24,86
959
562
911
,658
51%
845
42%
1,196
922
77%
11.1%
1,866
9345
2,764
187
54
Bom
et1.9
%1.6
%2.7
%0.4
9,761
184
232
863
7037
10,62
425
426
99,1
8694
%85
099
%51
146
491
%7.7
%79
740
191,1
8180
23
Barin
go1.3
%1.1
%1.9
%0.3
5,397
102
128
477
3921
5,874
140
149
3,450
64%
364
76%
282
204
72%
12.3%
441
2211
653
4413
Sam
buru
1.8%
1.5%
2.5%
0.42,8
2053
6724
920
113,0
6973
781,1
9742
%23
293
%14
847
32%
22.2%
230
116
341
237
Uasin
Gish
u3.9
%3.3
%5.5
%0.8
29,64
056
070
32,6
2021
211
332
,260
771
816
29,55
710
0%2,0
6779
%1,5
511,1
0971
%12
.4%2,4
2012
058
3,585
243
70
Bung
oma
3.2%
2.4%
3.9%
1.327
,648
999
450
2,396
248
111
30,04
41,2
4656
122
,375
81%
2,104
88%
1,868
1,424
76%
10.8%
2,297
106
533,9
6233
871
Kaka
meg
a4.5
%3.4
%5.6
%1.8
48,75
21,7
6179
44,2
2443
719
552
,976
2,197
989
40,52
583
%3,9
7794
%3,2
942,1
7666
%13
.2%4,0
5018
793
6,986
596
126
Busia
7.7%
5.7%
9.4%
3.135
,527
1,283
578
3,078
318
142
38,60
61,6
0172
133
,654
95%
2,415
78%
2,401
1,597
67%
13.1%
2,951
136
685,0
9143
492
Vihiga
5.4%
4.0%
6.7%
2.018
,346
663
299
1,590
164
7319
,935
827
372
13,13
172
%1,3
7086
%1,2
4060
549
%17
.3%1,5
2470
352,6
2922
447
Siaya
21.0%
19.4%
22.4%
7.711
3,605
3,419
1,690
9,501
620
372
123,1
074,0
392,0
6280
,123
71%
7,462
79%
6,222
4,564
73%
12.2%
9,272
890
158
16,88
11,6
4121
8
Kisii
4.4%
4.0%
4.7%
1.534
,950
1,052
520
2,923
191
114
37,87
41,2
4363
427
,571
79%
2,337
80%
1,914
1,055
55%
16.7%
2,852
274
495,1
9350
567
Migo
ri13
.3%12
.2%14
.2%5.0
79,14
62,3
821,1
776,6
1943
225
985
,765
2,814
1,436
65,82
083
%6,1
7593
%4,3
354,0
3493
%7.2
%6,4
5962
011
011
,761
1,143
152
Kisum
u16
.3%15
.0%17
.4%6.3
112,8
623,3
961,6
799,4
3961
636
912
2,301
4,012
2,048
101,5
2790
%8,2
2587
%6,1
815,3
9887
%8.7
%9,2
1188
415
716
,771
1,630
216
Hom
a Bay
20.7%
19.1%
22.1%
8.212
8,199
3,858
1,907
10,72
270
042
013
8,921
4,558
2,326
100,6
7779
%9,6
5590
%7,0
216,3
0490
%8.1
%10
,463
1,004
178
19,05
01,8
5224
6
Nyam
ira4.2
%3.9
%4.5
%1.4
17,53
752
826
11,4
6796
5719
,004
623
318
13,43
977
%1,3
5793
%96
051
253
%17
.1%1,4
3113
724
2,606
253
34
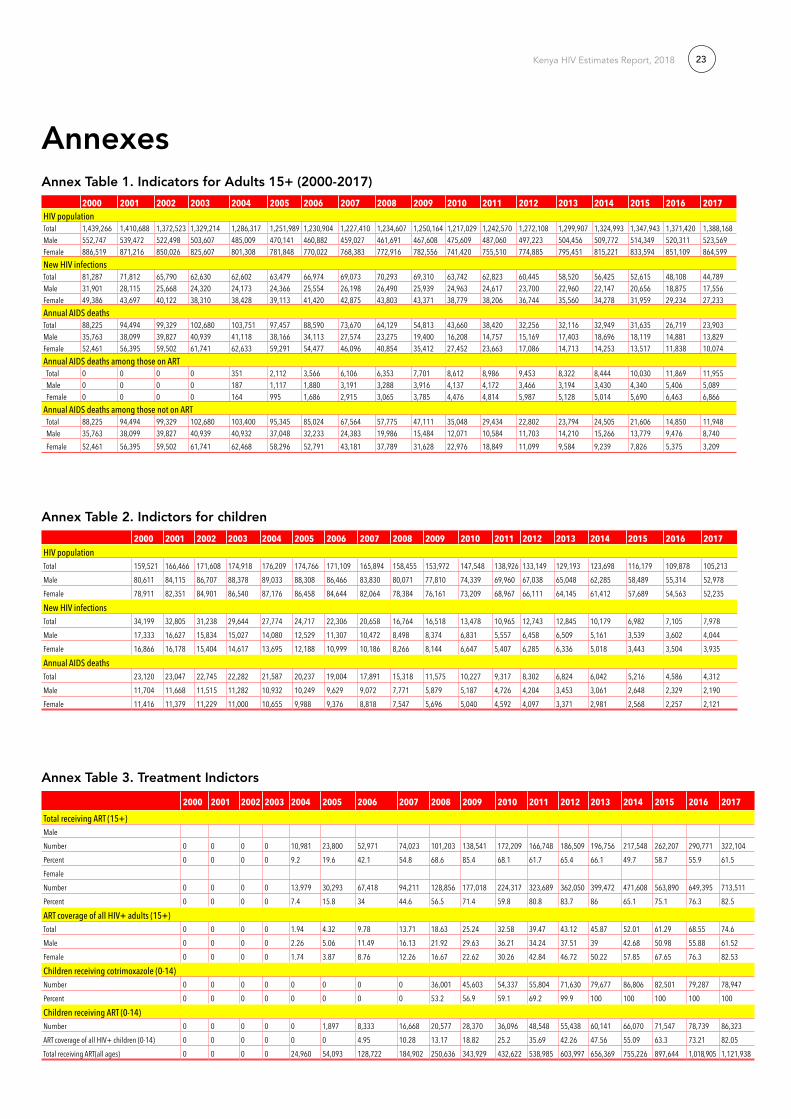
Kenya HIV Estimates Report, 2018 23
Annexes Annex Table 1. Indicators for Adults 15+ (2000-2017)
2000 2001 2002 2003 2004 2005 2006 2007 2008 2009 2010 2011 2012 2013 2014 2015 2016 2017HIV populationTotal 1,439,266 1,410,688 1,372,523 1,329,214 1,286,317 1,251,989 1,230,904 1,227,410 1,234,607 1,250,164 1,217,029 1,242,570 1,272,108 1,299,907 1,324,993 1,347,943 1,371,420 1,388,168Male 552,747 539,472 522,498 503,607 485,009 470,141 460,882 459,027 461,691 467,608 475,609 487,060 497,223 504,456 509,772 514,349 520,311 523,569Female 886,519 871,216 850,026 825,607 801,308 781,848 770,022 768,383 772,916 782,556 741,420 755,510 774,885 795,451 815,221 833,594 851,109 864,599New HIV infectionsTotal 81,287 71,812 65,790 62,630 62,602 63,479 66,974 69,073 70,293 69,310 63,742 62,823 60,445 58,520 56,425 52,615 48,108 44,789Male 31,901 28,115 25,668 24,320 24,173 24,366 25,554 26,198 26,490 25,939 24,963 24,617 23,700 22,960 22,147 20,656 18,875 17,556Female 49,386 43,697 40,122 38,310 38,428 39,113 41,420 42,875 43,803 43,371 38,779 38,206 36,744 35,560 34,278 31,959 29,234 27,233Annual AIDS deaths Total 88,225 94,494 99,329 102,680 103,751 97,457 88,590 73,670 64,129 54,813 43,660 38,420 32,256 32,116 32,949 31,635 26,719 23,903Male 35,763 38,099 39,827 40,939 41,118 38,166 34,113 27,574 23,275 19,400 16,208 14,757 15,169 17,403 18,696 18,119 14,881 13,829Female 52,461 56,395 59,502 61,741 62,633 59,291 54,477 46,096 40,854 35,412 27,452 23,663 17,086 14,713 14,253 13,517 11,838 10,074Annual AIDS deaths among those on ART Total 0 0 0 0 351 2,112 3,566 6,106 6,353 7,701 8,612 8,986 9,453 8,322 8,444 10,030 11,869 11,955 Male 0 0 0 0 187 1,117 1,880 3,191 3,288 3,916 4,137 4,172 3,466 3,194 3,430 4,340 5,406 5,089 Female 0 0 0 0 164 995 1,686 2,915 3,065 3,785 4,476 4,814 5,987 5,128 5,014 5,690 6,463 6,866Annual AIDS deaths among those not on ART Total 88,225 94,494 99,329 102,680 103,400 95,345 85,024 67,564 57,775 47,111 35,048 29,434 22,802 23,794 24,505 21,606 14,850 11,948 Male 35,763 38,099 39,827 40,939 40,932 37,048 32,233 24,383 19,986 15,484 12,071 10,584 11,703 14,210 15,266 13,779 9,476 8,740 Female 52,461 56,395 59,502 61,741 62,468 58,296 52,791 43,181 37,789 31,628 22,976 18,849 11,099 9,584 9,239 7,826 5,375 3,209
Annex Table 2. Indictors for children
2000 2001 2002 2003 2004 2005 2006 2007 2008 2009 2010 2011 2012 2013 2014 2015 2016 2017HIV populationTotal 159,521 166,466 171,608 174,918 176,209 174,766 171,109 165,894 158,455 153,972 147,548 138,926 133,149 129,193 123,698 116,179 109,878 105,213Male 80,611 84,115 86,707 88,378 89,033 88,308 86,466 83,830 80,071 77,810 74,339 69,960 67,038 65,048 62,285 58,489 55,314 52,978Female 78,911 82,351 84,901 86,540 87,176 86,458 84,644 82,064 78,384 76,161 73,209 68,967 66,111 64,145 61,412 57,689 54,563 52,235
New HIV infectionsTotal 34,199 32,805 31,238 29,644 27,774 24,717 22,306 20,658 16,764 16,518 13,478 10,965 12,743 12,845 10,179 6,982 7,105 7,978Male 17,333 16,627 15,834 15,027 14,080 12,529 11,307 10,472 8,498 8,374 6,831 5,557 6,458 6,509 5,161 3,539 3,602 4,044Female 16,866 16,178 15,404 14,617 13,695 12,188 10,999 10,186 8,266 8,144 6,647 5,407 6,285 6,336 5,018 3,443 3,504 3,935
Annual AIDS deathsTotal 23,120 23,047 22,745 22,282 21,587 20,237 19,004 17,891 15,318 11,575 10,227 9,317 8,302 6,824 6,042 5,216 4,586 4,312Male 11,704 11,668 11,515 11,282 10,932 10,249 9,629 9,072 7,771 5,879 5,187 4,726 4,204 3,453 3,061 2,648 2,329 2,190Female 11,416 11,379 11,229 11,000 10,655 9,988 9,376 8,818 7,547 5,696 5,040 4,592 4,097 3,371 2,981 2,568 2,257 2,121
Annex Table 3. Treatment Indictors
2000 2001 2002 2003 2004 2005 2006 2007 2008 2009 2010 2011 2012 2013 2014 2015 2016 2017
Total receiving ART (15+)MaleNumber 0 0 0 0 10,981 23,800 52,971 74,023 101,203 138,541 172,209 166,748 186,509 196,756 217,548 262,207 290,771 322,104Percent 0 0 0 0 9.2 19.6 42.1 54.8 68.6 85.4 68.1 61.7 65.4 66.1 49.7 58.7 55.9 61.5FemaleNumber 0 0 0 0 13,979 30,293 67,418 94,211 128,856 177,018 224,317 323,689 362,050 399,472 471,608 563,890 649,395 713,511Percent 0 0 0 0 7.4 15.8 34 44.6 56.5 71.4 59.8 80.8 83.7 86 65.1 75.1 76.3 82.5
ART coverage of all HIV+ adults (15+)Total 0 0 0 0 1.94 4.32 9.78 13.71 18.63 25.24 32.58 39.47 43.12 45.87 52.01 61.29 68.55 74.6Male 0 0 0 0 2.26 5.06 11.49 16.13 21.92 29.63 36.21 34.24 37.51 39 42.68 50.98 55.88 61.52Female 0 0 0 0 1.74 3.87 8.76 12.26 16.67 22.62 30.26 42.84 46.72 50.22 57.85 67.65 76.3 82.53
Children receiving cotrimoxazole (0-14)Number 0 0 0 0 0 0 0 0 36,001 45,603 54,337 55,804 71,630 79,677 86,806 82,501 79,287 78,947Percent 0 0 0 0 0 0 0 0 53.2 56.9 59.1 69.2 99.9 100 100 100 100 100
Children receiving ART (0-14)Number 0 0 0 0 0 1,897 8,333 16,668 20,577 28,370 36,096 48,548 55,438 60,141 66,070 71,547 78,739 86,323ART coverage of all HIV+ children (0-14) 0 0 0 0 0 0 4.95 10.28 13.17 18.82 25.2 35.69 42.26 47.56 55.09 63.3 73.21 82.05Total receiving ART(all ages) 0 0 0 0 24,960 54,093 128,722 184,902 250,636 343,929 432,622 538,985 603,997 656,369 755,226 897,644 1,018,905 1,121,938

Kenya HIV Estimates Report, 201824
2000
2001
2002
2003
2004
2005
2006
2007
2008
2009
2010
2011
2012
2013
2014
2015
Total
need
for A
RT (1
5+)
Total
182,2
2919
2,961
199,0
7820
0,751
199,6
5420
4,106
215,9
8034
7,095
368,8
2939
7,983
620,4
3966
1,515
709,5
2975
6,196
1,196
,148
1,245
,107
Male
85,39
989
,605
91,65
591
,692
90,49
991
,745
96,32
015
3,510
162,4
2917
4,665
269,8
0328
6,087
300,6
9131
3,017
484,6
4049
8,010
Fem
ale96
,829
103,3
5510
7,424
109,0
5910
9,155
112,3
6011
9,660
193,5
8520
6,400
223,3
1835
0,636
375,4
2840
8,838
443,1
7971
1,508
747,0
96
Total
rece
iving
ART (
15+)
Male
Num
ber
00
02,7
4910
,981
23,80
052
,971
74,02
310
1,203
138,5
4117
2,209
166,7
4818
6,509
196,7
5621
7,548
260,1
94
Perce
nt0
00
312
.125
.955
48.2
62.3
79.3
63.8
58.3
6262
.944
.952
.2
Fem
ale
Num
ber
00
03,4
9913
,979
30,29
367
,418
94,21
112
8,856
177,0
1822
4,317
323,6
8936
2,050
399,4
7247
1,608
560,0
20
Perce
nt0
00
3.212
.827
56.3
48.7
62.4
79.3
6486
.288
.690
.166
.375
ART c
overa
ge of
eligi
ble po
pulat
ion (1
5+)
Total
00
03.1
112
.526
.555
.7448
.4762
.3879
.2963
.9174
.1477
.3178
.8557
.6165
.87
Male
00
03
12.13
25.94
54.99
48.22
62.31
79.32
63.83
58.29
62.03
62.86
44.89
52.25
Fem
ale0
00
3.21
12.81
26.96
56.34
48.67
62.43
79.27
63.97
86.22
88.56
90.14
66.28
74.96
ART c
overa
ge of
all H
IV+ ad
ults (
15+)
Total
00
00.4
92.0
54.6
110
.4314
.5619
.6426
.3232
.1538
.4941
.6443
.8749
.2457
.78
Male
00
00.4
92.0
64.6
610
.5814
.820
26.8
32.42
30.51
33.28
34.37
37.27
44.15
Fem
ale0
00
0.49
2.04
4.58
10.32
14.37
19.36
25.96
31.94
44.48
47.83
50.77
57.8
67.45
HIV+
adult
s (15
+)
Total
1,514
,760.5
61,4
36,72
6.46
1,356
,694.2
61,2
80,93
4.54
1,217
,176.2
81,1
72,84
9.53
1,153
,804.8
41,1
55,75
4.79
1,171
,636.6
91,1
98,82
7.85
1,233
,441.0
41,2
74,23
7.54
1,317
,350.3
61,3
59,22
6.25
1,399
,611.0
81,4
40,36
1.70
Male
677,8
57.39
639,2
11.01
600,1
71.17
563,5
44.44
532,7
18.80
510,9
31.89
500,6
84.47
500,0
74.47
505,9
34.88
516,9
37.27
531,1
37.36
546,5
35.56
560,4
69.91
572,4
59.70
583,6
87.82
595,9
57.22
Fem
ale83
6,903
.1779
7,515
.4575
6,523
.0871
7,390
.1068
4,457
.4766
1,917
.6465
3,120
.3765
5,680
.3266
5,701
.8168
1,890
.5870
2,303
.6972
7,701
.9875
6,880
.4578
6,766
.5581
5,923
.2684
4,404
.49
Child
ren ne
eding
cotri
mox
azole
(0-14
)24
6,381
230,5
8421
3,647
196,7
1818
1,123
168,0
4615
7,476
148,9
8514
3,097
146,2
1414
8,848
144,1
2814
0,820
145,8
3315
1,048
150,4
41
Child
ren re
ceivi
ng co
trim
oxaz
ole (0
-14)
Num
ber
00
00
00
018
,919
36,00
145
,603
54,33
755
,804
71,63
079
,677
86,80
682
,501
Perce
nt0
00
00
00
12.4
24.8
32.3
35.9
38.2
50.4
57.1
57.1
55
Total
cove
rage f
or co
trim
oxaz
ole (0
-14)
00
00
00
012
.083.9
13.6
63.2
73.0
83.6
33.6
73.6
93.5
2
Child
ren ne
eding
ART (
0-14)
102,6
5197
,808
92,17
486
,017
79,01
671
,428
65,78
962
,571
61,20
267
,611
72,29
772
,313
76,18
384
,821
88,79
393
,056
Child
ren re
ceivi
ng AR
T (0-1
4)
Num
ber
00
00
01,9
778,3
3316
,668
20,57
728
,370
36,09
648
,548
55,43
860
,141
66,07
073
,767
Perce
nt0
00
00
2.612
.326
.133
.646
.348
.868
.874
.976
.872
.385
.5
ART c
overa
ge of
eligi
ble po
pulat
ion (0
-14)
00
00
02.7
712
.6726
.6433
.6241
.9649
.9367
.1472
.7770
.974
.4179
.27
ART c
overa
ge of
all H
IV+ ch
ildren
(0-14
)0
00
00
1.11
4.87
10.24
13.39
19.68
27.17
39.52
47.76
55.03
64.9
75.14

Kenya HIV Estimates Report, 2018 25
Annex Figure 1. Spectrum Estimate of All-Cause Mortality Compared to Vital Statistics
Annex Figure 2. Spectrum estimates of prevalence by age compared to survey estimates.
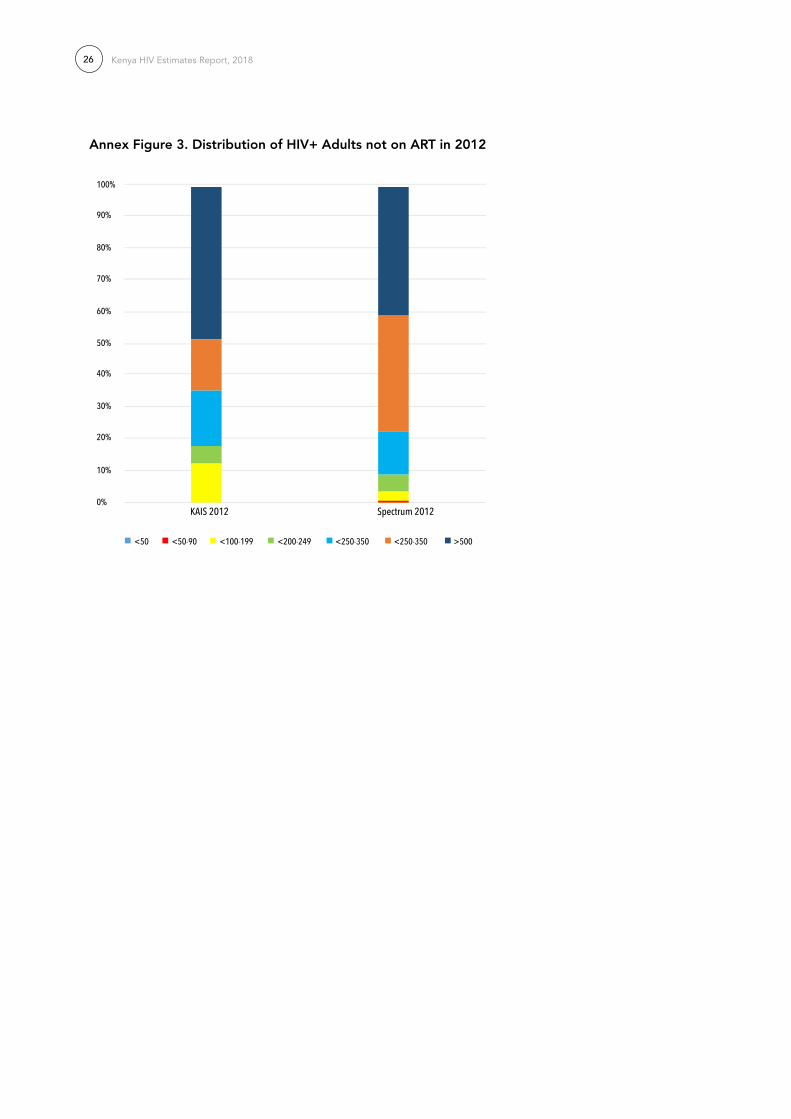
Kenya HIV Estimates Report, 201826
Annex Figure 3. Distribution of HIV+ Adults not on ArT in 2012
100%
90%
80%
70%
60%
50%
40%
30%
20%
10%
0%
<50 <50-90 <100-199 <200-249 <250-350 <250-350 >500
KAIS 2012 Spectrum 2012
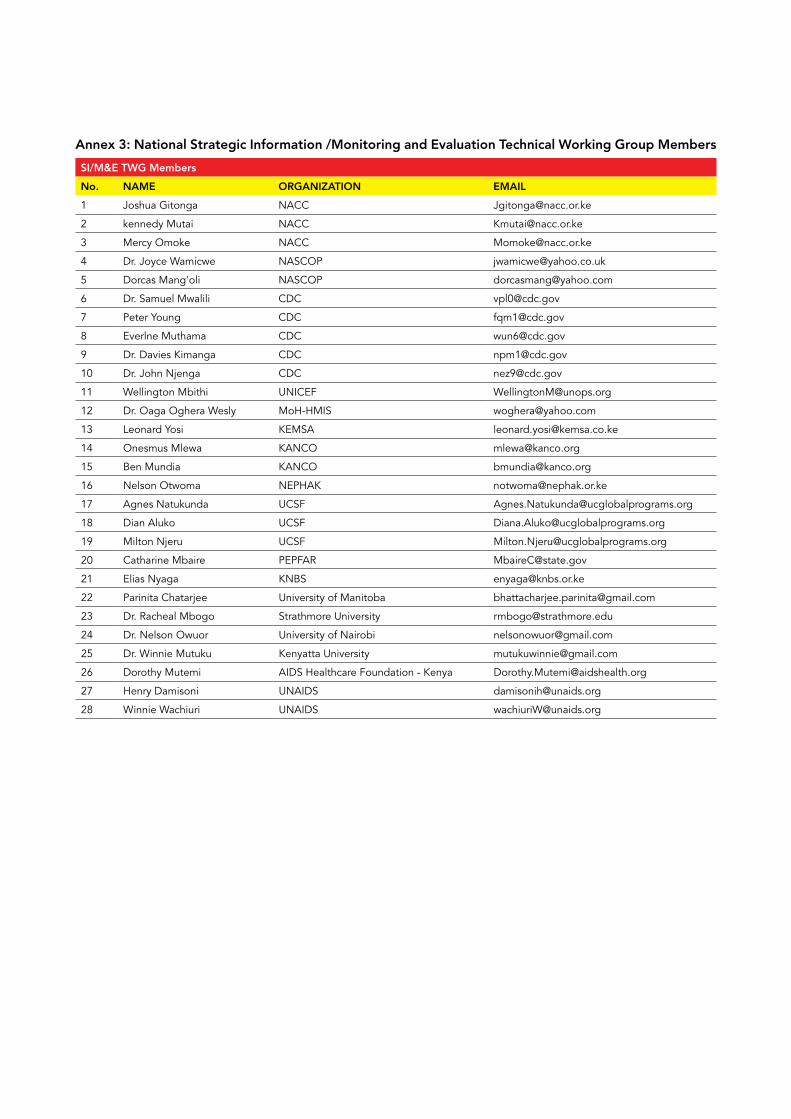
Annex 3: National Strategic Information /Monitoring and Evaluation Technical Working Group Members
SI/M&E TWG Members
No. NAME OrGANIZATION EMAIL
1 Joshua Gitonga NACC [email protected]
2 kennedy Mutai NACC [email protected]
3 Mercy Omoke NACC [email protected]
4 Dr. Joyce Wamicwe NASCOP [email protected]
5 Dorcas Mang’oli NASCOP [email protected]
6 Dr. Samuel Mwalili CDC [email protected]
7 Peter Young CDC [email protected]
8 Everlne Muthama CDC [email protected]
9 Dr. Davies Kimanga CDC [email protected]
10 Dr. John Njenga CDC [email protected]
11 Wellington Mbithi UNICEF [email protected]
12 Dr. Oaga Oghera Wesly MoH-HMIS [email protected]
13 Leonard Yosi KEMSA [email protected]
14 Onesmus Mlewa KANCO [email protected]
15 Ben Mundia KANCO [email protected]
16 Nelson Otwoma NEPHAK [email protected]
17 Agnes Natukunda UCSF [email protected]
18 Dian Aluko UCSF [email protected]
19 Milton Njeru UCSF [email protected]
20 Catharine Mbaire PEPFAR [email protected]
21 Elias Nyaga KNBS [email protected]
22 Parinita Chatarjee University of Manitoba [email protected]
23 Dr. Racheal Mbogo Strathmore University [email protected]
24 Dr. Nelson Owuor University of Nairobi [email protected]
25 Dr. Winnie Mutuku Kenyatta University [email protected]
26 Dorothy Mutemi AIDS Healthcare Foundation - Kenya [email protected]
27 Henry Damisoni UNAIDS [email protected]
28 Winnie Wachiuri UNAIDS [email protected]
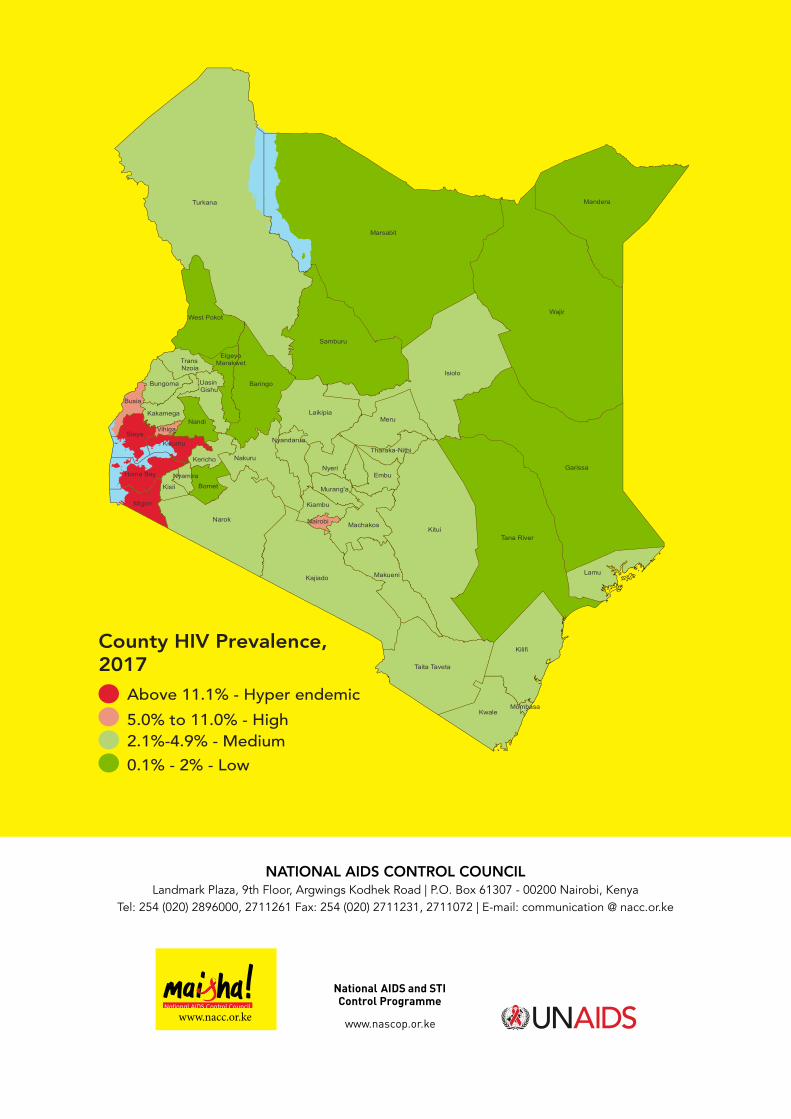
5.0% to 11.0% - High
Above 11.1% - Hyper endemic
2.1%-4.9% - Medium
0.1% - 2% - Low
County HIV Prevalence,2017
Wajir
Marsabit
Turkana
Kitui
Garissa
Isiolo
Tana River
Kilifi
Narok
Mandera
Kajiado
Samburu
Taita Taveta
Baringo
Meru
Kwale
Laikipia
Lamu
Nakuru
Makueni
West Pokot
Nyeri
Siaya
MNairobi achakos
Migori
N
Nyamira
andi
EmbuHoma Bay
Bomet
Kisumu
Kiambu
Busia
Kisii
Bungoma
Kericho
Kakamega
Murang'a
Nyandarua
Uasin Gishu
TransNzoia
Tharaka-Nithi
ElgeyoMarakwet
Vihiga
Mombasa
NATIONAL AIDS CONTrOL COUNCIL Landmark Plaza, 9th Floor, Argwings Kodhek Road | P.O. Box 61307 - 00200 Nairobi, Kenya
Tel: 254 (020) 2896000, 2711261 Fax: 254 (020) 2711231, 2711072 | E-mail: communication @ nacc.or.ke
www.nacc.or.ke