kenya national implementation plan for the...
TRANSCRIPT

REPUBLIC OF KENYA
MINISTRY OF ENVIRONMENT, WATER AND NATURAL RESOURCES
KENYA NATIONAL IMPLEMENTATION PLAN FORTHE STOCKHOLM CONVENTION ON PERSISTENT
ORGANIC POLLUTANTS
2014-2019
The project “Updating of the Kenya National Implementation Plan for the Stockholm Convention on Persistent Organic Pollutants in Kenyawas developed with the financial and technical assistance of the Global Environment Facility through the World Bank Kenya Country Office.
Stockholm Convention World Bank

1
FORWARD
Chemicals are an integral part of modern life. There is hardly any industry or service sector wherechemicals are not used. The UNEP Global Chemicals Outlook 2012 projects that chemicals productionwillcontinue to increase and sales will grow globally at 3%, with higher rates projected for developingcountries.
In Kenya, chemicals contribute about 8% of Gross Domestic Product in agriculture, trade, manufacturingand energy sectors. The country uses approximately 8.2 billion Kenya Shillings (US$100million) to importthe chemicals, of which a small part is industrial POPs, giving an idea of business in chemicals. It is in theimports of plastic products, electrical and electronic goods, computers, mobile phones, foams and flameretardants that form the bulk of the newly listed POPs occur. The main challenge that comes with chemicaluse is the proper management of chemicals across the lifecycle. Poor management of chemicals comes witha price due to poor health and degraded ecosystems.
Kenya is Party to the Stockholm Convention whose objective is to protect human health and environmentfrom persistent organic Pollutants. The first National Implementation Plan for POPs was developed andtransmitted to the Stockholm Convention Secretariat in 2007. From that time the Conference of the Partieshas added 10 more chemicals to the Convention annexes, hence necessitating the country to update herNational implementation plan. The Development of the updated National implementation plan is a keymilestone for Kenya and shows the country’s commitment to implementing the Stockholm Convention.
The Ministry of Environment, Water and Natural Resources (MEWNR) is honored to play the lead role onbehalf of Kenya in the review of policy, legal, regulatory and institutional frameworks to ensure complianceto the convention. Through it Kenya will put more effort to increased efficiency in adoption of newtechnologies and best practices in environmental management to eliminate use of intentionally producedpersistent organic pollutants and to minimize the release of unintentionally produced ones.It is important to note that the preparation of this NIP has been through a consultative and participatoryprocess that gained valuable inputs from several stakeholders in the government institutions and the privatesector. As the focal point for the Stockholm Convention the ministry will continue performing the leadingrole in the devolved system of government as provided in the Constitution 2010.
The updated National Implementation Plan shows the priority activities and strategies that Kenya will use toimplement the Stockholm Convention on POPs including the new additional POP chemicals listed in theConvention annexes A, B and C, revised emission factors, and the provisions of the Kenya constitution2010.The ministry will continue to provide for a for engagement of all the stakeholders in implementing theNIP.
Richard L. Lesiyampe (PhD) MBSPrincipal Secretary, Ministry of Environment, Water and Natural ResourcesKenya Convention Focal Point
2
ACKNOWLEDGEMENT
The Ministry of Environment water and Natural resources would like to acknowledge the efforts made bythe national institutions and the private sector and their contribution in data and information that facilitatedthe development of this National Implementation plan. These include: National Environment ManagementAuthority, Pest Control Products Board, Department of Health and Safety, Kenya Agricultural ResearchInstitute, Kenya Bureau of Standards, Kenya Revenue Authority, Kenya Plant Health Inspectorate Services,Kenya Marine and Fisheries Research Institute, Kenya Seed, University of Nairobi (UoN), Kenya MedicalResearch Institute (KEMRI), Masinde Muliro University of Science and Technology (MMUST), KenyaAssociation of Manufacturers (KAM), International Center of Insect Physiology and Ecology (ICIPE)among others.
Further acknowledgement goes to the national POPs experts who spent a lot of time to put together theprimary documents that were used in updating the NIP. These include: Mr. Francis Kihumba, Coordinatorof the process, Dr. Laetetia Kanja, Dr. Francis Orata, Dr. Vincent Madadi, Mr. Charles Mirikau, Ms.Pauline Matu, Mrs. Carol Wamai, Mr. Peter Opiyo, Mr. Mwai Mutungu and Mr. Lawrence Kalawa amongothers..
Special thanks go to Mr. Ibrahima Sow, the Chemicals Cluster Coordinator of the Global Environment forhis guidance during the
3
EXECUTIVE SUMMARY
1. Persistent Organic Pollutants (POPs)
Kenya is Party to the Stockholm Convention which is a globally binding treaty to protect human health andthe environment from POPs. The Convention requires the Parties to adopt and introduce measures to reduceor eliminate releases of POPs to protect health and the environment. Kenya developed and transmitted herfirst National Implementation Plan for POPs to the Stockholm Convention Secretariat in 2007. Thepreparation of the updated NIP is a culmination of the fact that since 2007 to 2012a total of ten additionalchemicals and groups of chemicals have been added to the Convention annexes, emission factors forcalculating unintentionally produced POPs have been revised and the fact that the new constitution ofKenya 2010 entrenches a number of approaches the country should follow in addressing health andenvironment matters.
There are 22 chemicals currently listed under the Convention. This NIP outlines the priority activities andstrategies that Kenya will follow to address management of POPs in her environment. The Plan wasdeveloped through participatory approach and in close consultation with the key national institutions,regulatory and research institutions, the private sector and the civil society.
2. POPS Inventory
The preparation of the NIP was preceded by a detailed review of the POPs inventory and assessment ofPOPs management infrastructure in the country since 2007 to ensure a comprehensive and systematicupdate the NIP. The detailed assessment reports are provided in separate annex documents volumes:
a) Vol.1 – POPs Pesticides- it provides detailed discussion of POPs production, import, export,alternatives and the human health population affected.
b) Vol. 2 Industrial POPs –it provides detailed discussion of the newly added POPs compounds andelectrical and electronic waste.
c) Vol.3 Unintentionally produced POPs-it details the assessment of UPOPs the processes that makethem produce UPOPs and the introduction of Best Available Technologies (BAT) and BestEnvironmental Practices(BEPs).
d) Vol.4 Monitoring, research, Public Education and Awareness –it provides a summary of thenational activities of public awareness, POPs monitoring activities, research and informationexchange.
e) Vol.5 Legal, Policy and Institutional aspects –it addresses the amendments to be made to makeKenya more compliant taking into consideration that Kenya has a new constitution which haverevised the roles contained in the initial inventory.
f) Vol.6 Socio Economic Assessment.
The development of these inventories followed the mechanisms provided in the convention guidancedocuments and materials which include the decisions of the conference of Parties, reports of the conventionbodies, guidelines for developing national inventories and NIPs, toolkits for developing inventories, Kenyagovernment policy documents and regulatory frame works among others.
3. Current Status of POPs
a) Pesticides POPsMost POPs pesticides are now either restricted or banned in the country. DDT continues to be banned foragricultural use and restricted for Public Health use. Kenya is currently engaged in promoting anddeveloping of DDT alternatives that need to be up-scaled to the level of commercialization. Further effortalso geared towards ensuring the control of illegal POPs entering Kenya and to dispose the presentstockpiles and wastes estimated at 200 tons, as well mopping up the remaining obsolete stocks in thecountry.

4
b) Industrial POPsKenya does not produce any of the four industrial POPs. The newly listed industrial POPs come asproducts and are released into the environment as POPs. Since 2007 there has been an exponential rise inthe amounts of Polybrominated Diphenylether (PDEs) released from computers, monitors, printers, mobilephones, televisions and refrigerators and other unclassified sources to about 144 tons. About 1.5 millionunits of PFOS fire retardants are imported into Kenya are released during training and fire-fightingactivities. The biggest threat is from plastics, electrical and electronic waste.
c) Unintentionally Produced POPs (UPOPs)Unintentionally produced POPS include: dioxins, furans and pentachlobenzene. A total of 2872 toxicequivalents (TEQs) were released in 2012. Medical waste incineration contributed 837.1 TEQ, heat andpower generation 964.1 TEQ, whereas open burning processes contributed 241.1TEQg/year.
4. Strategies and Action Plans
The NIP outlines several strategies and action plans that Kenya seeks to employ for effective managementof POPs in the country. It recognises the fact that there are a number initiatives on public education,awareness creation, monitoring and research. Assessment indicates, they are all underfunded and newfunding approaches should be put in place to accelerate these activities. There is also a lot of informationavailable on the convention website that need to be synthesized for local consumption and transmitted to thestakeholders.
The NIP update shows that Kenya lacks established national POPs monitoring programme. Most of thePOPs monitoring data in the country has been produced through Global Monitoring Program (GMP)activities. There is no systematic analysis of POPs residues in water and air from the national priority hotspots. However, the existing human and analytical capacity can support analysis of most of the basic POPspesticides and PCBs. But this requires provision of spare parts and consumables to support POPsmonitoring and research activities.
Kenya has several legislations and regulatory frameworks addressing chemical management. The draftregulations on electronic waste should be updated to include the related newly listed POPs. To comply theupdated NIP addresses the following convention obligations;
a. Awareness creation, Public Education, Research, Technical and Financial AssistanceThe assessment of existing infrastructure revealed commendable initiatives by universities, researchinstitutions and the private sector. However, there is a need to build capacity for assessment,evaluation of socio economic aspect of alternatives to POPs chemicals as well as the introduction ofBAT and BEP. This should be promoted through better networking arrangements especiallybetween the institutions in the implementation matrix.
b. Addressing future listing of chemicalsThe Stockholm convention is dynamic and assessment and listing of chemicals is continuous.There is need to continue to participate in the conventions regional and global initiatives to supportPOPs management activities.
c. Capacity buildingBecause of lack of institutional mechanism that addresses POPs, Kenya will need to build onexisting programs to create awareness and education of the general public. The threat of POPsrequires coordinated action at national, regional and county levels. This will involve working withgovernment institutions, nongovernmental organizations and the international agencies to developand implement appropriate interventions.
5
d. Financing the NIPThe total cost of the NIP is estimated at Kshs 5.8 billion Kenya Shillings equivalent to US$670million. It will be funded by the National Government, county governments, bilateral programmesand the Global Environment Facility. The detailed budget lines are detailed in the Appendix.
Lack of funding was the greatest impediments to the implementation of the first NIP. This NIPproposes an objectively organized resource mobilization strategy that will see the establishment ofthe national coordination structure for POPs management activities, establishment of thematicgroups for development of project proposals and streamlining of the NIP activities in the nationaland county development agenda.
e. Coordination MechanismThe updated NIP will be implemented over a 5 year period from 2014 to 2019 by diverse ofinstitutions specialized in POPs. The coordination office will be in the Directorate of Environment.A NIP implementation committee will be composed of Ministries of Environment Water andNatural Resources, Health, Energy, Devolution and Planning. National Environment ManagementAuthority, Pest Control products Board, Kenya Medical Research Institute, universities and ICIPE.Non government organizations will be invited to participate. The counties of Nairobi, MombasaKisumu and Garissa will be members to represent the devolved government.
5. Endorsement and Implementation
The NIP was endorsed on 21st May 2014, by stakeholders. By endorsing this NIP Kenya commits toaddress each of the action plans. This role may be specific to institutions, but also cross-sectoral. Theimplementation matrix in Annex 1 shows details of institutions specific actions.
6. The NIP lay out
The NIP has 10 chapters.
Chapter 1 reviews the POPs issues, describing the convention obligations and the chemicals to beregulated. It also gives the background of the NIP updating process.
Chapter 2 is on the country baseline in relation to POPs, political, social and economic status of Kenyawhich will influence the pace and rate of the implementation process. It highlights the fact that industrial,agricultural and waste runoff can lead to large-scale fish kills and even lower levels of chemicalscontamination of water and air can decimate fish populations over time. Chemicals contamination isassociated with diseases in fish populations including cancers, and increased vulnerability to infectiousdiseases
Chapter 3 highlights past and current programmes for monitoring releases and environmental and healthimpacts. This comes from sporadic monitoring and research much on pesticides showing levels of pesticidePOPs found in breast milk, fish, water and air.
Chapter 4 dwells on why and how Kenya needs to build on to existing programs to create awareness andeducation to the public that the threat of POPs is real and action is required at national, country and locallevels.
Chapter 5 is an assessment of current infrastructure assessment, measurement, analysis and the socioeconomic aspects of alternatives to POPs chemicals introducing BAT and Practices. Generally, more needsto be done to support what is already ongoing in terms of policy and infrastructure enhancement. Theinstitutions to do so are highlighted in Annex 1.

6
Chapter 6 recognizes that the convention being dynamic, assessment and listing of chemicals will becontinuous.
Chapter 7 is an overview of the technical and infrastructural facilities for future POPS management. Ithighlights the initiatives and progress made in monitoring POPs in the environment especially on pesticides.The main observation being that although there are several initiatives their objectives are largely academicand therefore they need high level recognition so that the findings coming out of; can influence policyformulation.
Chapter 8 addresses the summary needs of Kenya into objectives that address specific POPs and their crosssectoral nature. It highlights the policy strategic objectives and actions for POPs pesticides, listed industrialchemicals, UPOPs, monitoring and legal and policy issues.
Chapter 9 is on the technical and financial resources. It recognizes that although the convention has afinancing mechanism, the onus if for the Kenya Government to mobilize the resources from the GEF andrecognize that GEF funds attract a co-financing requirement which four parts should come the people andthe Government of Kenya.
Chapter10 concludes with specific activities that will be taken their timing and estimated financialrequirements. Annex1 is the Implementation matrix.
7
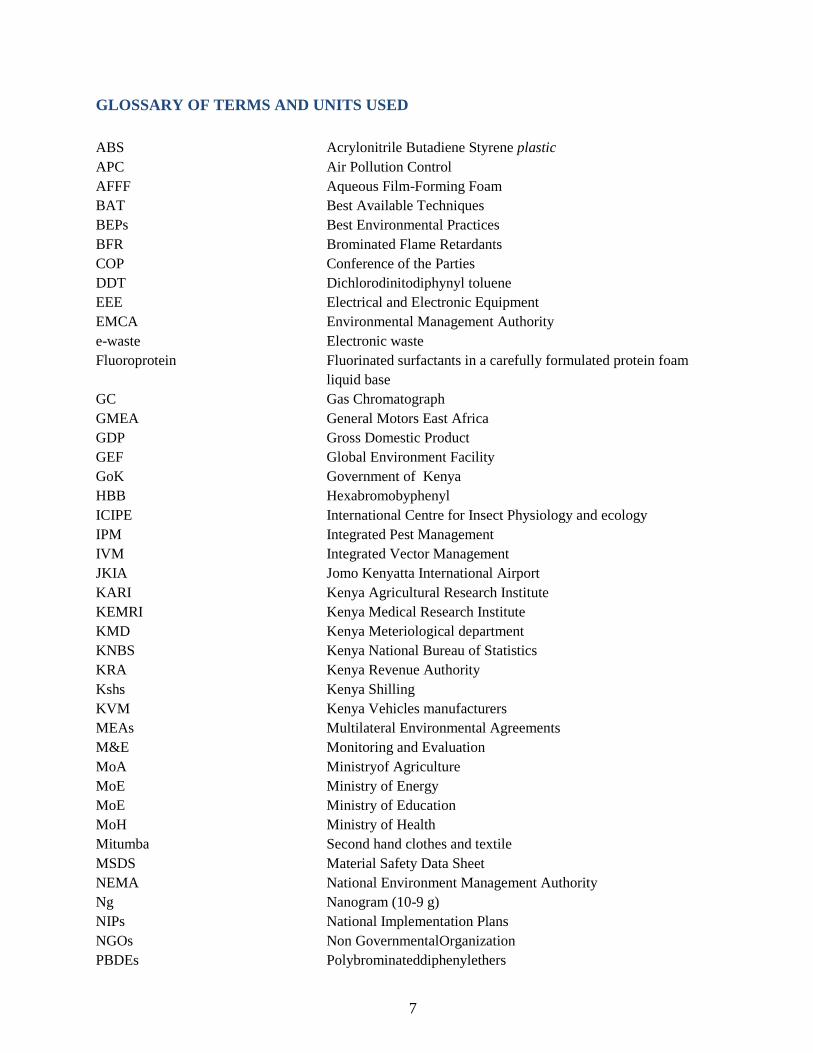
GLOSSARY OF TERMS AND UNITS USED
ABSAPCAFFF
Acrylonitrile Butadiene Styrene plasticAir Pollution ControlAqueous Film-Forming Foam
BATBEPs
Best Available TechniquesBest Environmental Practices
BFRCOPDDT
Brominated Flame RetardantsConference of the PartiesDichlorodinitodiphynyl toluene
EEEEMCAe-waste
Electrical and Electronic EquipmentEnvironmental Management AuthorityElectronic waste
Fluoroprotein
GC
Fluorinated surfactants in a carefully formulated protein foamliquid baseGas Chromatograph
GMEAGDPGEFGoK
General Motors East AfricaGross Domestic ProductGlobal Environment FacilityGovernment of Kenya
HBBICIPEIPMIVM
HexabromobyphenylInternational Centre for Insect Physiology and ecologyIntegrated Pest ManagementIntegrated Vector Management
JKIAKARIKEMRIKMD
Jomo Kenyatta International AirportKenya Agricultural Research InstituteKenya Medical Research InstituteKenya Meteriological department
KNBSKRAKshs
Kenya National Bureau of StatisticsKenya Revenue AuthorityKenya Shilling
KVMMEAsM&EMoAMoEMoEMoH
Kenya Vehicles manufacturersMultilateral Environmental AgreementsMonitoring and EvaluationMinistryof AgricultureMinistry of EnergyMinistry of EducationMinistry of Health
Mitumba Second hand clothes and textileMSDSNEMA
Material Safety Data SheetNational Environment Management Authority
Ng Nanogram (10-9 g)NIPsNGOs
National Implementation PlansNon GovernmentalOrganization
PBDEs Polybrominateddiphenylethers

8
PBTPCPBPCBPBDEs
Persistent, Bioaccumulative, and ToxicPest Control Products BoardPolychlorinated biphenylsPolychlorinated Dibromo Diphynyl Ethers
Perfluorinated Compounds Compounds with chemical formula (CnF2n+1COOH,) and(CnF2n+1SO3H, )
PFOA Perfluoroctanoic acidPFOS PerfluoroctanesulfonatePFOS-F Perfluorooctane sulfonic fluoridePg Picogram (10-12-12g)POPs POPsPUR foamSAICMSOESDE
Polyurethane FoamStrategic Approach to International chemicals ManagementState of EnvironmentState Department of Environment
TKL Toyota Kenya Ltd
UNUNDPUPOPs
United NationsUnited Nations Development ProgrammeUnintentionally Produced POPS
UNEP United Nations Environment ProgrammeWEEETEQs
Waste of Electrical and Electronic EquipmentToxic Equivalents
WHOAAKASP
World Health OrganizationAgro-Chemical Association of KenyaAfrican Stockpiles Program


10
2.4.7. Unintentionally produced POPs (UPOPs) ..................................................................................................... 412.4.8. Waste and Stockpiles of DDT ....................................................................................................................... 422.4.9. Public Awareness ......................................................................................................................................... 422.4.10. Linkages between health and environment ............................................................................................... 42
2.5. PESTICIDES – POSITIVE GAINS ..................................................................................................................................... 422.5.1. Summary of the Pesticides Action Needed................................................................................................... 432.5.2 Reduction of UPOPs Emissions .................................................................................................................... 432.5.3 Social Economic Measures ............................................................................................................................ 44
CHAPTER 3:LEGAL POLICY ISSUES SITUATION FOR POPS MANAGEMENT IN KENYA................................................ 45
3.1 BACKGROUND........................................................................................................................................................... 453.1.1. New Institutions ........................................................................................................................................... 453.1.2 New Institutional Roles for POPs................................................................................................................... 45
3.2 INTERNATIONAL AGREEMENTS ..................................................................................................................................... 463.2.2Multilateral Environmental Agreements ....................................................................................................... 463.2.3 Institutions .................................................................................................................................................... 46
3.3 COMPLIANCE ISSUES FOR KENYA:.................................................................................................................................. 493.3.1The legal, policy and institutional capacity inventory.................................................................................... 493.3.2 Inventories .................................................................................................................................................... 493.3.3Monitoring ..................................................................................................................................................... 493.3.4 Reporting ...................................................................................................................................................... 493.3.5 Capacity building........................................................................................................................................... 493.3.6Awareness Raising ......................................................................................................................................... 50
3.4. ADOPTION OF INTERNATIONAL TREATY LAW ................................................................................................................ 503.4.1 Synergy.......................................................................................................................................................... 50
3.5RECOMMENDATIONS............................................................................................................................................ 51
CHAPTER 4: ASSESSMENT OF THE 10 POPS ISSUE IN THE COUNTRY........................................................................ 52
4.1 NEW PESTICIDES ....................................................................................................................................................... 524.2 PRODUCTION, USE, IMPORT EXPORT IN KENYA................................................................................................................. 52
Currently none of the listed POPs pesticides are produced in Kenya ..................................................................... 524.2.1 Additional information on endosulfan and lidane ........................................................................................ 524.2.2Assessment of POP-PBDEs and HBB............................................................................................................... 52


12
CHAPTER 8: FINANCIAL AND TECHNICALRESOURCE REQUIREMENTS...................................................................... 98
8.1FINANCINGENVIRONMENTALACTIVITIES.......................................................................................................................... 988.2 THE CONVENTIONS FINANCIAL MECHANISM ................................................................................................................... 988.3 KENYA’SELIGIBILITY TO GEF FUNDING............................................................................................................................ 988.4 PROGRAMME PRIORITIES ........................................................................................................................................... 99
CHAPTER 9:OBJECTIVES AND STATEGIES................................................................................................................100
9.1 FORMATION OF A NIP COORDINATING COMMITTEE....................................................................................................... 1009.2 RESPONSIBILITIES..................................................................................................................................................... 1009.3 IMPLEMENTATION DETAILS ........................................................................................................................................ 100
9.3.1 Objective 1.Coordination ............................................................................................................................ 1009.3.2 Objective 2. Promoting Technology Transfer, Cleaner Production, industry and civil society participationin POPs management........................................................................................................................................... 1019.3.3 Objective 3. Enhancing Laboratory services, research for monitoring of POPs pollutants and assessmentof alternatives to toxic POPs ................................................................................................................................ 1019.3.4 Objective.4. Establishing effective financing mechanisms through inclusion of POPs programme in MediumTerm Expenditure Framework process................................................................................................................. 1029.3.5 Objective 5.Promote safer POPs alternatives as suggested by the National Implementation Plan,. ......... 1029.3.6. Objective 6. Address governance and advocacy issues.............................................................................. 1029.3.8. Objective7. Capacity Building and Technical Cooperation......................................................................... 1029.3.9 Objective 8. Technical and Financial Resource Mobilisation....................................................................... 1039.3.10 Objective9. Resource Mobilisations at Local and enterprise levels ........................................................... 1039.3.11 Objective 10. Develop, finance and implement Partnership Projects ....................................................... 103
CHAPTER10: ACTION PLANS...................................................................................................................................105
10.1 POLICY STATEMENT ............................................................................................................................................... 10510.2. ACTIVITIES,STRATÉGIES, AND ACTION PLANS FOR INTENTIONALLYPRODUCEDPOPS ........................................................... 105
10.2.1 Activity: Production, import and export, use, stockpiles, and wastes of Annex A POPs pesticides........... 10510.2.2 Activity 2: Production, import and export, use, identification, labeling, removal, storage, and disposal ofPCBs and equipment containing PCBs. ................................................................................................................ 10510.2.3. Activity 3: Production, import and export, use, stockpiles, and wastes of DDT ....................................... 10510.2.4 Activity4: Production, import and export, use, stockpiles, and wastes of Industrial POPs ....................... 10610.2.5 Activity5: Measures to reduce releases from unintentional production (Article 5)................................... 10610.2.6. Activity6: Measures to reduce releases from stockpiles and wastes (Article 6) ....................................... 10710.2.7Activity 7: Manage stockpiles and appropriate measures for handling and disposal of articles in use..... 10710.2.8 Activity8: Identification of contaminated sites and remediation .............................................................. 10710.2.9Activity 9: Facilitating or undertaking information exchange and stakeholder involvement .................... 10710.2.10Activity10: Public awareness, information and education (Article 10) .................................................... 10810.2.11 Activity 11: Effectiveness evaluation (Article 16) ................................................................................... 10810.2.12 Activity 12: Research, development and monitoring (Article 11)............................................................ 10810.2.13 Activity 13: Technical and financial assistance (Articles 12 and 13) ....................................................... 109
ANNEXES. ..............................................................................................................................................................110
RESOURCES .................................................................................................................................................................. 110IMPLEMENTATION MATRIX(S).......................................................................................................................................... 115PESTICIDES POPS ......................................................................................................................................................... 116INDUSTRIAL POPS ......................................................................................................................................................... 118UPOPS ...................................................................................................................................................................... 120ANNEX 4: MEASURES TAKEN TO MANAGE POPS IN KENYA ........................................................................................ 132
REFERENCES............................................................................................................................................................. III
TablesTable 1.POPs listed in Annexes A, B and C............................................................................................... 19Table 2 Selected Human Development....................................................................................................... 28

13
Table 3 Contribution to Gross Domestic Product of Activity (2008 - 2011).............................................. 29Table 4. POPs and their potential sources................................................................................................... 30Table 5. Energy Production ..................................................................................................................... 35Table 6: Imports of chemicals related......................................................................................................... 36Table 7: Volume of pesticide imported from 2006/2007 - 2009/2010 ....................................................... 36Table 8: National Cement Production Levels. ............................................................................................ 37Table 9 Current legal status with regard to initial POPs............................................................................. 40Table 10: Institutions and their roles in chemicals management ................................................................ 48Table 11: The new Pesticide POPs in Annex 1 .......................................................................................... 52Table 12: Use and Application of c-PentaBDE in various materials and applications in Kenya ............... 53Table 13:e-waste amount and the respective POP-PBDEs in stocks of EEE in Kenya annually ............... 55Table 14: POP PBDE release to the waste stream annually 2012 .............................................................. 56Table 15: Import and Export data of Firefighting foam containers in Kenya between the years 2005 to 2012..................................................................................................................................................................... 57Table 16: Total Releases from all Source Groups ...................................................................................... 60Table 17: Stockpiles, contaminated sites and wastes.................................................................................. 69Table 18: Summary of future production use and releases. ........................................................................ 73Table 19 Mean concentration (± SE) of Hexachlorocyclohexane (HCH) pesticide residues in water andsediment samples from Yala/Nzoia Basin .................................................................................................. 74Table 20: Mean concentration of Organochlorine pesticide levels (µg Kg-1) ±SD in various fish organs inKiambu County. .......................................................................................................................................... 74Table 21: Concentration of Organochlorine pesticide (µg Kg-1) ±SD levels in various fish organs inMachakos County. ...................................................................................................................................... 75Table 22: Mean and range of pesticide residue levels (µg/kg) in Nile perch liver and muscle samples fromLake Victoria, February – June 2001.......................................................................................................... 75Table 23: Result of Human Milk Surveys in Kenya ................................................................................... 76Table 24: Concentration (ng/L) of Endosulfan and Metabolites in Lake Naivasha................................... 76Table 25: Mean concentration of organochlorine pesticides in sediments and seaweed. ........................... 77Table 26: Endosulfan and Lindane residues detected in water samples at different sites........................ 77Table 27: Mean POPs concentrations (g Kg-1)in fish sampled in 2008 and 2003 .................................... 78Table 28: Concentrations of PFOS and PFOA in fish (in ng/g) ................................................................ 78Table 29: POPs pesticides and PCBs concentrations in ambient air, soil and fish samples ....................... 80Table 30:POPs pesticide concentrations in mothers’ milk sample ............................................................. 81Table 31: PCBs in mothers’ milk................................................................................................................ 82Table 32: Dioxins and furans measured in mothers milk samples.............................................................. 84Table 33: Summary table showing analytical research capacities for institutions...................................... 97FiguresFigure 1 Team consulting with staff of Oserian Flowers............................................................................ 26Figure 2: Horticulture facility in Naivasha ................................................................................................. 31Figure 3: Products where PBDEs were used in as flame retardants. .......................................................... 53Figure 4 Waste and the respective POP-PBDEs in stocks of EEE in Kenya.............................................. 55Figure 5 E- Wastes...................................................................................................................................... 56Figure 6: Percentage Contributions from all source categories .................................................................. 60Figure 7: The waste incineration category.................................................................................................. 61Figure 8Sample of small burners used for incineration of wastes .............................................................. 63Figure 9 Wastes packed waiting for incineration at the Provincial Hospital Incinerator ........................... 63Figure 10Nakuru Provincial HospitalMunicipal Solid Waste Incineration ................................................ 64Figure 11 Open burning at Dandora landfill; Sources: Maina Greenbelt Movement ................................. 65Figure 12Accumulated Waste at Giotto landfill Nakuru: source assessment team .................................... 66Figure 13 Open storage of AFFF at a Nairobi`s industrial area facility. .................................................... 70Figure 14: A site where PCPs were buries has been rehabilitated in Kayole Nairobi. ............................... 72Figure 15: Concentrations (ng/L) of PFOA (black bars) and PFOS (White bars) in water in Kisumu Kenya.................................................................................................................................................................... 79
14
Figure 16:Comparison of pesticide levels in background and hotspot site................................................. 83Figure 17: Photo showing sampler employing Semi-Permeable Membrane Devices ................................ 90Figure 18 Active air sampler for POPs at the Department of Chemistry, UON. ........................................ 91Figure 19: Low Volume ambient air sampling for POPs at the University of Nairobi............................... 91

15
CHAPTER 1: PURPOSE OF NIP, AND AN OVERVIEW OF THE STOCKHOLMCONVENTION.
1.0Chemicals in Perspective
The sound management of chemicals places significant responsibilities on governments and the privatesector. Many nations have created competent authorities for managing chemicals. The private sector hasestablished effective processes and practices for using chemicals appropriately and effectively managingtheir emissions and wastes. However, the need for a broad and comprehensive approach to the soundmanagement of chemicals requires recognition of different capacities and commitments of governments,institutions and industries that today manage chemicals. To carry out these responsibilities there exist abroad range of legal, professional and program instruments and approaches, which may be regulatory,economic, or technical, and which can be categorized by various goals:
First is controlling Chemical Pollution which may include pollution control activities such as end of pipesolutions with emission limits and chemical waste fees. These approaches frequently take a chemical-by-chemical or single environmental media approach. This is what the Kenyan standards are based on.
Second is preventing Chemical Pollution. In the early 1990s, Kenya Government institutions began todeploy policies that looked upstream to prevent pollution and reduce the use of toxic products, rather thancontrol downstream emissions or remediate contamination. These instruments include pollution preventionplanning, chemical accident prevention and cleaner production assessments within the technical category,as well as economic instruments such as chemical use fees and taxes and chemical leasing. The launch ofthe United Nations Environment Programme (UNEP)/United Nations Industrial Development Organization(UNIDO) Cleaner Production Program was also a significant initiative in chemicals pollution preventionwhich has seen many institutions awarded by the Kenya Cleaner Production Centre.
Third is r

16
One obstacle to reducing the use of toxic chemicals is the perceived lack of effective safer alternatives. Inassessing alternatives, issues include the functional requirements for various uses, cost, availability, andenvironmental health and safety considerations. Decision-making on chemicals of elevated concern andtheir alternatives tend to require extensive collection and analysis of information of chemicalcharacteristics, including chemical screening and characterization. Assessment, characterization, andprioritization of chemicals are important for governments with limited budgets to target their resourceseffectively. That is why in recent years, a new approach to the manufacture and use of chemicals hasemerged. Green Chemistry, or Sustainable Chemistry, seeks to reduce risk by generating chemicals that areinherently safer, rather than looking at the potential downstream impacts of chemicals. While the greatestconcentration of green chemistry activity is taking place in the developed nations, efforts are being made tocooperate with middle-income countries, developing countries and countries with economies in transitionon green chemistry approaches. UNIDO’s programs on chemical leasing as a business model
1.1 The Stockholm Convention
The Stockholm Convention on persistent organic pollutants (POPs), which was adopted in May 2001 andentered into force in May 2004, has the objective of protecting human health and the environment fromPOPs. The full text of the Convention and its annexes1 is available on the Stockholm Convention website(www.pops.int). Parties to the Stockholm Convention are required to develop national implementation plans(NIPs) to demonstrate how the obligations of the Convention will be implemented, and to review andupdate their NIPs, as appropriate, periodically and to address new obligations under the Convention. TheConvention is guided by the Conference of Parties (COP) that meets every two years. The POPs ReviewCommittee(POPRC) provides guidance on scientific, technical and economic issues regarding thechemicals to be controlled. Another expert group under the convention addresses best availabletechnologies and best environment practices (BAT and BEP).
Kenya is a party to the Convention which it ratified in 2004and transmitted her first NIP in 2007. Theamendment having entered into force on 26th August, 2010, created new compliance and implementationobligations for Kenya - to review and update its NIP and transmit it to the COP within two years of the dateof entry into force. In addition the new dispensation created by the Constitution of 20102, requires Kenya toupdate its NIP.
1.1.1Obligations to PartiesAt its fourth meeting held from 4 to 8 May 2009 the CoP to the Stockholm Convention on POPsadopted amendments to Annexes A, B and C to the Stockholm Convention to list nine new POPs.3 Theabove-mentioned amendments entered into force on 26 August 2010 for all parties, except those thathad submitted a notification of no acceptance in accordance with the provisions of paragraph 3 (b) ofArticle 22, or that had made a declaration in accordance with paragraph 4 of Article 25, in which casesuch amendments enter into force on the ninetieth day after the date of deposit of those parties’instruments of ratification, acceptance, approval or accession with regard to such amendments.
In the light of the above, pursuant to Article 7 paragraph 1 (c) of the Convention and taking intoaccount decisions SC-1/12 and SC-2/7, those parties, for which the 2009 amendments entered intoforce on 26 August 2010, should transmit their revised and updated national implementation plans tothe COP by 26 August 2012. Each remaining party will need to transmit its revised and updatednational implementation plan within two years of the date on which the amendments enter into forcefor it.
1 The Convention was amended at the first meeting of the CoP to add a new Annex G on arbitration and conciliationprocedures. The Convention text was also amended in 2009 and in 2011 to include 10 new POPs to its Annexes A, B and C.
2 The constitution devolved some issues related to POPs such as minimising emissions to counties and the titles ofimplementing agencies and institutions also changed3Decisions SC-4/10 to SC-4/18.
17
At its fifth meeting, held from 25 to 29 May 2011, the COP adopted an amendment to Annex A to theStockholm Convention to list technical endosulfan and its related isomers, with specific exemptions.4
The amendment entered into force on 27 October 2012 for all parties, except those that had made adeclaration in accordance with paragraph 4 of Article 25, in which case such amendment enters intoforce on the ninetieth day after the date of deposit of those parties’ instruments of ratification,acceptance, approval or accession with regard to such amendment.
Likewise, those parties for which the amendment entered into force on 27 October 2012 shouldtransmit their revised and updated national implementation plans to the COP by 27 October 20145.Each remaining party will need to transmit its reviewed and updated national implementation planwithin two years of the date on which the amendment enters into force for it6.
1.1.2 The risks posed by POPsPOPs are organic, natural and anthropogenic compounds which are persistent in nature. Most of themare pesticides while others are industrial chemicals and by products such as POPs have been identifiedby the world community as dangerous to health and environment and therefore requiring urgent andimmediate action at national, regional and global levels. The negotiation started in 1998 and endedafter five negotiating sessions leading to the diplomatic conference this May 2001 in Stockholm inSweden. The biggest problem with POPs in that they: Have high toxicity to man and animals Resist degradation in the environment Are not easily soluble Are highly soluble in animal fat (e.g. fish, meat) Bio-accumulate in fatty tissues Are highly mobile in regional and global environment.
The Stockholm Convention on POPs is a global treaty signed by 151 States and regional economicintegration organizations with the objective to protect human health and the environment from POPsParties to the Convention are required to develop and endeavor to put into practice a NationalImplementation Plan (NIP) setting out how they will implement their obligations under theConvention. This plan should be submitted within two years of the date on which the Conventionentered into force for that Party.
1.1.3 The need to update NIPThis updated NIP for Kenya was produced in response to the dynamic nature of the convention. Since2004, 10 additional POPs have been listed, the fact that Kenya has a new constitution, and newemission factors for unintentionally Produced POPs (UPOPs) have been established.
The updated Kenya NIP has been developed by the Ministry of Environment, Water and NaturalResources (MEWNR), State Department for Environment and Natural Resources (DENR) in closecollaboration with the other relevant Government Departments and Agencies
1.1.4 Chemicals covered by the ConventionThe Stockholm Convention currently focuses on reducing and eliminating releases of 22 POPs whichinclude the initial 12 POPs and 10 additional new POPs. Nine of the initial POPs listed in Annex Aand are destined for elimination with specific time-limited exemptions. These include the agriculturalchemicals such as aldrin, chlordane, dieldrin, endrin, heptachlor, mirex, and toxaphene, as well as theindustrial chemicals hexachlorobenzene (HCB), and polychlorinated biphenyls (PCBs). POPs listed in
4Decision SC-5/3.5 For Kenya it was required to deposit in August 20126 Thereafter it will report every two years and review its POPs emissions every 4 years

18
Annex B are subject to restrictions on production and use, but eligible for specific exemptions foracceptable purposes. These include the pesticide DDT. Annex C contains POPs that areunintentionally produced, for example as industrial byproducts and combustion processes, and includepolychlorinated dibenzo-p-dioxins, polychlorinated dibenzofurans, PCBs, and HCB. The newly listedPOPs include chemicals added to the Convention in 2009 and 2011. These include: chlordecone,lindane, alpha hexachlorocyclohexane, betahexachlorocyclohexane, endosulfan, commercialpentabromodiphenyl ether, commercial octabromobiphenyl ether, hexacbromobiphenyl,perfluorooctane sulfonic acid (PFOS), its salts, and perflourooctane sulfonyl flouride (PFOSF), andpentachlorobenzene.
1.1.5. Listed chemicals
The list of the chemicals is in Table1.
1.1.6 Risks of not complying It is against current constitution. The continued pesticide use is a risk to human health and the environment Fish Products can be affected thus impacting Kenyan and international trade Pops residue in horticulture could affect Kenya trade It does not reflect well on Kenya Internationally

19
Table 1.POPs listed in Annexes A, B and C7
Article Nature of provision Measure to Take Actiontaken
3 and4
Intentionallyproduced
POPs
PesticidesAnnex
A
Aldrin Eliminate Done
Alpha hexachlorocyclohexane* Done
Beta hexachlorocyclohexane*Chlordane Eliminate Done
Chlordecone* DoneDieldrin Eliminate Done
Endrin Eliminate Done
Heptachlor Eliminate Done
Hexachlorobenzene Eliminate Done
Lindane* Initiated
Mirex Eliminate Noactionrequired
Pentachlorobenzene* NoToxaphene Eliminate Done
AnnexB
DDT Exception Some
Industrialchemicals
AnnexA
Hexabromobiphenyl* Minimize None
Hexabromodiphenyl ether andheptabromodiphenyl ether*
Minimize None
Hexachlorobenzene Eliminate NonePentachlorobenzene* Minimize
emissionsNone
Polychlorinated biphenyls Eliminate
Tetrabromodiphenyl ether andpentabromodiphenyl ether*
None
AnnexB
PFOS, its salts and PFOSF* None
5Unintentionally produced
POPsAnnex
C
Dioxins Minimizeemissions
Some
Furans Minimizeemissions
SomeHexachlorobenzene Minimize
emissionsnone
Pentachlorobenzene* Minimizeemissions
None
Polychlorinated biphenyls Minimizeemissions
Some
* Added at the fourth meeting of the CoP and entered into force on 26 August 2010.
Source: Text of the Convention
The Stockholm Convention establishes a strong international framework for promoting global action onPOPs, which are divided into three groups according to their mechanism of production and level ofrestriction as follows.
a) Nineteen of the intentionally produced chemicals are subject to a ban on production and useexcept where there are generic or specific exemptions.
b) The production and use of DDT is severely restricted.c) Parties are required to take measures to reduce releases from the unintentional production of
dioxins, Hexachlorobenzene(HCB) and pentachlorobenzene (PeCB) with the goal ofminimizing and, where feasible, ultimate elimination. The main tool for this is thedevelopment of source inventories and release estimates as well as plans for release reductions.The use of Best Available Techniques (BAT)to limit releases of unintentionally produced POPsfrom the major sources, as categorized in the Convention, is also required.
7 Initial 12 POPS and the new 10 POPs
20
d) There are special provisions for those Parties with regulatory assessment schemes to bothreviewing the existing chemicals for POP characteristics and to take regulatory measures toprevent the development, production and marketing of new substances with POPcharacteristics.
e) The Convention also makes provision for the identification and safe management of stockpilescontaining or consisting of POPs.
f) Waste containing, consisting of or contaminated with POPs should be disposed of in such away that the POPs content is destroyed or irreversibly transformed. Where this does notrepresent the environmentally preferable option or where the POP content is low, waste shall beotherwise disposed of in an environmentally sound manner.
g) Disposal operations that may lead to the recovery or re-use of POPs are forbidden.
The Convention recognizes the particular needs of developing countries and specific provisions on technicalassistance, and the Global Environment Facility(GEF) has financial resources and mechanisms included inthe general obligations for parties in developing regions.
1.1.6 Objectives of the conventionThe key objectives of the convention are to:
a) Eliminate production and use of aldrin, edrin, toxaphene at entry into force of theconvention.
b) Control use of Chlordane, dieldrin, heptachlor, mirex, HCB and review sometimes.
c) Eliminate production of DDT for all except public health uses e.g. malaria but continuereview of alternatives developed.
d) Eliminate PCB production for all new uses but permit use of PCB in equipment and phaseout as soon as possible by 2025.
e) Minimize emission of unintentionally produced POPs such as dioxins and furans
f) Monitor environmental and health impacts of POPs.
g) Address social and economic issues.
1.1.7 Implementation activities for Kenya.Under this convention in their implementation efforts, parties are to take the following action:
i. Designate a National Focal Point
ii. Promote and facilitate a wide range of public information, awareness and education measures
iii. Encourage/undertake research, development, monitoring and cooperation on all aspects ofPOPs and their alternatives
iv. Report to the Conference of Parties (COP) on:
a. Measures taken Kenya to implement the Convention
b. Effectiveness of measures taken
c. Data/estimates for total quantities of POPs in Annex A and B that are traded, and list ofStates involved and status of Intentionally Produced POPs

21
1.1.8 Specific requirements for intentionally produced POPsIntentionally produced POPs (industrial chemicals and pesticides), production and use will beeither eliminated or restricted and, in each case, trade will be restricted.
Nine (9)chemicals are slated for eventual elimination (Annex A of the convention):
They are Aldrin, chlordane, dieldrin, edrin, heptachlor, hexachlorobenzene (HCB), mirex,polychlorinated biphenyls (PCBs) and , toxaphene
For PCBs, all Parties must: Cease production of new PCBs immediately(entry into force); andeliminate use of in-place PCB equipment by 2025; and make best efforts to identify, label andremove from use equipment containing > 50ppm, with higher priority given to equipmentcontaining higher levels of PCBs.
For DDT, Kenya must eliminate production and use except when needed for disease vectorcontrol programs and only when locally safe, effective and affordable alternatives are not available;
1.1.9. Trade issues:Most of the POPs to be controlled have trade implications. The convention provides that trade willbe restricted for all POPs in Annexes A and B and imports and exports are limited to shipments andintended for environmentally sound disposal. In each case the Convention Secretariat will beinformal.
1.1.10Unintentionally Produced POPs(UPOPs)Hexachlorobenzene, pentachlorobenzene, polychlorinated biphenyls, and polychlorinated dibenzo-p-dioxins and dibenzofurans are unintentionally formed and released from thermal processes involvingorganic matter and chlorine as a result of incomplete combustion or chemical reactions. The followingindustrial source categories have the potential for comparatively high formation and release of thesechemicals to the environment;The two classes are detailed herebelowClass I
• Waste incinerators, including co-incinerators of municipal, hazardous or• (a) medical waste or of sewage sludge;• (b) Cement kilns firing hazardous waste;• (c) Production of pulp using elemental chlorine or chemicals generating elemental chlorine for
bleaching;
Class IICategory3 are diffuse sources including:
a) Open burning of waste, including burning of landfill sites;b) Thermal processes in the metallurgical industry not mentioned in Part II;c) Residential combustion sources;d) Fossil fuel-fired utility and industrial boilers;e) Firing installations for wood and other biomass fuels;f) Specific chemical production processes releasing unintentionally formed POPs, especially
production of chlorophenols and chloranil;g) Crematoria;h) Motor vehicles, particularly those burning leaded gasoline;i) Destruction of animal carcasses;
22
j) Textile and leather dyeing (with chloranil) and finishing (with alkaline extraction);k) Shredder plants for the treatment of end of life vehicles;l) Smoldering of copper cables;m) Waste oil refineries.
According to Article 5 of the Convention, action plans shall include evaluations of current andprojected releases using UNEP Dioxin Furan Toolkit, assessing those that are derived through thedevelopment and maintenance of source inventories and release estimates, taking into consideration theSource Groups addressed in Annex C and best available technologies and practices.
1.1.11 Information exchange:According to article 9 of the Stockholm Convention (SC), each party is obliged to facilitate andundertake exchange of information relevant to reduction and elimination of the production, use andrelease of POPs (POPs), and alternative to POPs, including their risks and economic and socials costs.
1.1.12Public information, awareness and educationAccording to Article 10, each party to the Convention is required, within its capabilities, to promotepublic information, awareness and education regarding POPs among its policy and decision makers andthe general public. Each party should develop and implement education and public awarenessprogrammes on POPs and their health and environmental effects, as well as alternatives to POPs; ensurepublic participation in programmes addressing POPs and their health and environmental effects and indeveloping adequate responses. Each party is required to train workers, scientists, educators andtechnical and managerial personnel; develop and exchange educational and public awareness materialsat the national and international levels; and develop and implement training programmes at the nationaland international levels.
In implementing its obligations Kenya is required to ensure that information on POPs is kept up to date,and to encourage industry and professional users to promote and facilitate exchange of informationrelated to POPs at national and, as appropriate, at regional and global levels. In addition, there is need toprovide information on POPs alternatives using safety data sheets, mass media among other means asdeem appropriate, including establishment of information centers at national and regional levels, anddeveloping mechanisms for collection and dissemination of information on estimates of the annualquantities of the chemicals listed in Annex A, B or C that are released or disposed.
1.1.13 Research, development and monitoringArticle 11 on research, development and monitoring encourages each party to the Convention toundertake appropriate research, development, and monitoring and cooperation pertaining to listedPOPs, their alternatives and candidate POPs. Priority research activities include production of POPsdata on their: 1) Sources and releases into the environment, 2) Presence, levels and trends in human andenvironment, 3) Environmental transport, fate and transformation; 4) Effects on human health andenvironment; 5) Socioeconomic and cultural impacts; 6) Release reduction and and/or elimination, and7) Harmonized methodologies for making inventories of generating sources and analytical techniquesfor the measurement of releases.
Each party to the Convention is encouraged to support and further develop international programmes,networks and organizations aimed at defining, conducting, assessing and financing research, datacollection and monitoring, taking into account the need to minimize duplication, support national andinternational effort to strengthen national scientific and technical capacities, undertake research geared

23
to alleviate effects of POPs on reproductive health, support publication of their research, developmentand monitoring activities on timely and regular basis, and encourage and/or undertake cooperation withregard to storage and maintenance of information generated from research, monitoring anddevelopment activities.
1.2.Why NIP needs updating
The first Kenya NIP was endorsed in March 2007. Since then, the convention parties have added ten newchemicals and made new requirements to the management of POPs. They include:
Additional 10 POPs Revised the emission factor for UPOPs Drafted new guidelines for source point emissions Designated ICIPE as an the African Regional centre for developing non chemical alternatives
to pesticide POPs
These require revision of the national action plans.
1.2.1 Newly Listed POPsThe new POPs are the substances that were listed in the Stockholm Convention at the 4th and 5thCoP (COP) to the Stockholm Convention held in May 2009 and in April 2011, respectively,
Annex A substances, Pesticides (chlordecone, alpha and beta hexachlorocyclohexane (HCH),endosulfan and lindane (gamma HCH))
a)Alpha hexachlorocyclohexane
Listed in Annex A. No exemptions, it is a by‐product of lindane. Use of this chemical as aninsecticide was phased out years ago worldwide. Its formula is as shown below.
b)Beta hexachlorocyclohexane
Listed in Annex A. No exemptions, it is also a by‐

24
c) ChlodeconeListed in Annex A . No exemptions it is an organo-chlorine pesticide, chemically related to Mirex,used since 1950s but phased out.
d) HexabromobiphenylListed in Annex A. No exemptions. It is an industrial chemical used as a flame retardant. Mainlyused in the 1970s.
e)6 Hexabromodiphenyl ether and heptabromodiphenyl etherListed in Annex A with specific exemption is use in recycling of articles containing thesesubstances. Registered parties can use these substances for this purpose until 2030 components ofcommercial octabromodiphenyl ether (OctaBDE) and brominated flame retardants.5f) LindaneListed in Annex A, with a specific exemption, for use as human health pharmaceutical for controlof head lice and scabies as second line treatment. Initially used in Kenya as a broad‐spectruminsecticide for seed and soil treatment, foliar applications, tree and wood treatment and againstecto-parasites in both veterinary and human applications. Registered parties can continue usinglindane for this purpose for five years from the date of entry into force.
g) PentachlorobenzeneListed in Annex A and C it has no exemptions. Previously used in PCB products, in dyestuffcarriers, as a fungicide and a flame retardant, chemical intermediate for the production ofquintozene. Could be released unintentionally.
h) Tetrabromodiphenyl ether and pentabromodiphenyl etherListed in Annex A with specific exemption for use in recycling of articles containing thesesubstances. Registered parties can use these substances for this purpose until 2030. Components ofcommercial pentabromodiphenyl ether (PentaBDE) brominated flame retardants are as shownbelow.

25
i) Perfluorooctane sulfonic acid, its salts a and perfluorooctane sulfonyl fluorideListed in Annex B with acceptable purposes and specific exemptions for production and use.Current intentional uses of PFOS are widespread. Acceptable purposes that are allowed forregistered parties to continue to use and produce are:
1.2.2. Emissions of dioxins and furans and revised emission factorsIn accordance with the iterative revision process set forth in the Toolkit, emission factors areperiodically verified, updated and supplemented via targeted projects and research. Furthermore, asthe focus of the Toolkit is exclusively on unintentional POPs, it can be regarded as a comprehensivecompilation of emission factors for POPs releases to air, water, soil, products and residues.
The default emission factors presented in the Toolkit are drawn from a variety of data sources,ranging from laboratory experiments, peer reviewed literature and dedicated experimental projectsto governmental or institutional reports. The emission factors for each class are best estimates,based where possible on data measured at well-documented sources taking into account technology,process characteristics and operating practices, or estimates based on expert judgment. Dioxinemission factors have been revised or newly developed for the following source groups: 2 – Ferrousand non-ferrous metal production; 3 – Power generation and heating; 4 – Mineral products; and 6 –Uncontrolled combustion processes.
1.3 Mechanism used toreview and update the NIP
The NIP update was initiated by the MEWNR with the support of the Global Environment Facility. TheMEWNR established a coordination office to guide the process. Situated in the Directorate of Environment,Department of Multilateral Environmental Agreements (DMEAS) an inter-ministerial coordinatingcommittee was established.
a) Phase I – Establishment of coordinating mechanism and process organizationThis phase raised awareness within Government ministries and agencies of the POPs issue, theStockholm Convention and the need to develop updated NIP achieving political commitment to allowthe successful development of the NIP. It involved formation of updated NIP team and amechanism to involve all relevant stakeholders in particular building on work with SAICM(annex2), developed the structure, framework and procedures for the development of the updated NIP usingthe services of necessary experts, resources and facilities and initiated initiate an informationdissemination campaign.An inception workshop was held in April 2013 which brought in the principal institutions and
selected possible experts to carry out the process of updating.

26
b) Phase II – Establishment of POPs inventories and assessment of national infrastructureand capacity
This phase involved production of an updated background information on the POPs issue, including asummary of the situation within Kenya since the last NIP and how the NIP issue is currentlyunderstood and a summary of the requirements of the amended Stockholm Convention. It made apreliminary assessment of relevant sectors and activities which are likely affected by measuresrequired by the Convention and determine the stakeholders to be targeted. It had the followingactivities. This phase will endeavor to:
i. Carry out specific assessments, including targeted data generation and data gathering,required to provide the necessary background information and POPs baseline to stakeholdersunderstand the scope of the POPs issue and to complete a NIP. These assessments built asmuch as possible on existing information sources.
ii. Identified gaps in resources, capacity and knowledge which prevent the complete assessmentof the status of POPs and
iii. Identified Kenya needs in terms of technical expertise and other assistance to implement theNIP.
iv. Facilitated coordination and integration with national sustainable development, chemicalsmanagement and pollution control policies.
v. Facilitated coordination, as appropriate, with activities addressing other regional, sub-regional and international environmental agreements e.g. Rotterdam Convention especiallyfor the Eastern Africa Region.
Figure 1:Team consulting with staff of Oserian Flowers
The inventories were supported by field visits to the Central Region, Coast Region, Rift Valley,Western and Nyanza Regions. The reports of the stakeholder consultations form part of theinventories’
27
The following inventories for an Annex to this updated NIPi. POPs pesticide inventory
ii. Industrial Chemicalsiii. e-Wasteiv. Unintentionally Produced POPS and BAT and BEPv. Research, Monitoring and Public Education
vi. Legal, Policy and Institutional issuesvii. Social Economic Assessment
The inventories were validated in a workshop.
Phase III –

28
CHAPTER 2. COUNTRY BASELINE AND THE POPS ISSUE
2.1Policy Framework
The Government of Kenya recognizes the importance of managing risks posed by POPs through thedevelopment of policies and action plans as well as building the capacity for comprehensive chemicalsmanagement. In addition, the NIP responds to the existing and potential impacts of POPs on human healthand the environment. It specifies Kenya’s POPs management priorities and includes appropriate short,medium and long-term interventions to mitigate such impacts. The ministry (MEWNR) recognizes the factthat the implementation of the SC will result in improved quality of life for our people in terms of betterhealth, job creation, poverty reduction, and an improved environment. The NIP commitment is contained inthe State of Environment, 2008, the Kenya chemicals Policy and the Policy on Environment andDevelopment.
The implementation of this NIP is also an important step towards meeting the commitments of the WorldSummit on Sustainable Development whose goal is to ensure that, by 2020, chemicals are produced andused in ways that do not endanger human health and the environment.
2.1.1 Country Data ProfileKenya has a current population estimated at about 42 million and along with Ethiopia and Tanzaniais one of the most populous countries in Eastern Africa. It has the biggest and most advancedeconomy in East and Central Africa with significant industrial manufacturing, agro processing andservices development when compared to neighboring countries.
Table 2 Selected Human Development
Source: The World Bank (accessed November 2012); IMF (accessed November 2012); UNDP Human DevelopmentReport 2011
2.1.2 Economic Baseline and POPs issueThough Kenya was just recovering from a 25 year economic slump at the time when the first NIPon the POPs was prepared in 2007, the economy has since grown at an average of 4.6% perannum against a global average rate of about 3 per cent in 2012. This growth was expected toreach 4.5% in 2013 and 5.2% in 2014. The growth may be attributed to the Government’s effortsto stabilize the economy and as well as increased domestic demand and growth in credit andnotable growths in agriculture, wholesale and retail trade as well as Transport andCommunication sectors. It has not seen pesticide import grow. But industrial POPs listed havegrown and industries are more environmentally friendly, waste has increased and industries aremore environmentally friendly, waste has increased and more waste is being disposed in anenvironmentally sound manner.

29
2.1.3. Kenya’s Policy on Chemicals MarketingKenya’s general policy objective encourages a more open regime, strengthening, increasingmarket access and integrating Kenya into the world economy. Kenya’s domestic and internationaltrade is agro-based goods and other products from the industrial and manufacturing sectors whichinvolve POPs.Kenya is involving the private and public sectors in decision making and sound chemicals

30
Table 4. POPs and their potential sources
Chemical Potential stakeholders or information sourcesAlpha hexachlorocyclohexane;Beta hexachlorocyclohexane;Chloredecone;Lindane
Pesticides manufacturers, importers and distributors; pesticideregistration agencies; farmers associations; pharmaceuticalmanufacturers, distributors and retailers (for lindane); druglicensing and administration agencies (for lindane).
Hexabromobiphenyl;Hexabromodiphenyl ether andheptabromodiphenyl ether;Tetrabromodiphenyl ether andpentabromodiphenyl ether
Plastics industry; electrical and electronic equipment industry;furniture, textiles and packaging material industry; constructionindustry; industry for the recycling of electrical and electronicequipment, plastics and PUR foam.
Dioxins and Furans Incinerator, Cement manufacturers, pulp and paper Mills, ferrous, textile, transport, crematoria and waste dump sites
Pentachlorobenzene Manufacturers and users of pentachloronitrobenzene (quintozene)(Pentachlorobenzene is also listed under Annex C of theStockholm Convention; Parties are required to identify andaddress releases from unintentional sources. These includeincineration of waste, barrel burning of household waste, wastestreams from pulp and paper mills, iron and steel mills, petroleumrefineries and activated sludge from wastewater treatmentfacilities).
Perfluorooctane sulfonic acid,its salts a and perfluorooctanesulfonyl fluoride
Sectors related to the following applications:Firefighting foams, carpets, leather/apparel, textiles/upholstery,paper and packaging, coatings and coating additives, industrialand household cleaning products, floor polishes, denture cleanser,shampoos, industrial and household cleaning products, hydraulicfluids, anti-erosion additives, anti-reflective coatings, surfactants,photography, photolithography, photo microlithography, adhesioncontrol, metal plating and termite and ant bait.
Source: UNEP Guidelines 2012
2.1.4 Agricultural SectorThe agricultural sector as a tradition has remained the highest contributor to Kenya’s GDP (24%)and the main source of employment. It is also highly dependent on chemical fertilizers andpesticides. Horticulture produces being the most sensitive to use of toxic chemicals. The importanceof horticulture to Kenya’s economy is very high. While the impacts of increased generation ofPOPs are almost obvious in the agricultural sector, it is not the same in the wildlife especially fishand livestock sectors hence the need for increased protective measures to this otherwise valuedsector of the economy.
a) HorticultureHorticulture is among the leading contributors to Kenya’s agricultural gross domestic product (themarket value of all officially recognized final goods and services produced within a country in ayear, or other given period of time) at 36 per cent, and continues to grow at between 15 and 20 percent per year, employing over six million Kenyans directly or indirectly. Of the total horticulturalproduction, about 95 per cent is consumed or utilized locally, while the remaining 5 per cent isexported; yet in terms of incomes, the export segment earns the country huge amounts of foreignexchange. Horticulture earns the country approximately Sh90 billion every year.
31
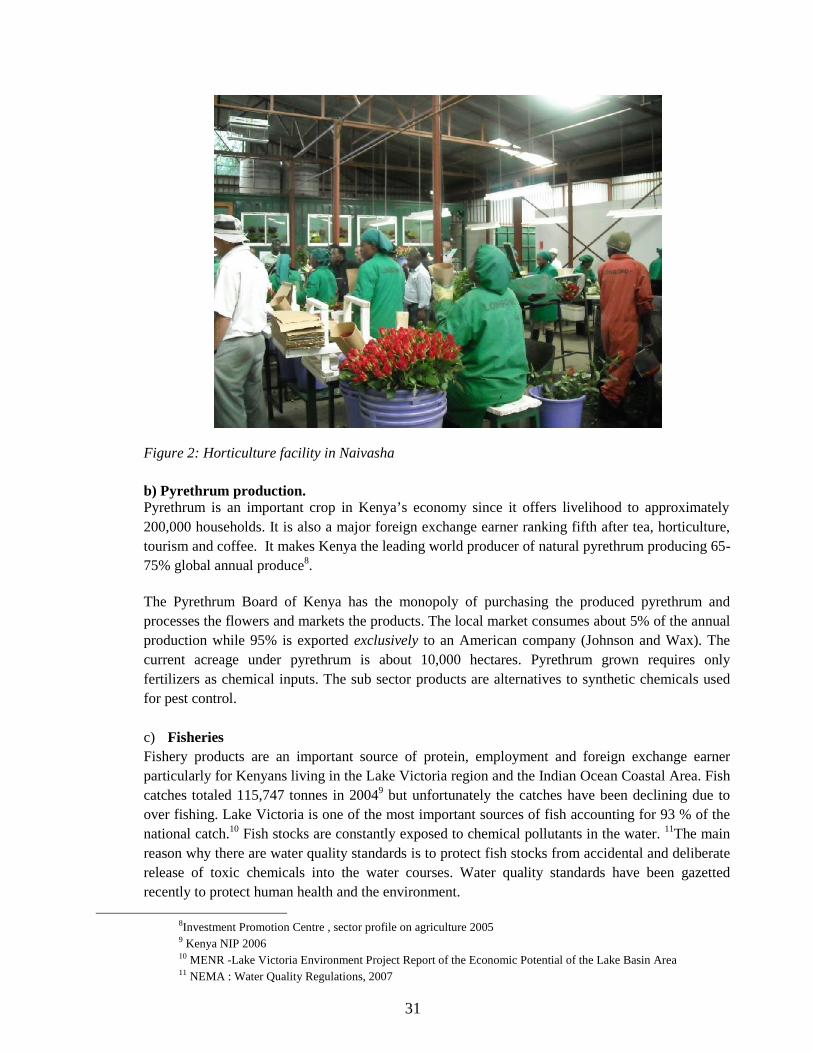
Figure 2: Horticulture facility in Naivasha
b) Pyrethrum production.Pyrethrum is an important crop in Kenya’s economy since it offers livelihood to approximately200,000 households. It is also a major foreign exchange earner ranking fifth after tea, horticulture,tourism and coffee. It makes Kenya the leading world producer of natural pyrethrum producing 65-75% global annual produce8.
The Pyrethrum Board of Kenya has the monopoly of purchasing the produced pyrethrum andprocesses the flowers and markets the products. The local market consumes about 5% of the annualproduction while 95% is exported exclusively to an American company (Johnson and Wax). Thecurrent acreage under pyrethrum is about 10,000 hectares. Pyrethrum grown requires onlyfertilizers as chemical inputs. The sub sector products are alternatives to synthetic chemicals usedfor pest control.
c) FisheriesFishery products are an important source of protein, employment and foreign exchange earnerparticularly for Kenyans living in the Lake Victoria region and the Indian Ocean Coastal Area. Fishcatches totaled 115,747 tonnes in 20049 but unfortunately the catches have been declining due toover fishing. Lake Victoria is one of the most important sources of fish accounting for 93 % of thenational catch.10 Fish stocks are constantly exposed to chemical pollutants in the water. 11The mainreason why there are water quality standards is to protect fish stocks from accidental and deliberaterelease of toxic chemicals into the water courses. Water quality standards have been gazettedrecently to protect human health and the environment.
8Investment Promotion Centre , sector profile on agriculture 20059 Kenya NIP 200610 MENR -Lake Victoria Environment Project Report of the Economic Potential of the Lake Basin Area11 NEMA : Water Quality Regulations, 2007
32
The water quality standards specifically have guidelines for discharges to the water systems toprotect fish but they do not include POPs.
There are 25 registered Fish Processing industries. The installed capacity is about 25000 tones/year.Most of the products are for export market. The fisheries sub-sector contributes about 5% of GDPand employs over 60,000 people directly with an additional 5, 000 people dependent on the fishindustry indirectly (IPC, Sector Profile Agriculture). There are 3 types of fish farming practices inKenya; warm water fish (tilapia, bass and common carp), cold mountain farming (trout), andcoastal saline water fish farming mainly of prawns. Lake Victoria produces over 90 % of the fish inKenya. The dominant species is the Nile perch, used for filleting in fish processing factories.
d) Sugar Factories and RefineriesKenya currently produces about 70% of her domestic sugar consumption. There are six registeredsugar factories with annual production capacity of 550-600,000 tonnes and four registered sugarrefineries. The registered sugar factories are Mumias, Sony, Nzoia, Chemelil, Muhoroni (underreceivership) and Miwani (under receivership). There is also Ramisi at the coast, closed, but itsrevival is underway. A new factory has been proposed at Busia while Western Kenya is a Juggeryand the Agrochemical Food Corporation (Muhoroni) produces alcohol from Molasses.These factories consume large volumes of water drawn from adjacent rivers. The effluents are pre-treated through use of stabilization ponds, which require extensive land area, before beingdischarged into the watercourse.
e) Tanneries and Leather FinishingThere are about seventeen registered leather-tanning industries in the country. Of these only eightare operational. Others have closed down. The leather tanning process requires various chemicalswhose reaction generates hazardous chemicals as well as emitting offensive smells.Most of the Kenyan leather industries process rawhide to the wet blue stage. They have seriousenvironmental problems with respect to the management of leather trimmings, chrome effluents andlime effluents from their operations. Most tanneries have effluent pretreatment plants whoseefficacy varies broadly. Their capacity to recover chrome and properly dispose the solid wastes isinadequate. Odour from tanneries has been a major cause of complaints from residents near suchfactories.
The government through KIRDI organizes awareness programs for management of hazardouswastes and related offensive smells.
f) Textiles Finishing, Spinning and WeavingTextiles, garments and apparel manufacturing have a very high potential in Kenya. The basic rawmaterial inputs such as dyes and chemicals are imported, as are all textile equipment and most spareparts.
There are 52 fabric manufacturers and 110 large-scale garment manufacturers registered with the Registrarof Industries. The mills have a combined installed capacity of 115.0 million square meters whilst thegarment manufacturing sector, has a combined capacity to process fabric into garments with a total installedmanufacturing capacity equivalent to 85% of the total national demand. It is estimated that the total fabricdemand in the country is at least 225.0 million square meters annually. The activities discharge effluentscontaining dyestuffs and solvents.

33
The leading textile industries are: Thika cloth mills ltd, premier bags and cordage Ltd, spinners andspinners Ltd, as well as JAR Kenya (EPZ) Ltd.
2.1.5 EnergyThe energy sector plays a critical role in the socio-economic development of a country12. In Kenya,petroleum and electricity as sources of energy are the main drivers of the economy, while biomass ismainly used in rural communities and a section of the urban population. Currently the energy sectorrelies wholly on the importation of all petroleum requirements. However, with the discovery of oil inNorthern Kenya this trend is likely to change. Electricity generation is predominately hydro,supplemented by geothermal and thermal sources. Apart from wood fuel which is overexploited, theother renewable energy resources, though abundant, have not been fully exploited.
About 80% of the population lives in rural areas where majority of these households still usetraditional biomass-based energy sources such as wood fuel (fuel wood and charcoal) as sources ofdomestic energy. Fuel wood accounts for about 70% of all energy consumed in rural areasamounting to 20 million m3 annually out of which, 95% is wood-fuel harvested from forests andrangelands. The sources and consumption is as detailed below;
a) CoalCoal is an affordable, competitive, reliable and easily accessible source of energy, especially forelectricity generation. Extensive coal exploration has taken place in the Mui Basin of Kitui Countywhere a total of 76 wells have been drilled with 42 wells intercepting coal seams of variousthicknesses at different depths. More wells are being drilled to appraise the coal reserves inthebasin of which Block C has been appraised to have 400 million tonnes. More coal exploration isgoing on in other parts of the country. These resources are expected to provide about 1,900MWof electricity generation by 2016 and 4,500MW by 2030.
b) PetroleumBoth refined petroleum products and crude oil are offloaded at the Kipevu Oil Terminal (KOT).The refined products are routed to the Kipevu Oil Storage Facility (KOSF) and crude oil to KenyaPetroleum Refineries facilities in Mombasa. KOT handles over 90% of the country’s imports,some of which are transit products for Uganda, Northern Tanzania, Rwanda, Burundi, EasternDRC, and South Sudan. KPRL has been refining 1.6 million metric tonnes per annum (mmtpa)against a nameplate capacity of 4mmtpa of crude oil. The refinery produces premium motor spirit(PMS), regular motor spirit (RMS), automotive gas oil (AGO), dual purpose kerosene (DPK),liquefied petroleum gas (LPG), fuel oil, grease and bitumen.
In July 2009 there was an attempt to modernize the refinery and for this reason the Governmententered into an agreement with Essar Energy Overseas Limited. The modernization would entailfull capacity utilization, residue conversion, construction of an LPG handling facility, addressenvironmental concerns and product quality requirements, and installation of a power plant
12 Ministry of Energy, Energy Policy,2012

34
c) Renewable EnergyRenewable energy, derived from the naturally occurring resources including geothermal, hydro,solar, wind and ocean energy, biomass, biofuels, biogas and municipal waste can supply
Renewable energy has the potential to enhance energy security and reliability; generate incomeand create employment; enable the country to make substantial foreign exchange savings byreducing dependence on imported fuels and its attendant price volatility, and mitigate climatechange as it has minimal adverse effects on the environment.
d) BiomassAccording to the Economic Survey 2013 biomass provides 69% of the country’s overall energyrequirements while petroleum accounts for about 22% and electricity 9%. 74.5% of the electricitycomponent is generated using renewable energy sources with fossil fuels providing the balance of25.5%. Heating and cooking in residential households with biomass is common practice inKenya. Over 74% of the people in the rural areas rely on biomass energy for cooking andheating. Wood fuel provides the bulk of total primary energy (about 70%) and meets 93% of therural household energy requirements. Agricultural and forest wastes are also used as fuel.
e) WasteLivestock (cattle, sheep, goats, donkeys) waste produces substantial quantities of methane, inmost areas with high potential for agriculture, especially where farmers practice zero grazing.Unfortunately, in this inventory, methane production could not be quantified. In many urbanareas, sawdust is used as fuel and so are plastics. In all these cases, 90% of the combustiontakes place on the traditional 3 stone fireplace designs and not the conventional Jiko (Kituyi et al.,2001). Table 18 shows the biomass consumption.
Energy consumption and production covers use of fossil fuels and plan matter mainly biomass forproduction of electricity heat and light. Fossil fuels and biomass naturally contain traceconcentrations of mercury which is released when fuel is burnt into the air but in big facilities inair pollution control systems which releases it into water systems.

35
Table 5. Energy Production
Process Activity rate
Annualconsumption/production
Coal combustion in large power plants 0Other coal uses 90,000Combustion/use of diesel, gasoil, petroleum,kerosene
118,799,200
Biomass fired power and heat production 11,512,000Charcoal combustion 1,000,000Fuel productionOil refining 81,452,900
Source: The World Bank, 2012); IMF, 2012); and UNDP, 2011.
As demonstrated in Table 2.2, the agricultural sector has recorded a steady growth of 3.8 per cent andcontributing about 24% to GDP in 2011 as compared to 21.4% in 2010.The increased contribution is mainlydue to increased production of key horticultural crops.
It will be noted in this NIP that whereas the national accounting for energy concentrates on the big twoelectricity and petroleum and somewhat just mentions biomass through cogeneration, the NIP bringsforward the importance of the fossil and household energy burning using low technology cook stoves.Further many of the tea factories drying tea are turning to wood and doing so using best availabletechnologies. Therefore wood and other biomass from sugar, rice continues to be important sources ofenergy.
This NIP notes that the contribution of the 3 stone cook stove to UPOPs is very high contributing largely todisease of the upper respiratory tract infections. Introduction of BAT and BEP therefore becomes the mosturgent in view of its linkages to health and the environment.
2.1.6Trade, Industry and Services SectorTrade, industry and services play a vital role in the country’s economy. Kenya being an open marketeconomy, imports and exports goods and services from both developed and developing countries. Theexpanding regionalization demands an integration of regional economic blocks mainly, COMESA(Common Markets for East and Southern Africa) and East African Community (EAC) which has ledto an increased momentum of growth of imports and exports of goods and services in the country,including regulated chemicals, some of them POPs Industries, trade and services will benefit byadopting environmental management systems that not only address production processes but alsopromote waste minimization, treatment and disposal.
2.2 Vision 2030
Kenya aspires to be fully industrialized by year 2030, opening up job opportunities and value addition toagricultural produce and natural mineral resources for export and local consumption. This trend ofdevelopment is expected to initiate industrial enterprises, which would in turn result in increased quantitiesand complexity of pollutants, including POPs. In order to reap the full benefits of this mode of economicdevelopment while conserving the environment, there is need to plan and develop the associatedinfrastructure to handle increased effluents and wastes. Some of the environmental challenges facing theindustry include; generation and management of solid, liquid and hazardous waste and e-waste; gaseousemissions, occupational health and safety, adoption of Cleaner production technologies and compliancewith EIA/EA, Waste and Water regulations.

36
2.2.1 Kenya’s Imports of Chemicals.Kenya is not a major producer of synthetic chemicals. But 2011 data13 reveals that extensiveextraction of minerals contributes to manufacturing like soda ash, fluorspar, diatomite, limestoneand titanium prospects. In 2008 imports, 16.5% were for chemicals and 24.8% for oil which weremostly chemicals, fertilizers and plastics. Major chemicals were in small quantities. The transportand energy sectors use chemicals and petroleum products and generate toxic waste through servicestations and garages, while the energy sector uses chemicals in power generation – fossil fuels,batteries, oil, refrigeration/metal treatment, etc. Kenya’s imports from chemical related products isshown in Table 2.3,
Most of the POPs will be included in pigments, plastics and agrochemicals. Table 2.5 shows theamounts of chemicals imported from 2003 to 2008.
Table 6: Imports of chemicals related
Articles 2008 2009 2010 2011 2012 2013ChemicalsPigments, paints, varnishes etc 7 728 10,301 10,416 10,937 13,107 15,434Soaps and cleansing preparations,perfumes
7,884 10,154 11,949 13,165 11,508 10,044
Waxes, polishes paste etc 366 286 436 796 374 489
Manufactured fertilizersNitrogenous 69,122 167,986 105,600 177,404 117,853 129,057
Phosphate 221 27,950 117 2,986 10,306 14,716
Other formulations 315,311 326,486 330,013 299,023 216,827 331,932Other CompoundsSynthetic plastic materials 175,380 175,433 170,703 193,985 219,818 222,761Insecticides, fungicides, disinfectantsetc.
7,216 8,394 8,984 9,735 10,215 9,972
Source: KNBS Statistical Abstract, 2010
As shown above pesticide imports into the country show an upward trend especially in theinsecticides group of compounds. More recent data was not available.
Table 7: Volume of pesticide imported from 2006/2007 - 2009/2010
Category2006/2007 2007/2008 2008/2009 2009/2010Quantityin tons
Value inmillion(Kshs)
Quantityin tons
Value inmillion(Kshs)
Quantityin tons
Value inmillion(Kshs)
Quantityin tons
Value inmillion(Kshs)
Insecticides 2475 1181 2887 3909 2995 2079 3181 2493Fungicides 3190 1251 2651 602 2340 3153 2415 3874Herbicides 1859 324 2289 206 2933 944 1840 939*Others 1225 362 1330 191 1413 1167 1396 918TOTAL 8749 3443 9157 4908 9681 7343 8832 8232**Source: PCPB Annual Report, 2009/2010.*Include growth regulators, surfactants and bio pesticides.
13 KNBS: Startiscal Abstract,2011

37
From the table above, approximately 8,832 metric tons of pesticides valued at Kshs. 8.2 billion wereimported into the country in 2009/2010. During this period, insecticides represented the largest quantities ofpest control products imported, indicating an increase from the previous years. It is important to note thatover four years the demand for the chemicals have been constant.
2.3Manufacturing
Manufacturing is critical for formulation and generation of POPs as pesticides, industrial POPs andunintentionally produced POPs. The key once are cement manufacturing, tanneries, plastics, textiles,tanneries etc
2.3.1 Cement ManufacturingThe UNEP Toolkit (2011) refers to other minerals with mercury impurities such as cement production,pulp and paper production, burnt lime production, cement, pulp and paper and burnt lime as sources ofmercury emissions are all produced in Kenya.There are three cement plants whose combined production capacity is 1.87 million tonnes per year.They are East Portland Cement Co Ltd in Athi River, Bamburi Portland Cement Co Ltd, and KaloleniCement Company in Kaloleni, Mombasa. The main raw materials for cement production arelimestone, pozzuolana and gypsum which are available in adequate quantities in various parts ofKenya especially in the Athi Plains and also plenty in the North-Eastern Province. In addition there isone clinker grinding plant with a combined production capacity of about 1 million tonnes/year. All theplants engage cement kilns for cement manufacture by dry process.
Table 8: National Cement Production Levels.Name of the Company Production(tonnes/annum)
East African Portland Cement company (EAPCC) 1,200,000
Bamburi Portland Cement Company (BPCC) 1,800,000
Rhino Cement Co limited 500,000
Athi River Mining 650,000
Others 420,000
Total 3,3200,00014
Source:(Yager Mining Yearbook,2010)
2.3.2Pulp and Paper ProductionPulp and Paper manufacturing is a source of mercury emissions, from trace level of mercury in the woodraw material, in fuels used for energy production and in the chemicals applied in the processes (UNEP,2005) A particular contributor to the manufacture of chlorine and caustic soda using the mercury cellchlor-alkali process. It has been reported that chlor-alkali process is no longer used in Kenya and elementalchlorine is no longer used for bleaching pulp and paper. However, because the alternative technologiesapplied have not been indicated as completely phased out, the emission estimates have been made. Basedon the information collected, only air distribution was applied because only the air emission factor wasused. Plastic products from Kenya are marketed locally and to the preferential Trade Area region in Africanow called Common Market for Eastern and Southern Africa, COMESA.
14 T Yager:2009, Minerals Yearbook. Kenya

38
2.3.3 Plastics ManufacturingThis is a major investment of Ksh50 Billions and having influence in all sectors of the economy in201115 it was estimated that production was 2247800 tonnes which is a major contribution. About 10%of it goes back to the environment. There are about three hundred formal establishments and twentythree registered manufacturers of plastics of various grades there are several other enterprises notmembers of the Kenya Association of Manufactures because some are very small scale association. Ofthe total only seventy have the capacity to recycle their factory waste. About twenty enterprises dorecycle street plastic waste but only two do recycle street polythene waste. The latter is a majorenvironmental nuisance due to its persistence in the environment leading to loss in property values,livestock deaths, drainage blockage, and mosquitoes breeding sites receptacles. These wastesadversely affect the aeration of the soil leading to decreased land productivity.
The plastics industry is well developed and produces goods made of polyvinyl Chloride (PVC),polyethylene, polystyrene, and polypropylene. All raw materials are imported in the form of granules.There are other attempts to recycle plastics through different approaches resulting in varied
environmental compliance requirements. Some are associated with serious environmental and healthimplications.
The major players in recycling and production of plastics are: Acme Container ltd, packagingindustries, prestige packaging and specialized fiberglass ltd. Roto Molders ltd reported wastegeneration of 5-10 kg/month and average noise levels slightly above the 90 Bb limit.
There are more than 10 plastic industries in Kenya with capacities ranging from 1000 to 8000tonnes per year. Most of them are located in Nairobi and Mombasa with a few in Kisumu,Nakuru, Eldoret, and Thika. The plastics industrial subsector has benefited from the advancetechnology changes that have occurred in the manufacturing industry resulting in increasedproduction and diversity of plastics products. The plastics subsector in Kenya mainly produces: Polythene Packaging Bags, Plastic Crates and Bottles, PVC Pipes And Fittings, Floor Tiles and mats Plastic Shoes Household Plastic Wares (plates , cups) Plastic Containers for Domestic and Industrial use, and. Films and sheets for green house stationery and electronics after use they are either burnt or
dumped.
The plastics sector currently constitutes approximately 150 industries, and has an annual growthrate of 6%; currently, there are about 17 firms that recycle plastics locally. Plastics contribute28% of all cadmium found in municipal solid waste and approximately 32% of all lead;substances that are highly toxic to humans and the environment in general.
2.3.4 Tyres/ Rubber productsThe plastic industry is also categorised with rubber products the main being tyres. Tyres are acomposite of styrene-butadiene copolymer or natural rubber, chloroprene, polyamide, steel wire,carbon black and numerous other organic and inorganic additives. Tyres contain low concentrationsof chlorine; they also contain significant sulphur, similar to that of medium sulphur coal, as a result
15Kenya Association of Manufacturers-Manufacturing Survey 2012

39
of vulcanization. Sulphur inhibits formation of POPs in combustion; the probability for generationof chlorinated POPs in this waste is probably lower than for mixed waste. However, poorcombustion of large volumes of tyres in open burning situations is a source of PCDD/PCDF and willcertainly be a prodigious generator of other hazardous pollutants, including SO2 and polycyclicaromatic hydrocarbons. Removal of tires form waste dream is therefore useful. Depending on theirsize and utilization, tyres vary in design, construction and total weight. As an example, the weight ofa used passenger tyre in Europe is about 6.5 kg and that of a truck tyre is about 53kg.
2.3.5 Pesticides &FertilizersThe rapid expansion of the agricultural sector has resulted in increased demand for agrochemicals.Kenya does not have pesticide-manufacturing facilities but only formulates. There are about 32registered enterprises involved in this formulation. The active ingredients are imported and theformulation carried out locally. This activity is associated with dust; offensive smells and related airpollution issues. Most of the industries have incorporated dust control equipment for the indoorenvironment.Operations focus on treating /recovering the collected dust which is part of their products. Theseproducts impact on the environment during usage. The accompanying wastes comprise organo-chlorines or organophosphate compounds, which are indiscriminately disposed in the environment.
2.4. Review of NIP 2007
The NIP 2007 is available in the convention website www.pops.int/countries.
2.4.1 Expectations of NIP 2007The following are actions for intentionally produced POPs like pesticides, DDT, PCBs andHexachlorobenzene:
i. Ensure that in future Kenya does not produce any intentionally produced POPs pesticides;
ii. Search for alternatives to DDT especially from Pyrethrum flower;
iii. Controlling illegal entry of POPs by banning those not yet banned;
iv. Adopt legislation banning or restricting the use of PCBs;
v. Prepare institutions, such as Kenya Power and Lighting, KENGEN, etc., for labeling of thePCB equipment in use consistent with the provisions of the Convention;
vi. Comprehensive inventory of PCBs undertaken using better analytical technology to identifyequipment containing PCBs in concentrations of 50ppm or greater and labeling such equipmentaccordingly;
vii. Give special focus to abandoned d industrial sites that still contain disused power transformersand/or capacitors and in what is an environmentally sound manner;
viii. Monitoring those POPs currently in use and with POPs like characteristics.
ix. Promoting awareness on international regulations on DDT
x. Finalizing policy on DDT and streamlining political consultation;
xi. Developing alternatives to DDT.
xii. Defining linkages between potential DDT and other multilateral environmental agreements;
xiii. Mobilizing resources for alternatives to DDT

40
2.4.2 Annex A pesticidesIn the NIP 2007it was noted that the national level of technological systems were inadequate interms of capacity to minimize releases of existing POPs –pesticides. Additionally, the workers andpopulation exposed to these chemicals were not adequately educated on the health risk and notadequately protected from the hazards. The NIP also took note of the fact that thecommunities/public were at risk of exposure to the POPs-pesticides because the legal andinstitutional frameworks were weak and not keen in implementation because of low levels ofawareness. In addition, it was established that there were inadequate facilities such as laboratoriesand equipment for the analysis and monitoring of POPs. The MEWNR is mandated to protect,conserve and sustainably manage the environment and natural resources in the country. The PestControl Products Board (PCPB) is a statutory organization of the Kenya Government establishedunder the PCPA, Cap 346, and Laws of Kenya regulating the importation, exportation,manufacture, distribution and use of Pest Control Products (Pesticides). The summary ofinformation of the situation of new pesticides POPs, stock piles, obsolete/ wastes and contaminatedsites gathered during the site visits and indicates the remedial measures that need to be undertaken.Key actions noted were:
i. PCPB has listed Banned and Restricted chemicals in the country;ii. The Pest Control Products Act is undergoing revision to include new pops
iii. Some roles and responsibilities of institutions identified in NIP 2007 have been revised;iv. No stockpiles or obsolete pesticide POPs reported in all the areas visited except for a few
expired chemicals not necessarily POPs that were reported in two sites;v. No registers kept for expired chemicals and some had no labels;
vi. Some workers reported getting sick after spraying certain chemicals;vii. Lack of adequate facilities for proper identification of POPs;
viii. Laboratories not properly equipped and capacity to do some analysis lacking;ix. Lack of understanding of some stakeholders e.g. those holding obsolete POPs – detailed
required information not given;x. There was suspicion (unconfirmed) that there is a possibility of some banned chemicals
entering the country from the neighboring countries and repackaged; andxi. Some of the banned pesticides formulated with others ( not POPs) and sold to non
suspecting farmers
The updated NIP builds on the successes of the NIP 2007 in its implementation, as detailed below.
2.4.3 Legal Measures already undertakenKenya has taken legal and administrative measures necessary to eliminate the use pesticide POPs incompliance to the Stockholm Convention.
Awareness creation by training and publication Putting in place necessary mechanisms for compliance monitoring and enforcement; Comprehensive study of all pesticides POPs alternatives should be undertaken;
Table 9 Current legal status with regard to initial POPs

41
Chemical
Name
Stockpiles,Contaminated Sitesand Wastes
Action and Measures Legal
Framework
Aldrin None Banned in 2004 PCPA
Chlordane None Banned in 1986 PCPA
Dieldrin None Banned in 2004 PCPA
Endrin None Banned in 1986 PCPA
2.4.4 DDTa) Since NIP 2007 no DDT has been imported, though there has beenno request for its
reintroduction.b) The need to gradually shift from DDT to alternatives was also recommended in the NIP 2007.c) Efforts have been made to search for alternatives.
2.4.5 Pyrethrum as DDT AlternativesPyrethrum was identified as the most effective environmentally sound and locally availablesubstitute to DDT. Kenya was the largest producer of pyrethrum accounting for over 80% of theworld’s production and was expected to be able to supply between 7,000 and 10,500 tonnes of dryflower equivalent per annum. The NIP report recommended enhancement of research in pyrethrumtowards increasing its production. It also called for pilot studies in order to “determine theirefficacy and applicability”.
The Pyrethrum Board of Kenya had the monopoly for purchasing produced pyrethrum, process theflowers and market the products. The local market consumed about 5% of the annual productionwith the remaining 95% being exported exclusively to an American company (Johnson Wax).There are plans to expand the export market to other regions (IPC, 2009).
2.4.6. PCBsNIP 2007 found that Kenya had stopped importing PCB products. It only needed to manage thetransformers with PCPs. Since then obsolete stocks of PCBs that had been buried have beenexported for destruction according to the guidelines provided under the Basel Conventions16.
As part of the action plan in this updated NIP, a more comprehensive inventory of industrial POPSshould still be concluded with the aim to capture those facilities that were not included in theNIP2007 and those in the preliminary list that were not visited. The Kenya Power and Lighting,KENGEN and Webuye Paper Mills had the largest stocks.
2.4.7. Unintentionally produced POPs (UPOPs)The NIP also established that the major source categories of UPOPs were incineration of medicalwastes; open burning of municipal and agricultural waste and pulp and paper production. However,since then, the emission factors have been revised.
NIP 2007 highlighted disposal of medical waste as a critical source of emissions. Since then all themajor hospitals in Nairobi have incinerators but still there is need for attention to this sourcecategory. On the handling and disposal of medical waste, there has been action to train currentpersonnel and upgrade the incinerators in use; It was also established that there were inadequate air
16 Basel Convention has guidelines that deal with waste that contain POPs. The guidelines are available onwww.basel.int
42
pollution control measures in place and that efforts were being put in place to control discharge ofUPOPs to rivers he operators was generally low.
2.4.8. Waste and Stockpiles of DDTIt was established that there were significant quantities of waste and stockpiles not only of thestockpiles but also of POPs contaminated wastes.
The first POPs inventory done in 2006 indicated that most of the residual DDT was held by theKenya Farmers Association in Nairobi, the Rift Valley and Central Provinces. The total amount ofobsolete DDT identified nationwide was then 1,338 kg, which has now been disposed of togetherwith other wastes (PCPB).
2.4.9. Public AwarenessAwareness raising of the public especially small scale farmers of the innovation in alternatives notwide; however for the international corporations it is good.
2.4.10. Linkages between health and environmentThough no comprehensive studies specific to the chemicals in question were evident, the increasingawareness of the impacts of chemicals to human health were evident. The NIP noted that therewere reports of increased cases of cancer and chemical related diseases in the country, but there isnot cause/effect relationship. Lack of data should not stop precautionary action.
The Ministry of Health through the Division of Malaria Control has been committed to achievingthe targets of Roll Back Malaria initiative, the Abuja Declaration, and the Millennium DevelopmentGoals through the Economic Recovery Strategy. This commitment was expressed through theNational Health Sector Strategic Plan (2008-2012) and the National Malaria Strategy (2009-2017).The goal of the new National Malaria Strategy is to reduce morbidity and mortality caused bymalaria by two thirds of the baseline in 2007/2008 among the Kenyan population by the year 2017.
Though not in significant magnitudes, the 2007 NIP took note that Pesticides residues were foundin fish especially in shallow inland Rift Valley lakes of Nakuru and Naivasha. Increased use ofpesticides was blamed for the death of flamingos and reduced bird life in Lake Naivasha (Mogakaet al., 2006). The levels of DDT, DDE and other organochlorine were also noted as potentiallyhazardous if not addressed as well as increased agricultural activities in the various ecosystemsfeeding the two lakes. The impacts of disused facilities like the Pan-paper Ltd and the KenyaPetroleum Refineries will need to be closely monitored. Currently it is still not documented.
2.5. Pesticides – Positive Gains
Pesticides received much attention in the 2007 NIP.
a) The recommendation of NIP 2007 for alternatives to POPs pesticides has been successful. A visit toNaivasha area with 56 flower farms showed that none is using any of the listed pesticides. Companieslike Oserian, Finlay Flowers and other have almost commercialized non chemical alternatives usingpurely private resources.
b) Capacity building - Initiatives by the Government agencies were supported by development partnersthrough specific programs. Specific mention may be made of the Universities e.g. Maseno, MasindeMuliro and Nairobi Universities (annex 12 1nd 4) that have made tremendous efforts to build thenational capacity to train and monitor POPs but also to develop cost effective alternatives. This impliesthat the capacities of these Universities and institutions to handle new POPs must be strengthened.Capacities are still massing for analysis of sophisticated POPs such as PBDEs, PFORS, Dioxins andfurans.
43
c) Residue Monitoring POPs Pesticides - The private laboratories sector e.g. SGS Kenya Ltd, Governmentchemist and universities can now analyze a wide range of POPs pesticide. But the requests for POPsanalysis are not many. To be able to harness these initiatives and for efficiency and effectiveness, thecountry may wish to develop and equip zonal laboratories as centre’s of excellence with the state of theart equipment in national research institutions, universities and regulatory bodies to monitor POPs inenvironment and products.
2.5.1. Summary of the Pesticides Action NeededThe following are the priorities for stockpiles and wastes: -
i. Dispose of about 15,000 tones of obsolete pesticides distributed across the nation in variousdifferent conditions of storage in an environmentally sound manner;
ii. Rehabilitate obsolete pesticides at sites detailed in the POPs Inventory and especially at Wajir,Kitengela, Dandora dumpsite and Nakuru;
iii. Evaluating efficacy of alternatives to POPs;
iv. Reduce risks associated with hazardous chemicals through the use of safe chemical practices;
v. Provide necessary advice and guidance to stakeholders involved in cleanup and disposaloperations for stockpiles and wastes;
vi. Partner with sector organizations especially the Agrochemical Association of Kenya and PestControl Products Board to address POPs;
vii. Participate in Global POPs Monitoring Program;
viii. Manage PCB waste stockpiles already identified.
2.5.2 Reduction of UPOPs EmissionsFor UPOPS these were the priorities;
i. Developing regulations on dioxins and furans which has startedii. Developing mechanisms for minimizing emissions from open burning process in which a few
studies have been undertakeniii. Introduction of Best Available Technologies and Best Environmental Practices to priority areas
in incineration, open burning, industriesiv. Assessment unintentional production of PCBs and hexachlorobenzene which could not be made
because the guidelines are not available ;v. Give priority to the source categories in Annex C of the convention having high dioxin
emissions as identified in the dioxin and furan inventory;vi. Train personnel involved in the handling and disposal of medical wastes which has largely been
a success.vii. Upgrade incinerators to meet emission levels consistent with the BAT/BEP guidelines and
other regulations which is ongoingviii. Support to public awareness programmes on proper waste handling, especially biomass and
municipal wastes, and the need to discontinue open burning practices of waste; which isongoing.
ix. Regulate governing environmental monitoring of contaminants, discharges and emissions frompulp and paper industries should be developed and enforced.
44
Various improved methods of POPs related waste disposal are in place. The National Health andSanitation policy as per the NIP had recommended construction of standard incinerators. It is observedthat there are incinerators(Annex 3) located in various institutions especially medical facilities.KEMRI has continued to operate efficient incinerators in Kisumu and Nairobi but their capacity wassaid to be increasingly over-stretched from other sources of medical waste. The county of Nairobi withsupport by UNEP and Japanese International Cooperation Agency have developed an integrated solidwaste management programme which took into consideration recommendations contained in the BATand BEP guidelines by UNEP. Nakuru and Kisumu County have programmes with the FrenchGovernment for construction of sanitary landfills but have not succeeded yet.
2.5.3 Social Economic MeasuresThe NIP had recommended use of economic and environmental tools and instruments. Their userequires compliance to BAT and BEP guidelines appropriate design to enhance awareness includingsocial acceptability, cost effectiveness and their economic feasibility. It can be appreciated thattraining in use of these tools has been on-going albeit not focused to POPs and POPs alternatives.
The use of economic and environmental tools and instruments including financial incentives forconsideration towards mobilizing of resources for the implementation of the NIP such as PropertyRights (Ownership, Use and Development rights), market creation, fiscal instruments – pollutionand resource taxes, investment tax credits and subsidies, charge systems (user charges, impact andaccess fees), Financial instruments – (soft loans and grants, green funds), liability systems – (legalliability and liability insurance) and bonds and deposit refund systems – (land reclamation bonds,environmental accident bonds and deposit refund systems) were proposed in the NIP. These havebeen tried witha measure of success for the plastic e-waste. Initiatives by Greenbelt Movement,Practical Action,iLIMA and many communal based organizations have tried to use a mix of thiswith some level of success.
The appreciation of use of environmental and economic instruments for costing purposes remainslargely not appreciated. The review noted that most of the above recommendations remain largelyunaccomplished. During this assessment, there was some evidence that these financingmechanisms were applied at some point since 2007. There is, therefore, a need to enhance thecountry’s ability to appreciate and use these tools.

45
CHAPTER 3:LEGAL POLICY ISSUES SITUATION FOR POPS MANAGEMENT INKENYA
3.1 Background
The Constitution of Kenya, 2010 has effectively changed the mode of government for example devolvingoverall governance matters to the counties. It has also created new administrative and legislative structuresthereby necessitating the rationalization of the new dispensation by new centers of power like Governors,new institutions at national and county levels, the merging or proscribing of some implementing institutionsand sectors. Some of these new interventions have been juxtaposed on the old multiplicity of implementinginstitutions and sectors. This has resulted in confusion with respect to jurisdictional and coordination issues.Additionally, new policy, legislation, regulations and standards are also in the process of being enacted toaddress the emerging governance agenda, thereby replacing some of the existing and introducing new,regulatory framework.
3.1.1. New InstitutionsThe rationalization of institutional and sectoral roles and mandates is still in the pipeline.The NationalEnvironment Management Authority (NEMA), which has the national mandate of coordination andsupervision of all matters of environmental management including POPs, has devolved some of itsnational mandate to the counties, but it is not clear whether the scope of devolved powers is adequate todeal with the counties’/regions’ environmental mandate exhaustively at their level. A case in support of2) above is with regard to EIA/EA: the region office can only license construction projects of only up tothe cost of Kshs. 100 million, while any projects involving chemicals and petrol products are licensed atheadquarters in Nairobi. Licensing of transportation and incineration of hazardous waste is also donefrom Nairobi. Regional offices only license transportation of municipal waste.
3.1.2 New Institutional Roles for POPsThe roles of all institutions with a mandate in chemicals management, NEMA included, are not clearlydefined and coordination structures. For example, the Governor’s office and NEMA will be put incontrol of the Stockholm Convention, regarding compliance, enforcement and coordination of all thosestakeholders.i. Some of the relevant MEAs have not been domesticated
ii. Generally, except for a few stakeholders, all other stakeholders which are key in implementing theStockholm Convention and the Kenya NIP, including NEMA County Office, Kisumu Office,KARI, Kenya Seed Company, LEVMP, were not aware of the SC and the NIP
iii. Almost all stakeholders engaged complained of lack of information sharing generally on chemicalsmanagement
iv. Those with some small stocks of expired and/or obsolete chemicals like KARI, Kitale and KenyaSeed, Kitale did not know how to dispose of them (lack of information sharing e.g. by NEMA andthe Medical Services and Dental Practitioners Board
v. Pollution control rests on credible research. Universities can carry out this role, but the country hasissues of information sharing and coordination
vi. Regional offices have serious capacity issues – human resources, technical expertise in POPsmanagement, facilitation to handle trans-boundary issues, among others. NB: We discovered that inthe POPs list under the East African Customs Act is missing some of them (evidence of inadequatestakeholder consultation in the legislative process) and needs to be updated
vii. Concern regarding transportation of banned chemicals from the region, where they are notcontrolled
viii. Regional profiling, currently are only for regions and should be extended to authorities and countiesand Conventions like the SC

46
3.2 International Agreements
This updated NIP should also consider how best to integrate commitments under the MEAs into thecompliance measures. This may be done through a comprehensive legal framework for chemicals.
3.2.2Multilateral Environmental AgreementsKenya is party to the following multilateral and bilateral of agreements of the environment:Regarding the international regulatory regime, the following were identified as key internationalorganizations in chemicals management, and synergies with them should be strongly encouraged:ICIPE, FAO, WHO, UNEP, UNIDO, UNDP, NEPAD, the Global Environment Facility, COMESA andthe secretariats of MEAs
In addition to the Stockholm Convention, a number of other agreements and instruments also addressdifferent aspects of the range of risks caused by hazardous chemicals over their life cycle. They alsoneed to be implemented in the Kenya national legal framework. It will be more efficient for such a lawto be developed, an integrated approach, incorporating all MEAs should be used.
The Stockholm Convention on POPs The Basel Convention on the Control of Trans boundary Movements of Hazardous Wastes
and their Disposal; The Rotterdam Convention on the Prior Informed Consent Procedure for Certain Hazardous
Chemicals and Pesticides in International Trade; The Convention on the Marine pollution currently being implemented under the New
Partnership for Development (NEPAD); The Framework Convention on Climate Change (FCCC); The Montreal Protocol on substances that deplete the ozone layer and The Cartagena Protocol on Biotechnology.
3.2.3 InstitutionsThe following institutions are importantin chemicals management:
i) National Environment Management Authority (NEMA)i) The Government Chemists Department ( GCD)ii) Kenya Medical Research Institute (KEMRI)iii) Kenya Plant Health Inspectorate Services (KEPHIS)iv) The Kenya Cleaner Production Centre (KNPC)v) The Department Of Occupational Health And Safety Services (DOHSS)vi) Kenya Bureau Of Standards (KBS)vii) Kenya Association Of Manufacturers. (KAM)viii) Kenya Mission to UNEP (KMUNEP)ix) The Pest Control Products Board.
3.2.4LegislationKenya mainly relies on international norms and practices when it comes to issues of chemicalsafety, regulation of production, importation, use and registration of Chemicals including pesticides
in Kenya., local legislation include;
i. Pharmacy and poison Act Cap 245.ii. Public health Act Cap 242
iii. Food drugs and chemical substance Act Cap 254iv. Environmental management and co-ordination Act of 1999

47
v. Malaria Control Act.vi. Pests Control Products Act Cap 346
vii. The Use of Poisonous Substances Act Cap 247viii. Public Health Act 264
ix. Water Act Cap 271x. Fertilizers and Animal food stuffs Act Cap 345

48
Table 10: Institutions and their roles in chemicals management
No Institution Role in POPs Management Chemical Sector
1Customs and ExerciseDepartment
The Department regulates international tradeand collect tax revenue for the government.
Iimporters and exportersRevenue agencies
2 Kenya Ports Authority Manages all the sea ports of Kenya. It is anEnforcer, regulator and user of Chemicals
Import/ exportTransboundary movement
3 National EnvironmentManagement Authority
Under the EMCA (1999), NEMA is mandated toensure a healthy environment in Kenya. It is anenforcer and regulator.
Environmental Regulationin all sectors
4 Pest Control Products Board The controls the pesticides used in Kenya. Pesticide products5 Agro-chemical Association of
Kenyacontrols the agro-chemical usage in Kenya Agrochemical usage only.
Trade association6 Counties The county governments manage wastes in all
counties and sub-counties.Waste managementFire risk
7 Kenya Industrial Research andDevelopment Institute (KIRDI)
The Institute conducts industrial research in thecountry.
Research in industrialprocesses andtechnology..
8 Kenya Medical ResearchInstitute (KEMRI)
Undertakes medical research in the country. Ithas very efficient incineration facilities.
Research on Impact ofchemicals on humanhealth
9 Kenya Marine and FisheriesResearch Institute (KEMFRI)
Undertakes marine and fisheries research in thecountry.
Research and Monitoring.
10 National Council of Science andTechnology (NCST)
Regulate science and technology developmentsin Kenya.
Research
11 Kenya Agricultural ResearchInstitute (KARI)
Undertakes all Agriculture related research inthe country.
Research and Monitoring
12 Kenya Plant Health InspectionServices (KEPHIS)
Inspects and supervises all agronomic researchin Kenya to ensure that they conform tointernational standards and benchmarks.
Monitoring andLaboratory analysis.
13 Universities and Other researchinstitutions
They are involved in academic and researchcapacity building
Capacitybuilding/Training/monitoring
14 Ministry of Health (MalariaControl Programme)
The Ministry provides policy guideline sonhuman health in Kenya.
User
19 Kenya Flower Council Is an apex body in charge of all flower farmersin Kenya.
Agrochemicals
20 Horticulture Crops DevelopmentAuthority (HCDA)
Horticultural development in the country. Agrochemicals
21 International Centre of InsectPhysiology and Ecology (ICIPE)
Research on alternatives to Chemicals. Alternatives to chemicals
22 Fresh Produce ExportersAssociation of Kenya (FPEAK)
Agrochemicals
22. Government Chemist23. ICIPE (Regional Center for
Stockholm Convention)24. National Cereals and Produce
Board25 Kenya Seed Company & private
companies treating seeds.26. Kenya Bureau of Standards

49
3.3 Compliance issues for Kenya:
In complying with its obligations under the Stockholm Convention Articles 3, 5 and 6relating to themeasures to be taken to reduce, or eliminate production, use, and releases of the new POPs and to reportthese efforts to the Secretariat, some long-term goals need to be clearly defined when designing strategiesto accomplish Kenya’s obligations under the Convention; setting a consultative mechanism to include allstakeholders towards developing policies and laws and to improve capacities.
3.3.1The legal, policy and institutional capacity inventoryThe current legal framework will need to be updated and appropriate policy instruments be put inplace. For example, the comprehensive National Environment Policy, 2008 is still in draft form asare the regulations more particularly intended to address POP issues, like the e-waste DraftRegulations 2012 and Air Quality Regulations, 2012. Generally no specific and/or integral law is inplace to address chemicals management including POPs. Such a law is strongly recommended.Although most Multilateral Environmental Agreements (MEAs) have now been domesticated inKenya, the environment protection agenda still remains with the overarching framework legislation,the Environment Management and Co-Ordination Act (EMCA) and sector specific statutes whichhave yet to be harmonized with EMCA.Regarding the institutional arrangements, the chemicalsmanagement infrastructure is distributed according to mandates over various institutions andharmonization of their roles and mandate(s) at national and regional levels is still outstanding.
3.3.2 InventoriesWith the amendments coming into force, Parties are obligated to develop inventories in order toavail information on the new POPs at the national level. National inventories are an important tool inreporting on priority chemicals like POPs. They are also a source of public information. Theyidentify major sources of releases and provide estimates of amounts of chemicals used, released anddisposed of. Inventories of new POPs were therefore conducted to identify their production, use andimports and then to prioritize which ones needed national actions, like BFRs, due to their wide use.
3.3.3MonitoringOne of the properties of POPs is their potential for long-range transport and therefore measurementand monitoring of their levels in the environment is important. Strategies data obtained frommonitoring will enrich policy and the country’s regulatory framework. It will also feed into theGlobal Monitoring Plan (GMP) of the Convention.
3.3.4 ReportingOne of the requirements of the Stockholm Convention is for Parties to report on measures taken toimplement relevant provisions of the Convention and their effectiveness. This includes Measures toreduce or eliminate releases from intentional production and use, as well as unintentional releases ofPOPs; Identification of articles in use and wastes containing chemicals listed in Annexes A, B andC; and Production, import and export of these chemicals. Article 15 has established an OnlineElectronic Reporting System (online ERS) and the government officers for reporting, in this case theministry of Environment, Water and Natural Resources, which is spear-heading this updating of theNIP. Use of Pollutant Release and Transfer Registers (PRTRs) is increasing. This NIP contains thereport for 2013.
3.3.5 Capacity buildingThis NIP has included capacity building activities to contribute to compliance measures and todevelop risk reduction measures under the Convention. It has identified technical assistance andfunding needs. Programmes, policy, legal framework and institutional capacity under the currentNIP will be revised and upgraded to address new POPs, for example strengthening the CustomsDepartment and KRA and their operational context, to enable them to handle POPs more
50
appropriately. The development of tariff codes specific for POPs can improve on tracking them atpoints of entry and provide more accurate data on imports and exports of POPs.
Universities and research institutions will be strengthened to provide data on chemicals of concern.Scientific expertise will be developed. Kenya will take advantage of guidance, expertise, assistanceand training support from international and regional organizations like OECD, WHO, FAO, UNITAR,
UNEP, ICIPE, etc. In implementing its updated NIP, Kenya will also participate actively in bilateral,regional and global cooperation programmes that offer capacity training activities for the assessment ofchemicals, including POPs.
3.3.6Awareness RaisingArticle 9 of the Convention requires Parties to exchange information, facilitate public information,awareness and education (Article 10), report to the Convention Secretariat (Article 15) andperiodically update implementation Plans (Article 7). When updating the Kenya NIP, a mechanismfor exchange of information on emerging chemicals issues that was geared towards initiating actionon new chemicals POPs for example the SAICM was recommended. Communication andawareness-raising on new POPs will facilitate public participation, including the civil society and theprivate sector, business community, academia, government organizations at national and countylevels, legal and policy experts and indigenous communities towards the sound management ofPOPs.
3.4. Adoption of International Treaty LawThe Constitution of Kenya incorporated all Conventions and Treaties, to which Kenya is party to, intoKenyan law, are usually inter-related and more often than not the preceding Agreements form a backgroundfor those that follow. Kenya stands to have a comprehensive system of dealing with POPs by adoption anddomestication of the provisions of Stockholm Conventions. The Stockholm Convention recognizes this,and in its preamble, it recalls the pertinent provisions of the relevant international environmentalconventions, and in particularRotterdam Convention.
3.4.1 SynergyAs discussed, Kenya’s POPs management system would benefit from the synergy of legislation withthe Stockholm Convention and other international and regional agreements with related content. In linewith the Synergies Agreement, National harmonization of POPs management is of the essence. In thefirst instance, chemicalpolicy focuses on developing a nationally accepted and environmentally friendlysound chemicals management procedure. To achieve this, it is important to involve key stakeholders indevelopment, improvement and implementation of the policy. As Kenya moves towardsindustrialization by 2020 the chemicals industry will be as important as the agricultural industry inPOPs management.
The POPs management policy must be acceptable, based on universally accepted scientific risk- basedassessment of POPs management and should incorporate core principles of safety and environmentalconservation.
Some of these principles include:a) Sustainable management and development which focuses on risk reduction management
where plausible and emphasis on development that meets the needs of the present generationwithout compromising the ability of future generations to meet their needs by maintaining thecarrying capacity of the supporting ecosystems;
b) The precautionary approach, which prescribes that where there are threats of damage to theenvironment, whether serious or irreversible, lack of full scientific certainty shall not be used asa reason for postponing cost-effective measures to prevent environmental degradation;

51
c) The “cradle to grave” approach to chemical safetyrelates to the management of riskthroughout the process of chemicals management from start to finish. This is realized in thedomestication of international treaties that provide for chemicals management in various stagesof the process. With regard to POPs the three are the Rotterdam Convention, StockholmConvention and the Basel Convention.
3.5RECOMMENDATIONS
Addressing the legal, policy and institutional aspects of POPs management in Kenya therefore makes thefollowing recommendations:-a) The overall operational context - legal, policy and institutional aspects of POPs and other hazardous and
chemicals management at county and therefore grassroots level needs to be improved in order to giveeffect to the devolution agenda as per the mix of the new constitutional dispensation requiringdevolution of environmental and administrative management to the counties has established newadministrative structures.
b) Relevant regulatory literature such as conventions, laws, protocols, regulations, standards, researchresults, etc., need to be widely availed to institutions and the public
c) On institutional capacity generally, all institutions need enhancement and facilitation to handle allprocesses and procedures of POPs management
d) County offices with a trans-boundary mandate need support in acquisition of necessary equipment andlocal expertise to be able to comply and collect accurate data, analysis, carry out surveillance,identification of and credible response to chemicals issues e.g. by NEMA and Customs dept – case ofoil spill and other disasters
e) There is need to encourage and enforce control audits – self-regulation. For example, the NEMA officein Kisumu, in implementing the current NIP, in promoting self-regulation is encouraging self audits inEIA/EA. Self-regulation should be extended to other problems e.g. regarding improper use of pesticidesby farmers, fellow stakeholders should impose sanctions on culprits
f) The greatest challenge for Kenya is to develop a legislative framework that comprehensivelydomesticates the relevant provisions relating to POPs as set out in the Stockholm Convention and otherchemical MEAs.
1) The development of regulations for the management of Ozone Depleting Substances (ODS) has nowprovided a precedent for the formulation of subsidiary legislation on chemicals management in Kenya.
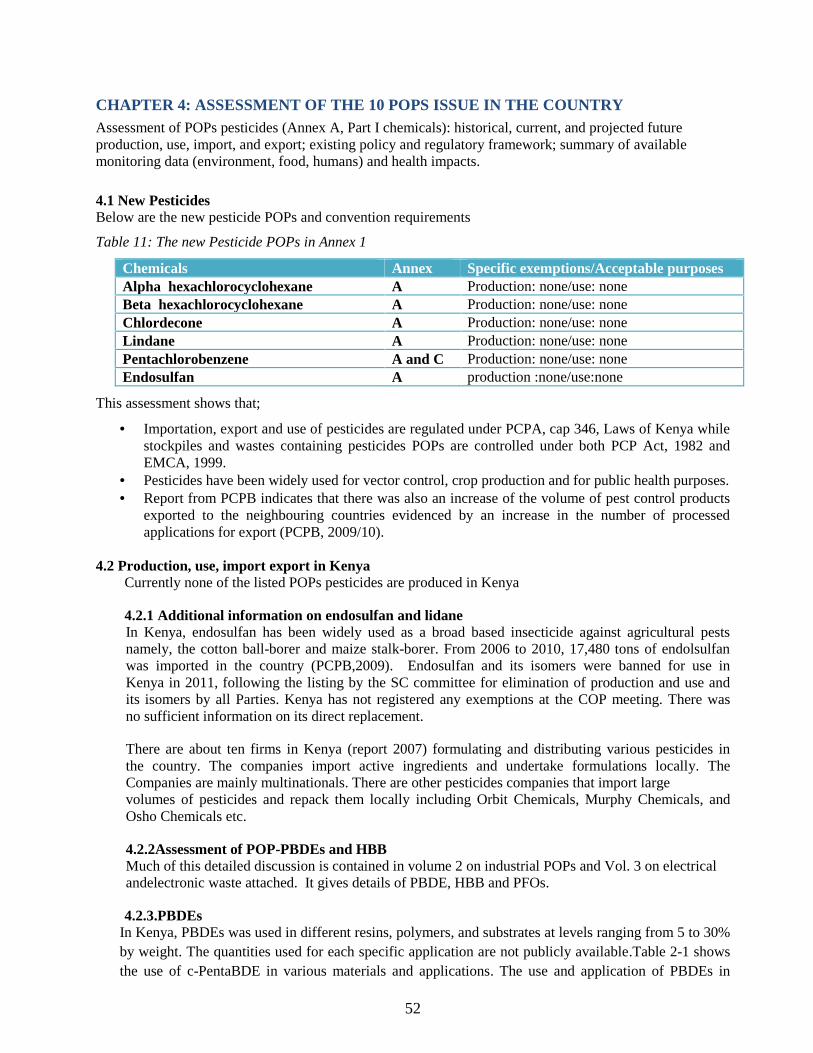
52
CHAPTER 4: ASSESSMENT OF THE 10 POPS ISSUE IN THE COUNTRYAssessment of POPs pesticides (Annex A, Part I chemicals): historical, current, and projected futureproduction, use, import, and export; existing policy and regulatory framework; summary of availablemonitoring data (environment, food, humans) and health impacts.
4.1 New PesticidesBelow are the new pesticide POPs and convention requirements
Table 11: The new Pesticide POPs in Annex 1
Chemicals Annex Specific exemptions/Acceptable purposesAlpha hexachlorocyclohexane A Production: none/use: noneBeta hexachlorocyclohexane A Production: none/use: noneChlordecone A Production: none/use: noneLindane A Production: none/use: nonePentachlorobenzene A and C Production: none/use: noneEndosulfan A production :none/use:none
This assessment shows that;
Importation, export and use of pesticides are regulated under PCPA, cap 346, Laws of Kenya whilestockpiles and wastes containing pesticides POPs are controlled under both PCP Act, 1982 andEMCA, 1999.
Pesticides have been widely used for vector control, crop production and for public health purposes. Report from PCPB indicates that there was also an increase of the volume of pest control products
exported to the neighbouring countries evidenced by an increase in the number of processedapplications for export (PCPB, 2009/10).
4.2 Production, use, import export in KenyaCurrently none of the listed POPs pesticides are produced in Kenya
4.2.1 Additional information on endosulfan and lidaneIn Kenya, endosulfan has been widely used as a broad based insecticide against agricultural pestsnamely, the cotton ball-borer and maize stalk-borer. From 2006 to 2010, 17,480 tons of endolsulfanwas imported in the country (PCPB,2009). Endosulfan and its isomers were banned for use inKenya in 2011, following the listing by the SC committee for elimination of production and use andits isomers by all Parties. Kenya has not registered any exemptions at the COP meeting. There wasno sufficient information on its direct replacement.
There are about ten firms in Kenya (report 2007) formulating and distributing various pesticides inthe country. The companies import active ingredients and undertake formulations locally. TheCompanies are mainly multinationals. There are other pesticides companies that import largevolumes of pesticides and repack them locally including Orbit Chemicals, Murphy Chemicals, andOsho Chemicals etc.
4.2.2Assessment of POP-PBDEs and HBBMuch of this detailed discussion is contained in volume 2 on industrial POPs and Vol. 3 on electricalandelectronic waste attached. It gives details of PBDE, HBB and PFOs.
4.2.3.PBDEsIn Kenya, PBDEs was used in different resins, polymers, and substrates at levels ranging from 5 to 30%by weight. The quantities used for each specific application are not publicly available.Table 2-1 showsthe use of c-PentaBDE in various materials and applications. The use and application of PBDEs in

53
products in Kenya is heavily dependent on import materials. This is because PBDEs are notmanufactured in Kenya. Therefore the history of production in producing countries where Kenyaimports these materials or products is important in order to provide estimates of the amounts of PBDEsin circulation in Kenya. Example, the origin country of import of motor vehicles, their category willvary among global regions of manufacture mainly, Central America, Europe and Asia.Sometoxicological effects associated with PBDEs include: neurodevelopmental effects, Neurobehavioraleffects, cancer, thyroid problems.
Figure 3: Products where PBDEs were used in as flame retardants.
Another example is in the imports of polyurethane foam whose ingredients Kenya has been importingfor the production of foam cushioning and other uses. There is no data available on the proportions ofuse of c-PentaBDE for the different applications in the US. Table9is the useand application ofPBDES
Table 12: Use and Application of c-PentaBDE in various materials and applications in Kenya
Materials/polymers/resins
Applications Commercial commodities
for the applications
Main KenyanCompanies/Institutions
Epoxy resins Circuit boards,protectivecoatings
Computers, ship interiors, electronic parts. Cables and ElectronicCompanies
Polyvinylchloride(PVC)
Cable sheets Wires, cables, floor mats, industrial sheets. Cables and ElectronicCompanies
Polyurethane (PUR) Cushioningmaterials,packaging, padding
Furniture, sound insulation packaging,padding panels, wood imitations,transportation.
Mattresses manufacturers
Unsaturated(Thermosetting)polyesters
Circuit boards,coatings
Electrical equipment, coatings for chemicalprocessing plants mouldings, military andmarine applications: construction panels.
Electronics importers
Rubber Transportation Conveyor belts, foamed pipes for insulation. Cable companiesPaints/lacquers Coatings Marine and industry lacquers for protection
of containersPaint and Ink Companies
4.2.4 PBDEs(tetra, penta, hexa and hepta BDE) Production, Import and ExportPolybrominateddiphenyl ethers (PBDEs) were additives in many electronic goods as flameretardants. It is therefore important to assess the quantities of electronics products imported intoKenya as Kenya is not a major producer of electrical and electronic products but is a major importer.
ELECTRONICS
TRANSPORT
FURNITURE,MATTRESSES,
TEXTILES, Otherminor uses

54
4.2.5Current production, use, control and release pathwaysMost vehicles assembled before 2005 had PBDEs additives in various parts. Kenya assembles motorvehicles but majority of cars in Kenya are imported as ready-made. The major assembler companies in
Kenya are the Kenya Vehicle Manufacturers (KVM) which also assembles for Hyundai Motor Corp andis located at Thika town, General Motors East Africa (GMEA), Honda Motorcycle Kenya Ltd,Associated Vehicle Assemblers Ltd (AVA) which also assembles for Toyota (East Africa), ToyotaKenya Ltd (TKL) and TVS Motors Kenya. Major retailers are the Toyota (East Africa)/ Toyota Kenya Ltd(TKL), Cooper Motor Corporation, General Motors East Africa (GMEA), Simba Colt and DT Dobie. Theassembling or body building is mainly done for buses and other mini buses. Cars imports from Asiaare estimated to take the highest percentage of POP PBDE input in Kenya (see figure 7).
This is generally because Kenyan main vehicles imports are from Asia. Enhanced trade with Asia ispredicted to increase the POP PBDE to Kenya if the source countries do not restrict the use of PBDEadditives in vehicles furnishes.
4.2.6Emission sources and release pathwaysThe source of the PBDEs is likely from trace amounts that leach into air (indoor and outdoor) andsewage from products. PBDEsflame retardants tend to be additive, which means they are held inplace physically, rather than chemically bonding to the polymer (plastic material) or fabrics as withreactive flame retardants. As a result, over time, PBDE molecules can be released will alsodepending on the environmental parameters and the property of the product. Resent research supportthe presence of PBDEs in offices and homes thus indicating emission through air ((Björklund.,2009, Björklund et al., 2011 and Thuresson at al., 2011).
4.2.7StockpilesData on e-Waste stockpiles in Kenya were reported Vol. A and B elsewhere as 11,400 tonnes aregenerated from refrigerators, 2,800 tonnes from TVs, 2,500 tonnes from personal computers, 500tonnes from printers and 150 tonnes from mobile phones (UNEP & UNU, 2009). The same report(UNEP & UNU, 2009) showed that 1,513 tonnes of electronics entered the market. The consumer inaddition to receiving 1489.4 tonnes also received 151.3 tonnes from the second hand market. It wasalso revealed that consumers are likely to dispose 1,210.4 tonnes in the second-hard market, and18.6 tonnes to collectors or as general waste which is sent to refurbishers. The consumer disposes afurther 18.6 tonnes directly to recyclers. Refurbishers and recyclers then send 605.2 tonnes fordisposal. Alternatives for flame retardants in electronic products exist, though imports from othercountries that have not affected the PBDE ban is a major pathway to PBDE in Kenya.
4.2.8 Electrical and electronic wasteVolume 3 report gives an insight of how industrial POPs management is a challenges and calls forinterventions. The PBDE released from these estimates can be calculated. The following Tablebelow shows the amount of E-waste and the respective POP-PBDEs in stocks of EEE in Kenya.

55
Figure 4Waste and the respective POP-PBDEs in stocks of EEE in Kenya
Table 13:e-waste amount and the respective POP-PBDEs in stocks of EEE in Kenya annually
Product type Amount of E-waste in tonnes/year POP-PBDEs in stocks of EEE in Kg/year
Fridge 1400 50.4
TVs 2800 2133.6
Computers 2500 236.25
Printers 500 47.25
Mobile phones 150 5.4
7350 2472.9
Bereau B & G (1993) used the following approach calculating EEE articles entering the waste stream orWEEE flows, respectively (Streicher-Porte, 2006). The two key inputs for this calculation are (i) theamount of EEE stockpiled (see 4.3.1.2) by consumers and (ii) the average life span (combined time of beingused and stored by consumers). These numbers were assessed through the consumer questionnaires as

56
Figure 5(a) ewaste from computers
Figure 5(b) E- Wastes from monitors
Table 14: POP PBDE release to the waste stream annually 2012
Product POP PBDE released in tonnes/yearPC+ Monitor 29.5 to 47.25 (Average 38.38)Printer 9.45Mobile Phones 1.35TVs 91.35Refrigerators 41.04Total 143.19
4.3 Annex B substances, Industrial chemicals
Perfluorooctane sulfonic acid (PFOS) is both intentionally produced and an unintended degradation productof related anthropogenic chemicals. PFOS is used as a surfactant in a number of firefighting foams andmany other industrial applications (Kissa 2001). In Kenya, it comes in the formulations called fluoro-protein foam and aqueous firefighting Foams (AFFF). Firefighting forms could be a significant source ofPFOS in the Kenyan environment. The other significant source of PFOS is the use domestic market

57
products, particularly as a stain repellent in furniture and other furnishing items. These items, which are stillbeing used, are likely to remain a source of PFOS emissions for an extended period.
4.3.1 Current production, marketing, use and controlTable 12 shows extracted data from the KNBS on reported quantities of imports and in-transit exportsof PFOS-based fire-fighting foams since 2005.
Table 15: Import and Export data of Firefighting foam containers in Kenya between the years 2005 to2012.
Year Imports Exports/transit to other countries
2005 1156150 47257
2006 1304651 101635.6
2007 1373201 38172
2008 1190848 117381
2009 1249051 153513
2010 5895383 117348
2011 1591617 103211
2012 1701403 82354
15462304 760871.6
Source: KNBS and KPA, Year 2011
Between 2005 to 2012, Kenya imported a total of 15462304 containers of firefighting foams.
There are two major firefighter companies in Nairobi. These include the Nairobi County and the G4Ssecurity company. The two companies offer training services to various firefighting companies. Inaverage, the amount of firefighting foam used by G4S is 12000 liters. The amount of PFOS and relatedchemical released in the environment per year is therefore between 60 kg to 180 kg per (average =120kg). The Nairobi county uses 4000 and 30000 of the Fluoroprotein and AFFF, respectively. That willrelease a range of between, 20 to 60 (average of 40 kg per year) and 150 to 450 (average of 300 kg peryear) kg per year of fluoroprotein and AFFF respectively, giving a total 340 kg per year. A total 460kg/year of PFOS and related chemicals release are notified by the two companies.
4.3.2 Emission sources and release pathwaysThe release of PFOS and related chemicals in Kenya is mostly through firefighting and during trainingof firefighting personnel. It is expected that major contamination site will be at firefighting trainingfacilities. One such facility is based at Naivasha. It is likely that PFOS-based foam has previously beenmore widely used, but it is not possible to make a quantitative estimate of emissions at this point.
In the Kenya, current use of PFOS includes metal plating activities in the chrome industry, the use ofsmall quantities in semi-conductor manufacture and limited applications in the photographic industry.In Kenya, the main environmental release pathways are believed to be to water through the waste watertreatment works.
4.4. Assessment with respect to DDT
4.4.1.Historical use of DDTSince 2007 there have been initiatives to reintroduce DDT to address the frustrations posed by malaria.In 2012 the DDT expert group under SC, having recognized the continued need for DDT for diseasevector control, recommended, among other things, that the use of DDT in indoor residual spray should

58
be limited only to the most appropriate situations based on operational feasibility, epidemiologicalimpact of disease transmission, entomological data and insecticide resistance management. It alsorecommended that countries should undertake further research on and implementation of non-chemicalmethods and strategies for disease vector control to supplement a reduced reliance on DDT. Pyrethroidbased alternatives have been used for Indoor Residual Spraying in malaria endemic areas such as Kisiiwith positive results. No need to apply DDT has been found. This has catalyzed Kenya to search foralternatives to DDT.
Kenya has continued to indicate a strong commitment to developing alternatives to DDT. ICIPE andKEMRI continues to provide this as partnersin an USA affiliated Centre for disease Control and ICIPE.The first NIP recommended activities that would target the further development and commercial roll-out of alternative disease vector control strategies that avoid the use of DDT. Since then, severalalternatives have been initiated, chief among them being the use chemical alternatives, plant-basedalternatives and Integrated Vector Management (IVM) practices.
The Kenya Medical Research Institute that has been monitoring the resistance of major malaria vectorsto the insecticides used for indoor residual spraying and in bed nets reported high levels of resistance topyrethroids, used for malaria control in Kenya, and recommended that Bendiocarb which belongs tothe carbamate class of insecticides be used for IRS .Bendiocarb is highly effective against resistant mosquito populations and its mode of action is differentfrom pyrethroids. The mode of action of bendiocarb compared with pyrethroids makes this insecticide asuitable alternative for mosquito vectors which are resistant to pyrethroids. Community acceptabilitywas high at 95% as evidenced in the study conducted in western Kenya in 2011 (Mbogo 2013personalcommunication). However, there are other factors that make it less favorable compared to pyrethroids.It is less persistent which makes it more expensive compared to pyrethroids and slightly higher toxicthus require more stringent measures for environmental protection and human safety.
4.4.2 Chemical alternatives to DDT and endolsufanA list of alternative chemicals for DDT and endosulfan was presented. Currently, 11 chemicals havebeen suggested as potential alternatives for DDT and 110 chemicals as alternatives for endosulfan. Thealternatives are evaluated for efficacy, persistence and POPs like properties. DDT alternatives include:Bifenthrin, chlorpyrifos, deltermethrin, fenitrothion, malathion, etc.
a) Non- Chemical Alternatives to DDTStakeholders recommend that studies should continue to identify more compounds of insecticidesto make up a pool of efficacious insecticides to be considered for alternate and rotational use as partof resistance management. A good monitoring plan for vector resistance to different classes ofinsecticides is necessary in our settings and, more specifically, in areas with a high level ofagricultural pesticide use
b) Bio-pesticides in KenyaBio-pesticides are derived from micro-organisms (bacteria, fungi, viruses, etc), plants (neem,pyrethrum, etc) and natural enemies of pests (parasitoids, predators and pathogens). Alsoincluded under bio-pesticides are semi-chemicals (e.g. insect sex pheromes), enzymes (proteins)and natural plant regulators and insect growth regulators. Table 1 and Table 2 depict bio-controlagents (products derived from micro-organisms and natural enemies) and botanical pesticides
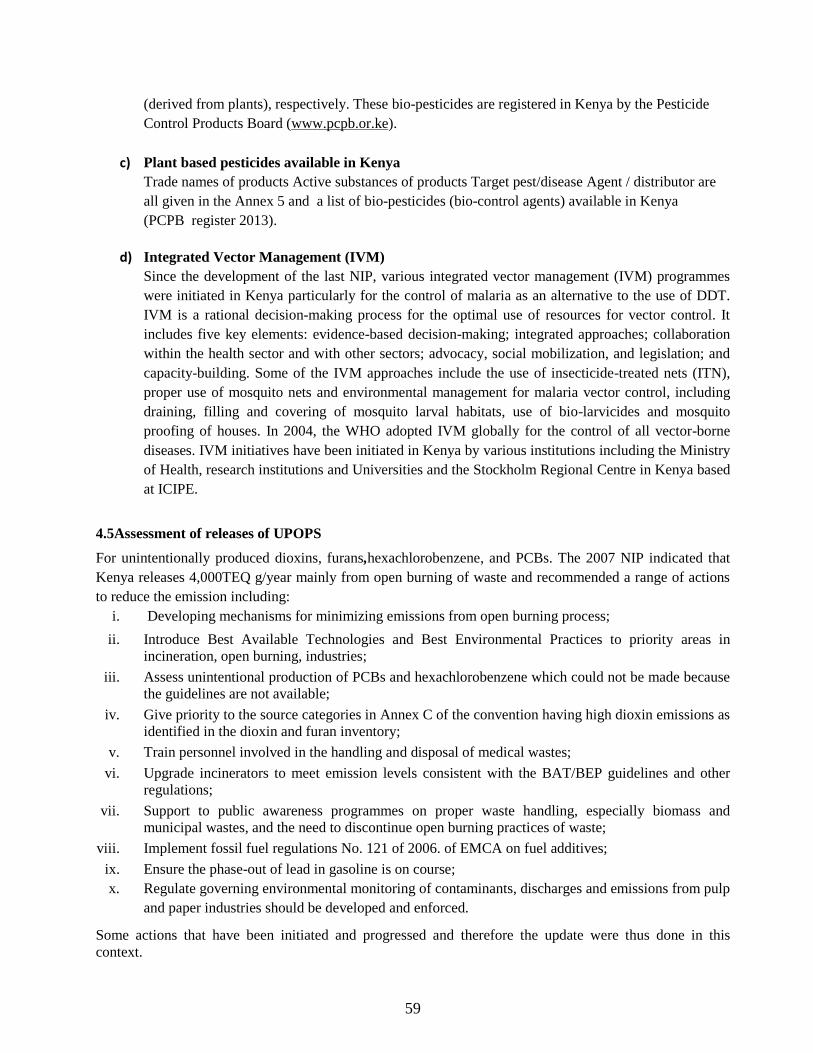
59
(derived from plants), respectively. These bio-pesticides are registered in Kenya by the PesticideControl Products Board (www.pcpb.or.ke).
c) Plant based pesticides available in KenyaTrade names of products Active substances of products Target pest/disease Agent / distributor areall given in the Annex 5 and a list of bio-pesticides (bio-control agents) available in Kenya(PCPB register 2013).
d) Integrated Vector Management (IVM)Since the development of the last NIP, various integrated vector management (IVM) programmeswere initiated in Kenya particularly for the control of malaria as an alternative to the use of DDT.IVM is a rational decision-making process for the optimal use of resources for vector control. Itincludes five key elements: evidence-based decision-making; integrated approaches; collaborationwithin the health sector and with other sectors; advocacy, social mobilization, and legislation; andcapacity-building. Some of the IVM approaches include the use of insecticide-treated nets (ITN),proper use of mosquito nets and environmental management for malaria vector control, includingdraining, filling and covering of mosquito larval habitats, use of bio-larvicides and mosquitoproofing of houses. In 2004, the WHO adopted IVM globally for the control of all vector-bornediseases. IVM initiatives have been initiated in Kenya by various institutions including the Ministryof Health, research institutions and Universities and the Stockholm Regional Centre in Kenya basedat ICIPE.
4.5Assessment of releases of UPOPS
For unintentionally produced dioxins, furans,hexachlorobenzene, and PCBs. The 2007 NIP indicated thatKenya releases 4,000TEQ g/year mainly from open burning of waste and recommended a range of actionsto reduce the emission including:
i. Developing mechanisms for minimizing emissions from open burning process;
ii. Introduce Best Available Technologies and Best Environmental Practices to priority areas inincineration, open burning, industries;
iii. Assess unintentional production of PCBs and hexachlorobenzene which could not be made becausethe guidelines are not available;
iv. Give priority to the source categories in Annex C of the convention having high dioxin emissions asidentified in the dioxin and furan inventory;
v. Train personnel involved in the handling and disposal of medical wastes;
vi. Upgrade incinerators to meet emission levels consistent with the BAT/BEP guidelines and otherregulations;
vii. Support to public awareness programmes on proper waste handling, especially biomass andmunicipal wastes, and the need to discontinue open burning practices of waste;
viii. Implement fossil fuel regulations No. 121 of 2006. of EMCA on fuel additives;
ix. Ensure the phase-out of lead in gasoline is on course;x. Regulate governing environmental monitoring of contaminants, discharges and emissions from pulp
and paper industries should be developed and enforced.
Some actions that have been initiated and progressed and therefore the update were thus done in thiscontext.

60
4.5.1 Calculating UPOPs emissionsFrom the UNEP Toolkit it was established that Kenya releases a total of 2872 g TEQ/a. That is there is
a decrease in emissions. Waste Incineration, Heat and Power Generation, Disposal and Open burningprocesses are the major UPOs emitters with a combined total of 95% of the total national releases. It wasalso established that 76% of these releases end up in Air the remaining 24 % being found in residues.
Table below shows the total releases from the ten source groups.
Table 16: Total Releases from all Source Groups
Source Groups Annual Releases (g TEQ/a)
Group Air Water Land Product Residue
1 Waste Incineration 837.1 0.0 0.0 0.0 170.9
2 Ferrous and Non-Ferrous Metal Production 125.4 0.0 0.0 0.0 15.9
3 Heat and Power Generation 964.1 0.0 0.0 0.0 2.1
4 Production of Mineral Products 5.3 0.0 0.0 0.9 0.3
5 Transportation 0.3 0.0 0.0 0.0 0.0
6 Open Burning Processes 241.1 0.0 6.6 0.0 0.0
7 Production of Chemicals and ConsumerGoods
0.5 0.0 0.0 11.1 0.0
8 Miscellaneous 0.0 0.0 0.0 0.0 0.0
9 Disposal 0.0 0.1 0.0 0.0 490.7
10 Identification of Potential Hot-Spots 0.0 0.0
1-10 Total 2173.8 0.1 6.6 12.0 679.8Grand Total 2872
Figure 6: Percentage Contributions from all source categories
WasteIncineratio
n35%
Heat andPower
Generation
34%
OpenBurning
Processes9%
Disposal17%
COMPARISSON ANNUAL RELEASES FROMALL GROUPS
60
4.5.1 Calculating UPOPs emissionsFrom the UNEP Toolkit it was established that Kenya releases a total of 2872 g TEQ/a. That is there is
a decrease in emissions. Waste Incineration, Heat and Power Generation, Disposal and Open burningprocesses are the major UPOs emitters with a combined total of 95% of the total national releases. It wasalso established that 76% of these releases end up in Air the remaining 24 % being found in residues.
Table below shows the total releases from the ten source groups.
Table 16: Total Releases from all Source Groups
Source Groups Annual Releases (g TEQ/a)
Group Air Water Land Product Residue
1 Waste Incineration 837.1 0.0 0.0 0.0 170.9
2 Ferrous and Non-Ferrous Metal Production 125.4 0.0 0.0 0.0 15.9
3 Heat and Power Generation 964.1 0.0 0.0 0.0 2.1
4 Production of Mineral Products 5.3 0.0 0.0 0.9 0.3
5 Transportation 0.3 0.0 0.0 0.0 0.0
6 Open Burning Processes 241.1 0.0 6.6 0.0 0.0
7 Production of Chemicals and ConsumerGoods
0.5 0.0 0.0 11.1 0.0
8 Miscellaneous 0.0 0.0 0.0 0.0 0.0
9 Disposal 0.0 0.1 0.0 0.0 490.7
10 Identification of Potential Hot-Spots 0.0 0.0
1-10 Total 2173.8 0.1 6.6 12.0 679.8Grand Total 2872
Figure 6: Percentage Contributions from all source categories
WasteIncineratio
n35%
Ferrousand Non-FerrousMetal
Production5%
COMPARISSON ANNUAL RELEASES FROMALL GROUPS
Water0%
Land0%
Product0%
Residue24%
COMPARISSION OF ANNUAL RELEASES INALL VECTORS
60
4.5.1 Calculating UPOPs emissionsFrom the UNEP Toolkit it was established that Kenya releases a total of 2872 g TEQ/a. That is there is
a decrease in emissions. Waste Incineration, Heat and Power Generation, Disposal and Open burningprocesses are the major UPOs emitters with a combined total of 95% of the total national releases. It wasalso established that 76% of these releases end up in Air the remaining 24 % being found in residues.
Table below shows the total releases from the ten source groups.
Table 16: Total Releases from all Source Groups
Source Groups Annual Releases (g TEQ/a)
Group Air Water Land Product Residue
1 Waste Incineration 837.1 0.0 0.0 0.0 170.9
2 Ferrous and Non-Ferrous Metal Production 125.4 0.0 0.0 0.0 15.9
3 Heat and Power Generation 964.1 0.0 0.0 0.0 2.1
4 Production of Mineral Products 5.3 0.0 0.0 0.9 0.3
5 Transportation 0.3 0.0 0.0 0.0 0.0
6 Open Burning Processes 241.1 0.0 6.6 0.0 0.0
7 Production of Chemicals and ConsumerGoods
0.5 0.0 0.0 11.1 0.0
8 Miscellaneous 0.0 0.0 0.0 0.0 0.0
9 Disposal 0.0 0.1 0.0 0.0 490.7
10 Identification of Potential Hot-Spots 0.0 0.0
1-10 Total 2173.8 0.1 6.6 12.0 679.8Grand Total 2872
Figure 6: Percentage Contributions from all source categories
Air76%
COMPARISSION OF ANNUAL RELEASES INALL VECTORS

61
a)Priority emission sourcesFrom the inventory, Waste Incineration, Heat and Power Generation, Disposal and Open burningprocesses emerged as the most significant source groups for the release of U-POPs
Table 14 UPOPs generation by category
Source Group Activity (ies) generating thereleases
(%)
1 Heat and Power Generation Virgin wood/biomass fired stoves;Charcoal fired stovesOpen-fire (3-stone) stoves (virginwood)Simple stoves (virgin wood)
33%
2 Waste Incineration Incineration of Hazardous waste 28%3 Disposal Mixed domestic and industrial
inputs: sewage sludge treatment17%
4 Open burning processes Open burning of domestic waste 8%
It is notable that sources 2, 3 and 4 all consist of activities related waste management;this point tothe need of programs to address matters pertaining to waste management. Source 1 is significant inthat the largest numbers of people affected are women and children as these are the ones who aremost likely going to be involved in this activities mainly cooking. This is a very vulnerablepopulation whose health needs to be given serious attention.
4.5.2Measures to Reduce or Eliminate Releases of U-POPs Pursuant to Article 5 of theConventionThe measures that need to be taken in order to reduce or eliminate releases of U-POPs include thereview of laws and policies covering activities the lead to generation of U-POPS and wherenecessary, introduce new ones, education, training and awareness-raising of the dangers of U-POPsand their management and, development of strategies for periodic review and updating of theinventory. The waste incineration category needs special mention. The composition of waste isshow in figure below.
Figure 7: The waste incineration category
0
10
20
30
40
50
60
Dust
Wet
was
te (f
ood…
Plas
tics
Soft
–Fl
imsy
Hard
–PV
CPa
per
Pape
r pac
kage
sU
ncoa
ted
Coat
edM
etal
Glas
sTe
xtile
Rubb
erDi
spos
able
…O
ther
sLe
aves
Woo
dBr
ickb
at
Urban
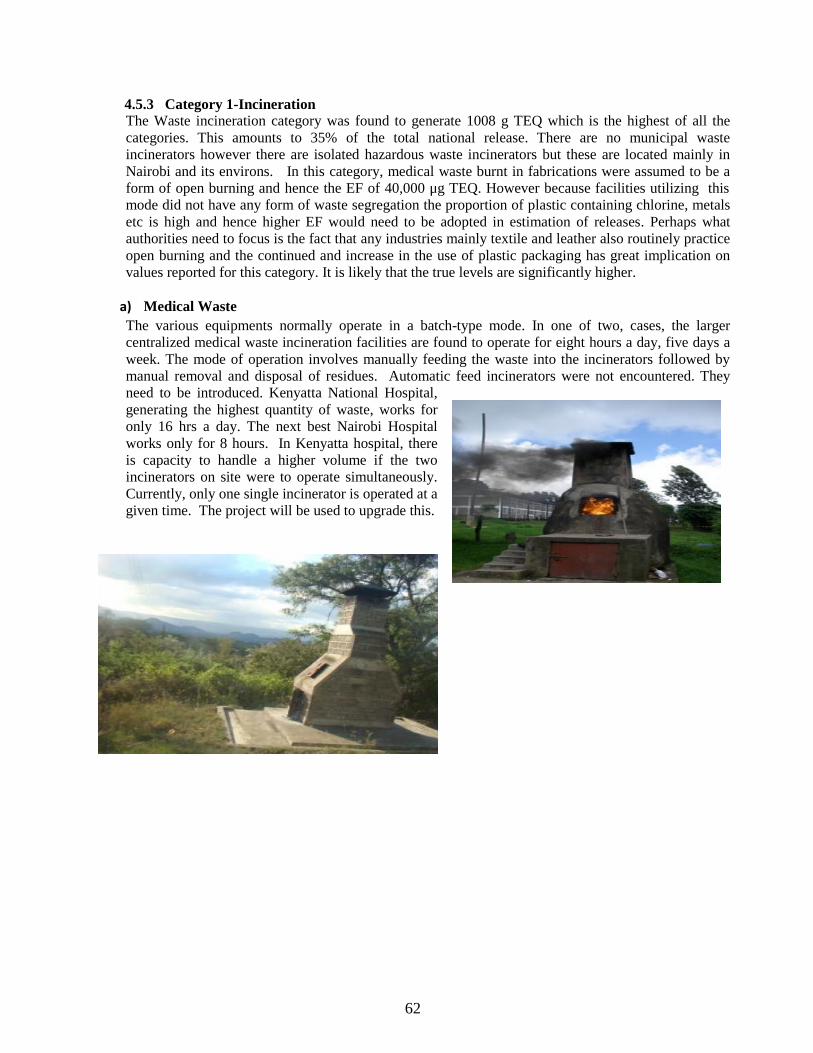
62
4.5.3 Category 1-IncinerationThe Waste incineration category was found to generate 1008 g TEQ which is the highest of all thecategories. This amounts to 35% of the total national release. There are no municipal wasteincinerators however there are isolated hazardous waste incinerators but these are located mainly inNairobi and its environs. In this category, medical waste burnt in fabrications were assumed to be aform of open burning and hence the EF of 40,000 μg TEQ. However because facilities utilizing thismode did not have any form of waste segregation the proportion of plastic containing chlorine, metalsetc is high and hence higher EF would need to be adopted in estimation of releases. Perhaps whatauthorities need to focus is the fact that any industries mainly textile and leather also routinely practiceopen burning and the continued and increase in the use of plastic packaging has great implication onvalues reported for this category. It is likely that the true levels are significantly higher.
a) Medical WasteThe various equipments normally operate in a batch-type mode. In one of two, cases, the largercentralized medical waste incineration facilities are found to operate for eight hours a day, five days aweek. The mode of operation involves manually feeding the waste into the incinerators followed bymanual removal and disposal of residues. Automatic feed incinerators were not encountered. Theyneed to be introduced. Kenyatta National Hospital,generating the highest quantity of waste, works foronly 16 hrs a day. The next best Nairobi Hospitalworks only for 8 hours. In Kenyatta hospital, thereis capacity to handle a higher volume if the twoincinerators on site were to operate simultaneously.Currently, only one single incinerator is operated at agiven time. The project will be used to upgrade this.

63
Figure 8Sample of small burners used for incineration of wastes
b) Hazardous WasteIncineration of Hazardous waste is also worth noting. It is the second most significant source ofreleases, 829 g TEQ/annum which is equivalent to 28% of the total national release. In Kenya, medicalwaste disposal is regulated strictly by local authorities and the hospitals authorities. It was found thatthe most common way to get rid of these wastes is by thermal treatment within the hospital or facility.However, it has been shown that incineration of medical waste in small and poorly controlledincinerators is a major practice and a potential source of PCDD/PCDF (UNEP 1999).
Figure 9 Wastes packed waiting for incineration at the Provincial Hospital Incinerator
Disposal generated 490.7 g TEQ equivalent to 17% of the total national releases
c) Combined Hazardous and Medical WasteHazardous waste (HW) refers to residues and wastes, which contain hazardous materials insignificant quantities. Materials including consumer goods, which require special precautions andrestrictions during handling and use, belong to this group. It includes solvents and other volatilehydrocarbons, paints and dyes, chemicals including pesticides, herbicides, other halogenatedchemicals, pharmaceutical products, batteries, fuels, oils and other lubricants, as well as goodscontaining heavy metals. Materials contaminated with these materials such as soaked rags or paper,treated wood and production residues, etc., are also considered as hazardous waste.

64
Figure 10Nakuru Provincial HospitalMunicipal Solid Waste Incineration
There are isolated incinerators dedicated to general municipal waste across the country In Mombasa,Kisumu, Nakuru and Garissa which also deal with medical waste and hazardous waste. The inventoryestablished that in the hazardous waste incineration accounts for the bulk of releases for this category. Thisis because of the growth occurring in the chemicals manufacturing sector that has led to a sharp increase inthe amounts of hazardous waste that needs to be incinerated. It is also notable that government districthospitals and other health facilities in Kenya operate incinerators that are of low technology levels. Theseincinerators do not have effective air pollution control systems (APCs).
4.5.4 Heat and Power GenerationThis includes fossil fuel power stations and household. Heat and power generation category has anotable contribution 966.1 g TEQ/a amount to 34% of the total national releases. With regards toindividual activities, household heating and cooking using biomass, a subcategory under Heat andPower Generation category is the most significant source of PCDD/PCDF releases. It generates 962 gTEQ/a which is equivalent to 33% of the total national releases.
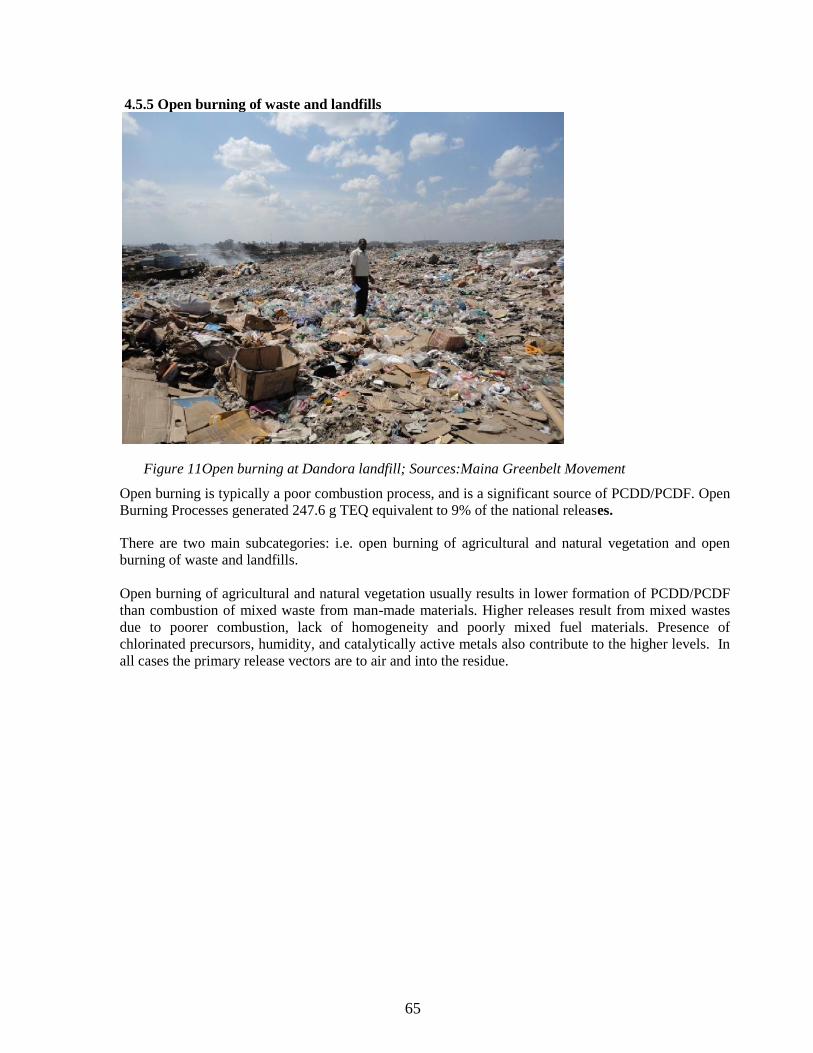
65
4.5.5 Open burning of waste and landfills
Figure 11Open burning at Dandora landfill; Sources:Maina Greenbelt Movement
Open burning is typically a poor combustion process, and is a significant source of PCDD/PCDF. OpenBurning Processes generated 247.6 g TEQ equivalent to 9% of the national releases.
There are two main subcategories: i.e. open burning of agricultural and natural vegetation and openburning of waste and landfills.
Open burning of agricultural and natural vegetation usually results in lower formation of PCDD/PCDFthan combustion of mixed waste from man-made materials. Higher releases result from mixed wastesdue to poorer combustion, lack of homogeneity and poorly mixed fuel materials. Presence ofchlorinated precursors, humidity, and catalytically active metals also contribute to the higher levels. Inall cases the primary release vectors are to air and into the residue.

66
Figure 12Accumulated Waste at Giotto landfill Nakuru: source assessment team
4.6 Implication of the emissions by category
Acute respiratory infections (ARI) are the leading cause of the global burden of disease,1, 2 accounting formore than 6% of worldwide disease and mortality, mostly in less-developed countries. Between 1997 and1999, acute lower respiratory infections (ALRI) caused 3·5–4·0 million deaths worldwide1–3—more thanthat caused by any other infectious disease. Exposure to indoor air pollution, especially to particulatematter, from combustion of bio-fuels (wood, charcoal, agricultural residues, and dung), has been associatedwith respiratory disease in less-developed countries. There more than 2billion people who use biomass astheir main source ofdomestic energy; hence international development and public-health organizations havesought to implement preventive measures to reduce this exposure. The exposure-response relation betweenindoor air pollutionfrom biomass combustion and ARI is important forassessment of the benefits andeffectiveness of preventivemeasures such as design and dissemination of improved stoves and fuels.
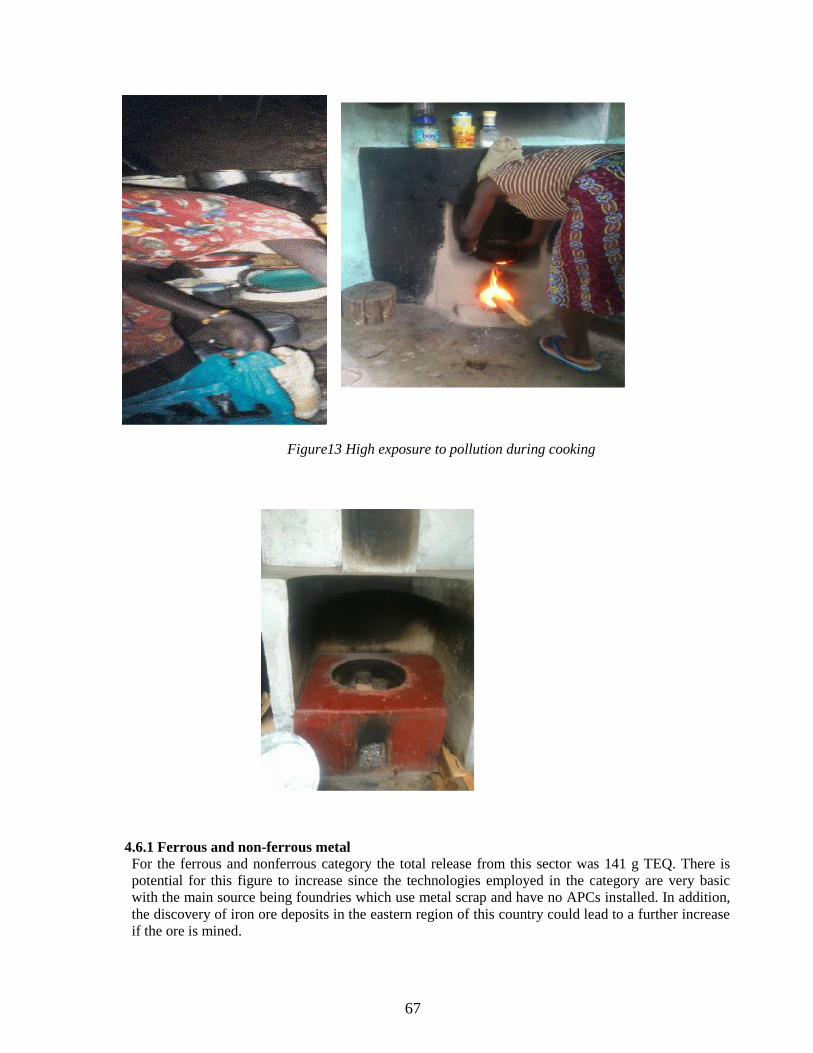
67
Figure13 High exposure to pollution during cooking
4.6.1 Ferrous and non-ferrous metalFor the ferrous and nonferrous category the total release from this sector was 141 g TEQ. There ispotential for this figure to increase since the technologies employed in the category are very basicwith the main source being foundries which use metal scrap and have no APCs installed. In addition,the discovery of iron ore deposits in the eastern region of this country could lead to a further increaseif the ore is mined.

68
4.6.2 Production of Mineral productsThe Production of Mineral Products contributed a relatively small amount5.6 g TEQ, mainly from theproduction of Lime. Similarly, the introduction of BAT would be pivotal in the control of releases inthis sector.
4.6.3 TransportThe transport categorycontributed 0.3 g TEQ. Further reductions can be achieved by introducingemission control regulations that address actual levels of pollutants.
4.6.4 Open BurningOpen burning of waste and landfills generates 247 g TEQ which is about 7% of the national releases.Though it is not the highest source, it should be noted that this form of release is widespread and thushas the potential to affect far more people. The lack of controls in open air burning and indeed itsencouragement for purposes of reducing the volume of waste is a key concern. Use of BEP especiallyin agriculture would greatly reduce the amounts released.
4.6.5 Production of chemicalsProduction of chemicals and consumer goods category contributed 12 g TEQ. This may seem like asmall amount but it is going to grow as the country continues to develop. Introduction of BAT andBEP would be significant in reducing the levels and ultimate elimination of the releases.
4.6.6 Disposal categoryFor the disposal category, its contribution amounting to 491 g TEQ/acomes mainly from disposalsarising from waste water treatment. This is expected to increase with increase in population that isconnected to sewerage systems. Adequate control in this area can beachieved by introducing BATand BEP.
4.6.7 HotspotsSeveral Hot spots were identified but quantification was not done. Thus although their contribution iscurrently 0, it is likely to change after detailed assessment as been done.
4.7 Information on the state of knowledge on stock piles, contaminated sites and wastes
4.7.1 PesticidesThe contaminated sites in Kenya include Kitengela, Menengai, Wajir and Madera. The sites werecontaminated through burial of pesticides. Although Kitengela and Menengai have undergone naturaldecontamination, there is no conclusive evidence that they are still not a threat.
There are no activities currently being carried out to clean up contaminated sites before the ban of thesaid pesticides. Follow up studies by PCPB have been done to assess the level of contamination, andreveal high levels of pesticide residues in contaminated soils. Along with the disposal process, anumber of activities are being implemented to prevent future pesticides accumulation. These activitiesinclude:
Development and enforcement of pesticide policy on obsolete pesticides, Development and the implementation of Integrated Pest Management (IPM) Development and implementation plan of Integrated Vector Management (IVM), Capacity building in terms of providing professional trainings at medical and paramedical
facilities, Creating awareness among stakeholders, and Enforcement of national legislations and policies related to pesticides use.

69
The agricultural, veterinary and public health pesticide stakeholders namely (PCPB, AAK,Cleanfarms, Syngenta, MoH) in the pesticide industry continued support clean the farms of unwantedpesticides, reducing both environmental and human risk. There is, therefore, a need to encouragefarmers, distributors, stockists, ranchers and other stakeholders to surrender the obsolete stocks to theClean Farms Safeguarding Project for safe disposal in licensed facilities.
4.7.2 New Pesticide PopsThe Table below gives a summary of information of the legal; situation of new pesticides POPs,stock piles, obsolete/ wastes and contaminated sites gathered during the site visits and indicates theremedial measures that need to be undertaken.
Table 17: Stockpiles, contaminated sites and wastes
New Pesticide POPs Contaminatedsites
wastes Quantity Relevantregulations
Guidance/remedialmeasures
Alpha hexachlorocyclohexane none N/A N/A PCPA Environmentalmonitoring
Beta hexachlorocyclohexane none N/A N/A ,, ,,Lindane none N/A ,, ,,Chlordecone none N/A N/A ,, ,,
Technical endosulfan andrelated isomers
none N/A N/A ,, ,,
Detailed information of the situation of New Pesticides POPs, stock piles, obsolete/ wastes andcontaminated sites were gathered during the site visits.
In conclusion there were no stockpiles, contaminated sites and wastes reported in all the areas visitedexcept in Nakuru where lindane (last stock) for seed dressing was reported. However there is need tocarry out monitoring studies with regard to residues in the environment especially in agriculturalpremises and farms where lindane and endolsulfan has been used.Lindane and endolsufan stocks can beused since only new imports are banned, no more stocks will accumulate
There is need to have a mechanism of distributing the NIPs to all stakeholders or make the informationpublic, maybe have a chemical website and occasionally reviewed.There are therefore no releases for new pesticide POPs
4.7.3 PCBs
The NIP 2007 required for PCBs that Kenya
i. Adopts legislation banning or restricting the use of PCBs;
ii. Prepare institutions, such as Kenya Power and Lighting, KENGEN, etc., for labeling of thePCB equipment in use consistent with the provisions of the Convention;
iii. Comprehensive inventory of PCBs undertaken using better analytical technology toidentify equipment containing PCBs in concentrations of 50ppm or greater and labelingsuch equipment accordingly;
iv. Giving special focus to abandoned d industrial sites that still contain disused powertransformers and/or capacitors and in what is an environmentally sound manner;
v. Monitoring those POPs currently in use and with POPs like characteristics.
vi. No action seems to be taken and transformers with PCB stocks still dot the country.

70
4.7.4 Industrial POPS Stockpiles, compliance activity and alternativesNairobi County’s total stockpiles of PFOS-based foam are estimated at 40000 litres and it is in openstorage facility at the premises in industrial area of Nairobi (See figure 4-1). Most fire and rescueservices reported that they had no stockpiles of PFOS-based foams, while a few had small quantities.The inventory did not include all Kenya’s fire and rescue services, but the information received isbelieved to be representative of this category as a whole. The Kenyan Armed Forces also haveconsiderable remaining stocks of PFOS-based foam. It is estimated that the total content of PFOS-related substances in foam stockpiles in all municipal councils in Kenya is approximately 80 tonnes.There are no requirements for new stocks
Figure below shows open storage of AFFF at a Nairobi`s industrial area facility.
Figure 13 Open storage of AFFF at a Nairobi`s industrial area facility.
4.7.4.1 Disposal of products containing industrial POPs in KenyaLack of information by all sectors stakeholders has led to improper disposal of waste containingPFOS and related substances. Proper disposal and handling of E-waste in Kenya goes hand in handin reduction of PBDE in the environment. For e-waste, Kenya has a number of projects gearedtowards recycling and disposal. They include the following; Computer for Schools through their refurbishment programme
WEEE Compliant Recycling at Athi River, Nairobi (the HP project. See Figure 5-1)
Support of individual companies in their projects. Examples are the Nokia Companythrough their recycling scheme. Companies such as IBM and XP have a program where e-
waste from their products is transported back to their homeland.
4.7.4.2 e-waste handlingAt the East African compliant recycling, 6000 kg per day of CRTs and 6000 kg per day of LCDsare sorted out. Different plastic polymer types separated for either recycling or disposal. Hazardousparts are sent to the UK for disposal. Apart from the CRTs and LCDs, 30000kg of other electronicsare sorted per year. Collection centers that feed the facilities within Nairobi are at Mukuru, Ngara,Dandora, Eastlands, Kibera . The Hazardous waste is sealed in containers and transported back tothe UK for further treatment and disposal.

71
The practices for managing e-waste are mostly handled by the informal sector (Jua Kali). Most ofthese operators have inadequate skills, are neither registered nor authorized and operate in asecretive manner. These operations are well connected to the supply chain processes of sourcing theraw material to finding markets for the recovered materials during post-recycling operations. Theprocesses are highly toxic and impact adversely to both the environment and human health.
4.7.4.3 Landfills and Waste DumpsThe wastes that end up in landfills and waste dumps come from both domestic and commercialsources. The inventory indicated that many of the industrial facilities generating both hazardousand non hazardous waste use open burning as the mode of waste disposal. In the City of Nairobifor example, the County Governments’ employees after sweeping will often burn them.Households also practice open burning although in a majority of cases especially in the rural areas,composting is done.
There is no sanitary land filling in Kenya and nearly all local authorities use dumping as a methodof disposal which is often followed by open burning. Calculations on releases were consideredunder open burning.
4.7.4.4Sewage /Sewage Treatment.There are some 30 sewerage treatment plants in Kenya. Generally people are served by mainsewer, septic tanks and pit latrines.It involves the conventional activated sludge process andoxidation ditches. There are sometimes no separate sewage lines for industrial and domestic. Thesewage treatment works treat mixed effluent, industrial and domestic. There are 142 gazetted urbancentres. Of these, only 30 % have sewerage systems.There are treatment plants that can beconsidered as major facilities in category although they may not be connected to other externalsewerage systems. Some of the key facilities are listed below:
Athi River Export processing Zone; Sugar Factories; Leather Factories; Textile Factories; PaperFactories; Sisal Factories; Slaughter houses; Food Processing Facilities. Table 26 below gives thenational water demand projections up to 2010. Currently only 70% urban is supplied with water and48% rural. Only 70% of the supplied water is treated in formal treatment works after it has beenused. The remaining 30% is dumped. It can thus be estimated that approximately 573,443,008 m3 ofwater is treated in formal treatment works while 245,761,289 m3 is dumped. Some haveconventional treatment works,
It was noted that sludge generated from the treatment works was normally sold out to farmers asfarm manure. Using data from the Nyeri Treatment works, 1,000,000 m3 of water treated wouldgenerate about 200 tons of sludge. It can thus be estimated that nationally the 573,443,008 m3 ofwaste water treated annually in the different sewage works, would generate approximately 105,000tons of sludge
4.7.4.5Open Water dumping.All waste water discharge that is not connected to sewers is disposed into rivers with or withouttreatment. Most septic tanks in urban areas are emptied with exhausters and the waste disposed ofinto the nearest sewer system. However for the purpose of this inventory, it was assumed that allfacilities in rural areas can be assumed to be dumping their water. A total of 245,761,289 m3ofwater is dumped.The estimated amount of sludge from the two facilities would be approximately 16tons per annum. Non-thermal treatment of waste oil does not lead to any generation of dioxins andfurans. Contamination and exposure to humans would thus arise from improper handling of thewaste oil, spills and improper disposal. Site specific inspection would need to be done in order toestablish exposure pathways.
72
4.7.4.6 Landfill Leachate.
Most of the dumps are located in valleys within the urban areas. It can be assumed that they leachespecially during the rainy season. The key ones are in Nairobi. However Landfill leachate was notquantified due to inadequate data.
4.7.4.7 Hot Spots
Several Hot spot areas were identified. These sites have the potential of becoming sources ofPCDD/PCDF releases in future. They include Pan Paper mills factory site is a potential Hot spot Athi River pesticide store Dandora dumpsites Some sites have been cleaned as in Juja where PCPs were removed.
Figure 14: A site where PCPs were buries has been rehabilitated in


74
CHAPTER 5: EXISTING PROGRAMMES FOR MONITORINGRELEASES
5.1.Pesticides
Pesticide POPs are the most dispersed. They are also easiest to monitor.
5.1.1. HCHThe beta-isomer of HCH is the most persistent and bio accumulative form. The alpha- and gamma-isomers of HCH are converted into the beta-isomer in living organisms. As a result of this conversion,as much as 90 percent of HCH detected in human tissues and breast milk is the beta-HCH. As withmany other POPs, HCH attaches to soil and sediment particles. However, fungi and bacteria can breakHCH down into less harmful substances. HCH isomers, including Lindane, are broken down quicklyin water. All HCH isomers can accumulate in the fatty tissue of fish and other animals. Work ofGichuche etc has shown the presence of POPs in water and sediments
Table 19Mean concentration (± SE) of Hexachlorocyclohexane (HCH) pesticide residues in water andsediment samples from Yala/Nzoia Basin
Pesticide Water (dry &rainy)
Sediment (μgkg/l(dry)
α-HCH ND 4.41 1.81±0.006β-HCH ND 2.76 0.92±0.017γ-HCH ND 16.03 6.43±0.012(Musa et al., 2011)
The presence of lindane in sediment indicates that it is significantly used in the region despite the factthat it is restricted for seed dressing only in Kenya. The concentrations of lindane in sediments weremuch higher than levelsof water probably because of accumulation in the sediments with time.Decomposition of large amounts of biomass enriches the surface sediments with organic carbon whichpromotes adsorption. This, therefore, could suggest previous use of this pesticide for other agriculturalpurposes apart from seed dressing.A study carried out in two counties (Kiambu and Machakos) compared levels of the HCH group ofcompounds in different fish organs as shown in Tables 5 and 6 below.
Table 20: Mean concentration of Organochlorine pesticide levels (µg Kg-1) ±SD in various fish organs inKiambu County.
Organochlorine Muscle Liver Gonad brain
α-BHC ND 0.236±0.266 0.383±0.15 0.025±0.024ɤ-BHC 0.072±0.011 0.013±0.033 0.169±0.45 0.022±0.046ß-BHC ND ND ND ND
ND: Not Detected/below detection limit. Source: Omwenga, 2013
5.1.2 LindaneLindane had the highest frequency of occurrence and was detected in 36 samples (16.9%) with a meanconcentration of 0.0723 ± 0.011, 0.013± 0.033, 0.169±0.45 and 0.022±0.046 in muscle, liver, gonadand brain respectively in Kiambu County. α-BHC was detected in 19 samples (8.92%) and rangedbetween not detectable to 0.236 µg Kg-1 with a mean concentration(µg kg-1 ) of 0.236±0.266,0.383±0.15 and 0.025±0.024 in liver, gonad and brain respectively in Kiambu County.

75
Table 21: Concentration of Organochlorine pesticide (µg Kg-1) ±SD levels in various fish organs inMachakos County.
Organochlorine Muscle Liver Gonad brainα-BHC ND ND 0.013±0.19 0.011
ɤ-BHC 0.013±0.008 0.073±0.01 0.017±0.029 0.029±0.041β-BHC ND ND ND ND
Fish flesh muscle is the edible part of fish and frequently employed in assessing human health risks inrelation to fish consumption.
Lindane had the highest frequency of detection in all samples analyzed. This is an indication that somefarmers might be illegally using lindane. Lindane was initially used for seed dressing to protect cropsagainst termites. However, its agricultural use has been banned in the country due to persistence andtoxicity to the untargeted organisms. The contamination pathways into water bodies are likely to benonpoint sources via runoff, atmospheric deposition and leaching due to past agricultural applicationsand vector control as the above tables show that levels were higher in Kiambu which is a more intenseagricultural area than Machakos County.
Table 22: Mean and range of pesticide residue levels (µg/kg) in Nile perch liver and muscle samples fromLake Victoria, February – June 2001.
Period of sampling 2001Pesticide residue February-June
Liver ( n=51)February-JuneMuscle (n-52)
Mean(range) Mean(range)-BHC 12.9(2-37)7/51 9.08(1.0-21.8)6/52
-BHC 31.1(9.3-52.9)5/51 14.8(4.6-40.0)13/52
-BHC 5.0(0.9-12.3)14/51 8.23(1.6-75.0)19/52
Residue levels are given on wet weight basis. Mean calculated for the positive samples only.Positive samples are given as a reciprocal. (-) Below detection limit. Source: Mwangi, 2001
The mean level of -BHC found in the liver was about two times higher than in the muscle. -BHC isthe environmentally most persistent isomer and may have higher ability to accumulate in liver tissuethan -BHC. However, -BHC has also been used as an insecticide in Kenya both in agriculture andlivestock as a cattle dip and this may be the reason of its detection in more samples than -BHC
5.1.3 Presence in human MilkIncrease in human settlement and activity along the shoreline is a major contributor to pollution in thelake ecosystem which requires extensive use of pesticides to produce enough food. Vector controlwithin the lake region, and industrial and sewage effluents draining into the lake adds to the lakepollution.These residues were detected during the month of March and April when highest rainfall was recordedand possible discharge of polluted water to the lake. However, since Nile perch are migratory fish, thedetection of these chemicals might reflect the general level of contamination of the lake rather than justa local contamination. The samples were, however, not representative of the entire population. NilePerch are also known to be bottom swimmers, feeding mainly on deposit material which may have
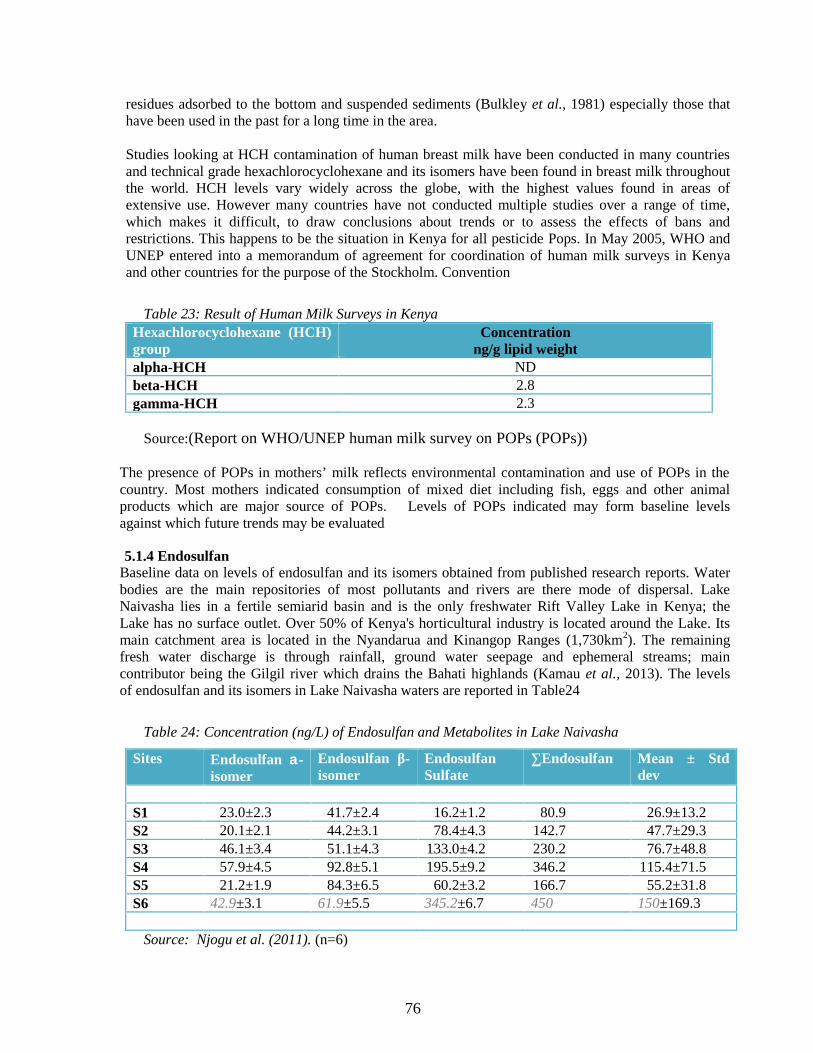
76
residues adsorbed to the bottom and suspended sediments (Bulkley et al., 1981) especially those thathave been used in the past for a long time in the area.
Studies looking at HCH contamination of human breast milk have been conducted in many countriesand technical grade hexachlorocyclohexane and its isomers have been found in breast milk throughoutthe world. HCH levels vary widely across the globe, with the highest values found in areas ofextensive use. However many countries have not conducted multiple studies over a range of time,which makes it difficult, to draw conclusions about trends or to assess the effects of bans andrestrictions. This happens to be the situation in Kenya for all pesticide Pops. In May 2005, WHO andUNEP entered into a memorandum of agreement for coordination of human milk surveys in Kenyaand other countries for the purpose of the Stockholm. Convention
Table 23: Result of Human Milk Surveys in KenyaHexachlorocyclohexane (HCH)group
Concentrationng/g lipid weight
alpha-HCH NDbeta-HCH 2.8gamma-HCH 2.3
Source:(Report on WHO/UNEP human milk survey on POPs (POPs))
The presence of POPs in mothers’ milk reflects environmental contamination and use of POPs in thecountry. Most mothers indicated consumption of mixed diet including fish, eggs and other animalproducts which are major source of POPs. Levels of POPs indicated may form baseline levelsagainst which future trends may be evaluated
5.1.4 EndosulfanBaseline data on levels of endosulfan and its isomers obtained from published research reports. Waterbodies are the main repositories of most pollutants and rivers are there mode of dispersal. LakeNaivasha lies in a fertile semiarid basin and is the only freshwater Rift Valley Lake in Kenya; theLake has no surface outlet. Over 50% of Kenya's horticultural industry is located around the Lake. Itsmain catchment area is located in the Nyandarua and Kinangop Ranges (1,730km2). The remainingfresh water discharge is through rainfall, ground water seepage and ephemeral streams; maincontributor being the Gilgil river which drains the Bahati highlands (Kamau et al., 2013). The levelsof endosulfan and its isomers in Lake Naivasha waters are reported in Table24
Table 24: Concentration (ng/L) of Endosulfan and Metabolites in Lake Naivasha
Sites Endosulfan -isomer
Endosulfan β-isomer
EndosulfanSulfate
∑Endosulfan Mean ± Stddev
S1 23.0±2.3 41.7±2.4 16.2±1.2 80.9 26.9±13.2S2 20.1±2.1 44.2±3.1 78.4±4.3 142.7 47.7±29.3S3 46.1±3.4 51.1±4.3 133.0±4.2 230.2 76.7±48.8S4 57.9±4.5 92.8±5.1 195.5±9.2 346.2 115.4±71.5S5 21.2±1.9 84.3±6.5 60.2±3.2 166.7 55.2±31.8S6 42.9±3.1 61.9±5.5 345.2±6.7 450 150±169.3
Source: Njogu et al. (2011). (n=6)

77
a) Lake VictoriaWerimo and coworkers (2009) reported having detected less than 0.5 μg L−1 of β-Endosulfan in LakeVictoria waters at Ndere Island, the reported levels were low and posed no unacceptable risks fromendosulfan contamination.
b) Other River SystemsA number of rivers in Kenya drain into the sea, River Umba is the only Transboundary River itscatchment area covers some section of Tanzania. RiverRamisi is a costal river with a catchmentspanning within the coastal region. Rivers Tana and Sabaki are the two major rivers the catchmentareas drain through agricultural and urban areas. Table21reports on pesticide concentrations inseaweed and marine sediment, the reported endosulfan concentration was higher compared to theother pesticides analyzed.
Table 25: Mean concentration of organo-chlorine pesticides in sediments and seaweed.Site/Sample Pesticide conc. (g/g)
English PointMarine sediment-BHC 0.004±2.1
Nyali BridgeMarine sediment-BHCMarine sediment-Endosulfan
0.025±0.010.322±0.01
Port Reitz CreekSargassum-BHC 0.193±0.01
Makupa CreekThalasadendron-BHC
0.045±0.01
Source: Oyugi et al. 2008
Table belowreports on POPs detected in estuarine and marine environment of interest is to note that bothSabaki and Ramisi estuaries recorded the lowest -endosulfan water concentrations, an indication of lessuse in their catchment area (Table 22. Kilifi and Mombasa on the other hand recorded high levels, the highlevels in Kilifi can be attributed to the Goshi River, which flows through Taita Hills and enters the IndianOcean at Kilifi Creek. This might imply high use of endosulfan in the catchment area of Taita Hills.
Table 26: Endosulfan and Lindane residues detected in water samples at different sites
Sites Mean (residues in water (ng/ml±sd)Sabaki Kilifi Mombasa Ramisi
Lindane 0.241* 0.503±0.361 BDL BDL
-Endosulfan 0.166±0.015 0.239±0.142 0.397±0.223 0.155±0.057*detected in one sample only; sd: Standard deviation; BDL: Below detection limitSource: Wandiga et al. 2002
Fish sampled from the Tana estuary contained very low endosulfan levels, these samples were howeversampled five years earlier, whereas the others were sampled in 2008 these were sampled in 2003. Possiblecause of the variant could be that endosulfan use in the catchment area might have been low in the periodprior 2003. The fish sampled from Sabaki estuary contained twice as much endosulfan concentrationscompared to the other sites sampled (Table23).
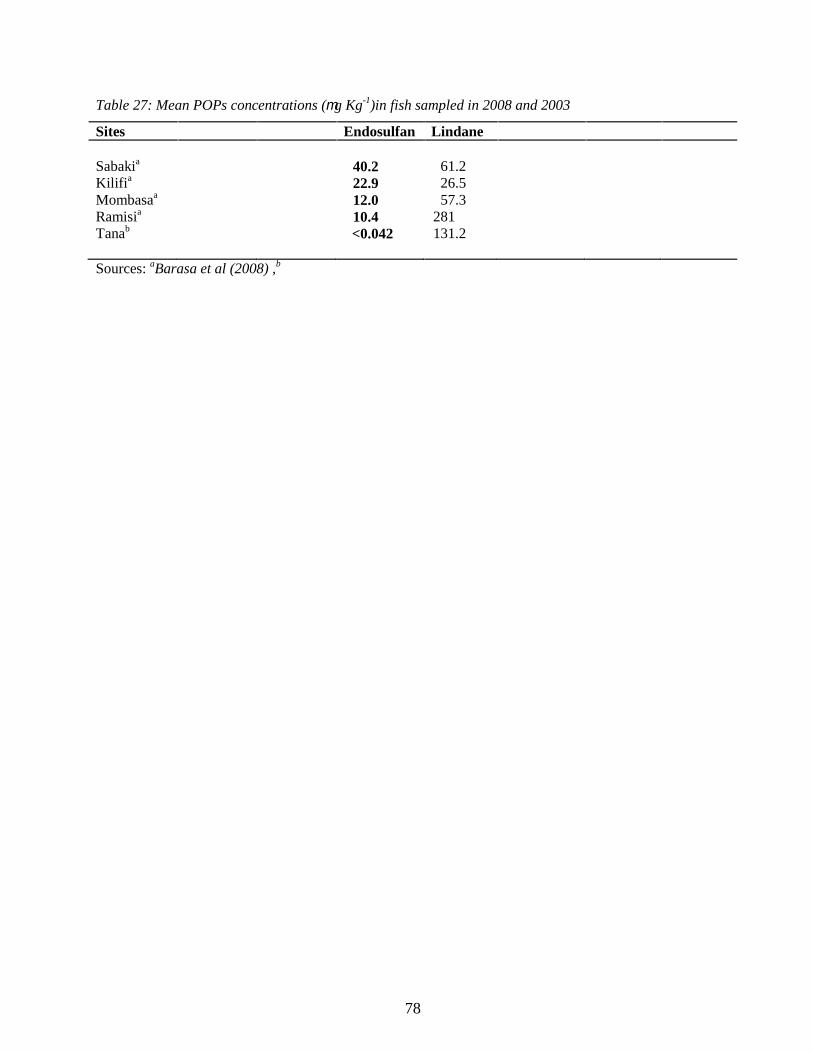
78
Table 27: Mean POPs concentrations (g Kg-1)in fish sampled in 2008 and 2003
Sites Endosulfan Lindane
Sabakia 40.2 61.2Kilifia 22.9 26.5Mombasaa 12.0 57.3Ramisia 10.4 281Tanab <0.042 131.2
Sources: aBarasa et al (2008) ,b

79
Figure 15: Concentrations (ng/L) of PFOA (black bars) and PFOS (White bars) in water in Kisumu Kenya
No levels have been monitored for POPs-PBDE and HBB in any environmental matrices in Kenya. Theneed to monitor these levels is therefore recommended.
5.3.Impacted populations or environnements
5.3.1 Assessment of ImpactedPopulations byPOPs pesticidesKenya does not have a nationally established programme to monitor POPs in environmental media,food stuff or human samples. The existing POPs data has been produced through participation ininternational programmes such as the Global monitoring Plan, UNEP/GEF supported activities, andlocally through research activities. Review of the existing national documents including the POPsinventory of 2006, and related reports such as the Africa POPs monitoring report and reports of theUNEP GEF capacity enhancement activities have revealed the presence of POPs pesticide residues inenvironmental media.
a) POPs pesticides in environmental samples
The results of analysis of environmental samples reveal the presence of POPs pesticides such as aldrinand dieldrin in fish and sediments, DDT and DDE in soil samples, whereas ambient air reveal highlevels of aldrin, DDE and DDT in samples from Kabete. However, o,p-DDT is considerably lowerthan their p,p’-DDT counterparts for most of the air samples. Other OCPs detected, but in low levels,are chlordanes, heptachlors and endrin. Based on the observed levels across the seasons, the residuesmeasured in air could be attributed to local air circulations rather than point source contamination(Table 2.1).Soils from contaminated site in Kitengela has revealed high concentrations of dieldrin,endrin, p,p’-DDT, p,p’-DDE, p,p’-DDD, o,p’-DDT, o,p’-DDE and o,p’-DDD. The presence of largestocks of contaminated soil in the country is of concern and appropriate decontamination strategiesneed to be employed to restore the soils.
0
5
10
15
20
25
30
35
40
45
50
55
60
65
70
75
80
85
90
95
100
0 2 4 6 8 10 120
10
20
30
40
50
60
70
80
90
100
0 1
0
10000
20000
30000
40000
50000
60000
70000
80000
90000
100000
0 2 4 6 8 10 12 14 16 18 20
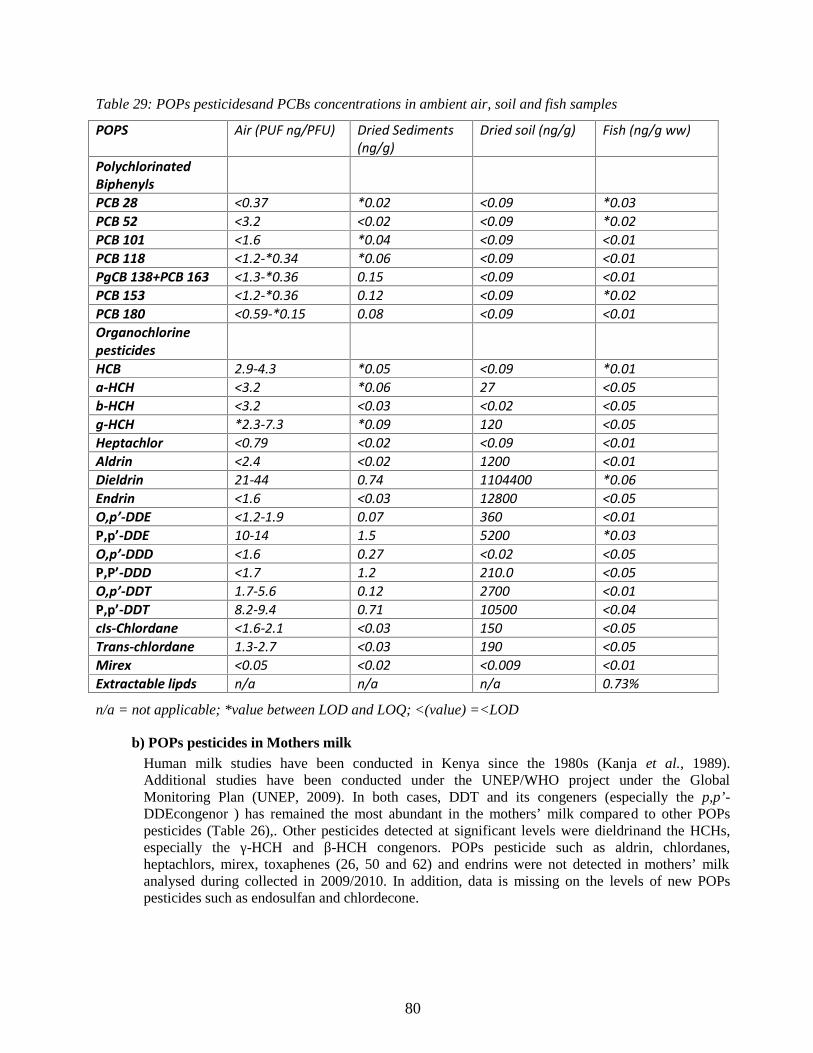
80
Table 29: POPs pesticidesand PCBs concentrations in ambient air, soil and fish samples
POPS Air (PUF ng/PFU) Dried Sediments(ng/g)
Dried soil (ng/g) Fish (ng/g ww)
PolychlorinatedBiphenylsPCB 28 <0.37 *0.02 <0.09 *0.03PCB 52 <3.2 <0.02 <0.09 *0.02PCB 101 <1.6 *0.04 <0.09 <0.01PCB 118 <1.2-*0.34 *0.06 <0.09 <0.01PgCB 138+PCB 163 <1.3-*0.36 0.15 <0.09 <0.01PCB 153 <1.2-*0.36 0.12 <0.09 *0.02PCB 180 <0.59-*0.15 0.08 <0.09 <0.01OrganochlorinepesticidesHCB 2.9-4.3 *0.05 <0.09 *0.01a-HCH <3.2 *0.06 27 <0.05b-HCH <3.2 <0.03 <0.02 <0.05g-HCH *2.3-7.3 *0.09 120 <0.05Heptachlor <0.79 <0.02 <0.09 <0.01Aldrin <2.4 <0.02 1200 <0.01Dieldrin 21-44 0.74 1104400 *0.06Endrin <1.6 <0.03 12800 <0.05O,p’-DDE <1.2-1.9 0.07 360 <0.01P,p’-DDE 10-14 1.5 5200 *0.03O,p’-DDD <1.6 0.27 <0.02 <0.05P,P’-DDD <1.7 1.2 210.0 <0.05O,p’-DDT 1.7-5.6 0.12 2700 <0.01P,p’-DDT 8.2-9.4 0.71 10500 <0.04cIs-Chlordane <1.6-2.1 <0.03 150 <0.05Trans-chlordane 1.3-2.7 <0.03 190 <0.05Mirex <0.05 <0.02 <0.009 <0.01Extractable lipds n/a n/a n/a 0.73%
n/a = not applicable; *value between LOD and LOQ; <(value) =<LOD
b) POPs pesticides in Mothers milkHuman milk studies have been conducted in Kenya since the 1980s (Kanja et al., 1989).Additional studies have been conducted under the UNEP/WHO project under the GlobalMonitoring Plan (UNEP, 2009). In both cases, DDT and its congeners (especially the p,p’-DDEcongenor ) has remained the most abundant in the mothers’ milk compared to other POPspesticides (Table 26),. Other pesticides detected at significant levels were dieldrinand the HCHs,especially the γ-HCH and β-HCH congenors. POPs pesticide such as aldrin, chlordanes,heptachlors, mirex, toxaphenes (26, 50 and 62) and endrins were not detected in mothers’ milkanalysed during collected in 2009/2010. In addition, data is missing on the levels of new POPspesticides such as endosulfan and chlordecone.
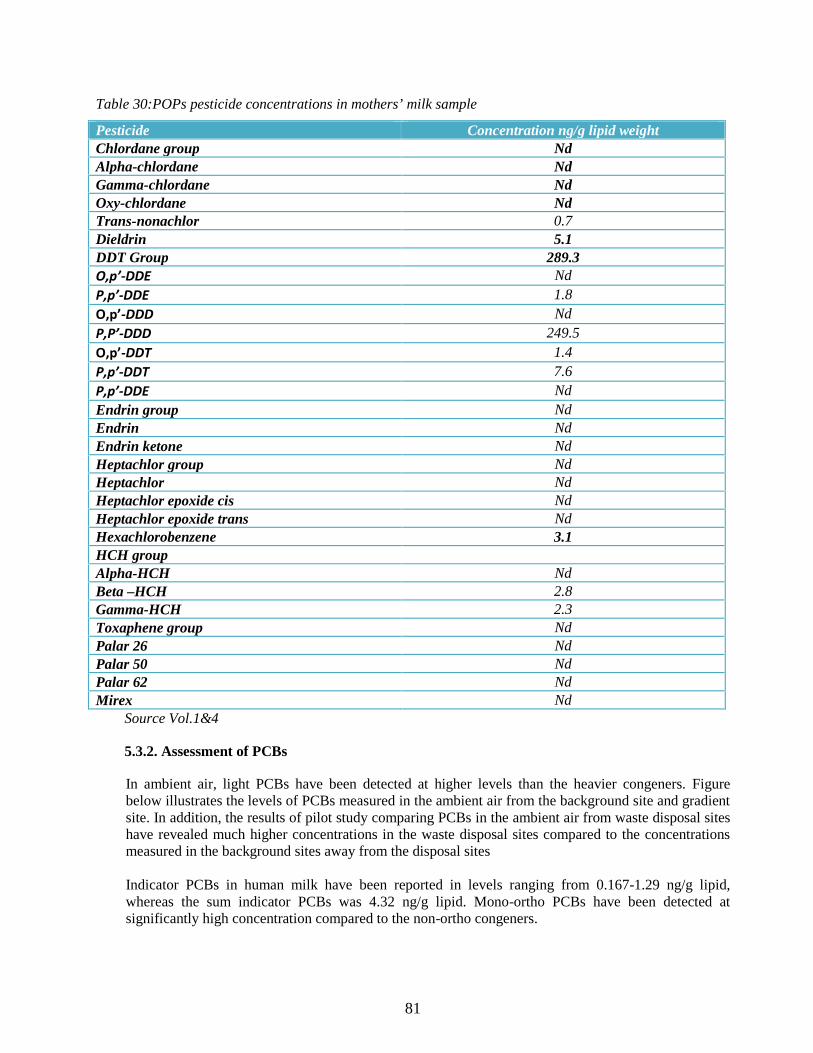
81
Table 30:POPs pesticide concentrations in mothers’ milk sample
Pesticide Concentration ng/g lipid weightChlordane group NdAlpha-chlordane NdGamma-chlordane NdOxy-chlordane NdTrans-nonachlor 0.7Dieldrin 5.1DDT Group 289.3O,p’-DDE NdP,p’-DDE 1.8O,p’-DDD NdP,P’-DDD 249.5O,p’-DDT 1.4P,p’-DDT 7.6P,p’-DDE NdEndrin group NdEndrin NdEndrin ketone NdHeptachlor group NdHeptachlor NdHeptachlor epoxide cis NdHeptachlor epoxide trans NdHexachlorobenzene 3.1HCH groupAlpha-HCH NdBeta –HCH 2.8Gamma-HCH 2.3Toxaphene group NdPalar 26 NdPalar 50 NdPalar 62 NdMirex Nd
Source Vol.1&4
5.3.2. Assessment of PCBs
In ambient air, light PCBs have been detected at higher levels than the heavier congeners. Figurebelow illustrates the levels of PCBs measured in the ambient air from the background site and gradientsite. In addition, the results of pilot study comparing PCBs in the ambient air from waste disposal siteshave revealed much higher concentrations in the waste disposal sites compared to the concentrationsmeasured in the background sites away from the disposal sites
Indicator PCBs in human milk have been reported in levels ranging from 0.167-1.29 ng/g lipid,whereas the sum indicator PCBs was 4.32 ng/g lipid. Mono-ortho PCBs have been detected atsignificantly high concentration compared to the non-ortho congeners.
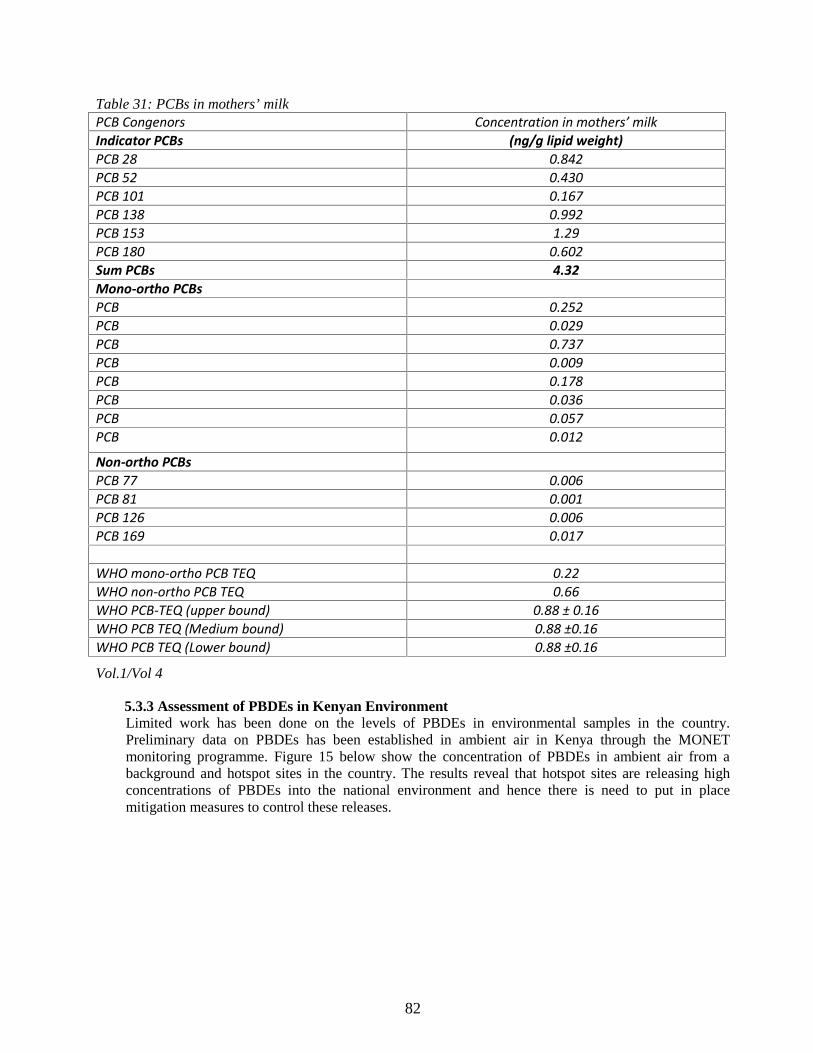
82
Table 31: PCBs in mothers’ milkPCB Congenors Concentration in mothers’ milkIndicator PCBs (ng/g lipid weight)PCB 28 0.842PCB 52 0.430PCB 101 0.167PCB 138 0.992PCB 153 1.29PCB 180 0.602Sum PCBs 4.32Mono-ortho PCBsPCB 0.252PCB 0.029PCB 0.737PCB 0.009PCB 0.178PCB 0.036PCB 0.057PCB 0.012
Non-ortho PCBsPCB 77 0.006PCB 81 0.001PCB 126 0.006PCB 169 0.017
WHO mono-ortho PCB TEQ 0.22WHO non-ortho PCB TEQ 0.66WHO PCB-TEQ (upper bound) 0.88 ± 0.16WHO PCB TEQ (Medium bound) 0.88 ±0.16WHO PCB TEQ (Lower bound) 0.88 ±0.16
Vol.1/Vol 4
5.3.3 Assessment of PBDEs in Kenyan EnvironmentLimited work has been done on the levels of PBDEs in environmental samples in the country.Preliminary data on PBDEs has been established in ambient air in Kenya through the MONETmonitoring programme. Figure 15 below show the concentration of PBDEs in ambient air from abackground and hotspot sites in the country. The results reveal that hotspot sites are releasing highconcentrations of PBDEs into the national environment and hence there is need to put in placemitigation measures to control these releases.
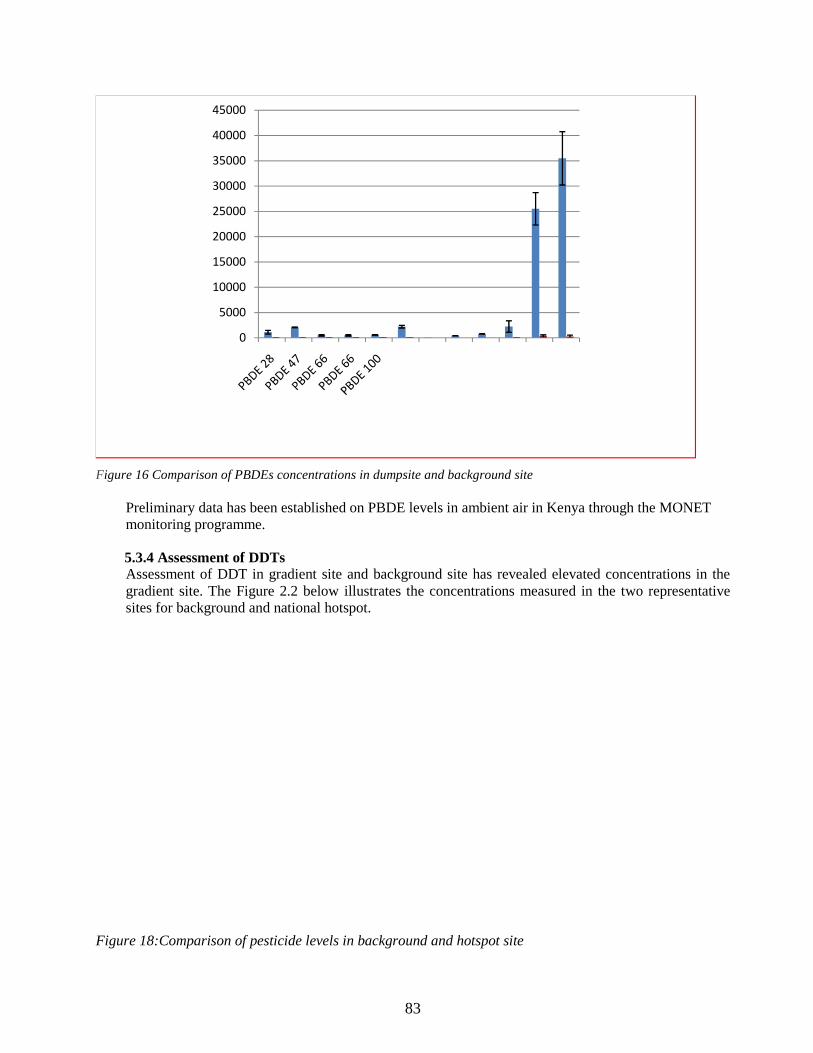
83
Figure 16 Comparison of PBDEs concentrations in dumpsite and background site
Preliminary data has been established on PBDE levels in ambient air in Kenya through the MONETmonitoring programme.
5.3.4 Assessment of DDTsAssessment of DDT in gradient site and background site has revealed elevated concentrations in thegradient site. The Figure 2.2 below illustrates the concentrations measured in the two representativesites for background and national hotspot.
Figure 18:Comparison of pesticide levels in background and hotspot site
0
5000
10000
15000
20000
25000
30000
35000
40000
45000

84
5.3.5 Assessment of PFOs and its salts and PFOSFLimited data exist on PFOS and PFOSF from research activities on these compounds in fish, water andsediments collected from Lake Victoria (Orataet al., 2008, 2009, 2011). In a study screeningperfluorooctanoic acid and perfluorooctanesulfonate in Lake Victoria Gulf and in its source rivers,levels of perfluorinated alkylated substances were detected. The concentration of perfluorooctanoicacid or perfluorooctanesulfonate in river waters ranged 400-96,400 for perfluorooctanoic acid and<400-13,230 pg/L for perfluorooctanesulfonate. The levels in the river samplers were found to behigher than those detected in the lake water samples for which the perfluorooctanoic acid ranged from400-11,650 and perfluorooctanesulfonate from<400-2,530 pg/L. The measured levels and trendssuggested generalized point sources such as domestic and industrial waste (Orata, et al., 2009).
5.3.6 Assessment of UPOPsPolychlorinated dibenzo-p-dioxins and dibenzofurans have been reported in mothers’ milk from therural areas at picogram levels. Furans concentration varied from 0.045-1.4 pg/g lipid, whereas dioxinconcentrations ranged from 0.268-52.3 pg/g lipid. Table 28shows the concentrations of differentcongeners of dioxins and furans measured in mothers’ milk samples.
Table 32: Dioxins and furans measured in mothers milk samples
2,3,7,8-substituted PCDD/PCDF Concentrations (pg/g lipid weight2,3,7,8-TCDF 0.5511,2,3,7,8-PeCDF 0,2302,3,4,7,8-HxCDF 1.051,2,3,4,7,8- HxCDF 0.3982,3,4,6,7,8- HxCDF 0.4401,2,3,7,8- HxCDF 0.2511,2,3,4,6,7- HpCDF1.2.3.4.6.7.8- HpCDF 0.0045OCDF 0.206
2,3,7,8,-TCDD 0.2681,2,3,7,8-PeCDD 0.4931,2,3,4,7,8-HxCDD 0.3811,2,3,6,7,8- HxCDD 1.891,2,3,,7,8,9- HxCDD 0.8941,2,3,4,6,7,8-HpCDD 9.75OCCDD 52.3
WHO-PCDD/F-TEQ (upper bound) 1.89 ±0.37WHO-PCDD/F-TEQ (medium bound) 1.89 ±0.37WHO-PCDD/F-TEQ (lower bound) 1.89 ±0.37
Dioxins and furans concentrations in the air samples have revealed high concentrations in gradient samplescompared to national background sites used in the Global Monitoring Plan. This is illustrated in the Figurebelow.
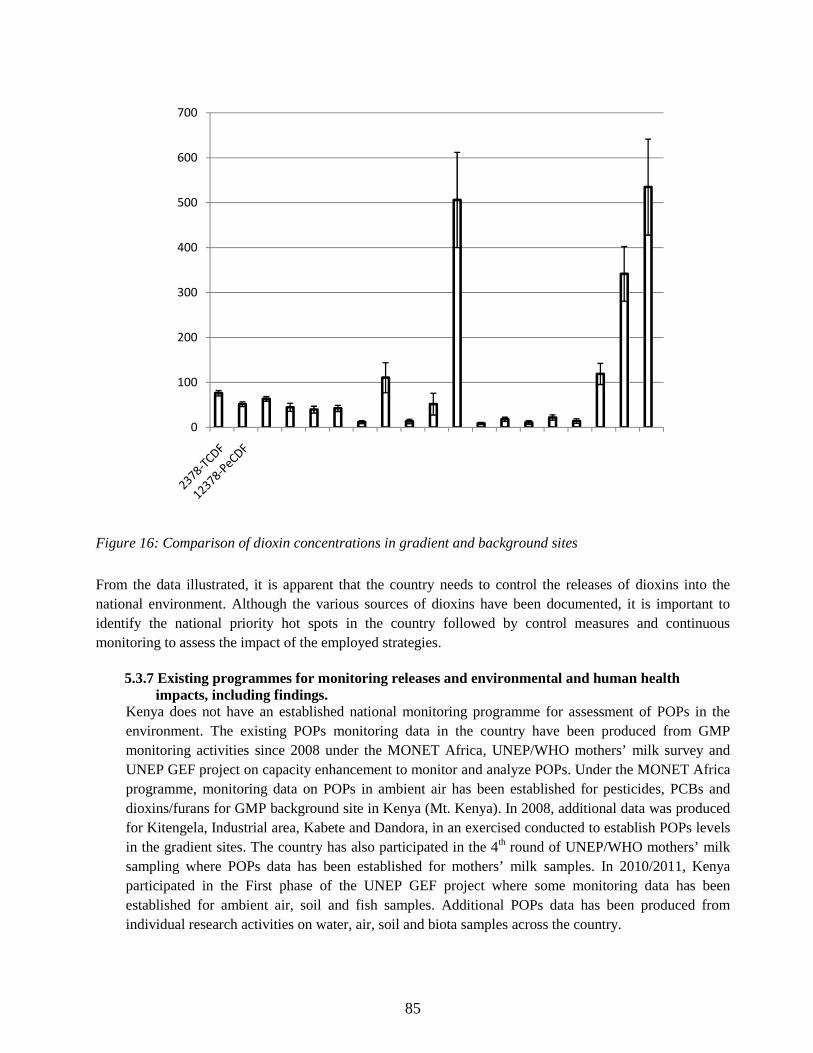
85
Figure 16: Comparison of dioxin concentrations in gradient and background sites
From the data illustrated, it is apparent that the country needs to control the releases of dioxins into thenational environment. Although the various sources of dioxins have been documented, it is important toidentify the national priority hot spots in the country followed by control measures and continuousmonitoring to assess the impact of the employed strategies.
5.3.7 Existing programmes for monitoring releases and environmental and human healthimpacts, including findings.
Kenya does not have an established national monitoring programme for assessment of POPs in theenvironment. The existing POPs monitoring data in the country have been produced from GMPmonitoring activities since 2008 under the MONET Africa, UNEP/WHO mothers’ milk survey andUNEP GEF project on capacity enhancement to monitor and analyze POPs. Under the MONET Africaprogramme, monitoring data on POPs in ambient air has been established for pesticides, PCBs anddioxins/furans for GMP background site in Kenya (Mt. Kenya). In 2008, additional data was producedfor Kitengela, Industrial area, Kabete and Dandora, in an exercised conducted to establish POPs levelsin the gradient sites. The country has also participated in the 4th round of UNEP/WHO mothers’ milksampling where POPs data has been established for mothers’ milk samples. In 2010/2011, Kenyaparticipated in the First phase of the UNEP GEF project where some monitoring data has beenestablished for ambient air, soil and fish samples. Additional POPs data has been produced fromindividual research activities on water, air, soil and biota samples across the country.
0
100
200
300
400
500
600
700

86
The availabledata reveal the presence of POPs in environmental samples. However, compared with theinitials data generated through research activities, there is indication that POPs levels especiallypesticides are decreasing in environmental samples. The priority areas of concern remain to becontaminated soils from obsolete pesticide dumpsites and waste disposal sites.In order to strengthenPOPs management in the country, it is necessary to develop national POPs monitoring programme toassess the levels of these chemicals in the priority hotspots such as obsolete pesticide sites, wastedisposal sites and industrials and agricultural sites.

87
CHAPTER 6:PUBLIC AWARENESS AND EDUCATION
Public information and awareness activities in the country are mainly conducted by the MEWNR, MoH,MoA and the private sector through NGOs. The MEWNR has conducted several awareness creationactivities during the development of the Kenya national Chemical Profile and the updating of the NationalImplementation plan.
6.1. Currentlevel of information, awareness and educationamongtarget groups
Several training workshops, meetings and symposia have been held such as: Meeting at the PCPB to review and revised the list of banned and listed chemicals. Series of workshops organized by Greenbelt Movement in Nairobi, Nakuru, Thika, Mombasa and
Kisumu to promote minimization of open burning of plastic waste Open Burning Programme in Nyeri Municipality. Training on the Global Monitoring of POPs. Stakeholder meetings during development of the National Chemical Profile and Updating of the
NIP.
However, POPs awareness among the stakeholders and special groups in the country isstill low and seem tobe limited at national levels among the inter-ministerial agencies involved in developing the nationalpolicies, regulations and environmental standards.
The priorityareas for awareness creation identified during stakeholder meetings held in different regions inthe country, such as Kisumu, Central and Rift Valley regions have been included in the action plan.
6.2. Awareness and educationamongtarget groups;
There are no appropriate educational materials on POPs for training the target groups such as women andchildren, policy makers, civil society, and even the implementing agencies at the grass-root levels amongothers. NIP has also been anchored in the SAICM national Action Plan.
6.3 Currentlevel of information
Exchange information on POPs is generally lacking amongthe local stakeholders at regional and countylevels. This seems to hamper their active participation and execution of their expected mandates on POPsmanagement. It is therefore important to ensure that appropriate communication strategies are developed toenhance exchange of information on POPs to stimulate active participation of the government agencies andthe general public in POPs management activities.
6.4 Relevant activities of non-governmentalstakeholders
NGOs play a key role in the realization of the goals of the SC and other chemicals safety agreements. Inorder to ensure success in the implementation of these Conventions the role that NGOs play is vitalespecially with regard to advocacy and introduction.

88
The main NGO having activities on NIP includes: Ecoethics in Mombasa The Greenbelt Movement in Mombasa iLIMA, Nairobi
Professionalorganizations include: Agrochemicals Association of Kenya Kenya Association of Manufacturers
6.5.IntergovernmentalOrganizations
Kenya interacts closely with intergovernmental organizations that have mandate on chemicals andespecially; United Nations Environment Program UNEP) with its headquarters in Nairobi, Kenya, plays an active
role in chemicals management. UNEP has under its wing most of the chemical and wastemanagement programs and Kenya should take advantage of this proximity.
Food and Agriculture Organization (FAO). This is the principle agent covering pesticide useparticularly with regard to the agricultural industry, which is its primary focus.
The International Labor Organization (ILO) steps in where issues of human health and in particularemployee safety in work environments where POPs and other potentially harmful chemicals areexposed to the employees.
The World Health Organization (WHO) participates also in the protection of human health and willcarry out research into eliminating health risks resulting from chemicals. In Kenya WHO is involvedin finding alternatives to POPs that are detrimental to human health such as DDT.
Working with these organizations is important as it benefits the country by easing access to information,human resources and financial resources.
Involvement in programs and projects organized by these organizations also encourages cooperation withother countries, which is effective in the realization of the objectives of the Convention.
6.6 Strategies for the Implementation ofAwarenessCreation and Communication
Several strategies will be embraced in the implementation of the component activities. These include;
a) Internal communication Strategy:This strategy will be used to enhance knowledge on NRBP among staff and policy-makers withinthe larger Ministry of Environment & Mineral Resources. Capacity building of the staff willbroaden communication on NRBP to the public in order to avoid conflicting messages.
b) Establishing public participation mechanism Strategy:This strategy will provide a platform for all stakeholders to be involved and contribute to theachievement of the NRBP across the 10 point intervention plan contained in 5 major components.An elaborate advocacy plan will be undertaken aimed at changing peoples’ perception andunderstanding of the NRBP and why the proposed decisions have been taken. The advocacyframework will identify issues/problems, identify solutions, identify “gatekeepers” who makedecisions, identify resources, define strategies and create action plan and implement and monitor.

89
c) Media campaignStrategy:The strategy will promote accurate and analytical media coverage of the NRBP activities. Variousmediums of communication will be applied including TV documentaries, talk shows,advertisements, radio interactive,
6.7 Enhancing Awareness and Communication
In order to ensure coordination of the various strategies, the following is recommended:
i) Establishment of a central official communication point on the NRBP:The identification of an overall coordinator and specific spokes persons will ensure that all officialmessages are delivered by authorized persons. It is advisable that the heads of implementinginstitutions or their designate be formally appointed as spokespersons for the programme.
ii) Developing a branded communication platform:The component has developed a slogan for the NRBP namely; A Clean Environment forImproved Livelihoods. The slogan will be applied in all the awareness materials produced thusproviding a coordinated platform for communication. This will enhance coherence of messagesand create synergy across the different communication activities.
The development and production of awareness and communication materials will be developedand printed under the close supervision of the Component Committee for dissemination amongvarious stakeholders. This will ensure accuracy in technical content, relevance andappropriateness. The awareness materials will enhance effective communication and awarenesscreation. The Committee will receive feedback from the various audiences on the appropriatenessof the materials.
ii) Dissemination of Information Materials:This comprises of thedistribution of materials among the intended audiences as well as localcommunities. Other materials will be displayed at strategic points such as bus stops, market places,bill boards aimed at creating awareness to a large portion of the public.
iii) Media PlacementA media plan for the public announcement will be put in place based on current media researchdata. The Project Spokesperson will release regular and accurate updates on the collectivemilestones achieved by the various components on the NRBP. In addition, media houses will belobbied to offer bonuses and other lucrative coverage arrangements as a way of making acontribution of the media to the Programme.
The Component identified major audience segments to target communication. In this regard, thekey audiences and the rationale for their involvement is tabulated below. The coverage of theseaudiences will broaden the information and understanding of the programme.
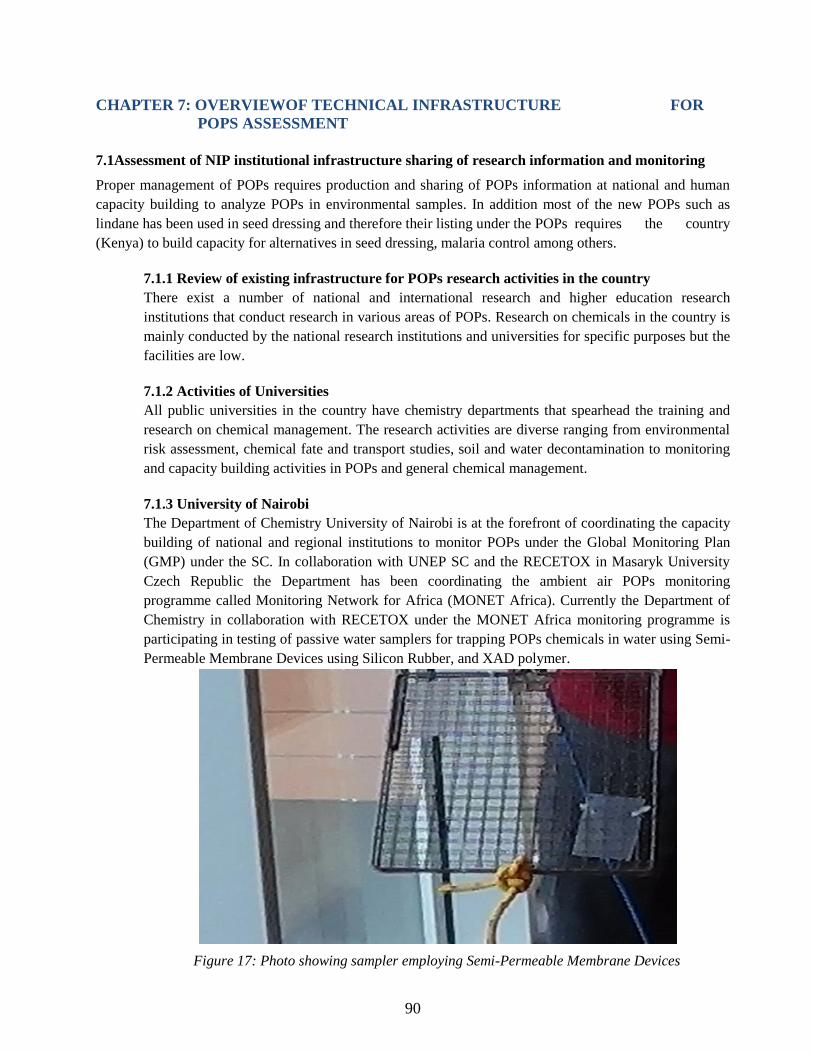
90
CHAPTER 7: OVERVIEWOF TECHNICAL INFRASTRUCTURE FORPOPS ASSESSMENT
7.1Assessment of NIP institutional infrastructure sharing of research information and monitoring
Proper management of POPs requires production and sharing of POPs information at national and humancapacity building to analyze POPs in environmental samples. In addition most of the new POPs such aslindane has been used in seed dressing and therefore their listing under the POPs requires the country(Kenya) to build capacity for alternatives in seed dressing, malaria control among others.
7.1.1 Review of existing infrastructure for POPs research activities in the countryThere exist a number of national and international research and higher education researchinstitutions that conduct research in various areas of POPs. Research on chemicals in the country ismainly conducted by the national research institutions and universities for specific purposes but thefacilities are low.
7.1.2 Activities of UniversitiesAll public universities in the country have chemistry departments that spearhead the training andresearch on chemical management. The research activities are diverse ranging from environmentalrisk assessment, chemical fate and transport studies, soil and water decontamination to monitoringand capacity building activities in POPs and general chemical management.
7.1.3 University of NairobiThe Department of Chemistry University of Nairobi is at the forefront of coordinating the capacitybuilding of national and regional institutions to monitor POPs under the Global Monitoring Plan(GMP) under the SC. In collaboration with UNEP SC and the RECETOX in Masaryk UniversityCzech Republic the Department has been coordinating the ambient air POPs monitoringprogramme called Monitoring Network for Africa (MONET Africa). Currently the Department ofChemistry in collaboration with RECETOX under the MONET Africa monitoring programme isparticipating in testing of passive water samplers for trapping POPs chemicals in water using Semi-Permeable Membrane Devices using Silicon Rubber, and XAD polymer.
Figure 17: Photo showing sampler employing Semi-Permeable Membrane Devices

91
The Department of Chemistry has recently acquired a Low Volume active air sampler forcalibration of the passive air samplers used in the Region. The active sampler will be used to airmonitoring of POPs in ambient air (Figure 15).
Figure 18 Active air sampler for POPs at the Department of Chemistry, UON.
The Department of Chemistry University of Nairobi has has coordinated several trainings of thenational institutions on POPs analysis in different environmental matrices such as ambient air,water, soil sediments and biota. Figure 4.1 below shows participants during one of the trainingworkshops on POPs.
Figure 19: Training of POPs analysis at the University of Nairobi
Department of public Health and Pharmacology, University of Nairobi which is located in theCollege of Agriculture and Veterinary Sciences undertakes research on DDT and metabolites in
92
human breast milk. In 2009, the institution carried out human breast milk sampling for analysis ofPOPs in collaboration with WHO and UNEP. Since 1978 the department together with otherinternational and national collaborators hasalso undertaken research and training to advancedknowledge and capacity building in analysis of chemical residues in the environment includingfoods of animal origin and other environmental studies. It is also one of the departments with thecapacity to carry out toxicity studies and the impact of these POPs in human/animal health and invarious ecosystems.
7.1.4 Masinde University of Science and Technology (MUST)Masinde University of Science and Technology undertakes research on organo-chlorine pesticidesand PFOS and PFOSF in water, sediments, fish and wastewater treatment plants effluents. TheUniversity is in possession of GC-ECD and GC-MS equipment for research.
7.1.5Maseno UniversityThe Department of Chemistry, Maseno University is conducting research on organo-chlorinepesticide residues in soil, water and sediments and decontamination of contaminated soils. TheDepartment is in possession of GC-ECD, HPLC, and greenhouse gas measuring equipment tofacilitate research activities in this area.
7.1.6 Jomo Kenyatta University of Agriculture andTechnology
Department of Chemistry located in Jomo Kenyatta University of Agriculture and Technology hasprogressively engaged in various research activities including POPs pesticide. The department hasbeen in constant collaborations with the public and private universities and research institutionssuch as ICIPE, KEFRI, KEMRI, KARI amongst others. Through Pan African chemistry Network(PACN) the Royal Society of Chemistry identified JKUAT through the department has hostedinternational training workshops on GC-MS. The training workshops have attracted participantsdrawn from different parts of Africa.
7.1.7 University of EldoretThe Department of Chemistry University of Eldoret conducts research on organo-chlorinepesticides in environmental media. The Department is in possession of GC and GC-MS to supportits research activities.
7.1.8 Kenyatta UniversityKenyatta University conducts research on organo-chlorine pesticides in environmental media. TheUniversity is in possession of HPLC and LC-MS instruments.
7.1.9 Other Universities working on POPsOther Universities that carry out research on chemicals include Moi University and EgertonUniversity.
7.2 National research institutions
The main national research institutions that address chemical issues include Kenya Medical ResearchInstitute (KEMRI), Kenya Agricultural Research Institute (KARI), and Kenya Industrial ResearchDevelopment Institute (KIRDI)..
93
a) Kenya Medical Research Institute (KEMRI)KEMRI conducts research on effects of pesticides among formulators/store-men and farm workers(Wanja, 2007). It also has pesticide inventories for the work carried out in 1990’s (Mbakayaet al.,1994). Other research activities at KEMRI include effectiveness of malaria vector control such asbed nets, larviciding, IRS, and other insecticides of public health importance. The institution is alsoKEMRI is working with Pyrethrum Board of Kenya to evaluate the quality of their products forvector control. In collaboration with ICIPE, KEMRI is working on research to use biological agentsfor Malaria control.
b) Kenya Agricultural Research Institute (KARI)The Kenya Agricultural Research Institute (KARI) is a premier national institution bringingtogether research programmes in food crops, horticultural and industrial crops, livestock and rangemanagement, land and water management, and socio-economics. It promotes sound agriculturalresearch, technology generation and dissemination to ensure food security through improvedproductivity and environmental conservation.
The KARI e-repository accesses large collection of world literature covering all aspects ofagricultural sciences and technology, including grey literature which is not available throughnormal publication and distribution channels.
KARI deals specifically with efficacy trials of Agricultural pesticides for field and stored crops(Mutambukiet al. 2002) and fertilizers. In general, research activities in the country are targeted tospecific needs of the society. However, there are limitations of funding, technical equipment andadequate human capacity as well as lack of information and networking/collaboration amongstabove institutions.
c) Pyrethrum Board of KenyaPyrethrum has been grown in Kenya since 1928 and the Pyrethrum Board of Kenya was establishedin 1934 to oversee to all activities related to the production and processing of pyrethrum for thebenefit of growers and consumers. By the end of Second World War, Kenya had become a majorsource of pyrethrum, accounting for more than 65% of the global supply, a leadership which thecountry has steadfastly maintained to the present time. Today, the Pyrethrum Board of Kenyaremains firmly committed to serving its international clientele of distributors, manufacturers andultimate consumers of end-use products.
d)Kenya Fisheries Research Institute (KEMFRI)Kenya Marine and Fisheries Research Institute (KMFRI) is a State Corporation in the Ministry ofFisheries Development of the Government of Kenya. It is mandated to conduct aquatic researchcovering all the Kenyan waters and the corresponding riparian areas including the Kenyan's EEZ inthe Indian Ocean waters. The research mandate of KMFRI is defined by article No. 4 of the Scienceand Technology Act of 1979, Cap 250. The Institute is empowered to carry out research in Marineand Freshwater fisheries, Aquatic biology, Aquaculture, Environmental Chemistry, Ecological,Geological and Hydrological studies, as well as Chemical and Physical Oceanography. Theinstitution conducts research on organo-chlorine pesticides in the estuaries and marine environment.It is in possession of GC-ECD equipment for analysis of POPs.5)
94
e) Kenya Industrial Research and Development Institute (KIRDI)Kenya Industrial Research and Development Institute (KIRDI) is a national research instituteestablished in 1979 under the Ministry of Trade and Industry and mandated to undertakemultidisciplinary research and development in industrial and allied technologies. The Research andTechnological Innovation (RTI) department handles the institute’s core objectives. The major RTIdivisions are: Engineering, Energy and Environment, ICT, Leather & Textiles, and FoodTechnology Divisions. ItsResearch, Technology and Innovation (RTI) Department of KIRDI is incharge of undertaking multidisciplinary research and development in industrial and alliedtechnologies. Research forms the core business of the Institute and contributes significantly todevelopment in all industrial and allied technologies through innovation, adoption, adaptation andtransfer of technologies to support the industrial development process. The Institute's ResearchScientists are the key players in research technology and innovation of industrial knowledge andtechnologies in areas such as: Engineering, Materials Science/Ceramics, Energy, Leather, Textile,Food Science & Technology, Microbiology, Information Science / Technology, ComputerEngineering, Socio-Science / Economics and Environmental Sciences. The vision of the departmentis to be a centre of excellence in applied research, technology and innovation. Our mission is to:apply science, technology and innovation that advance industrial research and development towardsrealization of vision 2030. It could make inroads on BATs and BEPs.
f)Environment ManagementThe Environment Management Division is one of the research, technology and innovation (RTI)departments in KIRDI. The division undertakes environmental research and development andconsultancy work for industry, community organizations, research institutions, and governmentagencies, among others in line with country’s Vision 2030. Technologies and innovationsdeveloped by the division are transferred through business incubation, development of pilot plants,and provision of common manufacturing facilities.
g)International Centre for Insect Physiology and Ecology (ICIPE)ICIPE was established in 1970, to develop and transfer technology on alternatives to chemicals. Ithas trained 600 PhDs & 700 Msc. students in 29 African countries. It conducts research on eco-friendly methods for controlling disease vectors and crop pests, and for preservation and use ofbeneficial insects. Most of the work related to POPs has been on development of alternatives toPOPs for human disease vector control, especially developing alternatives for DDT for malariacontrol. It was nominated in 2010 and endorsed 2011 as a Regional Centre for the StockholmConvention. Currently there are 15 regional centres globally, and an additional centre has beenproposed in Jakarta, Indonesia. At the moment there are four regional centers in Africa. These are:the SC regional Centre in Algiers-Algeria, ICIPE in Nairobi-Kenya; the Centre in Dakar-Senegal,and the regional Centre in Pretoria-South Africa.
The regional Centre has had various activities which include:Regional workshops: Workshops in 8 African countries on IVM as alternative to DDT.Training activities which include:
a) Training of communities.b) Application of mosquito nets.c) Training of children in the use of IVM.d) Habitat management.
95
e) Eco-friendly bio-pesticides for controlling mosquitoes BTI.f) Malaria prevalence reduction.g) Control of cereal stem-borer pests and Striga weed.h) Bio-pesticides.i) Fruit-fly control using fungus.j) Diamondback moth biological control-on cabbages, 75% reduction.k) Odour-baited traps for control of tsetse flies –developed eco-friendly traps that attract tsetse
flies based on shape, colour and smell.l) Repellant collars for control of tsetse flies using repellants compounds identified from wild
animals like water buck.m) Entomopathogenic fungi for control of ticks.
Chemical alternatives to POPs are being addressed in collaboration with the followingorganizations: Ministry of health, Ministry of agriculture, Ministry of Environment, KenyaAgricultural Research Institute, Universities, Research organizations; CIAT-international, theprivate sector such as Real IPM, and institutions promoting organic farming.The following were identified as priorities with regard to updating the NIP:
a) Need to outline the technical assistance received from UNEP Secretariat and Assistancefrom GEF.
b) Outline the trainings held and workshops- this can be provided as link to the web resourcesor a reference to the published documents.
c) Strategic plan for the Centre.d) Collaboration activities with the POPs Focal Point.e) Policy Commitment agreed at the Board to accept it as regional Centre.f) Project concepts.g) Collaboration with KEMRI, KARI etc.h) Activities on alternative of POPs other than DDTs.
The following were identified as additional activities that the ICIPE Regional Centre could getinvolved in:
a) Partnering with other organizations and Ministry of Health e.g. UNEP and WHO seeking tohelp the country to work with IVM-
b) Collaboration with PCPB to promote the use of bio-pesticidesc) Developing joint projects to in the area of alternatives especially in the Eastern Africa
Region.d) Interrogating COP decisions e.g. COP 6, and developing projects for resource mobilization
to address the proposed activities- technical assistance,e) Seek financial resources from TRUST funds-as part of resource mobilization.f) Set up a unit for MEAs at ICIPE to facilitate continuity and sustainability of activities.
The Department of Behavioural and Chemical ecology conducts on the development ofenvironmentally-sound methods to reduce/suppress target pest populations, and to increasepopulations of beneficial insects including natural enemies of these pests. Research is also carriedout to conserve beneficial insects such as honeybees. Central to the department’s activities areidentification, formulation and evaluation of pheromones, kairomones, allomones and hormonesmediating insect/arthropod behaviour. The department is well equipped with various analyticalchemistry instruments including volatile collection systems (VCS), gas chromatographs (GCs),

96
coupled gas chromatography-electroantennographic detection (GC-EAD) system, GC-massspectrometer (GC-MS), and a liquid chromatograph-mass spectrometer (LC-MS) to carry out itsresearch objectives. The department is also equipped with various instruments to study insectbehaviour. Capacity building is an integral part of research activities in the department.
h) Non Governmental OrganisationSeveral non-governmental bodies and entities are involved in activities that can supportmanagement of POPs and chemicals in general.
i) Kenya Association of Manufacturers
KAM has environmental subcommittee which is in charge of reviewing regulations regardingindustry on environment, the committee also participates in the formulation of environmentalregulations.KAM conduct seminars to enlighten members on new and upcoming regulations these forums helpmembers understand better and give views on the regulation to enhance their levels of compliance.However, different companies have different programmes / activities on chemical managementhowever through capacity building; the Association may be instrumental in conducting programs soas to improve chemical management amongst industries.
j) iLima KenyaiLima is a non-governmental organization established in the year 2004 and specializing inpromoting a toxics-free future and sustainable development approaches. ‘iLima’ is a word of SouthAfrican origin meaning ‘collective action’. Since inception, iLima programmes and projects hasbeen focusing on awareness creation, capacity building of communities and civil societies onchemical safety. The following are some of the programmes and projects.
a) Programme on Persistent Organic Pollutants (POPs)POPs are a class of highly hazardous chemical pollutants that persist in the environment for manyyears and bio-accumulate in the food chain. Some POPs are pesticides, industrial chemicals andsome are produced unintentionally as by-products during certain combustion and chemical industryprocesses.iLima carries out projects within key component areas of the NIP to achieve implementation of theconvention in the country. The main aim of these projects is to:
Raise awareness on the Stockholm Convention and possible sources of POPs and theireffects on Health and Environment.
Carry out education and capacity building on the convention and application of the BATsand BEPs such as Zero waste program as an alternative to practices that produces POPs.
Carry out studies and inventories on sources and amount of POPs released into theenvironment.
Establish national and regional NGO coordination and capacity in all regions of the worldin support of longer-term efforts to achieve chemical safety.
Promotepublic participation in the implementation of the convention throughorganizingskill-share on how NGOs and relevant stakeholders from across the country canutilize and reference the Stockholm Convention in their work.
Demonstrateapplicable Best Available Technologies and Environmental Practices tominimize production of POPs.

97
Table 33: Summary table showing analytical research capacities for institutions
No. Region Identified institutions Existing research and capacities1 Western Kenya MasindeMuliro University
of Science and TechnologyGC-ECD, GC-MS
2 Nyanza Maseno University GC-ECD, HPLC3 Rift Valley Egerton University
Moi UniversityGC-ECDGC-ECD, HPLC, GC-MS
4 Nairobi Nairobi UniversityICIPEKIRDI
GC-ECD, HPLC, GC-MSGC-MS, LC-MS, HPLCGC-ECD, HPLC
5 Central JKUATKenyatta University
GC-MSHPLC, LC-MS
6 Coast KEMFRI GC-ECD
7.3 System for the Assessment and listing of new chemicals
7.3.1National Environment Management Authority (NEMA)The National Environment Management Authority (NEMA), is established under the EnvironmentalManagement and Co-ordination Act No. 8 of 1999 (EMCA) as the principal instrument of Governmentfor the implementation of all policies relating to environment. The supreme objective underlying theenactment of EMCA 1999 was to bring harmony in the management of the country’senvironment.NEMA has developed several regulations addressing environment. These include noise,wetland, water quality, waste management, biodiversity and coastal zone regulations.
7.3.2 Pest Control Products Board (PCPB)The Pest Control Products Board is a Statutory organization of Kenya Government established under anAct of parliament, the PCPA, Cap 346, Laws of Kenya of 1982 to regulate the importation andexportation, manufacture, distribution and use of pest control products. The law requires that new pestcontrol products are tested for efficacy before they are registered for use in Kenya. Other studies thatare required to be conducted overseas or locally in accordance with the principles of Good LaboratoryPractice (GLP) include physical chemical properties, toxicology, ecotoxicology and residues studies.PCPB has accredited several institutions to carry out Efficacy, Toxicological, Physical and ChemicalStudies of Pest Control Products.
The service provides information on the various types of pesticides that can be administered on therespective pest. The board also offers training to formulators, applicators, distributors and pesticideusers. The Board is responsible for licensing and banning or restricting pesticides used in the country.

98
CHAPTER 8: FINANCIAL AND TECHNICALRESOURCE REQUIREMENTS
While environmental conservation has been viewed primarily as a Government affair, it has been realized thatinputs from the stakeholders are vital to the successful management of the environment and naturalresources. It is important that capacity building and training of these stakeholders be done in order to enablethem take up the roles previously performed by the Government. Further, the private sector will beengaged through collaborations and partnerships to invest and develop value addition industries for naturalresources in the rural areas. This would greatly improve their marketability and returns.
8.1FinancingEnvironmentalActivities
As the MEWNR implements the strategic plan, it recognizes the critical role that the communities and theCBOs play in joint natural resource management. The Ministry will intensify public awareness andsensitization on the projects and services it is providing in the country. The ministry will develop strongerenvironmental indicators with real assessment, to show contribution of environmental resource base tooverall GDP.The funding Sources to be utilized for NIP will include;
• National public budgets;• Bilateral development assistance agencies;• Multilateral dev. assistance agencies including specific environment funds;• Basel Convention Technical Coop. Trust Fund;• Funds, foundations, NGOs, charities;• Corporate sector participation
8.2 The Conventions Financial Mechanism
Paragraph 6 of Article 13 of the Stockholm Convention on POPs establishes a financial mechanism for theprovision of adequate and sustainable financial resources to developing countries Parties on a grant orconcessional basis to assist in their implementation of the Convention. The mechanism functions under theauthority, as appropriate, and guidance of, and be accountable to the CoP for the purposes of theConvention. (e).The modalities for the provision to interested Parties of assistance with needs assessment,information on available sources of funds and on funding patterns in order to facilitate coordination amongthem is available on www.gef.org.
The guidance to the financial mechanism adopted by the CoP at its first meeting and set out in the annex todecision SC-1/9 states in relation to the determination of funding:
8.3 Kenya’seligibility to GEF funding
The GEF is the convention’s financing mechanism. Its criteria are discussed below;
i. Country eligibility: Kenya is eligible to receive funding from the financial mechanism as it is adeveloping country; and A Party to the Convention.
ii. TheEligible activities: Activities that are eligible for funding from the financial mechanism arethose that seek to meet the objectives of the Convention, by assisting Kenya to fulfil its obligationsunder the Convention, in accordance with guidance provided by the CoP.

99
This NIP will seek to mobilize adequate and sustainable financial resources on a grant or concessional basisto be allocated to meet the agreed full incremental costs of implementing measures that:
a) Meet the eligibility criteria listed in paragraph 1 above, are country-driven and are endorsed KenyaGEF Focal Point
b) Assist Kenya in meeting its obligations under the Stockholm Convention and are in conformity with,and supportive of, the priorities identified in the Kenya national implementation plan;
c) Are in conformity with the programme priorities as reflected in the BAT and BEP guidanced) Build capacity and promote the utilization of local and regional expertise available at County offices;e) Promote sustainable national socio-economic development, poverty reduction and activities consistent
with existing national sound environmental management programmes geared towards the protection ofhuman health and the environment.
8.4 Programme priorities
In accordance with paragraph 7 (d) of Article 13, the CoP will provide on a regular basis to the entity orentities entrusted with the operation of the financial mechanism pursuant to paragraph 6 of Article 13 of theStockholm Convention on POPs, assessments of the funding needed to ensure effective implementation ofthe Convention.
The Global Environment Facility (GEF) is an international financial organisation that operates incollaboration and partnership with the three implementing agencies UNDP, UNEPand the World Bank forthe purpose of achieving global environmental benefits. The GEF is administratively supported by, butfunctionally independent of, the World Bank. The GEF provides grant and concessional funding forprojects and programmes within six areas: biodiversity, climate change, international waters, ozonedepletion, land degradation, and POPs (POPs). The GEF is also the designated financial mechanism forinternational agreements on biodiversity, climate change, and POPs.
NIP will promote the development by Kenya institutions projects that
Minimize emission of dioxins and furans
i. Develop and implement activities identified in the NIP as national or regional priority activitiesthat support or promote capacity-building, including human resource development and
institutional development and/or strengthening for institutions in the implementation matrix andcapacity improvement for designing, developing and enforcing action plans, strategy, andpolicies;
ii. Activities that promote and provide access to technical assistance through appropriatearrangements;
iii. Activities that promote transfer of technology adapted to local conditions, including best availabletechniques and best environmental practices;
iv. Activities that promote education, training and awareness-raising of stakeholders and the generalpublic;
v. Technology demonstration projects that are responsive to priorities identified in the nationalimplementation plans of eligible Parties and take fully into account the relevant guidance of theCoP;
vi. Activities that enhance information exchange and management;vii. Development and promotion of non-chemical alternatives to POPs.

100
CHAPTER 9:OBJECTIVES AND STATEGIES
9.1 Formation of a NIP Coordinating Committee
A National SAICM Steering Committee will be formed and will consist of representatives fromGovernment - Permanent Secretaries (or their representatives) from the Ministries of Environment andMineral Resources, Planning, National Development and Vision 2030, Finance, Ministry of Agriculture(Pest Control Products Board), Industrialization, Trade Environment water and Irrigation.
The committee will have powers to co-opt additional members if necessary. The committee will meet atleast twice yearly. Extraordinary meetings may be convened as needed. The Plan will be managed by aProgram ManagementUnit(PMU) if a funded project is made or a section within DMEAS which will beheaded by a full time National Program Coordinator (paid through the program) or officer who will bereport to the Director MEAS. Among other responsibilities, the National Program Coordinator willpromote the Program among other Government institutions, Non-GOK institutions and donor agencies.This will require development of a capacity building project to be founded by GEF and GoK.
9.2 Responsibilities
The Directorate of Environment and NEMA will provide logistical and administrative support for programactivities such as meetings. The GoK and the donor(s) will ensure that sufficient time and resources areallocated to the National Program Coordinator to carry out functions effectively.
For effectiveness, development of this strategy will aim at strengthening efficient utilization of currentcapacities while addressing the deficiencies identified in the N

101
Use existing POPs and waste institutional structure (ODS Committee, NIP Committee, etc fromgovernment and KAM, AAK to carry out activities in the plan)
Implementing national joint plans of action with ministries and other organizations andinstitutions working in Kenya on POPs and waste management agenda, as well as the synergybetween initiatives and/or Convections activities
This activity will be lead by the MEWNR
9.3.2 Objective 2. Promoting Technology Transfer, Cleaner Production, industry and civilsociety participation in POPs managementThrough industry associations and their representatives in the NIP Implementation Committee,industry and private sector will undertake the following activities:
i. In the implementation period mobilize private sector contributions through businessassociations such as the petroleum, agriculture and manufacturing at the East African regionallevel, as appropriate through the Common Market for Southern and Eastern Africa
ii. Formulate programmes for upgrading technologies for small scale enterprises for continuousminimization of releases of highly toxic POPs for partnership in the POPs lifecycle
iii. Through industry associations and through command and control mechanisms, introduce cleanerproduction and green technology into the informal sector and services for ferrous/nonferrousscrap reuse, waste management by 2015
iv. Hold training activities workshops and demonstration projects on BATs /BEPs guidelines toimplement and assess what is practical emphasising on recycling, reclamation and re-use ofwastes
v. Cooperate with public and the informal sector in the management of identified obsoletepesticide, industrial product stockpile and their disposal of hazardous substances as products oras wastes
vi. Continuous training and certification of custom officers at ports of entry.
9.3.3 Objective 3. Enhancing Laboratory services, research for monitoring of POPs pollutantsand assessment of alternatives to toxic POPs
This activity will promote monitoring and will;i. Acquire, generate, store and disseminate information and see operationalisation of POPs
database by 2012
ii. Build information technology infrastructure capacity to use CD ROMs as POPs literaturelibraries, and at the Provincial and district levels by 2012
iii. Provide audio visual programs at national level to be distributed to provinces (8) and districts(70) as well as local authorities by 2013;
iv. Develop research and training capacity onPOPs to academia’s and polytechnics throughout theplan period.
v. Run training programmes in local institutions e.g KIRDI, KEMRI, KARI, KEPHIS so thatthey can develop training materials/modules, curricula development etc. specific to their POPsmandate;
vi. Procure laboratory equipment that can analyse all the listed POPs, maintenance and servicingat universities in every province especially for analyzing PCBs, dioxins and furans;
vii. Put in place cost effective analytical methodology to be adopted and adapted to local needsespecially for field and hand held equipment

102
viii. Organizing training of trainers workshops
9.3.4 Objective.4. Establishing effective financing mechanisms through inclusion of POPsprogramme in Medium Term Expenditure Framework process.This activity will seek to mobilise domestic sources of finances by ensuring that the regularbudget archives the target of Kshs3.5billion estimates plan through activities that will:
i. Ensure POPs and hazardous regulatory agencies for understand the country’s internal decision-making processes for international environmental governance on POPs by holding at least oneworkshop of 30 people every year
ii. Each NIP stakeholders studying technical assistance guidelines under various MEAs andaggressively developing project concepts on them for the intergovernmental institutionsdedicated to SC implementation.
iii. Develop capacities on project formulation to enable access to international funds so as todevelop at least two POPs projects annually
iv. Hold at least two training workshops every year and putting finances aside for co financing
v. Develop systems for socio-economic considerations such as social indicators that will promotean understanding and enhance systems for liability and compensation.
This activity will initially be triggered by MEWNR and other will get the cue.
9.3.5 Objective 5.Promote safer POPs alternatives as suggested by the NationalImplementation Plan,.All stakeholders each by their own relevance, capacity, mandate and preparedness will undertakethe following activities:
i. Develop programmes to deal with relevant part of SC.ii. Enforcement activities of regulations on POPs, handling, development of regulations on
transportation of POPs and development of new ones on toxic POPs,iii. Strengthen enforcement of OSHA by holding more training programmes and worker
protection clothingiv. Promote non-chemical alternatives to POPs especially at farm level (pyrethrum growing),
use of compostv. Develop programmes that promote safe alternative to POPs and ecologically sustainable
agricultural practices, non-chemical use and especially good agricultural practices;
9.3.6. Objective 6. Address governance and advocacy issuesUnder the review the following will be undertaken:
i. Review of existing legislation to make them more comprehensive for NIP.
ii. Promote voluntary initiatives in the private sector by increasing more ISO 14000EMSCertification or GREENDOT that adopt the principles of the SC.
iii. Throughout the Plan Period, build capacities of civil society on chemical issues andmobilize a critical mass of NGOs and industries to participate in the NIP process and seekadequate financial resources.
9.3.8. Objective7. Capacity Building and Technical CooperationThis objective will address capacity building and technical cooperation needs. The following willbe undertaken:
i. Hold awareness raising workshops
103
ii. Train identified and recruit more inspectors and prosecutors who will be trained using theBasel Convention Judicial Manual
iii. Initiate collaborative mechanism to address technology information sharing and researchamong all stakeholders activities so as to tap technical assistance programmes of theIntergovernmental Organisations on Management of POPs
9.3.9 Objective 8. Technical and Financial Resource MobilisationThe use of economic instruments has been identified as a possible strategy in the mobilization ofresources for the implementation of the NIP. It is envisaged that the application of suchinstruments, collaboration with private sector associations, will go a long way towards achievingenvironmental conservation targets.
i. Review the ongoing POPs management programmes and projects, management optionsand related financial requirements against possible financing sources and budgetingprocesses with a view to give a coherent guidance to project formulation, co financing,partnership and leverage
ii. Explore national budgeting possibilities with the parastatals concerned through the MTEFprocess mainstreaming POPs and waste issues into ongoing and future bilateral activitiesstating with 2014/2015 printed budget ,
iii. Use of ministries and other agencies responsible for coordination of assistance frominternational funding agencies and bilateral donors to each develop a funding request,
iv. Maintain contact with the relevant financing agencies to explore the potential forcooperation
v. Include POPs management initiatives into relevant Kenyan bilateral developmentprogrammes activities and initiatives.
9.3.10 Objective9. Resource Mobilisations at Local and enterprise levelsThis activity will help local authorities and enterprises fill the financing gaps while addressingrisks posed by POPs. Although many of them are going on, they need to be accelerated by thefollowing actions:
i. Put current provisions of EMCA incentives (e.g the plastics initiative) into practice
ii. Address issues of cost-effectiveness of products of processes and alternatives throughintroduction of environmental economic instruments as has been done with plastic waste;
iii. Mobilizing private sector contributions in awareness, publicity and POPs database activities
iv. Mobilizing international funds through project concepts;
v. Ensuring the inclusion of national POPs management into bilateral and multilateraldevelopment programmes.
9.3.11 Objective 10. Develop, finance and implement Partnership ProjectsCapacity to implementNIP will be strengthened through partnerships directly and indirectly
with stakeholders. The activities to be carried out are.
i. Establishment of local, national and regional cooperation and technical assistance networks, withthe NIP, Climate Change, Rotterdam, Basel and Stockholm Conventions \secretariats
ii. Promoting the sound POPs management through the Global Environment Facility in partnershipwith UNEP,WHO, UNDP, FAO, UNIDO supported by UNITAR through the development of acapacity building project to address priority areas addressed in this plan and which are within thePOPs structure financed by the GEF;
iii. Mobilizing specialized and bilateral agencies and other intergovernmental organization funds and

104
programmes to support the plan.
This activity will be coordinated by SIC institutions led by the NIP Coordination Office.

105
CHAPTER10: ACTION PLANS
10.1 Policy Statement
This NIP outlines the Kenya Government’s commitment to addressing the POPs issue, for effective andefficient implementation as well as ensuring that all POPs matters and issues/concerns (legal, policy andinstitutional capacity especially) are addressed and integrated into the development process.
The NIP will as much as possible be mainstreamed into National and County Environmental Action Plans,strategic plans , the Medium Term Expenditure Framework and the National Development Plans startingat institutional and sector level
The Implementation matrix formulated will ensure definite and specific action is taken by all involvedtaking into consideration activities to respective institutions and stakeholders, time and detail attendantcosts.
10.2. Activities,stratégies, and action plans for intentionallyproducedPOPsAction planning leads to better decisions fosters acceptance of decisions and promotes accountability andcredibility in the Stockholm Convention. In this regard, Articles 7 (Implementation plans) and 10 (Publicinformation, awareness and education) explicitly call for stakeholder involvement in implementing theConvention. The preparation of Action Plans thus necessitated identifying and involving stakeholders.
Within the government these stakeholders included such Ministries as the ones responsible for Agriculture,Finance, Foreign Affairs, Health, Industry, Justice or Legal Affairs,Labour, Planning, Science andTechnology, Trade and Transport.
Other stakeholder categories for consideration included industry association & industrial Enterprise(KAMand AAK}, Retailers/ distributors(pesticide ), Public interest groups, Public health professionals, Women’sorganizations, Communities, Agricultural sector professionals and individual Citizens.
10.2.1 Activity: Production, import and export, use, stockpiles, and wastes of Annex A POPspesticides.
The following are actions to address intentionally produced pesticides;i. Ensure no production, import and export and use of Annex A pesticides
ii. Use or dispose all stockpilesiii. Dispose all pesticide wastesiv. Carry out more comprehensive inventory to address any more stockpiles and wastes.
10.2.2 Activity 2: Production, import and export, use, identification, labeling, removal, storage,and disposal of PCBs and equipment containing PCBs.
The following are actions to address PCBs;i. No production, import and export of PCBs,
ii. Identify and label all transformers with PCBs,iii. Where possible dispose all PCB containing transformers.iv. Identify contaminated sites
10.2.3. Activity 3: Production, import and export, use, stockpiles, and wastes of DDT
i. Ensure no production, import and export of DDT through legislation.
106
ii. Dispose all 100 tones stockpiles and waste of DDT.
iii. Promote search for alternatives
10.2.4 Activity4: Production, import and export, use, stockpiles, and wastes of Industrial POPs
Fine-tune policy issues that address, (i) controlling and the use (ii) eventual release to the environment,of the newly listed industrial POPs.
i. Restrictions on Mitumba (second hand clothes) that contain or is coated with PFOS andrelated substances.
ii. Prohibits the importation of electronic products and vehicles that are at or almost at their endof life.
iii. Projects such as computer for schools must be regulated. This should include storage,disposal and recycling of these products parts.
iv. An inventory that captures also the already existing sources of industrial POPs release inKenya needs to be done. This is mainly to capture informal sectors like cottage industries.
v. Research on industrial POPs especially per fluorinated compounds need to be supported andto start immediately.
vi. Monitoring be made mandatory in order to understand the sources, trends and success inregulating the industrial POPs
10.2.5 Activity5: Measures to reduce releases from unintentional production (Article 5)The following measures will be taken in order to reduce or eliminate releases of U-POPs;
i. Review of laws and policies covering activities the lead to generation of U-POPs and wherenecessary, introduce new ones,
ii. Education, training and awareness-raising of the risks of U-POPs and their managementincorporated in education curriculum;
iii. Development of strategies for periodic review and updating of the inventory for each sourcecategory,
iv. Enforcement of legislation/ by laws and practices of handling waste,v. Keeping and maintaining records of waste generated, treatment and disposal methodologies at
each sitevi. Ensuring health and safety for workers in potentially high emission facilities
vii. Installation of air pollution control equipment in line with EMCA for householdviii. Promoting and enforcing of standards and guidelines for thermal equipment such as
incinerators, boilers, quality, crematoria etc.ix. Provide guidelines on feed materials especially fuels containing chlorine.x. Ensure local authorities to restrict and regulate open burning
xi. Enforce regulations that ensure that hazardous waste is handles in the proper manner and byqualified personnel.
xii. Upgrading of ferrous and nonferrous metal production that are using low state technologies.
107
10.2.6. Activity6: Measures to reduce releases from stockpiles and wastes (Article 6)a) Start operational sing the ewaste guidelines.b) Creating public awareness on electronic waste and the hazards posed by unsafe disposal.c) Government to re-commit sound management and sustainable use of chemicals with the objective
of reducing exposure to the harmful effects of chemicals in electronic equipment through theprevention and reduction of anthropogenic releases in the environment.
d) The government should work towards strengthening the national and regional programmes onsound management of chemicals and hazardous wastes in electronics.
e) The government should adopt stringent regulations on the goods being imported in terms of settinga time frame for the phasing of toxic chemicals e.g. brominated flame retardants in electronicequipment.
10.2.7Activity 7: Manage stockpiles and appropriate measures for handling and disposal ofarticles in use
In addition, those dealing with waste consisting of, containing or contaminated with POPs will besubject to the other waste controls, as appropriate, such as duty of care and controls for hazardouswaste. The concentration limits in the POPs regulation are listed in the Table below:
POPs concentration Limits in waste
Low POPs concentration limits
Substance Concentration LimitDioxins/Furans 15g/kgPCBs 50mg/kgOther POPs50mg/kg
10.2.8 Activity8: Identification of contaminated sites and remediationA study will be undertaken to assess levels of emissions of polybrominated diphenyl ethers andPFOS from consumer products. Depending on the results of this work consideration will be givento potential methods for controlling emissions.
10.2.9Activity 9: Facilitating or undertaking information exchange and stakeholder involvementi. The Ministry website www.environment.go.keand NEMA website www.NEMA.go.ke contains a wide range
of information on what the Government is doing to protect the environment in a range of areas such aschemicals, air quality, soil and contamination and water quality. It includes news on national, and internationalchemicals policy, Government position statements, advisory committee papers and reports, and developmentsin research.
ii. NEMA’s state of Environment Report is an annual record of pollution in Kenya. One of its mainobjectives is to provide the public with easily accessible information about pollution from industrialand other sources in their local area and nationally. It records pollution that is released into air,discharged into rivers or the sewerage network, or is transferred off site as waste. It will ensure thatevery year contains the report for that year.
iii. Multi-media source inventories will be established to provide a more comprehensive assessment ofdioxin, PCB and HCB emissions to air, water and land. Kenya Government will to reduce thefrequency of monitoring for these pollutants.
iv. The Mount Kenya, baseline station will be included in the monitoring network.

108
v. Making information about the environment publicly available is essential in achieving sustainabledevelopment. By providing access to environmental information the public is able to take decisionsin the full knowledge of the likely environmental implications and to participate more effectively indecision-making processes that affect the environment. Openness also promotes transparentdecision-making and greater public accountability of how authorities undertake their duties andresponsibilities in Kenya.
10.2.10Activity10: Public awareness, information and education (Article 10)Lack of awareness indicated in the County Regional Offices will be addresses as below:
i. NEMA will continue to secure reductions in emissions from processes and activities regulated bylocal Authorities through EIAs and E.A.
ii. Kenya Government and devolved administrations will also work with the Local Authorities to exploreopportunities to build on existing efforts to improve public awareness of the current regulatory regimeon open burning of domestic waste to reduce emissions of UPOPs.
iii. Kenya shall within its capabilities promote and facilitate inter alia 'training of workers, scientists andeducators, policy and decision makers'.
iv. In Kenya it is standard practice when developing decision making on environmental policy to consultstakeholders and make information publicly available through a range of media including publications ofconsultation documents, research reports and the internet. This will be enhanced for POPs.
10.2.11 Activity 11: Effectiveness evaluation (Article 16)Through the current institutions and convention secretariat, Kenya will;
i. To determine the effectiveness of national actions on POPs management, Kenya will continue toassess the POPs levels in the environment to uncertain whether the action taken are effective inreducing releases of POPs into the environment.
ii. As a Party to the Convention and as called for under Article 16, Kenya will cooperate with theCoP and the Secretariat in evaluating the effectiveness of the Convention, including assisting withthe development of comparable monitoring data and implementation of any ensuingarrangements, in accordance with its technical and financial capabilities.
10.2.12 Activity 12: Research, development and monitoring (Article 11)Article 11 requires that Parties facilitate and encourage research, development and monitoring of POPson their sources, releases, transport levels and trends and effects in humans and environment andsupport international obligations aimed at research, data collection and monitoring. Kenya will;
i. Continue to support a substantial amount of scientific research to underpin policy development onPOPs. Government funded monitoring is commissioned and carried out by a range of organizations fora variety of purposes. These include compliance monitoring for the Global Monitoring of POPS GMP.
ii. A number of other Government Departments and agencies, including Department of Public Health(e.g. Environmental Health, Air Pollution), NEMA, KEMRI, have significant research portfolios onchemicals including POPs and information on will be further strengthened to utilize informationgathered on POPs alternatives.
iii. NEMA has supported air monitoring for various pollutants over the years including POPs.This will be accelerated.
iv. Environmental monitoring and modeling of air pollution will be reinforced to provide reliable

109
information on air quality and to satisfy statutory requirements for Lake Naivasha, Victoria, Nakuruand for contaminated sites.
10.2.13 Activity 13: Technical and financial assistance (Articles 12 and 13)
Kenya will continue to participate in international assessments of POPs and plays an active role to inputinto the work of technical committees under both the Stockholm Convention
i. Article 12 requires Parties to recognize that rendering timely and appropriate technical assistance inresponse to requests from developing country Parties and Parties with economies in transition isessential to the successful implementation of the Convention.
ii. Much of Kenya’s regional and bilateral development assistance is focused on helping developingcountries to mainstream sound management of chemicals including POPs in poverty reductionstrategies and development assistance. The principal routes for providing assistance to developingcountries and countries with economies in transition.
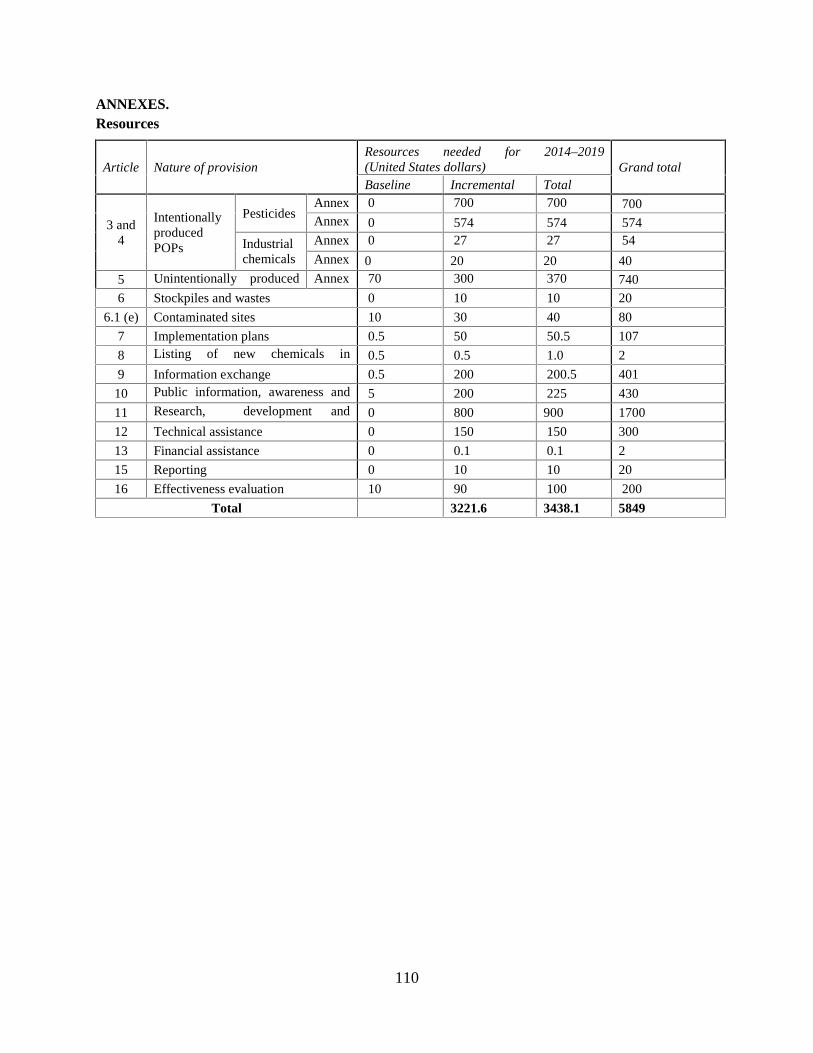
110
ANNEXES.Resources
Article Nature of provisionResources needed for 2014–2019(United States dollars) Grand totalBaseline Incremental Total
3 and4
IntentionallyproducedPOPs
PesticidesAnnexA
0 700 700 700AnnexB
0 574 574 574
Industrialchemicals
AnnexA
0 27 27 54
AnnexB
0 20 20 40
5 Unintentionally producedPOPs
AnnexC
70 300 370 740
6 Stockpiles and wastes 0 10 10 20
6.1 (e) Contaminated sites 10 30 40 80
7 Implementation plans 0.5 50 50.5 107
8 Listing of new chemicals inAnnexes A, B and C
0.5 0.5 1.0 2
9 Information exchange 0.5 200 200.5 401
10 Public information, awareness andeducation
5 200 225 430
11 Research, development andmonitoring
0 800 900 1700
12 Technical assistance 0 150 150 300
13 Financial assistance 0 0.1 0.1 2
15 Reporting 0 10 10 20
16 Effectiveness evaluation 10 90 100 200
Total 3221.6 3438.1 5849

111
REPUBLIC OF KENYA
MINISTRY OF ENVIRONMENT, WATER AND NATURAL RESOURCES
REPORT OF THE ENDORSEMENT WORKSHOPKENYA NATIONAL IMPLEMENTATION PLAN FOR THESTOCKHOLM CONVENTION ON PERSISTENT ORGANIC
POLLUTANTS
May 2014

112
1.0 Background
After the drafting of the updated National Implementaion Plan 2014, a stekeholdeers endorsementworkshop was organised for 24th May, 2013 at Utalii Hotel in airobi. It was attended by representaiives ofgovernment instiotutions, the private sector, intergovernmental organisations. the complete list of theattendees is annex 1.
The objectives of the workshop were:
To communicate clearly the scope, need for, purpose, and value of the NIP.
To consult with stakeholders on the proposed NIP, as appropriate.
To finalize the NIP, taking account of stakeholder input.
To secure political support and endorsement by the relevant authorities for the NIP and itsimplementation.
To transmit an agreed NIP to the COP of the Convention within two years of entry into force of theConvention for the Party, or when the review and updating of a NIP has been undertaken in order tocomply with changes in the obligations under the Convention occasioned by amendments to theConvention or its annexes, transmit an agreed revised and updated NIP to the COP within two years ofthe entry into force for that Party of the amendment.
To establish and put into practice a mechanism for periodic updating and review of the NIP inaccordance with Article 7 of the Convention.
To establish a mechanism for reporting to the COP as required.
To put in place the mechanism for implementation of the NIP.
2.0 Opening
The chair Mr. Richard Mwendandu who is the Director of Multilateral Environmental Agreementswelcomed participants to the KNIP endorsement workshop. He informed the participants on theobjectives of the workshop which was mainly for stakeholders to endorse the NIP and agree on theimplementation.
He emphasized the need to up measures that guarantee sustainability of environment throughout the valuechain, noting the need for concerted efforts by all stakeholders in safe and sound management ofchemicals. He highlighted that the importance of the NIP as a tool for management of chemicals.
2.1 NIP Update Process
Mr. Francis Kihumba, Coordinator NIP Project gave a brief on the NIP update process. He applauded theGEF who funded the process and are also willing to support the implementation. He informed thestakeholders that the NIP 2014 is an update of the version of 2007. Since the last NIP, the StockholmConvention has listed other 12 new POPs, thus the need to review the Kenyan NIP to include the newadditional POPs. This would aid Kenya in the control and management strategies of this additional POPsand also address the new emerging issues.
The NIP updating process started with a review of the progress/implementation status of the old NIPConsultants were hired based on expertise to identify the gaps and challenges and give possible way

113
forward. He noted that chemicals are used in all sectors, however the challenge on chemicals in theirmanagement. He noted that the NIP 2007 mainly dwelled on Pesticides and PCBs. Since 2007, there hasbeen great improvement on the introduction and use of NON chemical alternatives on pesticides. Thiswas confirmed the representative of the Pest Control Products Board and ICIPE who were both presentfor the endorsement of the NIP. Kenya Power and Lighting Company also informed the meeting that theyhave since banned use of PCBs in their transformers and informed the stakeholders that a big percentageof the old transformers that used PCBs have since been replaced.
2.2 Statement by UNEP Regional Office for Africa
UNEP ROA representative Dr. Abdouraman Bary thanked the Ministry for having invited him for thisendorsement process. He reiterated UNEP’s commitment in sustainable management the environment.He applauded the NIP 2014 as a good tool for chemicals management in Kenya. He pledged that UNEPwould continue to support the Ministry in spearheading management of chemicals and the environment asa whole.
3.0. Key note address by the Principal Secretary, State Department of Environment and NaturalResources
Engineer Kyengo read the key note address on behalf of the Principal Secretary. (Annex 2).
4.0 Discussion on Nip Implementation Activities
The stakeholders reviewed the implementation matrix and committed them to the specific activities asattached below)
5.0 Way Forward
The Director MEAs commended the stakeholders for their active participation throughout the NIPupdating process and also thanked the consultants for their efforts in completing the task on time despitethe challenges that had engulfed the project at the initial stages due to the restructuring of government andchange in financial systems. He reiterated the ministry commitment in spearheading the process onchemicals management in striving to meet the SAICM goal of sound chemicals management by the year2020.
Endorsed with amendments the matrix on Pesticide POPs, Industrial POPs, and unintentionalPOPs, Monitoring and Public awareness. The legal and policy matrix would be reviewed furtherby legal experts in order to get the actual current position on legislation and policy. The amendedand endorsed matrix tables are Annex 1 below.
Stakeholders emphasized the need to have the NIP and Policy document sent to all stakeholders.
The need to institutionalize the chemicals management through a memorandum of understandingwith all relevant sectors was recommended.
It was emphasized on the need to have periodical meetings to assess the progress onimplementation of the NIP by different sectors.

114
Workshop Outputs
The workshop endorsed the following
i. A pamphlet conveying in summary the contents, intentions, and need for and benefits of theNIP for stakeholders.
ii. Established a consultation system for the implementation process to ensure that stakeholderswithin and outside Government are made aware of the NIP and that feedback is gathered andcollated for assessment.
iii. Review the feedback from the consultation and adapt the NIP as appropriate.
iv. Agreed that a NIP Committee will be formed which will include mechanisms for periodicreview and updating as needed and appropriate in accordance with Article 7 of theConvention.
v. Edit the final NIP and submit it to the Minister for Environment Water and MineralResources for endorsement
vi. Set up a mechanism and structure for implementation of the NIP.
vii. The endorsed NIP will be submitted to the COP as required.

115
Implementation Matrix(s)
Coordination and Programme Management MatrixStrategic objective Activities Performance
indicatorsResponsibilities Budget
(MiKsh)
14 15 16 17 18 19
1 Establish a NIPCoordinationMechanism atNational andCounty levels asappropriate
-Prepare necessarypolicy and legaldocumentation forconsiderationapproval-Recruit staff
- CabinetapprovalBudgetsallocationStaff in position
SDE18,AG
50
2 Build capacity fordeveloping andpromotion ofadditional POPsalternatives
Strengthen trainingof researchers inPOPs alternatives.
POPs researchactivitiesNumber of POPsalternativesdeveloped
Universities19,(UoN taking leadrole), PCPB,KEMRI, ICIPE,KARI, AAK
30
3 Build andstrengthenknowledgemanagement
-Support a centrefor online accesspublications-Develop andoperationalizeinformationnetworks within thepartner institutions
ChemicalsDatabase andinformationnetworkestablished andequippedNetworksoperationalizedPOPs websiteNetworkingarrangement
SDE NEMA,PCPB GCDUniversities,
20
4 Ensure timelyresponse toConventionSecrettBuildcapacity of zonallaboratories ascentres ofexcellence intraining andmonitoring POPs
Facilitate ReportingFacilitate access totechnical assistanceFacilitate access toFinancialMechanism(GEF)
Number andvariety of projectthat cover allPOPsAmount of fundsmobilizedCounterpartfunds
SDE, NEMA,Universities
30
5 A CommunicationStrategy developedand implemented
Selection anddistribution ofconventionmatrrial,information andresources
CommunicationStrategyDevelopedNumber ofinstitutions usingthe strategy
SDE, NEMA 5
6 Monitoring andevaluation of theNIPSubtotal 135
18 State Department of Environment in the MEWNR19Dpt PHPT,Kabete, UoN

116
Pesticides POPSStrategic Objectives Activities Performance indicators Responsibility Budget
Ksh M14 15 16 17 18 19
1 Collection and disposal ofPOPs stockpiles
Dispose current 200 tons POPs stockpiles Disposal of already collectedstockpiles of approx 200 tons by2015.Disposal certificate
NEMA. PCPB , MoA, AAK,KARI, Veterinary
30
2 Public awareness oncurrent situation ofpesticide POPs in thecountry and theiralternatives.
Workshop for all stakeholders and countyreps on POPs pesticide
Mainstreaming pesticide issuesin institutional strategiescompleted
NEMA, PCPB, KARI, AAK,Livestock and FisheriesICIPE,MOH,KRA CustomsStockholm Convention RegionCentre
10
3 To strengthen the nationalcapacity and capability toperform POPS analysis.
Invest and sustain resources both in humanand financial terms – training, acquisitionof equipment, transfer of technology ateach of 5 key institutions etc.Establish partnerships.
Procure High performanceanalytical equipment for POPsand the same be availed inregional centres
MEW&NR, KARI, PCPB,Government Chemist, NEMA,Universities and Private SectorPartnership with donorcountries. All the counties
10020
4 Complying withArticle8
Collaborative studies and analyses amonglaboratories, both at national andinternational levels.Create for a for exchange of research anddata
Routine analysis for POPsPesticides in KARI,Universities, ICIPE
Selected universities, IGO andprivate sectors participating
50
5 Research, developmentimplementation andprogramme
Review continuing activities on research,application promotion and capacity supportto institutions.Ensure sharing of results after every 2-4
years through bulletins, questionnaires andworkshops/seminars /training etc
Research work and findingsdocumented annually workshopsand seminarsBulletins every 2 yearsQuestionnaires
MEW&NR, NationalTreasury, NEMA, ICIPEPrivate sector, UniversitiesKEMRI
150
6 Development andpromotion of alternative toPOPs
Continued research on IVM and BEPPromoting IVM / IPM, BATS programmesin Kenya.
Hold regional training at all countiesICIPE
Complete replacement of allbanned and listed POPs by 2016
Involving all relevantgovernment agenciesSynergy with PIC Convention
KARI
300
7 Enforcement of law andregulation
Border surveillance will be enhanced tominimize illegal imports of banned andrestricted POPs
Regular surveillance of POPspesticide starting 2014
NEMA, MoAMoH, KARI, PCPBKEMRI,ICIPE,Private sector, KEBS, PCPB,Customs,Radiation board Pharmacy andPoisons
200
TOTAL 700
20 1 HPLC/GC Ksh Ksh 10M approximately

117
DDT and its alternatives
Objectives Activities PerformanceIndicators
Responsibility BudgetKshM
14 15 16 17 18 19
13 Update knowledge on extent of use ofDDT alternatives
Identify the alternatives usedespecially in malaria prone areaseffectiveness, social and healthimpacts
List of alternativesdeveloped
ICIPE KEMRI MOH, PCPB PBK, KARI
5
14 Development and promotion ofalternatives to DDT
Identify socially acceptable andefficacious alternatives to DDT andother Pesticide POPsCarry out institutional andstakeholder financing needsassessment
No of alternativessuccessful.No in use
MOH ,, NEMA, WHO, UNEPICIPE/ KEMRI, MOAPCPB
100
15 To strengthen malaria controlperformancemonitoring and evaluation system
Build partnerships between MOH andDDT allianceEnhance capacities at grassrootslevels for sustainable non chemicalalternativesSensitize policy makers on the needfor allocation of financial andtechnical resources for alternatives
No. of activitieswith partners.
Funds mobilizedfrom Globalmalaria
Forums organized
NEMA, MENR, WHOTreasury, KEMRI ,ICIPE, MOH, PBKMOHMalaria Rollback programme
200
16 Capacity building for planning and ,monitoringperformance of chemical/non chemical alternativeEnvironmental monitoring
Development of adequate humanresources,training and career structures atnational and local level to manageIVM programmes, development ofessential physical infrastructure,provision of financial resources tomarket alternatives.
Number of trainedlevel of residuePOPs in differentmedia
MOH,,DOMC KEMRI, ICIPE, NEMA,MEWNRUniversitiesResearch institutionsPrivate Sector
300
17 Strengthen research development andmonitoring illegal imports.
Development of appropriatemonitoring tools s and a clearmonitoring system incorporated intothe program, with budgets allocated.Monitoring on health andenvironmental impacts.
Monitoring
Clear monitoringsystem
Reports of healthimpacts
ICIPE, KEMRI, MOHNEMA UniversitiesResearch institutions-Private SectorKPA and CustomsPCPB
30
18 Information Exchange and creation ofpublic awareness
Update of existing databaseDevelop modalities for inform nationexchange programs.
No of forumsorganized.
No of articlespublishedinternationally
NEMA, MOH, MOA,ICIPEUniversitiesResearch institutions
-Private Sector
50
19 Policy and regulatory framework Harmonize the existing regulationsand legislation
Draft regulations MEWNR,NEMA,MOH,WHO,UNEP,MOA, KEMRI, .PCPB,
7
Subtotal 692

118
Industrial POPs
Objective Activity PerformanceIndicator
Action Cost(Ksh)M)
14 15 16 17 18 19
1 Develop Policyframework formanagement ofindustrial POPs
Develop Policy andimplementation on industrialPOPsDevelop Regulatory standardsfor industrial POPs.Strengthen enforcement ofstandards for industrial POPsRegulation/ban of second handproducts containing bannedindustrial POPs
PolicyKEBs Standards
Gazetted regulationsNumber of compliantindustriesRegulated second handsgoods
NEMA, AG office,KEBS, KAM, MoIED
50
2 To put in placematerial and rawproducts analysis andmonitoring program
Establish quality control andquality assurance laboratorysystems in industries
Number of laboratories andquality assurance systems inindustries
NEMA, KEBS,Universities, KAM
120
3 Minimize industrialPOPs emissions inindustries to meet theBAT & BEP guidelines
Include industrial-POPsemissions as part of industrialannual auditsTrain industry personnel onalternativesEnhance BEP and BAT
Number of industries thathave carried out industrialPOPs analysisNumber of industries usingalternativesNumber of industriesupholding BEP and BAT
NEMA; Ministry ofIndustry, KAM
50
4 To use alternatives toindustrial POPs.
Educate manufacturers onavailable alternativesEncourage importation ofalternatives
Number of industries usingthe alternatives to POPsNumber of importedalternatives for industrialuse
NEMA/Ministry ofcommerce andindustry, KIRDI, KAM
100
5 Eradication of bannedindustrial POPs
To introduce alternatives toindustrial POPsBan importations from non-compliant import countriesEducate users
Number of alternatives inuse increaseNo imports of bannedindustrial POPs allowedNumber of complyingstakeholders
NEMA, KIRDI, 40
6 Educating stakeholderson industrial POPs
Establish data bank for usersRegulate findings andpublicationsNetworking and information
Databank houses andoperationalNumber of publications andICT materialsNumber of institutions and
NEMA, Ministry ofeducation, Ministry ofinformation
30
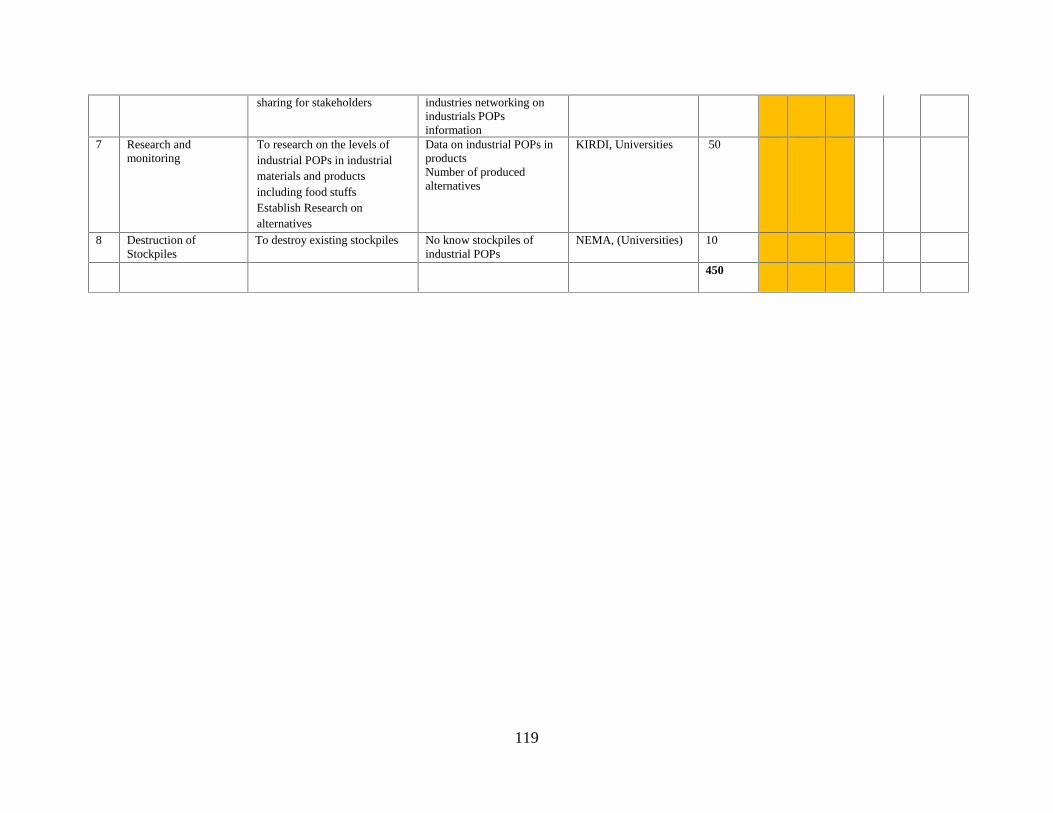
119
sharing for stakeholders industries networking onindustrials POPsinformation
7 Research andmonitoring
To research on the levels ofindustrial POPs in industrialmaterials and productsincluding food stuffsEstablish Research onalternatives
Data on industrial POPs inproductsNumber of producedalternatives
KIRDI, Universities 50
8 Destruction ofStockpiles
To destroy existing stockpiles No know stockpiles ofindustrial POPs
NEMA, (Universities) 10
450

120
UPOPS
Strategic Objectives Activity Performance indicators Responsibility EstimatedCost
14 15 16 17 18 19
1 Increase the efficiency of heatand power Generation systemsfor industry and householdsystems.
1. Create awareness on benefits ofincreased efficacy of heat andpower generation systems.
2. Upscale the introduction ofenergy saving stoves.
3. Promote the use of alternativecleaner energy sources inindustry.
1. Number of industries andinstitutions trained onincreased efficacy of heatand power generationsystems.
2. Number of industriescompliant with reducedemissions.
3. Increased number ofhouseholds with improvedenergy saving stoves.
MoE, MOHCountiesGovernments,NEMA, DOHSS,KCPC
50
2 Minimize releases from wasteincineration
1. Ensure incinerators meetNEMA guidelines.
2. Training on proper managementof incinerators in all sectors.
3. Encourage development oflocally manufacturedincinerators at county levels.
4. Promote uptake of BEP.
Number of incinerators thatmeet NEMA standardsNumber of trainees onincinerator management.Number of locallymanufactured incineratorsthat meet NEMA standards.Number of enterprisesapplying BEPs
NEMA
KIRDI
MoI (at countygovernments)
120
3 Sludge Disposal: Achievegood environmental practicesin the management of sewagesludge
1. Introduce BEPs in themanagement of sludge.
2. Ensure industries installwastewater treatment facilities.
3. Ensure industrial compliance toNEMA effluent standards.
4. Conduct assessment ofcontaminants in sludge.
No of Sewage treatmentplants not burning sludge
Number of wastewatertreatment facilities meetingstandards
No of analyses carried out
KIRDI, SDW r,WRMA, GCD, UON,
50
4 Eliminate open burning ofsolid wastes
1. Introduction of Interrogatedsolid waste managementsystems
2. Awareness raising andeducation on proper wastemanagement methods
3. Enforcement of waste disposalregulations
4. Enforcement of air qualityregulations
ISWM plans put in Place inall counties in solid wastegenerating facilities
Training sessions on ISWM
Air Quality regulations andStandards in place
NEMA, MoH,County Governments
100

121
5 Minimise UPOPs emissions inindustries
1. Include U-POPs emissions aspart of industrial annual audits
2. Train industry personnel onhow to use the UNEP UPOPsToolkit
Number of industries thathave carried out UPOPsanalysis
Number of personnel trainedin application of UPOPsToolkit
NEMA; Universities 50
1. 370

122
Monitoring Research and Public Awareness
Strategic objective Activities Performance indicators Responsibilities Budget 14 15 16 17 18 191 Develop capacity for
POPs research andmonitoring in thecountry
Procure laboratory equipment foranalysis of POPsTrain Technical staff to analysePOPs chemicals inenvironmental and industrialssamples.Develop POPs monitoringprogramme for food stuff, water,air and biota samples
Number of laboratorieswell equipped tomonitor POPs.Number of technicianstrained to analysedPOPs.High qualitymonitoring data onPOPs generated.Number of prioritysites and matricesbeing monitored
KEBS, Government Chemist,Universities, KEMFRI, KARI,PCPB, KRA, LVEMP, KEPHIS
5 years 500
2 Build research capacityfor POPs and POPsalternatives
Training of researchers in POPsalternatives.Conduct research onenvironmentally friendlyalternatives for POPs.Commercialise POPsalternatives in the country.
Number of trainedPOPs experts in thecountry.POPs researchactivities on POPsalternatives.Number of POPsalternatives developed
Universities, KEMRI, ICIPE,KARI, NACOST, KIRD
5 years 300
3 Build capacity forinformation exchangeon POPs
Establish POPs informationexchange and coordinationcenter.Provide infrastructure forinformation exchange.Establish POPs thematic groupsfor information exchange.Conduct POPs awarenessworkshops.
Information exchangestructures in place.POPs thematic groupestablished.Information exchange
activities on POPs.
NEMA, PCPB, KARI, KEMRI,Universities, Civil society,KIRDI, KEPHIS
2 years 200
4 Build capacity for POPsawareness creation
Develop communication strategyfor POPs awareness creationDevelop and disseminate POPsawareness materials.Develop POPs awarenessprogrammes.
Number of awarenesscreation activitiesProgrammes andmaterials developedLevel of POPsunderstanding amongspecial groups
NEMA, PCPB, KARI, KEPHIS,DOSH, KIRDI, NGOs, CivilSociety,
2 years 100
1100
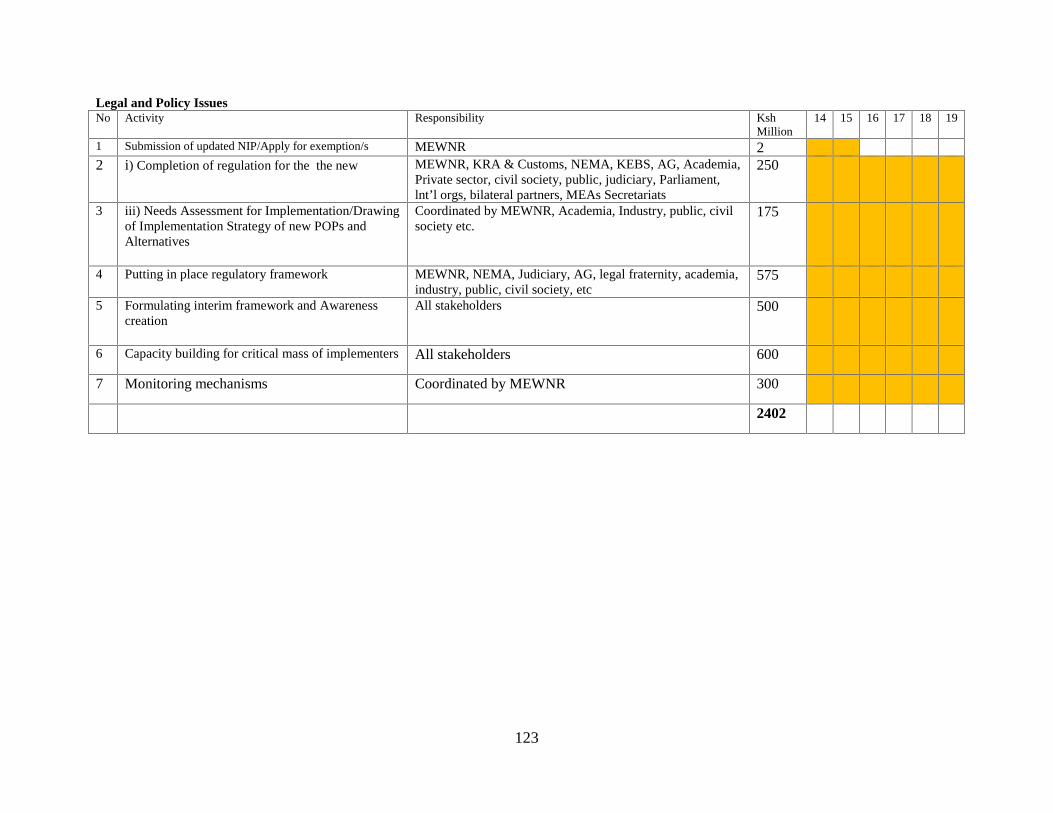
123
Legal and Policy IssuesNo Activity Responsibility Ksh
Million14 15 16 17 18 19
1 Submission of updated NIP/Apply for exemption/s MEWNR 22 i) Completion of regulation for the the new MEWNR, KRA & Customs, NEMA, KEBS, AG, Academia,
Private sector, civil society, public, judiciary, Parliament,lnt’l orgs, bilateral partners, MEAs Secretariats
250
3 iii) Needs Assessment for Implementation/Drawingof Implementation Strategy of new POPs andAlternatives
Coordinated by MEWNR, Academia, Industry, public, civilsociety etc.
175
4 Putting in place regulatory framework MEWNR, NEMA, Judiciary, AG, legal fraternity, academia,industry, public, civil society, etc
575
5 Formulating interim framework and Awarenesscreation
All stakeholders 500
6 Capacity building for critical mass of implementers All stakeholders 600
7 Monitoring mechanisms Coordinated by MEWNR 300
2402

124
MINISTRY OF ENVIRONMENT, WATER AND NATURAL RESOURCESNATIONAL IMPLEMENTATION PLAN FOR UPDATED PERSISTENT ORGANIC
POLLUTANTS ENDORSEMENT
KEYNOTE ADDRESS BY DR. RICHARD LESIYAMPE, PRINCIPAL SECRETARY,STATE DEPARTMENT OF ENVIRONMENT AND NATURAL RESOURCES
UTALII HOTEL, 21ST MAY 2014
Representatives of UNEPRepresentatives of the Government DepartmentsRepresentatives from Private Sector,Ladies and Gentlemen
It is a privilege and great honor to be with you and to welcome you all to this important workshop thatseek to endorse the updated National Implementation Plan for the Stockholm Convention on PersistentOrganic Pollutants (POPs). The updating has been comprehensive and participatory. During theconsultation process a sample of stakeholders in the chemicals sector have given their views on what ispriority in addressing this group of toxic and hazardous chemicals that the whole world has decided to act.
The purpose of this workshop is to set up national priorities for the POPs issues that are important toKenya, come up with objectives for addressing those priority issues, allocate responsibilities and agree onthe timing for those actions. We believe that each one of you have a role to play on this.
Let me on the onset make a few observations about POPs. We all appreciate the role played by chemicalsin development. However, some like the POPs are harmful to health and the environment, thus the worldhas collectively said no to them. This is why the Stockholm Convention on POPs was formulated and isnow ratified by 179 countries reflecting its universal acceptance and deciding that 22 chemicals listedshould be banned, restricted or their emissions minimized or eliminated in the shortest time possible.
In 2007, Kenya endorsed the NIP. That time, pesticides, dioxins and furans were identified as prioritychemicals and consequently, Kenya banned or restricted nearly all the pesticides originally listed.Dioxins and Furans were mainly identified to come from medical waste and open burning. . It is nowcommon to find that every reputable hospital has acceptable segregation, recycling and eventual thermaldisposal though over 80% have not done so. They need to be revitalized to cover not only hospitals butindustry and services also.
I am also happy to note that Kenya has addressed the contribution of POPs form open burning of wastewhich not only emits common air pollutants, it is also a major source of dioxins and furans from theplastics and flame retardants contained in plastics, textiles and electronic waste. . We now have the drafte-Waste guidelines which will be gazette soon to ensure that less waste containing chlorine, bromates andfluorine are burnt in the open.
Ladies and Gentlemen,Kenya has been taking part in global monitoring of POPs. We now have baseline data for the originallylisted POPs. Our major markets for fish and horticulture are perennially reviewing the residue levels ofthese chemicals. The trend is clear that chemical products are under increasing global scrutiny and Kenyacannot be left behind. It is in our interest that we keep abreast with global action to ensure that we protectKenya’s environment, health, economic and social being.
125
Further we note that the new calculations for POPs emissions indicate that our traditional three stonescook stoves are some of the major emitters of many air pollutants, as well as dioxins and furans. Thisraises concern as over statistics show that 29% of the diseases cannot be categorized; perhaps becausethey cannot be diagnosed easily. Such diseases may include cancers, asthma, immunodeficiencyendocrine disruption, etc. These are all attributed somewhat to POPs. In any case most countries havemoved from dirty fuels to clean fuels with households devising safe ways to dispose fumes. We have aduty to inform and assist to promote 30 million Kenyans using Stone Age cooking to dwellings s withbetter ventilation, less exposure to emission.
Ladies and gentlemen,I invite you to consider the proposed strategies and the actions and especially those in your sector ormandate and probably improve them. Our estimate of Kshs 5 billion to implement the convention overfive (5) years or at least 1 (one) billion every year is conservative. My Ministry will ensure that in theupcoming years, both the national and county governments regularly allocate funds that address relevantparts of the NIP. In this regard, let me conclude by thanking Global Environment Facility for the financialsupport to update the NIP.
I am happy that our development partners; WHO, UNDP, UNEP and World bank will journey with us tomeet the objectives of the convention.
Thank you.

126
STAKEHOLDERS PRESENT AT THE NIP ENDORSEMENT
126
STAKEHOLDERS PRESENT AT THE NIP ENDORSEMENT
126
STAKEHOLDERS PRESENT AT THE NIP ENDORSEMENT

127

128

129
LIST OF STAKEHOLDERS CONSULTATED IN UPDATING NATIONALIMPLEMENTATION PLAN
NO. CONTACT NAME INSTITUTION THEME1. Mr. Peter Giathi Bata Shoe (k) Ltd Industrial POPs
Ms. Peninah Kariuki Bata Shoe (k) Ltd Industrial POPsMr. Benson Maende Bata Shoe (k) Ltd Industrial POPs
2. Mr. James Kinyua Naivasha Sub-CountyMr. Ezekiel Bowen Naivasha Sub-CountyMr. Stephen Mungai Naivasha Sub- County
3 Dr. Riaz M. Khan Oserian Company Ltd Pesticides & Medical WasteMr. Erastus Mugo Oserian Company Ltd Medical Waste
4. Mr. Wilfred Osumo Nakuru Environment OfficeFrancis Irungu Kamau Nakuru Environment OfficeMs. Sarah Waruo Nakuru Environment Office
5. Ms. Zipporah Magelo Nakuru Provincial HospitalMs. Mirriam C. Mohammed Nakuru Provincial Hospital
6. Ms. Joyce Agutana Kenya Seed Company, Nakuru7. Andiba Kipkosgei Finlays, Kericho UPOPs/Energy8. Leonard Chepkwony EHS Asstant, Finlays Kericho UPOPs/Energy9. Reoben Langat EHS Asstant, Finlays Kericho UPOPs/Energy10. Mr. Nyatome Distric Public Health Officer,
KerichoIncinerators
11. Elias Nyakundi Mumias Sugar Co. Energy12. Stela Kamasi Environment Officer, Kisumu East13. Wycliffe Okuba Agrochemical and Food Company Environment and Safety14. Daniel Mututho Agrochemical and Food Company Environment and Safety15. Reuben K. Odhiambo Agrochemical and Food Company Quality Assurance16. Stephen Auma Agrochemical and Food Company Production17. Andiba Kipkosgei Finlays, Kericho18. Julius K. Kirima Ministry of Industrialization Industrial POPs19. Peter W. Wanjohi Ministry of Health Unintentional POPs20. Lulu Hayanga State Law Office Legal and Policy21. Muitungi Mwai NEMA Unintentional POPs22. Caroline Wamai Government Chemist Pesticide POPs23. Lawrence Kalawa Pest Control Pesticide Board Pesticide POPs24. Dr. Faridah H. Were Kenya Industrial Research Institute Industrial POPs25. Dr. Wilber Lwande ICIPE Pesticide POPs26. J. W. Chege Department of Water and Natural
ResourcesUnintentional POPs
27. David Rono Department of Water and NaturalResources
Policy
28. Francis Kombe Kenya Ports Authority Legal and Policy

130

131
Other Stakeholders Consulted1. Commission on the Implementation of the Constitution2. Environmental & Combustion Consultants, Kitengela3. Customs Departments, Mombasa, Kisumu and Nairobi4. National environmental Trust Fund5. National Environmental Tribunal6. Kenya Intellectual Property Institute7. Kisumu Water Services Company8. Kenya Bureau of Standards9. Office of the Attorney General, Department of Justice, Nairobi10. Agricultural Finance Coorporation11. Nairobi University12. Masinde Muliro University13. Maseno University14. Pan Paper Mills, Webuye15. Mumias Sugar Factory16. KARI, Mtwapa17. KEMRI, Kilifi18. SGS, Mombasa19. Kipevu Sewerage Plant, Mombasa
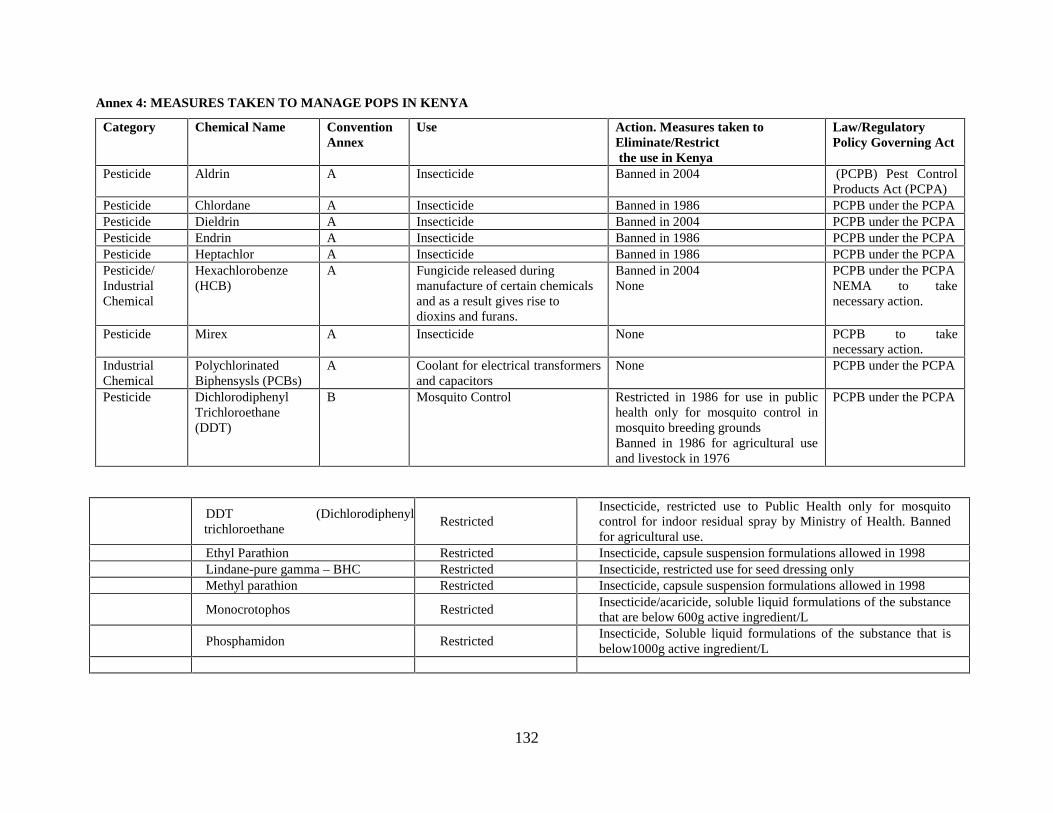
132
Annex 4: MEASURES TAKEN TO MANAGE POPS IN KENYA
Category Chemical Name ConventionAnnex
Use Action. Measures taken toEliminate/Restrictthe use in Kenya
Law/RegulatoryPolicy Governing Act
Pesticide Aldrin A Insecticide Banned in 2004 (PCPB) Pest ControlProducts Act (PCPA)
Pesticide Chlordane A Insecticide Banned in 1986 PCPB under the PCPAPesticide Dieldrin A Insecticide Banned in 2004 PCPB under the PCPAPesticide Endrin A Insecticide Banned in 1986 PCPB under the PCPAPesticide Heptachlor A Insecticide Banned in 1986 PCPB under the PCPAPesticide/IndustrialChemical
Hexachlorobenze(HCB)
A Fungicide released duringmanufacture of certain chemicalsand as a result gives rise todioxins and furans.
Banned in 2004None
PCPB under the PCPANEMA to takenecessary action.
Pesticide Mirex A Insecticide None PCPB to takenecessary action.
IndustrialChemical
PolychlorinatedBiphensysls (PCBs)
A Coolant for electrical transformersand capacitors
None PCPB under the PCPA
Pesticide DichlorodiphenylTrichloroethane(DDT)
B Mosquito Control Restricted in 1986 for use in publichealth only for mosquito control inmosquito breeding groundsBanned in 1986 for agricultural useand livestock in 1976
PCPB under the PCPA
DDT (Dichlorodiphenyltrichloroethane
RestrictedInsecticide, restricted use to Public Health only for mosquitocontrol for indoor residual spray by Ministry of Health. Bannedfor agricultural use.
Ethyl Parathion Restricted Insecticide, capsule suspension formulations allowed in 1998Lindane-pure gamma – BHC Restricted Insecticide, restricted use for seed dressing onlyMethyl parathion Restricted Insecticide, capsule suspension formulations allowed in 1998
Monocrotophos RestrictedInsecticide/acaricide, soluble liquid formulations of the substancethat are below 600g active ingredient/L
Phosphamidon RestrictedInsecticide, Soluble liquid formulations of the substance that isbelow1000g active ingredient/L
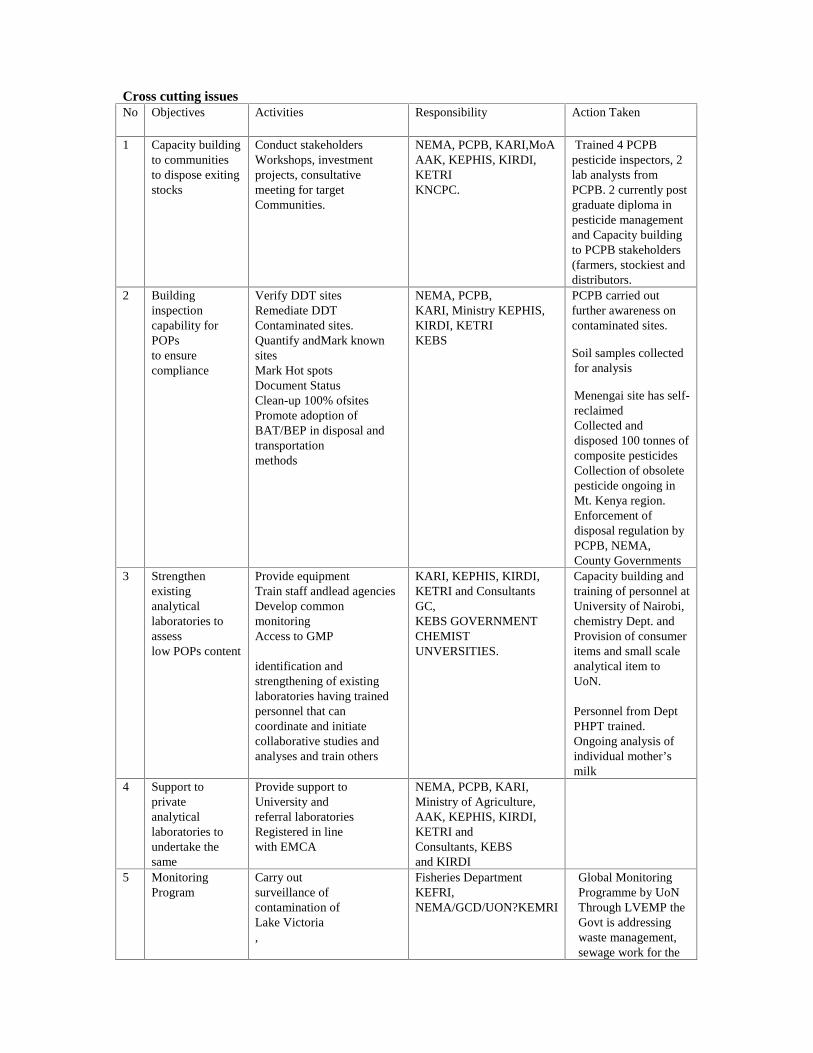
Cross cutting issuesNo Objectives Activities Responsibility Action Taken
1 Capacity buildingto communitiesto dispose exitingstocks
Conduct stakeholdersWorkshops, investmentprojects, consultativemeeting for targetCommunities.
NEMA, PCPB, KARI,MoAAAK, KEPHIS, KIRDI,KETRIKNCPC.
Trained 4 PCPBpesticide inspectors, 2lab analysts fromPCPB. 2 currently postgraduate diploma inpesticide managementand Capacity buildingto PCPB stakeholders(farmers, stockiest anddistributors.
2 Buildinginspectioncapability forPOPsto ensurecompliance
Verify DDT sitesRemediate DDTContaminated sites.Quantify andMark knownsitesMark Hot spotsDocument StatusClean-up 100% ofsitesPromote adoption ofBAT/BEP in disposal andtransportationmethods
NEMA, PCPB,KARI, Ministry KEPHIS,KIRDI, KETRIKEBS
PCPB carried outfurther awareness oncontaminated sites.
Soil samples collectedfor analysis
Menengai site has self-reclaimedCollected anddisposed 100 tonnes ofcomposite pesticidesCollection of obsoletepesticide ongoing inMt. Kenya region.Enforcement ofdisposal regulation byPCPB, NEMA,County Governments
3 Strengthenexistinganalyticallaboratories toassesslow POPs content
Provide equipmentTrain staff andlead agenciesDevelop commonmonitoringAccess to GMP
identification andstrengthening of existinglaboratories having trainedpersonnel that cancoordinate and initiatecollaborative studies andanalyses and train others
KARI, KEPHIS, KIRDI,KETRI and ConsultantsGC,KEBS GOVERNMENTCHEMISTUNVERSITIES.
Capacity building andtraining of personnel atUniversity of Nairobi,chemistry Dept. andProvision of consumeritems and small scaleanalytical item toUoN.
Personnel from DeptPHPT trained.Ongoing analysis ofindividual mother’smilk
4 Support toprivateanalyticallaboratories toundertake thesame
Provide support toUniversity andreferral laboratoriesRegistered in linewith EMCA
NEMA, PCPB, KARI,Ministry of Agriculture,AAK, KEPHIS, KIRDI,KETRI andConsultants, KEBSand KIRDI
5 MonitoringProgram
Carry outsurveillance ofcontamination ofLake Victoria,
Fisheries DepartmentKEFRI,NEMA/GCD/UON?KEMRI
Global MonitoringProgramme by UoNThrough LVEMP theGovt is addressingwaste management,sewage work for the
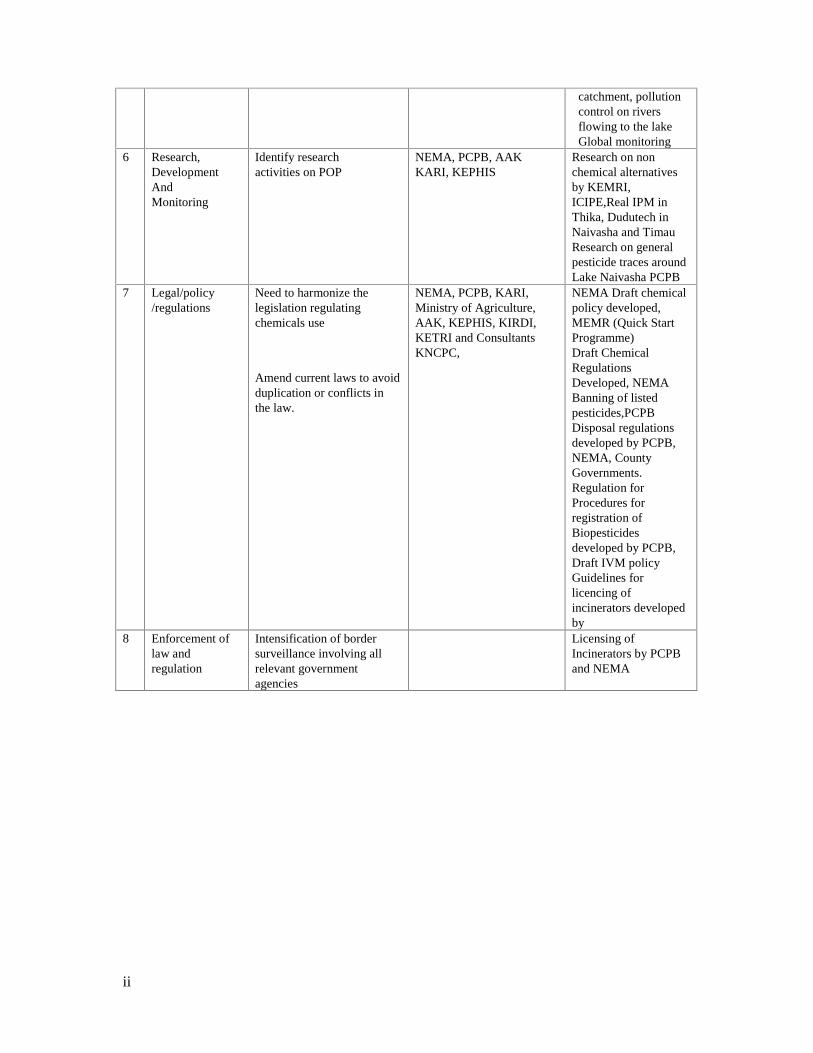
ii
catchment, pollutioncontrol on riversflowing to the lakeGlobal monitoring
6 Research,DevelopmentAndMonitoring
Identify researchactivities on POP
NEMA, PCPB, AAKKARI, KEPHIS
Research on nonchemical alternativesby KEMRI,ICIPE,Real IPM inThika, Dudutech inNaivasha and TimauResearch on generalpesticide traces aroundLake Naivasha PCPB
7 Legal/policy/regulations
Need to harmonize thelegislation regulatingchemicals use
Amend current laws to avoidduplication or conflicts inthe law.
NEMA, PCPB, KARI,Ministry of Agriculture,AAK, KEPHIS, KIRDI,KETRI and ConsultantsKNCPC,
NEMA Draft chemicalpolicy developed,MEMR (Quick StartProgramme)Draft ChemicalRegulationsDeveloped, NEMABanning of listedpesticides,PCPBDisposal regulationsdeveloped by PCPB,NEMA, CountyGovernments.Regulation forProcedures forregistration ofBiopesticidesdeveloped by PCPB,Draft IVM policyGuidelines forlicencing ofincinerators developedby
8 Enforcement oflaw andregulation
Intensification of bordersurveillance involving allrelevant governmentagencies
Licensing ofIncinerators by PCPBand NEMA

iii
References1. Alternatives Project Report DOMC/KEMRI (2012). Alternatives to pyrethroid insecticides for
indoor residual spraying (IRS) in Kenya2. M.W. Barasa J.O, Lalah and S.O. Wandiga. (2008). Seasonal variability of persistent
organochlorine pesticide residues in marine fish along the Indian Ocean coast of Kenya.Toxicological & Environmental Chemistry Vol. 90, No. 3 535-547
3. Mbogo C Policy Brief on Insecticide Resistance in Kenya (draft 2009)4. MPH&S, WHO 2009 Kenya IVM Policy guidelines (Draft)
5. GOK/UNEP 2002. Final Draft Country Report on Selection, Design and Implementation ofEconomic Instruments in the Kenyan Solid Waste Management Sector
6. Government of Kenya (2007) Kenya Vision 2030, a globally competitive and prosperousKenya.
7. Government of Kenya, Draft report of national research, monitoring and public awarenessactivities on POPs, Ministry of Environment, Water and Natural resources. (2014)
8. Government of Kenya: Identification and Quantification of dioxins and furan releases inKenya, March 2006
9. Government of Kenya: Kenya Draft Chemical Policy for Implementing the StrategicApproach
10. Government of Kenya: Kenya National Implementation Plan, March (2007).
11. Guidelines For Reviewing And Updating The NIP Under The Stockholm Convention on Pops;Global Environment Facility www.pops.int/NIP
12. Investment Climate Kenya, November, (2004. pp 10-11)13. Kenya National Bureau of Statistics (KNBS), (2010). Population & Housing Census Results
2009. Minister of State for Planning, National Development and Vision 2030, Kenya.14. Kenya National Profile To Assess the Chemicals Management (2011)15. Kenya-Economic-Update-June-2013, World Bank16. Madadi O.V., S.O. Wandiga, (2006) The status of POPs in Lake Victoria catchments.11th
World Lake Conference proceedings,(2): 107-112.17. Madadi O.V., Wandiga S.O., Njogu J.M., Mutie T., Mavuti. K.M., Jumba I.O, Shiundu P.M,
and D. Haper (2014) Occurrence of and distribution of organochlorine pestici de residues inLake Naivasha catchments. (In press).
18. Mogaka, H., Gichere, S., Davis, R. and Hirji, R. (2006). Climate variability and waterresources degradation in Kenya: improving water resources development and management,World Bank. Working Paper No 69, Washington DC.
19. Musa, J. W.Gichuki, P. O.Raburu., C Mulanda Aura 2011 Organochlorine andorganophosphorus pesticide residues in water and sediment from Yala/Nzoia River withinLake Victoria Basin, Kenya. Journal of Ecology and the Natural Environment 3 392-39
20. Njogu P.M, Kitetu J.J, Wanjau R.N and Keriko J.M. (2011). Application of the PERPESTModel in the prediction of environmental risks of endosulfan on Oreochromis leocostictus; Acase study of Lake Naivasha, Kenya
21. Orata, Francis , Maes, Ankes , Werres, Friedrich and Wilken, Rolf Dieter(2011)'Perfluorinated Compounds Distribution and Source Identification in Sediments of LakeVictoria Gulf Basin', Soil and Sediment Contamination: An International Journal, 20: 2, 129 -141
22. Omwenga I. M (2013)Assessment Of Pesticide And Heavy Metal Residues In Tilapia FishFrom Machakos And Kiambu Counties, Kenya MSc, Thesis UoN.
23. Pest Control Products Registered for use in Kenya. Revised Edition July 2013PCPB (Pest Control and Products Board) (2 List of pest control products provisionallyregistered by the pest control productboard for use in Kenya.
24. Report on WHO/UNEP Human Milk Survey on POPs (POPS) 2010.25. Resources Management Seminar (in Kenya pp.44. January 22-25).
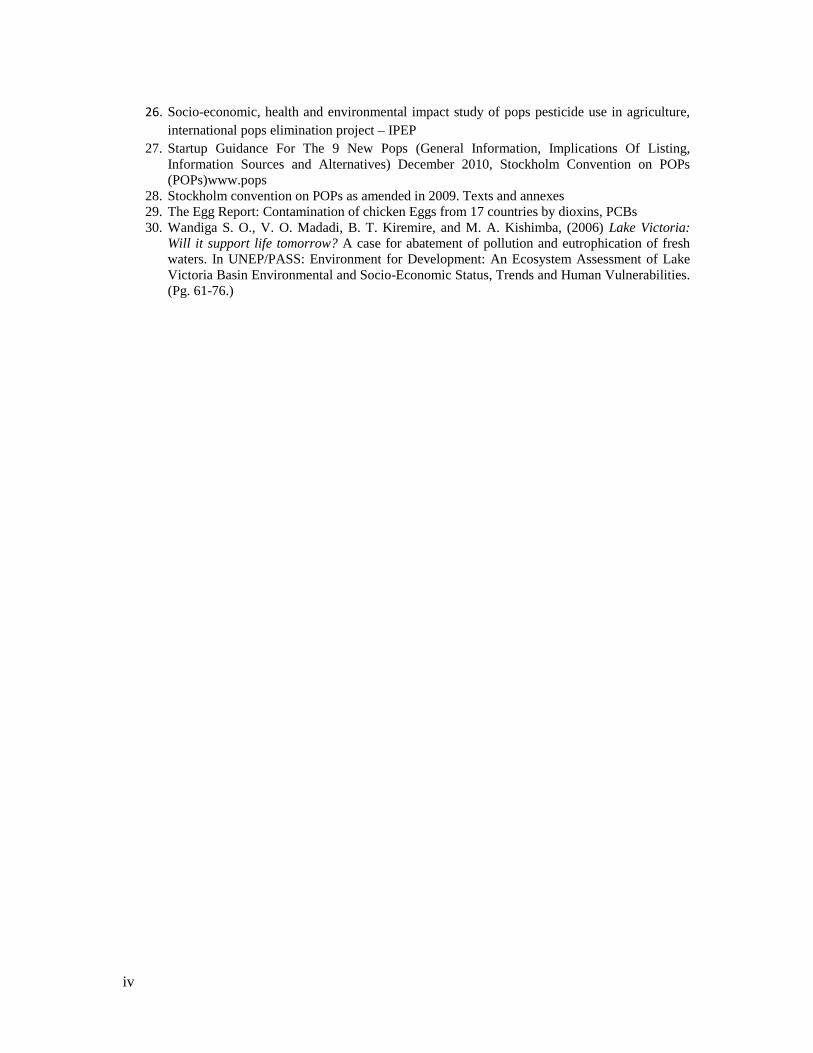
iv
26. Socio-economic, health and environmental impact study of pops pesticide use in agriculture,international pops elimination project – IPEP
27. Startup Guidance For The 9 New Pops (General Information, Implications Of Listing,Information Sources and Alternatives) December 2010, Stockholm Convention on POPs(POPs)www.pops
28. Stockholm convention on POPs as amended in 2009. Texts and annexes29. The Egg Report: Contamination of chicken Eggs from 17 countries by dioxins, PCBs30. Wandiga S. O., V. O. Madadi, B. T. Kiremire, and M. A. Kishimba, (2006) Lake Victoria:
Will it support life tomorrow? A case for abatement of pollution and eutrophication of freshwaters. In UNEP/PASS: Environment for Development: An Ecosystem Assessment of LakeVictoria Basin Environmental and Socio-Economic Status, Trends and Human Vulnerabilities.(Pg. 61-76.)

v
FOR FURTHER ENQUIRIES
The Principal SecretaryMinistry of Environment, Water and Natural ResourcesP. O. Box 30126NAIROBITel.254-02-2730808Email: [email protected], [email protected]
DirectorDepartment of Multilateral Environmental AgreementsNHIF Building, Ragat RoadNAIROBITel. 254-02-2730808Email: [email protected], [email protected]
PARTNERS
Global Environment Facility1818 H Street, NWWashington, DC 20433U.S.A.
The SecretariatStockholm Convention on Persistent Organic PollutantsChemin des AnemonesChatelaine,SWITZERLAND