kernel-based association test - home | genetics
TRANSCRIPT

Copyright � 2008 by the Genetics Society of AmericaDOI: 10.1534/genetics.107.084616
Kernel-Based Association Test
Hsin-Chou Yang,*,1,2 Hsin-Yi Hsieh†,‡ and Cathy S. J. Fann†,‡,2
*Institute of Statistical Science, Academia Sinica, Nankang, Taipei, Taiwan 115, †Institute of Biomedical Sciences, Academia Sinica,Nankang, Taipei, Taiwan 115 and ‡Institute of Public Health, Yang-Ming University, Taipei, Taiwan 112
Manuscript received November 15, 2007Accepted for publication March 23, 2008
ABSTRACT
Association mapping (i.e., linkage disequilibrium mapping) is a powerful tool for positional cloning ofdisease genes. We propose a kernel-based association test (KBAT), which is a composite function of ‘‘P-values of single-locus association tests’’ and ‘‘kernel weights related to intermarker distances and/or linkagedisequilibria.’’ The KBAT is a general form of some current test statistics. This method can be applied to thestudy of candidate genes and can scan each chromosome using a moving average procedure. We evaluatedthe performance of the KBAT through simulation studies that considered evolutionary parameters, diseasemodels, sample sizes, kernel functions, test statistics, window attributes, empirical P-value estimations, andgenetic/physical maps. The results showed that the KBAT had a well-controlled false positive rate and highpower compared to existing methods. In addition, the KBAT was also applied to analyze a genomewide dataset from the Collaborative Study on the Genetics of Alcoholism. Important genes associated with alcoholismdependence were identified. In summary, the merits of the KBAT are multifold: the KBAT is robust againstthe inclusion of nuisance markers, is invariant to the map scale, and accommodates different types ofgenomic data, study designs, and study purposes. The proposed methods are packaged in the user-friendlysoftware, KBAT, available at http://www.stat.sinica.edu.tw/hsinchou/genetics/association/KBAT.htm.
ASSOCIATION study has been broadly imple-mented to identify disease susceptibility genes
related to complex disorders (Cardon and Bell 2001;Hirschhorn and Daly 2005; Wang et al. 2005; Laird
and Lange 2006). Several historical milestones of genemapping that have used association studies include theidentifications of the association between late-onsetAlzheimer’s disease and the APOE-4 allele on 19q13.2(Corder et al. 1993) and the association betweenCrohn’s disease and NOD2 on 16q21 (Hugot et al.2001). With the completion of international genetic/genomic projects, such as the Human Genome Project(International Human Genome Mapping Consor-
tium 2001), the HapMap Project (International
HapMap Consortium 2003), and the ENCODE Pro-ject (Encode Project Consortium 2004), a largenumber of SNP markers across the human genomehave become available for gene association studies. Inaddition, new SNP array technologies have blossomed(Matsuzaki et al. 2004; Steemers and Gunderson
2007). A great reduction in the cost of genotyping andan increase in the number of genetic markers makegenomewide association scans more feasible andefficient. These recent advances have improved thepower and resolution of association mapping, therebyproviding exquisite genetic dissection of complex
disorders and greatly contributing to drug discovery(Wellcome Trust Case Control Consortium 2007).
A key factor in a successful association study is thechoice of association tests. Association tests can bedivided into single-locus and multilocus tests, accordingto the number of marker loci involved in a test statistic.Single-locus association tests emphasize marginal ef-fects and are most suitable for studying a locus with astrong main effect on disease manifestation, where thestudy locus may be causal or highly correlated (indirectassociation) to genes responsible for disease. Linkagedisequilibrium, which reflects allelic association amongdifferent loci, plays an important role in indirectmapping. Linkage disequilibrium decays due to chro-mosomal recombination in meiosis between generations,and hence it exists only within a small chromosomeregion after many generations in an outbred popula-tion. Consequently, association mapping (i.e., linkagedisequilibrium mapping) is highly accurate for posi-tional cloning of disease-related genes.
In recent years, multilocus association tests havegained widestream use for association studies identify-ing disease susceptibility genes related to complex dis-orders (Hoh and Ott 2003). Multiple genes may besimultaneously involved in a same-disease pathway andact in concert to confer a higher risk of disease. For onething, multilocus susceptibility models are competentfor detection of marginal effects unless a flip-flop phe-nomenon occurs (Zaykin and Shibata 2008). Foranother, a multilocus association test provides more
1Corresponding author: Institute of Statistical Science, Academia Sinica,128 Academia Rd., Sec. 2, Nankang, Taipei, Taiwan 115.E-mail: [email protected]
2 These authors contributed equally to this work.
Genetics 179: 1057–1068 ( June 2008)

information regarding the disease-related gene regionand potentially increases the statistical power for genelocalization compared with a single-locus inference.The reasons justify the use of multilocus associationanalyses.
The main multilocus association analyses consist ofhaplotype inference (Schaid et al. 2002; Zaykin et al.2002a; Chen and Kao 2006), genotype partition/com-bination ½combinatorial partitioning method (CPM)(Nelson et al. 2001) and multifactor dimensonalityreduction (MDR) (Ritchie et al. 2001)�, statistic com-bination tests (Hoh et al. 2001; Hoh and Ott 2003;Wille et al. 2003; Sun et al. 2006), and P-value com-binations (Zaykin et al. 2002b; Dudbridge and Koele-
man 2003; Yang et al. 2006). Each of these methods hasits respective strengths and has proven practical incertain applications. This article focuses on P-value com-binations due to two reasons. First, they reflect ourresearch interests. Second, P-value combination has sev-eral merits (Zaykin et al. 2002b and discussion and
conclusion in this article).P-value combinations originated with Fisher’s prod-
uct P-value method, equivalent to the sum of log scale ofP-values (Fisher 1925). Later, other P-value combina-tion methods were developed (Tippett 1931; Stouffer
et al. 1949; Edgington 1972). P-values were assumed tobe independent in these methods for the convenienceof theoretical development; however, this assumption istoo stringent for use in many practical applications, suchas candidate gene or genomewide association scansusing dense SNP markers. Different computational algo-rithms have been developed to circumvent the difficultyin deviation of null distributions with dependent P-values, such as permutation, bootstrap, and Monte Carlo(Manly 1998). P-value combination methods have beenbroadly applied to different fields, such as meta-analysisof linkage mapping (Guerra et al. 1999) and microarraygene expression analysis (Hess and Iyer 2007). Re-cently, these methods have been extended to associa-tion mapping (Zaykin et al. 2002b; Dudbridge andKoeleman 2003; Yang et al. 2006). Some P-valuecombination methods have been incorporated intopopular analysis packages, such as SAS/Genetics ver-sion 9.1.3 (Sas Institute 2005).
Although many P-value combination methods havebeen developed, few incorporate intermarker distancesinto the algorithm. Two methods were developed toaccount for intermarker distances, i.e., random inter-marker distances and constant intermarker distances.For random distances, mutation processes were formu-lated by a compound Poisson process, and intermarkerdistances were assumed to follow an identical exponen-tial distribution independently (Sun et al. 2006). Thestudy found that the Fisher’s product P-value methodcould identify disease gene regions, but the regionswere larger than that identified by their scan method.For constant distances, intermarker distances were for-
mulated as fixed constants and served as weights for P-values on different marker loci (Yang et al. 2006). Theresults showed that the Fisher’s product P-value methodmay lose in power and/or increase in false positive ratewhen nuisance markers were included in the analysis.This article focuses on the model of constant inter-marker distances that do not assume a specific un-derlying distribution for intermarker distances. Thepurpose of this article is to propose a new P-valuecombination method for efficient multilocus associa-tion scans and to examine this method using large-scalesimulation studies and real data analyses.
METHOD
A two-stage procedure: We introduce a two-stageassociation mapping strategy to locate genes that in-fluence susceptibility to a complex trait or disorder.Consider a study region ½0, T � that contains M SNPmarkers at positions L ¼ fL1 , L2 , � � � , LM�1 , LM ;L1 ¼ 0; LM ¼ Tg. In the first stage, M single-locusassociation tests for null hypotheses ‘‘H0i: the ith SNPis not associated with the study disease, i ¼ 1; � � � ;M ’’are performed, and the observed significance probabil-ities are summarized in a series of P-values, P ¼ fpi ;i ¼ 1; � � � ; Mg. For instance, allele- and trend-basedassociation tests can be considered for unrelated case–control studies under Hardy–Weinberg equilibrium anddisequilibrium, respectively (Sasieni 1997). Family-based association tests (FBATs) (Rabinowitz andLaird 2000; Horvath et al. 2001) can be performedfor family-based case–control and quantitative traitmapping studies.
In the second stage, a multilocus association testcombining neighboring P-values in sequence P is con-structed. The study region ½0, T � is scanned using amoving average procedure from the starting SNP atposition 0 to the end SNP at position T. The procedure isdescribed as follows. Let an anchor denote a chromo-somal position of interest. Given a bandwidth h and ananchor locus t, a window W ðt; hÞ is constructed bychoosing all SNPs ½i.e., W ðt; hÞ ¼ fi : Li 2 ½t � h; t 1 h�;pi # 1g� or potential SNPs ½i.e., W ðt; hÞ ¼ fi : Li 2½t � h; t 1 h�; pi # ug� within the chromosome region½t � h, t 1 h� for 0 # t # T and h . 0, where constant u
denotes a truncation threshold where P-values greaterthan the threshold are removed from the window. If allP-values in a window are .u, the window is removedfrom subsequent analyses. The entire study region ispartitioned into contiguous windows by shifting theanchors from the beginning to the end of the studyregion. The moving windows have a fixed windowlength (i.e., 2h) except when an anchor is close to theboundary of the study region. Different windows prob-ably contain various numbers of SNPs.
Within each window, we perform a kernel-basedassociation test (KBAT). Given a bandwidth, h, and an
1058 H.-C. Yang, H.-Y. Hsieh and C. S. J. Fann
anchor at position t, the test statistic for window W ðt; hÞis written as follows:
Gt;h ¼X
i2W ðt;hÞðai 3 lnðpiÞÞ; ð1Þ
where
ai ¼(Kððt � t iÞ=hÞ)P
j2W ðt;hÞ (Kððt � t jÞ=hÞ) ð2Þ
denotes kernel weight for the ith P-value within windowW ðt; hÞ, and function Kð�Þ denotes a kernel densitysatisfying three properties: (1) unimode, (2) symmetry,and (3) integration to one. Three frequently used ker-nel density functions, Epanechnikov kernel (KðvÞ¼34ð1�v2Þ;�1#v #1), triangular kernel (KðvÞ¼ð1�jvjÞ;�1#v #1), and quartic kernel (KðvÞ¼ 15
16ð1�v2Þ2;�1#v #1), were considered in our simulation study.The KBAT elaborated in Equation 1 is constructed undera multiplicative P-value model (Fisher 1925; Zaykin et al.2002b). Other models, e.g., an additive P-value model, canalso be considered. Association between a putative diseaselocus and an anchor locus is sequentially scanned byshifting the anchor, which is the center of a window, fromthe start to the end of the study region. The KBATemphasizes a ‘‘local effect,’’ where higher weights areassigned to single-locus P-values of markers closer to theanchor. Effects of remote marker loci are negligible. Thisfeature pertains to kernel function and kernel weights asmentioned before. Such a local effect is suitable fordescribing the pattern of linkage disequilibrium, whichdecays due to historical meiosis recombination.
Sampling distributions of the KBAT statistic and itsspecial cases: The sampling distribution of the KBATstatistic should be derived for testing disease associa-tion. We first discuss the scenario where all P-valueswithin a window are independent. Let #ðW ðt; hÞÞ de-note the number of P-values within window W ðt; hÞ,fp1; � � � ; p#ðW ðt;hÞÞg represents the corresponding P-values, and fa1; � � � ; a#ðW ðt;hÞÞg represents the kernelweights. Under the null hypothesis of no association,all P-values follow a uniform distribution.
The KBAT statistic elaborated in Equation 1 is ageneral form of the single-locus P-value statistic and thelog function of the product P-value statistics. If a kernelfunction having a single-point mass on an anchor isadopted, then the KBAT statistic reduces to the single-locus P-value statistic. If a rectangle kernel function isadopted and the P-value truncation procedure is notconsidered (i.e., u ¼ 1), then the KBAT statistic reducesto the Fisher’s product P-value statistic (Fisher 1925).The commonly used formula, i.e., minus twice the logfunction of the product P-value statistic, follows a chi-square distribution with a degree of freedom of2 3 #ðW ðt; hÞÞ under the null hypothesis. If a rectanglekernel function is adopted and the P-value truncationprocedure is considered (i.e., u , 1), then the KBAT
statistic reduces to the Zaykin’s truncated product P-value statistic whose null distribution has been de-scribed previously (Zaykin et al. 2002b). If other kernelfunctions are used and the P-value truncation pro-cedure is not considered, then the KBAT statistic re-duces to the weighted product P-value statistic and itsnull distribution has been described previously (Good
1955).If P-values within a window are statistically dependent,
the exact null distribution becomes intractable andrelies on the correlation structure of P-values. MonteCarlo (Zaykin et al. 2002b), permutation (Churchill
and Doerge 1994; Doerge and Churchill 1996;Dudbridge and Koeleman 2003), and direct simula-tion methods (Lin 2005; Seaman and Muller-Myhsok
2005) have been proposed to generate the null distri-bution. All of these algorithms can be applied to yield anull distribution of the KBAT with slight modifications.In this article, we capitalized on the Zaykin’s MonteCarlo procedure by applying a five-step algorithm asfollows: (1) a correlation matrix was established to de-fine the relationship among P-values; (2) dependent P-values mimicking the original P-values in the real datawere generated; (3) the KBAT statistic was recalculatedon the basis of each of the Monte Carlo samples; (4) theempirical distribution of the KBAT statistic was con-structed; and (5) the empirical P-value was calculated.For the details in each step refer to Yang et al. (2006).
SIMULATION
Simulation conditions: Using simulations, we evalu-ated the performance of the KBAT under differentconditions. Dichotomous phenotype data (affected caseand unaffected control) and SNP genotype data (1/1,1/0, and 0/0) were generated using HAPSIM software(Curtis et al. 2001). The details of the simulationalgorithms are listed in the HAPSIM user manuals.Our simulations considered several parameters/factorsincluding (1) evolutionary parameters (recombinationand mutation age); (2) disease models ½disease allelefrequency (DAF) and penetrance vector (PV)� andsample sizes; (3) kernel functions (Epanechnikov, tri-angular, and quartic kernels); (4) test statistics ½single-locus method, product P-value method (Fisher 1925),truncated product P-value method (Zaykin et al. 2002b),minimum P-value method (Tippett 1931), weightedproduct P-value method (Yang et al. 2006) and KBATs�;(5) bandwidths and windows (fixed window and movingwindows); (6) empirical P-value estimations (MonteCarlo procedure and permutation procedure); and(7) genetic/physical maps (base pairs, centimorgans,morgans, and recombination fraction). In the simula-tion study, we generated S simulation samples (S ¼1000) under each simulation condition. In each simu-lation sample, a chi-square test statistic was calculatedfor the single-locus association test in the first stage on
Kernel-Based Association Test 1059

the basis of genotype data, and the resulting P-valueswere used for multilocus association tests in the secondstage. Given the P-values from raw data, we calculatedcorrelation matrices of P-values. Then we generateddependent P-values mimicking the original P-values forC times (C¼ 10,000). In each sequence of dependent P-values, all test statistics were recalculated. Then theempirical distribution of each test statistic was con-structed and the empirical P-value was calculated on thebasis of the C Monte Carlo samples. The procedure wasapplied to all S simulation samples. On the basis of theobtained empirical P-values, we calculated the false pos-itive rate for models without disease genes, and we cal-culated the power in models containing disease genes.
Evolutionary parameters: We examined the perfor-mance of the KBAT using an Epanechnikov kernelunder different recombination fractions and mutationages, which affected the evolutionary process of thedisease gene of study. Two recombination fractions wereconsidered: (1) SU-1 and (2) SU-5. Among 31 diallelicmarkers in the study region, the recombination fractionSU-1 contained 3 middle markers and SU-5 contained11 middle markers that are highly linked to the truedisease locus; the remaining SNPs were not linked to thedisease locus (Yang et al. 2006). Two mutation ages wereconsidered: (1) recent polymorphism and (2) historic
polymorphism. The first condition considered thenumber of generations before and after the diseasemutation to be 10 and 10, respectively; the second con-dition considered the number of generations beforeand after the disease mutation to be 200 and 10, re-spectively. In the simulation of power study, the (un-observable) disease locus was set close to the center ofthe study region with 31 markers. For both the affectedcases and unaffected controls, the sample size was Na ¼Nu¼ 1000. The frequency of disease allele D was DAF ¼0.1, and the penetrance vector for genotypes dd, Dd, andDD was PV ¼ (0.1, 0.3, 0.4), respectively. Bandwidthswere assigned on the basis of window sizes of 3, 11, 21,and 31.
The results in Figure 1A demonstrate that the re-combination fraction had a large effect on the power ofthe KBAT, but the effect of mutation ages was relativelylow. Under the SU-1 recombination fraction containing3 markers linked to the true disease locus, the power wasbetween 0.42 and 0.45; under the scenario of SU-5containing 11 markers linked to the true disease locus,the power increased from 0.47 to�0.75 when data fromall informative markers were capitalized in the KBAT.The effects of window size and bandwidth will bediscussed later. The recombination fraction and muta-tion ages slightly affected the false positive rate of the
Figure 1.—Evaluation of effects of evolutionary/genetic/other factors on the KBAT. (A) Effects of recombination fraction andmutation age. (B) Effects of disease model and sample size. (C) Effect of kernel function.
1060 H.-C. Yang, H.-Y. Hsieh and C. S. J. Fann
KBAT, but all false positive rates were controlledbetween 0.03 and 0.08.
Disease model and sample size: Two sample sizeswere considered: (1) 500 cases and 500 controls and (2)1000 cases and 1000 controls. Four disease models wereconsidered: (1) high penetrance model with PV ¼ (0,0.7, 0.7) and DAF ¼ 0.001, (2) modest penetrancemodel with PV ¼ (0.1, 0.3, 0.4) and DAF ¼ 0.1, (3)modest penetrance model with PV ¼ (0.1, 0.3, 0.4) andDAF ¼ 0.25, and (4) low penetrance model with PV ¼(0.005, 0.005, 0.03) and DAF ¼ 0.25.
The results in Figure 1B demonstrate that the powerincreased when sample size or penetrance increased.Although the pattern was not surprising, the values ofincreased power allow for practical study designs. Underthe four disease models, the percentage of powergained due to doubling the sample size was 2, 35, 40,and 55%, respectively. Under the same PV (diseasemodels 2 and 3), KBAT had higher power for a dis-ease model with a higher DAF. Under the same DAF(disease models 2 and 3), KBAT had higher power for adisease model with a higher PV.
Without additional descriptions regarding simulationconditions for the subsequent simulation studies, wedescribe results from the simulation studies, whichgenerated 31 diallelic markers for 1000 cases and 1000controls under the SU-1 recombination fraction. Thenumber of generations before and after the diseasemutation was 10. A disease model of PV¼ (0.1, 0.3, 0.4)and DAF ¼ 0.1, which had the lowest power among thefour previously considered disease models, was dis-cussed. Analyses for other evolutionary/disease modelswere also performed but results are not shown.
Kernel functions: We evaluated the impact of kernelfunctions on the KBAT. Three frequently used kerneldensity functions were considered: (1) Epanechnikov
kernel, (2) triangular kernel, and (3) quartic kernel. Allsimulation results in Figure 1C show that the power andfalse positive rates for different kernel functions wereconsistent. The power for different kernel functions was0.42, and the false positive rate was 0.03. Therefore,kernel functions have no or only a limited effect on theKBAT. In subsequent simulations, we show only resultsof the KBAT using an Epanechnikov kernel, which isoptimal for density estimation (Epanechnikov 1969).
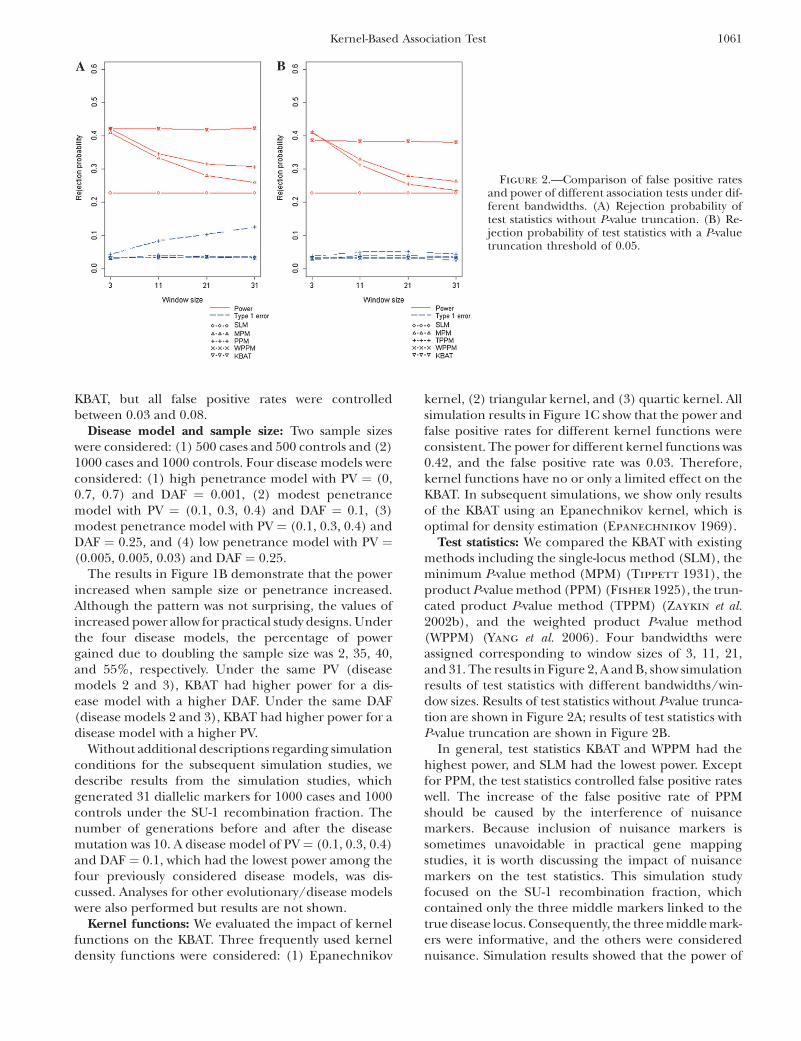
Test statistics: We compared the KBAT with existingmethods including the single-locus method (SLM), theminimum P-value method (MPM) (Tippett 1931), theproduct P-value method (PPM) (Fisher 1925), the trun-cated product P-value method (TPPM) (Zaykin et al.2002b), and the weighted product P-value method(WPPM) (Yang et al. 2006). Four bandwidths wereassigned corresponding to window sizes of 3, 11, 21,and 31. The results in Figure 2, A and B, show simulationresults of test statistics with different bandwidths/win-dow sizes. Results of test statistics without P-value trunca-tion are shown in Figure 2A; results of test statistics withP-value truncation are shown in Figure 2B.
In general, test statistics KBAT and WPPM had thehighest power, and SLM had the lowest power. Exceptfor PPM, the test statistics controlled false positive rateswell. The increase of the false positive rate of PPMshould be caused by the interference of nuisancemarkers. Because inclusion of nuisance markers issometimes unavoidable in practical gene mappingstudies, it is worth discussing the impact of nuisancemarkers on the test statistics. This simulation studyfocused on the SU-1 recombination fraction, whichcontained only the three middle markers linked to thetrue disease locus. Consequently, the three middle mark-ers were informative, and the others were considerednuisance. Simulation results showed that the power of
Figure 2.—Comparison of false positive ratesand power of different association tests under dif-ferent bandwidths. (A) Rejection probability oftest statistics without P-value truncation. (B) Re-jection probability of test statistics with a P-valuetruncation threshold of 0.05.
Kernel-Based Association Test 1061

MPM, PPM, and TPPM was reduced dramatically whennuisance markers were included. The weighted statistics(KBAT and WPPM) properly adjusted the interferenceof nuisance markers and maintained the power. Inclu-sion of nuisance markers also resulted in the inflation offalse positive rate of PPM. The P-value truncation pro-cedure suggested by Zaykin et al. (2002b) significantlyimproved inflation of false positive rate, whereas thetruncation slightly reduced the power. The weightingprocedures recommended in Yang et al. (2006) and inthis article also controlled false positive rate well. Insummary, KBAT and WPPM had the best performancein both power and false positive rate, i.e., the two teststatistics were invariant to the inclusion of nuisancemarkers.
Bandwidths and windows: First, we examined the casewhere the anchor marker was fixed at the center of studymarkers (scenario of a fixed window). We specified fourbandwidths corresponding to window sizes of 3, 11, 21,and 31. Simulation results are shown in Figure 2, A andB. In general, the KBAT and the WPPM performed wellwith regard to power and false positive rate evenalthough a nonoptimal bandwidth or window size wasused (the optimal window size was 3 in this case). MPM,PPM, and TPPM were comparable to KBAT and WPPMwhen the optimal window size was considered, but the
power was dramatically reduced when the incorrectwindow size was adopted.
We further evaluated the performance of the KBATusing moving anchors (scenario of moving windows).We generated 11 SNP markers in the study region for1000 cases and 1000 controls under the SU-1 recombi-nation fraction. A true disease locus was located closeto one of the following five loci: (1) the starting lo-cus SNP1, (2) the second locus SNP2, (3) the sixth locusSNP6, (4) the tenth locus SNP10, and (5) the last locusSNP11. A ‘‘disease-related region’’ was constructed usingmarkers associated with the true disease locus. There-fore, the disease-related regions under SU-1 wereconstructed by {SNP1, SNP2}, {SNP1, SNP2, SNP3},{SNP5, SNP6, SNP7}, {SNP9, SNP10, SNP11}, and {SNP10,SNP11} when the true disease locus was close to the fiveloci: SNP1, SNP2, SNP6, SNP10, and SNP11, respectively.Two bandwidths (h ¼ 25,000.00001 bp and h ¼50,000.000045 bp) were considered. For each truedisease location and for each of the two bandwidths,rejection probabilities of three test statistics (SLM,TPPM, and KBAT) with a P-value truncation thresholdof 0.05 were calculated sequentially from the firstmarker locus SNP1 to the last marker locus SNP11.Results are shown in Figure 3, where the vertical axisdenotes rejection probability. The location of a true
Figure 3.—Comparisonof rejection probabilitiesof the SLM, the TPPM,and the KBAT. In eachgraph, the horizontal axisdenotes SNP locus and thevertical axis denotes rejec-tion probability. Twographs in each row show re-sults for two different band-widths (h ¼ 25,000.00001bp and h ¼ 50,000.000045bp), given the same loca-tion of the true diseasegene; 5 graphs in each col-umn show results for five lo-cations of the true diseasegene, given a bandwidth.The location of a true dis-ease locus is signified by ablue inverted triangle.
1062 H.-C. Yang, H.-Y. Hsieh and C. S. J. Fann

disease locus is signified by a blue inverted triangle. Therejection probability signifies power at a SNP marker ifthe SNP is located within the disease-related region; therejection probability signifies a false positive rate at aSNP marker if the SNP is located outside the disease-related region.
Results showed that the KBAT improved power of theSLM due to incorporation of multilocus informationand improved false positive rate of the TPPM resultingfrom integration of proper marker weights. The im-provement of false positive rate can also be explained asan improvement in the resolution of association map-ping, where the KBAT reliably identified the regionlinked to the true disease locus as well as accuratelydetermined the width of the disease gene region. Inaddition, we examined whether the location of a truedisease locus affected performance of the proposedmethods. When an anchor is close to the boundary ofthe study region, the corresponding window has animbalanced number of markers on both sides of theanchor marker. If the power and false positive rate arenot influenced by an imbalanced number of markers,we label this property as an ‘‘immunity of boundaryeffect.’’ Figure 3 shows that the KBAT satisfied thisproperty. These advantages justify the application of theKBAT to association scans.
Empirical P-value estimations: We compared the twomethods of empirical P-value calculation, Monte Carloprocedure (Zaykin et al. 2002b) and permutation pro-cedure (Churchill and Doerge 1994; Doerge andChurchill 1996). A disease model of PV ¼ (0.1, 0.3,0.4) and DAF ¼ 0.25 was discussed. Four bandwidthswere assigned corresponding to window sizes of 3, 11,21, and 31. KBAT statistics without P-value truncation(u ¼ 1) and with P-value truncation (u ¼ 0:05) were
calculated. The total number of simulations was S ¼1000. In each simulation, empirical P-values were cal-culated by using the Monte Carlo procedure andpermutation procedure, respectively, where the numberof Monte Carlo replications was C ¼ 10,000 and thenumber of permutation replications was R ¼ 10,000.The power and false positive rate of the KBAT with/without P-value truncation were calculated under dif-ferent bandwidths. Simulation results of test statisticswithout P-value truncation are shown in Figure 4A;results of test statistics with P-value truncation are shownin Figure 4B. Results showed that the power and falsepositive rates from the Monte Carlo procedure andpermutation procedure were close. The differences ofpower of the two procedures across different truncationthresholds and bandwidths were smaller than 0.02; thedifferences of false positive rates of the two proceduresacross different truncation thresholds and bandwidthswere smaller than 0.03. Two methods of empirical P-value calculation produced the consistent results, sug-gesting that the calculation of empirical P-value of theKBAT was reliable.
Genetic/physical maps: We examined whether dif-ferent maps and scales influence the weights used in theKBAT and the WPPM, and therefore, the performancein disease gene mapping. Results showed that weights ofthe KBAT were not affected by the map scale (Figure5A), but the weights of the WPPM were affected (Figure5B). In other words, the KBAT is scale invariant. We alsocompared the effect of map scale on false positive ratesand power of the KBAT and the WPPM. The results areshown in Figure 5C. Because of an invariance to mapscale, the false positive rate and power of the KBATremained constant for different map scales. However,the WPPM was affected greatly. When base pair (bp) was
Figure 4.—Comparison of false positiverates and power of KBATs, which usedMonte Carlo procedure and permutationprocedure for empirical P-value estima-tion, under different bandwidths. (A) Re-jection probability of the KBAT withoutP-value truncation. (B) Rejection probabil-ity of the KBAT with a P-value truncationthreshold of 0.05.
Kernel-Based Association Test 1063

used as the distance scale, the WPPM assigned almost allweight to the anchor marker. Under these circum-stances, the WPPM was equivalent to the SLM wherethe power was reduced while false positive rate was min-imized. When recombination fraction (RF) was used,all markers in the window had approximately equalweights. The WPPM, therefore, was approximately equiv-alent to the PPM. The power decreased and false positiverate increased when nuisance markers were included, i.e.,when the number of included markers was .3. Whencentimorgan (cM) and morgan (M) were used, the KBATand the WPPM performed similarly. The results showedthat the KBAT was invariant to the map scale.
REAL DATA ANALYSIS
Alcoholism dependence ½Online Mendelian Inheri-tance in Man (OMIM) no. 103780� is a polygenic andmultifactorial disorder characterized by an alcoholcraving, alcohol tolerance, and/or aggressive and anti-social behavior. In this study, we analyzed the data fromThe Collaborative Study on the Genetics of Alcoholism(COGA) provided by Genetic Analysis Workshop 14(GAW14) (Bailey-Wilson et al. 2005; Edenberg et al.
2005) to illustrate our proposed method. In this study,patients with an alcohol dependency were diagnosedusing the DSM-III-R and Feighner criteria. This studycollected 143 pedigrees with 1614 samples in total,which corresponded to 643 patients, 285 pure un-affected individuals, and 686 others (‘‘others’’ containunknown, never drank, and unaffected with somesymptoms). Samples who met the diagnostic criteria ofalcohol dependency were treated as affected individuals(cases). The remaining samples were treated as un-affected individuals (controls). Genotyping was per-formed with the Affymetrix GeneChip Mapping 10KArray (11,560 SNPs) and Illumina Linkage III Panel(4763 SNPs). Our analysis capitalized only on the SNPsin the former platform, having an average intermarkerdistance of 210 kb, because the former platform pro-vided a larger number of SNP markers. Of 11,120 SNPson 22 autosomes, 1497 SNPs violating Hardy–Weinbergequilibrium were excluded from our analysis.
In our analysis, FBATs (Rabinowitz and Laird 2000;Horvath et al. 2001) were conducted to test thenull hypothesis of no association in the first stage. Falsediscovery rates (FDR) (Benjamini and Hochberg
1995) of the FBAT are shown in Figure 6 (black dashed
Figure 5.—Evaluation of the effects of different weighting procedures. (A) Weight values of the proposed kernel-based weightingprocedure. (B) Weight values of the distance-based weight procedure (Yang et al. 2006). (C) Rejection probabilities of the KBATand the WPPM under different distance scales (M, morgan; cM, centimorgan; bp, base pair; and RF, recombination fraction).
1064 H.-C. Yang, H.-Y. Hsieh and C. S. J. Fann

line). Results showed that the genomewide single-locusFBAT identified five significant SNPs with FDR ,
0.05 (tsc0055322 and tsc0559236 on chromosome 1,tsc0564670 on chromosome 5, tsc0483523 on chromo-some 6, and tsc0325449 on chromosome 14). In ad-dition to the single-locus FBAT, we also calculated themultilocus KBAT with bandwidths covering 5, 10, and20 SNPs on an average on the basis of P-values of thegenomewide single-locus FBAT. FDR was applied to theempirical P-values of the KBAT to consider a multiple-test comparison. In this scenario, the regions located byKBATs with the three bandwidths were similar. There-fore, only results based on the bandwidth covering fiveSNPs on average are shown in Figure 6 (blue solid line).Results showed that all SNPs identified by the genome-wide single-locus FBAT were also captured by the KBAT.Nevertheless, the KBAT further identified additionalloci over the single-locus FBAT. The genomewide multi-
locus KBAT identified 24 significant SNPs on chromo-somes 1, 2, 3, 5, 6, 7, 14, and 18, where the highest�log10(FDR) on these eight chromosomes were 2.34,1.62, 1.42, 3.51, 2.90, 1.42, 1.40, and 1.40, respectively.SNPs identified by at least one of three KBATs withdifferent bandwidths are summarized in supplementalTable 1.
Our analyses confirmed findings in previous genome-wide linkage mapping (Hill et al. 2004; Yang et al.2005a). Our identified strong association signals onchromosomes 1 and 6 were close to the regions mappedby the previous studies (Edenberg et al. 2004; Lappa-
lainen et al. 2004). The highest peak on chromosome 1was close to the alcoholism gene region betweenD1S2779 (126.16 cM) and D1S1170 (128.73 cM) iden-tified by Lappalainen et al. (2004). The highest peak onchromosome 6 was close to the human major histocom-patibility complex region that covers important alco-
Figure 6.—Genome-wide association scans of alcoholism data. The horizontal axis is the genetic distance in centimorgans. Thevertical axis is the false discovery rate (FDR) of the FBAT in �log10. The red reference line denotes the significance threshold of�log10(FDR) ¼ 1.30, i.e., FDR ¼ 0.05. The black dashed line represents �log10 (FDR) of the single-locus FBAT and the blue solidline denotes �log10(FDR) of the multilocus KBAT.
Kernel-Based Association Test 1065

holism genes, such as GABRA2 (Edenberg et al. 2004).In addition, KBATs also identified chromosome regionsthat were neither found by the single-locus FBAT norreported by other studies. More investigation of bi-ological function and disease etiology of these regionswith strong association signals, such as gene regions ofFMNL2 (2q23.3), LIMD1 (3p21.3), DDC (7p11), andWDR7 (18q21.1-q22), and regions of 22.0 cM and 49.8–50.0 cM on chromosome 5, is needed.
SOFTWARE
KBAT software was developed on the basis of lan-guage R and a user-friendly interface based on R-GUI(See Figure 7). Programs, several illustrated datasets, and a user guide are available at the KBAT website http://www.stat.sinica.edu.tw/hsinchou/genetics/association/KBAT.htm. Before using KBAT software,it is suggested that users read the user guide for softwareinstallation/initialization, function/operation, and for-mat of input/output data.
DISCUSSION AND CONCLUSION
This article proposes a nonparametric kernel-basedassociation test. The performance of the proposedmethods was examined by simulation studies and a ge-nomewide association study. Simulation results showedthat the KBAT performs well with regard to power and
false positive rate. In addition, the developed software,KBAT, provides a useful tool for users to analyze theirdata. In summary, the KBAT is simple in concept and hasseveral main features as follows.
First, the KBAT is scale invariant to marker distances.The KBAT incorporates marker weights to dilute theimpact of nuisance markers and to amplify the effect ofinformative markers. The marker weights in Equation 2are a ratio of kernel function to marker distances. Thebasic unit is eliminated. Consequently, kernel weightsare invariant to scale change of physical/genetic distances.
Second, the KBAT is able to infer disease associationat unassayed loci. Regardless of whether the anchorlocus of interest is assayed, a window is constructedby symmetrically extending two regions with a lengthequal to the bandwidth from the anchor. Continuouskernel function symmetrical to the anchor locus assignsweights to P-values within the window. If the anchor isassayed, the highest weight is assigned to the P-value ofthe anchor. If the anchor is not assayed, then the con-tinuous kernel function provides an automatic adjust-ment for the calculation of marker weights. In otherwords, the weight at the anchor is shared by othernearby assayed markers. Therefore, the KBAT can inferdisease association at any specific locus of interest.
Third, the KBAT can incorporate information aboutthe background of linkage disequilibrium. In additionto intermarker distances, information about linkagedisequilibrium can also be utilized directly. If genotypedata are available, the coefficient of linkage disequilib-
Figure 7.—Interface of theKBAT software.
1066 H.-C. Yang, H.-Y. Hsieh and C. S. J. Fann
rium can be calculated (Morton et al. 2001; Shete
2003); otherwise, the information can be gathered fromthe web site of the International HapMap Project(http://www.hapmap.org/downloads/index.html.en).The information can be used alone or jointly with in-termarker distances for weight assignment in the KBAT.This utility was also incorporated into the KBAT soft-ware. In our simulation study, the KBAT with a jointweight function of distance and linkage disequilibriumperformed similarly to the KBAT and the WPPM withdistance-only P-value weights.
The KBAT can also analyze different types of datafrom different study designs and research purposes:
1. The KBAT can be applied to genetic associationstudies without genotype data, such as pooled DNAmultilocus association tests (Sham et al. 2002; Yang
and Fann 2007). In such a study, the loss of individualgenotype information limits the capitalization ofhaplotype-based or genotyped-based multilocus as-sociation tests in such studies. The KBAT can easilyapply to perform pooled DNA multilocus associationtests by incorporating pooled DNA single-locusassociation tests (Visscher and Le Hellard 2003;Yang et al. 2005b). In addition, the KBATcan be usedfor meta-analysis (Glass 1976) where only P-valuedata are collected. P-value sequence data of diseaseassociation from different sources, e.g., several stud-ies or related publications, are merged and analyzedby the KBAT to provide an integrated conclusion.
2. The KBAT can be applied to genetic studies withdifferent study designs. For example, the KBAT caneasily adapt to unrelated case–control studies, family-based case–control studies, and quantitative traitstudies once P-values from proper single-locus asso-ciation tests are collected.
3. The KBAT has potential for different study purposes.In addition to disease gene association mapping, theKBAT also has potential to identify genetic linkageand detection of chromosomal aberrations, e.g., copynumber change and allelic imbalance.
4. The KBAT can be applied to study marker lociviolating Hardy–Weinberg equilibrium, which is thefundamental assumption of many multilocus associ-ation tests. The KBAT can circumvent this restrictionby choosing a proper single-locus association test thatis valid under Hardy–Weinberg disequilibrium. Forexample, a trend test (Armitage 1955) for a casecontrol association study can be applied.
The KBAT has several other interesting qualities. TheKBAT is a Nadaraya–Watson-type statistic (Nadaraya
1964; Watson 1964) with an underlying model—thelocal constant regression model. The model is a specialcase of local polynomials having advantages of minimaxefficiency, absence of boundary effect, and flexiblefluctuation data fitting (Fan and Gijbels 1996). Thedetermination of the degree of polynomials is a trade-
off. A large degree of polynomials improves the accuracyof curve fitting but also increases its variability andcomputational time. Further investigation of the KBATunder this extended model is worth pursuing. Addi-tionally, the KBAT is nonparametric. This strength isflexible in data analysis because this approach is notrestricted by specific parametric assumptions. However,the calculation of empirical P-values may take longerrelative to parametric approaches. The computationaltime required by the KBAT is reasonable, but intensivetime is demanded for a large-scale, whole genome scan.Further refinement of an efficient computational algo-rithm to derive null distribution is underway.
Data of alcoholism dependence analysis were provided by theCollaborative Study on the Genetics of Alcoholism (U10AA008401).This work was partially supported by a National Science Council grantof Taiwan (NSC 96-2314-B-001-005) and a National Research Programfor Genomic Medicine grant of Taiwan (NSC 97-3112-B-001-027).
LITERATURE CITED
Armitage, P., 1955 Tests for linear trends in proportion and fre-quencies. Biometrics 11: 375–386.
Bailey-Wilson, J. E., L. Almasy, M. De Andrade, J. Bailey, H. Bick-
eboller et al., 2005 Genetic Analysis Workshop 14: microsatel-lite and single-nucleotide polymorphism marker loci forgenome-wide scans. BMC Genet. 6: S1.
Benjamini, Y., and Y. Hochberg, 1995 Controlling the false discov-ery rate: a practical and powerful approach to multiple testing. J.R. Stat. Soc. B 57: 289–300.
Cardon, L. R., and J. I. Bell, 2001 Association study designs forcomplex diseases. Nat. Rev. Genet. 2: 91–99.
Chen, Y. H., and J. T. Kao, 2006 Multinomial logistic regression ap-proach to haplotype association analysis in population-basedcase-control studies. BMC Genet. 7: 43.
Churchill, G. A., and R. W. Doerge, 1994 Empirical threshold val-ues for quantitative trait mapping. Genetics 138: 967–971.
Corder, E. H., A. M. Saunders, W. J. Strittmatter, D. E. Schme-
chel, P. C. Gaskell et al., 1993 Gene dose of apolipoproteinE type 4 allele and the risk of Alzheimer’s disease in late onsetfamilies. Science 261: 921–923.
Curtis, D., B. V. North and P. C. Sham, 2001 Use of an artificialneural network to detect association between a disease and mul-tiple marker genotypes. Ann. Hum. Genet. 65: 95–107.
Doerge, R. W., and G. A. Churchill, 1996 Permutation tests formultiple loci affecting a quantitative character. Genetics 142:285–294.
Dudbridge, F., and B. P. Koeleman, 2003 Rank truncated productof p values, with application to genomewide association scans.Genet. Epidemiol. 25: 360–366.
Edenberg, H. J., D. M. Dick, X. Xuei, H. Tian, L. Almasy et al.,2004 Variations in GABRA2, encoding the alpha 2 submit ofthe GABAA receptor, are associated with alcohol dependenceand with brain oscillations. Am. J. Hum. Genet. 74: 705–714.
Edenberg, H. J., L. J. Bierut, P. Boyce, M. Cao, S. Cawley et al.,2005 Description of the data from the Collaborative Study onthe Genetics of Alcoholism (COGA) and single-nucleotide poly-morphism genotyping for Genetic Analysis Workshop 14. BMCGenet. 6: S2.
Edgington, E. S., 1972 An additive model for combining probabil-ity values from independent experiments. J. Psychol. 80: 351–363.
Encode Project Consortium, 2004 The ENCODE (ENCyclopediaof DNA Elements) Project. Science 22: 636–640.
Epanechnikov, V. A., 1969 Non-parametric estimation of a multi-variate probability density. Theory Probab. Appl. 14: 153–158.
Fan, J., and I. Gijbels, 1996 Local Polynomial Modeling and Its Appli-cations. Chapman & Hall, London.
Kernel-Based Association Test 1067

Fisher, R. A., 1925 Statistical Methods for Research Workers. Oliver &Boyd, London.
Glass, G. V., 1976 Primary, secondary, and meta-analysis of re-search. Educ. Res. 5: 3–8.
Good, I. J., 1955 On the weighted combination of significance tests.J. R. Stat. Soc. B 17: 264–265.
Guerra, R., C. J. Etzel, D. R. Goldstein and S. R. Sain, 1999 Meta-analysis by combining p-values: simulated linkage studies. Genet.Epidemiol. 17: S605–S609.
Hess, A., and H. Iyer, 2007 Fisher’s combined p-value for detectingdifferentially expressed genes using Affymetrix expression arrays.BMC Genomics 8: 96.
Hill, S. Y., S. Shen, N. Zezza, E. K. Hoffman, M. Perlin et al.,2004 A genome wide search for alcoholism susceptibility genes.Am. J. Med. Genet. (Neuropsychiat. Genet.) B 128: 102–113.
Hirschhorn, J. N., and M. J. Daly, 2005 Genome-wide associationstudies for common diseases and complex traits. Nat. Rev. Genet.6: 95–108.
Hoh, J., and J. Ott, 2003 Mathematical multi-locus approaches to lo-calizing complex human trait genes. Nat. Rev. Genet. 4: 701–709.
Hoh, J., A. Wille and J. Ott, 2001 Trimming, weighting, andgrouping SNPs in human case-control association studies. Ge-nome Res. 11: 2115–2119.
Horvath, S. X. Xu, and N. Laird, 2001 The family based associa-tion test method: strategies for studying general genotype-pheno-type associations. Euro. J. Hum. Genet. 9: 301–306.
Hugot, J. P., M. Chamaillard, H. Zouali, S. Lesage, J. P. Cezard
et al., 2001 Association of NOD2 leucine-rich repeat variantswith susceptibility to Crohn’s disease. Nature 411: 599–603.
International HapMap Consortium, 2003 The InternationalHapMap Project. Nature 426: 789–796.
International Human Genome Mapping Consortium, 2001 Aphysical map of human genome. Nature 409: 934–941.
Laird, M. N., and C. Lange, 2006 Family-based designs in the age oflarge-scale gene-association studies. Nat. Rev. Genet. 7: 385–394.
Lappalainen, J., H. R. Kranzler, I. Petrakis, L. K. Somberg, G. Page
et al., 2004 Confirmation and fine mapping of the chromosome1 alcohol dependence risk locus. Mol. Psychiat. 9: 312–319.
Lin, D., 2005 An efficient Monte Carlo approach to assessing statis-tical significance in genomic studies. Bioinformatics 21: 781–787.
Manly, B. J. F., 1998 Randomization, Bootstrap and Monte Carlo Meth-ods in Biology, Ed. 2. Chapman & Hall, New York.
Matsuzaki, H., S. Dong, H. Loi, X. Di, G. Liu et al.,2004 Genotyping over 100,000 SNPs on a pair of oligonucleo-tide arrays. Nat. Methods 1: 109–111.
Morton, N. E., W. Zhang, P. Taillon-Miller, P. Y. Kwok and A. Col-
lins, 2001 The optimal measure of allelic association. Proc.Natl. Acad. Sci. USA 98: 5217–5221.
Nadaraya, E. R., 1964 On estimating regression. Theory Prob.Appl. 9: 141–142.
Nelson, M. R., S. L. R. Kardia, R. E. Ferrell and C. F. Sing, 2001 Acombinatorial partitioning method to identify multilocus geno-typic partitions that predict quantitative trait variation. GenomeRes. 11: 458–470.
Rabinowitz, D., and N. M. Laird, 2000 A unified approach to ad-justing association tests for population admixture with arbitrarypedigree structure and arbitrary missing marker information.Hum. Hered. 50: 211–223.
Ritchie, M. D., L. W. Hahn, N. Roodi, L. R. Bailey, W. D. Plummer
et al., 2001 Multifactor dimensionality reduction reveals high-order interactions among estrogen metabolism genes in sporadicbreast cancer. Am. J. Hum. Genet. 69: 138–147.
Sas Institute, 2005 SAS/Genetics User’s Guide. Cary, NC.Sasieni, P. D., 1997 From genotypes to genes: doubling the sample
size. Biometrics 53: 1253–1261.
Schaid, D. J., C. M. Rowland, D. E. Tines, R. M. Jacobson and G. A.Poland, 2002 Score tests for association between traits and hap-lotypes when linkage phase is ambiguous. Am. J. Hum. Genet. 70:425–434.
Seaman, S. R., and B. Muller-Myhsok, 2005 Rapid Simulation of Pvalue for product methods and multiple testing adjustment in as-sociation studies. Am. J. Hum. Genet. 76: 399–408.
Sham, P., J. S. Bader, I. Craig, M. O’Donovan and M. Owen,2002 DNA pooling: a tool for large-scale association studies.Nat. Rev. Genet. 3: 862–871.
Shete, S., 2003 A note on the optimal measure of allelic association.Ann. Hum. Genet. 67: 189–191.
Steemers, F. J., and K. L. Gunderson, 2007 Whole genome geno-typing technologies on the BeadArray platform. Biotechnol. J. 2:41–49.
Stouffer, S. A., E. A. Suchman, L. C. Devinney, S. A. Star and R. M.Williams, Jr., 1949 The American Soldier, Vol. 1: Adjustment Dur-ing Army Life. Princeton University Press, Princeton, NJ.
Sun, Y. V., A. M. Levin, E. Boerwinkel, H. Robertson and S. L. R.Kardia, 2006 A scan statistic for identifying chromosomal pat-terns of SNP association. Genet. Epidemiol. 30: 627–635.
Tippett, L. H., 1931 The Methods of Statistics. Williams and Norgate,London.
Visscher, P. M., and S. Le Hellard, 2003 Simple method to analyzeSNP-based association studies using DNA pools. Genet. Epide-miol. 24: 291–296.
Wang, W. Y. S., B. J. Barratt, D. G. Clayton and J. A. Todd,2005 Genome-wide association studies: theoretical and practi-cal concerns. Nat. Rev. Genet. 6: 109–118.
Watson, G. S., 1964 Smooth regression analysis. Sankhya A 26: 359–372.
Wellcome Trust Case Control Consortium, 2007 Genome-wideassociation study of 14,000 cases of seven common diseases and3,000 shared controls. Nature 447: 661–678.
Wille, A., J. Hoh and J. Ott, 2003 Sum statistics for the joint de-tection of multiple disease loci in case-control association studieswith SNP markers. Genet. Epidemiol. 25: 350–359.
Yang, H. C., and C. S. J. Fann, 2007 Association mapping usingpooled DNA, pp. 161–176 in Linkage Disequilibrium and AssociationMapping, edited by A. Collins. Humana Press, Clifton, NJ.
Yang, H. C., C. C. Chang, C. Y. Lin, C. L. Chen, C. Y. Lin et al.,2005a A genome-wide scanning and fine mapping study ofCOGA data. BMC Genet. 6: S30.
Yang, H. C., C. C. Pan, R. C. Y. Lu and C. S. J. Fann, 2005b New ad-justment factors and sample size calculation in a DNA-poolingexperiment with preferential amplification. Genetics 169: 399–410.
Yang, H. C., C. Y. Lin and C. S. J. Fann, 2006 A sliding-windowweighted linkage disequilibrium test. Genet. Epidemiol. 30:531–545.
Zaykin, D. V., and K. Shibata, 2008 Genetic flip-flop without an ac-companying change in linkage disequilibrium. Am. J. Hum.Genet. 82: 794–796.
Zaykin, D. V., P. H. Westfall, S. S. Young, M. A. Karnoub, M. J.Wagner et al., 2002a Testing association of statistically inferredhaplotypes with discrete and continuous traits in samples of un-related individuals. Hum. Hered. 53: 79–91.
Zaykin, D. V., L. A. Zhivotovsky, P. H. Westfall and B. S. Weir,2002b Truncated product method for combining P values.Genet. Epidemiol. 22: 170–185.
Communicating editor: R. W. Doerge
1068 H.-C. Yang, H.-Y. Hsieh and C. S. J. Fann