kesko presentation
TRANSCRIPT

1
KESKO PRESENTATION
SEPTEMBER 2016MIKKO HELANDER

• Net sales €8,993m
• Operating profit* €253m
• ROCE* 12.6%
• Personnel 30,000
• Shareholders 40,000
• Market capitalisation €3.7bn (June 30, 2016)
* comparable
2
KESKO Q2/2016ROLLING 12 MO

OPERATIONS IN THREE DIVISIONS
3
Grocery trade Building and technical trade
Car trade
• Some 1,500 retaileroperated stores in Finland and 9 in Russia
• Net sales €4.9bn• #2 in the Finnish
market
• Some 700 stores in 9 countries
• Net sales €3.3bn• #1 in the Finnish
building and home improvement market
• Sole importer of VW, Audi and Seat+10 stores
• Net sales €0.8bn• VW #1 in first
registrations

NET SALES BY DIVISION Q2/2016
€1,353m 52%€1,046m
40%
€214m 8%
Grocery trade +2.3%*total change +17.7%
Building and technicaltrade +6.7%*total change +18.4%
Car trade +12.1%
4
* in local currencies, excluding acquisitions

5
OPERATIONS IN NINE COUNTRIES
Norway5% Sweden
2%
Finland81%
Lithuania4%
Latvia1%
Estonia2%
Russia4%
Belarus1%
Retail sales, € million, 2015 (excl. Suomen Lähikauppa and Onninen)Finland 8,927Sweden 209Norway 664Estonia 136Latvia 90Lithuania 366Russia 311Belarus 116
Poland

• K-Group’s pro forma sales €13.4bn
• Operations in nine countries
• Number of personnel around 50,000
• Third largest retailer in northernEurope
6
K-GROUP TODAY
After the acquisition of Suomen Lähikauppa and Onninen

GROWTH STRATEGY
• Growth of the grocery trade particularly in Finland
• Growth of the building and technical trade and expansion in Europe
• Growth of the car trade particularly in Finland
7
7

Real estatearrangementDivestment of
Anttila
Kesko Senukaiarrangement in the Baltic countries
Acquisition of Suomen Lähikauppa
Acquisition of Onninen
8
STRATEGY IMPLEMENTATION IS PROGRESSING
One unified Kesko – the customer and quality in everything we do

GROWTH STRATEGY IS BECOMING REALITYNET SALES PERFORMANCE, Q/Q
-10
-5
0
5
10
15
20
2012 2013 2014 2015 2016
9
%

GROCERY TRADE
10

KESKO GROCERY TRADE
11
Net sales €4,867m
Operating profit* €174m
Operating margin* 3.6%
ROCE* 22.2%K-Group 32.7%S-Group 45.9%Lidl 8.3%Suomen Lähikauppa 6.4%Others 6.7%
Total market €16.6 billion in 2015
Source: Nielsen
* comparable
Q3/2015-Q2/2016

RETAIL STORESSales 2015€ million, VAT 0%
Number of stores at 31.12.2015
Concept
1,505+575 81 Hypermarket
1,716 219 Supermarket
1,189 476 Neighbourhoodstore
Siwa and Valintatalo stores 936 600 Neighbourhood
store
106 9 Compact hyper, Russia
Others 122 108 Incl. online store
12

13
GROCERY TRADE STRATEGY PROGRESSING AS PLANNED
• Renewal of neighbourhood store network and conversion of Siwa and Valintatalo stores into K-Markets
• 70 renewed Neste K service station stores by 2017, of which 25 completed in 2016
• Renewal of K-citymarket chain
• Best digital services in the tradingsector

INTEGRATION OF SUOMEN LÄHIKAUPPA• Conversion of Siwa and Valintatalo stores into
K-Markets
• K-neighbourhood store selection and Pirkka products introduced
• Prices as much as 20% lower
• Conversion has progressed faster than planned
• Some 90 stores already converted, over 200 bythe end of 2016
• Average increase of 6% over last year in customervisits of stores converted into K-Markets
• Net sales of stores converted into K-Markets haveimproved by an average of 12% compared to theperformance of the first months of the year
14

ACQUISITION OF SUOMEN LÄHIKAUPPA -FINANCIAL IMPACTS
• Synergy benefits are estimated at approximately €25–30 million at EBITDA level as of 2018• Requires conversion costs for the renewal of the stores acquired from
Suomen Lähikauppa. The costs of store and network conversion, to be treated as non-recurring restructuring cost, will total approximately €30 million in 2016–2018.
15

K-CITYMARKET CHAIN RENEWAL
• K-citymarket renewal to be implemented in 23 stores by 12/2016
• Future new K-citymarket stores: Helsinki Itäkeskus in autumn 2017 and Sastamala in spring 2017
• Renewal of non-food departments has begun
• Self-service checkout testing ongoing at KCM Helsinki Ruoholahti, feedback from customers very positive
• Posti service points already at 25 K-citymarket stores
• Next Starbucks to open at KCM Jumbo in Vantaa on 19 August
16

BUILDING AND TECHNICAL TRADE
17
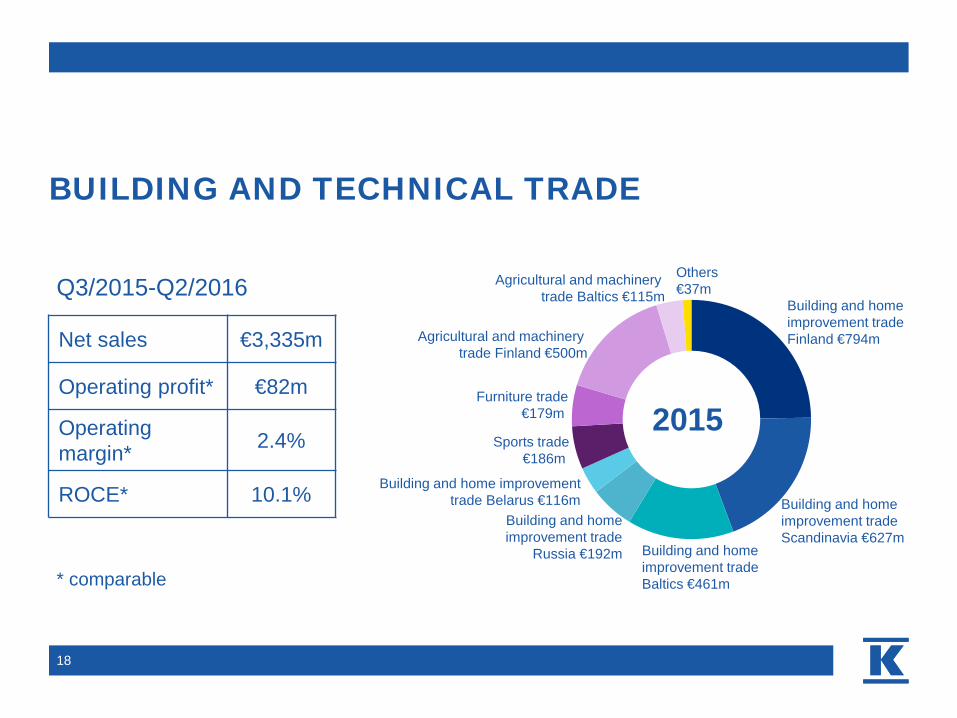
BUILDING AND TECHNICAL TRADE
18
Net sales €3,335m
Operating profit* €82m
Operatingmargin* 2.4%
ROCE* 10.1%
Sports trade€186m
Furniture trade€179m
Agricultural and machinery trade Finland €500m
Others€37m
Building and home improvement trade Belarus €116m
Building and home improvement trade
Russia €192m
Building and homeimprovement tradeFinland €794m
Building and homeimprovement tradeScandinavia €627m
Building and home improvement trade Baltics €461m
Agricultural and machinery trade Baltics €115m
* comparable
2015
Q3/2015-Q2/2016

15.214.2
5.6 5.2 4.3 3.5 2.6
0
4
8
12
16
GroupeAdeo
Kingfisher OBI Bauhaus K-groupand
Onninen
Hornbach WolseleyNordic
Net sales, 2015
KESKO AND K-GROUP ONE OF THE LEADERS IN ITS FIELD IN EUROPE
Source: Companies’ annual reports, websites, Kingfisher excl. B&Q ChinaBauhaus: Dähne Statistics DIY Europe, estimate
€bn
195/2015

GOOD PROFIT PERFORMANCE IN THE BUILDINGAND TECHNICAL TRADE DIVISION
• Good sales performance• Strong growth in B2B trade
• Profitability improved especially in the Baltics, Sweden and Norway
• Kesko Senukai’s profitability good• Market still has significant growth
potential
20
0
10
20
30
40
50
60
70
80
90
Comparable rolling 12 mo operating profit
M€

STRENGTHENING OF PROFITABILITY AND GROWTH
• Combination of Onninen and Kesko to become the strongest B2B entity in themarket
• Widest selection in the market
• Most comprehensive store network and largest sales organisation of northern Europe
• Most customer oriented logistics and digitalservices for B2B customers
• Realisation of synergies has started
21

ACQUISITION OF ONNINEN - SIGNIFICANTECONOMIES OF SCALE AND SYNERGIES
• From common customer relationships• From purchasing and logistics• From store site network development• From ICT and administration• From efficient employment of capital
• Full synergies at EBITDA level around €30 million per year as of 2020• Combined net cash flow impact of synergies estimated at around €25 million
positive in 2016-2019
22

Belarus 3% Russia 4%
Finland 45% €1.9bn
Sweden 9%
Baltics 12%
K-Group and Onninen, breakdown of 2015 retail sales €4.3bn (pro forma)STRONG OPERATOR IN EUROPE
23
Norway 22%
Poland 5%Foreign countries 55%
€2.4bn

GROWTH FROM EUROPE AND B2B SALES
• Growth from both B2C and B2B sales
• Strengthening of market position in Finland
• Accelerating of growth and furtherstrengthening of positions in Scandinavia
• Boosting Kesko Senukai’s growth
24
Current operating country Poland with acquisition of Onninen as of 1 June

25
LARGE GROWTH POTENTIAL
Country Market size, €bn Kesko’s market share
Finland 3.1 40%Sweden 4.3 5%Norway 4.0 17%Estonia 0.4 24%Latvia 0.4 12%Lithuania 0.5 30%Russia 9.2 7%*Belarus 1.4 10%Poland 5.7 -
*St. Petersburg and Moscow regions

CAR TRADE
26

CAR TRADE
27
Net sales €786m
Operating profit* €25m
Operating margin* 3.2%
ROCE* 22.5%
Volkswagen 11.0%
Toyota 10.8%
Skoda 9.7%
Ford 8.1%
Volvo 6.3%
Nissan 6.1%
Kia 6.1%
Audi 5.2%
Seat 2.0%
Others 34.7%* comparable
Q2/2016
Q3/2015-Q2/2016

28
MAXIMISING VALUE CREATION ALSO IN OTHERBUSINESSES
• Important to have the best platform for Kesko’s small and medium sized businesses to succeed in tight competition• Furniture trade (Finland and Estonia)• Agricultural trade (Finland)• Machinery trade (Finland and the Baltic countries)• Shoe trade (Finland)• Sports trade (Finland)
• All options which improve competitiveness of other businesses and retailer entrepreneurs are possible

FINANCIALS
29

NET SALES BY QUARTERQ2 GROWTH 17.2%, IN LOCAL CURRENCIES EXCL. ACQUISITIONS 4.6%
30
3,000
2,000
1,500
500
0
2,500
1,000
2,610
2,2032,371
2,227
Q1
2,129
Q3
2,082
Q4
2,166
Q2
2,3042,013
2,267
€m20152014 2016

OPERATING PROFITCOMPARABLE, BY QUARTER
31
62
84
68
19
59
8276
27
79
32
0
20
40
60
80
100
Q4Q3Q2Q1
€m20162014 2015

32
FINANCIAL TARGETS ANDCAPITAL EXPENDITURE
• Return on capital employed 14%
• Return on equity 12%
• Interest bearing net debt / EBITDA < 2.5
• Capital expenditure in 2015–2017 approximately €750 million• Excluding possible acquisitions
Dividend policy: Kesko Corporation distributes at least 50% of its comparable earnings per share as dividends, taking however the company's financial position and operating strategy into account.

RETURN ON CAPITAL EMPLOYEDCOMPARABLE, ROLLING 12 MO
33
14.0 13.1
9.0 9.8 9.911.7 12.6
0
4
8
12
16
2010 2011 2012 2013 2014 2015 Q2 2016
%Target14%

RETURN ON CAPITAL EMPLOYED BY DIVISIONCOMPARABLE, ROLLING 12 MO
34
Group totalBuilding and technical trade
Grocery trade Car trade
%
22.2
10.1
22.5
12.6
0
5
10
15
20
25
30

35
050
100150200250300350400450
2006 2007 2008 2009 2010 2011 2012 2013 2014 2015
Capital expenditure in store sites Acquisitions Other capital expenditure
average
CAPITAL EXPENDITURE
€m

STRONG FINANCIAL POSITION
36
30.6.2016 30.6.2015
Equity ratio, % 44.8 52.2
Liquid assets, €m 327 843
Interest-bearing net debt, €m 330 -359
Cash flow from operating activities, H1, €m -18 68
Capital expenditure, H1, €m 564 110

EARNINGS / SHARE AND DIVIDEND
37
2010 2011 2012 2013 2014 2015
2.5
2.0
1.5
1.0
0.5
0.0
2.50
1.701.50
1.651.40
1.68
1.201.47
1.20
1.84
1.30
1.78
DividendEarnings / share, comparable
€€

38
REAL ESTATE IN 2015
38
Owned properties
Country Area, 1,000 m2
Finland 540
Other Nordic countries 66
Baltic countries and Belarus 109
Russia 191
TotalCarrying amount
906€1,107m
Leased properties total1,000 m2 2,951
Classification
Strategic properties 64%
Standard properties 26%
Development properties 9%
Realisation properties 1%

39
SHAREHOLDERS 7/2016
The largest registeredshareholders by number of shares
Foreign ownership of B shares 44%
1 K-retailers´ Association 3,942,746 3.94
2 Vähittäiskaupan Takaus Oy 3,491,771 3.49
3 Kruunuvuoren Satama Oy 3,438,885 3.44
4Ilmarinen Mutual Pension Insurance Company 1,990,632 1.99
5 Valluga-sijoitus Oy 1,340,439 1.34
6Varma Mutual Pension Insurance Company 1,130,986 1.13
7Foundation for Vocational Training in the Retail Trade 1,127,533 1.13
8 Oy The English Tearoom Ab 1,000,000 1.00
9 The State Pension Fund 950,000 0.95
10 Elo Pension Company 896,968 0.90
%

MARKET SITUATION AND OUTLOOK
40

0
2
4
6
8
10
12
14
16
1/00
7/00
1/01
7/01
1/02
7/02
1/03
7/03
1/04
7/04
1/05
7/05
1/06
7/06
1/07
7/07
1/08
7/08
1/09
7/09
1/10
7/10
1/11
7/11
1/12
7/12
1/13
7/13
1/14
7/14
1/15
7/15
1/16
7/16
Expectations for own finances
Expectation, 21st centuryaverage
CONSUMER CONFIDENCE IN FINLAND
41
odotukset omasta taloudesta seuraavan 12 kk:n kuluttua
Source: Statistics Finland

-2,0
0,0
2,0
4,0
6,0
8,0
10,0
1/20
132/
2013
3/20
134/
2013
5/20
136/
2013
7/20
138/
2013
9/20
1310
/201
311
/201
312
/201
31/
2014
2/20
143/
2014
4/20
145/
2014
6/20
147/
2014
8/20
149/
2014
10/2
014
11/2
014
12/2
014
1/20
152/
2015
3/20
154/
2015
5/20
156/
2015
7/20
158/
2015
9/20
1510
/201
511
/201
512
/201
51/
2016
2/20
163/
2016
4/20
165/
2016
6/20
16la
test
mon
th
Estonia
Lithuania
Sweden
Norway
Latvia
Finland
RETAIL TRADE TRENDS IN OPERATING COUNTRIESROLLING 12 MO
42
Source: Eurostat, excl. motor vehicles and fuels
% (r
ollin
g12
mo)
Latestmonth

43
OUTLOOKEstimates for the outlook of Kesko Group's net sales and comparable operating profit are given for the 12-month period following the reporting period (7/2016-6/2017) in comparison with the 12 months preceding the end of the reporting period (7/2015-6/2016).
The general economic situation and the expected trend in consumer demand vary in Kesko’s different operating countries. In Finland, owing to the weak trend in consumers’ purchasing power, the trading sector’s growth is expected to remain slow. In the Finnish grocery trade, intense competition is expected to continue. The markets for the Finnish building and technical trade are expected to improve slightly. With respect to foreign countries, the outlook for the Russian economy is still modest. In Sweden and Norway and the Baltic countries, the market is expected to grow.
Kesko Group's net sales for the next 12 months are expected to exceed the level of the preceding 12 months. The comparable operating profit for the next 12-month period is expected to exceed the level of the preceding 12 months.

44
THE WORLD’S MOST SUSTAINABLE RETAIL OPERATOR
Davos, January 2015 and 2016:’The Global 100 Most SustainableCorporations in the World’ list.

KESKO IS THE MOST RESPONSIBLE FOOD AND STAPLES RETAILER IN THE WORLD
45
In 2015, Kesko rose to CDP’s Climate A List for the first time
At the top of the Nordic Climate Disclosure Leadership climate index since 2011. In 2015, Kesko was awarded the full 100 points
In ’The Global 100 Most Sustainable Corporations in the World’ list since 2005
Included in the FTSE4Good index since 2009
Included in the STOXX Global ESG Leaders index family since 2011
Included in the Dow Jones sustainability indexes DJSI World and DJSI Europe 2003-2014

46
HALF YEARFINANCIAL REPORT
Q2 2016 MIKKO HELANDER
3 AUGUST 2016

Q2 HIGHLIGHTS• Kesko’s net sales increased markedly, by 17.2%. Growth in local currencies,
excluding acquisitions, was 4.6%
• Acquisitions of Suomen Lähikauppa and Onninen were completed during thesecond quarter
• Comparable operating profit increased to €79.1 million (€76.4 million)
• Return on capital employed continued to rise and was 12.6% (10.9%)
• In the grocery trade, good profitability, acquisition of Suomen Lähikauppa significantly increased net sales
• In the building and technical trade, growth strengthened organically and withthe acquisition of Onninen. Profitability continued to improve
• In the car trade, sales increased markedly, profitability at a good level
47

KEY PERFORMANCE INDICATORS
48
Q2/2016 Q2/2015 H1/2016 H1/2015
Net sales, €m 2,610 2,227 4,624 4,310
Operating profit*, €m 79.1 76.4 111.4 102.9
Operating margin*, % 3.0 3.4 2.4 2.4
Profit before tax*, €m 79.2 72.7 113.7 99.1
Earnings per share*, € 0.59 0.52 0.85 0.71
Return on capital employed*, %, rolling 12 mo 12.6 10.9
Return on equity*, %, rolling 12 mo 9.4 8.4
*Comparable

49
GROCERY TRADE

GROCERY TRADE, Q2
• Acquisition of Suomen Lähikauppa completed in April
• K-Group’s grocery sales +14.9%, Suomen Lähikauppa excluded, -0.3%• Change in grocery market prices around -1%• Strengthening of quality and price competitiveness progressed as
planned
• Profitability at a good level due to enhancement actions taken
• Renewal of Kesko’s neighbourhood retail services making fast progress• All of the over 400 K-Markets will be renewed• Siwa and Valintatalo stores acquired from Suomen Lähikauppa to be
converted into K-Markets
50

NET SALESQ2 GROWTH 17.7%, IN LOCAL CURRENCIES EXCL. ACQUISITIONS 2.3%
51
500
1,000
1,500
2,500
2,000
0H1/2016
2,447
H1/2015
2,252
Q2/2016
1,353
Q2/2015
1,149
€m

OPERATING PROFITCOMPARABLE
52
0
20
40
60
80
H1/2015
78.2
Q2/2016
43.6
Q2/2015
43.3
74.8
H1/2016
€m

53
BUILDING AND TECHNICAL TRADE

BUILDING AND TECHNICAL TRADE, Q2
• Net sales growth 18.4%, in local currencies, excluding Onninen, 6.7%• Sales in B2B trade strengthened• Sales in local currencies increased in all operating countries
• Acquisition of Onninen completed at the beginning of June and will significantlystrengthen the division’s growth strategy• Significant synergy potential
• Profitability improved by increased operating profit in the building and home improvement trade in the Nordic and Baltic countries, the acquisition of Onninen and the good profit performance of the leisure trade
• During the reporting period, a decision was made in the building and technical trade to combine the Rautia and K-rauta stores into a new K-rauta chain in spring 2017. At the same time, all of the 140 building and home improvement stores in Finland will be revamped
54

NET SALESQ2 GROWTH 18.4%, IN LOCAL CURRENCIES EXCL. ACQUISITIONS 6.7%
55
883
500
1,000
1,500
2,000
0
1,656
Q2/2016
1,046
Q2/2015 H1/2016
1,741
H1/2015
€m

OPERATING PROFITCOMPARABLE
56
0
20
40
Q2/2016
37.9
H1/2016
38.2
H1/2015
20.3
Q2/2015
34.5
€m

57
CAR TRADE

CAR TRADE, Q2
• In the car trade, total market performance was strong in April-June
• VV-Auto’s net sales growth +12.1%• Combined market share of Volkswagen, Audi and Seat passenger cars
and vans in April-June 18.7%
• Profitability remained at a good level, operating profit €5.8 million
• VV-Auto’s order books strengthened markedly from the previous year
58

NET SALESQ2 GROWTH +12.1%
59
438400
214190
0
250
500
H1/2016H1/2015Q2/2016Q2/2015
€m
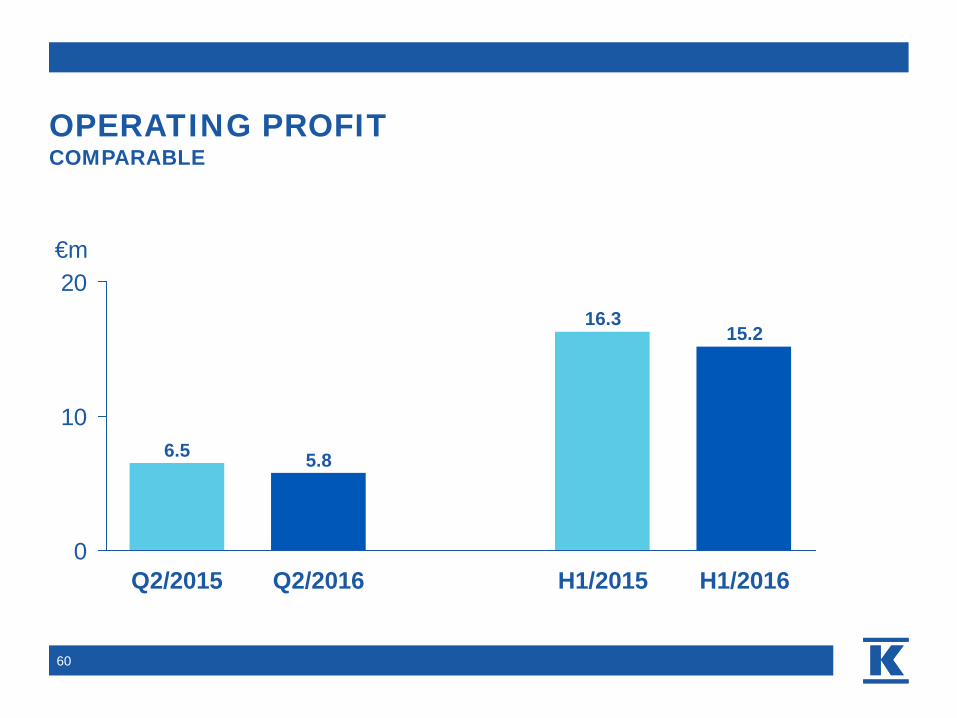
OPERATING PROFITCOMPARABLE
60
0
10
20
H1/2016
15.2
H1/2015
16.3
Q2/2016
6.5 5.8
Q2/2015
€m

K-PLUSSA TO BE REVISED AND NEW K-KAMPUS TO BE BUILT IN KALASATAMA, HELSINKI
• A key role in the implementation of Kesko’s strategy is also played by therevision of K-Plussa. In the future, the revised K-Plussa will be the mostrewarding customer loyalty programme and offer the best digital services.
• The new K-kampus will also take the one, unified Kesko a leap forward. K-kampus will be built in Kalasatama, Helsinki, in cooperation with Varma. Kampus will be completed in spring 2019 and it will bring together around1,700 Kesko employees.
61

