kevin jackson matt osborne head of risk
TRANSCRIPT

CLICK TO EDIT MASTER TITLE STYLE
Kevin JacksonLead Consultant
Matt OsborneHead of Risk
Robin PrestonSales Director
ENERGY PROCUREMENT
Understanding risk and how to manage it!

CLICK TO EDIT MASTER TITLE STYLE
UNDERSTANDING RISKAND HOW TO MANAGE IT. • What does risk
mean to you?

CLICK TO EDIT MASTER TITLE STYLEEVOLUTION OF THE ENERGY MARKET
1968 - Inenco
30.00
40.00
50.00
60.00
70.00
80.00
90.00
100.00
110.00
30.00
40.00
50.00
60.00
70.00
80.00
90.00
100.00
110.00
Oct
-200
5Ja
n-20
06A
pr-2
006
Jul-2
006
Oct
-200
6Ja
n-20
07A
pr-2
007
Jul-2
007
Oct
-200
7Ja
n-20
08A
pr-2
008
Jul-2
008
Oct
-200
8Ja
n-20
09A
pr-2
009
Jul-2
009
Oct
-200
9Ja
n-20
10A
pr-2
010
Jul-2
010
Oct
-201
0Ja
n-20
11A
pr-2
011
Jul-2
011
Oct
-201
1Ja
n-20
12A
pr-2
012
Jul-2
012
POWER PRICE £/MWh
GAS PRICE P/THERM
Gas and Power Forward Prices
GasPrices
1879 Edison’s lightbulb moment
2017 –Today
1986 – Gas Act
1st April 1990 – 1MW1800s - Volta / Franklin
1st April 1994 -100kW - HH
27th March 2001- NETA
1st April 1998 - Sub 100 - NHH

CLICK TO EDIT MASTER TITLE STYLEWHAT CAN YOU BUY, WHEN AND WHERE FROM?
Prebon Spectron
ICAP
GFI ICE

CLICK TO EDIT MASTER TITLE STYLETHE EVOLUTION OF THE ENERGY MARKET
0
20
40
60
80
100
120
140
160
180
£/M
Wh
Day Ahead (UKBaseload) (£/MWh)
Day Ahead (UKBaseload) (£/MWh)
THE PAST: BETTA
UK Energy markets begin liberalization in 2001-02 (NETA).Single GB market in 2005 (BETTA)Access to wholesale market participation widensControlling energy cost becomes a bumpy ride!!!!
Demand begins to outstrip supply (lack of import responsiveness & storage capacity) and commodities “super cycle” takes off
Global recession and the financial crisis brought an abrupt end to rising prices
Weak renewables andFrench nuclear
offline
Relative stability/gradual decline
Commodities “super cycle”peaks – oil touches $147/bbl

CLICK TO EDIT MASTER TITLE STYLE
FIXED PRICE
CAPPED/ LOCK/UNLOCK
TECHNICAL ANALYSIS
PROMPT TRADING
WHOLESALE
EVOLUTION OF TRADING
1990 2013+2003 2008
Risk
Man
agem
ent
High
UK Electricity Market Deregulated
April 2001NETA Introduced
Increased Volatility Gasand Power Prices Spike
Timeline
Further Developments in the Market
2001

CLICK TO EDIT MASTER TITLE STYLEYOUR BILL
What impacts what you pay
Taxes & Levies15 – 20%
Transportation & Distribution30 – 40%
Supplier Costs 5%
Commodity45% - 55%

CLICK TO EDIT MASTER TITLE STYLESO WHERE TO START
What isyour Goal?
What are youtrying to achieve?

CLICK TO EDIT MASTER TITLE STYLEBUYING ENERGYWHAT ARE YOU TRYING TO ACHIEVE
Budget Certainty?Best Price?

CLICK TO EDIT MASTER TITLE STYLEINENCO’S PROCUREMENT STRATEGY
‘Buying energy is all about knowing what you want to achieve and then managing the risk to secure the right balance between price and budget certainty for BOTH commodity and non commodity elements’
RISK LOWHIGHBEST PRICE BUDGETCERTAINTY
PromptYou take the risk
CappedShared Risk
FixedSupplier takes Risk
Pass ThroughYou take the risk
Partially FixShared Risk
Fully FixSupplier takes Risk
Commodity
Non-Commodity

CLICK TO EDIT MASTER TITLE STYLE
UNDERSTANDING THE ENERGY MARKET & STRATEGY DEVELOPMENTThe Energy Markets What gives
the market direction?

CLICK TO EDIT MASTER TITLE STYLE1. UNDERSTANDING THE MARKET : KEY TOOLS

CLICK TO EDIT MASTER TITLE STYLETHE RIGHT VIEW
Prebon Spectron ICAP GFI
We ensure we have full access to the wholesale market
Our bespoke trading system consolidates all broker screens so wecan identify truemarket value
ICE

CLICK TO EDIT MASTER TITLE STYLEASSESS THE MARKET
We combine technical & fundamental analysis
Technical
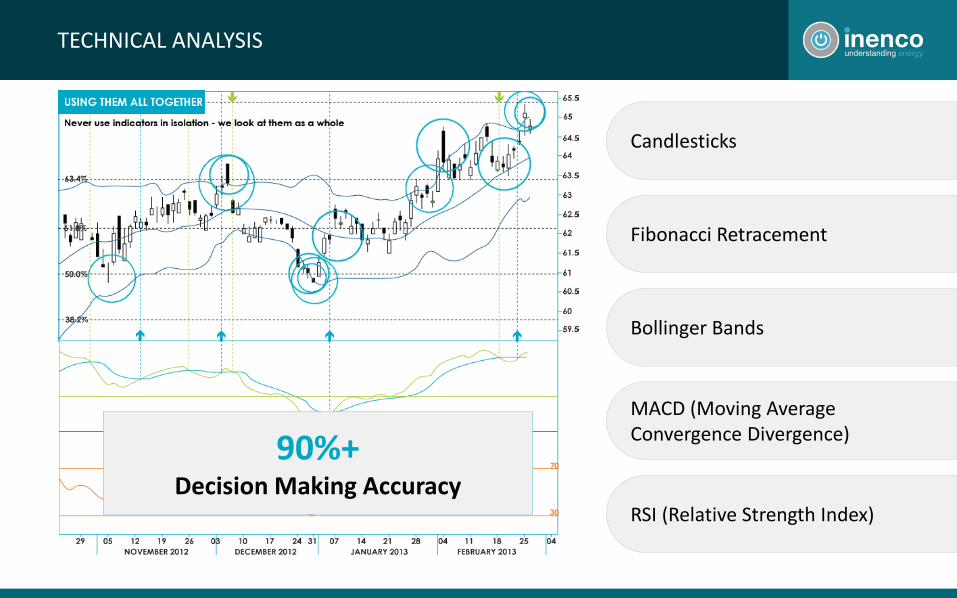
CLICK TO EDIT MASTER TITLE STYLETECHNICAL ANALYSIS
Candlesticks
Bollinger Bands
MACD (Moving Average Convergence Divergence)
RSI (Relative Strength Index)
Fibonacci Retracement
90%+Decision Making Accuracy

CLICK TO EDIT MASTER TITLE STYLE2. CURRENT MARKET DRIVERS

CLICK TO EDIT MASTER TITLE STYLECURRENT PRICE DRIVERS
MacroeconomicEU Zone debt Demand – EMBrexit Fundamentals
LNG - US/AUS Weather Margins & renewable outputStorage
GeopoliticsMiddle East OPEC vs Market UkraineN. Korea
Technical AnalysisMarket uptrend still intact?
Longer termLCPD/MCPDShale Development LNG – Asian Demand

CLICK TO EDIT MASTER TITLE STYLE
Bullish Bearish
CRUDE OIL

CLICK TO EDIT MASTER TITLE STYLEOIL
Brent touches $59/bbl as Turkey threatens to cut off the northern Iraq pipeline.
OPEC production cut compliance at c90%.
US refinery’s at c90% capacity following hurricanes Harvey and Irma.
EIA reports surprise fall in US stockpiles – 6m bbldrawdown vs forecast 0.5m bbl.
Recent $ strength could limit upside.
US production continues to increase (drilling technology & efficiency improvements.
Rig count remains high.
OPEC getting desperate? Calls for US shale producers to join production cuts.

CLICK TO EDIT MASTER TITLE STYLE
Bullish Bearish
GAS & POWER
£

CLICK TO EDIT MASTER TITLE STYLEAN EVOLVING GENERATION MIX
Source:National Grid Future Energy ScenariosInstalled generation by type –No Progression

CLICK TO EDIT MASTER TITLE STYLELNG – THE NEXT ENERGY BUBBLE?
Global LNG output to rise by c47% by 2020 & Demand insufficient to absorb the scale of new capacity

CLICK TO EDIT MASTER TITLE STYLESO WHERE NEXT FOR PRICES?
Technical Indication:
• Key resistance level continues to provide a ceiling for prices.
• Failure to break through has provided some near term bearish sentiment, which could test initial support levels.
Gas – Winter’18

CLICK TO EDIT MASTER TITLE STYLESO WHERE NEXT FOR PRICES?
Technical Indication:
• Recently broken through contract highs.
• Some softening but upward trend channel is still intact.
• Overall fundamentals indicate further bullish momentum, however OPEC production could change this outlook.
• Support and resistance levels in line with the trend lines.
Power – Winter’18

CLICK TO EDIT MASTER TITLE STYLEELECTRICITY PRICE FORECAST
Forward thinking is critical
Prices pose more upside risk than further downside potential
35
40
45
50
55
60
2012 2013 2014 2015 2016 2017 2018 2019 2020 2021
£/MWh Wholesale UK Power Price Forecast
High/Low Range Historical Normal

CLICK TO EDIT MASTER TITLE STYLE3. HOW TO MANAGE SUCH RISK : KEY STEPS

CLICK TO EDIT MASTER TITLE STYLEA) ESTABLISH A RISK MANAGEMENT STRATEGY IMPLEMENTATION PROCESS
MONITORRESULTS IDENTIFY &
ANALYSE EXPOSURES
EXAMINE RISK MANAGEMENT
TECHNIQUES
SELECT RISK MANAGEMENT
TECHNIQUE
IMPLEMENT TECHNIQUES
RISKMANAGEMENT

CLICK TO EDIT MASTER TITLE STYLEB) UNDERSTAND YOUR PRIORITIES
CERTAINTYAn exact price upfront
OPTIMISATIONChase the best price using risk management
PROTECTIONAn upper limit for budgeting

CLICK TO EDIT MASTER TITLE STYLEC) UNDERSTAND YOUR RISK-REWARD PROFILE
Performance
Risk
Prompt StrategyOptimise
Trend StrategyCapitalise
Fixed StrategyCertainty
Capped StrategyProtect
Use risk mapping & tolerance exercises to reach consensus!

CLICK TO EDIT MASTER TITLE STYLED) THINK ABOUT THE BIGGER PICTURE :BUDGETING – FULLY DELIVERED FORECASTING
Commodity Element 2015 2016 2017 2018 2019 2020 Key drivers/assumptionsLow 38 38.1 39.6 41 41.8 42.8 Low oil price forecast, declining power demand and low NBP price forecast
Base 40.1 40.9 43.2 44.6 45.2 46.2 Normal oil price forecast, static power demand and normal price forecast
High 50 52.3 52.7 53.9 55.3 56.3 High oil price forecast, increasing power demand and high NBP price forecast
Commodity Price Forecast (£/MWh) – illustrative only
Non-Commodity Element 2015 2016 2017 2018 2019 2020 Key drivers/assumptionsD and T Losses 0.33 0.33 0.33 0.33 0.33 0.33 Average across large section of supplies
BSUOS 0.21 0.22 0.23 0.24 0.25 0.26 Average across large section of supplies
DUOS 1.87 1.96 1.87 1.96 1.96 1.96 Average across large section of supplies
TNUOS (Triad) 0.72 0.81 0.95 1.09 1.22 1.37 Average across large section of supplies
CFD 0.00 0.00 0.00 0.00 0.00 0.00 Should remain fairly level during next few years
FIT 0.41 0.48 0.53 0.56 0.60 0.62 Uptake has slowed but the belief is that is will still rise faster than inflation
Capacity Market 0.00 0.00 0.00 0.00 0.00 0.00 Should remain fairly level during next few years
RO 1.29 1.37 1.40 1.40 1.40 1.40 Will rise for a couple of years before stagnating as no new renewable projects will be financed via this source
Other 0.024 0.02 0.02 0.02 0.02 0.02 Should remain fairly level during next few years
CCL 0.55 0.56 0.57 0.58 0.60 0.61 Subject to government legislation –should rise with inflation
Total (p/KWh) 2015 2016 2017 2018 2019 2020Low 5.53 6.13 6.43 7.34 7.94 8.70 (-3%)
Normal 5.70 6.32 6.62 7.57 8.19 8.98 As per assumptions above
High 5.99 6.63 6.96 7.95 8.60 9.42 (+5%)
Non Commodity Price Forecast (p/KWh) – illustrative only
Illustrative only

CLICK TO EDIT MASTER TITLE STYLEE) DEVELOP YOUR OVERARACHING APPROACH TO THE MARKET : BUYING ENERGY
Budget Certainty?Best Price?
FLEXIBLE? FIXED?

CLICK TO EDIT MASTER TITLE STYLE4. WHAT TOOLS ARE AVAILABLE & APPROPRIATE?

CLICK TO EDIT MASTER TITLE STYLEA) LOCK & UNLOCK
1 – Lock to limit exposure in rising market 2 – Unlock to expose volume in falling markets

CLICK TO EDIT MASTER TITLE STYLEB) SLEEVING
Go to
Trade
Offer(Buy @ £52.10/MWh)
Bid(Sell @ £50.75/MWh)
Trade at(£51.50/MWh)
SAVINGS (£0.60/MWh)On a 1MW clip of a season = £2,621
Go to Sleeving Counterparties
AddedValue 1%
What about access to green energy / asset specific generation : PPAs?

CLICK TO EDIT MASTER TITLE STYLEC) HEDGING ENVELOPE
Strategy requirements/objectives also help determine trading decisions: for example do we need a trading timetable to achieve a particular cash flow profile?
Risk Levels can act as trigger points:• Volatility
• Budget level
• CaR or CFaR
• Stop losses
• Cap & Collar
Season Current Season Bullish BearishFront Season Winter‘ 17 100% 60%
Front +1 Summer’ 18 80% 40%
Front +2 Winter‘ 18 80% 40%
Front +3 Summer‘ 19 60% 20%
Front +4 Winter‘ 19 60% 20%
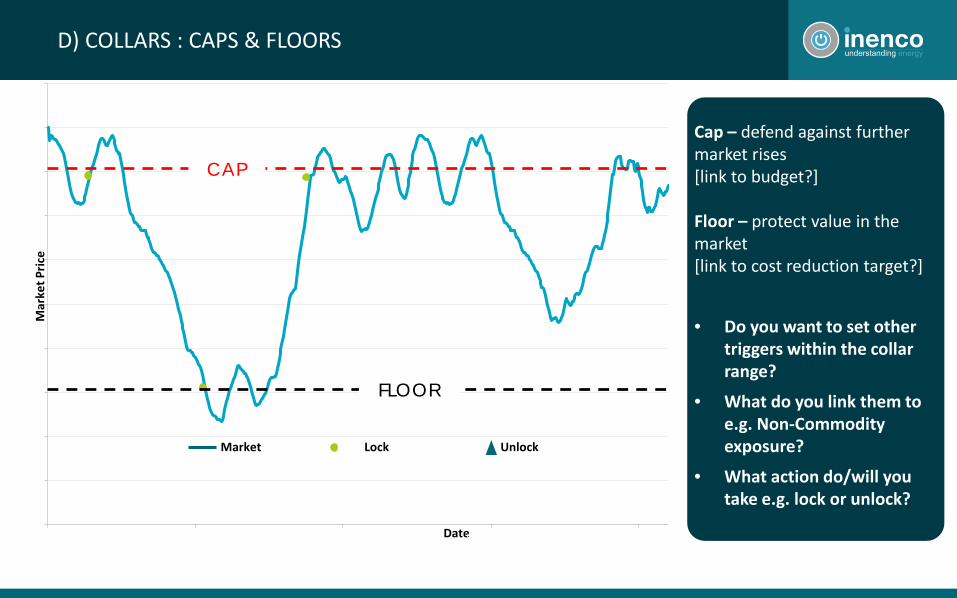
CLICK TO EDIT MASTER TITLE STYLED) COLLARS : CAPS & FLOORSM
arke
t Pric
e
Date
Good for securing your volume in a one time purchase 1 – Identifies likely low point in the market to purchase 100% of the volume in the portfolio a maximum of 12 months prior to the supply year
Cap – defend against further market rises[link to budget?]
Floor – protect value in the market[link to cost reduction target?]
• Do you want to set other triggers within the collar range?
• What do you link them to e.g. Non-Commodity exposure?
• What action do/will you take e.g. lock or unlock?
50
52
54
56
58
60
62
64
66
68
70
01/07/2010 01/12/2010 01/05/2011 01/10/2011 01/03/2012
Market Lock Unlock
CAP
FLOOR

CLICK TO EDIT MASTER TITLE STYLEE) NETTING
Buyer & Seller separately go to
Trade
Buyer Pays Offer Price(Buy @ £52.00/MWh)
Seller Gets Bid Price(Sell @ £51.00/MWh)
Both Trade at
(£51.50/MWh)
Instead trade internally with each other
AddedValue %
Net the two
positions
AddedValue %

CLICK TO EDIT MASTER TITLE STYLE5. COMBINE & BUILD INTO A COHERANT STRATEGYWHAT WILL IT LOOK LIKE?

CLICK TO EDIT MASTER TITLE STYLEFIXED STRATEGY
50
52
54
56
58
60
62
64
66
68
70
01/07/2010 01/12/2010 01/05/2011 01/10/2011 01/03/2012
CERTAINTY
Mar
ket P
rice
Date
Market Customer position Lock
1
Risk to Budget Medium/High
Performance Low
Overall Risk Rating Medium
Good for securing your volume in a one time purchase 1 – Identifies likely low point in the market to purchase 100% of the volume in the portfolio a maximum of 12 months prior to the supply year
• Places emphasis on budget certainty• Identifies likely low points in the market
to purchase 100% of the volume inthe portfolio

CLICK TO EDIT MASTER TITLE STYLECAPPED STRATEGYM
arke
t Pric
e
50
52
54
56
58
60
62
64
66
68
70
72
74
01/07/2010 01/12/2010 01/05/2011 01/10/2011 01/03/2012
Date
Optimises your price through risk management
Protection against rising market prices
Provides an upper level budgetary price
Capitalises on downward market movements
PROTECT
Cap Market Customer position Lock Unlock
Good for budget certainty
1 – CAP is set
2 – Volume locked out under cap protecting against rising market prices
3 – Unlock to re-expose volume to falling prices and capitalise on downward market movements
4 – Relock to take profit when downward market movements reverse
1
2
3
4
Risk to Budget Low
Performance Medium
Overall Risk Rating Low/Medium

CLICK TO EDIT MASTER TITLE STYLETREND STRATEGY
50
52
54
56
58
60
62
64
66
68
70
01/07/2010 01/10/2010 01/01/2011 01/04/2011 01/07/2011 01/10/2011 01/01/2012
Mar
ket P
rice
Date
CAPITALISE1
23
4
Risk to Budget Low/Medium
Performance Medium/High
Overall Risk Rating Medium
Cap Market Customer position Lock Unlock
Good for taking advantage of market volatility1 – Lock to limit exposure in rising market
2 – Unlock to expose volume in falling markets
3 – Unlocks more volume than the capped strategy to further optimise price
4 – Relock to take profit when downward market movements reverse
• Aims to optimise your price
• Uses technical analysis to identify and react to market trends and patterns
• Looks to reduce volume in rising markets and expose volume in falling markets
• Unlocks more volume than the capped strategy

CLICK TO EDIT MASTER TITLE STYLEPROMPT STRATEGY
50
52
54
56
58
60
62
64
66
68
70
01/07/2010 01/12/2010 01/05/2011 01/10/2011 01/03/2012 01/08/2012
Mar
ket P
rice
Date
Forward Market Prompt
OPTIMISE
Good for price optimisation if you can take the risk
1 – Buys volume within thedelivery period.
1
• Looks to buy volume within the delivery period
• Energy Trading Team will decide whether to buy Month-Ahead or Day-Ahead Market depending on the market conditions at the time
Risk to Budget High
Performance High
Overall Risk Rating High
Cap Market Customer position Lock Unlock

CLICK TO EDIT MASTER TITLE STYLEDOCUMENT YOUR STRATEGY POLICY
Key strategy parameters
Key contract parameters
Strategy exceptions
Process
Measuring value
Strategy review
Forecasting – consumption & budget
Agreement

CLICK TO EDIT MASTER TITLE STYLECONTINUE TO MONITOR & RE-ALIGN
FY16/17 £/MWh £
Mark 53.58 28,603,758.57
Inflated Mark 54.45 29,066,537.85
Market 33.78 18,239,973.77
Budget 53.19 28,394,157.11
Target/RecommendationForecasts remain bearish but excellent value. Scope for the market to fall further. Hold
0%
20%
40%
60%
80%
100%
Oct-15 Nov-15 Dec-15 Jan-16 Feb-16 Mar-16 Apr-16 May-16 Jun-16 Jul-16 Aug-16 Sep-16Exposed 0% 0% 0% 0% 0% 74% 100% 103% 102% 100% 94% 99%
Day Ahead Trade 74% 75% 74% 72% 73% 0% 0% 0% 0% 0% 0% 0%
Forward Trade 68% 92% 85% 95% 95% 77% 42% 43% 42% 0% 0% 0%
Hedged Position
Illustrative only

CLICK TO EDIT MASTER TITLE STYLEDON’T FORGET – A QUICK RECAP
MONITORRESULTS IDENTIFY &
ANALYSE EXPOSURES
EXAMINE RISK MANAGEMENT
TECHNIQUESSELECT RISK
MANAGEMENT TECHNIQUE
IMPLEMENT TECHNIQUES
RISKMANAGEMENT
Remember non-commodity costs!
Understand your options fully
Document the strategyKeep it simpleMake sure you understand it !
Are you best placed to do this?How quickly can you react?
Markets & business objectives change –keep strategy fit for purpose

CLICK TO EDIT MASTER TITLE STYLE
NON COMMODITY CHARGES What are they
and how to mitigate them

CLICK TO EDIT MASTER TITLE STYLENON COMMODITY COMPONENTS
Taxes & Levies15 – 20%
Transportation & Distribution30 – 40%
Supplier Costs 5%
Commodity45% - 55%

CLICK TO EDIT MASTER TITLE STYLENON COMMODITY COMPONENTS
Taxes & Levies15 – 20%
Transportation & Distribution30 – 40%
• Balancing & Settlement Use of System (BSUoS)
• Distribution Use of System (DUoS)
• Transmission Network Use of System (TNUoS)
• Line Loss Factors (LLF)
• AAHEDC - Assistance for Areas with high electricity distribution Costs
• Renewable Obligation (RO) Levy
• Feed in Tariff (FIT) Levy
• Contract for Difference Levy (CfD) Levy
• Climate Change Levy (CCL)
• Carbon Reduction Commitment (CRC)
• Capacity Market (CM)
Fixed Cost
per kWh
Vary on time and season
Vary on time and season

CLICK TO EDIT MASTER TITLE STYLENON COMMODITY - FIXED VS VARYING RATES
LLF(AAHEDC)
Renewable Obligations (RO) Levy
Feed in Tariff (FIT) Levy
Contract for Difference Levy (CfD) Levy
Climate Change Levy(CCL)
Carbon Reduction Commitment (CRC)
Capacity Market (CM)
Transmission Network Use of System (TNUoS)
Distribution Useof System (DUoS)
Balancing & Settlement Use of System (BSUoS)

CLICK TO EDIT MASTER TITLE STYLERENEWABLES NEED SUBSIDIES!
2012/13
£6.43/MWh
2017/18
£19.64/MWh
RO Demand levy

CLICK TO EDIT MASTER TITLE STYLETHERE IS SOME GOOD NEWS!
20 years
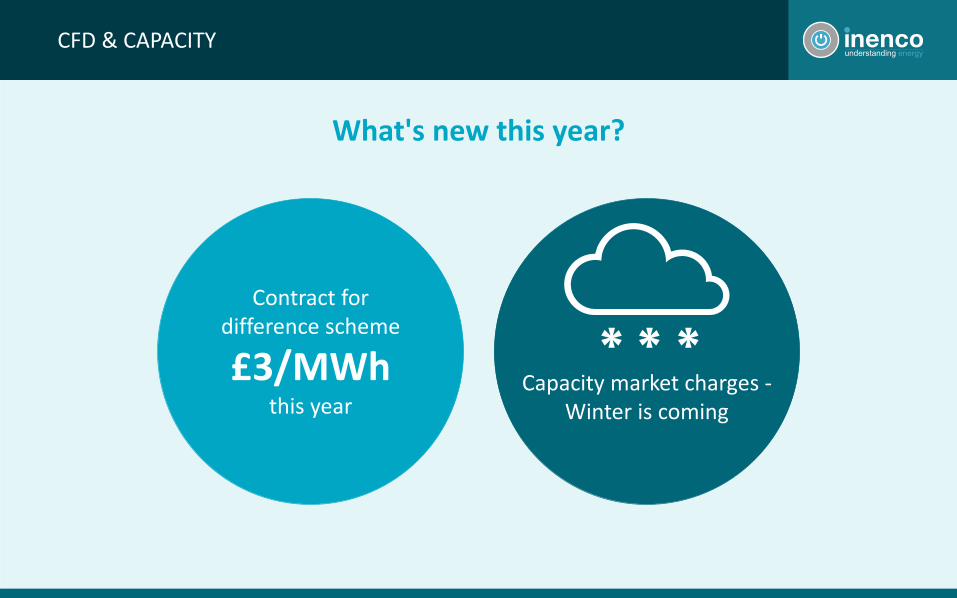
CLICK TO EDIT MASTER TITLE STYLECFD & CAPACITY
Capacity market charges -Winter is coming
Contract fordifference scheme
£3/MWhthis year
What's new this year?
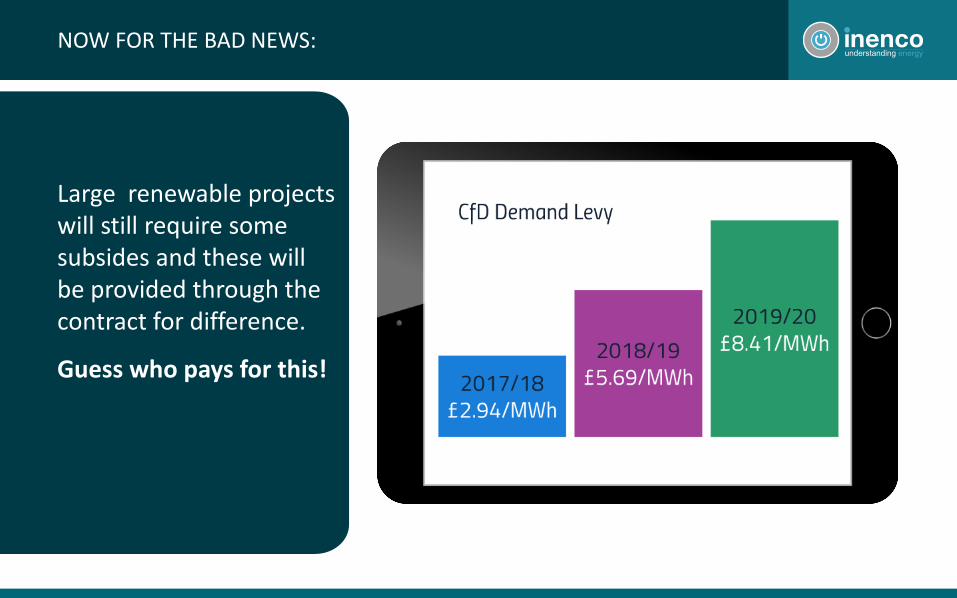
CLICK TO EDIT MASTER TITLE STYLENOW FOR THE BAD NEWS:
Large renewable projects will still require some subsides and these will be provided through the contract for difference.
Guess who pays for this!

CLICK TO EDIT MASTER TITLE STYLECAPACITY MARKET
The capacity market is a mechanism designed to control the rate of closure of power plants and to encourage new plants to be built.
The scheme will cost around £380m this year and almost £1bn in the following 2 years, but this rise considerably in the 2020’s when remaining coal plantsstart to close
£1bn

CLICK TO EDIT MASTER TITLE STYLECAPACITY MARKET

CLICK TO EDIT MASTER TITLE STYLETNUoS CHARGES
The Grid needs to be reconfigured.
Uncertainty of charges beyond 2019
It is impossible that we will move away from triads and have fixedcosts associated with connection capacity

CLICK TO EDIT MASTER TITLE STYLE
TNUoS costs will continue to rise quickly however much of the increase will be due to a programme to extend interconnector capacities
TNUoS CHARGES

CLICK TO EDIT MASTER TITLE STYLETRIAD NOTIFICATIONS
TRIAD NOTIFICATIONS - 2016/17
The 2016/17 Triad was
The winter of 2016/17 was relatively mild and consistent throughout the Triad season which was one reason there were no surprises at the Triad dates.
Wind speed also affects Triads – all three 2016/17 Triads occurred when speeds were below average.
TOTAL DEMAND OVER THE THREE TRIADS WAS AROUND 1% HIGHER THAN 2015/16+1%
The more businesses that participate in demand side management and shift load outside of peak periods, the less predictable Triads could be in future. Keep an eye on upcoming consultations from Ofgem. Triads may change from 2020.
Demand-Side Management may also be impacting Triads. More and more businesses are switching off loads or starting stand-by generators during Triad warnings in an attempt to reduce the Triad charges.
59
After the unusual Triad behaviour seen in Winter 15/16, the past winter produced Triad dates that were more consistent with previous years.
Since 2007/8 statistically the most common day for a Triad has been a Monday, followed by Thursday. Only one Triad has ever occurred on a Friday and never at the weekend. Over the last 10 years:
BACK TO NORMAL
5THDEC
23RDJAN
47%
27%
26%
27 of the previous 30 Triads occurred between
17:00 and 17:30 and 2 occurred between 17:30
and 18:00 and 1 occurred between 18:00 and 18:30.
This year all 3 Triads occurred between 17:00
and 17:30
Monday 5th December 201617:00pm – 17:30pm
50,163 MW chargeable
Thursday 5th January 201717:00pm – 17:30pm
48, 516 MW chargeable
Monday 23rd January 201717:00pm – 17:30pm
48,970 MW chargeable
SEVEN WEEKS APART
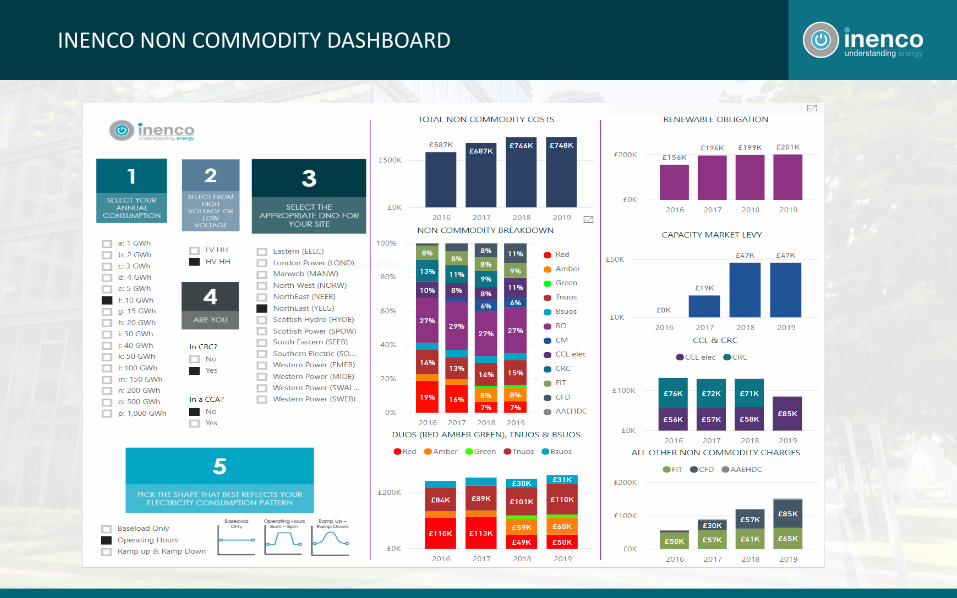
CLICK TO EDIT MASTER TITLE STYLEINENCO NON COMMODITY DASHBOARD

CLICK TO EDIT MASTER TITLE STYLE
REFRESHMENT BREAK

CLICK TO EDIT MASTER TITLE STYLE
INENCO TRADING GAMEPut what yourlearnings into action! • Could you be an
energy trader?

CLICK TO EDIT MASTER TITLE STYLEINENCO TRADING GAME
4th April End of Summer 17 Trading and Winter 17 and Summer 18 both look well supplied
11th April MET Office revise forecast average Winter temperatures up by 2 degrees after weaker El Nino
18th April Centrica announce that Rough storage is no longer viable and there will be no extractions this winter
25th April Dutch Government reduce withdrawals from Groningen Gas field down to 50% due to further tremors
2nd May Tension between US and North Korea increase after further nuclear and hydrogen missile testing
9th May US LNG production hits new highs
16th May Japan successfully re-start 3 nuclear power stations
23rd May LNG cargos to the UK are expected to increase by 25% over summer following Japanese news
30th May Generation capacity for offshore wind reaches record high
6th June Prices reach 3 year lows and attract buying interest
£33MWh£32MWh£31MWh£35MWh£37MWh£39MWh£35MWh£33MWh£32MWh£31MWh

CLICK TO EDIT MASTER TITLE STYLEINENCO TRADING GAME
13th June
Bullish hammer candle seen on chart after prices rise off 18th April lows
£32MWh

CLICK TO EDIT MASTER TITLE STYLEINENCO TRADING GAME
20th June
5 day moving average crosses above 21 day moving average
£34MWh
CLICK TO EDIT MASTER TITLE STYLEINENCO TRADING GAME
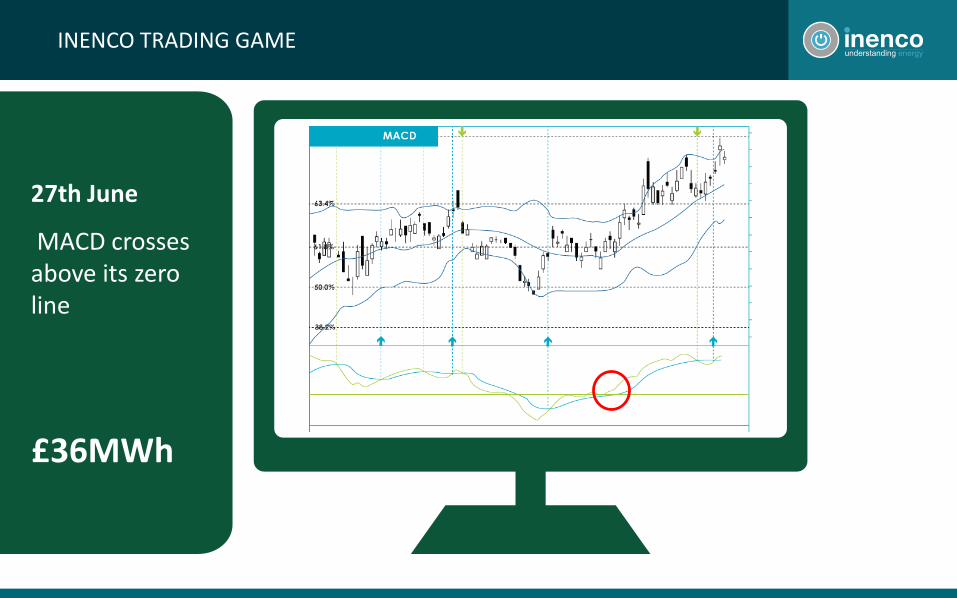
27th June
MACD crosses above its zero line
£36MWh

CLICK TO EDIT MASTER TITLE STYLEINENCO TRADING GAME
4th July
Evening star candle pattern
£37MWh

CLICK TO EDIT MASTER TITLE STYLEINENCO TRADING GAME
11th July
Bearish candle trades through central Bollinger band
£34MWh

CLICK TO EDIT MASTER TITLE STYLEINENCO TRADING GAME
18th July
Prices closed below previous support level of 31
31
£30MWh

CLICK TO EDIT MASTER TITLE STYLEINENCO TRADING GAME
25th July
Fails to break previous low and bounces off lower bollingerband
£28MWh

CLICK TO EDIT MASTER TITLE STYLEINENCO TRADING GAME
1st August
Stochastics rise above oversold line
£29MWh

CLICK TO EDIT MASTER TITLE STYLEINENCO TRADING GAME
8th August
Prices gap up, leaving a breakaway gap on the chart
£32MWh

CLICK TO EDIT MASTER TITLE STYLEINENCO TRADING GAME
15th August
Continuation candle pattern observed
£34MWh

CLICK TO EDIT MASTER TITLE STYLEINENCO TRADING GAME
22nd
Prices test 4th July level on strong volume
£37MWh

CLICK TO EDIT MASTER TITLE STYLEINENCO TRADING GAME
29th August
Prices reach 9th May highs
TOO LATE!!!!!
You should have bought earlier
£39MWh

CLICK TO EDIT MASTER TITLE STYLE
SESSION 3Improve your buyingfor the future
Putting together an integrated
energy strategy

CLICK TO EDIT MASTER TITLE STYLEPROCUREMENT STRATEGY SUMMARY
Choose the right supplier and the right contract type that enables you to implement your strategy
Execute your strategy to optimise your energy costs by purchasing from the wholesale market
Identify your goals and choose the appropriate strategy to match your appetite for risk
EnergyProcurement
Strategy & Risk
Management
Trading

CLICK TO EDIT MASTER TITLE STYLEHOW DO WE HELP YOU?
Delivery and benefits Delivery and benefits Delivery and benefits Delivery and benefits Delivery and benefits
Risk Scoping Session
Contract negotiation
Energy Trading Reporting & MI Optimisations

CLICK TO EDIT MASTER TITLE STYLEWHAT STRATEGY WOULD WORK BEST FOR YOU?
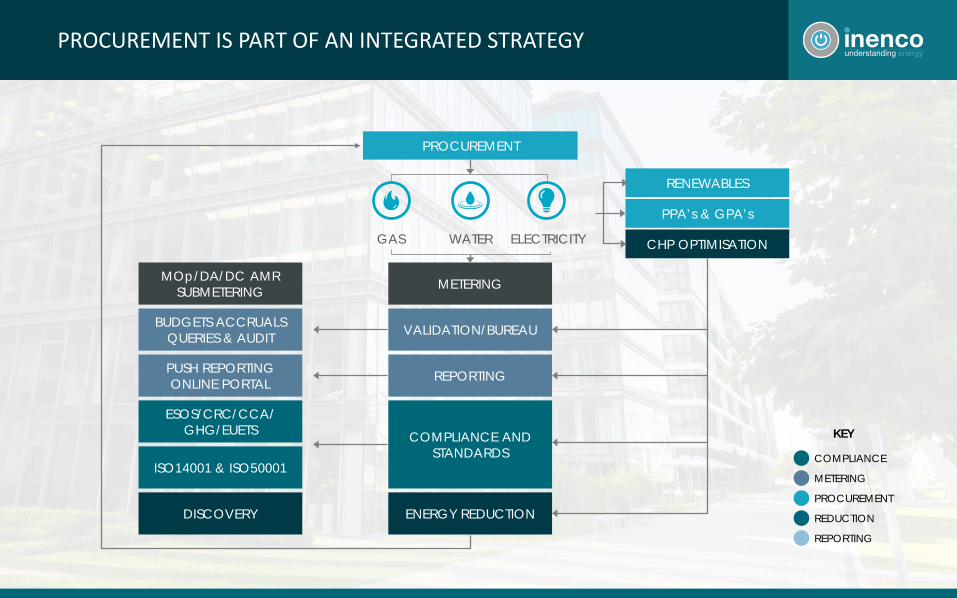
CLICK TO EDIT MASTER TITLE STYLEPROCUREMENT IS PART OF AN INTEGRATED STRATEGY
KEY
COMPLIANCE
RENEWABLES
CHP OPTIMISATION
PPA’s & GPA’s
ESOS/CRC/CCA/ GHG/EUETS
ISO14001 & ISO50001
DISCOVERY
MOp/DA/DC AMR SUBMETERING
BUDGETS ACCRUALS QUERIES & AUDIT
PUSH REPORTINGONLINE PORTAL
ENERGY REDUCTION
METERING
VALIDATION/BUREAU
COMPLIANCE AND STANDARDS
REPORTING
PROCUREMENT
GAS ELECTRICITYWATER
METERING
PROCUREMENT
REDUCTION
REPORTING

CLICK TO EDIT MASTER TITLE STYLEHOW TO BUILD AN ENERGY STRATEGY
REFRESH
GET A BOARD MANDATE 1
Review Your Existing
Situation
2
Set Your Targets
3
Review The Available
Alternatives
4
Challenge Your Review
5
Understand The
Implications
6
Prioritize Your Activities
7
Plan Your Next Steps
8
Implement Your Key
Tasks
9
Measure The Performance
10

CLICK TO EDIT MASTER TITLE STYLESOME INTERESTING MARKET FACTS
MARKETSOver 95% of
Inenco’s £3Bn energy portfolio is purchased via the wholesale energy market
CONSULTANTSSome 80% of all
companies use energy consultants for
support in buying energy
TECHNICAL ANALYSISTypically
averages over 90% decision
making accuracy
COMMODITYWholesale
commodity prices have gone up
40% since April 2016
BUYINGWINDOW
A three year procurement window
outperforms a one year window by
typically 15%

CLICK TO EDIT MASTER TITLE STYLEWHAT SHOULD YOU BE TELLING THE BOARD!
‘After a period of relative stability –prices are now going up due to both commodity and non commodity cost increases’
‘Markets are becoming more volatile with increases in intermittent renewable generation’
‘Flexible energy procurement helps manage risk’
‘Longer term integrated energy strategies are the way forward’

CLICK TO EDIT MASTER TITLE STYLE
• Established in 1968
• 250+ staff
• Procurement
• Bureau & Reporting
• Energy Optimisation
• Metering Management
• Legislative compliance
• Renewables & PPAs
• Water management
INENCO
SCALE
INENCO GROUP
Established 1983100+ staffFixed procurement SME focusedEnergy surveys
INENCO DIRECT
Lytham (Head Office)LiverpoolBudapest
OFFICES
£3bn£2bn worth of electricity
and £1bn gas procured for our clients annually
utility invoices processed and validated in our system
every year
~1,400,000

CLICK TO EDIT MASTER TITLE STYLEFCA ACCREDITATION

CLICK TO EDIT MASTER TITLE STYLEWHY USE INENCO?
As one of the largest TPIs in the UK, Inenco is playing a role in improving trust and transparency in the sector.
We have participated in the development of Ofgem’s Code of Practice over the past two years and in the absence of regulation, continue to voluntarily adhere to both the UIA and Microbusiness TPI Codes of Practice.
At Inenco we pride ourselves on being a trusted consumer champion.
We offer total transparency in what we do, and support our customers on minimising their costs for every element of their utility bills, through efficiencies, compliance or innovation.
Our sector based team have acquired specialist knowledge and as an agnostic but experienced consultancy we have the scale, heritage and breadth to advise you on every element of your utility strategy.”

CLICK TO EDIT MASTER TITLE STYLE
YOUR QUESTIONS

The image part with relationship ID rId2 was not found in the file.

CLICK TO EDIT MASTER TITLE STYLE