key advances and remaining knowledge gaps in remote ... · pdf fileknowledge gaps in remote...
TRANSCRIPT

Key Advances and Remaining Knowledge Gaps in Remote SensingKnowledge Gaps in Remote Sensing
for Precision AgricultureD. J. Mulla
Professor and Larson Chair forSoil and Water Resources
Director Precision Agriculture CenterDirector Precision Agriculture CenterDept. Soil, Water and Climate
University of Minnesota

Challenges FacingChallenges Facing Agriculture
Need to feed and provide energy for an additional 1 billion people in 10 years using
t i bl hsustainable approaches Very little new land is available for new
rainfed productionrainfed production Climate change threatens to alter rainfall
patterns and crop yield potentialpatterns and crop yield potential Need to reduce agricultural impacts on
water quality & greenhouse gaseswater quality & greenhouse gases

Precision AgriculturePrecision Agriculture A management
practice applied atpractice applied at the right time and the right place in the right amount
Field sub-region management
– NutrientsD i– Drainage or Irrigation
– Pests and Weedsests a d eeds– Tillage and Seeding

Precision Management
Optimal ResourceMManagement
DataImplementationCollection
Implementation
WISDOM DATAMap Based
or
InformationMana ement
DecisionProcess
Real TimeApproach
ManagementAnalysis and Di ti
Process
KNOWLEDGE INFORMATIONDiagnostics

The Electromagnetic Spectrum

Remote Sensingg Bare soil reflectance
Soil organic carbon and water content– Soil organic carbon and water content– Iron oxides or carbonates
C fl t Crop reflectance– Leaf area index– Crop growth stage– Crop color and leaf N status– Weeds and disease
Thermal emission of energygy– Surface temperature and crop water stress

Remote Sensing ApplicationsRemote Sensing Applications Mapping crop variabilitypp g p y
– Crop growth, biomass, and yield– Crop phenology and evapotranspirationp p gy p p– Crop stresses due to nutrients, disease,
weeds, and insects Mapping soil variability Targeted sampling Targeted sampling Management zone delineation Ability to monitor changes over time

Remote Sensing Sugar Beetsg g(Seelan et al., 2003)

History of Remote Sensing

Satellite Remote SensingSatellite
(Year)
Spectral Bands
(Spatial Resolution)
Return
Frequency
(d)
Suitability
for PA
(d)
Landsat 1 (1972) G, R, two IR (56x79 m) 18 L
AVHRR (1978) R, NIR, two TIR (1090 m) 1 L
Landsat 5 TM (1984) B, G, R, two NIR, MIR, TIR (30 m) 16 M
SPOT 1 (1986) G, R, NIR (20 m) 2-6 M
IRS 1A (1988) B G R NIR (72 ) 22 MIRS 1A (1988) B, G, R, NIR (72 m) 22 M
ERS-1 (1991) Ku band altimeter, IR (20 m) 35 L
JERS-1 (1992) L band radar (18 m) 44 L

Satellite Remote SensingSatellite Remote SensingSatellite
(Year)
Spectral Bands
(Spatial Resolution)
Return
Frequency
Suitability
for PA(Year) (Spatial Resolution) Frequency
(d)
for PA
IKONOS (1999) Panchromatic, B, G, R, NIR (1-4 m) 3 H
Terra EOS ASTER
(2000)
G, R, NIR & 6 MIR, 5 TIR bands (15-90 m) 16 M
EO-1 Hyperion (2000) 400-2500 nm 10 nm bandwidth (30 m) 16 HEO-1 Hyperion (2000) 400-2500 nm, 10 nm bandwidth (30 m) 16 H
QuickBird (2001) Panchromatic, B, G, R, NIR (0.61-2.4 m) 1-4 H
EOS MODIS (2002) 36 bands in VIS-IR (250-1000 m) 1-2 L
RapidEye (2008) B, G, R, Red edge, NIR (6.5 m) 5.5 H
GeoEye-1 (2008) Panchromatic, B, G, R, NIR1, NIR2 (1.6 m) 2-8 H
WorldView-2 (2009) P B G Y R Red edge NIR (0 5 m) 1 1 HWorldView-2 (2009) P, B, G, Y, R, Red edge, NIR (0.5 m) 1.1 H

Increasing Spatial Resolution of Imagery

Pixel Size

Increased Homogeneity of Pixels

Limitations to Satellitetat o s to Sate teRemote Sensing
Coarse spatial resolution and infrequent repeat coverage for older satellite platforms
Difficulty obtaining images when needed Interference from clouds Changes in irradiance on multiple passes Slow turn-around time due to image g
processing for calibration, corrections, and geo-rectification
Cost ranges from $23 - $45/km2

A i l R tAerial Remote SensingSe s g
AirplanesU d Unmanned Aerial Vehicles


Proximal Remote SensingProximal Remote Sensing
Sensors can be mounted on tractors Sensors can be mounted on tractors, spreaders, sprayers or irrigation booms
G S k– GreenSeeker– Crop Circle
W dS k– WeedSeeker– Infrared thermometers
Allows real time site specific management of fertilizer, pesticides or irrigation

Data InterpretationData Interpretation Classification (Bauer, 2000)
– Supervised, unsupervised, multi-temporal data sets,Supervised, unsupervised, multi temporal data sets, decision tree classifiers, neural network classification, guided clustering, fuzzy sets, contextual classifiers, and use of auxiliary informationand use of auxiliary information
Pattern Detection (Civco, 2002)Image differencing cross correlation chemometric– Image differencing, cross correlation, chemometricanalysis, principal component analysis, neural networks, object oriented classification (Walker, 2003), fuzzy set theory (Viscarra Rossel, 2006)
Assess accuracy (Congalton, 1991; Foody, 2002)Vi l t A i S li t t i– Visual assessment, Area comparisons, Sampling strategies, Kappa statistic, Confusion matrix

Traditional ClassificationTraditional Classification

Fuzzy ClassificationFuzzy Classification

Spectral Decomposition and p pChemometrics
Spectral Mi ing Anal sis (H ete 1991) Spectral Mixing Analysis (Huete, 1991) Principal Component Analysis
P ti l L t S R i (Li d Partial Least Squares Regression (Lindgren, 1994)St i M lti l Li R i Stepwise Multiple Linear Regression
Multiple Regression AnalysisM lti i t Ad ti R i S li Multivariate Adaptive Regression Splines

Spectral Mixing AnalysisSpectral Mixing Analysis
where ρ is reflectance, m are end-members, k are bands, and i,j are pixels

Principal Component Analysis

Artificial Neural Networks
weighting factors
Output Layer
weighting factors
a summation function
a transfer function
Neuron(hidden)
scaling and limiting processes
t t f ti
InputLayer
an output function
an error functionMiao, Y., D. J. Mulla and P. C. Robert. Prec. Agric. 7(2):117-136 2006
a back-propagated value/learning function
7(2):117-136, 2006

Pixel Accuracy AssessmentPixel Accuracy Assessment
Non-Spatial Accuracy Test
Border Pixel Accuracy Important

Confusion Matrix
Omission errors involve underestimation of a classOmission errors involve underestimation of a classCommission errors involve overestimation of a class

Accuracy AssessmentAccuracy Assessment Statistics
Kappa Statisticfor ClassificationAccuracy

Confusion Matrix
DCNIRB User's Commission
High Moderate Low None Total Accuracy ErrorLeaf N
g yHigh 19 2 1 0 22 0.86 0.14Moderate 2 3 0 2 7 0.43 0.57Low 2 1 2 4 9 0.22 0.78N 0 1 9 32 42 0 76 0 24None 0 1 9 32 42 0.76 0.24Total 23 7 12 38 80
Producer's Accuracy 0.83 0.43 0.17 0.84 0.70Omission Error 0.17 0.57 0.83 0.16
Nigon, Rosen, Mulla et al., 2012g , , ,

Estimate Biophysical or Biochemical Variables
Courtesy of Drs. V.C. Patilyand K.A. Al-Gaadi, King Saud University

Spatial Pattern

Spatial Pattern is Complicated when p pHyperspectral Data are involved!

Integration of Imagery in GISIntegration of Imagery in GIS

Statistical AdvancesStatistical Advances Traditional statistics
– Mean and dispersion– Histogramsg
Spatial and non-traditional statistics– Spatial filtering (low and high pass kernal– Spatial filtering (low and high pass kernal
filters, Kalman filters, wavelets, etc)– Homogeneity Contrast DissimilarityHomogeneity, Contrast, Dissimilarity– Geostatistical analysis

Using Geostatistics toCorrect Errors in RS Images
Used when pixels are missing– Cloud cover or satellite malfunction
Rossi et al., Rem. Sens. Environ. 49:32-40, 1994Zhu et al Rem Sens Environ 124:49 60 2012Zhu et al., Rem. Sens. Environ.124:49-60, 2012

Spatial Modeling & Interpolation p g p
Cokriging KrigingCokriging Kriging
Mulla D J Geostatistics remote sensing and precision farming 1997 pp 100 119Mulla, D. J. Geostatistics, remote sensing and precision farming. 1997. pp 100-119. In: A. Stein and J. Bouma (eds.), Precision Agriculture: Spatial and Temporal Variability of Environmental Quality. Ciba Foundation Symposium 210. Wiley, Chichester.

Kriged Phosphorus (ppm)400
g ( )
300
(m)
200
STAN
CE
100
DIS
0 100 200 300 400 500 6000
0 100 200 300 400 500 600
DISTANCE (m)

Cokriged Phosphorus (ppm)400
g ( )
300
(m)
200
STAN
CE
100
DIS
0 100 200 300 400 500 6000
0 100 200 300 400 500 600
DISTANCE (m)

Targeted Soil Sampling Strategyg p g gyBased on Bare Soil NIR Image
100
150
0 100 200 300 400 500 600 700 8000
50
0 100 200 300 400 500 600 700 800


Applications of Remote Sensing pp gin Precision Ag
C th t LAI bi d Crop growth stages, LAI, biomass, and yield
Crop chlorophyll and nitrogen stress Crop ET and water stressp Weed, insect and disease infestations Soil salinity organic matter moisture etc Soil salinity, organic matter, moisture, etc Delineating management zones Precision conservation

Crop SensorspYear Innovation Citation
1992 SPAD meter (650, 940 nm) used to detect N
d fi i i
Schepers et al., 1992
deficiency in corn
1995 Nitrogen Sufficiency Indices Blackmer and Schepers,
1995
1996 Optical sensor (671, 780 nm) used for on-the-go
detection of variability in plant nitrogen stress
Stone et al. (1996)
2002 Yara N sensor (450-900 nm) Link et al. (2002), TopCon
Industries
2002 GreenSeeker (650, 770 nm) Raun et al. (2002), NTech
Industries
2004 Crop Circle (590, 880 nm or 670, 730, 780 nm) Holland et al (2004), Holland
Scientific
2002 CASI hyperspectral sensor based index Haboudane et al (2002;2002 CASI hyperspectral sensor based index
measurements of chlorophyll
Haboudane et al. (2002;
2004)

Spectral Signatures


Visible Absorption Spectrum

The Red-NIR Reflectance Space
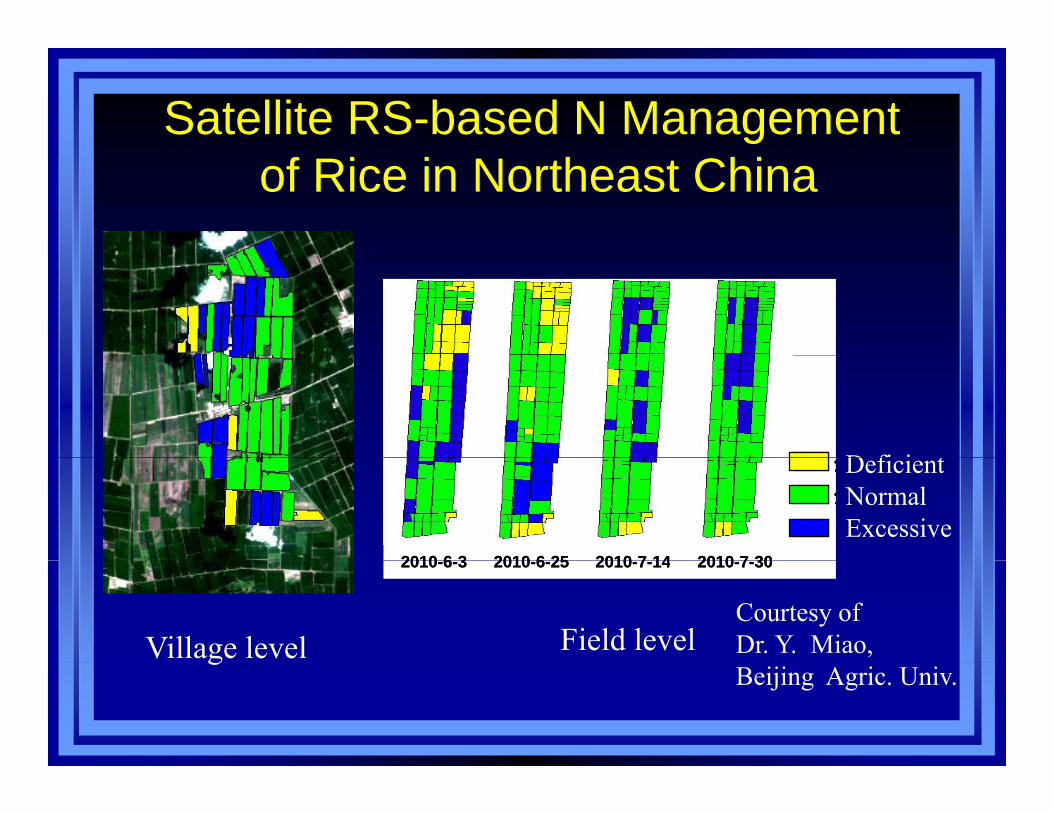
Satellite RS-based N Managementof Rice in Northeast China
生生D fi i t生生
2010 6 3 2010 6 25 2010 7 14 2010 7 30
生生
2010 6 3 2010 6 25 2010 7 14 2010 7 30
DeficientNormalExcessive
2010-6-3 2010-6-25 2010-7-14 2010-7-302010-6-3 2010-6-25 2010-7-14 2010-7-30
Village level Field levelCourtesy of Dr. Y. Miao, gBeijing Agric. Univ.

Crop Sensor-based N Management Strategy (China)
400
500
1 )
Soil_based S b d
(Li et al., 2009. Soil Science Society of America Journal 73:1566-1574)
100
200
300
400
N R
ate
(kg
ha-1 Sensor_based
FP
N Rate
02006 2007
Year
4000500060007000
d (k
g ha
-1)
0100020003000
Gra
in Y
iel
Winter Wheat Yield
2006 2007Year

Spectral IndicesSpectral Indices Canopy reflectance is affected by water,
hl h ll d it d il tchlorophyll, canopy density and age, soil, etc Leaf water potential and leaf temperature
1981 C W S I d (J k )– 1981 Crop Water Stress Index (Jackson) Leaf Area Index
1974 NDVI (R 670 & 800 )– 1974 NDVI (Rouse, 670 & 800 nm) Soil Adjusted Vegetative Index (670 & 800 nm)
1994 MSAVI (Qi)– 1994 MSAVI (Qi) Chlorophyll Absorption Ratio Index
2000 MCARI (Daughtry 550 670 & 700 nm)– 2000 MCARI (Daughtry, 550, 670 & 700 nm)

Crop Water StressCrop Water StressHigh water Treatments (low temperatures)Bl d
Thermal Crop Water
Blue and green spots
Thermal Crop Water Stress Indices.– Crop: Cottonp– Location: Arizona– Sensor: Thermal
(h li t )scanners (helicopter)
Low water Treatments (high temperatures)Low water Treatments (high temperatures)Yellow and orange spots.Source: http://www.uswcl.ars.ag.gov

RGB
Thermal
Courtesy Drs. V. Alchanatis &Y. Cohen, Volcani Center, AROand Pivot Irrigation & Pumping

Types of Reflectance SpectraTypes of Reflectance Spectra Panchromatic reflectance
– An average over all wavelengths Broad band or multispectral reflectancep
– Reflectance at a few specific discrete wavelengthsg
– B, G, R NIR portions of spectrum Hyperspectral reflectance Hyperspectral reflectance
– Reflectance at specific narrow band discrete wavelengths across a largediscrete wavelengths across a large continuous spectral range
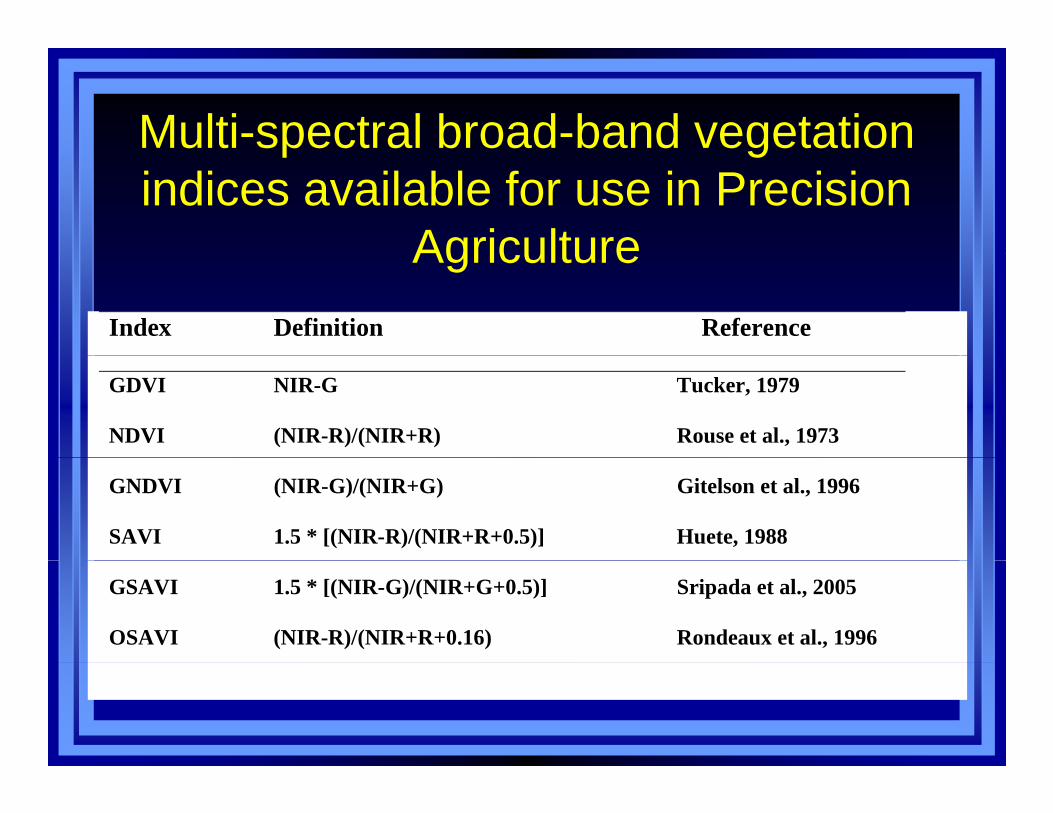
Multi-spectral broad-band vegetation p gindices available for use in Precision
AgricultureAgricultureIndex Definition Reference
GDVI NIR-G Tucker, 1979
NDVI (NIR-R)/(NIR+R) Rouse et al., 1973
GNDVI (NIR-G)/(NIR+G) Gitelson et al., 1996
SAVI 1.5 * [(NIR-R)/(NIR+R+0.5)] Huete, 1988
GSAVI 1.5 * [(NIR-G)/(NIR+G+0.5)] Sripada et al., 2005
OSAVI (NIR-R)/(NIR+R+0.16) Rondeaux et al., 1996

Hyperspectral Data CubeHyperspectral Data Cube
Nigon, Rosen, Mulla et al., 2012

Best Reflectance Wavelengths?gThenkabail et al. (2000)
The greatest information about plant characteristics with g pmultiple narrow bands includes the longer red wavelengths (650-700 nm), shorter green wavelengths (500 550 nm) red edge (720 nm) and NIR (900 940 nm(500-550 nm), red-edge (720 nm), and NIR (900-940 nm and 982 nm) spectral bands– The information in these bands is only available in narrow
i t f 10 20 d i il b d i b dincrements of 10-20 nm, and is easily obscured in broad multispectral bands that are available with older satellites
The best combination of two narrow bands in NDVI-like indices is centered in the red (682 nm) and NIR (920 nm) wavelengths, but varies depending on the type of crop, as well as the plant characteristic of interestwell as the plant characteristic of interest

Hyperspectral narrow-band vegetation indices available for use
in precision agriculturep gIndex Definition Reference
SR1 NIR/Red = R801/R670 Daughtry et al., 2000
SR7 R860/(R550 * R708) Datt, 1998
NDVI (R800-R680)/(R800+R680) Lichtenthaler et al.,
1996
Green NDVI (R801-R550)/(R800+R550) Daughtry et al., 2000
(GNDVI)
NDI1 (R780-R710)/(R780-R680) Datt, 1999
NDI2 (R850-R710)/(R850-R680) Datt, 1999

Hyperspectral narrow-bandHyperspectral narrow band vegetation indices available for use
in precision agriculturein precision agricultureIndex Definition Reference
MCARI [(R700-R670)-0.2(R700-R550)](R700/R670) Daughtry et al., 2000
TCARI 3*[(R700-R670)-0.2*(R700-R550)(R700/R670)] Haboudane et al., 2002
OSAVI (1+0.16)(R800-R670)/(R800+R670+0.16) Rondeaux et al., 1996
MSAVI 0.5[2R800+1-SQRT((2R800+1)2-8(R800-R670))] Qi et al., 1994
MCARI2 5.0)56()12(
)](3.1)(5.2[5.1
6708002
800
550800670800
RRR
RRRR Haboudane et al., 2004

Derivative SpectraH perspectral reflectance data are collected in Hyperspectral reflectance data are collected in nearly continuous narrow bands across a wide range of wavelengthsrange of wavelengths
The derivative of hyperspectral reflectance data can be very useful at indicating portions of thecan be very useful at indicating portions of the spectrum where the slope of the reflectance curve changes rapidly
Derivative spectra reduce interference from soil

Derivative SpectraDerivative Spectra
Nigon, Rosen, Mulla et al., 2012

Lambda Lambda PlotsLambda-Lambda Plots Lambda-lambda plots involve calculating, for
example the r2 coefficient for leaf N content at allexample, the r2 coefficient for leaf N content at all hyperspectral reflectance bands
A graph of the r2 coefficient for all possible g p pcombinations of band 1 on the x-axis and band 2 on the y-axis results in a lambda-lambda plot
The lambda lambda plot is useful for identifying The lambda-lambda plot is useful for identifying which combinations of two bands contain redundant information about N stress
Spectral bands or narrow band indices should be selected with low r2 coefficients to eliminate redundancy and maximize information about cropredundancy and maximize information about crop characteristics (such as N stress).

Lambda-lambda
plotplot
Nigon, Rosen, M lla et alMulla et al., 2012

Temporal Analysis of Data

In Season N ManagementIn-Season N Management
(From J. Schepers, 2005)

Properties of N deficient PlantsProperties of N deficient Plants• Green reflectance
iincreases • Red reflectance
increases & NIRincreases & NIR reflectance decreases
• Differences in reflectance greatest between 550 600between 550 – 600 nm, followed by red-edge (680 –g (730 nm)


Hyperspectral Imaging forHyperspectral Imaging for N Sufficiency in Maize
CM = 56.74 + 6.48 * R713 + 2.02 * R953 + 8.42 * R666 - 9.87 * R695- 0.75 * R972 - 19.57 * R554 + 16.68 * R499 - 1.66 * R934
Miao et al., Precision Agriculture 10:45-62, 2009

Promising Indices for Crop N Stress
Normalized Difference Index 2:

N stress in potato
Results/discussion
N stress in potatoLeaf N NDI2
Nigon, Rosen, Mulla et al., 2012Nigon, Rosen, Mulla et al., 2012

Leaf N (CV 14%) NDVI (CV 5%)
Nigon, RosenRosen, Mulla, 2012
DCNI (CV 15%) NDVI1 (CV 26%)

LiDARLiDAR Light Detection and Ranging
scans earth’s surface usingscans earth s surface using a laser with visible radiation
Provides a high resolution Provides a high resolution Digital Elevation Model (DEM) which can be ( )processed in GIS with terrain analysis– Slope, curvature, flow
accumulation, etc.Stream power topographic– Stream power, topographic wetness, etc.


Precision ConservationPrecision Conservationin Critical Source Areasin Critical Source Areas
Side Inlet
in Critical Source Areasin Critical Source AreasGalzkiGalzki, J., A. S. Birr and D. J. , J., A. S. Birr and D. J. MullaMulla. 2011. . 2011.
JJ. Soil Water . Soil Water ConservConserv. 66:423. 66:423--430.430.
Two criteria:Two criteria:AccumulationAccumulation Accumulation Accumulation of surface flowof surface flow
HydrologicHydrologic
Gully
Hydrologic Hydrologic connection to connection to surface waterssurface waterssurface waterssurface waters
GIS based GIS based LiDARLiDAR data data used to used to identify CSAsidentify CSAs

Example: Using Specific Catchment Area to Identify Critical Source AreasBeauford Watershed (Blue Earth County)

ConclusionsConclusions Precision agriculture dates back to the middle
of the 1980’sof the 1980 s Remote sensing applications in precision
agriculture began with sensors for soilagriculture began with sensors for soil organic matter, and have quickly diversified to include satellite, aerial, unmanned aerial vehicles, tractors, spreaders, sprayers and irrigation booms
Spatial resolution of aerial and satellite remote sensing imagery has improved from 100’s of m to sub meter accuracy100 s of m to sub-meter accuracy

Conclusions Wavelengths in use range from the ultraviolet
to microwave portions of the spectrum– Red edge reflectance is increasingly available– LiDAR, fluorescence and thermal spectroscopy
h d dhave advanced Spectral bandwidth has decreased with the
advent of hyperspectral remote sensingadvent of hyperspectral remote sensing A variety of useful spectral indices now exist
for various precision agriculture applicationsfor various precision agriculture applications– The best spectral indices for N stress are robust
over crop species, variety and growth stage (with p p y g g (high r2 and CV)

ConclusionsConclusions Return frequency of satellite remote sensing
i h i d d ti llimagery has improved dramatically– Timeliness, cloud interference and cost of imagery
are still issuesare still issues More research on remote sensing with
unmanned aerial vehicles is needed tounmanned aerial vehicles is needed to improve the timeliness of data collection
Errors in geo-rectification and geometric g gcorrection from aerial platforms are becoming more important relative to image pixel size

Remaining Knowledge GapsRemaining Knowledge Gaps More emphasis is needed on chemometric
th d f l i tmethods of analysis to assess crop biophysical and biochemical characteristicsS t l i di th t i lt l ll f Spectral indices that simultaneously allow for assessment of multiple crop stresses (e.g; water nitrogen and disease) are lackingwater, nitrogen and disease) are lacking
Higher spatial resolution of aerial remote sensing is needed for early detection ofsensing is needed for early detection of disease

Remaining Knowledge GapsRemaining Knowledge Gaps Sensors are needed for direct estimation of
t i t d fi i i ith t th fnutrient deficiencies without the use of reference stripsTh l ith d t l There are many algorithms and spectral indices for management of crop N stress– The utility of these seems to vary by year crop– The utility of these seems to vary by year, crop
type, variety and growth stage– Simple, generalizable solutions are needed
Remote sensing needs to be better integrated with automated, online soil and crop management decision support systems

Remaining Knowledge Gaps
At present there is considerable interest in collecting remote sensing data at multiple times in order to conduct near real time soil, crop and pest managementW h d f f i b il t We have progressed from farming by soil, to farming by grid cell to farming by management zone and now the challenge ismanagement zone and now the challenge is to manage individual plants in real-time

Questions?Questions?Acknowledgement: Some images were obtained from “Fundamentals of Satellite Remote Sensing” by Chuvieco and Huete (2010)by Chuvieco and Huete (2010)