key drivers in determining lidar sensor selection … · key drivers in determining lidar sensor...
TRANSCRIPT

TS 19 – Positioning and Measurement in Practice Jake Jenkins TS19.5 Key Drivers in Determining LiDAR Sensor Selection Promoting Land Administration and Good Governance 5th FIG Regional Conference Accra, Ghana, March 8-11, 2006
1/18
Key Drivers in Determining LiDAR Sensor Selection
L.G. (Jake) JENKINS, Canada
Key words: SUMMARY An airborne lidar sensor represents a significant capital investment. To avoid making an inadequately informed and costly decision, careful research is essential. This paper focuses on the critical factors surveyors must consider when deciding to purchase an airborne lidar system. The main points addressed are: 1) the current state of the survey industry in terms of lidar technology; 2) critical specifications to compare when considering a lidar instrument; 3) a comparison of hardware among four different lidar systems; 4) an analysis of various types of scanners; 5) a consideration of drivers that can be decisive. Beginning with an overview of the current state of the survey industry, the paper identifies those factors that define the performance of a lidar instrument manufacturer: reputation, reliability, support, service and leadership. The question, “What does the customer search for when they seek the best?” is defined in terms of efficiency in design and cost effectiveness of operation. Flexibility, accuracy, and programmability are also examined as factors that determine the quality of a lidar system’s performance. The specifications of four different lidar systems are compared: Optech 3100, Leica ALS-50, Toposys Falcon III and IGI LM5600. Also, three different scanner types are assessed: fiber, rotating polygon and oscillating mirror. Because the scanner largely determines lidar system accuracy, programmability, spot density, swath width and area coverage rate, the comparative advantages and disadvantages of each type of scanner are addressed. When deciding which lidar instrument best serves the surveyor’s needs a number of drivers can be decisive. These drivers include: altitude specification, beam divergence, automatic roll compensation and waveform digitization capabilities. The impact of these features on airborne surveying is discussed. The paper summarizes with the acknowledgment that lidar is a relatively new technology, and as such, is contributing significantly to the growth of the survey industry. As the technical capabilities of lidar sensors continue to evolve, new surveying possibilities and opportunities arise. In conclusion, the paper offers the insight that the critical criterion in choosing a particular lidar sensor should be the overall instrument efficiency, and cautions against overvaluing individual component specifications as they can easily be taken out of context.
TS 19 – Positioning and Measurement in Practice Jake Jenkins TS19.5 Key Drivers in Determining LiDAR Sensor Selection Promoting Land Administration and Good Governance 5th FIG Regional Conference Accra, Ghana, March 8-11, 2006
2/18
Key Drivers in Determining LiDAR Sensor Selection
L.G. (Jake) JENKINS, Canada 1. LIDAR AND THE CURRENT STATE OF THE SURVEY INDUSTRY The decision to purchase an airborne lidar sensor represents a significant capital investment. To avoid making an inadequately informed and costly decision, careful research is essential. This paper focuses on the critical factors surveyors must consider when deciding to purchase an airborne lidar system. A surveyor in the market for an airborne lidar system needs to research at least two areas: − The lidar sensor itself (hardware) − The sensor manufacturer (hardware provider). 2. ASSESSING THE HARDWARE Of the airborne lidar systems currently available in the market, which is best? Which system offers the most efficient design and is most cost effective to operate? Which system is the most reliable? Which offers the best options and provides for future flexibility? Comparing the performance specs of commercially available lidar sensors seems a logical place to begin. After all, “a spec is a spec,” and when manufacturers’ specifications are stacked up for comparison, certain facts should become apparent. If only it were that easy! Anyone who has ever plowed into a thicket of arcane information and technical specs soon realizes that: a) often what appears to be a straightforward comparison of widgets may be a case comparing apples and oranges; and b) there are always different methods of testing various performance parameters—competing manufacturers can and do use different means of arriving at a test result. 3. SEARCHING FOR THE BEST What do surveyors search for when they seek the best? Informal surveys of customer satisfaction among lidar operators have identified several key indicators: “Best” is most often defined in terms of efficiency in design and cost effectiveness of operation. Flexibility, accuracy, and programmability are also pointed to as factors that determine the quality of a lidar system’s performance. How is “efficiency” measured? Efficiency = net profit for the operator after implementation (installation, training, etc.) and operational costs have been taken into account. A brief glimpse at how lidar works quickly reveals the extraordinary technical challenges that this technology manages. Consider the typical airborne lidar survey scenario: an aircraft (rotary or fixed wing) equipped with a GPS receiver/antenna flies a mounted laser sensor over the target terrain. The laser in the lidar sensor emits pulses at frequencies of up to 100
TS 19 – Positioning and Measurement in Practice Jake Jenkins TS19.5 Key Drivers in Determining LiDAR Sensor Selection Promoting Land Administration and Good Governance 5th FIG Regional Conference Accra, Ghana, March 8-11, 2006
3/18
kHz (100,000 pulses per second). In order to ascertain accurate range and slant data, each discrete laser pulse and its corresponding reflection must be located in space and time from the point of origin (emission) to the point of detection (reflection from target). To do this, it is essential to have accurate position information on the aircraft’s trajectory, which is provided by the GPS subsystem. To achieve sub-meter accuracy, information on the in-flight position of the aircraft (specifically the position and orientation of the lidar sensor) must also be accurate. Therefore, all dynamic changes in the aircraft’s heading, pitch and roll must be measured and logged. This information is provided by a Position and Orientation System (POS). As well, the range and slant measurements (XYZ point data) and intensity values must be logged to, and stored in, on-board data storage media. To complicate matters, all three data streams—lidar, GPS and POS—dense as they are, must be synchronized to a universal time stamp that places all data events along one unifying timeline. Without temporal synchronization, all relative position, range and intensity data are useless for the purpose of measuring distances. So clearly the technical challenges are significant. Couple the technical challenges with variables from the physical operating environment—temperature, atmospheric pressure, humidity, vibration, shock, electromagnetic interference, etc.—and the potential for error is increased. Since errors (including operator error) cannot be categorically eliminated, the aim is to minimize the error budget to the greatest extent possible. In practice, the best lidar sensor should have balanced error contributions from all subsystem sources. That is, no single subsystem—laser, GPS, POS—should be contributing a disproportionate amount to the error budget. And errors from one source need to be regarded in relation to the overall system operation. For example, a mere 2 cm error from roll may be impressive, but if the laser “footprint” on the target is a whopping 70 cm in circumference the seemingly insignificant error is a moot point. The highest percentage of errors originate from the scanner, the rangefinder, the POS, the GPS and the laser spot size. For example, there is no point in claiming superior POS accuracy without also addressing scanner accuracy. So again, the “best” system has minimal and balanced error contributions from each subsystem source. The “best” lidar systems have also been recognized as being adaptable to multiple survey needs. Programmability in laser pulse repetition frequency (PRF), spot spacing, swath width, operating altitude and spot size all count as features that add up to the “best” system. The lidar sensor under consideration should be optimum for its intended operational environment. Where the primary survey applications involve massive coverage such as coastal zones, forestry or utility corridors, high altitude operation, scanner speed and swath coverage become crucial factors. Surveying congested urban areas presents other

TS 19 – Positioning and Measurement in Practice Jake Jenkins TS19.5 Key Drivers in Determining LiDAR Sensor Selection Promoting Land Administration and Good Governance 5th FIG Regional Conference Accra, Ghana, March 8-11, 2006
4/18
requirements: if denser data is needed, higher laser rep rates may be necessary. When flying at lower altitudes and slower speeds, having the option of adjustable beam divergence is critical because scanning with a wide divergence beam setting at reduced power output greatly mitigates the risk of operating a laser under conditions that could be potentially hazardous to eye safety. Ideally, the prospective lidar sensor should have flexibility to allow for new surveys to be done without hardware modifications. A firm that specializes in forestry surveys should not be constrained by their lidar equipment from pursuing different types of survey opportunities such as urban planning. 4. ASSESSING THE HARDWARE PROVIDER If comparing “hard” specs is challenging, weighing the “soft” claims of hardware providers can be even more so. The surveyor in the market for a lidar sensor needs persuasive answers to a number of questions: Which manufacturer will offer us the best system, the best reliability, the best options, the best training and—down the road when the pressure is on to deliver accurate and reliable 3D topographic data quickly—the best support? In a word, after we make a very serious capital investment in highly sophisticated hardware and software, who will not let us down? Along with the technical drivers discussed elsewhere, a number of key non-technical drivers need serious attention to fully inform the decision making process. The following list identifies and addresses key non-technical drivers. Key Non-Technical Drivers
Non-Technical Driver Considerations
Reputation
Look into the reputation of the prospective lidar equipment provider. Professional survey organizations and associations, publications, trade journals, user groups, conferences, trade shows all can be valuable sources of information on a company’s status in the industry. Name recognition, while not the ultimate indicator of a company’s reputation, can be a general barometer. As with the reputation of any manufacturer of costly, high-tech equipment, the caveat, “buyer beware” applies if the provider is a start-up with little legacy to review.
Reliability Find out what you can about the “workhorse” lidar sensors, those that have been operating in the field the longest. The number of a company’s lidar units that have racked up impressive numbers of operating hours is certainly a good sign. What are the service records of these units? Is there any pattern to incidences of failure? Among the instrument’s
TS 19 – Positioning and Measurement in Practice Jake Jenkins TS19.5 Key Drivers in Determining LiDAR Sensor Selection Promoting Land Administration and Good Governance 5th FIG Regional Conference Accra, Ghana, March 8-11, 2006
5/18
Non-Technical Driver Considerations
subsystems, are any more prone to trouble? Reliability is also related to the manufacturer’s longevity. If a company has held only a brief standing in the marketplace, the jury may still be out on assessing long-term performance.
Solutions / Turnkey Is the lidar provider strictly (or primarily) a manufacturer? Does it support other units or divisions? Does it provide other services? Even if the surveyor is familiar with airborne photogrammetry and has all the requisite flight infrastructure in place, preparation is still required for flight planning. What, if anything, does the lidar sensor provider offer in terms of flight training software, tutorials and support?
Support Ask for a sample Sales Contract. Make sure that promises of after-sales support are delineated in a written document. Verbal promises have a way of eroding over time.
Market Share While market share should not be the sole determining factor in deciding, there is usually a sound reason why one provider has sold and deployed more units are than others.
Service Airborne surveying takes place in remote areas all over the globe. If your lidar sensor falters in mid-survey when deployed over an atoll in the South China Sea, what is your fallback plan? Do you scuttle the mission and bear the financial losses or does your provider have service depots and replacement parts deployed in that region? Ask about Integrated Logistics Support (ILS). Determine what the lidar provider’s polices are regarding field service. Ask for a sample Warranty plan. Again, before signing anything, make sure you see these policies in writing.
Market Focus What does the lidar sensor provider do best? What is their core expertise? Is lidar their specialty or a sideline? Is the company independent, part of a joint venture or a peripheral branch of a much larger conglomerate?
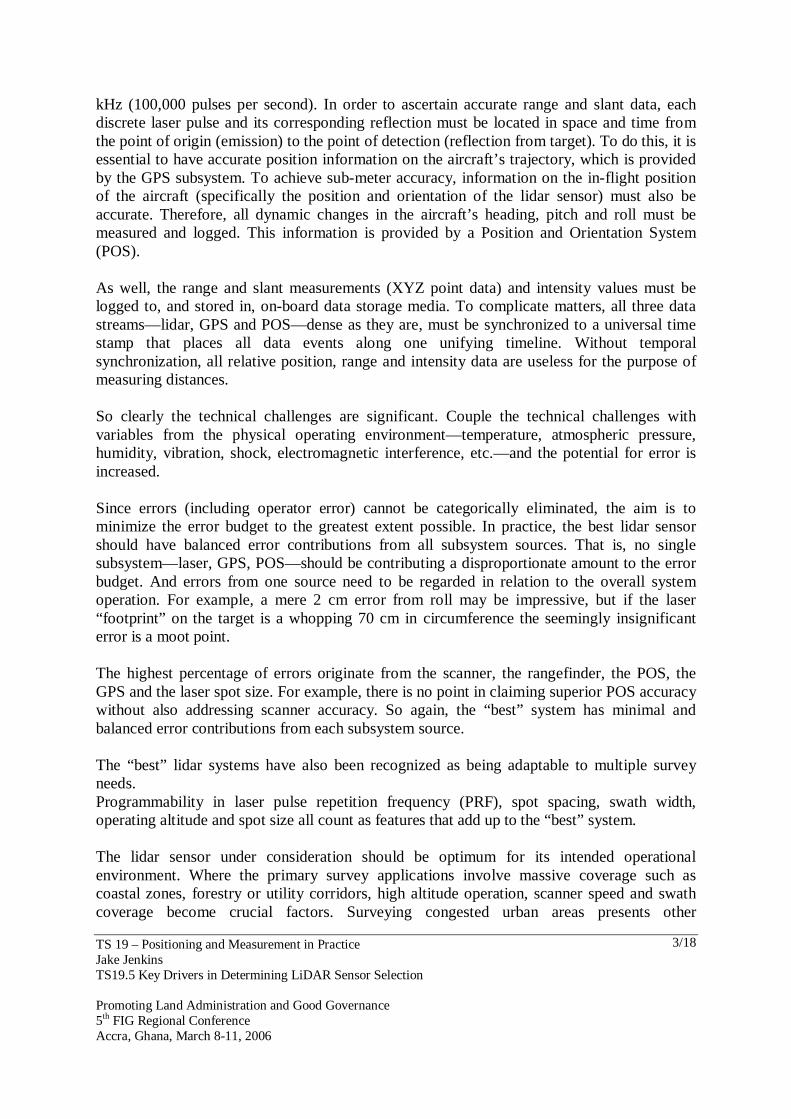
Data Processing Power
The fastest, most accurate lidar sensor will not produce useful results without a fully developed data processing infrastructure in place. Downloading, file management, pre-processing, data storage, decoding, filtering, data analysis, troubleshooting, processing support, server capabilities, training—all these must be in place and well organized to output the desired data. What can the provider tell you about
TS 19 – Positioning and Measurement in Practice Jake Jenkins TS19.5 Key Drivers in Determining LiDAR Sensor Selection Promoting Land Administration and Good Governance 5th FIG Regional Conference Accra, Ghana, March 8-11, 2006
6/18
Non-Technical Driver Considerations
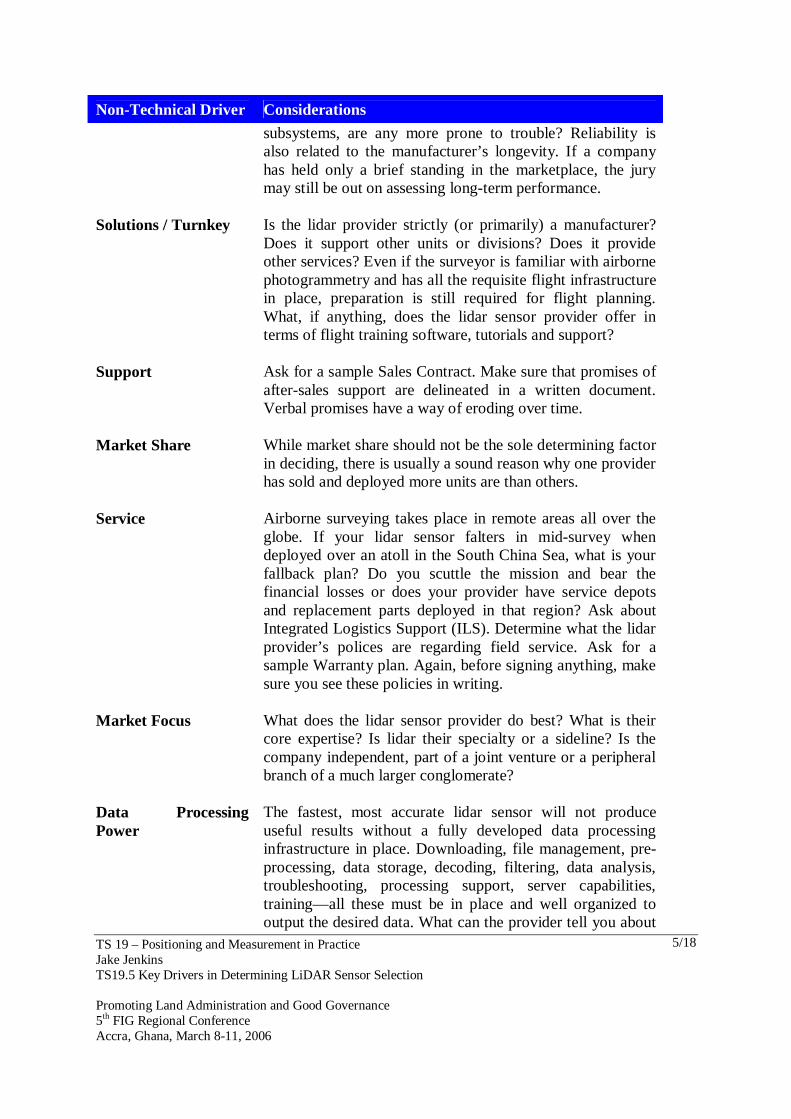
effective post-processing operations?
Upgradeability Does an upgrade require replacing the core system, or are incremental upgrades available? Are firmware, software, feature and option upgrades possible?
Product Roadmap Where the company is investing its R&D dollars can be telling. Is lidar an offshoot of another enterprise within the company? Has the company staked its reputation on advancing the lidar industry? What are the company’s plans for adapting, evolving and refining the state-of-the-art in lidar applications? What new models and model features are envisioned? Are new applications being aggressively investigated? Is there movement toward combining lidar sensing with other remote sensing technologies?
Leadership How long has the company been involved in designing, manufacturing, deploying and servicing airborne lidar sensors? Is the company currently engaged with other global agencies/companies? Does the company have an active role with governmental, scientific or educational research focused on advancing the potential for remote sensing through lidar? Are the company’s products at the vanguard of development? Or does the company’s strength lie in imitation and emulation?
Related to a number of non-technical drivers is the question of companies consolidating. For example, Leica acquired Azimuth, Hexagon acquired Leica, BLOM acquired TopEye, etc. TopEye systems are no longer manufactured, and there are currently multiple resellers of Riegl systems. A possible benefit from such mergers is that the strengths of one company may reinforce the complementary assets of another company. There has been speculation on several new engineering designs as a result of consolidation, but it is still too early to evaluate the efficiencies of prototype sensors that have not yet been fully field tested and qualified. A possible drawback of consolidation is that it can destabilize a product. Corporate mergers can directly affect the lidar equipment owner. Future availability of replacement parts/add-on options, applicability of Warranty items, changes in support packages, viability of long-term upgrading are all serious issues that could be complicated or even compromised when the contract in place at the time of sale shifts to the aegis of a different company with different standards and practices.

TS 19 – Positioning and Measurement in Practice Jake Jenkins TS19.5 Key Drivers in Determining LiDAR Sensor Selection Promoting Land Administration and Good Governance 5th FIG Regional Conference Accra, Ghana, March 8-11, 2006
7/18
In this discussion the focus is on four principal manufacturers: Optech Incorporated, Leica, TopoSys and IGI. 5. COMPARING CRITICAL SPECIFICATIONS The following section compares the key specifications of four different lidar systems: − Optech ALTM 3100 − Leica ALS-50 − TopoSys Falcon III − IGI LM5600. Overall, the key specifications are similar among the four systems. Operating altitude ranges from 50 m to 3500 m above ground level (AGL), with 2000 m AGL representing a typical altitude. Range accuracy is from 5 cm to 75 cm with 15 cm typical. The scanner field-of view (FOV) spans from 20° to 75° with 40° being typical. The laser PRF ranges from 12 kHz to 125 kHz with ~70 kHz being typical. Most systems provide a laser reflectance (intensity) feature. LIDAR Specifications Table 1: Critical specifications among four airborne lidar systems.*
Maximum Altitude
Swath Width
Roll Accuracy
Laser Rate /Eff. Laser Rate
Beam Divergence
Optech ALTM3100
3500 m 60° 0.005° 100 kHz / 97 kHz
0.2 mrad (narrow); 0.8 mrad (wide)
Leica ALS50
5000 m (std. system: 3000 m)
75° 0.005° 83 kHz / 65 kHz
0.33 mrad
TopoSys Falcon III
2500 m 20° 0.01° 125 kHz / 25 kHz
0.7 mrad
IGI LM560 1600 m 60° 0.01° 100 kHz / 66 kHz
0.5 mrad
*Specifications summarized in GIM International, “Product Survey on Airborne Laserscanners” May 2004, and manufacturers’ websites. 6. SPECIFICATION MIX Operating altitude, laser scan rate, FOV, range accuracy and laser PRF are routinely quoted as separate items in an effort to demonstrate the superiority of a particular system. But true system efficiency must be determined by the sum of all system specifications. Ideally, a picture of the balanced system emerges with no unexpected deficits in any one area. For
TS 19 – Positioning and Measurement in Practice Jake Jenkins TS19.5 Key Drivers in Determining LiDAR Sensor Selection Promoting Land Administration and Good Governance 5th FIG Regional Conference Accra, Ghana, March 8-11, 2006
8/18
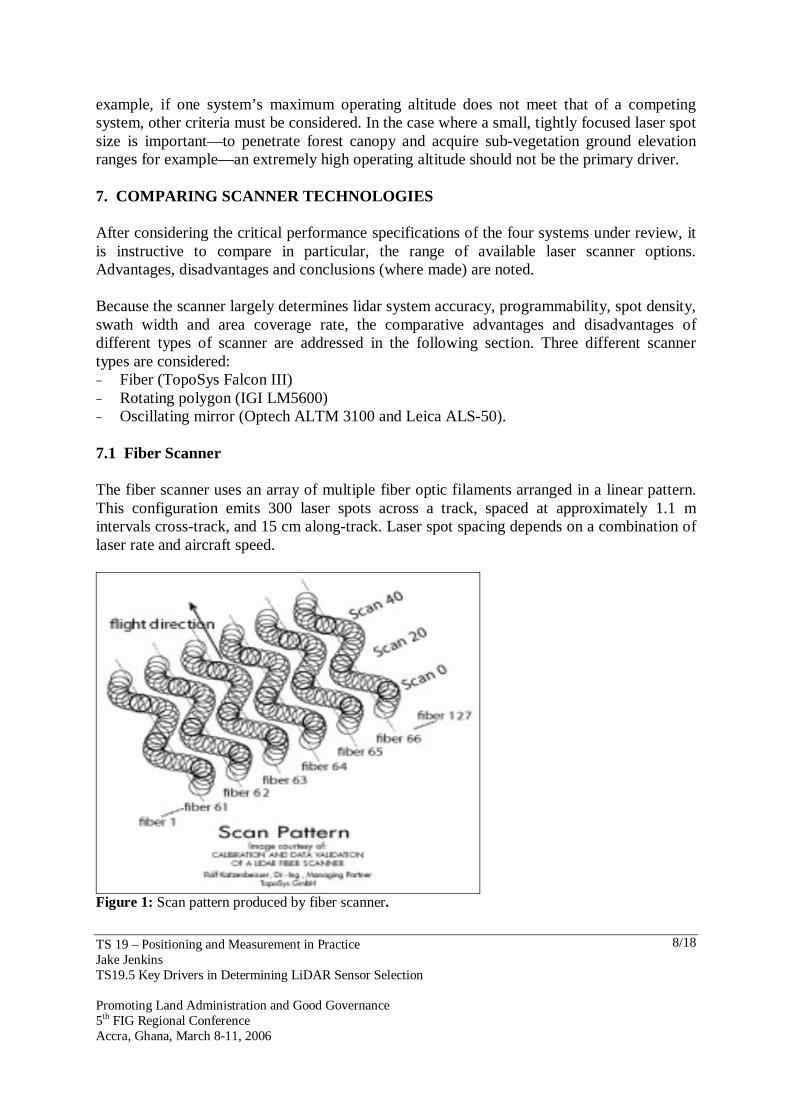
example, if one system’s maximum operating altitude does not meet that of a competing system, other criteria must be considered. In the case where a small, tightly focused laser spot size is important—to penetrate forest canopy and acquire sub-vegetation ground elevation ranges for example—an extremely high operating altitude should not be the primary driver. 7. COMPARING SCANNER TECHNOLOGIES After considering the critical performance specifications of the four systems under review, it is instructive to compare in particular, the range of available laser scanner options. Advantages, disadvantages and conclusions (where made) are noted. Because the scanner largely determines lidar system accuracy, programmability, spot density, swath width and area coverage rate, the comparative advantages and disadvantages of different types of scanner are addressed in the following section. Three different scanner types are considered: − Fiber (TopoSys Falcon III) − Rotating polygon (IGI LM5600) − Oscillating mirror (Optech ALTM 3100 and Leica ALS-50). 7.1 Fiber Scanner The fiber scanner uses an array of multiple fiber optic filaments arranged in a linear pattern. This configuration emits 300 laser spots across a track, spaced at approximately 1.1 m intervals cross-track, and 15 cm along-track. Laser spot spacing depends on a combination of laser rate and aircraft speed.
Figure 1: Scan pattern produced by fiber scanner.

TS 19 – Positioning and Measurement in Practice Jake Jenkins TS19.5 Key Drivers in Determining LiDAR Sensor Selection Promoting Land Administration and Good Governance 5th FIG Regional Conference Accra, Ghana, March 8-11, 2006
9/18
Table 2: Fiber scanner properties.
Advantages Disadvantages Conclusions
A rigid relationship between pixels.
Fixed FOV of 20° total. This limits the swath to a width of 35% of altitude, thereby necessitating more flight time which results in higher operational costs.
Digital Terrain Model (DTM) or contour output software may balk at irregular density of resulting data.
After calibration in the lab the fibers should never move.
Very uneven scan pattern: 1.1 m across-track and 10 cm along-track. This results in an acquisition deficit in surface target details.
No built-in roll compensation.
Repeatable scan pattern. A comparatively large laser footprint of 70 cm. Heavy over-sampling taxes the effective data capture rate by 80%.
No possibility to redirect the scanner for special survey applications.
The lack of variable tilt in the scanning mechanism requires more flight time to complete area coverage.
Cannot reduce the scan angle (e.g., to minimize data cloaked by shadows in urban areas) without discarding data).
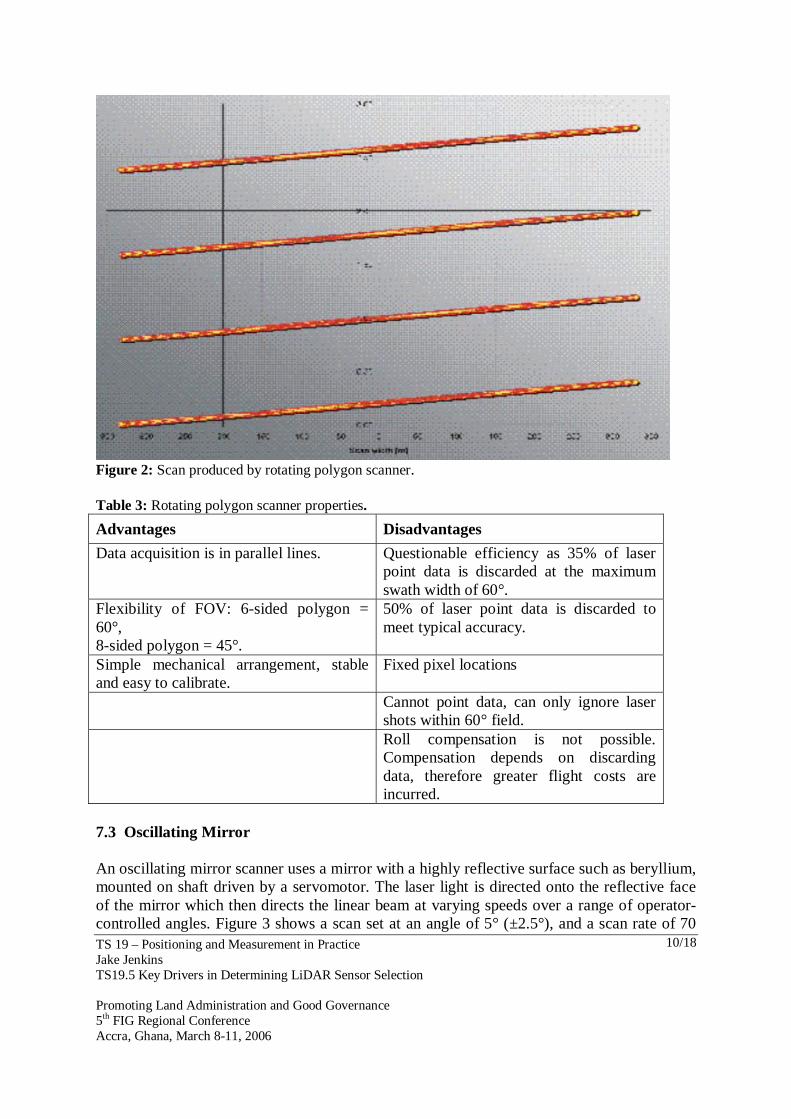
7.2 Rotating Polygon In a rotating polygon scanner, laser light is directed to, and reflected off the planar faces of a rotating polygon (square). Laser shots from close to the edges (i.e., corners of the polygon) are discarded in a data processing stage.
TS 19 – Positioning and Measurement in Practice Jake Jenkins TS19.5 Key Drivers in Determining LiDAR Sensor Selection Promoting Land Administration and Good Governance 5th FIG Regional Conference Accra, Ghana, March 8-11, 2006
10/18
Figure 2: Scan produced by rotating polygon scanner. Table 3: Rotating polygon scanner properties.
Advantages Disadvantages
Data acquisition is in parallel lines. Questionable efficiency as 35% of laser point data is discarded at the maximum swath width of 60°.
Flexibility of FOV: 6-sided polygon = 60°, 8-sided polygon = 45°.
50% of laser point data is discarded to meet typical accuracy.
Simple mechanical arrangement, stable and easy to calibrate.
Fixed pixel locations
Cannot point data, can only ignore laser shots within 60° field.
Roll compensation is not possible. Compensation depends on discarding data, therefore greater flight costs are incurred.
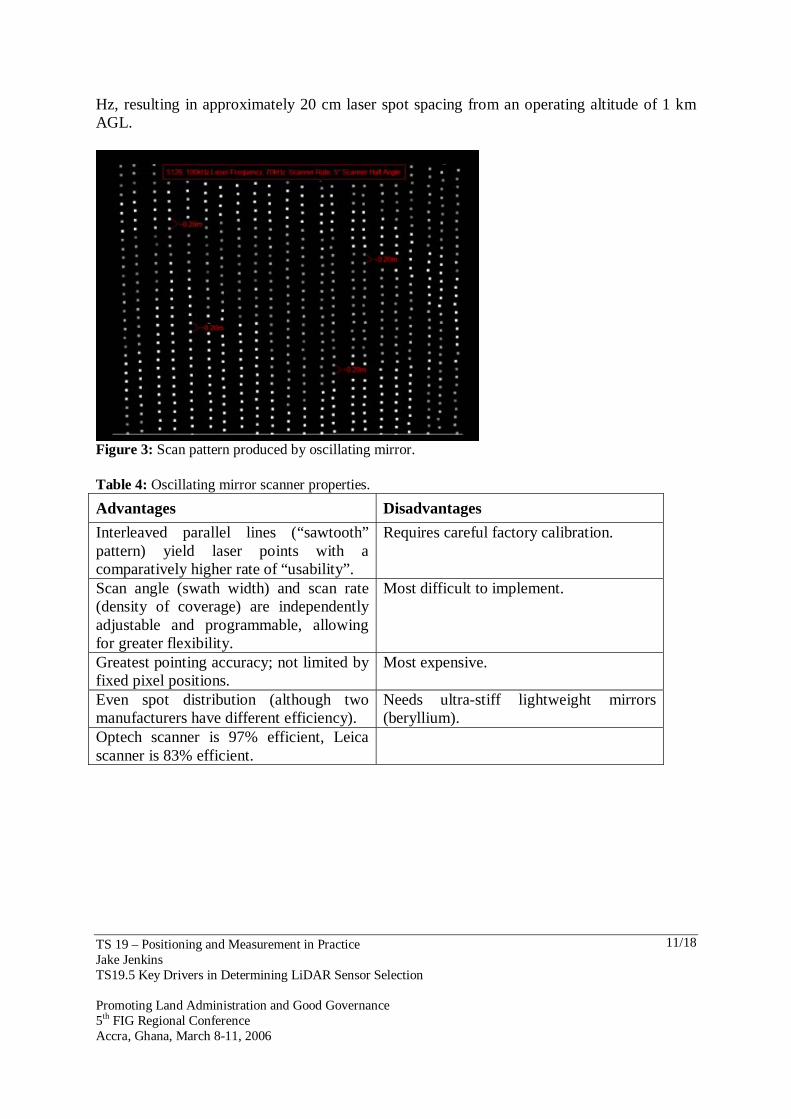
7.3 Oscillating Mirror An oscillating mirror scanner uses a mirror with a highly reflective surface such as beryllium, mounted on shaft driven by a servomotor. The laser light is directed onto the reflective face of the mirror which then directs the linear beam at varying speeds over a range of operator-controlled angles. Figure 3 shows a scan set at an angle of 5° (±2.5°), and a scan rate of 70
TS 19 – Positioning and Measurement in Practice Jake Jenkins TS19.5 Key Drivers in Determining LiDAR Sensor Selection Promoting Land Administration and Good Governance 5th FIG Regional Conference Accra, Ghana, March 8-11, 2006
11/18
Hz, resulting in approximately 20 cm laser spot spacing from an operating altitude of 1 km AGL.
Figure 3: Scan pattern produced by oscillating mirror. Table 4: Oscillating mirror scanner properties.
Advantages Disadvantages
Interleaved parallel lines (“sawtooth” pattern) yield laser points with a comparatively higher rate of “usability”.
Requires careful factory calibration.
Scan angle (swath width) and scan rate (density of coverage) are independently adjustable and programmable, allowing for greater flexibility.
Most difficult to implement.
Greatest pointing accuracy; not limited by fixed pixel positions.
Most expensive.
Even spot distribution (although two manufacturers have different efficiency).
Needs ultra-stiff lightweight mirrors (beryllium).
Optech scanner is 97% efficient, Leica scanner is 83% efficient.
TS 19 – Positioning and Measurement in Practice Jake Jenkins TS19.5 Key Drivers in Determining LiDAR Sensor Selection Promoting Land Administration and Good Governance 5th FIG Regional Conference Accra, Ghana, March 8-11, 2006
12/18
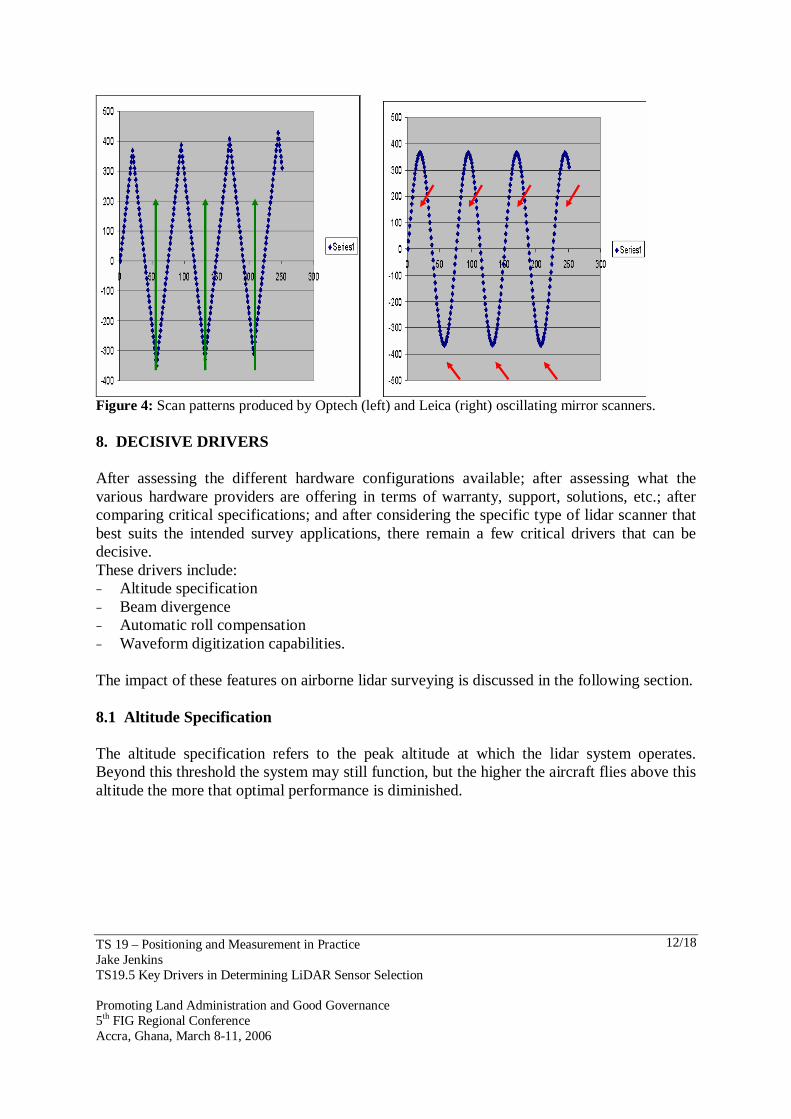
Figure 4: Scan patterns produced by Optech (left) and Leica (right) oscillating mirror scanners. 8. DECISIVE DRIVERS After assessing the different hardware configurations available; after assessing what the various hardware providers are offering in terms of warranty, support, solutions, etc.; after comparing critical specifications; and after considering the specific type of lidar scanner that best suits the intended survey applications, there remain a few critical drivers that can be decisive. These drivers include: − Altitude specification − Beam divergence − Automatic roll compensation − Waveform digitization capabilities. The impact of these features on airborne lidar surveying is discussed in the following section. 8.1 Altitude Specification The altitude specification refers to the peak altitude at which the lidar system operates. Beyond this threshold the system may still function, but the higher the aircraft flies above this altitude the more that optimal performance is diminished.
TS 19 – Positioning and Measurement in Practice Jake Jenkins TS19.5 Key Drivers in Determining LiDAR Sensor Selection Promoting Land Administration and Good Governance 5th FIG Regional Conference Accra, Ghana, March 8-11, 2006
13/18
Table 5: Peak altitude performance among four airborne lidar systems.
Altitude Observations
Leica 5000 m (customized system)
The higher altitude performance requires a larger mirror, which can degrade performance.
TopoSys 2500 m
Operating at this altitude reduced the normal stated accuracy; 3-meter data gaps were noted at the maximum altitude.
IGI 1500 m to 80% target Only grass or dry cement is this bright.
Optech 3500 m to 10% target Target example: black pavement.
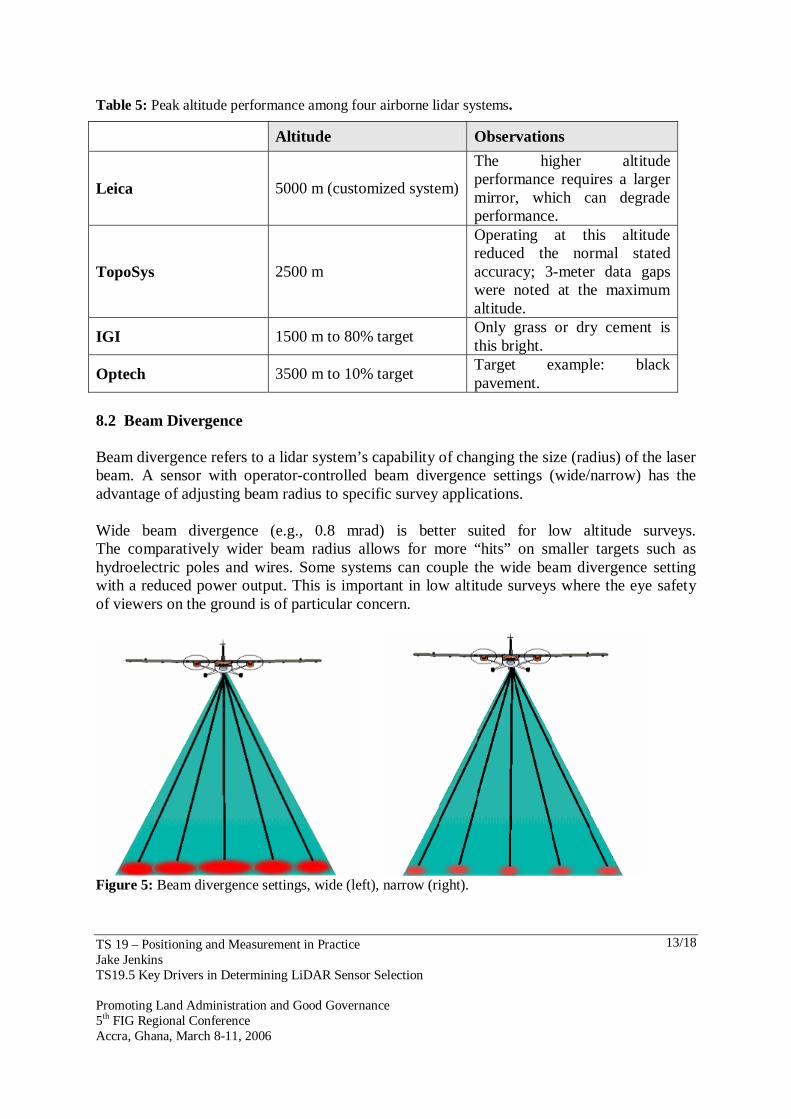
8.2 Beam Divergence Beam divergence refers to a lidar system’s capability of changing the size (radius) of the laser beam. A sensor with operator-controlled beam divergence settings (wide/narrow) has the advantage of adjusting beam radius to specific survey applications. Wide beam divergence (e.g., 0.8 mrad) is better suited for low altitude surveys. The comparatively wider beam radius allows for more “hits” on smaller targets such as hydroelectric poles and wires. Some systems can couple the wide beam divergence setting with a reduced power output. This is important in low altitude surveys where the eye safety of viewers on the ground is of particular concern.
Figure 5: Beam divergence settings, wide (left), narrow (right).
TS 19 – Positioning and Measurement in Practice Jake Jenkins TS19.5 Key Drivers in Determining LiDAR Sensor Selection Promoting Land Administration and Good Governance 5th FIG Regional Conference Accra, Ghana, March 8-11, 2006
14/18
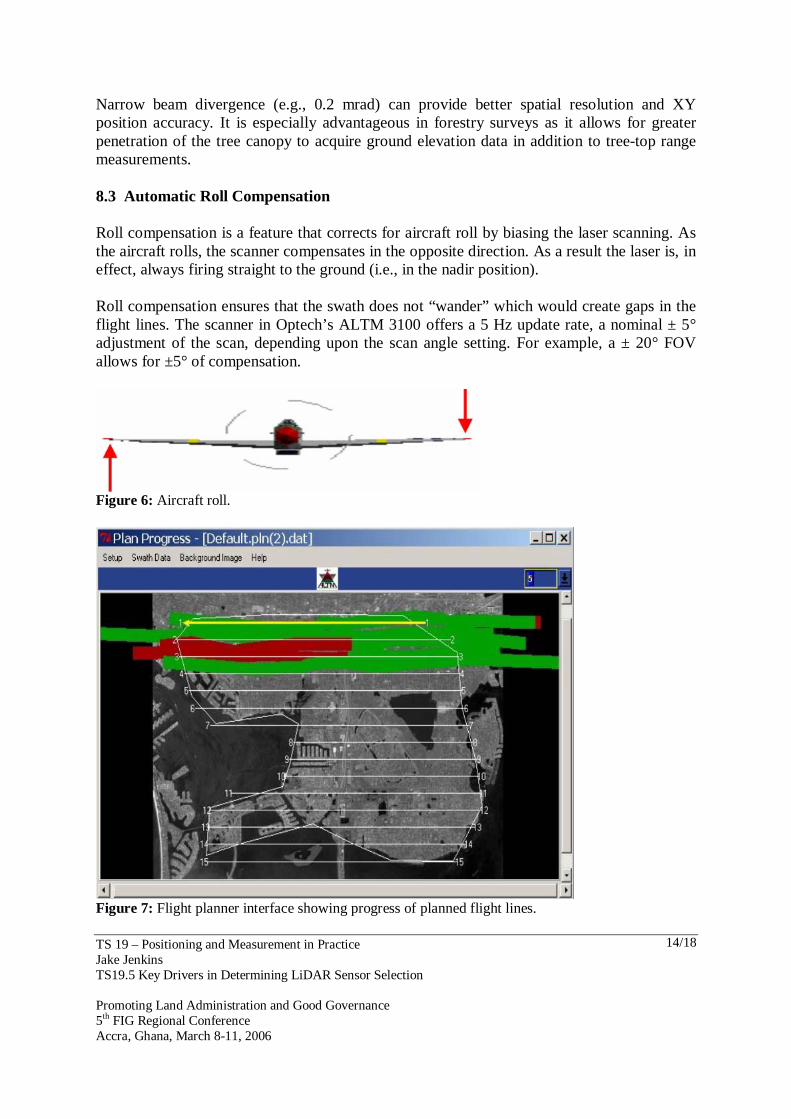
Narrow beam divergence (e.g., 0.2 mrad) can provide better spatial resolution and XY position accuracy. It is especially advantageous in forestry surveys as it allows for greater penetration of the tree canopy to acquire ground elevation data in addition to tree-top range measurements. 8.3 Automatic Roll Compensation Roll compensation is a feature that corrects for aircraft roll by biasing the laser scanning. As the aircraft rolls, the scanner compensates in the opposite direction. As a result the laser is, in effect, always firing straight to the ground (i.e., in the nadir position). Roll compensation ensures that the swath does not “wander” which would create gaps in the flight lines. The scanner in Optech’s ALTM 3100 offers a 5 Hz update rate, a nominal ± 5° adjustment of the scan, depending upon the scan angle setting. For example, a ± 20° FOV allows for ±5° of compensation.
Figure 6: Aircraft roll.
Figure 7: Flight planner interface showing progress of planned flight lines.
TS 19 – Positioning and Measurement in Practice Jake Jenkins TS19.5 Key Drivers in Determining LiDAR Sensor Selection Promoting Land Administration and Good Governance 5th FIG Regional Conference Accra, Ghana, March 8-11, 2006
15/18
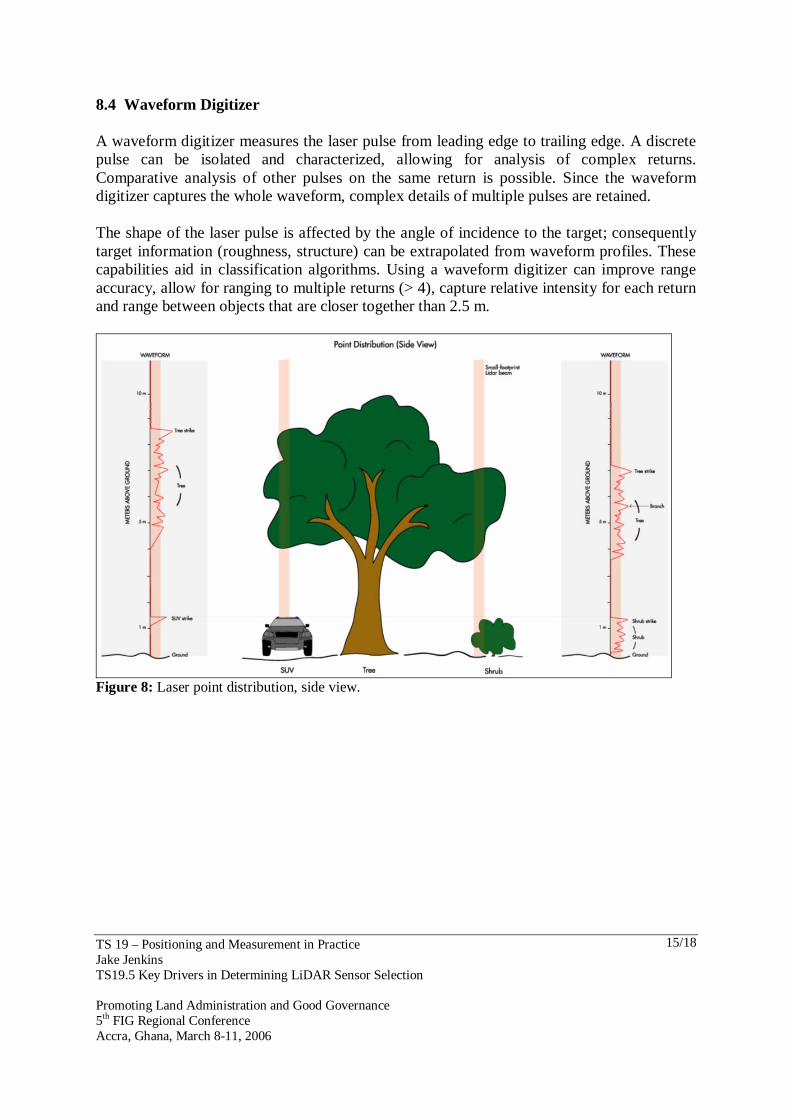
8.4 Waveform Digitizer A waveform digitizer measures the laser pulse from leading edge to trailing edge. A discrete pulse can be isolated and characterized, allowing for analysis of complex returns. Comparative analysis of other pulses on the same return is possible. Since the waveform digitizer captures the whole waveform, complex details of multiple pulses are retained. The shape of the laser pulse is affected by the angle of incidence to the target; consequently target information (roughness, structure) can be extrapolated from waveform profiles. These capabilities aid in classification algorithms. Using a waveform digitizer can improve range accuracy, allow for ranging to multiple returns (> 4), capture relative intensity for each return and range between objects that are closer together than 2.5 m.
Figure 8: Laser point distribution, side view.
TS 19 – Positioning and Measurement in Practice Jake Jenkins TS19.5 Key Drivers in Determining LiDAR Sensor Selection Promoting Land Administration and Good Governance 5th FIG Regional Conference Accra, Ghana, March 8-11, 2006
16/18
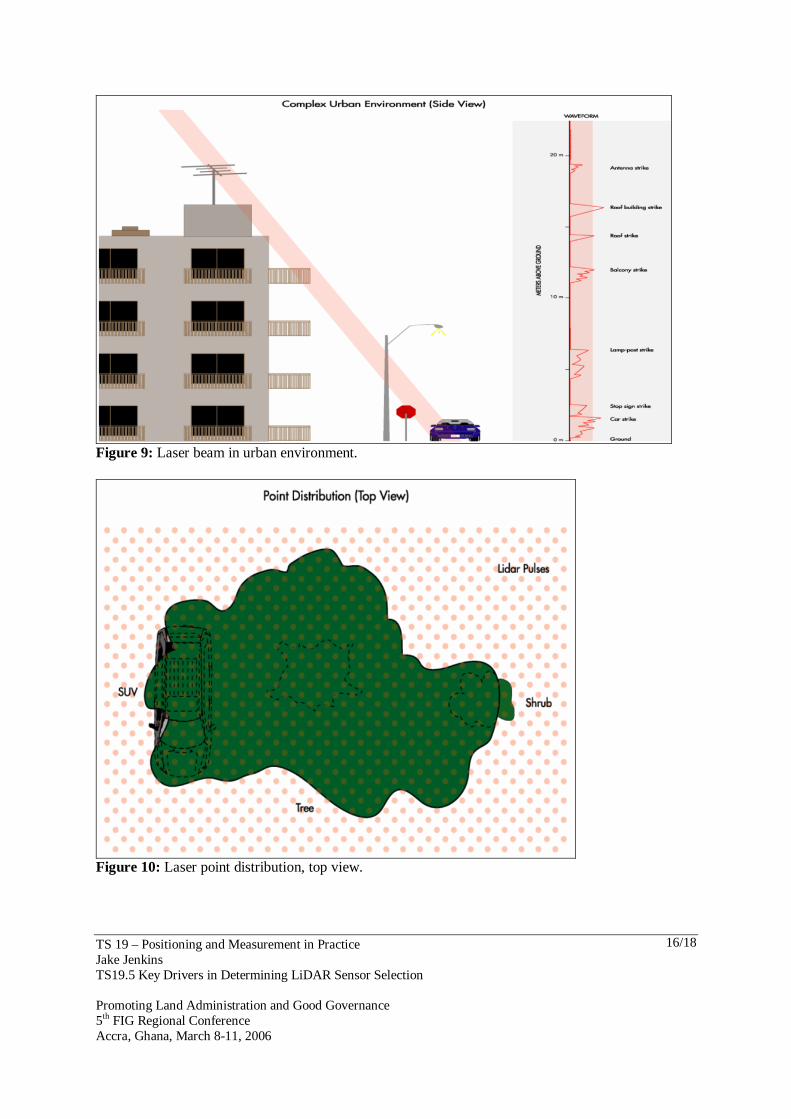
Figure 9: Laser beam in urban environment.
Figure 10: Laser point distribution, top view.
TS 19 – Positioning and Measurement in Practice Jake Jenkins TS19.5 Key Drivers in Determining LiDAR Sensor Selection Promoting Land Administration and Good Governance 5th FIG Regional Conference Accra, Ghana, March 8-11, 2006
17/18
9. CONCLUSION Lidar is a relatively new technology. As such, it is contributing significantly to the growth of the survey industry. As the technical capabilities of lidar sensors continue to evolve, new surveying possibilities and opportunities arise. Any decision to invest in an evolving technology must be carefully researched. When comparing specifications from competing lidar systems the critical criterion in choosing a particular sensor should be the overall instrument efficiency. The fully informed investor in does not overvalue any single specification irrespective of others in the mix because any single specification can easily be taken out of context. The key is having a clear objective based on the types of surveying anticipated and planning for operational flexibility in the future. Let the overall efficiency of the lidar system guide any final purchase decision.
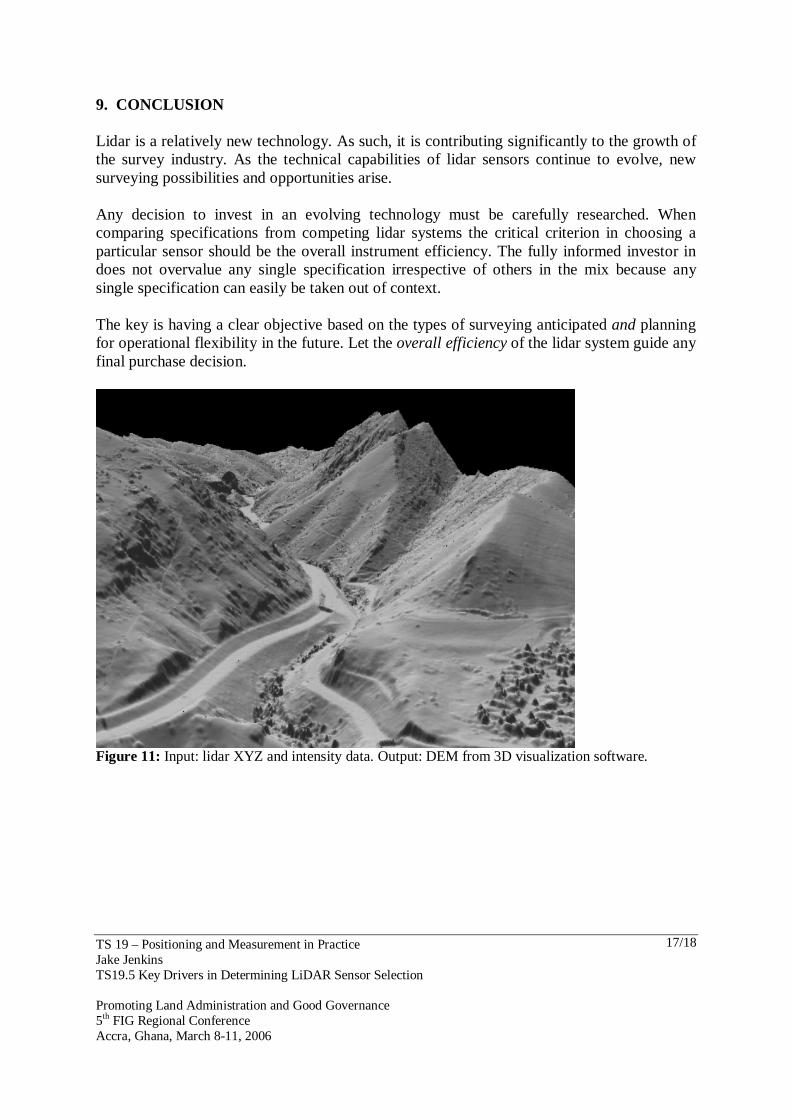
Figure 11: Input: lidar XYZ and intensity data. Output: DEM from 3D visualization software.

TS 19 – Positioning and Measurement in Practice Jake Jenkins TS19.5 Key Drivers in Determining LiDAR Sensor Selection Promoting Land Administration and Good Governance 5th FIG Regional Conference Accra, Ghana, March 8-11, 2006
18/18
CONTACTS L.G. (Jake) Jenkins Director, Airborne Terrestrial Survey Division Optech Incorporated 100 Wildcat Rd Toronto, M3J 2Z9 Ontario CANADA Tel. + 1 416 661 5904 ext. 400 Fax + 1 416 661 4168 Email: [email protected]