key messages and issues arising from the new … · key messages and issues arising from the new...
TRANSCRIPT

© Yann Arthus-Bertrand / Altitude
Key messages and issues arisingfrom the New IPCC Report
Key messages and issues arisingfrom the New IPCC Report
Thomas Stocker & Qin Dahe259 Authors and Review Editors
WGI TSU Team

Key SPM Messages
19 Headlineson less than 2 Pages
2
14 Chapters & Atlas
1,100,000 Words
Summary for Policymakers
14,000 Words

Key SPM Messages
19 Headlineson less than 2 Pages
3
14 Chapters & Atlas
1,100,000 Words
Summary for Policymakers
14,000 Words
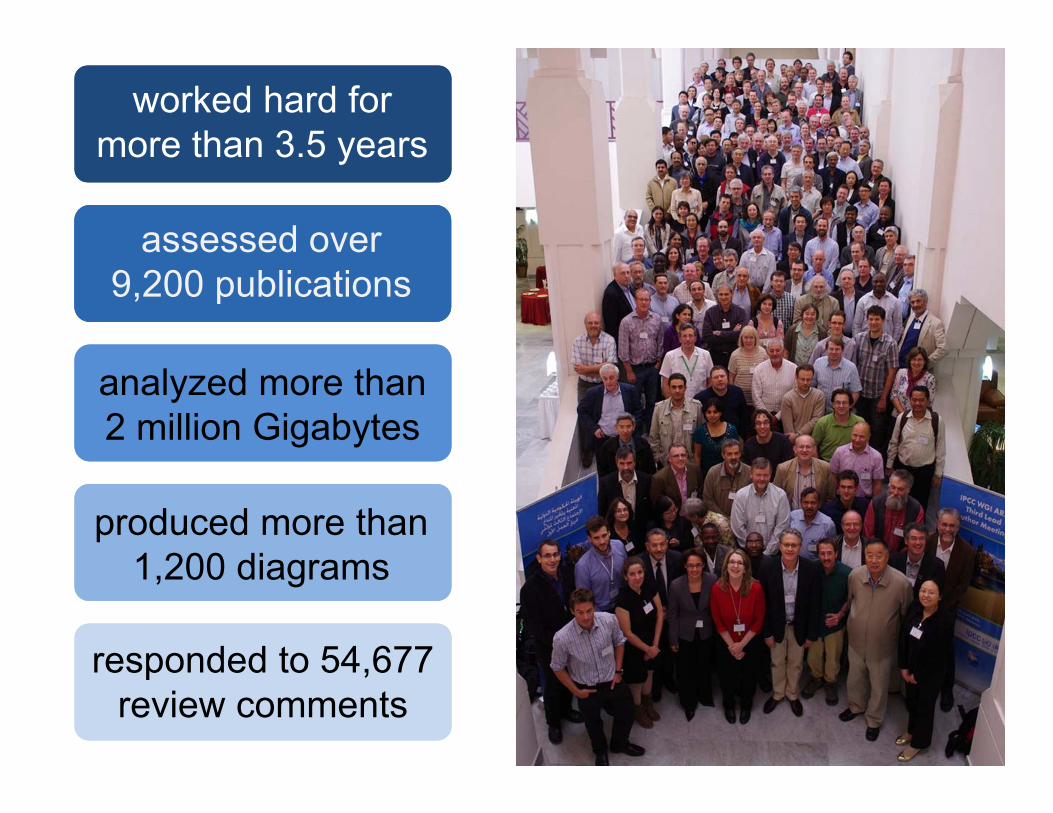
assessed over 9,200 publications
worked hard for more than 3.5 years
analyzed more than 2 million Gigabytes
produced more than 1,200 diagrams
responded to 54,677 review comments
5
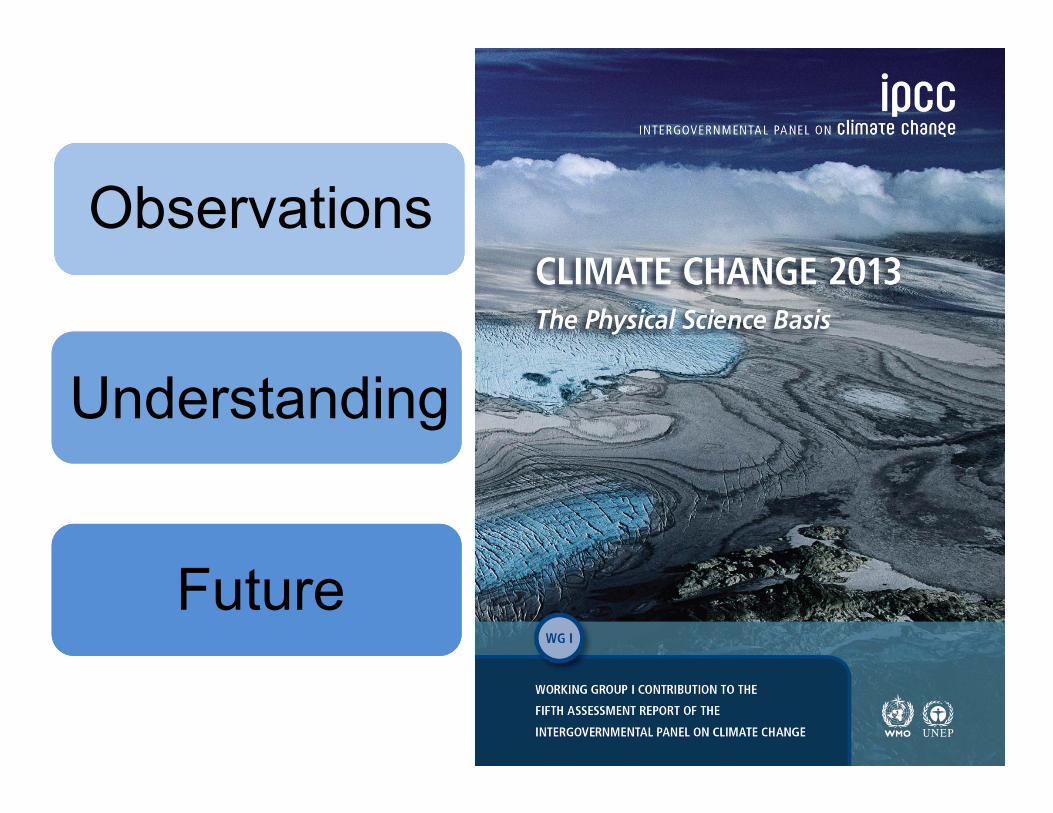
Observations
Understanding
Future
ObservationWhat has changed?

Each of the last three decades has been successively warmer at the Earth’s surface than any preceding decade since 1850.
In the Northern Hemisphere, 1983–2012 was likely the warmest 30-year period of the last 1400 years (medium confidence).
Fig. SPM.1a
Ano
mal
y (°
C) r
elat
ive
to 1
961-
1990
© IP
CC
201
3

Warming of the climate systemis unequivocal
Fig.
SP
M.1
b
Temperature Difference 1901 to 2012 based on trend (°C)
© IPCC 2013


Fig.
TS
.3
Ice loss from Glaciers 226 (±60%) Gt yr-1 (1993-2009)
Greenland 215 (±25%) Gt yr-1 (2002-2011)
Antarctica 147 (±50%) Gt yr-1 (2002-2011)
© IPCC 2013
100 Gt yr-1 of ice loss corresponds to 0.28 mm yr-1 of global mean sea level rise

Fig. 3.1
© IPCC 2013
It is virtually certain that the upper ocean (0-700 m) warmed from 1971 to 2010, [...]. It is likely that the ocean
warmed between 700 and 2000 m from 1957 to 2009.
Change in upper ocean temperature (°C)

Ene
rgy
(102
1Jo
ules
)
Ocean warming dominates the increase in energy stored in the climate system, accounting for more than 90% of the energy accumulated between 1971 and 2010 (high confidence).
Box 3.1, Fig. 1© IPCC 2013

UnderstandingWhy has it changed?

Global mean warming since 1951 (°C)
Solar, Volcanic
Aerosols
CO2, CH4, N2O
Anthropogenic
Internal Variability
Observed
Fig. TS.10
The observed warming 1951−2010 is approximately 0.6°C to 0.7°C.
© IP
CC
201
3

Global mean warming since 1951 (°C)
Solar, Volcanic
Aerosols
CO2, CH4, N2O
Anthropogenic
Internal Variability
Observed
Fig. TS.10
It is extremely likely that human influence hasbeen the dominant cause of the observed
warming since the mid-20th century.
© IP
CC
201
3

FutureHow will it change?

Fig. SPM.7a
Global surface temperature change for the end of the 21st century is likely to exceed 1.5°C relative to
1850−1900 for all scenarios except RCP2.6.
Global mean surface temperature change from 1986-2005
© IP
CC
201
3

TS T
FE.1
, Fig
. 2
The contrast in precipitation between wet and dry regions and between wet and dry seasons will increase, [...]
© IP
CC
201
3
Change in water cycle properties from 1986-2005 to 2081-2100 in RCP8.5

RCP2.6 (2081-2100), likely range: 26 to 55 cmRCP8.5 (in 2100), likely range: 52 to 98 cm
Fig. SPM.9
© IP
CC
201
3

Fig.
SP
M.1
0
790 Bill. t C790 Bill. t C
Limiting climate change will require substantial and sustained reductions
of greenhouse gas emissions.

Limiting climate change will require substantial and sustained reductions of
greenhouse gas emissions.
Budget for the 2°C target: 790 Bill. t CCO2 emitted until 2011: −515 Bill. t C
CO2 emissions 2012: 9.7 Bill. t C/yr
Remaining emissions: 275 Bill. t C

RCP8.5CO2eq = 1313 ppm
IPC
C 2
013,
Fig
. SP
M.8
RCP2.6CO2eq = 475 ppm
We have a choice.

© Yann Arthus-Bertrand / Altitude
www.climatechange2013.orgwww.climatechange2013.orgFurther InformationFurther Information
Full report and backgroundinformation now available
Full report and backgroundinformation now available