key ratio analysis: calculating the numbers...
TRANSCRIPT

1
Speaker: David Osburn, MBA, CCRA
Date: June 14, 2016
Time: 2:00pm-5:00pm
Session Number: 25053
KEY RATIO ANALYSIS:
CALCULATING THE NUMBERS
CORRECTLY!

KEY RATIO ANALYSIS: CALCULATING THE NUMBERS CORRECTLY
I. Who Uses Key Ratio Analysis
II. The Five Step Key Ratio Analysis Plan-Basics
III. Accounting Basics
IV. The Five Step Key Ratio Analysis Plan- Expanded
V. Other Issues in Key Ratio Analysis
2

I. Who Uses Key Ratio Analysis?
Credit: Bank loan officers and bond rating analysts
ascertain company’s ability to pay its debts.
Investment: Stock analysts- assess company’s
efficiency, risk, and growth.
Management: Business owners and managers- analyze,
control, and improve their firm’s operations.
Guarantor: Business owners- use “related” analysis to
determine their personal financial position.
3

II. The Five Step Key Ratio Analysis Plan-Basics
a. Liquidity
b. Activity
c. Leverage
d. Operating Performance
e. Cash Flow
4
III. Accounting Basics
Four Basic Financial Statements
a. Income Statement
b. Statement of Owner’s Equity
c. Balance Sheet
d. Statement of Cash Flows
5
Types of Statements:
Audit
a. Unqualified Audit
b. Qualified Audit
c. Adverse
d. Disclaimer
Other
a. Reviewed
b. Compiled
c. Company prepared
6

IV. The Five Step Key Ratio Analysis Plan-Expanded
a. Liquidity:
Working Capital: Current Assets- Current Liabilities
Current Ratio: Current Assets/Current Liabilities
Quick/Acid Test Ratio: Current Assets-Inventory/Current Liabilities
b. Activity:
Accounts Receivable Turnover: A/R/Sales X Days in Period
Accounts Payable Turnover: A/P/COGS X Days in Period
Inventory Turnover: Inventory/COGS X Days in Period
7

c. Leverage
Debt Ratio= Debt/Net Worth (Equity)
8
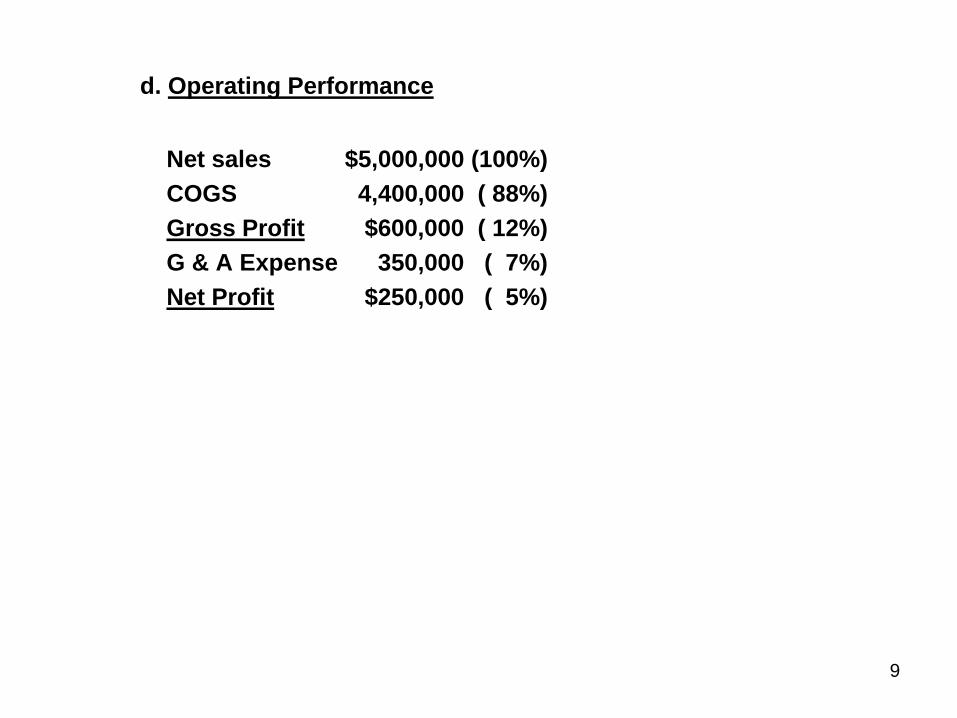
d. Operating Performance
Net sales $5,000,000 (100%)
COGS 4,400,000 ( 88%)
Gross Profit $600,000 ( 12%)
G & A Expense 350,000 ( 7%)
Net Profit $250,000 ( 5%)
9

e. Cash Flow:
Traditional Cash Flow Analysis
EBITDA $1,200M
Less: Debt Ser. (P&I) 500M
Margin $700M
DCR 2.4X
(EBITDA = Net Profit + Interest Expense + Taxes + Depreciation + Amortization)
Note: Most lenders require a minimum DCR of 1.20X
10

F. Personal Cash Flow (Business Owner/Guarantor) Salary + Business Income+ $500M Rental Income, K-1 Pass-Through, etc. = Total Income Less: Federal & State Taxes 150M Cash Flow Available $350M For Debt Service Less: Debt Service (P&I) $200M Margin $150M DCR 1.75X Note: Most lenders want to see a minimum guarantor DCR of 1.00x to 1.40X
11
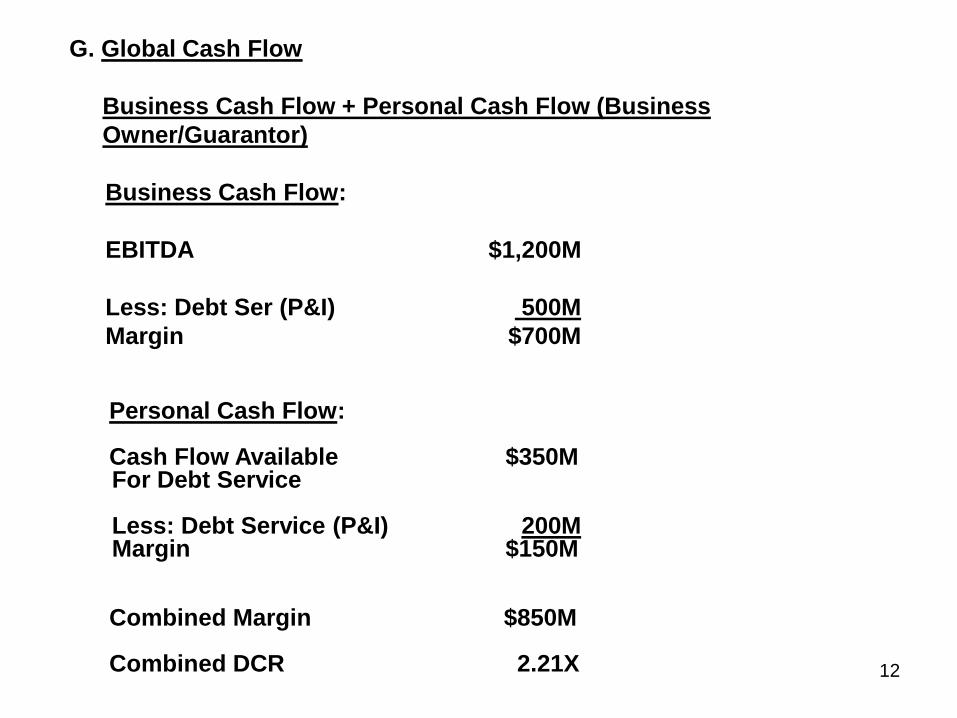
G. Global Cash Flow
Business Cash Flow + Personal Cash Flow (Business
Owner/Guarantor)
Business Cash Flow:
EBITDA $1,200M
Less: Debt Ser (P&I) 500M
Margin $700M
Personal Cash Flow: Cash Flow Available $350M For Debt Service Less: Debt Service (P&I) 200M Margin $150M Combined Margin $850M Combined DCR 2.21X 12
V. Other Issues in Key Ratio Analysis
a. Industry Comparisons (RMA, S&P, D&B, Local Trade Group)
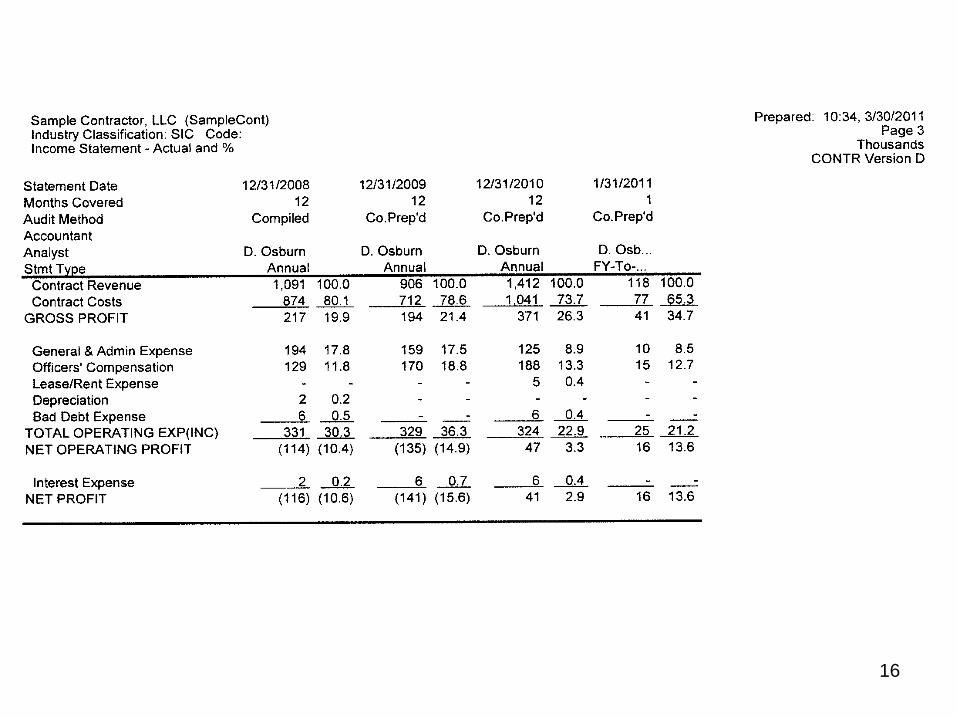
b. Spreading a Financial Statement (See Attached)
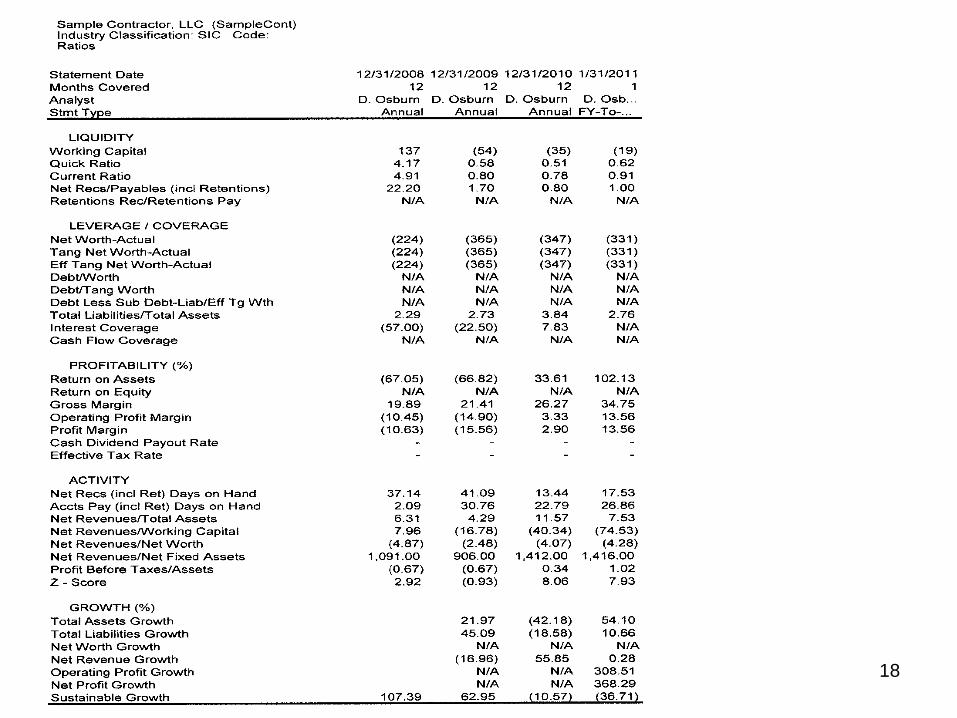
c. Z-Score (Bankruptcy Predictor) (See Attached)
d. Sustainable Growth Model (See Attached)
13

14

15
16

17
18

19
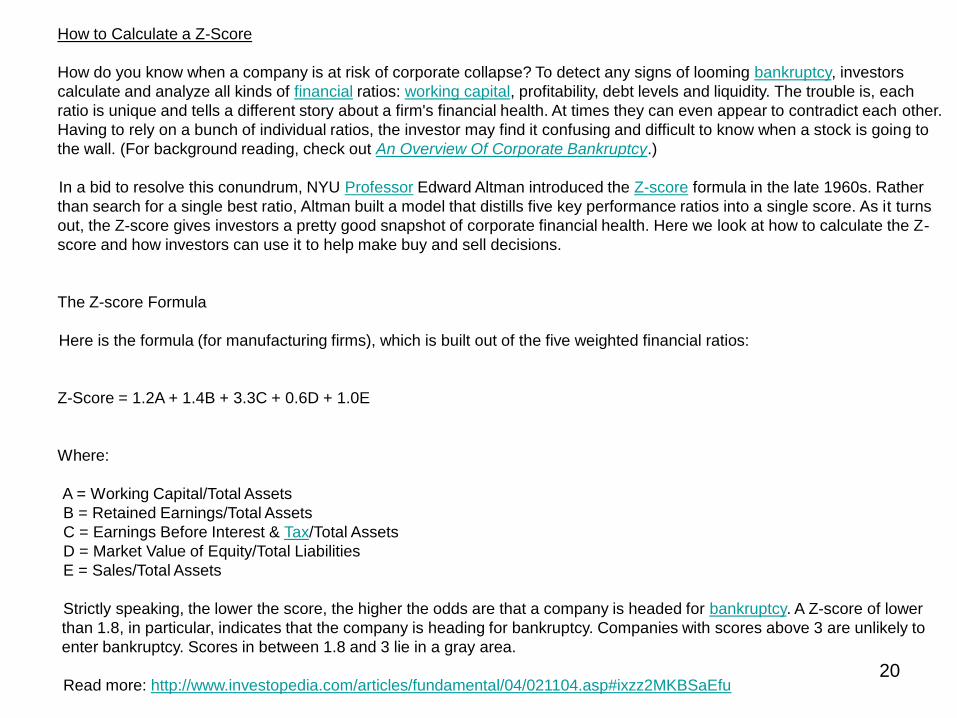
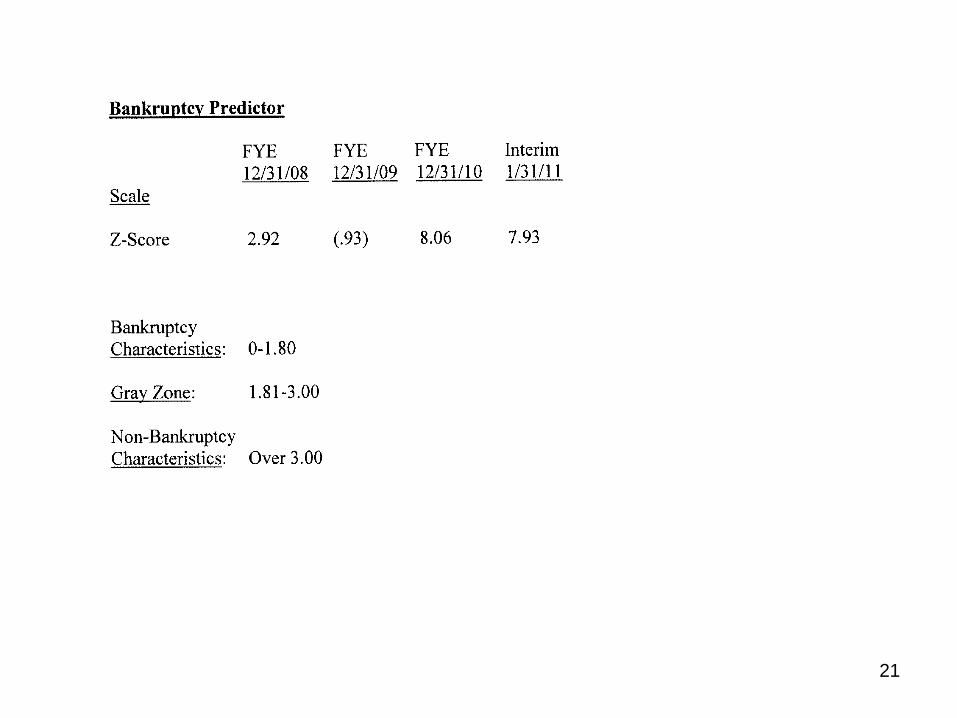
How to Calculate a Z-Score
How do you know when a company is at risk of corporate collapse? To detect any signs of looming bankruptcy, investors
calculate and analyze all kinds of financial ratios: working capital, profitability, debt levels and liquidity. The trouble is, each
ratio is unique and tells a different story about a firm's financial health. At times they can even appear to contradict each other.
Having to rely on a bunch of individual ratios, the investor may find it confusing and difficult to know when a stock is going to
the wall. (For background reading, check out An Overview Of Corporate Bankruptcy.)
In a bid to resolve this conundrum, NYU Professor Edward Altman introduced the Z-score formula in the late 1960s. Rather
than search for a single best ratio, Altman built a model that distills five key performance ratios into a single score. As it turns
out, the Z-score gives investors a pretty good snapshot of corporate financial health. Here we look at how to calculate the Z-
score and how investors can use it to help make buy and sell decisions.
The Z-score Formula
Here is the formula (for manufacturing firms), which is built out of the five weighted financial ratios:
Z-Score = 1.2A + 1.4B + 3.3C + 0.6D + 1.0E
Where:
A = Working Capital/Total Assets
B = Retained Earnings/Total Assets
C = Earnings Before Interest & Tax/Total Assets
D = Market Value of Equity/Total Liabilities
E = Sales/Total Assets
Strictly speaking, the lower the score, the higher the odds are that a company is headed for bankruptcy. A Z-score of lower
than 1.8, in particular, indicates that the company is heading for bankruptcy. Companies with scores above 3 are unlikely to
enter bankruptcy. Scores in between 1.8 and 3 lie in a gray area.
Read more: http://www.investopedia.com/articles/fundamental/04/021104.asp#ixzz2MKBSaEfu 20
21

Sustainable Growth Rates (SGR) (from a financial perspective)
The sustainable growth rate according to Robert C. Higgins is the maximum growth rate a company can achieve consistent with the
firm’s established financial policy. Basically, it is calculated as:
SGR = (pm*(1-d)*(1+L)) / (T-(pm*(1-d)*(1+L)))
•pm is the existing and target profit margin
•d is the target dividend payout ratio
•L is the target total debt to equity ratio
•T is the ratio of total assets to sales
In order to grow faster, the company would have to invest more equity capital, increase its financial leverage or increase the target
profit margin.
The sustainable growth rate model assumes several simplifications such as depreciation is sufficient to maintain the value of existing
assets, the profit margin remains stable (also for new businesses), the proportion of assets and sales remains stable (also for new
businesses) and the company maintains its current capital structure and dividend payout policy.
The sustainable growth rate model has implications for valuation models, as for instance the Gordon model and other discounted
cash flow models require a growth estimate that can be sustained for many years. The sustainable growth rate can be a check if
business plans are reasonable.
22
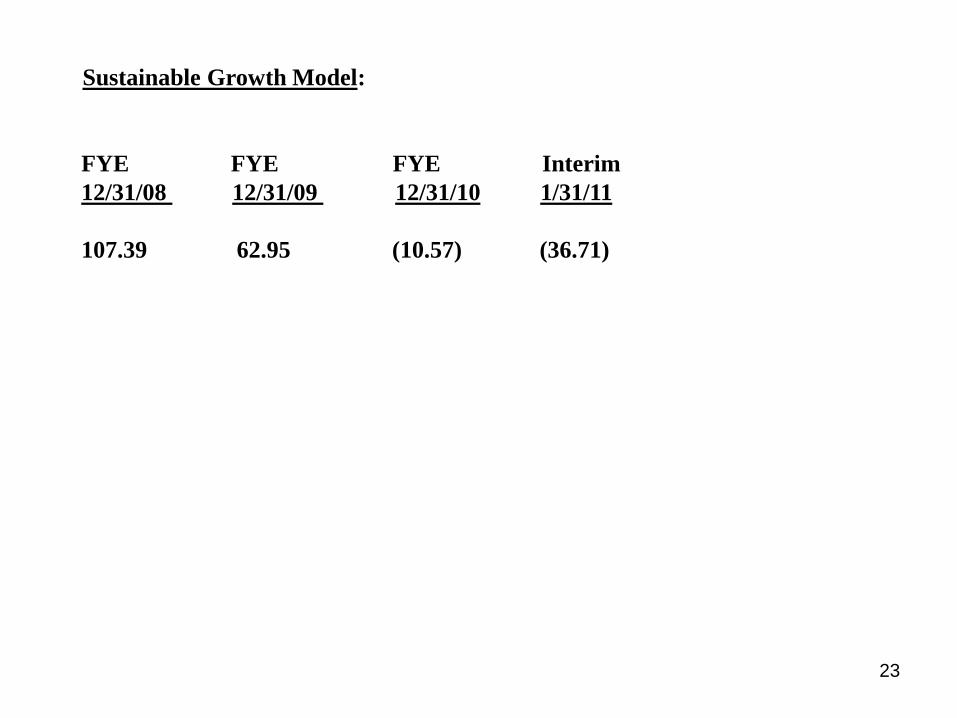
Sustainable Growth Model:
FYE FYE FYE Interim
12/31/08 12/31/09 12/31/10 1/31/11
107.39 62.95 (10.57) (36.71)
23
VI. Final Thoughts:
a. In today’s challenging economy:
Cash is not king.
Credit is not king.
Cash flow is king!
b. Figures lie and liars figure
c. Be a decision maker!
24