key results on employment and...
TRANSCRIPT

Revised Report No. 406
Key Results on Employment and Unemployment
Fifth Quinquennial Survey NSS Fiftieth Round
( July 1993 - June 1994 )
National Sample Survey Organisation
Department Of Statistics
Government Of India
October, 1996

Preface The National Sample Survey Organisation (NSSO) has been carrying out all-India surveys quinquennially on consumer expenditure, employment & unemployment. The present report is based on data collected in the 50th round (July 1993 - June 1994) socio-economic survey of NSS. It was the fifth quenquennial survey on consumer expenditure, employment & unemployment . The previous four quinquennial surveys were conducted during the 27th (October 1972 - September 1973), the 32nd (July 1977 - June 1978), the 38th (January - December 1983) and the 43rd (July 1987 - June 1988) rounds. In order to provide the Planning Commission with necessary data for formulation of the Ninth Five Plan, it was decided to bring out basic information on employment patterns based on a detailed survey. The survey was conducted in 1993-94. A summary report has been prepared essentially giving labour force participation patterns for India and its major states as well as for different consumer expenditure levels, education levels, and age-groups; this is now being released. The report consists of four chapters and tables. Chapter I is introductory, Chapter II sets out the conceptual framework and Chapter III is a brief note on sample design of the survey. Chapter IV deals with summary findings of the report on employment and unemployment. The schedule design for the survey was essentially similar to that adopted in the previous quinquennial round. The field work for the survey was conducted by the Field Operations Division of the Organisation. The collected data were processed by the Data Processing Division of the NSSO and tabulated by the Computer Centre of the Department of Statistics . The report has been prepared by the Survey Design & Research Division (SDRD) of the NSSO. I am grateful to the members of the Governing Council, Heads of various Divisions of the NSSO, Executive Director, Computer Centre, and their colleagues for the efforts taken in preparing the report which, hopefully , can serve as a reference document to planners and policy makers. Comments/ suggestions from the readers of the report will be most welcome. New Delhi S. S. Srivastava Date : 27 June, 1996 Chief Executive Officer National Sample Survey Organisation

FIFTH QUINQUENNIAL SURVEY : KEY RESULTS ON EMPLOYMENT AND
UNEMPLOYMENT
CONTENTS
Pages Chapter 1 Introduction 1-2 Chapter 2 Conceptual framework 3-11 Chapter 3 Sample design 12-14 Chapter 4 Main findings 15-44 a. Age distribution 15 b. Labour force participation rates 16 c. Workforce participation rates 20 d. Age specific WFPR 23 e. Workforce partcipation rates for states/uts 24 f. Distribution of employment by category of employment 32 g. Distribution of employed by industry 33 h. Unemployed 34 i. Unemployment rates for educated 38 j. Proportion of unemployed in states/uts 39 Chapter 5 Detailed tables 45-87 Appendix List of NSS reports on employment unemployment

List of NSS reportson Employment - Unemployment based on the quinquennial surveys
published in Sarvekshana
---------------------------------------------------------------------------------------------------------- Survey round Topics covered Sarvekshana where published & period Vol. No. Month & Year Issue no. ----------------------------------------------------------------------------------------------------------- First quinquennial 1.1 Employment- Unemploy- I 2 October 1977 2 survey ment situation at a glance 27th round 1.2 All-India and Statewise III 3 January 1980 11 Oct.72 - Sept.73 results Second quinquennial 2.1 Some key results II 2 October 1978 6 survey 2.2 Preliminary results for II 4 April 1979 8 32nd round persons aged 15 to 59 July77 - June78 2.3 Activity situation pertai- IV 3&4 Jan.- April 81 14 ning to Women usually engaged in domestic duties 2.4 Final results - All-India V 1&2 July - Oct. 81 15 2.5 Selected important results VI 1&2 July - Oct. 82 17 for 8 States-A.P., Maha- rashtra,Bihar,Gujarat,Har- yana,Punjab,T.N., & W.B. 2.6 Selected important results VI 3&4 Jan.- April 83 18 for 4 States-Kerala,M.P., Rajasthan & U.P. 2.7 Selected important results VII 3 January 1984 20 for 5 States/UTs-Assam, Delhi,H.P.,Karnataka& J&K 2.8 Selected important results VII 4 April 1984 21 for 9 States/UTs-Arunachal Pradesh,Goa,Daman&Diu, Manipur,Meghalaya,Orissa, Pondicherry,Tripura,Chandi- garh & Nagaland 2.9 Employment- Unemploy- X 2 October 1986 29 ment situation in cities and towns during late seventies. Third quinquennial 3.1 Preliminary results based IX 4 April 1986 27 survey on first two sub-rounds data 38th round 3.2 Employment- Unemploy- IX 4 April 1988 35 Jan. - Dec. 1983 ment (All-India) ---------------------------------------------------------------------------------------------------------
-2-

----------------------------------------------------------------------------------------------------------- Survey round Topics covered Sarvekshana where published & period Vol. No. Month & Year Issue no. ----------------------------------------------------------------------------------------------------------- 3.3 Additional 10 Tables on XII 3 Jan. - March 1989 38 employment & unemploy- ment 3.4 Employment- Unemploy- XIII 1 July 1989 40 ment situation of scheduled tribe and scheduled caste population during early eighties 3.5 Employment- Unemploy- XIV 1 July - Sept. 90 44 ment (9 State results) 3.6 Employment- Unemploy- XIV 2 Oct. - Dec. 90 45 ment (8 State results) Fourth quinquennial 4.1 Results of fourth quinque- Special No. Sept. 1990 - survey nnial survey on employ- 43rd round ment and unemployment July87 - June88 (All-India) 4.2 Employment- Unemploy- XV 2 Oct. - Dec.1991 49 ment situation of scheduled tribe and scheduled caste population during early eighties 4.3 Results of fourth quinque- Special Issue January 1992 - nnial survey on employ- ment and unemployment (18 states in booklets) 4.4 Results of fourth quinque- XVI 2 Oct. - Dec. 1992 53 nnial survey on employ- ment and unemployment (18 states in booklets) 4.5 - do - remaining states XVI 3 Jan. - Mar. 1993 54 4.6 A note on employment - XVII 2 Oct. - Dec. 1993 57 unemployment situation in cities and towns during late eighties. ---------------------------------------------------------------------------------------------------------

1. INTRODUCTION
ne of the important surveys conducted by the National Sample Survey Org-anisation(NSSO) is the quinquennial survey on employment-unemployment. The first such survey was done during September 1972-October 1973 corresponding to the 27th
round of NSS. The present survey conducted during the period July 1993 to June 1994 is the fifth in the series. Though the NSSO had first conducted a survey with a view to assess the volume and structure of employment (unemployment) as early as in its 9th round, the first quinquennial survey made a marked departure from the previous employment surveys in procedure and content. The previous surveys of NSSO had tried out a very useful set of concepts on employment in view of the absence of an accepted and suitable methodology for the conduct of employment(unemployment) surveys. The concepts and procedure followed in the first quinquennial survey were primarily based on the recommendations of the ‘Expert Committee on Unemployment Estimates’ popularly known as the Dantwala Committee appointed by the Planning Commission and whose recommendations were available before this survey. Since then, three successive quinquennial surveys conducted in 32nd, 38th, and 43rd rounds of NSS have more or less followed an identical approach in the measurement of employment and unemployment. The current report is based on the fifth such survey. The basic approach in all these surveys have been the collection of data to generate the estimates of employment and unemployment according to the ‘usual status’ based on a reference period of one year, the ‘current weekly status (cws)’ based on a reference period of one week, and the ‘current daily status(cds)’ based on each day of the previous week. In order to reveal the multi--dimensional aspects of the employment-unemployment situation in India, information on several correlates are also gathered in these surveys. A set of probing questions have also been one of the basic features of these surveys. The survey on employment and unemployment is conducted along with the survey on ‘Consumer expenditure’ in the same set of households.
1.1 Apart from these quinquennial surveys on employment, NSSO have been collecting in-formation on certain key items on employment unemployment from a limited set of households since the 45th round. These are on the usual and current weekly status employment and unemployment, category of employment, industrial distribution of the usually employed etc. These have been published up to the 49th round survey.
1.2 In the present survey, apart from the collection of data on employment and unemployment efforts were also made to collect data on the activity profiles of children. This is hoped to make available useful information relating to child labour and its causes. Another new dimension added to the present survey was in the probing questions to the unemployed regarding their educational background, past employment, nature of efforts made and sectors in which employment is sought. The probing questions on the employed to understand the extent of under utilisation of labour time was further expanded to acquire more specific information from the employed. There were also some questions on the qualitative aspects of employment like
O

Key Results on Employment-Unemployment: NSS 50th Round
2 occupational changes, availability of trade unions, nature of employer etc. It is proposed to
bring out detailed reports on each of these subjects separately.
1.3 The fifth quinquennial survey was conducted during the 50th round survey operations from July 1993 to June, 1994. Generally the NSSO surveys cover the entire country with the exception of certain interior areas of Nagaland and the Andaman & Nicobar Islands. However in this round besides the above, in the state of Jammu & Kashmir out of the 12 Districts, only three Districts could be surveyed. These Districts viz. Jammu, Kathua and Udhampur are however included in the all India estimates..
1.4 Layout of the report: After this introductory first chapter, the next chapter briefly gives the conceptual framework of the employment-unemployment surveys and the revisions/-changes made for this survey. Chapter 3 describes the sample design. In Chapter 4 of the report the main findings obtaining from the results are discussed. The results of the previous surveys are also incorporated wherever possible to get a comparable picture of the employment-unemployment situation over a period of time. Detailed all-India tables are given in Chapter 5.

Key Results on Employment-Unemployment: NSS 50th Round
3
2. CONCEPTUAL FRAMEWORK 2.1 The NSSO surveys on employment and unemployment aim to measure the extent of ‘employment’ and ‘unemployment’ in quantitative terms disaggregated by various household and population characteristics . The persons surveyed are classified in to various activity categories on the basis of the activities pursued by them during certain specified reference periods. Three reference periods are used in these surveys. These are (i) one year (ii) one week and (iii) each day of the week. Based on these three periods three different measures are arrived at. These are termed as usual status, current weekly status ,and the current daily status . The procedure adopted to arrive at these three measures are given below.
2.2 Classification according to usual status. In this approach the status of activity on which a person spent relatively longer time of the preceding 365 days from the date of survey is consid-ered as the principal usual status activity of the person. Accordingly, a person is considered ‘working or employed’ if the person was engaged for a relatively longer time during the past year in any one or more work related activities(economic activities) including seeking or being available for work. The person is considered as ‘seeking or available’ for work or ‘un-
employed’ if the person was not working but was either seeking or was available for work for a relatively longer time during the past year. If the person was
engaged in any non-economic activities for a relatively longer time of the reference year he/she is considered as ‘out of labour force’. The specific activity category is determined on the basis of time spent criterion. i.e. the activity on which major time was spent being assigned as the usual status activity. A person categorised as ‘worker’ or ‘employed’ on the basis of the principal status is called a ‘principal status worker’ or ‘principal status employed’. A person categorised as a non-worker (i.e. unemployed or out of labour force) who pursued some economic activity in a subsidiary capacity is called a ‘subsidiary status worker’ or ‘subsidiary status employed’. These two groups viz. principal status workers and subsidiary status workers together constitute ‘all workers’ according to the usual status classification.
The various activity categories along with the codes used for usual status classification are given in the box below.
code description ---- ----------- [activities for working(employed) persons] 11 worked in household enterprise(self-employed) as an own account worker 12 worked in household enterprise(self-employed) as an employer
Usual Status :- Principal Status and Subsidiary Status

Key Results on Employment-Unemployment: NSS 50th Round
421 worked in household enterprise as a helper 31 worked as regular salaried/wage employee 41 worked as casual labour in public works 51 worked as casual labour in other types of works [unemployed] 81 seeking or available for work [out of labour force activities] 91 attended educational institutions 92 attended domestic duties only 93 attended domestic duties and was also engaged in free collection of goods(vegetables, roots, fire-wood, etc. for household ) 94 rentiers, pensioners, remittance recipients, etc. 95 not able to work due to disability 96 beggars, prostitutes, etc. 97 others 99 infants of age 0-4 years.
Activities coded 11-51 are those applicable for persons who are classified as workers while 91-99 apply to those who are out of labour force. Detailed definitions of these categories are given elsewhere in this section. Code 81 is assigned to an unemployed.
2.3 Classification according to current weekly status approach: For classification of persons according to current weekly status approach, they are assigned a unique activity status with reference to a period of 7 days preceding the date of survey. This is easily done in the case of persons having only one status during the reference week. But for persons pursuing more than one activity a priority-cum-major time rule was applied to obtain a unique activity status.
Under the priority rule, the status of working got priority over the status of not working but seeking/available for work. Further the status of not working but seeking/available for work got priority over the status of not working and not seeking/available for work. Within the broad category of working and not
working, the detailed activity category was assigned by major time spent criterion. Using this procedure in the current weekly status(cws) a person is considered working or employed if the person was engaged for at least one hour on any one day of the previous week on any work related(economic) activity. A person who had not worked for even one hour on any one day of the week, but had been seeking or had been available for work at any time for at least one hour during the week was considered ‘seeking/available for work’. Others were considered ‘not available for work’ or as out of labour force. For working or employed besides the codes used for usual activity 4 additional codes were used to reflect the weekly situation. These were as follows:
Current Weekly Status

Key Results on Employment-Unemployment: NSS 50th Round
561 did not work due to sickness though there was work in household enterprise
62 did not work due to other reasons though there was work in household enterprise
71 did not work due to sickness but had regular salaried/wage employment
72 did not work due other reasons but had regular salaried/wage employment
For unemployed the codes were: 81 sought work 82 did not seek but was available for work For ‘out of labour force’ one additional code was used as: 98 did not work due to sickness(for casual workers only)
2.4 Classification according to current daily status approach : The activity pattern of people particularly in the unorganised sector is such that a person might be pursuing more than one activity during a week and sometimes even during a day. In the current daily status(cds),up to two activity statuses were assigned to a person on each day of the reference week. The unit of classification was thus ‘half day’ in the cds. In assigning the activity status on a day, a person was considered working for the entire day if he had worked 4 hours or more during the day. If he had worked one hour or more but less than 4 hours, he was considered work-ing(employed) for half day and seeking/available for work (unemployed) or not available for work(not in labour force) for the other half day depending on whether he was seeking /avail-able for work or not. On the other hand, if a person was not engaged in any work even for one hour but was seeking or available for work for 4 hours or more, he was considered unemployed
for the entire day. If he was available for work for less than 4 hours only, he was considered unemployed for half day and not in labour force for the other half of the day. A person who neither had any work to do nor was available for work even for ‘half’ of the day was considered not in labour force for the entire day and was assigned one or two non-economic activity
status codes . The aggregate of person days classified under the different activity categories for all the seven days gave the distribution of person days by activity category during an average week over the survey period of one year. The codes used for describing the various activity categories under the cds were the same as those used for current weekly status classification.
2.5 As can be seen in the above paragraphs, central to the concept of identifying a worker is the engagement in any economic activity. The concept of economic activity as used in the NSS is explained now.
Current Daily Status
Concept of
economic activity

Key Results on Employment-Unemployment: NSS 50th Round
6 Economic activity is any activity that results in production of goods and services that adds value to national product. Such activities include production of all goods and services for market i.e. production for pay or profit and the production of primary commodities for own consumption and own account production of fixed assets, among the non-market activities. The entire spectrum of human activity falls in two categories: economic and non-economic activi-ties. The economic activities have two parts:- market activities and non-market activities. Market activities are those that involve remuneration to those who perform it i.e. activity per-formed for pay or profit. These are essentially production of goods including those of Gov-ernment services etc. Non market activities are the production for own consumption of primary products and own account production of fixed assets. The full spectrum of economic activities as defined in the UN system of National Accounts is not covered in the definition adopted for the current survey or in the previous surveys. The term economic activity as adopted in the 50th round survey include:
i) All the market activities described above i.e. the activities performed for pay or profit which result in production of goods and services for exchange.
Ii) Of the non-market activities, a) all the activities relating to the agricultural sector (industry section 0 of NIC 1987) which results in production (including gathering of uncultivated crops, forestry, collection of firewood, hunting, fishing etc.) of agricultural produce for consumption and
b) the activities relating to the own-account production of fixed assets. Own account production of fixed assets include construction of own houses, roads, wells, etc., and of machinery, tools etc. for household enterprise and also construction of any private or community facilities free of charge. A person may be engaged in own-account con-struction either in the capacity of a labour or a supervisor.
2.6 In this context, it may be noted that hitherto in NSS the term used was ‘gainful activity’. The above definition is very close to the ‘gainful activity’ concept except for the inclusion of own-account production of fixed assets. The contribution of this component was found to be negligible from a separate tabulation of this component in the 43rd round survey and as such the comparability of the survey results will be unaffected by this change.
2.7 According to the international standards the term ‘economically active population’ comprises of persons of either sex who furnish the supply of labour for production of goods

Key Results on Employment-Unemployment: NSS 50th Round
7and services as defined in the United Nations system of national accounts and balances during a specified time reference period. According to these systems, the production of goods and services includes all production and processing of primary products, whether for market, for barter or for own consumption, the production of all other goods and services for the market and, in the case of households which produce such goods and services for the market, the corresponding production for own consumption.1 The definition adopted in the NSS follow the above approach very closely except for the ‘processing of primary commodities for own consumption by the producers of these items’ which is not covered by the NSS definition. Further the international standards use the term ‘economically active population’ as a generic term and use two other measures viz. the ‘usually active population’ in relation to a long reference period such as a year and the ‘currently active population’ measured in relation to a short reference period such as a week or a day. Generally the term ‘labour force’ is used to denote the currently active population. In this report the term labour force is meant to imply the population comprising the employed and the unemployed. In conventional terms, the employed, unemployed and those in the labour force are defined as follows.
2.8 Workers or employed : persons who are engaged in any economic activity or who despite their attachment to economic activity have abstained for reason of illness, injury or other physical disability, bad weather, festivals, social or religious functions or other contingencies necessitating temporary absence from work constitute workers. Unpaid helpers who assist in the operation of an economic activity in the household farm or non-farm activities are also considered as workers.
2.9 Seeking or available for work or unemployed : Persons who owing to lack of work had not worked but either sought work through employment exchanges, intermediaries, friends or relatives or by making applications to prospective employers or expressed their willingness or availability for work under the prevailing condition of work and remuneration are considered as those ‘seeking or available for work or as unemployed’.
2.10 Labour force and those out of labour force : Persons who are either ‘working’ or seeking or available for work (i.e. unemployed) during the reference period constitute the labour force. Persons who were neither working and at the same time were not seeking nor available for work during the reference period are considered to be ‘ out of labour force’. The persons under this category are students, those engaged in domestic duties, rentiers, pensioners, recipients of remittances, those living on alms, infirm or disabled, too young or too old, prostitutes, smugglers etc., and casual workers not working due to sickness etc.. However a
1 Surveys of economically active population, employment,
unemployment and underemployment: An ILO manual on concepts and methods, I L O , Geneva, 1990.

Key Results on Employment-Unemployment: NSS 50th Round
8domestic servant who is considered as a member of the employer’s household is treated as a worker though he/she may be performing only household chores.
.
2.11 The status of persons engaged in various economic activities are classified as follows.
2.11.1 Self-employed in household enterprises: Persons who operate their own farm or non-farm enterprises or are engaged independently in a profession or trade on own-account or with one or a few partners are self-employed in household enterprises. The essential feature of self-employment is that the remuneration is determined wholly or mainly by sales or profits of the goods or services which are being produced. The self-employed persons are further categorised into three groups.
(a) own-account workers: They are the self-employed persons who operate their enterprises on their own account or with one or a few partners and who during the reference period by and large, run their enterprise without hiring any labour. They may, however, have unpaid helpers to assist them in the activity of the enterprise.
(b) employers: The self employed persons who work on their own account or with one or a few partners and by and large run their enterprise by hiring labour.
(c) helpers in household enterprises: The helpers are mostly family members who keep themselves engaged in their household enterprises, working full or part time and do not receive any regular salary or wages in return for the work. They do not run the enterprise on their own, but assist the related person living in the same household running the enterprise. Here it is to be noted that a departure was made in the case of identifying ‘helpers’ from the earlier surveys. Persons who worked in the capacity of ‘helpers’ but had a share in their family earnings were not considered as ‘helpers’ in the earlier rounds, but are considered so in the present survey.
2.12.2 Regular salaried/wage employee: Persons working in other’s farm or non-farm en-terprises, both household and non-household, and getting in return salary or wages on a regular basis (and not on the basis of daily or periodic renewal of work contract) are the regular salaried/wage employees. This category not only includes persons getting time wage but also persons receiving piece wage or salary and paid apprentices, both full time and part-time. 2.12.3 Casual labour: A person casually engaged in other’s farm or non-farm enterprises(-both household and non-household) and getting in return wage according to the terms of the daily or periodic work contract is a casual labour. Depending on whether they are so employed in ‘public works’ sponsored by Govt. agencies or local bodies or in other types

Key Results on Employment-Unemployment: NSS 50th Round
9work, the casual workers are classified into the two groups viz. Casual labour in public works and casual workers in other types of work.
2.13 Certain other terms related to the different types of ‘labour’ are now explained. 2.14 Manual work : a job essentially involving physical labour is considered as manual work. However, jobs essentially involving physical labour but also requiring a certain level of general, professional, scientific, or technical education are not termed manual work. On the other hand, jobs not involving much of physical labour and at the same time not requiring much educational background as above, are treated as manual work. Thus engineers, doctors etc. are not considered as manual workers even though their jobs involve some amount of physical labour. But peons, chowkidars, watchman, etc. Are considered as manual workers even though their work involve much less physical labour. In the NSS, the manual work is specifically defined a as work pursued in one or more of the following occupational groups of the National Classification of Occupations.(1968):
Division 5 - Service workers:
Group 52,53,54,55,56 and family 570,574,579
Division 6 -Farmers, Fishermen, Hunters, loggers, and related workers:
Group 63,64,65,66,67,68
Division 7-8-9 : production and related workers, Transport equipment operators and labourers. 2.15 Wage paid manual labour : A person who does manual work in return for wages in cash or kind or partly in cash and partly in kind( excluding exchange labour) is a wage paid manual labour. Persons who are self employed doing manual work is not treated as a wage paid manual labour. 2.16 Agricultural Labour : A person is considered engaged in agricultural labour if he/she follows one or more of the following agricultural occupations in the capacity of a wage paid manual labour, whether paid in cash or kind or both:
(I) farming (ii) dairy farming (iii) production of any horticultural commodity (iv) raising of livestock, bees or poultry
(v) any practice performed on a farm as incidental to or in conjunction with farm operations(including forestry and timbering) and the operation for market and delivery to

Key Results on Employment-Unemployment: NSS 50th Round
10storage or to market or to carriage for transportation to market of farm produce. Carriage for transportation refers to the first stage of the transport from farm to the first place of disposal. Working in fisheries is excluded from agricultural labour.
2.17 Rural labour : Manual labour, living in rural areas, working in agricultural and/or non-agricultural occupations in return for wages paid either in cash or in kind (excluding exchange labour) is considered as rural labour. Thus rural labour includes both agricultural labour and other labour.
2.18 Some of the other important terms used in the survey are now explained. 2.19 Skill : Any marketable expertise however acquired, irrespective of whether marketed or not, whether the intention is to market it or not, is considered as a skill. 2.20 Nominal work : Work done by a person for 1-2 hours in a day is said to be a day with nominal work. In the daily time disposition record, such days are given half intensity in accounting. 2.21 Earnings : earnings refer to the wage/salary (and not total earnings) receivable for the wage/salaried work done during the reference week by the wage/salaried employee and casual labourers. The wage/salary may be in cash or kind or partly in cash and kind. The kind wages are evaluated at the current retail price. Bonus and perquisites evaluated at the retail prices and duly apportioned for the reference week are also included in earnings. However, amount receivable as ‘over time’ for the additional work done beyond normal working time is ignored. 2.22 Cultivation : All activities relating to production of crops and related ancillary activities are considered as cultivation. Growing of trees, plants or crops as plantation or orchards( such as rubber, cashew, coconut, pepper, coffee, tea etc.) are not considered as cultivation activities for the purpose. In general, the activities covered under industry groups 000-008 are considered as cultivation
2.23 Procedural changes in the present survey: Apart from the changes in the definition and classification of the economically active persons mentioned above, a few other procedural aspects introduced in the classification of usual status and current weekly and daily status are explained now. These changes, it may be seen , do not in any way affect the comparability of the survey estimates with that of the previous rounds.
(a) In the past, for the identification of the usual status based on the major time criterion, a tri-chotomous classification of the population was followed. i.e. a person is classified

Key Results on Employment-Unemployment: NSS 50th Round
11into one of the three broad groups ‘employed’, ‘unemployed’ and out of labour force’ based on the major time criterion. In this round, the procedure prescribed is a two stage dichotomous procedure which involves a classification into ‘labour force’ and ‘out labour force’ in the first stage and thereafter the labour force into ‘employed’ and ‘unemployed’ in the second stage. While this could marginally affect the principal and subsidiary classification theoretically, it can be seen that the ‘all workers’ would remain the same.
(b) Previously the current weekly status of a person was first assigned on the basis of the response to a direct question on his/her participation in economic activities during the week and thereafter the daily time disposition data was collected from all those who were in the labour force(i.e. employed plus unemployed). In this round however the daily time disposition was collected from all the persons in the household and the current weekly status was recorded on the basis of the daily time disposition during the week.
2.24 Data collected and survey instruments 2 : The data for this survey was collected in the NSS Schedule 10 used for employment surveys. For this round, the schedule had 8 core blocks. Household characteristics like, household size, principal industry-occupation, social group, land possessed and cultivated, use of hired labour, monthly per capita expenditure etc. were recorded in Block 3. In the next Block the detailed demographic particulars including age, sex, educational level school attendance, principal and subsidiary statuses, the industry, occupation of the employed, distance to place of work etc. were recorded. Block 5 was used to record the daily time disposition. Apart form recording the different activities from among the various status codes explained in the earlier part of this section, the industry and type of ‘operation’ for rural areas were also recorded. For a day utmost two activity statuses could be recorded, an activity status getting an intensity of ‘half or full’ depending on the time spent on it. No limits on the number of activities that could be reported in a week was specified. The current weekly status of the person derived form the various daily activity statuses followed in the week and the corresponding industry-occupation was also recorded in this block. Besides the above, the wage and salary earnings were also entered in this block. Block 6 was used to record the answers to certain probing questions to the unemployed. The unemployed for this purpose were those who had not worked on any day of the reference week. These probing questions included among other things the academic performance, particulars of work sought, details of past employment, reasons for unemployment, length of spell of unemployment, type of efforts made etc.. Further probing questions on the usually employed on the qualitative aspects of employment were made in Block 7. These included occupational mobility, availability for additional work and reasons, extent of under utilisation of labour time, membership of trade unions, nature of employer, permanency of employment etc.. A major innovation in this survey was the attempt to specifically collect information on the activity profiles of children. In order to build up the profile, the school attendance status of the children, reason for non-attendance, extent of participation in household chores, information on the type of work done and the industry in which worked, reason for working, economic benefits derived by the household from such work , its effect on studies etc. were ascertained for all children aged in the 5-
2 Instructions to field staff Vol I & II, NSS 50th round: Department of Statistics, New Delhi, June 1993.

Key Results on Employment-Unemployment: NSS 50th Round
1214 years age group in the sample household. All this information was recorded in Block 8. In Block 9, the follow up questions were asked to or about those who reportedly were engaged in domestic duties. This block was canvassed as in the previous surveys . Block 10 was canvassed as part of the rural labour enquiry being undertaken for the Labour Bureau by the NSSO and which is integrated with the employment survey.

Key Results on Employment-Unemployment: NSS 50th Round
13
3. SAMPLE DESIGN AND ESTIMATION PROCEDURE
3.1 The sample design adopted for this round of survey was similar to that followed3 in the past surveys in its general aspects. The general scheme was a two stage stratified design with the first stage units being villages in the rural areas and urban frame survey blocks(UFS) in the urban areas. The second stage units were the households.
3.2 Sampling frame for first stage units: The frame used for selection of first stage units in the rural sector was the 1991 census list of villages for all the four sub-rounds for 8 states/u.t.s viz. Andhra Pradesh, Assam, Kerala, Madhya Pradesh, Orissa, Uttar Pradesh, West Bengal and Chandigarh. However for Agra district of U.P. and the three districts, viz. Durg, Sagar, and Morena of M.P., samples were drawn using 1981 census list of villages. For Jammu & Kashmir samples for all the 4 sub-rounds were drawn using the 1981 census list as the 1991 census was not conducted in the state. For the remaining 23 states/u.t.s, the frame was 1991 census list for sub-rounds 2 to 4 and 1981 census list for sub-round 1 as the 1991 census list was not available for use at the time of drawing the samples. As usual, for Nagaland the list of villages within 5 kms. of the bus route and for Andaman and Nicobar Islands the list of accessible villages constituted the frame. In the case of urban sector the frame consisted of the UFS blocks and, for some newly declared towns where these were not available, the 1991 census enumeration blocks were used.
3.3 Region formation and stratification: States were divided into regions by grouping contiguous districts similar in respect of population density and cropping pattern. In rural sector each district was treated a separate stratum if the population was below 2 million and where it exceeded 2 million, it was split into two or more strata. This cut off point of population was taken as 1.8 million ( in place of 2 million ) for the purpose of stratification for districts for which the 1981 census frame was used. In the urban sector, strata were formed, within each NSS region on the basis of population size class of towns. However for towns with population of 4 lakhs or more the urban blocks were divided into two classes viz. one consisting of blocks inhabited by affluent section of the population and the other consisting of the remaining blocks.
3.4 Selection of first stage units: Selection of sample villages was done circular system-atically with probability proportional to population and sample blocks circular system-atically with equal probability. Both the sample villages and the sample blocks were se-lected in the form of two or more independent sub-samples. In Arunachal Pradesh the procedure of cluster sampling has been followed. Further large villages/blocks having present population of 1200 or more were divided into a suitable number of hamlet- groups/ sub-blocks having equal population content. Two hamlet- groups were selected from the larger villages while one sub-block was selected in urban sector for larger blocks.
3 Sampling Design and estimation procedure for 50th Round
NSS(Mimeographed, National Sample Survey Organisation, 1994

Key Results on Employment-Unemployment: NSS 50th Round
143.5 Selection of households: While listing the households in the selected villages, cer-tain relatively affluent households were identified and considered as second stage stratum 1 and the rest as second stage stratum 2. A total of 10 households were surveyed from the selected village/hamlet-groups, 2 from the first category and remaining from the second. Further in the second stage stratum-2, the households were arranged according to the means of livelihood. The means of livelihood were identified on the basis of the major source of income as i) self-employed in non-agriculture, ii) rural labour and iii) others. The land possessed by the households was also ascertained and the frame for selection was arranged on the basis of this information. The households were selected circular systematically from both the second stage strata.
3.6 In the urban blocks a different method was used for arranging the households for selection. This involved the identification means of livelihood of households as any one of a) self—employed, b)regular salaried/wage earnings, c) casual labour, d) others. Further the average household monthly per capita consumer expenditure (mpce) was also ascertained. All households with MPCE of (i) Rs. 1200/- or more (in towns with population less than 10 lakhs or (ii) Rs. 1500/- or more (in towns with population 10 lakh or more) formed second-stage stratum 1 and the rest, second-stage stratum 2. The households of seco-nd-stage stratum 2 were arranged according to means of livelihood class and MPCE ranges before selection of sample households. A total of 10 households were selected from each sample block as follows
(i) For affluent strata/classes : 4 households from second- stage stratum 1 and 6 households from second-stage stratum 2 (ii) For other strata/classes : 2 households from second stage stratum 1 and 8 from second-stage stratum 2. Households were then selected circular systematically with a random start. Shortfall in the required number of household in any second-stage stratum was made up by increasing the quota for the other second stage stratum.
3.7 Work programme: The survey period of one year was divided into four sub-rounds of three months duration each as below.
Period of survey for the four sub-rounds
Equal number of sample villages and blocks was allotted for survey in each of these sub-rounds. However in Andaman and Nicobar Islands , Laksha-dweep, and rural areas of Arunachal Pradesh and Nagaland, the restriction of surveying the allotted
households during the sub-round period was not strictly enforced.
3.8 No. of villages/blocks, households and persons surveyed: The number of villages-/blocks and the households and persons surveyed in different States and Union Territories is given in Table(3). The information relates to all the sub-rounds covered. As reported in Para 1.3 in Jammu and Kashmir the survey work was undertaken in the districts of Jammu ,
sub-round period of survey ------- ---------------- 1 July-September, 1993 2 October- December, 1993 3 January-March, 1994 4 April-June, 1994

Key Results on Employment-Unemployment: NSS 50th Round
15Kathua and Udhampur only. The remaining 9 districts were not surveyed. Therefore the estimates pertaining to all India and Jammu and Kashmir will be exclusive of these districts. state/ut. Villages / blocks persons allotted surveyed surveyed rural urban rural urban rural urban ( 1 ) (2) (3) (4) (5) (6) (7) Andhra Pradesh. 496 368 494 367 21420 15912 Ar. Pradesh * 120 24 120 24 5133 834 Assam 344 88 321 88 16706 3784 Bihar 704 216 704 216 36575 10617 Goa 16 24 16 24 643 848 Gujarat 224 240 224 240 11849 10959 Haryana 104 72 104 72 6137 3124 H. P. 192 40 192 40 9808 1472 Jammu Kashmir 264 168 84 53 4626 2553 Karnataka 264 248 264 248 14202 11552 Kerala 256 184 256 184 11856 8181 Madhya Pradesh 544 328 534 326 28795 15924 Maharashtra 448 560 448 559 22107 24277 Manipur 104 72 102 71 5457 3696 Meghalaya 112 48 112 48 5074 1897 Mizoram 48 96 48 96 2350 4371 Nagaland 48 24 48 24 2520 1171 Orissa 336 104 336 104 16653 4525 Punjab 224 200 206 198 11148 8779 Rajasthan 312 184 312 184 16846 8440 Sikkim 48 16 48 16 2066 571 Tamil Nadu 392 408 391 408 16253 16405 Tripura 176 56 154 56 6975 2316 Uttar Pradesh 904 448 904 448 52149 23098 West Bengal 448 336 448 336 23454 13509 A & N Islands 56 40 50 40 2656 1504 Chandigarh 8 16 8 16 336 537 D & N Haveli 24 8 24 8 1201 334 Daman & Diu 8 8 8 8 396 347 Delhi 8 112 8 112 244 4047 Lakshadweep 8 24 7 24 391 1343 Pondicherry 8 32 8 32 325 1462 All India 7248 4792 6983 4670 356351 208389
* 26 nucleus villages were allotted.

Key Results on Employment-Unemployment: NSS 50th Round
16
4. Main findings 4.0 General: In this chapter the main findings relating to employment and unemployment including certain characteristics of the employed and the trends in employment and unemployment are presented. The estimates are given for the all-India and states and union territories though the discussion is centered mainly on the all India estimates. Comparisons are made with earlier survey results for all India. A few points on the general aspects of the survey estimates are to be noted. Generally the population estimates from the NSS are on the lower side when compared to the census population or the projected population. This difference arises mainly due to the different methods and coverage adopted in the NSS in comparison to the census operation. For example in this survey the rural total population is estimated as 585 million and urban population as 193 million only. However ratios obtained from the survey are much closer to the Census ratios. For example the survey estimates the sex ratio as 934 females per 1000 males in the country. Usually the estimates on employment- unemployment are presented as ratios. To estimate an absolute number in any category one is advised to apply the survey estimates of ratios to the census or projected population of the appropriate class. The estimates of aggregates given in the detailed tables help to combine the ratios . As the tables are generally presented as per thousand distribution, the figures are rounded off. Thus while using the ratios from the survey results, it is to be noted that the accuracy of these derived aggregates will be limited to the number of significant digits available in the ratio or percentage estimates presented in the report. The estimated aggregates, wherever possible can be used to get ratios with more significant digits. 4.1 Some population characteristics. In this paragraph we discuss certain survey estimates relating to the population. These are the age distribution of the population and age specific labour force participation rate . These are given only for all India in this report. The limited number of tables now generated for this provisional report do not contain any household tables or other population characteristics.
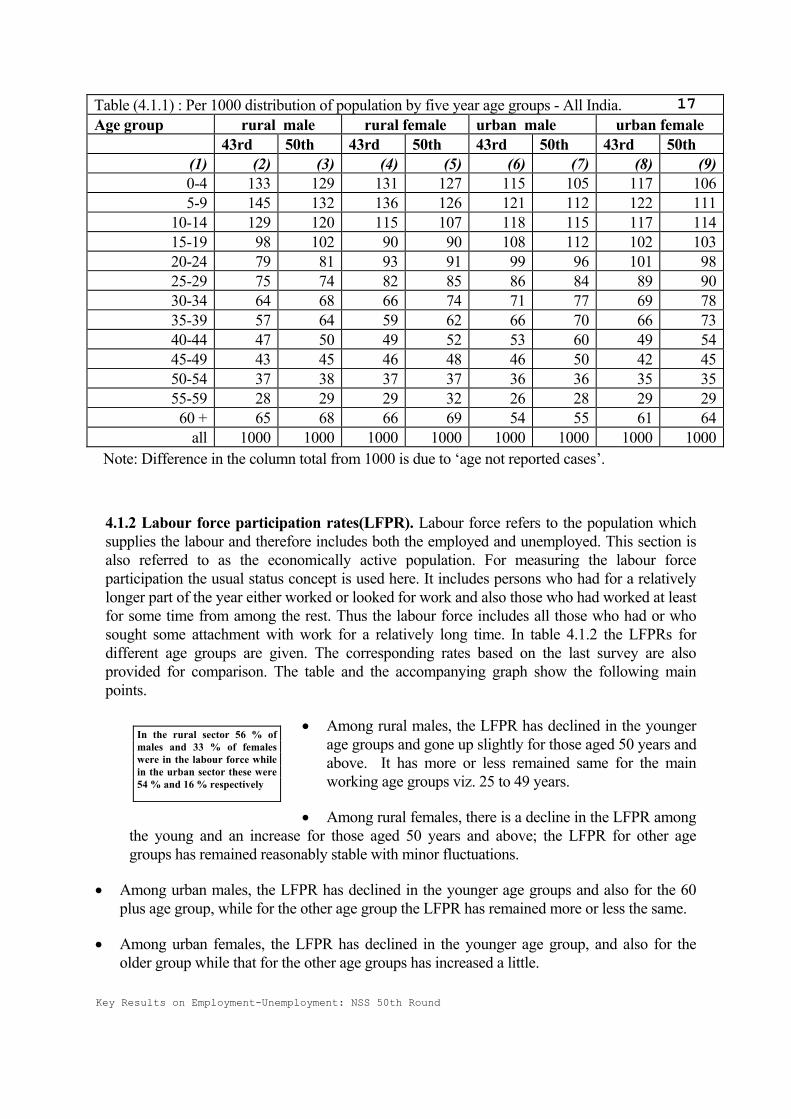
4.1.1 Age distribution. In the table below, the distribution of the rural and urban population by five year age groups is presented for males and females separately. During the six years that separate the two surveys a small shift is visible in the population especially from the younger age groups. The percentage of children is seen to have declined in all the categories. The results present a consistent pattern as far as the cohorts of the previous survey are concerned. This distribution can help in better understanding of the results presented later, as most of the results are age specific.
Key Results on Employment-Unemployment: NSS 50th Round
17
Note: Difference in the column total from 1000 is due to ‘age not reported cases’.
4.1.2 Labour force participation rates(LFPR). Labour force refers to the population which supplies the labour and therefore includes both the employed and unemployed. This section is also referred to as the economically active population. For measuring the labour force participation the usual status concept is used here. It includes persons who had for a relatively longer part of the year either worked or looked for work and also those who had worked at least for some time from among the rest. Thus the labour force includes all those who had or who sought some attachment with work for a relatively long time. In table 4.1.2 the LFPRs for different age groups are given. The corresponding rates based on the last survey are also provided for comparison. The table and the accompanying graph show the following main points.
• Among rural males, the LFPR has declined in the younger age groups and gone up slightly for those aged 50 years and above. It has more or less remained same for the main working age groups viz. 25 to 49 years.
• Among rural females, there is a decline in the LFPR among the young and an increase for those aged 50 years and above; the LFPR for other age groups has remained reasonably stable with minor fluctuations.
• Among urban males, the LFPR has declined in the younger age groups and also for the 60 plus age group, while for the other age group the LFPR has remained more or less the same.
• Among urban females, the LFPR has declined in the younger age group, and also for the older group while that for the other age groups has increased a little.
Table (4.1.1) : Per 1000 distribution of population by five year age groups - All India. Age group rural male rural female urban male urban female 43rd 50th 43rd 50th 43rd 50th 43rd 50th
(1) (2) (3) (4) (5) (6) (7) (8) (9)0-4 133 129 131 127 115 105 117 1065-9 145 132 136 126 121 112 122 111
10-14 129 120 115 107 118 115 117 11415-19 98 102 90 90 108 112 102 10320-24 79 81 93 91 99 96 101 9825-29 75 74 82 85 86 84 89 9030-34 64 68 66 74 71 77 69 7835-39 57 64 59 62 66 70 66 7340-44 47 50 49 52 53 60 49 5445-49 43 45 46 48 46 50 42 4550-54 37 38 37 37 36 36 35 3555-59 28 29 29 32 26 28 29 29
60 + 65 68 66 69 54 55 61 64all 1000 1000 1000 1000 1000 1000 1000 1000
In the rural sector 56 % of males and 33 % of females were in the labour force while in the urban sector these were 54 % and 16 % respectively

Key Results on Employment-Unemployment: NSS 50th Round
18
Thus in general it can be seen that the LFPR in the age group 5-20 has indeed shown a decline, probably because of increased attendance in educational institutions, though the present tabulations do not these figures. Further the LFPR has increased for the older age groups in the rural sector but shows a decline in the urban sector. Table (4.1.2) : Age specific usual status labour force participation rates -All India
rural male rural female urban male urban female age group 43rd 50th 43rd 50th 43rd 50th 43rd 50th
(1) (2) (3) (4) (5) (6) (7) (8) (9) 5-9 23 11 24 14 5 4 3 4
10-14 193 139 183 142 92 71 66 47 15-19 630 598 415 371 429 404 169 142 20-24 918 902 484 470 792 772 225 230 25-29 981 980 539 528 967 958 244 248 30-34 990 988 588 587 985 983 282 283 35-39 991 992 608 610 989 990 313 304 40-44 984 989 620 607 986 984 311 320 45-49 982 984 590 594 977 976 307 317 50-54 962 970 530 543 944 945 269 287 55-59 929 941 463 468 849 856 235 225 60 + 670 699 220 241 482 443 123 114
all 549 561 331 331 534 542 162 164

Key Results on Employment-Unemployment: NSS 50th Round
19
rural male
0
100
200
300
400
500
600
700
800
900
1000 5
-9
10-
14
15-
19
20-
24
25-
29
30-
34
35-
39
40-
44
45-
49
50-
54
55-
59
60
+age group
LFPR 43rd
50th
rural female
0
100
200
300
400
500
600
700
5-9
10-
14
15-
19
20-
24
25-
29
30-
34
35-
39
40-
44
45-
49
50-
54
55-
59
60
+
age group
LFPR
43rd
50th
Usual status labour force participation rates

Key Results on Employment-Unemployment: NSS 50th Round
20
urban male
0
100
200
300
400
500
600
700
800
900
1000 5
-9
10-
14
15-
19
20-
24
25-
29
30-
34
35-
39
40-
44
45-
49
50-
54
55-
59
60
+
age group
LFPR 43rd
50th
urban female
0
50
100
150
200
250
300
350
5-9
10-
14
15-
19
20-
24
25-
29
30-
34
35-
39
40-
44
45-
49
50-
54
55-
59
60
+
age group
LFPR 43rd
50th
4.2 The Employed (or the Workforce). In this Section, the estimates of the employed or workforce and its structure are discussed. In order to study the trend, earlier survey estimates are provided. The survey has generated three different estimates of the employed based on the three approaches used in classification of the activity statuses of the person surveyed. These are i) number of persons usually employed - usually employed in the principal status and all workers taking into account the employed according to both the principal and subsidiary statuses, ii) the

Key Results on Employment-Unemployment: NSS 50th Round
21average number of persons employed in a week based on the current weekly status and iii) the average number of persons-days employed per day. The number of persons/person-days employed per thousand persons/person-days is referred to as the work-force participation rate (-WFPR) or the worker population ratio (WPR). This ratio is used in the following discussions on the employed. 4.2.1 WFPR estimates : Of the three approaches, the usual principal status approach is best suited as a measure of the level of economic activity in an economy with seasonal fluctuations in the employment. This is because, in this approach the criteria used is the pattern of activities followed by the person for a relatively long period of time. By considering also persons with some subsidiary employment, certain transient component of employment is also netted in. 4.2.1.1 Given below in table (4.2.1.1) are the WFPRs according to the three approaches viz., usual status, current weekly status, and current daily status for all-India population, separately by residence status and sex. The WFPR is higher in rural areas than in the urban sector. It remains substantially higher for males than for females. As is to be expected the WFPR accor-ding to the usual status including the subsidiary workers i.e. 'all workers' is the highest. Normally due to the longer reference period in the usual status, the usual status WFPR should be more stable, whereas participation in seasonal activities will have an effect on the WFPR according to the cws and cds. The daily status rates take due account of the unutilised days or even the half days of persons who are classified as employed as per the cws or usual status. Thus the differ-ence between the cds rates and usual status or cws rates is a reflection of the extent of underem-ployment which is seen to be higher in the rural sector than in the urban sector. Further it is also due to the absence of large scale regular wage/salaried employment in the rural sector. For females, subsidiary employment as an usual status is much higher than for males. It is also noteworthy that in case of rural females the difference between the usual status rate on the one hand and the cws and cds rates on the other , is the widest. In a situation where all persons have regular full time employment, all the three approaches will produce similar estimates dimension. Thus the differences among these rates is an indication of the divergence of the employment situation from a situation of zero underemployment. Table(4.2.1.1) Number of persons employed per 1000 persons according to usual , current weekly and current daily statuses -All India status number of persons/person-days employed rural urban male female person male female person
(1) (2) (3) (4) (5) (6) (7) usual - ps 538 234 391 513 121 327 usual - all 553 328 444 520 154 347 cws 530 267 403 511 139 334 cds 504 220 365 498 120 317 4.2.2 Usually employed over the rounds: In table(4.2.2) below the WFPRs obtained from the previous quinquennial surveys are presented. It is to be noted that due to certain procedural diff-erences the 27th round results pertaining to usual status are comparable only in respect of all
Key Results on Employment-Unemployment: NSS 50th Round
22workers and are presented only for that category. Similar comparisons are done for cws and cds in the subsequent tables.

Key Results on Employment-Unemployment: NSS 50th Round
23 Table (4.2.2): Number of persons employed per 1000 persons according to usual status 1992-93 to 1993-94 NSS rounds-all-India ----------------------------------------------------------- round employed (all workers) (year)-------------------------------------------------- rural urban ------------------------- ------------------------ male female person male female person ----------------------------------------------------------- (1) (2) (3) (4) (5) (6) (7) ----------------------------------------------------------- 50 553 328 444 520 154 347 (1993-94) 43 539 323 434 506 152 337 (1987-88) 38 547 340 445 512 151 340 (1983) 32 552 331 444 508 156 341 (1977-78) 27 545 318 * 501 134 * (1972-73) ------------------------------------------------------------ * proportions not derived in NSS 27th round. Relative to 1987-88 the WFPRs for males for 1993-94 are higher in both rural and urban sectors by over one percentage point. For females the rates are at the same level as obtained in the 43 rd round. 4.2.3 Current weekly/Daily status employed over the rounds: The cws rates show a higher WFPR both for male and females. Considering that 1987-88 was a year when large parts of the country were under drought conditions, the estimates of WFPRs for 1987-88 were slightly lower than those obtained in the 1983 survey. The CWS rates for the current survey are higher than the 1983 rates. However the WFPR based on the person days employed according to the daily status concept present a different picture. Here, in the case of rural males who constitute the largest segment of the
Usual status wfpr over NSS survey years
0
100
200
300
400
500
600
rura
lm
ale
rura
lfe
mal
e
urba
nm
ale
urba
nfe
mal
e
1972-73
1977-78
1983
1987-88
1993-94
Current weekly status WFPR over NSS survey years
0
100
200
300
400
500
600
ruralmale
ruralfemale
urbanmale
urbanfemale
1972-73
1977-78
1983
1987-88
1993-94

Key Results on Employment-Unemployment: NSS 50th Round
24workforce, the WFPR has remained almost at the same level. A marginal increase of one to two percentage points is evident in cws rates for the other groups. .
Table(4.2.3): Number of persons employed per 1000 persons according to current weekly status
and current daily status over NSS rounds. all-India
---------------------------------------------------------------------------------------------- round cws employed cds employed
------------------------------------ --------------------------------------------- rural urban rural urban
------------------ ------------------ ------------------ ------------------------ male female male female male female male female
------------------------------------------------------ --------------------------------------------- (1) (2) (3) (4) (5) (6) (7) (8) (9)
------------------------------------------------------------------------------------------------------ 50 530 267 511 139 504 220 498 120 43 504 220 492 119 501 207 477 110 38 511 227 492 118 482 198 473 106 32 519 232 490 125 488 194 472 109 27 530 277 491 123 503 231 477 108
--------------------------------------------------------------------------------------------------
The work force participation rates according to the three different approaches indicates that, the WFPRs have increased compared to the 1987-88 rates. That the rate for rural male according to the CDS has not increased as in the case of usual or weekly status indicates that though more persons are in the workforce now, the person days employed have not increased correspon- dingly for them .

Key Results on Employment-Unemployment: NSS 50th Round
25
Current daily Status WFPR over NSS survey years
0100200300
400500600
ruralmale
ruralfemale
urbanmale
urbanfemale
1972-73
1977-78
1983
1987-88
1993-94
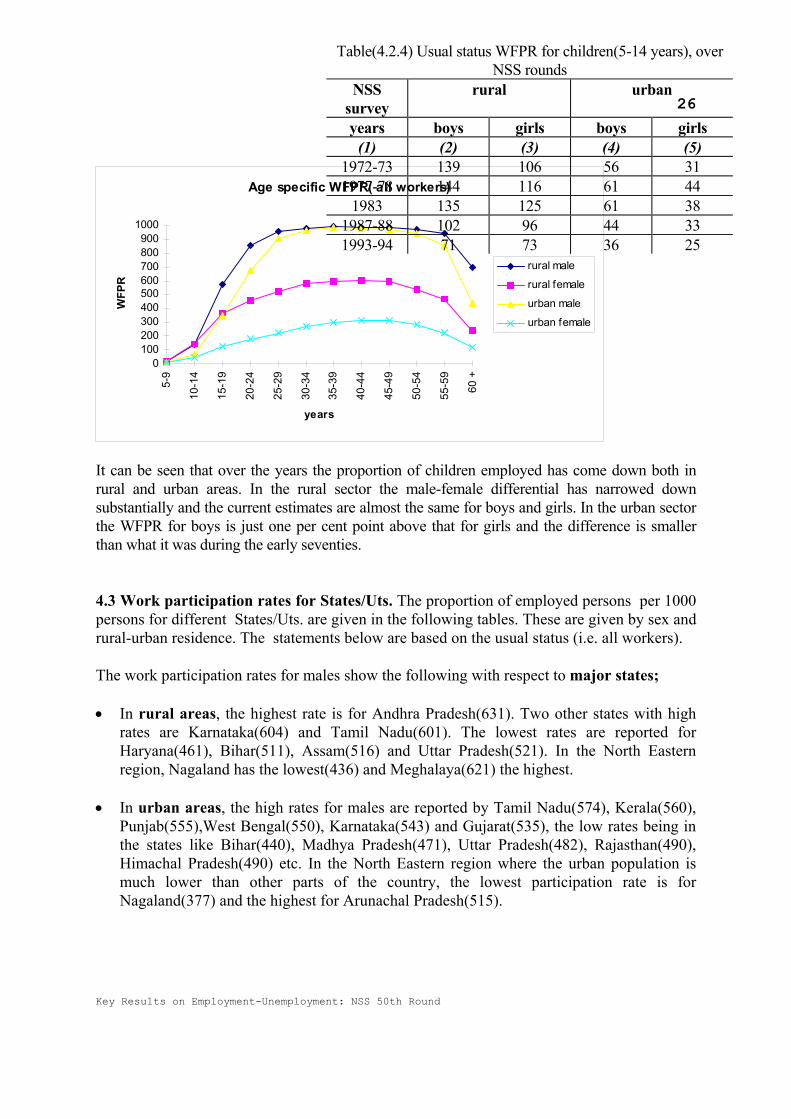
4.2.4 Age-specific WFPR: The de-tailed tables in Chapter 5 give the WFPRs for 5 yearly age groups according to the three approaches (refer to table nos. 1A, 1B, 1C and 1D). A chart depicting the age specific WFPR for the all workers category is given below. A large majority of the male population in the age-group 30-59 years is found working. An interesting component
of the age specific WFPR is the participation rate for those in the age group 5-14 years. They constitute the child labour. In 1993-94 about 7 per cent of the rural children worked while in the urban sector about 2.5 per cent of the female and 3.6 per cent of the male children had some employment. A comparison of these rates with the previous survey results of NSS is given in table(4.2.4)
The estimated number of males who were employed in terms of usual principal status rose from 209 million in 1987-88 to 243 million in 1993-94 roughly at the average rate of 2.7% per annum. For females this growth was from 83 million to 89 million at an average annual growth rate of only 1.2%. Average annual growth rate of employment in urban sector during this period was around 5.2%, from 65 million to 85 million. Compared to this the rural growth rate was only 1.5%. There was a higher growth in employment when both principal and subsidiary statuses are considered; for females it was around 2.2% as against 1.2% in the principal status workers. For males this rate was 2.5%( These rates are worked out on population projected as on January 1, 1988 and 1994.
Key Results on Employment-Unemployment: NSS 50th Round
26
Age specific WFPR( all workers)
0100200300400500600700800900
1000
5-9
10-
14
15-1
9
20-2
4
25-2
9
30-3
4
35-3
9
40-4
4
45-4
9
50-5
4
55-5
9
60 +
years
WFP
R
rural male
rural female
urban male
urban female
It can be seen that over the years the proportion of children employed has come down both in rural and urban areas. In the rural sector the male-female differential has narrowed down substantially and the current estimates are almost the same for boys and girls. In the urban sector the WFPR for boys is just one per cent point above that for girls and the difference is smaller than what it was during the early seventies. 4.3 Work participation rates for States/Uts. The proportion of employed persons per 1000 persons for different States/Uts. are given in the following tables. These are given by sex and rural-urban residence. The statements below are based on the usual status (i.e. all workers). The work participation rates for males show the following with respect to major states; • In rural areas, the highest rate is for Andhra Pradesh(631). Two other states with high
rates are Karnataka(604) and Tamil Nadu(601). The lowest rates are reported for Haryana(461), Bihar(511), Assam(516) and Uttar Pradesh(521). In the North Eastern region, Nagaland has the lowest(436) and Meghalaya(621) the highest.
• In urban areas, the high rates for males are reported by Tamil Nadu(574), Kerala(560),
Punjab(555),West Bengal(550), Karnataka(543) and Gujarat(535), the low rates being in the states like Bihar(440), Madhya Pradesh(471), Uttar Pradesh(482), Rajasthan(490), Himachal Pradesh(490) etc. In the North Eastern region where the urban population is much lower than other parts of the country, the lowest participation rate is for Nagaland(377) and the highest for Arunachal Pradesh(515).
Table(4.2.4) Usual status WFPR for children(5-14 years), over NSS rounds
NSS survey
rural urban
years boys girls boys girls (1) (2) (3) (4) (5)
1972-73 139 106 56 31 1977-78 144 116 61 44
1983 135 125 61 38 1987-88 102 96 44 33 1993-94 71 73 36 25

Key Results on Employment-Unemployment: NSS 50th Round
27The work participation rates for females are much lower than those for males in all the states. Again considering the major states it can be seen that ; • In rural areas, Himachal Pradesh(521) and Andhra Pradesh(520) alone had a rate higher
than 500. • In urban areas, the rates are lower than 250 everywhere. Among the major states,
Kerala(203), Andhra Pradesh(201), and Tamil Nadu(228) had more than 20 % of the urban females working.
4.3.1 Changes in the WFPR over the last survey. In order to look at the change in the participation rates in the major states over the previous survey (i.e. the fourth quinquennial survey ) the rates obtained for the current survey and the previous survey -are presented in the form of four charts in the subsequent pages. The all workers norm is used in these charts and the 1993-94 estimates are compared with 1987-88 estimates. • While it is seen that the all India rates have shown an increase especially for males, these
charts show that in a few states marginal changes have been reported. • For rural males, the WFPR is lower only in the two states of Haryana and Punjab in 1993-
94 compared to 1987-88. • For rural females, the rate is marginally lower in the four states of Bihar, Haryana,
Kerala and Punjab .
• The urban male rate is lower in Haryana with very marginal decrease in Bihar, Madhya Pradesh and Uttar Pradesh while the urban female rate is slightly down in Andhra Pradesh, Bihar, Karnataka, Punjab and Rajasthan .
• The WFPR estimates are based on a sample survey. Therefore, one has to discount
marginal changes as all the estimates are subject to sampling errors . However it is noticed that in Haryana and Punjab the rates have shown a decrease over the previous survey in all segments of the workforce considered.

Key Results on Employment-Unemployment: NSS 50th Round
28
Table (4.3a): Employed persons per 1000 population according to principal usual status by sex and residence for States and Union Territories. ---------------------------------------------------------------- employed persons per 1000 population ------------------------------------------------------ states rural urban --------------------------- ------------------------- male female persons male female persons ---------------------------------------------------------------- (1) (2) (3) (4) (5) (6) (7) ---------------------------------------------------------------- A. P. 621 462 541 533 168 356 Ar. Pradesh 493 407 452 515 96 325 Assam 493 86 309 521 78 309 Bihar 502 129 327 433 56 261 Goa 553 195 364 498 171 339 Gujarat 565 252 415 527 97 323 Haryana 444 58 263 513 71 311 H. P. 510 365 434 475 142 328 J & K 500 95 299 481 81 291 Karnataka 586 328 456 532 141 343 Kerala 516 150 326 543 151 343 M. P. 558 300 435 464 120 303 Maha'tra 537 403 471 520 137 337 Manipur 453 214 335 427 156 294 Meghalaya 616 484 551 496 182 342 Mizoram 514 305 415 478 256 372 Nagaland 419 117 275 375 91 256 Orissa 552 210 382 502 115 319 Punjab 543 37 304 552 59 319 Rajasthan 528 300 418 484 109 308 Sikkim 560 153 381 577 124 375 Tamil Nadu 587 405 495 567 202 382 Tripura 517 104 319 494 111 304 U. P. 506 130 327 475 71 285 West Bengal 537 84 316 537 105 338 A & N Is.'s 544 155 359 535 111 350 Chandigarh 535 105 362 627 161 414 Dadra & 551 197 383 601 178 399 N. Haveli Daman & Diu 579 160 378 493 124 306 Delhi 586 75 398 537 93 344 Lakshadweep 491 84 267 452 90 262 Pondicherry 495 260 386 517 130 317 ----------------------------------------------------------------- All-India 538 234 391 513 121 327
Key Results on Employment-Unemployment: NSS 50th Round
29
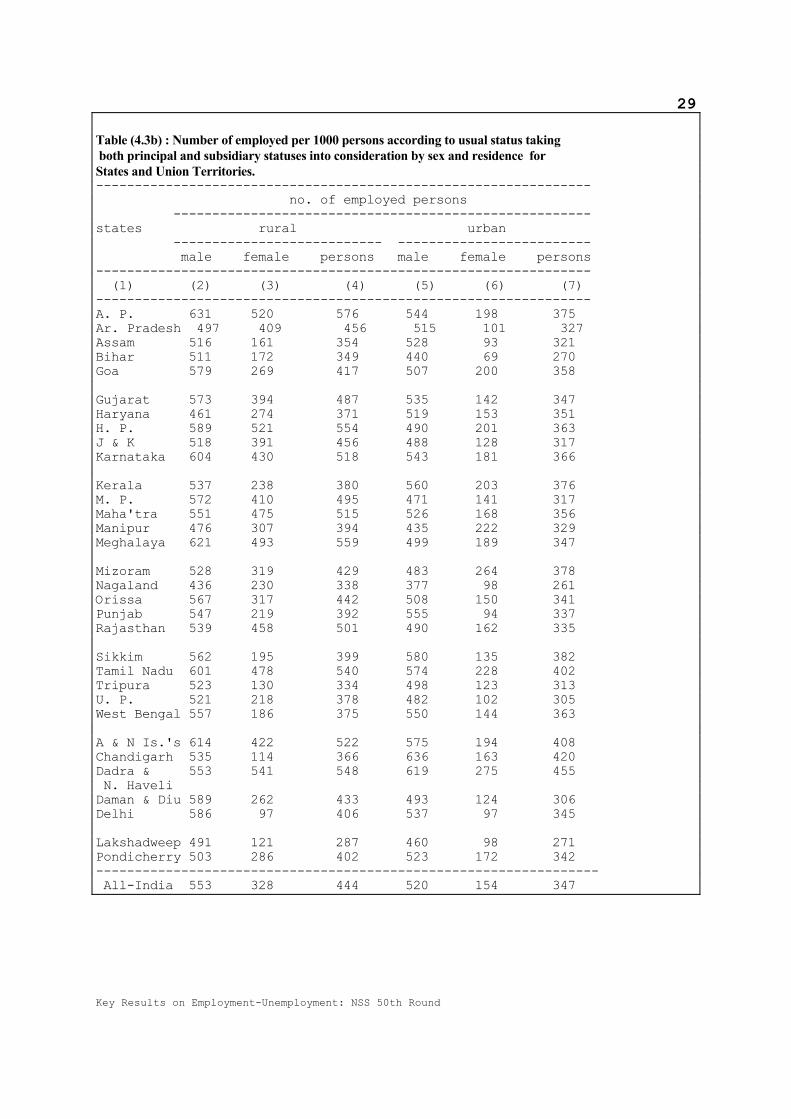
Table (4.3b) : Number of employed per 1000 persons according to usual status taking both principal and subsidiary statuses into consideration by sex and residence for States and Union Territories. ---------------------------------------------------------------- no. of employed persons ------------------------------------------------------ states rural urban --------------------------- ------------------------- male female persons male female persons ---------------------------------------------------------------- (1) (2) (3) (4) (5) (6) (7) ---------------------------------------------------------------- A. P. 631 520 576 544 198 375 Ar. Pradesh 497 409 456 515 101 327 Assam 516 161 354 528 93 321 Bihar 511 172 349 440 69 270 Goa 579 269 417 507 200 358 Gujarat 573 394 487 535 142 347 Haryana 461 274 371 519 153 351 H. P. 589 521 554 490 201 363 J & K 518 391 456 488 128 317 Karnataka 604 430 518 543 181 366 Kerala 537 238 380 560 203 376 M. P. 572 410 495 471 141 317 Maha'tra 551 475 515 526 168 356 Manipur 476 307 394 435 222 329 Meghalaya 621 493 559 499 189 347 Mizoram 528 319 429 483 264 378 Nagaland 436 230 338 377 98 261 Orissa 567 317 442 508 150 341 Punjab 547 219 392 555 94 337 Rajasthan 539 458 501 490 162 335 Sikkim 562 195 399 580 135 382 Tamil Nadu 601 478 540 574 228 402 Tripura 523 130 334 498 123 313 U. P. 521 218 378 482 102 305 West Bengal 557 186 375 550 144 363 A & N Is.'s 614 422 522 575 194 408 Chandigarh 535 114 366 636 163 420 Dadra & 553 541 548 619 275 455 N. Haveli Daman & Diu 589 262 433 493 124 306 Delhi 586 97 406 537 97 345 Lakshadweep 491 121 287 460 98 271 Pondicherry 503 286 402 523 172 342 ----------------------------------------------------------------- All-India 553 328 444 520 154 347

Key Results on Employment-Unemployment: NSS 50th Round
30
Table(4.3c) : Number of employed per 1000 persons according to current weekly status by sex and residence for States and Union Territories. ------------------------------------------------------------- no. of employed persons ------------------------------------------------------ states rural urban --------------------------- ------------------------- male female persons male female persons ---------------------------------------------------------------- (1) (2) (3) (4) (5) (6) (7) ---------------------------------------------------------------- A. P. 599 437 518 528 171 354 Ar. Pradesh 499 409 457 514 103 326 Assam 498 132 332 523 88 318 Bihar 498 140 328 427 63 261 Goa 529 198 355 501 182 346 Gujarat 558 335 450 525 128 333 Haryana 441 208 330 503 127 333 H. P. 540 464 501 478 176 347 J & K 501 261 383 480 107 300 Karnataka 583 365 473 530 161 350 Kerala 516 198 351 529 170 347 M. P. 545 316 437 459 124 303 Maha'tra 526 397 461 516 149 341 Manipur 462 289 376 430 209 319 Meghalaya 614 486 553 493 186 344 Mizoram 534 348 446 505 282 396 Nagaland 429 192 317 374 93 255 Orissa 533 216 378 495 126 321 Punjab 541 197 378 551 91 334 Rajasthan 526 387 461 482 142 323 Sikkim 560 260 427 575 127 377 Tamil Nadu 567 410 486 564 212 388 Tripura 514 111 319 490 108 300 U. P. 502 169 346 475 90 294 West Bengal 531 140 340 540 135 353 A & N Is.'s 554 233 399 535 131 357 Chandigarh 525 114 360 604 171 408 Dadra & 546 395 472 610 224 427 N. Haveli Daman & Diu 570 222 405 493 147 317 Delhi 586 108 410 544 112 358 Lakshadweep 478 75 255 447 76 253 Pondicherry 443 254 354 492 136 309 ----------------------------------------------------------------- All-India 520 267 403 511 139 334

Key Results on Employment-Unemployment: NSS 50th Round
31Table (4.3d) : Number of employed person-days per 1000 person-days by sex and residence status for States and Union Territories. ------------------------------------------------------------- no. of employed persons ------------------------------------------------------ states rural urban --------------------------- ------------------------- male female persons male female persons ---------------------------------------------------------------- (1) (2) (3) (4) (5) (6) (7) ---------------------------------------------------------------- A. P. 567 378 472 505 149 331 Ar. Pradesh 490 401 448 503 102 321 Assam 465 93 297 504 81 301 Bihar 473 121 309 423 56 257 Goa 515 176 337 489 170 332 Gujarat 531 256 399 508 103 315 Haryana 421 134 288 490 95 310 H. P. 513 362 435 472 143 328 J & K 494 175 335 474 90 289 Karnataka 549 303 427 511 141 331 Kerala 457 144 292 479 139 305 M. P. 531 276 409 449 114 292 Maha'tra 499 348 425 507 133 330 Manipur 440 228 336 420 172 299 Meghalaya 570 420 497 480 175 332 Mizoram 465 275 375 441 228 335 Nagaland 427 186 312 375 91 256 Orissa 503 185 344 482 112 307 Punjab 534 117 336 545 74 322 Rajasthan 520 338 433 478 121 310 Sikkim 545 178 383 571 124 372 Tamil Nadu 500 324 411 535 184 359 Tripura 497 102 307 478 104 293 U. P. 486 136 319 465 76 283 West Bengal 496 96 300 521 114 333 A & N Is.'s 520 158 348 511 118 338 Chandigarh 517 88 345 598 170 404 Dadra & 542 271 413 598 159 389 N. Haveli Daman & Diu 563 167 375 487 146 315 Delhi 582 100 406 540 96 348 Lakshadweep 460 75 247 438 74 248 Pondicherry 369 210 294 463 118 284 -------------------------------------------------------------- all India 504 220 365 498 120 317

Key Results on Employment-Unemployment: NSS 50th Round
32
Number of 'all workers' per 1000 persons in 1987-88 and 1993-94- rural male
0
100
200
300
400
500
600
700
A.
P.
Ass
am
Bih
ar
Guj
arat
Har
yana
H. P
.
Kar
nata
ka
Ker
ala
M. P
.
Mah
aras
htra
Pun
jab
Raj
asth
an
T. N
.
U. P
.
W. B
.
All-
Indi
a
1987-88 1993-94
Number of 'all workers' per 1000 rural females in 1987-88 and 1993-94
0
100
200
300
400
500
600
A. P
.
Ass
am
Bih
ar
Guj
arat
Har
yana
H. P
.
Kar
nata
ka
Ker
ala
M. P
.
Mah
aras
htra
Oris
sa
Pun
jab
Raj
asth
an
T. N
.
U. P
.
W. B
.
All-
Indi
a
WFP
R
1993-94
1987-88

Key Results on Employment-Unemployment: NSS 50th Round
33
0
100
200
300
400
500
600A
. P
.
Assa
m
Bih
ar
Guj
arat
Har
yana
H. P
.
Kar
nata
ka
Ker
ala
M. P
.
Mah
aras
htra
Oris
sa
Pun
jab
Raj
asth
an
T. N
.
U. P
.
W. B
.
All-
Indi
a
WFP
R
Number of 'all workers' per 1000 urban males in 1987-88 and 1993-94
1993-94 1987-88
Number of 'all workers' per 1000 urban females in 1987-88 and 1993-94
0
50
100
150
200
250
A.
P.
Ass
am
Bih
ar
Guj
arat
Har
yana
H. P
.
Kar
nata
ka
Ker
ala
M. P
.
Mah
aras
htra
Oris
sa
Pun
jab
Raj
asth
an
T. N
.
U. P
.
W. B
.
All-
Indi
a
WFP
R
1993-94
1987-88
4.4 Distribution of usually employed by status of employment: The employed persons are categorised into three broad groups according to their status of employment. These groups are (i)

Key Results on Employment-Unemployment: NSS 50th Round
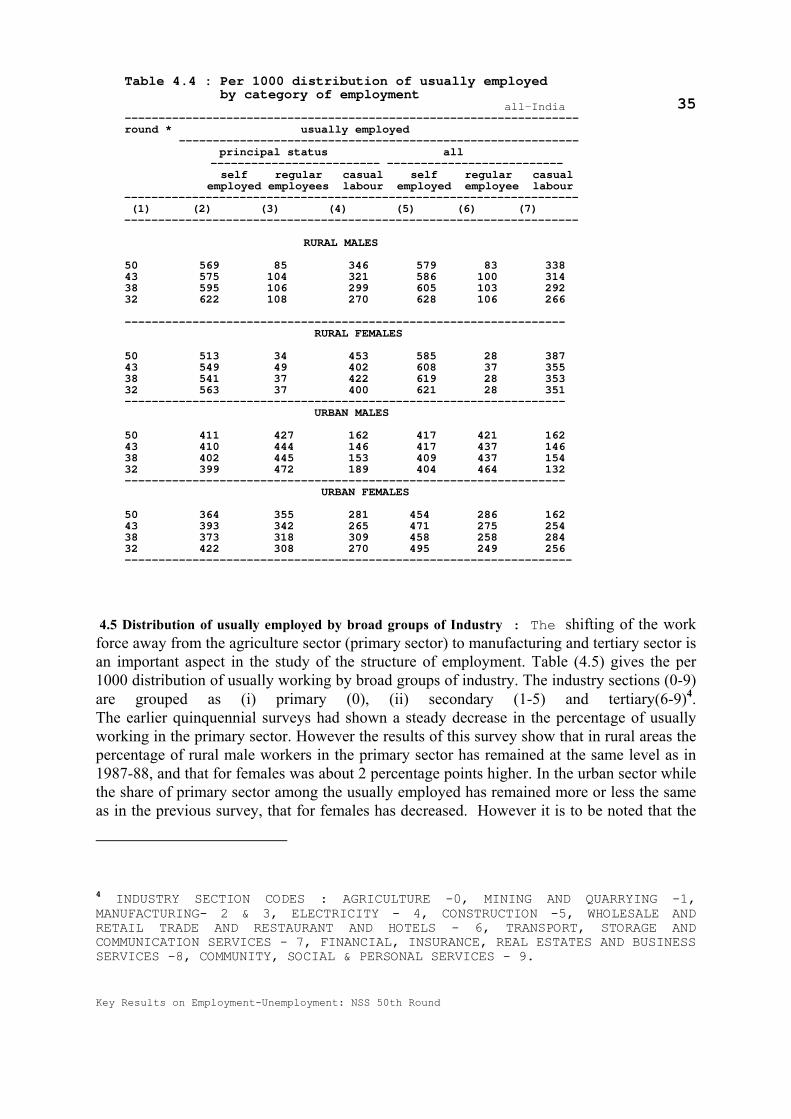
34self-employed (ii) regular employees and (iii) casual labour. These groups can be formed on the basis of the activity status recorded for each person. The self-employed consist of the own-account workers, employers and the helpers in household enterprises. The results pertaining to 'all workers' are given in Table (4.4) below. More than 50 per cent of the rural male employed are in the category of self employed. The regular employees constituted around 8 per cent of the employed males and around 3 per cent of the employed females. Further, over the years the share of the casual labour among the employed has been on the increase. From the 1987-88 level this share is now up by 2 points for males and 5 per cent for females. In the urban sector the self employed and regular employed have an almost equal share of about 42 per cent for males, the remaining 16 per cent being casual labour. However the share of casual labour has increased by a little over one percentage point. For urban females, whose work force participation rate is much lower than of other segments, the distribution shows no clear trend over the years.
Key Results on Employment-Unemployment: NSS 50th Round
35
4.5 Distribution of usually employed by broad groups of Industry : The shifting of the work force away from the agriculture sector (primary sector) to manufacturing and tertiary sector is an important aspect in the study of the structure of employment. Table (4.5) gives the per 1000 distribution of usually working by broad groups of industry. The industry sections (0-9) are grouped as (i) primary (0), (ii) secondary (1-5) and tertiary(6-9)4. The earlier quinquennial surveys had shown a steady decrease in the percentage of usually working in the primary sector. However the results of this survey show that in rural areas the percentage of rural male workers in the primary sector has remained at the same level as in 1987-88, and that for females was about 2 percentage points higher. In the urban sector while the share of primary sector among the usually employed has remained more or less the same as in the previous survey, that for females has decreased. However it is to be noted that the
4 INDUSTRY SECTION CODES : AGRICULTURE -0, MINING AND QUARRYING -1, MANUFACTURING- 2 & 3, ELECTRICITY - 4, CONSTRUCTION -5, WHOLESALE AND RETAIL TRADE AND RESTAURANT AND HOTELS - 6, TRANSPORT, STORAGE AND COMMUNICATION SERVICES - 7, FINANCIAL, INSURANCE, REAL ESTATES AND BUSINESS SERVICES -8, COMMUNITY, SOCIAL & PERSONAL SERVICES - 9.
Table 4.4 : Per 1000 distribution of usually employed by category of employment all-India ------------------------------------------------------------------- round * usually employed ----------------------------------------------------------- principal status all
------------------------- -------------------------- self regular casual self regular casual employed employees labour employed employee labour
------------------------------------------------------------------- (1) (2) (3) (4) (5) (6) (7) -------------------------------------------------------------------
RURAL MALES
50 569 85 346 579 83 338 43 575 104 321 586 100 314 38 595 106 299 605 103 292 32 622 108 270 628 106 266 ----------------------------------------------------------------- RURAL FEMALES 50 513 34 453 585 28 387 43 549 49 402 608 37 355 38 541 37 422 619 28 353 32 563 37 400 621 28 351 ----------------------------------------------------------------- URBAN MALES 50 411 427 162 417 421 162 43 410 444 146 417 437 146 38 402 445 153 409 437 154 32 399 472 189 404 464 132 ----------------------------------------------------------------- URBAN FEMALES 50 364 355 281 454 286 162 43 393 342 265 471 275 254 38 373 318 309 458 258 284 32 422 308 270 495 249 256 ------------------------------------------------------------------

Key Results on Employment-Unemployment: NSS 50th Round
36share of the primary sector, in the gross domestic product of the country which had steadily declined in the seventies and early eighties, was only marginally higher in 1987-88 compared to 1993-94. 4.5.1 The detailed industrial distributions of the employed according to the usual status taking in to account the principal status separately and the principal and subsidiary status together are given in table (4.5.1) for all-India and those for all states/uts. in Tables (3A) and (3B) respectively.
Table(4.5) : Per 1000 distribution of usually working by broad groups of industry all-India ----------------------------------------------------------------- round male female --------------------------- ----------------------------- primary secondary tertiary primary secondary tertiary ------- --------- -------- -------- --------- --------- ps all ps all ps all ps all ps all ps all ----------------------------------------------------------------- (1) (2) (3) (4) (5) (6) (7) (8) (9) (10) (11) (12) (13) ----------------------------------------------------------------- RURAL 50 737 741 113 112 149 147 847 862 91 83 63 56 43 739 745 123 121 138 134 825 847 112 100 63 53 38 772 775 102 100 123 122 862 875 78 74 57 48 32 804 806 89 88 107 105 868 881 71 67 61 51 ----------------------------------------------------------------- URBAN 50 87 90 331 330 581 579 193 247 295 291 510 463 43 85 91 343 340 572 569 218 294 324 317 458 389 38 97 103 344 342 551 550 255 310 307 306 430 376 32 102 106 338 338 560 557 251 319 327 324 421 357 -----------------------------------------------------------------

Key Results on Employment-Unemployment: NSS 50th Round
37 4.6 Unemployed : As in the case of 'employed', for unemployed also three different estimates are obtained following the three different approaches: These are :
a) Number of persons usually unemployed based on 'usual status' classification
b) Number of persons unemployed on an average in a week based on the 'weekly status' classification and
c) Number of person-days unemployed on an average on a day based on 'daily status'.
The first estimate indicates the magnitude of persons unemployed for a relatively longer period during a reference period of 365 days and appr-oximates to an indicator relating to the chronically unemployed. Some of the unemployed obtained on the basis of
this time criterion, might be working in a subsidiary capacity. We can therefore get another estimate of the unemployed excluding those employed in a subsidiary capacity during the reference period. The former are called as the usually unemployed in terms of the principal status (p.s) and the latter, the usually unemployed excluding the subsidiary status workers (u.s adjusted) which admittedly will be lower than the former. The second estimate based on the weekly status, gives the average weekly picture during the survey year and includes both the chronic unemployment and also the intermittent unemployment caused by seasonal fluctuations in the labour market of those categorised as usually employed. The third estimate based on the daily status concept gives average volume of unemployment on a day during the survey year. It is the most inclusive rate of 'unemployment' capturing the unemployed days of the chronically unemployed, the unemployed days of the usually employed who become intermittently unemployed during the reference week and the unemployed days of those classified as employed according to the priority criterion of current weekly status. For discussions on the subject of unemployment, the unemployment rates are used rather than the proportion of unemployed in the population. Unemployment rate is defined as the number of persons unemployed per thou-
Table ( 4.5.1) Per 1000 distribution of usual status workers by industry
employed according to industry males females section ps all ps all
(1) (2) (3) (4) (5) rural areas
0 737 741 847 8621 7 7 5 4
2 & 3 70 70 75 704 3 3 0 05 33 32 11 96 55 55 22 217 22 22 1 18 4 4 1 19 67 66 39 33
all 1000 1000 1000 1000urban areas
0 87 90 193 2471 13 13 7 6
2 & 3 236 236 238 2414 12 12 3 35 70 69 49 416 219 219 107 1007 98 97 15 138 38 37 22 199 226 226 366 331
all 1000 1000 1000 1000

Key Results on Employment-Unemployment: NSS 50th Round
38sand persons in the labour force (which includes both the employed and the unemployed). This in effect gives the unutilised portion of the labour force. 4.6.1 Unemployment rates: In table (4.6.1) the unemployment rates according to the three approaches are provided. The proportions of unemployed in the population are given in paren-theses. The overall unemployment rates are not high. The urban rates are higher than the rural rates. The unemployed person-day rates are higher than the rates obtaining for persons indicating a high degree of intermittent unemployment. This is mainly due to the absence of regular employment for many workers. The usually unemployed, measured through the usual status or the still restrictive usual status adjusted , as a proportion of the total population is very small. However unemployment rates among certain specified categories like the educated, the youth etc. can be much high than thes overall rates. Some of these rates are specifically looked in to in this section. Considering the population in the age group 15 to 29 who constitute the youth among the labour force, the usual principal status unemployment rates vary from 3 per cent among rural females to 19 per cent among urban females. For males it is 5 per cent in rural sector
and 11 per cent in urban sector. 4.6.2 Unemployment over NSS survey years :Table(4.6.2) gives the unemployment rates according to the five quinquennial surveys of NSS. It may be recalled that for the 27th round survey only the usual status (adjusted) figures are available. The unemployment rate in terms of
Table(4.6.1) :Unemployment rates according to usual, current weekly, current daily status all-India ----------------------------------------------------------- status unemployment rate ---------------------------------------------------------- rural urban --------------------------- ------------------------------ male female person male female person ----------------------------------------------------------------------- (1) (2) (3) (4) (5) (6) (7) ---------------------------------------------------------------------- u.s 20 13 18 45 83 52 (11) (3) (7) (24) (11) (18) us(adj.) 14 9 11 41 61 44 (8) (3) (5) (22) (10) (16) cws 31 29 29 52 79 56 (17) ( 8) (12) (28) (12) (20) cds 56 56 56 67 104 76 (30) (13) (22) (36) (14) (26)
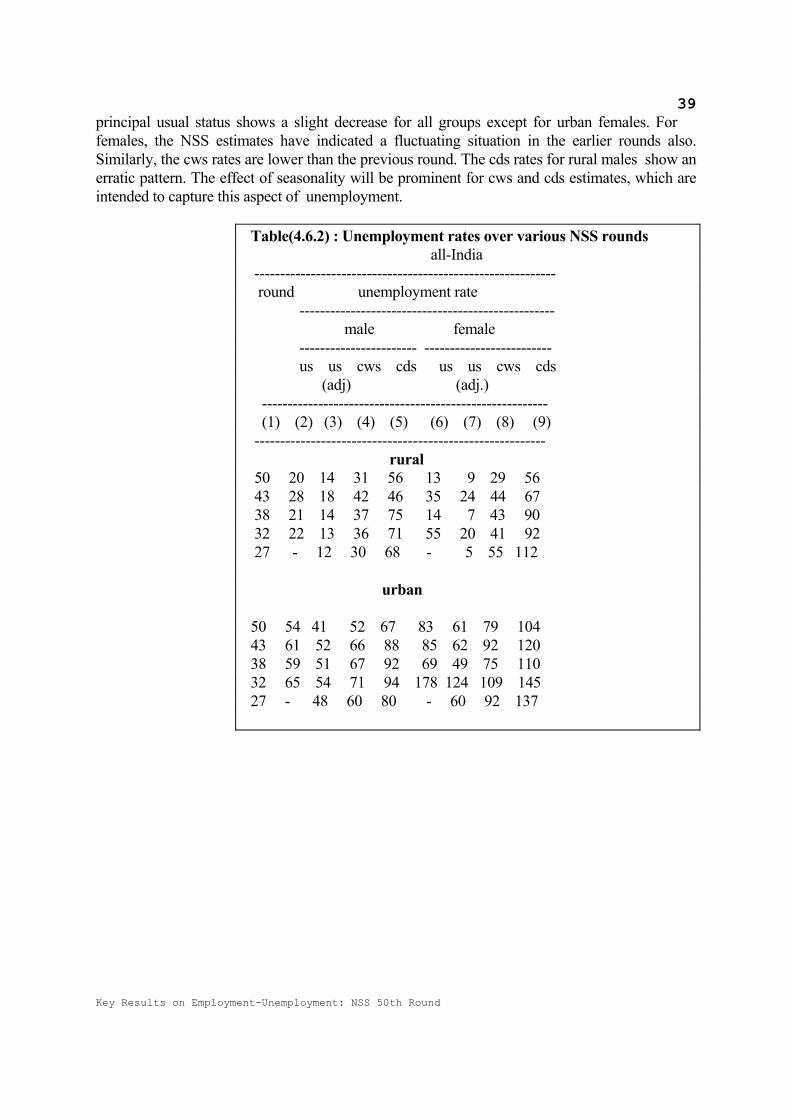
Key Results on Employment-Unemployment: NSS 50th Round
39principal usual status shows a slight decrease for all groups except for urban females. For females, the NSS estimates have indicated a fluctuating situation in the earlier rounds also. Similarly, the cws rates are lower than the previous round. The cds rates for rural males show an erratic pattern. The effect of seasonality will be prominent for cws and cds estimates, which are intended to capture this aspect of unemployment.
Table(4.6.2) : Unemployment rates over various NSS rounds all-India ----------------------------------------------------------- round unemployment rate -------------------------------------------------- male female ----------------------- ------------------------- us us cws cds us us cws cds (adj) (adj.) -------------------------------------------------------- (1) (2) (3) (4) (5) (6) (7) (8) (9) --------------------------------------------------------- rural 50 20 14 31 56 13 9 29 56 43 28 18 42 46 35 24 44 67 38 21 14 37 75 14 7 43 90 32 22 13 36 71 55 20 41 92 27 - 12 30 68 - 5 55 112 urban 50 54 41 52 67 83 61 79 104 43 61 52 66 88 85 62 92 120 38 59 51 67 92 69 49 75 110 32 65 54 71 94 178 124 109 145 27 - 48 60 80 - 60 92 137

Key Results on Employment-Unemployment: NSS 50th Round
40Unemployment rates - 1972-73 to 1993-94
Unemployment rates- rural male
0
20
40
60
80
72-73 77-78 1983 87-88 93-94
survay years
unem
ploy
ed p
er 1
000
in la
bour
forc
e
us(adj.)
cw s
cds
Unemployment rates- rural female
0
50
100
150
72-73 77-78 1983 87-88 93-94
survey years
unem
ploy
ed p
er
1000
in la
bour
forc
e
us(adj.)cw s
cds
Unemployment rate- urban male
0
20
40
60
80
100
72-73 77-78 1983 87-88 93-94
survey years
unem
ploy
ed p
er 1
000
in
labo
ur fo
rce
us(adj.)
cw s
cds

Key Results on Employment-Unemployment: NSS 50th Round
41
Unemployment rate- urban female
020406080
100120140160
72-73 77-78 1983 87-88 93-94
survey years
unem
ploy
ed p
er 1
000
in
labo
ur fo
rce
us(adj.)
cw s
cds
4.7 Educated among the employed/unemployed: The educational attainment of the members of respondent sample households was ascertained in the survey. The data have been tabulated to
obtain the percentage of educated among the employed/unemployed. The educated for this purpose are defined as persons with secondary and higher educational levels. Only the usual
principal status is considered. The results are presented in Table(4.7) below. The table shows that among the unemployed about 60 per cent and 63 per cent were in the educated category in the
rural and urban sectors respectively. 4.7.1 Unemployment rates of the educated: From the detailed table it can be worked out that about 5 to 6 per cent of the educated are unemployed. This figure does not convey the real picture as it is derived by taking all the persons with secondary and higher education in the denominator. Many of them may be continuing their studies as students or in the case of females remaining as home makers. In this situation the unemployment rate obtained by considering the educated who provide the supply of labour in the denominator can be more helpful. In table (4.7.1), the educated are split further into graduate and above category. This table reveals some interesting facts. The unemployment rate is much higher among educated females than among males both in the rural and urban sectors. In fact 24 per cent of the educated females in the labour force in the rural sector are unemployed. In the urban sector this is slightly lower at 21 per cent. Among the graduates this discrepancy is even more glaring. Over 32 per cent of the rural female graduates in the labour force are unemployed. Secondly the problem of unemployment among the educated appears to be much more in the rural sector than in the urban sector contrary to the general belief. Perhaps the reduced mobility and other social factors which restrict the labour market options for females explain this high rate of unemployment among the educated females. Similar factors play a role in the rural sector in general to show high unemployment rate among the educated rural males. The educated are generally seeks white collar jobs and the gender difference in the access to them is an important issue. These rates are however seen to be marginally lower than the estimates of 43rd round NSS which are also given in table(4.7.1). 4.7.2 One can also work out the literacy levels from the detailed table( Table 2 in Chapter 5) by taking the complement of the not literate. These are shown in Table (4.7.2).

Key Results on Employment-Unemployment: NSS 50th Round
42 Table (4.7) : Percentage of educated among the employed/unemployed (5 years & above)
rural urban status male female person male female person
(1) (2) (3) (4) (5) (6) (7) employed self-employed
130 19 100 335 118 300
regular employed
425 339 413 530 557 533
casual labour
39 6 28 80 17 63
all 124 24 95 376 248 354 un-employed #
604 (409)
576 (234)
597
586 (461)
725 (601)
626
# Figures in the brackets are estimates corresponding to the 43rd round(1987-88) Table (4.7.1) : Unemployment rates( usual principal status) for the educated secondary and above graduate and above
sector male female male female (1) (2) (3) (4) (5)
Rural-43rd round 114 341 149 373 -50th round 89 243 134 323 Urban-43rd round 83 219 74 210 -50th round 69 207 64 205
4.8 Proportion of unemployed in States/Union Territories : In the next four tables are presented the proportion of unemployed (days) per 1000 persons(days) for various states and union territories. To study the pattern of unemployment in the states and uts. one can first consider the usual status unemployed. They consist of persons who have reported unemployment for a relatively longer time during the reference period of one year. However it is possible that some of them had some
marginal employment for some short period of time. From the figures presented in table (4.8a) we observe that :
literacy rate for 5 years and above population(per 1000) -------------------------------- 1993-94 1987-88 rural male 652 556 rural female 366 295 urban male 841 808 urban female 682 625

Key Results on Employment-Unemployment: NSS 50th Round
43 In general the proportions5 are much higher in urban areas than in rural areas. States/Uts. reporting high proportion of unemployed males also have high proportion of unemployed females . ¶ rural males
Among the major states Kerala has reported the highest level of unemployment, 40 per thousand, followed by Assam( 33), Tamil Nadu(17) and West Bengal(16). The other states with more than one per cent of their rural males usually unemployed are Orissa(15), Bihar(12), HP(12) and Haryana(11). In the smaller states and Union Territories where, as mentioned earlier, the results will be based on a comparatively smaller sample size, the proportions show wide variations. The estimated proportion for Goa is 54 per 1000, the highest. In Lakshadweep also one finds a high proportion(30). Other high proportions are in the Union Territories of A & N Islands(29), Pondicherry(22) and Chandigarh(15).
¶ rural females
The proportions are much lower than for rural males. In fact, only Kerala and Assam have the proportions higher at 29 and 14 per 1000. In Kerala as can be seen elsewhere also both males and females have reported high proportions of unemployment . In the Union Territory of Lakshdweep the estimate is as high 78 per thousand. It was observed that in Lakshdweep out of a total of 206 females surveyed 18 reported unemployment throughout the year including the survey week. Thus it can be seen that the estimates of unemployment for rural females under all the three approaches are the same for Lakshdweep.
¶ urban males
The unemployed urban males are the most visible segment of the unemployment problem. This shows up in the estimates also. The usually unemployed constitute more than 2 per cent of the urban male population of all ages. Among the major states Kerala and West Bengal have almost four and half per cent of their urban males unemployed for a major part of the year. Orissa , Assam and Bihar have also rather high figures. For the smaller states and union territories it is to be noted that except for Chandigarh and Delhi the urban population is very small. Goa has also a very high proportion followed by Pondicherry.
¶ urban females The regional pattern of unemployment among urban females is similar to that observed among urban males. Kerala, West Bengal, Tamil Nadu, Assam among the major states and Goa, Tripura, Chandigarh among the smaller ones have high level of unemployment .
4.8.1 To measure chronic unemployment, we can consider the usually unemployed excluding those employed in a subsidiary status (called the usual status adjusted). These are smaller in
5 All proportions mentioned in parenthesis are number per 1000.

Key Results on Employment-Unemployment: NSS 50th Round
44magnitude than the usual status proportion .But the regional pattern is similar to that of unadjusted usual status unemployment . The daily status concept incorporates the changes in the activity statuses of persons by taking into account the half- days data during the seven days of the reference week. The estimates based on the daily status therefore measure the extent of unemployment in terms of person-days rather than unemployed persons. To an extent the unemployed days of persons who are usually employed are also taken into account in this case. In a situation where large scale seasonal unemployment exists, the cds measure gives a better picture of the unemployment situation than the one relating to unemployed persons. In the daily status estimates we find that Tamil Nadu has the highest proportion of unemployed person-days in the rural sector (58 person days out of 1000 person days) followed by Kerala(51) and West Bengal(30). The estimates for urban males are the highest for Kerala (79), followed by West Bengal (60) and Tamil Nadu (51).

Key Results on Employment-Unemployment: NSS 50th Round
45
Table (4.8a) : Number of unemployed per 1000 persons according to usual principal status by sex and residence status for States/union Territories. ---------------------------------------------------------------- no. of unemployed persons ------------------------------------------------------ states rural urban --------------------------- ------------------------- male female persons male female persons ---------------------------------------------------------------- (1) (2) (3) (4) (5) (6) (7) ---------------------------------------------------------------- A. P. 6 2 4 19 8 14 Ar. Pradesh 9 1 5 9 8 9 Assam 33 14 24 35 32 33 Bihar 12 1 7 33 7 21 Goa 54 40 47 46 38 42 Gujarat 9 1 5 18 6 13 Haryana 11 3 7 14 6 10 H. P. 12 2 7 20 1 12 J & K 7 2 4 33 14 24 Karnataka 8 2 5 19 12 15 Kerala 40 29 34 45 49 47 M. P. 5 1 3 28 6 18 Maha'tra 9 3 6 25 8 17 Manipur 9 2 6 24 7 15 Meghalaya 3 - 1 7 7 7 Mizoram 9 2 6 2 2 2 Nagaland 10 0 5 28 7 19 Orissa 15 4 9 40 10 26 Punjab 8 3 6 19 6 13 Rajasthan 2 1 2 10 1 6 Sikkim 3 6 5 9 12 10 Tamil Nadu 17 5 11 29 19 24 Tripura 8 10 9 33 28 30 U. P. 6 1 4 18 1 10 W. B. 16 4 10 45 26 36 A & N Is.'s 29 16 22 46 31 39 Chandigarh 15 5 11 22 49 34 D&N Haveli 4 4 4 9 4 7 Daman&Diu 10 - 5 23 15 19 Delhi - - - 5 6 5 Lakshadweep 30 78 56 84 52 67 Pondicherry 22 - 12 31 19 25 ----------------------------------------------------------------- All-India 11 3 7 24 11 18

Key Results on Employment-Unemployment: NSS 50th Round
46 Table (4.8b) : Number of unemployed per 1000 persons according to usual status excluding those who are employed in a subsidiary status by sex and residence status for States/union Territories. ---------------------------------------------------------------- no. of unemployed persons ------------------------------------------------------ states rural urban --------------------------- ------------------------- male female persons male female persons ---------------------------------------------------------------- (1) (2) (3) (4) (5) (6) (7) ---------------------------------------------------------------- A. P. 4 1 2 16 7 12 Ar.Pradesh 8 1 5 9 8 9 Assam 25 13 19 31 32 31 Bihar 10 1 6 32 7 21 Goa 43 40 41 44 36 40 Gujarat 8 1 5 17 6 12 Haryana 7 1 4 13 5 10 H. P. 5 1 3 17 1 10 J & K 5 2 3 31 12 22 Karnataka 6 2 4 16 11 14 Kerala 31 26 28 40 47 43 M. P. 4 1 2 26 6 17 Maha'tra 7 2 4 24 8 16 Manipur 6 2 4 21 7 14 Meghalaya 3 - 1 5 7 6 Mizoram 8 1 5 2 1 2 Nagaland 10 0 5 28 7 19 Orissa 10 2 6 36 10 24 Punjab 8 3 5 18 5 12 Rajasthan 2 1 1 8 1 5 Sikkim 3 3 3 9 12 10 Tamil Nadu 11 3 7 26 17 21 Tripura 8 8 8 32 26 29 U. P. 5 1 3 16 1 9 W. B. 10 3 7 37 31 24 A & N Is.'s 15 7 11 24 22 23 Chandigarh 15 5 11 22 46 33 D&N Haveli 4 4 4 - 4 2 Daman & Diu 10 - 5 23 15 19 Delhi - - - 5 6 5 Lakshadweep 30 78 56 81 52 66 Pondicherry 22 - 12 31 19 25 ----------------------------------------------------------------- All-India 8 3 5 22 10 16

Key Results on Employment-Unemployment: NSS 50th Round
47Table (4.8c) : Number of unemployed per 1000 persons according to current weekly status by sex and residence status for States/ union Territories. ---------------------------------------------------------------- no. of unemployed persons ------------------------------------------------------ states rural urban --------------------------- ------------------------- male female persons male female persons ---------------------------------------------------------------- (1) (2) (3) (4) (5) (6) (7) ---------------------------------------------------------------- A. P. 16 13 15 26 12 19 Ar.Pradesh 9 2 6 9 111 9 Assam 28 16 23 31 32 32 Bihar 17 4 11 37 7 23 Goa 69 46 57 49 38 44 Gujarat 15 6 11 21 9 15 Haryana 22 5 14 25 7 17 H. P. 7 1 4 17 2 11 J & K 10 2 6 35 14 26 Karnataka 11 4 8 22 12 17 Kerala 39 30 34 54 49 51 M. P. 11 6 8 30 8 20 M'rashtra 16 8 13 29 11 21 Manipur 8 2 5 22 6 14 Meghalaya 4 - 1 7 7 7 Mizoram 8 2 5 2 1 2 Nagaland 10 1 5 28 7 19 Orissa 25 9 17 44 10 28 Punjab 10 3 7 19 5 13 Rajasthan 5 1 3 12 2 7 Sikkim 3 2 3 11 12 11 Tamil Nadu 27 12 20 31 19 26 Tripura 11 10 11 37 28 32 U. P. 10 8 9 21 5 13 W. B. 23 9 17 46 29 38 A & N Is.'s 22 11 17 45 27 37 Chandigarh 15 18 16 44 59 51 D&N Haveli 5 4 5 - 4 2 Daman & Diu 21 - 11 23 12 17 Delhi - - - 8 6 7 Lakshadweep 35 78 59 82 52 66 Pondicherry 74 6 43 51 18 34 ----------------------------------------------------------------- All-India 17 8 12 28 12 20
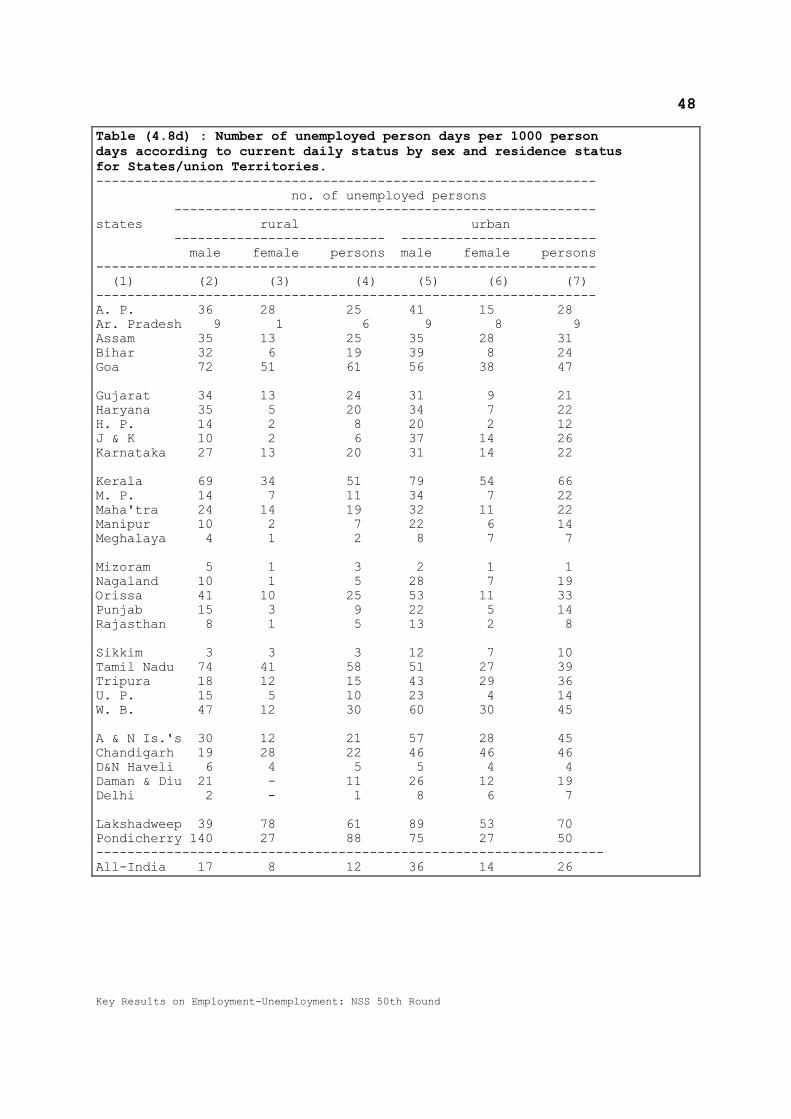
Key Results on Employment-Unemployment: NSS 50th Round
48 Table (4.8d) : Number of unemployed person days per 1000 person days according to current daily status by sex and residence status for States/union Territories. ---------------------------------------------------------------- no. of unemployed persons ------------------------------------------------------ states rural urban --------------------------- ------------------------- male female persons male female persons ---------------------------------------------------------------- (1) (2) (3) (4) (5) (6) (7) ---------------------------------------------------------------- A. P. 36 28 25 41 15 28 Ar. Pradesh 9 1 6 9 8 9 Assam 35 13 25 35 28 31 Bihar 32 6 19 39 8 24 Goa 72 51 61 56 38 47 Gujarat 34 13 24 31 9 21 Haryana 35 5 20 34 7 22 H. P. 14 2 8 20 2 12 J & K 10 2 6 37 14 26 Karnataka 27 13 20 31 14 22 Kerala 69 34 51 79 54 66 M. P. 14 7 11 34 7 22 Maha'tra 24 14 19 32 11 22 Manipur 10 2 7 22 6 14 Meghalaya 4 1 2 8 7 7 Mizoram 5 1 3 2 1 1 Nagaland 10 1 5 28 7 19 Orissa 41 10 25 53 11 33 Punjab 15 3 9 22 5 14 Rajasthan 8 1 5 13 2 8 Sikkim 3 3 3 12 7 10 Tamil Nadu 74 41 58 51 27 39 Tripura 18 12 15 43 29 36 U. P. 15 5 10 23 4 14 W. B. 47 12 30 60 30 45 A & N Is.'s 30 12 21 57 28 45 Chandigarh 19 28 22 46 46 46 D&N Haveli 6 4 5 5 4 4 Daman & Diu 21 - 11 26 12 19 Delhi 2 - 1 8 6 7 Lakshadweep 39 78 61 89 53 70 Pondicherry 140 27 88 75 27 50 ----------------------------------------------------------------- All-India 17 8 12 36 14 26
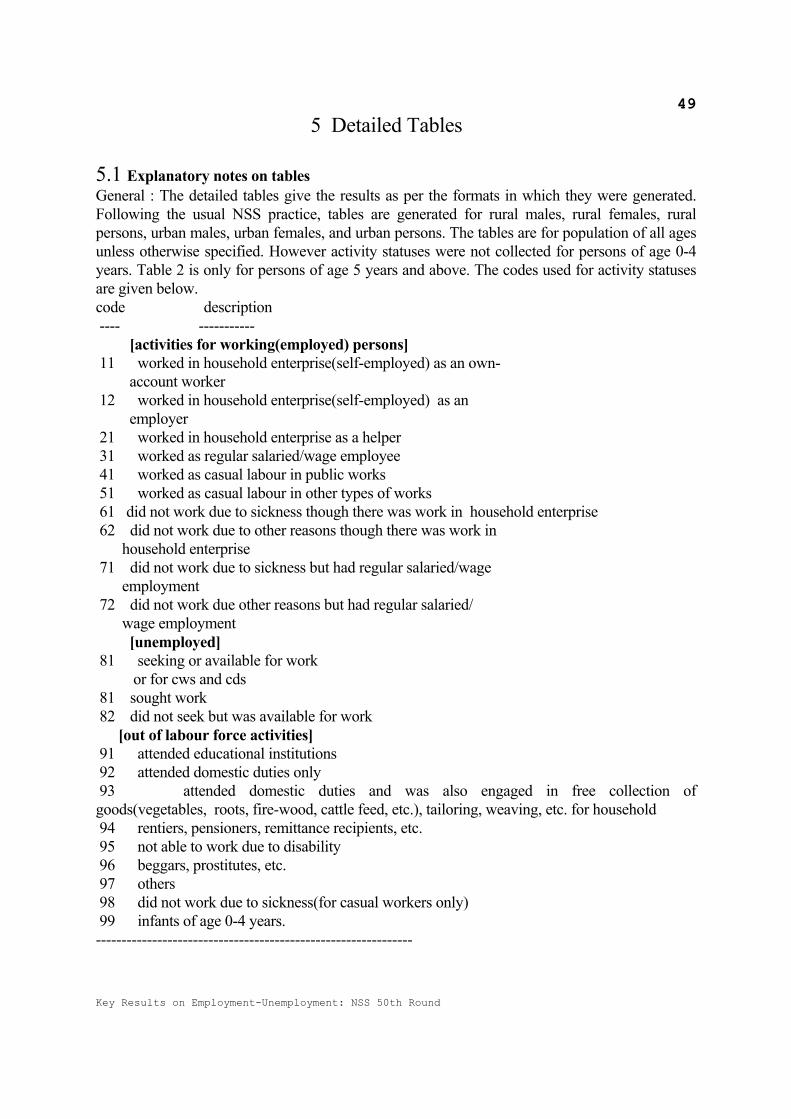
Key Results on Employment-Unemployment: NSS 50th Round
495 Detailed Tables
5.1 Explanatory notes on tables General : The detailed tables give the results as per the formats in which they were generated. Following the usual NSS practice, tables are generated for rural males, rural females, rural persons, urban males, urban females, and urban persons. The tables are for population of all ages unless otherwise specified. However activity statuses were not collected for persons of age 0-4 years. Table 2 is only for persons of age 5 years and above. The codes used for activity statuses are given below. code description ---- ----------- [activities for working(employed) persons] 11 worked in household enterprise(self-employed) as an own- account worker 12 worked in household enterprise(self-employed) as an employer 21 worked in household enterprise as a helper 31 worked as regular salaried/wage employee 41 worked as casual labour in public works 51 worked as casual labour in other types of works 61 did not work due to sickness though there was work in household enterprise 62 did not work due to other reasons though there was work in household enterprise 71 did not work due to sickness but had regular salaried/wage employment 72 did not work due other reasons but had regular salaried/ wage employment [unemployed] 81 seeking or available for work or for cws and cds 81 sought work 82 did not seek but was available for work [out of labour force activities] 91 attended educational institutions 92 attended domestic duties only 93 attended domestic duties and was also engaged in free collection of goods(vegetables, roots, fire-wood, cattle feed, etc.), tailoring, weaving, etc. for household 94 rentiers, pensioners, remittance recipients, etc. 95 not able to work due to disability 96 beggars, prostitutes, etc. 97 others 98 did not work due to sickness(for casual workers only) 99 infants of age 0-4 years. --------------------------------------------------------------
Key Results on Employment-Unemployment: NSS 50th Round
50 Codes 61,62,71,72,82,and 98 are applicable for current weekly and current daily status only. 5.2 The main contents of each table are described below: Table 1A: This gives the per thousand distribution of persons by principal usual activity category for each age-group and also the distribution of persons by age-groups and principal usual activity categories. Under each of the work related activity categories the broad industry-wise distr-ibution is also given. These are industry section 0 (i.e. primary sector), 1-5 (secondary sector), and 6-9 ( tertiary sector). It is to be noted that in the industrial distribution under various statuses, the 6-9 group also contains a few cases where industry section is not given. Thus some minor differences are likely in this and table3A. The estimates of aggregates under each column/row are also given along with the sample persons. Tables 1B, 1C and 1D: These are similar to table 1A but cover activity statuses according to (i) principal usual status including subsidiary status workers, (ii) current weekly status and (iii) cur-rent daily status. In table 1D, the distribution pertains to person-days rather than persons. For each person the seven days of the reference week preceding the date of survey is considered and the aggregate of person days are distributed in to various classes. Table 2 : This table gives the per thousand distribution of persons of age 5 years and above by general education category for each principal usual status. Table 3A: This table gives the per thousand distribution of workers by industry section for the principal status workers and all workers. 5.3 Adjustment of rounding off : In the case of per thousand distribution, the difference of the sum of components from 1000 is adjusted with the row/column having the maximum entry making the respective row-sum/column-sum equal to 1000. This is indicated by '#' sign against the row/column. However in the table the actual sums before the adjustment is printed in place of 1000. 5.4 Difference between '-' and '0': A '-' indicates that no sample observation in that particular class exists i.e. the numerator is absolute zero, whereas a '0' indicates that the estimated value is so small that when rounded off for presentation has become 0.
***********

46
NATIONAL SAMPLE SURVEY, 50TH ROUND : JULY 1993--JUNE 1994
TABLE (1A): PER 1000 DISTRIBUTION OF PERSONS BY PRINCIPAL USUAL ACTIVITY CATEGORY FOR EACH AGE-GROUP.
RURAL
ALL-INDIA MALE
NO. OF SAMPLE VILLAGES: 6983
------------------------------------------------------------------------------------------------------------------------------------
USUAL ACTIVITY AGE-GROUP IN YEARS
---------------- --------------------------------------------------------------------------------------------------- ESTD. SAMPLE
STATUS INDUSTRY 0- 5- 10- 15- 20- 25- 30- 35- 40- 45- 50- 55- 60 & NOT ALL PERSONS PERSONS
4 9 14 19 24 29 34 39 44 49 54 59 ABOVE RECD. GROUPS (00)
------------------------------------------------------------------------------------------------------------------------------------
(1) (2) (3) (4) (5) (6) (7) (8) (9) (10) (11) (12) (13) (14) (15) (16) (17) (18) (19)
------------------------------------------------------------------------------------------------------------------------------------
11,12,21 0 - 5 57 231 355 361 362 375 415 428 475 492 448 - 239 714779 48010
1-5 - 0 4 17 31 43 40 50 41 45 34 37 31 - 22 67516 3761
6-9 - 1 6 36 75 92 96 91 84 74 76 68 49 - 45 136352 8585
---------------------------------------------------------------------------------------------------------------------------
0-9 - 6 67 284 461 496 498 516 540 547 585 597 528 - 306 918647 60356
------------------------------------------------------------------------------------------------------------------------------------
31 0 - 0 6 8 12 11 14 12 13 13 10 10 5 - 7 22075 1385
1-5 - - 1 7 22 22 31 26 24 25 17 11 2 - 11 34381 1929
6-9 - 0 2 10 31 49 66 66 76 76 73 54 7 - 28 84865 6872
---------------------------------------------------------------------------------------------------------------------------
0-9 - 0 9 25 65 82 111 104 113 114 100 75 14 - 46 141321 10186
------------------------------------------------------------------------------------------------------------------------------------
41&51 0 - 2 29 163 223 287 295 301 279 270 246 232 128 - 150 450883 20985
1-5 - 1 7 39 57 59 56 50 41 37 25 23 10 - 27 80727 4071
6-9 0 0 2 11 18 23 19 17 12 12 9 9 4 - 9 27034 1807
---------------------------------------------------------------------------------------------------------------------------
0-9 0 3 38 213 298 369 370 368 332 319 280 264 142 - 186 558644 26863
------------------------------------------------------------------------------------------------------------------------------------
11-51 0 - 7 92 402 590 659 671 688 707 711 731 734 581 - 3961187737 70380
1-5 - 1 12 63 110 124 127 126 106 107 76 71 43 - 60 182624 9761
6-9 0 1 10 57 124 164 181 174 172 162 158 131 60 - 82 248251 17264
---------------------------------------------------------------------------------------------------------------------------
0-9 0 9 114 522 824 947 979 988 985 980 965 936 684 - 5381618612 97405
------------------------------------------------------------------------------------------------------------------------------------
81 X - 0 2 26 59 31 8 2 2 1 0 1 0 - 11 32374 2255
------------------------------------------------------------------------------------------------------------------------------------
11-81 X 0 9 116 548 883 978 987 990 987 981 965 937 684 - 5491650986 99660
------------------------------------------------------------------------------------------------------------------------------------
91-99 X 1000 991 884 452 117 22 13 10 13 19 35 63 316 1000 4511357450 83804
------------------------------------------------------------------------------------------------------------------------------------
11-99 X# 1000 1000 1002 999 999 999 1000 998 1000 1000 1001 999 999 1000 9993008436 183464
------------------------------------------------------------------------------------------------------------------------------------
PER 1000 129 132 120 102 81 74 68 64 50 45 38 29 68 0 1000 XXX XXX
DISTRIBUTION
------------------------------------------------------------------------------------------------------------------------------------
EST.PERS.(00) 386918 397951 361467 308300 243079 222788 204987 192521 148967 135466 113802 88177 203811 2023008436 XXX XXX
------------------------------------------------------------------------------------------------------------------------------------
SAMPLE PERSON 22815 23401 21963 19315 15373 13835 12392 11511 9093 8397 7089 5462 12808 10 183464 XXX XXX
------------------------------------------------------------------------------------------------------------------------------------
#: THE DIFFERENCE OF ENTRY IN COL.3..17 FROM 1000 UNDER STATUS 11-99/ COL.17 UNDER PER 1000 DISTRIBUTION FROM 1000 (ROUNDING OFF ERROR)
IS ADJUSTED WITH THE ROW/ COLUMN HAVING MAXIMUM ENTRY MAKING RESPECTIVE ROW-SUM/ COL-SUM EQUALS TO 1000

47
NATIONAL SAMPLE SURVEY, 50TH ROUND : JULY 1993--JUNE 1994
TABLE (1A): PER 1000 DISTRIBUTION OF PERSONS BY PRINCIPAL USUAL ACTIVITY CATEGORY FOR EACH AGE-GROUP.
RURAL
ALL-INDIA FEMALE
NO. OF SAMPLE VILLAGES: 6983
------------------------------------------------------------------------------------------------------------------------------------
USUAL ACTIVITY AGE-GROUP IN YEARS
---------------- --------------------------------------------------------------------------------------------------- ESTD. SAMPLE
STATUS INDUSTRY 0- 5- 10- 15- 20- 25- 30- 35- 40- 45- 50- 55- 60 & NOT ALL PERSONS PERSONS
4 9 14 19 24 29 34 39 44 49 54 59 ABOVE RECD. GROUPS (00)
------------------------------------------------------------------------------------------------------------------------------------
(1) (2) (3) (4) (5) (6) (7) (8) (9) (10) (11) (12) (13) (14) (15) (16) (17) (18) (19)
------------------------------------------------------------------------------------------------------------------------------------
11,12,21 0 - 8 49 105 124 131 159 179 199 209 198 166 87 - 100 283353 19193
1-5 - 1 7 16 17 16 18 19 15 12 13 14 8 - 11 30144 1483
6-9 - 0 3 7 9 11 16 20 16 17 15 17 11 - 9 24592 1380
---------------------------------------------------------------------------------------------------------------------------
0-9 - 9 59 128 150 158 193 218 230 238 226 197 106 - 120 338089 22056
------------------------------------------------------------------------------------------------------------------------------------
31 0 - - 0 1 1 2 3 5 3 3 2 0 0 - 1 4028 229
1-5 - 0 1 3 5 4 4 2 3 4 2 1 0 - 2 5635 263
6-9 - 0 1 3 8 10 11 12 10 10 7 5 2 - 5 14364 1267
---------------------------------------------------------------------------------------------------------------------------
0-9 - 0 2 7 14 16 18 19 16 17 11 6 2 - 8 24027 1759
------------------------------------------------------------------------------------------------------------------------------------
41&51 0 - 2 35 111 139 162 178 183 179 166 160 128 61 - 96 273160 11814
1-5 - 1 6 16 13 14 16 13 13 13 8 5 2 - 8 23648 1077
6-9 0 - 1 2 2 3 2 3 4 4 3 2 2 - 2 5068 371
---------------------------------------------------------------------------------------------------------------------------
0-9 0 3 42 129 154 179 196 199 196 183 171 135 65 - 106 301876 13262
------------------------------------------------------------------------------------------------------------------------------------
11-51 0 - 10 84 217 264 295 340 367 381 378 360 294 148 - 197 560541 31236
1-5 - 2 14 35 35 34 38 34 31 29 23 20 10 - 21 59427 2823
6-9 0 0 5 12 19 24 29 35 30 31 25 24 15 - 16 44024 3018
---------------------------------------------------------------------------------------------------------------------------
0-9 0 12 103 264 318 353 407 436 442 438 408 338 173 - 234 663992 37077
------------------------------------------------------------------------------------------------------------------------------------
81 X - 0 1 9 15 7 3 2 0 1 1 - 0 - 3 9399 736
------------------------------------------------------------------------------------------------------------------------------------
11-81 X 0 12 104 273 333 360 410 438 442 439 409 338 173 - 237 673391 37813
------------------------------------------------------------------------------------------------------------------------------------
91-99 X 1000 988 896 727 667 640 590 562 558 561 591 662 827 1000 7632166899 135074
------------------------------------------------------------------------------------------------------------------------------------
11-99 X# 1000 1000 999 1001 998 999 1000 999 1001 1001 1000 1001 1001 1000 10002840290 172887
------------------------------------------------------------------------------------------------------------------------------------
PERS.DST/000# 127 126 107 90 91 85 74 62 52 48 37 32 69 0 1001 XXX XXX
------------------------------------------------------------------------------------------------------------------------------------
EST.PERS.(00) 364352 357306 303802 254779 258493 242117 208804 175803 147177 135085 106209 90159 196066 1382840290 XXX XXX
------------------------------------------------------------------------------------------------------------------------------------
SAMPLE PERSON 21328 21113 18675 16472 16170 14716 12427 10746 9016 8330 6534 5401 11952 7 172887 XXX XXX
------------------------------------------------------------------------------------------------------------------------------------
#: THE DIFFERENCE OF ENTRY IN COL.3..17 FROM 1000 UNDER STATUS 11-99/ COL.17 UNDER PER 1000 DISTRIBUTION FROM 1000 (ROUNDING OFF ERROR)
IS ADJUSTED WITH THE ROW/ COLUMN HAVING MAXIMUM ENTRY MAKING RESPECTIVE ROW-SUM/ COL-SUM EQUALS TO 1000

48
NATIONAL SAMPLE SURVEY, 50TH ROUND : JULY 1993--JUNE 1994
TABLE (1A): PER 1000 DISTRIBUTION OF PERSONS BY PRINCIPAL USUAL ACTIVITY CATEGORY FOR EACH AGE-GROUP.
RURAL
ALL-INDIA PERSONS
NO. OF SAMPLE VILLAGES: 6983
------------------------------------------------------------------------------------------------------------------------------------
USUAL ACTIVITY AGE-GROUP IN YEARS
---------------- --------------------------------------------------------------------------------------------------- ESTD. SAMPLE
STATUS INDUSTRY 0- 5- 10- 15- 20- 25- 30- 35- 40- 45- 50- 55- 60 & NOT ALL PERSONS PERSONS
4 9 14 19 24 29 34 39 44 49 54 59 ABOVE RECD. GROUPS (00)
------------------------------------------------------------------------------------------------------------------------------------
(1) (2) (3) (4) (5) (6) (7) (8) (9) (10) (11) (12) (13) (14) (15) (16) (17) (18) (19)
------------------------------------------------------------------------------------------------------------------------------------
11,12,21 0 - 7 53 174 236 242 258 282 308 319 342 327 270 - 171 998132 67203
1-5 - 1 6 17 24 29 29 35 28 29 24 26 20 - 17 97660 5244
6-9 - 0 4 23 41 50 56 57 50 46 47 42 30 - 28 160944 9965
---------------------------------------------------------------------------------------------------------------------------
0-9 - 8 63 214 301 321 343 374 386 394 413 395 320 - 2161256736 82412
------------------------------------------------------------------------------------------------------------------------------------
31 0 - 0 3 5 6 6 9 9 8 8 6 5 3 - 4 26103 1614
1-5 - 0 1 5 13 13 17 15 13 14 9 6 1 - 7 40016 2192
6-9 - 0 2 7 19 29 38 40 43 43 41 29 4 - 17 99229 8139
---------------------------------------------------------------------------------------------------------------------------
0-9 - 0 6 17 38 48 64 64 64 65 56 40 8 - 28 165348 11945
------------------------------------------------------------------------------------------------------------------------------------
41&51 0 - 2 32 139 180 222 236 245 229 218 204 180 95 - 124 724042 32799
1-5 - 1 7 28 34 35 36 32 27 25 17 14 6 - 18 104376 5148
6-9 0 0 1 7 10 13 11 10 8 8 6 6 3 - 5 32102 2178
---------------------------------------------------------------------------------------------------------------------------
0-9 0 3 40 174 224 270 283 287 264 251 227 200 104 - 147 860520 40125
------------------------------------------------------------------------------------------------------------------------------------
11-51 0 - 9 88 318 422 470 503 536 545 545 552 512 368 - 2991748277 101616
1-5 - 2 14 50 71 77 82 82 68 68 50 46 27 - 42 242052 12584
6-9 0 0 7 37 70 92 105 107 101 97 94 77 37 - 50 292275 20282
---------------------------------------------------------------------------------------------------------------------------
0-9 0 11 109 405 563 639 690 725 714 710 696 635 432 - 3912282604 134482
------------------------------------------------------------------------------------------------------------------------------------
81 X - 0 1 18 36 18 5 2 1 1 0 0 0 - 7 41773 2991
------------------------------------------------------------------------------------------------------------------------------------
11-81 X 0 11 110 423 599 657 695 727 715 711 696 635 432 - 3982324377 137473
------------------------------------------------------------------------------------------------------------------------------------
91-99 X 1000 989 890 577 401 343 305 273 285 289 304 365 568 1000 6023524349 218878
------------------------------------------------------------------------------------------------------------------------------------
11-99 X# 999 1000 1000 1000 1000 999 1002 998 999 1000 1000 999 999 1000 10015848726 356351
------------------------------------------------------------------------------------------------------------------------------------
PERS.DST/000# 128 130 114 96 86 79 71 63 51 46 38 30 68 0 999 XXX XXX
------------------------------------------------------------------------------------------------------------------------------------
EST.PERS.(00) 751269 755258 665269 563079 501573 464905 413791 368324 296143 270550 220011 178336 399877 3415848726 XXX XXX
------------------------------------------------------------------------------------------------------------------------------------
SAMPLE PERSON 44143 44514 40638 35787 31543 28551 24819 22257 18109 16727 13623 10863 24760 17 356351 XXX XXX
------------------------------------------------------------------------------------------------------------------------------------
#: THE DIFFERENCE OF ENTRY IN COL.3..17 FROM 1000 UNDER STATUS 11-99/ COL.17 UNDER PER 1000 DISTRIBUTION FROM 1000 (ROUNDING OFF ERROR)
IS ADJUSTED WITH THE ROW/ COLUMN HAVING MAXIMUM ENTRY MAKING RESPECTIVE ROW-SUM/ COL-SUM EQUALS TO 1000

49
NATIONAL SAMPLE SURVEY, 50TH ROUND : JULY 1993--JUNE 1994
TABLE (1A): PER 1000 DISTRIBUTION OF PERSONS BY PRINCIPAL USUAL ACTIVITY CATEGORY FOR EACH AGE-GROUP.
URBAN
ALL-INDIA MALE
NO. OF SAMPLE BLOCKS: 4670
------------------------------------------------------------------------------------------------------------------------------------
USUAL ACTIVITY AGE-GROUP IN YEARS
---------------- --------------------------------------------------------------------------------------------------- ESTD. SAMPLE
STATUS INDUSTRY 0- 5- 10- 15- 20- 25- 30- 35- 40- 45- 50- 55- 60 & NOT ALL PERSONS PERSONS
4 9 14 19 24 29 34 39 44 49 54 59 ABOVE RECD. GROUPS (00)
------------------------------------------------------------------------------------------------------------------------------------
(1) (2) (3) (4) (5) (6) (7) (8) (9) (10) (11) (12) (13) (14) (15) (16) (17) (18) (19)
------------------------------------------------------------------------------------------------------------------------------------
11,12,21 0 - 0 6 20 32 33 32 35 34 45 52 79 76 - 26 26600 3506
1-5 - 0 7 34 69 82 88 81 84 80 84 72 61 - 48 48663 5044
6-9 - 1 12 78 194 240 271 248 238 233 221 222 177 - 137 138976 15613
---------------------------------------------------------------------------------------------------------------------------
0-9 - 1 25 132 295 355 391 364 356 358 357 373 314 - 211 214239 24163
------------------------------------------------------------------------------------------------------------------------------------
31 0 - - 0 2 1 4 3 4 5 5 4 5 3 - 2 2175 231
1-5 - 0 5 41 92 149 161 169 177 168 156 133 20 - 80 81271 7697
6-9 - 1 12 54 123 218 280 306 327 330 315 244 38 - 137 138746 15915
---------------------------------------------------------------------------------------------------------------------------
0-9 - 1 17 97 216 371 444 479 509 503 475 382 61 - 219 222192 23843
------------------------------------------------------------------------------------------------------------------------------------
41&51 0 - 0 2 17 17 30 27 24 29 24 34 30 21 - 16 16493 1596
1-5 - 0 7 59 79 83 66 72 57 54 47 44 20 - 42 42811 3926
6-9 - 0 8 33 48 53 34 43 30 32 27 16 14 - 25 25213 2599
---------------------------------------------------------------------------------------------------------------------------
0-9 - 0 17 109 144 166 127 139 116 110 108 90 55 - 83 84517 8121
------------------------------------------------------------------------------------------------------------------------------------
11-51 0 - 0 8 39 50 67 62 63 68 74 90 114 100 - 44 45268 5333
1-5 - 0 19 134 240 314 315 322 318 302 287 249 101 - 170 172745 16667
6-9 - 2 32 165 365 511 585 597 595 595 563 482 229 - 299 302935 34127
---------------------------------------------------------------------------------------------------------------------------
0-9 - 2 59 338 655 892 962 982 981 971 940 845 430 - 513 520948 56127
------------------------------------------------------------------------------------------------------------------------------------
81 X - 0 3 52 106 64 21 6 3 4 4 2 1 - 24 24795 2689
------------------------------------------------------------------------------------------------------------------------------------
11-81 X - 2 62 390 761 956 983 988 984 975 944 847 431 - 537 545743 58816
------------------------------------------------------------------------------------------------------------------------------------
91-99 X 1000 998 938 610 239 44 17 12 16 25 56 153 569 1000 463 468893 50251
------------------------------------------------------------------------------------------------------------------------------------
11-99 X# 1000 999 1000 1002 1002 1001 999 1000 999 999 1002 999 1000 1000 9991014636 109067
------------------------------------------------------------------------------------------------------------------------------------
PER 1000 105 112 115 112 96 84 77 70 60 50 36 28 55 0 1000 XXX XXX
DISTRIBUTION
------------------------------------------------------------------------------------------------------------------------------------
EST.PERS.(00) 106632 113997 116603 113698 97073 85516 77996 70961 60733 51022 36359 28080 55843 1231014636 XXX XXX
------------------------------------------------------------------------------------------------------------------------------------
SAMPLE PERSON 10988 11882 12487 12042 10476 9169 8300 7731 6640 5652 4220 3192 6277 11 109067 XXX XXX
------------------------------------------------------------------------------------------------------------------------------------
#: THE DIFFERENCE OF ENTRY IN COL.3..17 FROM 1000 UNDER STATUS 11-99/ COL.17 UNDER PER 1000 DISTRIBUTION FROM 1000 (ROUNDING OFF ERROR)
IS ADJUSTED WITH THE ROW/ COLUMN HAVING MAXIMUM ENTRY MAKING RESPECTIVE ROW-SUM/ COL-SUM EQUALS TO 1000

50
NATIONAL SAMPLE SURVEY, 50TH ROUND : JULY 1993--JUNE 1994
TABLE (1A): PER 1000 DISTRIBUTION OF PERSONS BY PRINCIPAL USUAL ACTIVITY CATEGORY FOR EACH AGE-GROUP.
URBAN
ALL-INDIA FEMALE
NO. OF SAMPLE BLOCKS: 4670
------------------------------------------------------------------------------------------------------------------------------------
USUAL ACTIVITY AGE-GROUP IN YEARS
---------------- --------------------------------------------------------------------------------------------------- ESTD. SAMPLE
STATUS INDUSTRY 0- 5- 10- 15- 20- 25- 30- 35- 40- 45- 50- 55- 60 & NOT ALL PERSONS PERSONS
4 9 14 19 24 29 34 39 44 49 54 59 ABOVE RECD. GROUPS (00)
------------------------------------------------------------------------------------------------------------------------------------
(1) (2) (3) (4) (5) (6) (7) (8) (9) (10) (11) (12) (13) (14) (15) (16) (17) (18) (19)
------------------------------------------------------------------------------------------------------------------------------------
11,12,21 0 - 0 2 7 8 13 14 18 20 24 24 28 16 - 10 9359 1302
1-5 - 1 9 20 22 19 21 27 26 28 27 15 12 - 15 14044 1460
6-9 0 1 3 10 16 25 36 37 42 45 42 29 22 - 19 17275 2076
---------------------------------------------------------------------------------------------------------------------------
0-9 0 2 14 37 46 57 71 82 88 97 93 72 50 - 44 40678 4838
------------------------------------------------------------------------------------------------------------------------------------
31 0 - - - 0 0 0 1 1 1 0 1 - 0 - 0 343 37
1-5 - 0 3 9 11 13 12 14 9 10 7 6 3 - 7 6433 657
6-9 - 0 7 14 42 57 70 76 89 78 79 60 14 - 36 33172 3995
---------------------------------------------------------------------------------------------------------------------------
0-9 - 0 10 23 53 70 83 91 99 88 87 66 17 - 43 39948 4689
------------------------------------------------------------------------------------------------------------------------------------
41&51 0 - 0 4 11 17 20 20 24 24 25 27 19 9 - 13 11839 1023
1-5 - 0 5 19 15 17 23 24 29 27 18 17 7 36 14 12471 1132
6-9 - 0 2 4 6 11 12 13 16 15 14 12 9 - 7 6446 687
---------------------------------------------------------------------------------------------------------------------------
0-9 - 0 11 34 38 48 55 61 69 67 59 48 25 36 34 30756 2842
------------------------------------------------------------------------------------------------------------------------------------
11-51 0 - 0 6 18 25 33 35 43 45 49 52 47 25 - 23 21541 2362
1-5 - 1 17 48 48 49 56 65 64 65 52 38 22 36 36 32948 3249
6-9 0 1 12 28 64 93 118 126 147 138 135 101 45 - 62 56893 6758
---------------------------------------------------------------------------------------------------------------------------
0-9 0 2 35 94 137 175 209 234 256 252 239 186 92 36 121 111382 12369
------------------------------------------------------------------------------------------------------------------------------------
81 X - - 1 19 52 26 12 4 2 1 1 1 0 - 11 9972 1157
------------------------------------------------------------------------------------------------------------------------------------
11-81 X 0 2 36 113 189 201 221 238 258 253 240 187 92 36 132 121354 13526
------------------------------------------------------------------------------------------------------------------------------------
91-99 X 1000 998 964 887 811 799 779 762 742 747 760 813 908 964 868 796947 85796
------------------------------------------------------------------------------------------------------------------------------------
11-99 X# 999 999 1001 1000 1002 1000 1002 1001 1000 999 1000 1001 1000 1000 1000 918301 99322
------------------------------------------------------------------------------------------------------------------------------------
PER 1000 106 111 114 103 98 90 78 73 54 45 35 29 64 0 1000 XXX XXX
DISTRIBUTION
------------------------------------------------------------------------------------------------------------------------------------
EST.PERS.(00) 96921 101683 104711 94811 90085 82249 71993 67182 49175 41740 31889 26475 59229 158 918301 XXX XXX
------------------------------------------------------------------------------------------------------------------------------------
SAMPLE PERSON 9908 10642 11047 10324 9649 8904 7789 7325 5589 4851 3701 2856 6722 15 99322 XXX XXX
------------------------------------------------------------------------------------------------------------------------------------
#: THE DIFFERENCE OF ENTRY IN COL.3..17 FROM 1000 UNDER STATUS 11-99/ COL.17 UNDER PER 1000 DISTRIBUTION FROM 1000 (ROUNDING OFF ERROR)
IS ADJUSTED WITH THE ROW/ COLUMN HAVING MAXIMUM ENTRY MAKING RESPECTIVE ROW-SUM/ COL-SUM EQUALS TO 1000

51
NATIONAL SAMPLE SURVEY, 50TH ROUND : JULY 1993--JUNE 1994
TABLE (1A): PER 1000 DISTRIBUTION OF PERSONS BY PRINCIPAL USUAL ACTIVITY CATEGORY FOR EACH AGE-GROUP.
URBAN
ALL-INDIA PERSONS
NO. OF SAMPLE BLOCKS: 4670
------------------------------------------------------------------------------------------------------------------------------------
USUAL ACTIVITY AGE-GROUP IN YEARS
---------------- --------------------------------------------------------------------------------------------------- ESTD. SAMPLE
STATUS INDUSTRY 0- 5- 10- 15- 20- 25- 30- 35- 40- 45- 50- 55- 60 & NOT ALL PERSONS PERSONS
4 9 14 19 24 29 34 39 44 49 54 59 ABOVE RECD. GROUPS (00)
------------------------------------------------------------------------------------------------------------------------------------
(1) (2) (3) (4) (5) (6) (7) (8) (9) (10) (11) (12) (13) (14) (15) (16) (17) (18) (19)
------------------------------------------------------------------------------------------------------------------------------------
11,12,21 0 - 0 4 14 20 23 23 26 28 36 39 55 45 - 19 35959 4808
1-5 - 0 7 27 46 51 56 55 58 57 57 45 36 - 32 62706 6504
6-9 0 1 8 47 108 135 158 145 150 148 137 128 97 - 81 156251 17689
---------------------------------------------------------------------------------------------------------------------------
0-9 0 1 19 88 174 209 237 226 236 241 233 228 178 - 132 254916 29001
------------------------------------------------------------------------------------------------------------------------------------
31 0 - - 0 1 0 2 2 3 3 3 3 2 1 - 1 2518 268
1-5 - 0 4 27 53 82 89 94 102 97 87 71 11 - 45 87704 8354
6-9 - 0 10 36 84 139 179 194 220 216 205 154 25 - 89 171918 19910
---------------------------------------------------------------------------------------------------------------------------
0-9 - 0 14 64 137 223 270 291 325 316 295 227 37 - 135 262140 28532
------------------------------------------------------------------------------------------------------------------------------------
41&51 0 - 0 3 14 17 25 24 24 27 24 31 25 15 - 15 28332 2619
1-5 - 0 6 41 48 51 45 48 45 42 33 31 13 20 29 55282 5058
6-9 - 0 5 20 28 32 23 28 24 25 21 14 11 - 16 31659 3286
---------------------------------------------------------------------------------------------------------------------------
0-9 - 0 14 75 93 108 92 100 96 91 85 70 39 20 60 115273 10963
------------------------------------------------------------------------------------------------------------------------------------
11-51 0 - 0 7 29 37 50 49 53 58 63 73 82 61 - 35 66809 7695
1-5 - 0 17 95 147 184 190 197 205 196 177 147 60 20 106 205692 19916
6-9 0 1 23 103 220 306 360 367 394 389 363 296 133 - 186 359828 40885
---------------------------------------------------------------------------------------------------------------------------
0-9 0 1 47 227 404 540 599 617 657 648 613 525 254 20 327 632329 68496
------------------------------------------------------------------------------------------------------------------------------------
81 X - 0 2 37 80 46 17 5 3 3 2 1 1 - 18 34767 3846
------------------------------------------------------------------------------------------------------------------------------------
11-81 X 0 1 49 264 484 586 616 622 660 651 615 526 255 20 345 667096 72342
------------------------------------------------------------------------------------------------------------------------------------
91-99 X 1000 999 951 736 516 414 384 378 340 349 385 474 745 980 6551265841 136047
------------------------------------------------------------------------------------------------------------------------------------
11-99 X# 1000 998 1000 1001 999 999 999 999 1001 1000 998 1000 999 1000 10001932937 208389
------------------------------------------------------------------------------------------------------------------------------------
PER 1000 105 112 114 108 97 87 78 71 57 48 35 28 60 0 1000 XXX XXX
DISTRIBUTION
------------------------------------------------------------------------------------------------------------------------------------
EST.PERS.(00) 203553 215680 221314 208510 187158 167765 149989 138143 109907 92763 68248 54555 115072 2801932937 XXX XXX
------------------------------------------------------------------------------------------------------------------------------------
SAMPLE PERSON 20896 22524 23534 22366 20125 18073 16089 15056 12229 10503 7921 6048 12999 26 208389 XXX XXX
------------------------------------------------------------------------------------------------------------------------------------
#: THE DIFFERENCE OF ENTRY IN COL.3..17 FROM 1000 UNDER STATUS 11-99/ COL.17 UNDER PER 1000 DISTRIBUTION FROM 1000 (ROUNDING OFF ERROR)
IS ADJUSTED WITH THE ROW/ COLUMN HAVING MAXIMUM ENTRY MAKING RESPECTIVE ROW-SUM/ COL-SUM EQUALS TO 1000

52
NATIONAL SAMPLE SURVEY, 50TH ROUND : JULY 1993--JUNE 1994
TABLE (1B): PER 1000 DISTRIBUTION OF PERSONS BY USUAL ACTIVITY CATEGORY TAKING ALSO INTO CONSIDERATION THE SUBSIDIARY
GAINFUL STATUS OF PERSONS CATEGORISED NOT WORKING IN PRINCIPAL STATUS FOR EACH AGE-GROUP.
RURAL
ALL-INDIA MALE
NO. OF SAMPLE VILLAGES: 6983
------------------------------------------------------------------------------------------------------------------------------------
USUAL ACTIVITY AGE-GROUP IN YEARS
---------------- --------------------------------------------------------------------------------------------------- ESTD. SAMPLE
STATUS INDUSTRY 0- 5- 10- 15- 20- 25- 30- 35- 40- 45- 50- 55- 60 & NOT ALL PERSONS PERSONS
4 9 14 19 24 29 34 39 44 49 54 59 ABOVE RECD. GROUPS (00)
------------------------------------------------------------------------------------------------------------------------------------
(1) (2) (3) (4) (5) (6) (7) (8) (9) (10) (11) (12) (13) (14) (15) (16) (17) (18) (19)
------------------------------------------------------------------------------------------------------------------------------------
11,12,21 0 0 7 78 274 377 368 365 375 417 431 477 495 461 - 251 748864 50540
1-5 - 0 5 19 32 43 40 50 41 45 35 38 31 - 23 69004 3842
6-9 - 1 7 39 78 93 96 92 84 74 76 68 50 - 46 139489 8790
---------------------------------------------------------------------------------------------------------------------------
0-9 0 8 90 332 487 504 501 517 542 550 588 601 542 - 320 957357 63172
------------------------------------------------------------------------------------------------------------------------------------
31 0 - 0 6 8 12 11 14 12 13 13 10 10 5 - 7 22075 1385
1-5 - - 1 7 23 22 31 26 24 25 17 11 2 - 11 34492 1936
6-9 - 0 2 11 33 49 66 66 76 76 73 54 7 - 28 85495 6896
---------------------------------------------------------------------------------------------------------------------------
0-9 - 0 9 26 68 82 111 104 113 114 100 75 14 - 46 142062 10217
------------------------------------------------------------------------------------------------------------------------------------
41&51 0 - 2 30 168 226 288 295 302 280 271 247 233 129 - 151 454234 21140
1-5 - 1 7 40 58 59 56 50 41 37 25 23 10 - 27 81391 4105
6-9 0 0 2 12 19 24 19 17 12 12 10 9 4 - 9 27622 1845
---------------------------------------------------------------------------------------------------------------------------
0-9 0 3 39 220 303 371 370 369 333 320 282 265 143 - 187 563247 27090
------------------------------------------------------------------------------------------------------------------------------------
11-51 0 0 9 114 450 615 667 674 689 710 715 734 738 595 - 4091225173 73065
1-5 - 1 13 66 113 124 127 126 106 107 77 72 43 - 61 184887 9883
6-9 0 1 11 62 130 166 181 175 172 162 159 131 61 - 83 252606 17531
---------------------------------------------------------------------------------------------------------------------------
0-9 0 11 138 578 858 957 982 990 988 984 970 941 699 - 5531662666 100479
------------------------------------------------------------------------------------------------------------------------------------
81 X - 0 1 20 44 23 6 2 1 0 0 - - - 8 24154 1664
------------------------------------------------------------------------------------------------------------------------------------
11-81 X 0 11 139 598 902 980 988 992 989 984 970 941 699 - 5611686820 102143
------------------------------------------------------------------------------------------------------------------------------------
91-99 X 1000 989 861 402 98 20 12 8 11 16 30 59 301 1000 4391321616 81321
------------------------------------------------------------------------------------------------------------------------------------
11-99 X# 1000 999 1000 999 1003 1001 1000 999 999 998 1001 1000 1000 1000 9983008436 183464
------------------------------------------------------------------------------------------------------------------------------------
PER 1000 129 132 120 102 81 74 68 64 50 45 38 29 68 0 1000 XXX XXX
DISTRIBUTION
------------------------------------------------------------------------------------------------------------------------------------
EST.PERS.(00) 386918 397951 361467 308300 243079 222788 204987 192521 148967 135466 113802 88177 203811 2023008436 XXX XXX
------------------------------------------------------------------------------------------------------------------------------------
SAMPLE PERSON 22815 23401 21963 19315 15373 13835 12392 11511 9093 8397 7089 5462 12808 10 183464 XXX XXX
------------------------------------------------------------------------------------------------------------------------------------
#: THE DIFFERENCE OF ENTRY IN COL.3..17 FROM 1000 UNDER STATUS 11-99/ COL.17 UNDER PER 1000 DISTRIBUTION FROM 1000 (ROUNDING OFF ERROR)
IS ADJUSTED WITH THE ROW/ COLUMN HAVING MAXIMUM ENTRY MAKING RESPECTIVE ROW-SUM/ COL-SUM EQUALS TO 1000

53
NATIONAL SAMPLE SURVEY, 50TH ROUND : JULY 1993--JUNE 1994
TABLE (1B): PER 1000 DISTRIBUTION OF PERSONS BY USUAL ACTIVITY CATEGORY TAKING ALSO INTO CONSIDERATION THE SUBSIDIARY
GAINFUL STATUS OF PERSONS CATEGORISED NOT WORKING IN PRINCIPAL STATUS FOR EACH AGE-GROUP.
RURAL
ALL-INDIA FEMALE
NO. OF SAMPLE VILLAGES: 6983
------------------------------------------------------------------------------------------------------------------------------------
USUAL ACTIVITY AGE-GROUP IN YEARS
---------------- --------------------------------------------------------------------------------------------------- ESTD. SAMPLE
STATUS INDUSTRY 0- 5- 10- 15- 20- 25- 30- 35- 40- 45- 50- 55- 60 & NOT ALL PERSONS PERSONS
4 9 14 19 24 29 34 39 44 49 54 59 ABOVE RECD. GROUPS (00)
------------------------------------------------------------------------------------------------------------------------------------
(1) (2) (3) (4) (5) (6) (7) (8) (9) (10) (11) (12) (13) (14) (15) (16) (17) (18) (19)
------------------------------------------------------------------------------------------------------------------------------------
11,12,21 0 0 10 76 173 213 241 276 301 322 325 301 262 139 169 164 468430 31438
1-5 - 1 10 22 26 26 29 27 21 19 18 22 11 - 16 44325 2262
6-9 - 0 4 11 14 18 24 27 20 22 17 19 13 - 12 33572 1891
---------------------------------------------------------------------------------------------------------------------------
0-9 0 11 90 206 253 285 329 355 363 366 336 303 163 169 192 546327 35591
------------------------------------------------------------------------------------------------------------------------------------
31 0 - - 1 1 1 2 4 5 3 3 2 0 0 - 2 4334 242
1-5 - 0 1 3 5 4 4 2 3 4 2 1 0 - 2 5792 270
6-9 - 0 1 3 9 10 11 12 10 10 7 5 2 - 5 14839 1292
---------------------------------------------------------------------------------------------------------------------------
0-9 - 0 3 7 15 16 19 19 16 17 11 6 2 - 9 24965 1804
------------------------------------------------------------------------------------------------------------------------------------
41&51 0 0 2 41 131 170 203 216 216 208 193 183 149 70 - 115 326263 14201
1-5 - 1 7 17 16 16 18 15 15 13 9 7 3 - 10 27065 1236
6-9 0 0 1 3 3 3 3 4 5 5 4 3 3 - 2 6693 450
---------------------------------------------------------------------------------------------------------------------------
0-9 0 3 49 151 189 222 237 235 228 211 196 159 76 - 127 360021 15887
------------------------------------------------------------------------------------------------------------------------------------
11-51 0 0 12 118 305 384 446 496 522 533 521 486 411 209 169 281 799027 45881
1-5 - 2 18 42 47 46 51 44 39 36 29 30 14 - 28 77182 3768
6-9 0 0 6 17 26 31 38 43 35 37 28 27 18 - 19 55104 3633
---------------------------------------------------------------------------------------------------------------------------
0-9 0 14 142 364 457 523 585 609 607 594 543 468 241 169 328 931313 53282
------------------------------------------------------------------------------------------------------------------------------------
81 X - 0 0 7 13 5 2 1 0 0 - - - - 3 7386 610
------------------------------------------------------------------------------------------------------------------------------------
11-81 X 0 14 142 371 470 528 587 610 607 594 543 468 241 169 331 938699 53892
------------------------------------------------------------------------------------------------------------------------------------
91-99 X 1000 986 858 629 530 472 413 390 393 406 457 532 759 831 6691901591 118995
------------------------------------------------------------------------------------------------------------------------------------
11-99 X# 999 1000 1002 1000 1001 998 1001 998 999 1000 1000 1000 999 1000 10012840290 172887
------------------------------------------------------------------------------------------------------------------------------------
PER 1000 127 126 107 90 91 85 74 62 52 48 37 32 69 0 1001 XXX XXX
DISTRIBUTION
------------------------------------------------------------------------------------------------------------------------------------
EST.PERS.(00) 364352 357306 303802 254779 258493 242117 208804 175803 147177 135085 106209 90159 196066 1382840290 XXX XXX
------------------------------------------------------------------------------------------------------------------------------------
SAMPLE PERSON 21328 21113 18675 16472 16170 14716 12427 10746 9016 8330 6534 5401 11952 7 172887 XXX XXX
------------------------------------------------------------------------------------------------------------------------------------
#: THE DIFFERENCE OF ENTRY IN COL.3..17 FROM 1000 UNDER STATUS 11-99/ COL.17 UNDER PER 1000 DISTRIBUTION FROM 1000 (ROUNDING OFF ERROR)
IS ADJUSTED WITH THE ROW/ COLUMN HAVING MAXIMUM ENTRY MAKING RESPECTIVE ROW-SUM/ COL-SUM EQUALS TO 1000

54
NATIONAL SAMPLE SURVEY, 50TH ROUND : JULY 1993--JUNE 1994
TABLE (1B): PER 1000 DISTRIBUTION OF PERSONS BY USUAL ACTIVITY CATEGORY TAKING ALSO INTO CONSIDERATION THE SUBSIDIARY
GAINFUL STATUS OF PERSONS CATEGORISED NOT WORKING IN PRINCIPAL STATUS FOR EACH AGE-GROUP.
RURAL
ALL-INDIA PERSONS
NO. OF SAMPLE VILLAGES: 6983
------------------------------------------------------------------------------------------------------------------------------------
USUAL ACTIVITY AGE-GROUP IN YEARS
---------------- --------------------------------------------------------------------------------------------------- ESTD. SAMPLE
STATUS INDUSTRY 0- 5- 10- 15- 20- 25- 30- 35- 40- 45- 50- 55- 60 & NOT ALL PERSONS PERSONS
4 9 14 19 24 29 34 39 44 49 54 59 ABOVE RECD. GROUPS (00)
------------------------------------------------------------------------------------------------------------------------------------
(1) (2) (3) (4) (5) (6) (7) (8) (9) (10) (11) (12) (13) (14) (15) (16) (17) (18) (19)
------------------------------------------------------------------------------------------------------------------------------------
11,12,21 0 0 8 77 228 295 301 321 339 369 379 393 378 303 69 2081217290 81978
1-5 - 1 7 21 29 34 34 39 31 32 27 30 21 - 19 113330 6104
6-9 - 1 6 26 45 54 60 61 52 48 48 43 32 - 30 173061 10681
---------------------------------------------------------------------------------------------------------------------------
0-9 0 10 90 275 369 389 415 439 452 459 468 451 356 69 2571503681 98763
------------------------------------------------------------------------------------------------------------------------------------
31 0 - 0 3 5 6 6 9 9 8 8 6 5 3 - 5 26409 1627
1-5 - 0 1 5 13 13 17 15 14 14 9 6 1 - 7 40284 2206
6-9 - 0 2 7 20 29 38 40 43 43 41 29 4 - 17 100335 8188
---------------------------------------------------------------------------------------------------------------------------
0-9 - 0 6 17 39 48 64 64 65 65 56 40 8 - 29 167028 12021
------------------------------------------------------------------------------------------------------------------------------------
41&51 0 0 2 35 151 197 244 255 261 244 232 216 190 100 - 133 780497 35341
1-5 - 1 7 29 36 37 37 33 28 25 17 15 7 - 19 108456 5341
6-9 0 0 2 8 11 13 11 11 9 8 7 6 3 - 6 34315 2295
---------------------------------------------------------------------------------------------------------------------------
0-9 0 3 44 188 244 294 303 305 281 265 240 211 110 - 158 923268 42977
------------------------------------------------------------------------------------------------------------------------------------
11-51 0 0 10 115 384 498 551 585 609 621 619 615 573 406 69 3462024196 118946
1-5 - 2 15 55 78 84 88 87 73 71 53 51 29 - 45 262070 13651
6-9 0 1 10 41 76 96 109 112 104 99 96 78 39 - 53 307711 21164
---------------------------------------------------------------------------------------------------------------------------
0-9 0 13 140 480 652 731 782 808 798 789 764 702 474 69 4442593977 153761
------------------------------------------------------------------------------------------------------------------------------------
81 X - 0 1 14 28 14 4 1 0 0 0 - - - 5 31540 2274
------------------------------------------------------------------------------------------------------------------------------------
11-81 X 0 13 141 494 680 745 786 809 798 789 764 702 474 69 4492625517 156035
------------------------------------------------------------------------------------------------------------------------------------
91-99 X 1000 987 859 506 320 255 214 191 202 211 236 298 526 931 5513223209 200316
------------------------------------------------------------------------------------------------------------------------------------
11-99 X# 999 1000 1000 999 999 1001 1000 999 999 998 999 999 999 1000 10005848726 356351
------------------------------------------------------------------------------------------------------------------------------------
PER 1000 128 130 114 96 86 79 71 63 51 46 38 30 68 0 999 XXX XXX
DISTRIBUTION
------------------------------------------------------------------------------------------------------------------------------------
EST.PERS.(00) 751269 755258 665269 563079 501573 464905 413791 368324 296143 270550 220011 178336 399877 3415848726 XXX XXX
------------------------------------------------------------------------------------------------------------------------------------
SAMPLE PERSON 44143 44514 40638 35787 31543 28551 24819 22257 18109 16727 13623 10863 24760 17 356351 XXX XXX
------------------------------------------------------------------------------------------------------------------------------------
#: THE DIFFERENCE OF ENTRY IN COL.3..17 FROM 1000 UNDER STATUS 11-99/ COL.17 UNDER PER 1000 DISTRIBUTION FROM 1000 (ROUNDING OFF ERROR)
IS ADJUSTED WITH THE ROW/ COLUMN HAVING MAXIMUM ENTRY MAKING RESPECTIVE ROW-SUM/ COL-SUM EQUALS TO 1000

55
NATIONAL SAMPLE SURVEY, 50TH ROUND : JULY 1993--JUNE 1994
TABLE (1B): PER 1000 DISTRIBUTION OF PERSONS BY USUAL ACTIVITY CATEGORY TAKING ALSO INTO CONSIDERATION THE SUBSIDIARY
GAINFUL STATUS OF PERSONS CATEGORISED NOT WORKING IN PRINCIPAL STATUS FOR EACH AGE-GROUP.
URBAN
ALL-INDIA MALE
NO. OF SAMPLE BLOCKS: 4670
------------------------------------------------------------------------------------------------------------------------------------
USUAL ACTIVITY AGE-GROUP IN YEARS
---------------- --------------------------------------------------------------------------------------------------- ESTD. SAMPLE
STATUS INDUSTRY 0- 5- 10- 15- 20- 25- 30- 35- 40- 45- 50- 55- 60 & NOT ALL PERSONS PERSONS
4 9 14 19 24 29 34 39 44 49 54 59 ABOVE RECD. GROUPS (00)
------------------------------------------------------------------------------------------------------------------------------------
(1) (2) (3) (4) (5) (6) (7) (8) (9) (10) (11) (12) (13) (14) (15) (16) (17) (18) (19)
------------------------------------------------------------------------------------------------------------------------------------
11,12,21 0 0 0 8 25 36 34 32 35 34 46 53 86 83 - 28 28534 3756
1-5 - 0 8 36 70 83 88 81 84 81 84 73 62 - 49 49393 5129
6-9 - 2 15 85 203 245 273 248 239 233 222 224 181 - 140 142078 15943
---------------------------------------------------------------------------------------------------------------------------
0-9 0 2 31 146 309 362 393 364 357 360 359 383 326 - 217 220005 24828
------------------------------------------------------------------------------------------------------------------------------------
31 0 - 0 1 2 1 4 3 4 5 5 4 5 3 - 2 2272 234
1-5 - 0 5 42 93 149 161 169 177 168 156 133 20 - 80 81440 7713
6-9 - 1 13 55 124 219 280 309 326 330 314 243 38 - 137 139164 15965
---------------------------------------------------------------------------------------------------------------------------
0-9 - 1 19 99 218 372 444 482 508 503 474 381 61 - 219 222876 23912
------------------------------------------------------------------------------------------------------------------------------------
41&51 0 - 0 2 17 18 30 27 24 29 24 34 30 21 - 16 16579 1607
1-5 - 1 8 60 81 84 66 72 57 54 47 45 20 - 43 43371 3994
6-9 - 0 8 34 49 55 34 43 30 32 27 16 14 - 25 25783 2655
---------------------------------------------------------------------------------------------------------------------------
0-9 - 1 18 111 148 169 127 139 116 110 108 91 55 - 84 85733 8256
------------------------------------------------------------------------------------------------------------------------------------
11-51 0 0 0 11 44 55 68 62 63 68 75 91 121 107 - 46 47385 5597
1-5 - 1 21 138 244 316 315 322 318 303 287 251 102 - 172 174204 16836
6-9 - 3 36 174 376 519 587 600 595 595 563 483 233 - 302 307025 34563
---------------------------------------------------------------------------------------------------------------------------
0-9 0 4 68 356 675 903 964 985 981 973 941 855 442 - 520 528614 56996
------------------------------------------------------------------------------------------------------------------------------------
81 X - 0 3 48 97 55 19 5 3 3 4 1 1 - 22 22294 2424
------------------------------------------------------------------------------------------------------------------------------------
11-81 X 0 4 71 404 772 958 983 990 984 976 945 856 443 - 542 550908 59420
------------------------------------------------------------------------------------------------------------------------------------
91-99 X 1000 996 929 596 228 42 17 10 16 24 55 144 557 1000 458 463728 49647
------------------------------------------------------------------------------------------------------------------------------------
11-99 X# 1000 999 1002 1000 1000 1001 1000 997 1000 999 1003 1001 999 1000 9991014636 109067
------------------------------------------------------------------------------------------------------------------------------------
PER 1000 105 112 115 112 96 84 77 70 60 50 36 28 55 0 1000 XXX XXX
DISTRIBUTION
------------------------------------------------------------------------------------------------------------------------------------
EST.PERS.(00) 106632 113997 116603 113698 97073 85516 77996 70961 60733 51022 36359 28080 55843 1231014636 XXX XXX
------------------------------------------------------------------------------------------------------------------------------------
SAMPLE PERSON 10988 11882 12487 12042 10476 9169 8300 7731 6640 5652 4220 3192 6277 11 109067 XXX XXX
------------------------------------------------------------------------------------------------------------------------------------
#: THE DIFFERENCE OF ENTRY IN COL.3..17 FROM 1000 UNDER STATUS 11-99/ COL.17 UNDER PER 1000 DISTRIBUTION FROM 1000 (ROUNDING OFF ERROR)
IS ADJUSTED WITH THE ROW/ COLUMN HAVING MAXIMUM ENTRY MAKING RESPECTIVE ROW-SUM/ COL-SUM EQUALS TO 1000

56
NATIONAL SAMPLE SURVEY, 50TH ROUND : JULY 1993--JUNE 1994
TABLE (1B): PER 1000 DISTRIBUTION OF PERSONS BY USUAL ACTIVITY CATEGORY TAKING ALSO INTO CONSIDERATION THE SUBSIDIARY
GAINFUL STATUS OF PERSONS CATEGORISED NOT WORKING IN PRINCIPAL STATUS FOR EACH AGE-GROUP.
URBAN
ALL-INDIA FEMALE
NO. OF SAMPLE BLOCKS: 4670
------------------------------------------------------------------------------------------------------------------------------------
USUAL ACTIVITY AGE-GROUP IN YEARS
---------------- --------------------------------------------------------------------------------------------------- ESTD. SAMPLE
STATUS INDUSTRY 0- 5- 10- 15- 20- 25- 30- 35- 40- 45- 50- 55- 60 & NOT ALL PERSONS PERSONS
4 9 14 19 24 29 34 39 44 49 54 59 ABOVE RECD. GROUPS (00)
------------------------------------------------------------------------------------------------------------------------------------
(1) (2) (3) (4) (5) (6) (7) (8) (9) (10) (11) (12) (13) (14) (15) (16) (17) (18) (19)
------------------------------------------------------------------------------------------------------------------------------------
11,12,21 0 - 1 5 14 21 27 33 42 43 53 47 51 29 - 22 20131 2519
1-5 - 1 12 30 29 25 33 40 38 37 33 20 15 - 22 19862 2062
6-9 0 1 4 15 27 38 52 50 55 58 50 32 25 - 26 23605 2707
---------------------------------------------------------------------------------------------------------------------------
0-9 0 3 21 59 77 90 118 132 136 148 130 103 69 - 70 63598 7288
------------------------------------------------------------------------------------------------------------------------------------
31 0 - - - 0 0 0 1 1 1 0 1 - 0 - 0 346 38
1-5 - 0 3 10 11 14 12 14 10 10 7 6 3 - 7 6666 684
6-9 - 1 9 14 45 59 72 78 90 80 80 60 14 - 37 34434 4097
---------------------------------------------------------------------------------------------------------------------------
0-9 - 1 12 24 56 73 85 93 101 90 88 66 17 - 44 41446 4819
------------------------------------------------------------------------------------------------------------------------------------
41&51 0 - 0 5 14 21 26 26 30 29 29 31 23 10 - 16 14564 1272
1-5 - 0 6 22 19 21 28 28 34 33 21 18 8 36 16 14756 1326
6-9 - 0 2 5 7 14 15 17 19 16 16 14 10 - 8 7740 805
---------------------------------------------------------------------------------------------------------------------------
0-9 - 0 13 41 47 61 69 75 82 78 68 55 28 36 40 37060 3403
------------------------------------------------------------------------------------------------------------------------------------
11-51 0 - 1 10 28 42 53 60 73 73 82 79 74 39 - 38 35041 3829
1-5 - 1 21 62 59 60 73 82 82 80 61 44 26 36 45 41284 4072
6-9 0 2 15 34 79 111 139 145 164 154 146 106 49 - 71 65779 7609
---------------------------------------------------------------------------------------------------------------------------
0-9 0 4 46 124 180 224 272 300 319 316 286 224 114 36 154 142104 15510
------------------------------------------------------------------------------------------------------------------------------------
81 X - - 1 18 50 24 11 4 1 1 1 1 0 - 10 9467 1097
------------------------------------------------------------------------------------------------------------------------------------
11-81 X 0 4 47 142 230 248 283 304 320 317 287 225 114 36 164 151571 16607
------------------------------------------------------------------------------------------------------------------------------------
91-99 X 1000 996 953 858 770 752 717 696 680 683 713 775 886 964 836 766730 82715
------------------------------------------------------------------------------------------------------------------------------------
11-99 X# 999 1000 1000 1001 1000 1001 1000 1000 999 999 1001 998 1001 1000 999 918301 99322
------------------------------------------------------------------------------------------------------------------------------------
PER 1000 106 111 114 103 98 90 78 73 54 45 35 29 64 0 1000 XXX XXX
DISTRIBUTION
------------------------------------------------------------------------------------------------------------------------------------
EST.PERS.(00) 96921 101683 104711 94811 90085 82249 71993 67182 49175 41740 31889 26475 59229 158 918301 XXX XXX
------------------------------------------------------------------------------------------------------------------------------------
SAMPLE PERSON 9908 10642 11047 10324 9649 8904 7789 7325 5589 4851 3701 2856 6722 15 99322 XXX XXX
------------------------------------------------------------------------------------------------------------------------------------
#: THE DIFFERENCE OF ENTRY IN COL.3..17 FROM 1000 UNDER STATUS 11-99/ COL.17 UNDER PER 1000 DISTRIBUTION FROM 1000 (ROUNDING OFF ERROR)
IS ADJUSTED WITH THE ROW/ COLUMN HAVING MAXIMUM ENTRY MAKING RESPECTIVE ROW-SUM/ COL-SUM EQUALS TO 1000

57
NATIONAL SAMPLE SURVEY, 50TH ROUND : JULY 1993--JUNE 1994
TABLE (1B): PER 1000 DISTRIBUTION OF PERSONS BY USUAL ACTIVITY CATEGORY TAKING ALSO INTO CONSIDERATION THE SUBSIDIARY
GAINFUL STATUS OF PERSONS CATEGORISED NOT WORKING IN PRINCIPAL STATUS FOR EACH AGE-GROUP.
URBAN
ALL-INDIA PERSONS
NO. OF SAMPLE BLOCKS: 4670
------------------------------------------------------------------------------------------------------------------------------------
USUAL ACTIVITY AGE-GROUP IN YEARS
---------------- --------------------------------------------------------------------------------------------------- ESTD. SAMPLE
STATUS INDUSTRY 0- 5- 10- 15- 20- 25- 30- 35- 40- 45- 50- 55- 60 & NOT ALL PERSONS PERSONS
4 9 14 19 24 29 34 39 44 49 54 59 ABOVE RECD. GROUPS (00)
------------------------------------------------------------------------------------------------------------------------------------
(1) (2) (3) (4) (5) (6) (7) (8) (9) (10) (11) (12) (13) (14) (15) (16) (17) (18) (19)
------------------------------------------------------------------------------------------------------------------------------------
11,12,21 0 0 1 6 20 29 31 33 38 38 49 50 69 55 - 25 48666 6275
1-5 - 1 10 33 50 55 62 61 64 61 60 47 38 - 36 69255 7191
6-9 0 1 9 53 118 144 167 152 157 154 142 131 101 - 86 165683 18650
---------------------------------------------------------------------------------------------------------------------------
0-9 0 3 25 106 197 230 262 251 259 264 252 247 194 - 147 283604 32116
------------------------------------------------------------------------------------------------------------------------------------
31 0 - 0 0 1 0 2 2 3 3 3 3 2 1 - 1 2618 272
1-5 - 0 4 27 54 82 89 94 102 97 87 71 11 - 46 88106 8397
6-9 - 1 11 36 86 141 180 195 221 217 206 155 26 - 90 173598 20062
---------------------------------------------------------------------------------------------------------------------------
0-9 - 1 15 64 140 225 271 292 326 317 296 228 38 - 137 264322 28731
------------------------------------------------------------------------------------------------------------------------------------
41&51 0 - 0 3 16 19 28 26 27 29 26 33 27 15 - 16 31143 2879
1-5 - 1 7 43 51 53 48 51 47 45 35 32 14 20 30 58127 5320
6-9 - 0 5 21 29 35 25 30 25 25 21 15 12 - 17 33523 3460
---------------------------------------------------------------------------------------------------------------------------
0-9 - 1 15 80 99 116 99 108 101 96 89 74 41 20 63 122793 11659
------------------------------------------------------------------------------------------------------------------------------------
11-51 0 0 1 9 37 48 61 61 68 70 78 86 98 71 - 42 82427 9426
1-5 - 2 21 103 155 190 199 206 213 203 182 150 63 20 112 215488 20908
6-9 0 2 25 110 233 320 372 377 403 396 369 301 139 - 193 372804 42172
---------------------------------------------------------------------------------------------------------------------------
0-9 0 5 55 250 436 571 632 651 686 677 637 549 273 20 347 670719 72506
------------------------------------------------------------------------------------------------------------------------------------
81 X - 0 2 34 74 40 15 5 2 2 2 1 1 - 16 31761 3521
------------------------------------------------------------------------------------------------------------------------------------
11-81 X 0 5 57 284 510 611 647 656 688 679 639 550 274 20 363 702480 76027
------------------------------------------------------------------------------------------------------------------------------------
91-99 X 1000 995 943 716 490 389 353 344 312 321 361 450 726 980 6371230457 132362
------------------------------------------------------------------------------------------------------------------------------------
11-99 X# 1000 1000 998 1000 999 1001 1000 1001 1000 999 1002 999 1001 1000 10001932937 208389
------------------------------------------------------------------------------------------------------------------------------------
PER 1000 105 112 114 108 97 87 78 71 57 48 35 28 60 0 1000 XXX XXX
DISTRIBUTION
------------------------------------------------------------------------------------------------------------------------------------
EST.PERS.(00) 203553 215680 221314 208510 187158 167765 149989 138143 109907 92763 68248 54555 115072 2801932937 XXX XXX
------------------------------------------------------------------------------------------------------------------------------------
SAMPLE PERSON 20896 22524 23534 22366 20125 18073 16089 15056 12229 10503 7921 6048 12999 26 208389 XXX XXX
------------------------------------------------------------------------------------------------------------------------------------
#: THE DIFFERENCE OF ENTRY IN COL.3..17 FROM 1000 UNDER STATUS 11-99/ COL.17 UNDER PER 1000 DISTRIBUTION FROM 1000 (ROUNDING OFF ERROR)
IS ADJUSTED WITH THE ROW/ COLUMN HAVING MAXIMUM ENTRY MAKING RESPECTIVE ROW-SUM/ COL-SUM EQUALS TO 1000

58
NATIONAL SAMPLE SURVEY, 50TH ROUND : JULY 1993--JUNE 1994
TABLE (1C): PER 1000 DISTRIBUTION OF PERSONS BY CURRENT WEEKLY ACTIVITY FOR EACH AGE-GROUP.
RURAL
ALL-INDIA MALE
NO. OF SAMPLE VILLAGES: 6983
------------------------------------------------------------------------------------------------------------------------------------
CUR. WEEKLY ACT. AGE-GROUP IN YEARS
---------------- --------------------------------------------------------------------------------------------------- ESTD. SAMPLE
STATUS INDUSTRY 0- 5- 10- 15- 20- 25- 30- 35- 40- 45- 50- 55- 60 & NOT ALL PERSONS PERSONS
4 9 14 19 24 29 34 39 44 49 54 59 ABOVE RECD. GROUPS (00)
------------------------------------------------------------------------------------------------------------------------------------
(1) (2) (3) (4) (5) (6) (7) (8) (9) (10) (11) (12) (13) (14) (15) (16) (17) (18) (19)
------------------------------------------------------------------------------------------------------------------------------------
11,12,21, 0 - 6 66 248 365 371 374 388 438 449 488 516 450 - 248 744767 49452
61&62 1-5 - 0 5 19 34 44 39 50 41 46 35 36 31 - 23 69412 3863
6-9 - 1 10 44 83 98 103 98 90 82 81 75 56 - 50 151152 9601
---------------------------------------------------------------------------------------------------------------------------
0-9 - 7 81 311 482 513 516 536 569 577 604 627 537 - 321 965331 62916
------------------------------------------------------------------------------------------------------------------------------------
31,71&72 0 - 1 5 10 12 11 15 13 14 14 12 11 6 - 8 23571 1484
1-5 - - 1 6 22 22 30 25 23 25 17 9 2 - 11 33581 1895
6-9 - 0 3 11 32 48 66 67 77 77 74 53 7 - 28 85691 6850
---------------------------------------------------------------------------------------------------------------------------
0-9 - 1 9 27 66 81 111 105 114 116 103 73 15 - 47 142843 10229
------------------------------------------------------------------------------------------------------------------------------------
41&51 0 - 2 23 139 190 243 249 249 226 218 196 179 99 - 124 372773 17582
1-5 - 1 7 43 59 61 60 54 43 38 26 23 10 - 28 85226 4245
6-9 - 0 2 15 21 24 20 18 13 12 9 8 5 - 10 29604 1879
---------------------------------------------------------------------------------------------------------------------------
0-9 - 3 32 197 270 328 329 321 282 268 231 210 114 - 162 487603 23706
------------------------------------------------------------------------------------------------------------------------------------
11-72 0 - 9 94 397 567 625 638 650 678 681 696 706 555 - 3801141111 68518
1-5 - 1 13 68 115 127 129 129 107 109 78 68 43 - 62 188219 10003
6-9 - 1 15 70 136 170 189 183 180 171 164 136 68 - 88 266447 18330
---------------------------------------------------------------------------------------------------------------------------
0-9 - 11 122 535 818 922 956 962 965 961 938 910 666 - 5301595777 96851
------------------------------------------------------------------------------------------------------------------------------------
81 X - 0 2 27 57 38 15 11 10 7 6 8 3 - 14 40832 2457
82 X - 0 1 5 8 6 4 3 2 2 3 5 3 - 3 8397 406
81&82 X - 0 3 32 65 44 19 14 12 9 9 13 6 - 17 49229 2863
------------------------------------------------------------------------------------------------------------------------------------
11-82 X - 11 125 567 883 966 975 976 977 970 947 923 672 - 5471645006 99714
------------------------------------------------------------------------------------------------------------------------------------
91-99 X 1000 989 875 433 117 34 25 24 23 30 53 77 328 1000 4531363430 83750
------------------------------------------------------------------------------------------------------------------------------------
11-99 X# 1000 1000 1000 1001 1001 1000 1001 1000 1000 1000 1000 998 1000 1000 10003008436 183464
------------------------------------------------------------------------------------------------------------------------------------
PER 1000 129 132 120 102 81 74 68 64 50 45 38 29 68 0 1000 XXX XXX
DISTRIBUTION
------------------------------------------------------------------------------------------------------------------------------------
EST.PERS.(00) 386918 397951 361467 308300 243079 222788 204987 192521 148967 135466 113802 88177 203811 2023008436 XXX XXX
------------------------------------------------------------------------------------------------------------------------------------
SAMPLE PERSON 22815 23401 21963 19315 15373 13835 12392 11511 9093 8397 7089 5462 12808 10 183464 XXX XXX
------------------------------------------------------------------------------------------------------------------------------------
#: THE DIFFERENCE OF ENTRY IN COL.3..17 FROM 1000 UNDER STATUS 11-99/ COL.17 UNDER PER 1000 DISTRIBUTION FROM 1000 (ROUNDING OFF ERROR)
IS ADJUSTED WITH THE ROW/ COLUMN HAVING MAXIMUM ENTRY MAKING RESPECTIVE ROW-SUM/ COL-SUM EQUALS TO 1000

59
NATIONAL SAMPLE SURVEY, 50TH ROUND : JULY 1993--JUNE 1994
TABLE (1C): PER 1000 DISTRIBUTION OF PERSONS BY CURRENT WEEKLY ACTIVITY FOR EACH AGE-GROUP.
RURAL
ALL-INDIA FEMALE
NO. OF SAMPLE VILLAGES: 6983
------------------------------------------------------------------------------------------------------------------------------------
CUR. WEEKLY ACT. AGE-GROUP IN YEARS
---------------- --------------------------------------------------------------------------------------------------- ESTD. SAMPLE
STATUS INDUSTRY 0- 5- 10- 15- 20- 25- 30- 35- 40- 45- 50- 55- 60 & NOT ALL PERSONS PERSONS
4 9 14 19 24 29 34 39 44 49 54 59 ABOVE RECD. GROUPS (00)
------------------------------------------------------------------------------------------------------------------------------------
(1) (2) (3) (4) (5) (6) (7) (8) (9) (10) (11) (12) (13) (14) (15) (16) (17) (18) (19)
------------------------------------------------------------------------------------------------------------------------------------
11,12,21, 0 - 9 59 136 166 190 226 248 267 272 250 212 107 - 133 377931 25334
61&62 1-5 - 1 9 21 22 22 27 25 20 14 17 19 10 - 14 40094 2029
6-9 - 1 6 15 18 25 30 34 31 30 24 23 17 - 16 45630 2790
---------------------------------------------------------------------------------------------------------------------------
0-9 - 11 74 172 206 237 283 307 318 316 291 254 134 - 163 463655 30153
------------------------------------------------------------------------------------------------------------------------------------
31,71&72 0 - - 1 1 2 3 4 5 4 4 3 1 1 - 2 4881 274
1-5 - 0 1 3 5 4 4 2 3 3 1 1 0 - 2 5620 260
6-9 - 0 2 3 9 10 12 12 9 11 7 6 2 - 5 15345 1315
---------------------------------------------------------------------------------------------------------------------------
0-9 - 0 4 7 16 17 20 19 16 18 11 8 3 - 9 25846 1849
------------------------------------------------------------------------------------------------------------------------------------
41&51 0 - 2 33 95 112 140 155 156 149 145 130 104 50 - 82 232374 10181
1-5 - 1 7 17 14 17 18 16 15 12 10 8 2 - 9 26523 1191
6-9 - 0 1 4 5 6 6 7 8 6 8 6 4 - 4 10808 601
---------------------------------------------------------------------------------------------------------------------------
0-9 - 3 41 116 131 163 179 179 172 163 148 118 56 - 95 269705 11973
------------------------------------------------------------------------------------------------------------------------------------
11-72 0 - 11 93 232 280 333 385 409 420 421 383 317 158 - 217 615186 35789
1-5 - 2 17 41 41 43 49 43 38 29 28 28 12 - 25 72237 3480
6-9 - 1 9 22 32 41 48 53 48 47 39 35 23 - 25 71783 4706
---------------------------------------------------------------------------------------------------------------------------
0-9 - 14 119 295 353 417 482 505 506 497 450 380 193 - 267 759206 43975
------------------------------------------------------------------------------------------------------------------------------------
81 X - 0 1 9 16 10 7 7 4 6 3 4 2 - 5 14319 890
82 X - 0 2 7 6 5 5 4 6 4 4 5 1 - 3 9336 440
81&82 X - 0 3 16 22 15 12 11 10 10 7 9 3 - 8 23655 1330
------------------------------------------------------------------------------------------------------------------------------------
11-82 X - 14 122 311 375 432 494 516 516 507 457 389 196 - 275 782861 45305
------------------------------------------------------------------------------------------------------------------------------------
91-99 X 1000 986 878 689 625 568 506 484 484 493 543 611 804 1000 7252057429 127582
------------------------------------------------------------------------------------------------------------------------------------
11-99 X# 1000 1000 1000 999 1000 1000 1002 1001 999 999 1001 1003 999 1000 9992840290 172887
------------------------------------------------------------------------------------------------------------------------------------
PER 1000 127 126 107 90 91 85 74 62 52 48 37 32 69 0 1001 XXX XXX
DISTRIBUTION
------------------------------------------------------------------------------------------------------------------------------------
EST.PERS.(00) 364352 357306 303802 254779 258493 242117 208804 175803 147177 135085 106209 90159 196066 1382840290 XXX XXX
------------------------------------------------------------------------------------------------------------------------------------
SAMPLE PERSON 21328 21113 18675 16472 16170 14716 12427 10746 9016 8330 6534 5401 11952 7 172887 XXX XXX
------------------------------------------------------------------------------------------------------------------------------------
#: THE DIFFERENCE OF ENTRY IN COL.3..17 FROM 1000 UNDER STATUS 11-99/ COL.17 UNDER PER 1000 DISTRIBUTION FROM 1000 (ROUNDING OFF ERROR)
IS ADJUSTED WITH THE ROW/ COLUMN HAVING MAXIMUM ENTRY MAKING RESPECTIVE ROW-SUM/ COL-SUM EQUALS TO 1000
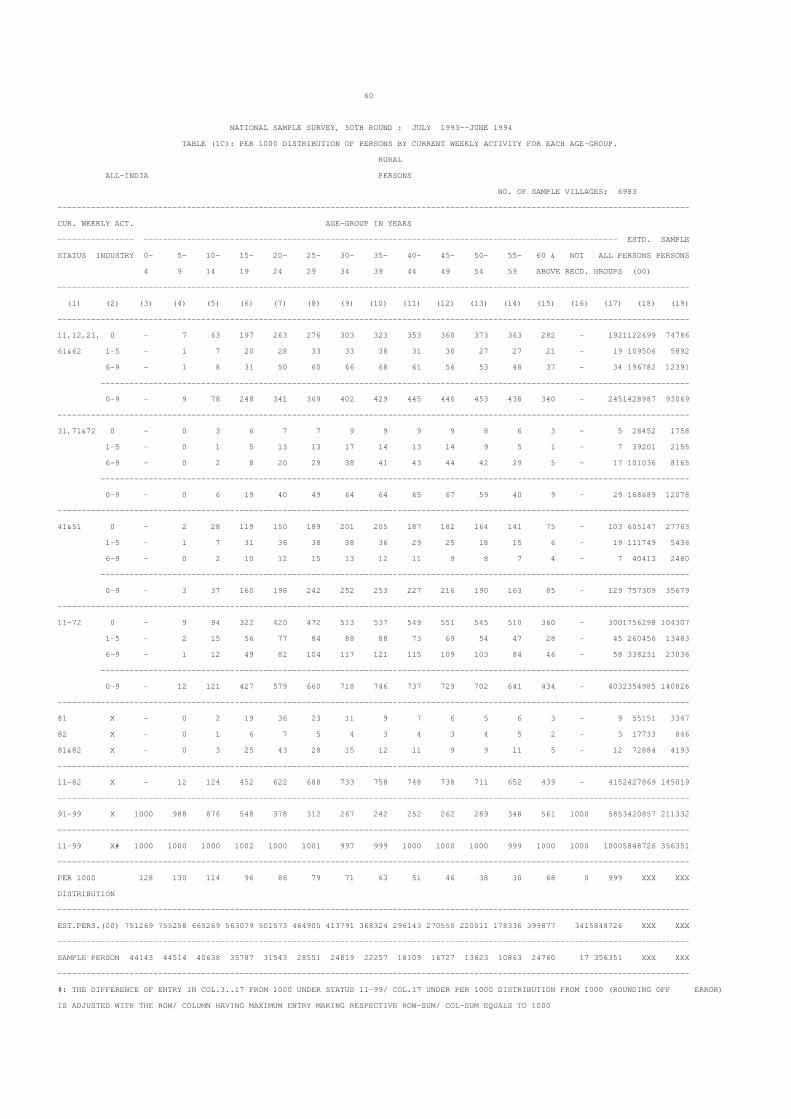
60
NATIONAL SAMPLE SURVEY, 50TH ROUND : JULY 1993--JUNE 1994
TABLE (1C): PER 1000 DISTRIBUTION OF PERSONS BY CURRENT WEEKLY ACTIVITY FOR EACH AGE-GROUP.
RURAL
ALL-INDIA PERSONS
NO. OF SAMPLE VILLAGES: 6983
------------------------------------------------------------------------------------------------------------------------------------
CUR. WEEKLY ACT. AGE-GROUP IN YEARS
---------------- --------------------------------------------------------------------------------------------------- ESTD. SAMPLE
STATUS INDUSTRY 0- 5- 10- 15- 20- 25- 30- 35- 40- 45- 50- 55- 60 & NOT ALL PERSONS PERSONS
4 9 14 19 24 29 34 39 44 49 54 59 ABOVE RECD. GROUPS (00)
------------------------------------------------------------------------------------------------------------------------------------
(1) (2) (3) (4) (5) (6) (7) (8) (9) (10) (11) (12) (13) (14) (15) (16) (17) (18) (19)
------------------------------------------------------------------------------------------------------------------------------------
11,12,21, 0 - 7 63 197 263 276 303 323 353 360 373 363 282 - 1921122699 74786
61&62 1-5 - 1 7 20 28 33 33 38 31 30 27 27 21 - 19 109506 5892
6-9 - 1 8 31 50 60 66 68 61 56 53 48 37 - 34 196782 12391
---------------------------------------------------------------------------------------------------------------------------
0-9 - 9 78 248 341 369 402 429 445 446 453 438 340 - 2451428987 93069
------------------------------------------------------------------------------------------------------------------------------------
31,71&72 0 - 0 3 6 7 7 9 9 9 9 8 6 3 - 5 28452 1758
1-5 - 0 1 5 13 13 17 14 13 14 9 5 1 - 7 39201 2155
6-9 - 0 2 8 20 29 38 41 43 44 42 29 5 - 17 101036 8165
---------------------------------------------------------------------------------------------------------------------------
0-9 - 0 6 19 40 49 64 64 65 67 59 40 9 - 29 168689 12078
------------------------------------------------------------------------------------------------------------------------------------
41&51 0 - 2 28 119 150 189 201 205 187 182 164 141 75 - 103 605147 27763
1-5 - 1 7 31 36 38 38 36 29 25 18 15 6 - 19 111749 5436
6-9 - 0 2 10 12 15 13 12 11 9 8 7 4 - 7 40413 2480
---------------------------------------------------------------------------------------------------------------------------
0-9 - 3 37 160 198 242 252 253 227 216 190 163 85 - 129 757309 35679
------------------------------------------------------------------------------------------------------------------------------------
11-72 0 - 9 94 322 420 472 513 537 549 551 545 510 360 - 3001756298 104307
1-5 - 2 15 56 77 84 88 88 73 69 54 47 28 - 45 260456 13483
6-9 - 1 12 49 82 104 117 121 115 109 103 84 46 - 58 338231 23036
---------------------------------------------------------------------------------------------------------------------------
0-9 - 12 121 427 579 660 718 746 737 729 702 641 434 - 4032354985 140826
------------------------------------------------------------------------------------------------------------------------------------
81 X - 0 2 19 36 23 11 9 7 6 5 6 3 - 9 55151 3347
82 X - 0 1 6 7 5 4 3 4 3 4 5 2 - 3 17733 846
81&82 X - 0 3 25 43 28 15 12 11 9 9 11 5 - 12 72884 4193
------------------------------------------------------------------------------------------------------------------------------------
11-82 X - 12 124 452 622 688 733 758 748 738 711 652 439 - 4152427869 145019
------------------------------------------------------------------------------------------------------------------------------------
91-99 X 1000 988 876 548 378 312 267 242 252 262 289 348 561 1000 5853420857 211332
------------------------------------------------------------------------------------------------------------------------------------
11-99 X# 1000 1000 1000 1002 1000 1001 997 999 1000 1000 1000 999 1000 1000 10005848726 356351
------------------------------------------------------------------------------------------------------------------------------------
PER 1000 128 130 114 96 86 79 71 63 51 46 38 30 68 0 999 XXX XXX
DISTRIBUTION
------------------------------------------------------------------------------------------------------------------------------------
EST.PERS.(00) 751269 755258 665269 563079 501573 464905 413791 368324 296143 270550 220011 178336 399877 3415848726 XXX XXX
------------------------------------------------------------------------------------------------------------------------------------
SAMPLE PERSON 44143 44514 40638 35787 31543 28551 24819 22257 18109 16727 13623 10863 24760 17 356351 XXX XXX
------------------------------------------------------------------------------------------------------------------------------------
#: THE DIFFERENCE OF ENTRY IN COL.3..17 FROM 1000 UNDER STATUS 11-99/ COL.17 UNDER PER 1000 DISTRIBUTION FROM 1000 (ROUNDING OFF ERROR)
IS ADJUSTED WITH THE ROW/ COLUMN HAVING MAXIMUM ENTRY MAKING RESPECTIVE ROW-SUM/ COL-SUM EQUALS TO 1000

61
NATIONAL SAMPLE SURVEY, 50TH ROUND : JULY 1993--JUNE 1994
TABLE (1C): PER 1000 DISTRIBUTION OF PERSONS BY CURRENT WEEKLY ACTIVITY FOR EACH AGE-GROUP.
URBAN
ALL-INDIA MALE
NO. OF SAMPLE BLOCKS: 4670
------------------------------------------------------------------------------------------------------------------------------------
CUR. WEEKLY ACT. AGE-GROUP IN YEARS
---------------- --------------------------------------------------------------------------------------------------- ESTD. SAMPLE
STATUS INDUSTRY 0- 5- 10- 15- 20- 25- 30- 35- 40- 45- 50- 55- 60 & NOT ALL PERSONS PERSONS
4 9 14 19 24 29 34 39 44 49 54 59 ABOVE RECD. GROUPS (00)
------------------------------------------------------------------------------------------------------------------------------------
(1) (2) (3) (4) (5) (6) (7) (8) (9) (10) (11) (12) (13) (14) (15) (16) (17) (18) (19)
------------------------------------------------------------------------------------------------------------------------------------
11,12,21, 0 - 0 6 22 33 34 32 35 35 47 51 79 74 - 27 27098 3545
61&62 1-5 - 0 7 34 67 80 87 78 82 79 79 68 59 - 47 47536 4981
6-9 - 4 16 86 201 246 274 254 238 235 223 226 185 - 141 143095 16062
---------------------------------------------------------------------------------------------------------------------------
0-9 - 4 29 142 301 360 393 367 355 361 353 373 318 - 215 217729 24588
------------------------------------------------------------------------------------------------------------------------------------
31,71&72 0 - 0 1 1 1 4 4 5 4 6 5 5 3 - 2 2430 237
1-5 - 0 5 42 90 147 158 166 175 165 155 130 20 - 79 80186 7609
6-9 - 0 13 54 122 217 279 306 326 328 317 240 37 - 136 138378 15894
---------------------------------------------------------------------------------------------------------------------------
0-9 - 0 19 97 213 368 441 477 505 499 477 375 60 - 217 220994 23740
------------------------------------------------------------------------------------------------------------------------------------
41&51 0 - 0 2 14 16 26 22 20 26 18 28 26 16 - 14 14016 1374
1-5 - 1 8 58 76 79 63 69 53 53 45 42 18 - 41 41172 3752
6-9 - 0 8 32 46 51 35 40 28 29 24 16 13 - 24 24212 2522
---------------------------------------------------------------------------------------------------------------------------
0-9 - 1 18 104 138 156 120 129 107 100 97 84 47 - 79 79400 7648
------------------------------------------------------------------------------------------------------------------------------------
11-72 0 - 0 9 37 50 64 58 60 65 71 84 110 93 - 43 43544 5156
1-5 - 1 20 134 233 306 308 313 310 297 279 240 97 - 167 168894 16342
6-9 - 4 37 172 369 514 588 600 592 592 564 482 235 - 301 305685 34478
---------------------------------------------------------------------------------------------------------------------------
0-9 - 5 66 343 652 884 954 973 967 960 927 832 425 - 511 518123 55976
------------------------------------------------------------------------------------------------------------------------------------
81 X - 0 3 48 108 66 24 10 9 8 8 4 3 - 26 26208 2810
82 X - 0 0 5 4 4 2 2 0 1 4 3 2 - 2 2017 180
81&82 X - 0 3 53 112 70 26 12 9 9 12 7 5 - 28 28225 2990
------------------------------------------------------------------------------------------------------------------------------------
11-82 X - 5 69 396 764 954 980 985 976 969 939 839 430 - 539 546348 58966
------------------------------------------------------------------------------------------------------------------------------------
91-99 X 1000 995 931 604 236 46 20 15 24 31 61 161 570 1000 461 468288 50101
------------------------------------------------------------------------------------------------------------------------------------
11-99 X# 1000 998 1000 999 1000 999 1000 1001 1000 999 1001 998 999 1000 10001014636 109067
------------------------------------------------------------------------------------------------------------------------------------
PER 1000 105 112 115 112 96 84 77 70 60 50 36 28 55 0 1000 XXX XXX
DISTRIBUTION
------------------------------------------------------------------------------------------------------------------------------------
EST.PERS.(00) 106632 113997 116603 113698 97073 85516 77996 70961 60733 51022 36359 28080 55843 1231014636 XXX XXX
------------------------------------------------------------------------------------------------------------------------------------
SAMPLE PERSON 10988 11882 12487 12042 10476 9169 8300 7731 6640 5652 4220 3192 6277 11 109067 XXX XXX
------------------------------------------------------------------------------------------------------------------------------------
#: THE DIFFERENCE OF ENTRY IN COL.3..17 FROM 1000 UNDER STATUS 11-99/ COL.17 UNDER PER 1000 DISTRIBUTION FROM 1000 (ROUNDING OFF ERROR)
IS ADJUSTED WITH THE ROW/ COLUMN HAVING MAXIMUM ENTRY MAKING RESPECTIVE ROW-SUM/ COL-SUM EQUALS TO 1000

62
NATIONAL SAMPLE SURVEY, 50TH ROUND : JULY 1993--JUNE 1994
TABLE (1C): PER 1000 DISTRIBUTION OF PERSONS BY CURRENT WEEKLY ACTIVITY FOR EACH AGE-GROUP.
URBAN
ALL-INDIA FEMALE
NO. OF SAMPLE BLOCKS: 4670
------------------------------------------------------------------------------------------------------------------------------------
CUR. WEEKLY ACT. AGE-GROUP IN YEARS
---------------- --------------------------------------------------------------------------------------------------- ESTD. SAMPLE
STATUS INDUSTRY 0- 5- 10- 15- 20- 25- 30- 35- 40- 45- 50- 55- 60 & NOT ALL PERSONS PERSONS
4 9 14 19 24 29 34 39 44 49 54 59 ABOVE RECD. GROUPS (00)
------------------------------------------------------------------------------------------------------------------------------------
(1) (2) (3) (4) (5) (6) (7) (8) (9) (10) (11) (12) (13) (14) (15) (16) (17) (18) (19)
------------------------------------------------------------------------------------------------------------------------------------
11,12,21, 0 - 1 5 11 13 20 26 29 33 43 36 38 22 - 17 15159 1862
61&62 1-5 - 1 10 26 27 24 29 37 32 33 29 20 14 - 19 17777 1826
6-9 - 3 7 15 24 32 47 48 54 52 49 36 25 - 25 22589 2710
---------------------------------------------------------------------------------------------------------------------------
0-9 - 5 22 52 64 76 102 114 119 128 114 94 61 - 61 55525 6398
------------------------------------------------------------------------------------------------------------------------------------
31,71&72 0 - - - - 0 1 1 1 1 0 2 0 1 - 0 414 41
1-5 - 0 2 10 11 11 12 14 11 10 7 7 3 - 7 6353 678
6-9 - 1 8 15 43 59 71 77 91 80 82 58 13 - 37 34118 4068
---------------------------------------------------------------------------------------------------------------------------
0-9 - 1 10 25 54 71 84 92 103 90 91 65 17 - 44 40885 4787
------------------------------------------------------------------------------------------------------------------------------------
41&51 0 - 0 3 11 15 16 18 24 23 23 23 16 7 - 12 10615 925
1-5 - 0 6 21 17 19 25 25 29 29 19 16 7 - 14 13262 1183
6-9 - 0 3 5 7 13 14 17 17 15 14 12 9 - 8 7277 765
---------------------------------------------------------------------------------------------------------------------------
0-9 - 0 12 37 39 48 57 66 69 67 56 44 23 - 34 31154 2873
------------------------------------------------------------------------------------------------------------------------------------
11-72 0 - 1 8 22 28 37 45 54 57 66 61 54 30 - 29 26188 2828
1-5 - 1 18 57 55 54 66 76 72 72 55 43 24 - 40 37392 3687
6-9 - 4 18 35 74 104 132 142 162 147 145 106 47 - 70 63984 7543
---------------------------------------------------------------------------------------------------------------------------
0-9 - 6 44 114 157 195 243 272 291 285 261 203 101 - 139 127564 14058
------------------------------------------------------------------------------------------------------------------------------------
81 X - 0 2 16 47 24 11 5 2 4 2 2 0 - 10 9492 1110
82 X - 0 0 5 7 5 4 2 3 2 1 1 1 - 2 2267 201
81&82 X - 0 2 21 54 29 15 7 5 6 3 3 1 - 12 11759 1311
------------------------------------------------------------------------------------------------------------------------------------
11-82 X - 6 46 135 211 224 258 279 296 291 264 206 102 - 151 139323 15369
------------------------------------------------------------------------------------------------------------------------------------
91-99 X 1000 994 954 865 789 776 742 721 704 709 736 794 898 1000 849 778978 83953
------------------------------------------------------------------------------------------------------------------------------------
11-99 X# 1000 999 1000 1001 1002 1000 999 1001 999 999 1000 1000 1001 1000 999 918301 99322
------------------------------------------------------------------------------------------------------------------------------------
PER 1000 106 111 114 103 98 90 78 73 54 45 35 29 64 0 1000 XXX XXX
DISTRIBUTION
------------------------------------------------------------------------------------------------------------------------------------
EST.PERS.(00) 96921 101683 104711 94811 90085 82249 71993 67182 49175 41740 31889 26475 59229 158 918301 XXX XXX
------------------------------------------------------------------------------------------------------------------------------------
SAMPLE PERSON 9908 10642 11047 10324 9649 8904 7789 7325 5589 4851 3701 2856 6722 15 99322 XXX XXX
------------------------------------------------------------------------------------------------------------------------------------
#: THE DIFFERENCE OF ENTRY IN COL.3..17 FROM 1000 UNDER STATUS 11-99/ COL.17 UNDER PER 1000 DISTRIBUTION FROM 1000 (ROUNDING OFF ERROR)
IS ADJUSTED WITH THE ROW/ COLUMN HAVING MAXIMUM ENTRY MAKING RESPECTIVE ROW-SUM/ COL-SUM EQUALS TO 1000

63
NATIONAL SAMPLE SURVEY, 50TH ROUND : JULY 1993--JUNE 1994
TABLE (1C): PER 1000 DISTRIBUTION OF PERSONS BY CURRENT WEEKLY ACTIVITY FOR EACH AGE-GROUP.
URBAN
ALL-INDIA PERSONS
NO. OF SAMPLE BLOCKS: 4670
------------------------------------------------------------------------------------------------------------------------------------
CUR. WEEKLY ACT. AGE-GROUP IN YEARS
---------------- --------------------------------------------------------------------------------------------------- ESTD. SAMPLE
STATUS INDUSTRY 0- 5- 10- 15- 20- 25- 30- 35- 40- 45- 50- 55- 60 & NOT ALL PERSONS PERSONS
4 9 14 19 24 29 34 39 44 49 54 59 ABOVE RECD. GROUPS (00)
------------------------------------------------------------------------------------------------------------------------------------
(1) (2) (3) (4) (5) (6) (7) (8) (9) (10) (11) (12) (13) (14) (15) (16) (17) (18) (19)
------------------------------------------------------------------------------------------------------------------------------------
11,12,21, 0 - 1 5 17 23 27 29 32 34 45 44 59 47 - 22 42257 5407
61&62 1-5 - 1 8 30 48 53 59 58 60 59 56 45 36 - 34 65313 6807
6-9 - 3 12 53 116 141 165 154 156 152 142 134 102 - 86 165684 18772
---------------------------------------------------------------------------------------------------------------------------
0-9 - 5 25 100 187 221 253 244 250 256 242 238 185 - 142 273254 30986
------------------------------------------------------------------------------------------------------------------------------------
31,71&72 0 - 0 0 1 1 3 3 3 3 4 3 3 2 - 1 2844 278
1-5 - 0 4 27 52 80 88 92 101 96 86 71 11 - 45 86539 8287
6-9 - 1 11 36 84 140 179 195 221 216 208 151 25 - 89 172496 19962
---------------------------------------------------------------------------------------------------------------------------
0-9 - 1 15 64 137 223 270 290 325 316 297 225 38 - 135 261879 28527
------------------------------------------------------------------------------------------------------------------------------------
41&51 0 - 0 3 13 15 21 20 22 25 20 25 21 11 - 13 24630 2299
1-5 - 1 7 41 47 50 44 48 43 42 32 29 13 - 28 54434 4935
6-9 - 0 6 20 27 32 25 28 23 22 19 14 11 - 16 31490 3287
---------------------------------------------------------------------------------------------------------------------------
0-9 - 1 16 74 89 103 89 98 91 84 76 64 35 - 57 110554 10521
------------------------------------------------------------------------------------------------------------------------------------
11-72 0 - 1 8 31 39 51 52 57 62 69 72 83 60 - 36 69731 7984
1-5 - 2 19 98 147 183 191 198 204 197 174 145 60 - 107 206286 20029
6-9 - 4 29 109 227 313 369 377 400 390 369 299 138 - 191 369670 42021
---------------------------------------------------------------------------------------------------------------------------
0-9 - 7 56 238 413 547 612 632 666 656 615 527 258 - 334 645687 70034
------------------------------------------------------------------------------------------------------------------------------------
81 X - 0 2 34 79 45 18 8 6 6 5 3 2 - 18 35700 3920
82 X - 0 0 5 5 4 3 2 1 1 3 2 1 - 2 4284 381
81&82 X - 0 2 39 84 49 21 10 7 7 8 5 3 - 20 39984 4301
------------------------------------------------------------------------------------------------------------------------------------
11-82 X - 7 58 277 497 596 633 642 673 663 623 532 261 - 354 685671 74335
------------------------------------------------------------------------------------------------------------------------------------
91-99 X 1000 993 942 723 503 404 367 358 327 337 377 468 739 1000 6461247266 134054
------------------------------------------------------------------------------------------------------------------------------------
11-99 X# 1000 1000 1000 1000 1001 1000 999 1000 1000 999 1000 1000 999 1000 10001932937 208389
------------------------------------------------------------------------------------------------------------------------------------
PER 1000 105 112 114 108 97 87 78 71 57 48 35 28 60 0 1000 XXX XXX
DISTRIBUTION
------------------------------------------------------------------------------------------------------------------------------------
EST.PERS.(00) 203553 215680 221314 208510 187158 167765 149989 138143 109907 92763 68248 54555 115072 2801932937 XXX XXX
------------------------------------------------------------------------------------------------------------------------------------
SAMPLE PERSON 20896 22524 23534 22366 20125 18073 16089 15056 12229 10503 7921 6048 12999 26 208389 XXX XXX
------------------------------------------------------------------------------------------------------------------------------------
#: THE DIFFERENCE OF ENTRY IN COL.3..17 FROM 1000 UNDER STATUS 11-99/ COL.17 UNDER PER 1000 DISTRIBUTION FROM 1000 (ROUNDING OFF ERROR)
IS ADJUSTED WITH THE ROW/ COLUMN HAVING MAXIMUM ENTRY MAKING RESPECTIVE ROW-SUM/ COL-SUM EQUALS TO 1000

64
NATIONAL SAMPLE SURVEY, 50TH ROUND : JULY 1993--JUNE 1994
TABLE (1D): PER 1000 DISTRIBUTION OF PERSON-DAYS BY CURRENT DAILY ACTIVITY FOR EACH AGE-GROUP
RURAL
ALL-INDIA MALE
NO. OF SAMPLE VILLAGES: 6983
------------------------------------------------------------------------------------------------------------------------------------
CUR. DAILY ACT. AGE-GROUP IN YEARS ESTD. SAMPLE
-------------- ----------------------------------------------------------------------------------------------------- PERSON PERSON
STATUS INDUSTRY 0- 5- 10- 15- 20- 25- 30- 35- 40- 45- 50- 55- 60 & NOT ALL DAYS DAYS
4 9 14 19 24 29 34 39 44 49 54 59 ABOVE RECD. GROUPS (000)
------------------------------------------------------------------------------------------------------------------------------------
(1) (2) (3) (4) (5) (6) (7) (8) (9) (10) (11) (12) (13) (14) (15) (16) (17) (18) (19)
------------------------------------------------------------------------------------------------------------------------------------
11,12 0 - 6 64 245 366 374 383 398 441 452 488 517 452 - 249 523777 345754
21,61& 1-5 - 0 4 18 33 43 37 47 40 44 34 36 29 - 22 46550 26134
62 6-9 - 0 5 34 72 87 95 89 82 74 74 65 46 - 44 92238 58079
---------------------------------------------------------------------------------------------------------------------------
0-9 - 6 73 297 471 504 515 534 563 570 596 618 527 - 315 662565 429966
------------------------------------------------------------------------------------------------------------------------------------
31,71& 0 - 1 6 12 16 15 18 17 18 17 16 14 8 - 10 21022 12848
72 1-5 - - 1 6 21 22 30 25 23 25 17 10 2 - 11 23112 13077
6-9 - 0 2 10 30 47 63 65 74 74 71 50 6 - 27 57330 46153
---------------------------------------------------------------------------------------------------------------------------
0-9 - 1 9 28 67 84 111 107 115 116 104 74 16 - 48 101464 72078
------------------------------------------------------------------------------------------------------------------------------------
41&51 0 - 2 21 124 168 214 217 218 199 192 170 154 86 - 109 229275 109113
1-5 - 1 6 37 51 53 52 47 38 34 22 21 9 - 25 51861 26114
6-9 - 0 2 9 15 19 16 13 11 9 6 7 3 - 7 15393 10180
---------------------------------------------------------------------------------------------------------------------------
0-9 - 3 29 170 234 286 285 278 248 235 198 182 98 - 141 296529 145406
------------------------------------------------------------------------------------------------------------------------------------
11-72 0 - 9 91 381 550 603 618 633 658 661 674 685 546 - 368 774074 467715
1-5 - 1 11 61 105 118 119 119 101 103 73 67 40 - 58 121523 65324
6-9 - 0 9 53 117 153 174 167 167 157 151 122 55 - 78 164961 114412
---------------------------------------------------------------------------------------------------------------------------
0-9 - 10 111 495 772 874 911 919 926 921 898 874 641 - 5041060558 647451
------------------------------------------------------------------------------------------------------------------------------------
81 X - 0 4 38 76 58 36 29 24 22 20 20 9 - 23 48943 26442
82 X - 0 1 11 14 15 12 11 10 9 9 9 5 - 7 14591 7004
81&82 X - 0 5 49 90 73 48 40 34 31 29 29 14 - 30 63534 33446
------------------------------------------------------------------------------------------------------------------------------------
11-82 X - 10 116 544 862 947 959 959 960 952 927 903 655 - 5341124092 680897
------------------------------------------------------------------------------------------------------------------------------------
91-99 X 1000 990 884 456 138 53 41 41 40 48 73 97 345 1000 466 981813 603351
------------------------------------------------------------------------------------------------------------------------------------
11-99 X# 1000 1000 1000 999 1002 1000 999 999 1000 1001 998 1001 997 1000 10002105905 1284248
------------------------------------------------------------------------------------------------------------------------------------
PDAYS.DISTN# 129 132 120 102 81 74 68 64 50 45 38 29 68 0 1000 XXX XXX
------------------------------------------------------------------------------------------------------------------------------------
ES.PDAYS000 270843 278564 253027 215810 170155 155951 143491 134765 104277 94826 79662 61724 142668 1422105905 XXX XXX
------------------------------------------------------------------------------------------------------------------------------------
SAMP.PDAYS. 159705 163807 153741 135205 107611 96845 86744 80577 63651 58779 49623 38234 89656 701284248 XXX XXX
------------------------------------------------------------------------------------------------------------------------------------
#: THE DIFFERENCE OF ENTRY IN COL.3..17 FROM 1000 UNDER STATUS 11-99/ COL.17 UNDER PER 1000 DISTRIBUTION FROM 1000 (ROUNDING OFF ERROR)
IS ADJUSTED WITH THE ROW/ COLUMN HAVING MAXIMUM ENTRY MAKING RESPECTIVE ROW-SUM/ COL-SUM EQUALS TO 1000

65
NATIONAL SAMPLE SURVEY, 50TH ROUND : JULY 1993--JUNE 1994
TABLE (1D): PER 1000 DISTRIBUTION OF PERSON-DAYS BY CURRENT DAILY ACTIVITY FOR EACH AGE-GROUP
RURAL
ALL-INDIA FEMALE
NO. OF SAMPLE VILLAGES: 6983
------------------------------------------------------------------------------------------------------------------------------------
CUR. DAILY ACT. AGE-GROUP IN YEARS ESTD. SAMPLE
-------------- ----------------------------------------------------------------------------------------------------- PERSON PERSON
STATUS INDUSTRY 0- 5- 10- 15- 20- 25- 30- 35- 40- 45- 50- 55- 60 & NOT ALL DAYS DAYS
4 9 14 19 24 29 34 39 44 49 54 59 ABOVE RECD. GROUPS (000)
------------------------------------------------------------------------------------------------------------------------------------
(1) (2) (3) (4) (5) (6) (7) (8) (9) (10) (11) (12) (13) (14) (15) (16) (17) (18) (19)
------------------------------------------------------------------------------------------------------------------------------------
11,12 0 - 8 55 119 141 159 189 209 230 233 216 186 94 - 114 227085 150669
21,61& 1-5 - 1 8 18 18 17 21 20 17 11 15 16 9 - 11 22739 11398
62 6-9 - 0 3 7 9 11 16 20 16 18 15 14 11 - 9 16947 9444
---------------------------------------------------------------------------------------------------------------------------
0-9 - 9 66 144 168 187 226 249 263 262 246 216 114 - 134 266771 171511
------------------------------------------------------------------------------------------------------------------------------------
31,71& 0 - 0 1 2 4 4 6 6 5 6 4 2 1 - 3 5146 2762
72 1-5 - 0 1 3 5 4 4 2 3 3 1 1 0 - 2 3870 1782
6-9 - 0 1 3 8 10 10 11 9 10 6 5 2 - 5 9466 8444
---------------------------------------------------------------------------------------------------------------------------
0-9 - 0 3 8 17 18 20 19 17 19 11 8 3 - 10 18482 12987
------------------------------------------------------------------------------------------------------------------------------------
41&51 0 - 2 27 77 91 113 125 129 121 118 107 85 40 - 66 132068 58182
1-5 - 0 6 15 12 13 15 13 12 10 8 6 1 - 8 15422 6983
6-9 - - 1 1 2 2 2 3 4 3 4 2 2 - 2 3080 2131
---------------------------------------------------------------------------------------------------------------------------
0-9 - 2 34 93 105 128 142 145 137 131 119 93 43 - 76 150570 67295
------------------------------------------------------------------------------------------------------------------------------------
11-72 0 - 10 83 198 236 276 320 344 356 357 327 273 135 - 183 364299 211612
1-5 - 1 15 36 35 34 40 35 32 24 24 23 10 - 21 42031 20162
6-9 - 0 5 11 19 23 28 34 29 31 25 21 15 - 16 29493 20019
---------------------------------------------------------------------------------------------------------------------------
0-9 - 11 103 245 290 333 388 413 417 412 376 317 160 - 220 435823 251793
------------------------------------------------------------------------------------------------------------------------------------
81 X - 0 4 14 19 17 14 13 11 12 9 6 4 - 9 17117 8956
82 X - 0 3 8 7 6 7 6 7 7 6 5 3 - 4 8550 3845
81&82 X - 0 7 22 26 23 21 19 18 19 15 11 7 - 13 25667 12802
------------------------------------------------------------------------------------------------------------------------------------
11-82 X - 11 110 267 316 356 409 432 435 431 391 328 167 - 233 461490 264595
------------------------------------------------------------------------------------------------------------------------------------
91-99 X 1000 989 890 733 684 644 591 568 565 569 609 672 833 1000 7671526713 945614
------------------------------------------------------------------------------------------------------------------------------------
11-99 X# 1000 998 1003 1001 1001 1000 1002 1001 1001 999 1002 1000 999 1000 10001988203 1210209
------------------------------------------------------------------------------------------------------------------------------------
PDAYS.DIST# 127 126 107 90 91 85 74 62 52 48 37 32 69 0 1001 XXX XXX
------------------------------------------------------------------------------------------------------------------------------------
ES.PDAYS000 255046 250114 212662 178346 180945 169482 146163 123062 103024 94559 74346 63111 137246 971988203 XXX XXX
------------------------------------------------------------------------------------------------------------------------------------
SAMP.PDAYS. 149296 147791 130725 115304 113190 103012 86989 75222 63112 58310 45738 37807 83664 491210209 XXX XXX
------------------------------------------------------------------------------------------------------------------------------------
#: THE DIFFERENCE OF ENTRY IN COL.3..17 FROM 1000 UNDER STATUS 11-99/ COL.17 UNDER PER 1000 DISTRIBUTION FROM 1000 (ROUNDING OFF ERROR)
IS ADJUSTED WITH THE ROW/ COLUMN HAVING MAXIMUM ENTRY MAKING RESPECTIVE ROW-SUM/ COL-SUM EQUALS TO 1000

66
NATIONAL SAMPLE SURVEY, 50TH ROUND : JULY 1993--JUNE 1994
TABLE (1D): PER 1000 DISTRIBUTION OF PERSON-DAYS BY CURRENT DAILY ACTIVITY FOR EACH AGE-GROUP
RURAL
ALL-INDIA PERSONS
NO. OF SAMPLE VILLAGES: 6983
------------------------------------------------------------------------------------------------------------------------------------
CUR. DAILY ACT. AGE-GROUP IN YEARS ESTD. SAMPLE
-------------- ----------------------------------------------------------------------------------------------------- PERSON PERSON
STATUS INDUSTRY 0- 5- 10- 15- 20- 25- 30- 35- 40- 45- 50- 55- 60 & NOT ALL DAYS DAYS
4 9 14 19 24 29 34 39 44 49 54 59 ABOVE RECD. GROUPS (000)
------------------------------------------------------------------------------------------------------------------------------------
(1) (2) (3) (4) (5) (6) (7) (8) (9) (10) (11) (12) (13) (14) (15) (16) (17) (18) (19)
------------------------------------------------------------------------------------------------------------------------------------
11,12 0 - 7 60 188 251 262 284 308 337 342 358 351 275 - 183 750862 496423
21,61& 1-5 - 1 6 18 25 29 29 34 29 28 25 26 19 - 17 69289 37531
62 6-9 - 0 4 22 39 47 55 56 49 46 45 39 29 - 27 109185 67523
---------------------------------------------------------------------------------------------------------------------------
0-9 - 8 70 228 315 338 368 398 415 416 428 416 323 - 227 929336 601477
------------------------------------------------------------------------------------------------------------------------------------
31,71& 0 - 0 4 8 10 10 12 12 11 11 10 8 4 - 6 26168 15610
72 1-5 - 0 1 5 13 13 17 14 13 14 9 5 1 - 7 26982 14858
6-9 - 0 2 7 19 27 36 39 42 42 40 27 4 - 16 66796 54598
---------------------------------------------------------------------------------------------------------------------------
0-9 - 0 7 20 42 50 65 65 66 67 59 40 9 - 29 119946 85066
------------------------------------------------------------------------------------------------------------------------------------
41&51 0 - 2 23 103 128 161 171 175 160 155 139 119 64 - 88 361343 167294
1-5 - 1 6 27 31 32 33 31 25 22 15 13 5 - 16 67283 33097
6-9 - 0 1 6 8 10 9 8 7 6 5 4 3 - 5 18472 12310
---------------------------------------------------------------------------------------------------------------------------
0-9 - 3 30 136 167 203 213 214 192 183 159 136 72 - 109 447098 212702
------------------------------------------------------------------------------------------------------------------------------------
11-72 0 - 9 87 299 389 433 467 495 508 508 507 478 343 - 2771138373 679327
1-5 - 2 13 50 69 74 79 79 67 64 49 44 25 - 40 163554 85486
6-9 - 0 7 35 66 84 100 103 98 94 90 70 36 - 48 194453 134430
---------------------------------------------------------------------------------------------------------------------------
0-9 - 11 107 384 524 591 646 677 673 666 646 592 404 - 3651496380 899244
------------------------------------------------------------------------------------------------------------------------------------
81 X - 0 4 27 47 37 25 21 17 17 15 13 7 - 16 66060 35399
82 X - 0 2 10 10 11 9 9 8 8 7 7 4 - 6 23142 10848
81&82 X - 0 6 37 57 48 34 30 25 25 22 20 11 - 22 89202 46248
------------------------------------------------------------------------------------------------------------------------------------
11-82 X - 11 113 421 581 639 680 707 698 691 668 612 415 - 3871585582 945492
------------------------------------------------------------------------------------------------------------------------------------
91-99 X 1000 989 887 579 419 361 320 293 302 309 332 388 585 1000 6132508526 1548965
------------------------------------------------------------------------------------------------------------------------------------
11-99 X# 1000 1000 1002 1003 1000 1000 1001 999 999 1001 998 999 1000 1000 9994094108 2494457
------------------------------------------------------------------------------------------------------------------------------------
PDAYS.DIST# 128 130 114 96 86 79 71 63 51 46 38 30 68 0 999 XXX XXX
------------------------------------------------------------------------------------------------------------------------------------
ES.PDAYS000 525888 528680 465689 394155 351101 325433 289654 257827 207300 189385 154008 124835 279914 2394094108 XXX XXX
------------------------------------------------------------------------------------------------------------------------------------
SAMP.PDAYS. 309001 311598 284466 250509 220801 199857 173733 155799 126763 117089 95361 76041 173320 1192494457 XXX XXX
------------------------------------------------------------------------------------------------------------------------------------
#: THE DIFFERENCE OF ENTRY IN COL.3..17 FROM 1000 UNDER STATUS 11-99/ COL.17 UNDER PER 1000 DISTRIBUTION FROM 1000 (ROUNDING OFF ERROR)
IS ADJUSTED WITH THE ROW/ COLUMN HAVING MAXIMUM ENTRY MAKING RESPECTIVE ROW-SUM/ COL-SUM EQUALS TO 1000

67
NATIONAL SAMPLE SURVEY, 50TH ROUND : JULY 1993--JUNE 1994
TABLE (1D): PER 1000 DISTRIBUTION OF PERSON-DAYS BY CURRENT DAILY ACTIVITY FOR EACH AGE-GROUP
URBAN
ALL-INDIA MALE
NO. OF SAMPLE BLOCKS: 4670
------------------------------------------------------------------------------------------------------------------------------------
CUR. DAILY ACT. AGE-GROUP IN YEARS ESTD. SAMPLE
-------------- ----------------------------------------------------------------------------------------------------- PERSON PERSON
STATUS INDUSTRY 0- 5- 10- 15- 20- 25- 30- 35- 40- 45- 50- 55- 60 & NOT ALL DAYS DAYS
4 9 14 19 24 29 34 39 44 49 54 59 ABOVE RECD. GROUPS (000)
------------------------------------------------------------------------------------------------------------------------------------
(1) (2) (3) (4) (5) (6) (7) (8) (9) (10) (11) (12) (13) (14) (15) (16) (17) (18) (19)
------------------------------------------------------------------------------------------------------------------------------------
11,12 0 - 0 6 21 33 34 34 36 35 48 51 78 73 - 27 18899 24281
21,61& 1-5 - 0 7 33 66 79 84 76 80 77 76 67 57 - 46 32333 33792
62 6-9 - 2 14 83 195 240 271 251 237 232 221 224 181 - 139 98546 110332
---------------------------------------------------------------------------------------------------------------------------
0-9 - 2 27 137 294 353 389 363 352 357 348 369 311 - 212 149778 168405
------------------------------------------------------------------------------------------------------------------------------------
31,71& 0 - 0 1 1 2 5 5 5 4 6 5 5 3 - 3 1809 1774
72 1-5 - 0 5 40 88 142 154 162 171 160 152 126 20 - 77 54627 51954
6-9 - 1 13 56 124 220 281 310 327 332 321 241 38 - 138 97976 111768
---------------------------------------------------------------------------------------------------------------------------
0-9 - 1 19 97 214 367 440 477 502 498 478 372 61 - 218 154412 165495
------------------------------------------------------------------------------------------------------------------------------------
41&51 0 - 0 2 12 13 23 19 17 22 16 23 22 13 - 12 8370 8293
1-5 - 1 7 50 65 66 54 59 47 45 39 33 14 - 35 24648 22559
6-9 - 0 7 29 39 45 32 35 25 25 22 13 11 - 21 14937 15668
---------------------------------------------------------------------------------------------------------------------------
0-9 - 1 16 91 117 134 105 111 94 86 84 68 38 - 68 47955 46520
------------------------------------------------------------------------------------------------------------------------------------
11-72 0 - 0 9 34 48 62 58 58 61 70 79 105 89 - 42 29078 34348
1-5 - 1 19 123 219 287 292 297 298 282 267 226 91 - 158 111608 108304
6-9 - 3 34 168 358 505 584 596 589 589 564 478 230 - 298 211459 237768
---------------------------------------------------------------------------------------------------------------------------
0-9 - 4 62 325 625 854 934 951 948 941 910 809 410 - 498 352145 380420
------------------------------------------------------------------------------------------------------------------------------------
81 X - 0 4 54 119 79 33 17 15 14 13 10 7 - 31 22099 23208
82 X - 0 1 9 8 9 6 6 4 3 7 7 4 - 5 3274 2778
81&82 X - 0 5 63 127 88 39 23 19 17 20 17 11 - 36 25373 25986
------------------------------------------------------------------------------------------------------------------------------------
11-82 X - 4 67 388 752 942 973 974 967 958 930 826 421 - 534 377518 406406
------------------------------------------------------------------------------------------------------------------------------------
91-99 X 1000 996 933 612 248 58 27 26 33 42 70 174 579 1000 466 332731 357067
------------------------------------------------------------------------------------------------------------------------------------
11-99 X# 1000 999 1000 999 1000 1002 1000 1000 1001 999 998 1000 999 1000 1002 710249 763472
------------------------------------------------------------------------------------------------------------------------------------
PDAYS.DIST# 105 112 115 112 96 84 77 70 60 50 36 28 55 0 1000 XXX XXX
------------------------------------------------------------------------------------------------------------------------------------
ES.PDAYS000 74647 79798 81621 79589 67951 59861 54597 49673 42513 35716 25451 19656 39090 86 710249 XXX XXX
------------------------------------------------------------------------------------------------------------------------------------
SAMP.PDAYS. 76923 83174 87409 84294 73332 64180 58100 54117 46480 39564 29540 22344 43939 77 763473 XXX XXX
------------------------------------------------------------------------------------------------------------------------------------
#: THE DIFFERENCE OF ENTRY IN COL.3..17 FROM 1000 UNDER STATUS 11-99/ COL.17 UNDER PER 1000 DISTRIBUTION FROM 1000 (ROUNDING OFF ERROR)
IS ADJUSTED WITH THE ROW/ COLUMN HAVING MAXIMUM ENTRY MAKING RESPECTIVE ROW-SUM/ COL-SUM EQUALS TO 1000

68
NATIONAL SAMPLE SURVEY, 50TH ROUND : JULY 1993--JUNE 1994
TABLE (1D): PER 1000 DISTRIBUTION OF PERSON-DAYS BY CURRENT DAILY ACTIVITY FOR EACH AGE-GROUP
URBAN
ALL-INDIA FEMALE
NO. OF SAMPLE BLOCKS: 4670
------------------------------------------------------------------------------------------------------------------------------------
CUR. DAILY ACT. AGE-GROUP IN YEARS ESTD. SAMPLE
-------------- ----------------------------------------------------------------------------------------------------- PERSON PERSON
STATUS INDUSTRY 0- 5- 10- 15- 20- 25- 30- 35- 40- 45- 50- 55- 60 & NOT ALL DAYS DAYS
4 9 14 19 24 29 34 39 44 49 54 59 ABOVE RECD. GROUPS (000)
------------------------------------------------------------------------------------------------------------------------------------
(1) (2) (3) (4) (5) (6) (7) (8) (9) (10) (11) (12) (13) (14) (15) (16) (17) (18) (19)
------------------------------------------------------------------------------------------------------------------------------------
11,12 0 - 1 4 8 10 17 20 23 26 30 29 32 19 - 13 8362 10552
21,61& 1-5 - 1 8 22 21 20 23 30 26 28 24 16 12 - 16 10173 10528
62 6-9 - 1 5 12 19 27 37 40 46 47 45 31 23 - 20 13173 15451
---------------------------------------------------------------------------------------------------------------------------
0-9 - 3 17 42 50 64 80 93 98 105 98 79 54 - 49 31708 36532
------------------------------------------------------------------------------------------------------------------------------------
31,71& 0 - - - 0 0 1 1 1 1 1 1 1 1 - 1 330 331
72 1-5 - 0 2 10 10 11 11 13 10 10 7 7 2 - 7 4197 4497
6-9 - 1 8 15 42 57 70 76 90 78 81 58 13 - 36 23445 28012
---------------------------------------------------------------------------------------------------------------------------
0-9 - 1 10 25 52 69 82 90 101 89 89 66 16 - 44 27972 32840
------------------------------------------------------------------------------------------------------------------------------------
41&51 0 - 0 3 10 11 12 14 19 18 18 17 11 5 - 9 5789 5066
1-5 - 0 5 16 14 14 20 19 23 22 14 13 6 - 11 7272 6515
6-9 - 0 2 4 5 10 12 14 14 12 13 10 7 - 7 4254 4490
---------------------------------------------------------------------------------------------------------------------------
0-9 - 0 10 30 30 36 46 52 55 52 44 34 18 - 27 17315 16072
------------------------------------------------------------------------------------------------------------------------------------
11-72 0 - 1 7 18 21 30 35 43 45 49 47 44 25 - 23 14481 15950
1-5 - 1 15 48 45 45 54 62 59 60 45 36 20 - 34 21642 21540
6-9 - 2 15 31 66 94 119 130 150 137 139 99 43 - 63 40872 47953
---------------------------------------------------------------------------------------------------------------------------
0-9 - 4 37 97 132 169 208 235 254 246 231 179 88 - 120 76995 85444
------------------------------------------------------------------------------------------------------------------------------------
81 X - 0 3 18 47 25 13 7 5 7 2 3 1 - 11 7318 8334
82 X - 0 0 5 6 5 4 3 3 3 4 2 1 - 3 1750 1516
81&82 X - 0 3 23 53 30 17 10 8 10 6 5 2 - 14 9068 9851
------------------------------------------------------------------------------------------------------------------------------------
11-82 X - 4 40 120 185 199 225 245 262 256 237 184 90 - 134 86063 95295
------------------------------------------------------------------------------------------------------------------------------------
91-99 X 1000 996 960 880 815 801 775 755 738 744 763 816 910 1000 866 556746 599956
------------------------------------------------------------------------------------------------------------------------------------
11-99 X# 1000 1000 1002 1001 999 1000 999 1001 999 999 1001 1000 1000 1000 1001 642809 695250
------------------------------------------------------------------------------------------------------------------------------------
PDAYS.DIST# 106 111 114 103 98 90 78 73 54 45 35 29 64 0 1000 XXX XXX
------------------------------------------------------------------------------------------------------------------------------------
ES.PDAYS000 67844 71178 73299 66368 63058 57574 50395 47027 34422 29218 22322 18533 41461 110 642809 XXX XXX
------------------------------------------------------------------------------------------------------------------------------------
SAMP.PDAYS. 69356 74494 77329 72268 67540 62328 54523 51275 39123 33957 25907 19992 47054 105 695251 XXX XXX
------------------------------------------------------------------------------------------------------------------------------------
#: THE DIFFERENCE OF ENTRY IN COL.3..17 FROM 1000 UNDER STATUS 11-99/ COL.17 UNDER PER 1000 DISTRIBUTION FROM 1000 (ROUNDING OFF ERROR)
IS ADJUSTED WITH THE ROW/ COLUMN HAVING MAXIMUM ENTRY MAKING RESPECTIVE ROW-SUM/ COL-SUM EQUALS TO 1000

69
NATIONAL SAMPLE SURVEY, 50TH ROUND : JULY 1993--JUNE 1994
TABLE (1D): PER 1000 DISTRIBUTION OF PERSON-DAYS BY CURRENT DAILY ACTIVITY FOR EACH AGE-GROUP
URBAN
ALL-INDIA PERSONS
NO. OF SAMPLE BLOCKS: 4670
------------------------------------------------------------------------------------------------------------------------------------
CUR. DAILY ACT. AGE-GROUP IN YEARS ESTD. SAMPLE
-------------- ----------------------------------------------------------------------------------------------------- PERSON PERSON
STATUS INDUSTRY 0- 5- 10- 15- 20- 25- 30- 35- 40- 45- 50- 55- 60 & NOT ALL DAYS DAYS
4 9 14 19 24 29 34 39 44 49 54 59 ABOVE RECD. GROUPS (000)
------------------------------------------------------------------------------------------------------------------------------------
(1) (2) (3) (4) (5) (6) (7) (8) (9) (10) (11) (12) (13) (14) (15) (16) (17) (18) (19)
------------------------------------------------------------------------------------------------------------------------------------
11,12 0 - 0 5 15 22 25 27 30 31 40 41 56 45 - 20 27261 34833
21,61& 1-5 - 1 7 28 44 50 55 53 56 55 52 42 34 - 31 42506 44320
62 6-9 - 2 10 51 111 137 159 149 152 149 139 130 100 - 83 111718 125784
---------------------------------------------------------------------------------------------------------------------------
0-9 - 3 22 94 177 212 241 232 239 244 232 228 179 - 134 181485 204937
------------------------------------------------------------------------------------------------------------------------------------
31,71& 0 - 0 0 1 1 3 3 3 3 4 3 3 2 - 2 2140 2105
72 1-5 - 0 3 26 51 78 85 89 99 93 84 68 11 - 43 58825 56450
6-9 - 1 11 37 85 140 180 196 222 217 208 152 25 - 90 121421 139780
---------------------------------------------------------------------------------------------------------------------------
0-9 - 1 14 64 137 221 268 288 324 314 295 223 38 - 135 182386 198335
------------------------------------------------------------------------------------------------------------------------------------
41&51 0 - 0 2 11 12 18 17 18 20 17 21 17 9 - 10 14158 13360
1-5 - 0 6 35 40 41 38 39 36 35 28 23 10 - 24 31920 29074
6-9 - 0 5 18 23 28 23 25 20 19 18 12 9 - 14 19191 20158
---------------------------------------------------------------------------------------------------------------------------
0-9 - 0 13 64 75 87 78 82 76 71 67 52 28 - 48 65269 62592
------------------------------------------------------------------------------------------------------------------------------------
11-72 0 - 0 7 27 35 46 47 51 54 61 65 76 56 - 32 43559 50298
1-5 - 1 16 89 135 169 178 181 191 183 164 133 55 - 98 133251 129845
6-9 - 3 26 106 219 305 362 370 394 385 365 294 134 - 187 252330 285721
---------------------------------------------------------------------------------------------------------------------------
0-9 - 4 49 222 389 520 587 602 639 629 594 503 245 - 317 429140 465864
------------------------------------------------------------------------------------------------------------------------------------
81 X - 0 3 38 84 53 23 12 10 11 8 7 4 - 22 29417 31542
82 X - 0 1 7 7 7 5 5 3 3 6 4 3 - 4 5024 4294
81&82 X - 0 4 45 91 60 28 17 13 14 14 11 7 - 26 34441 35836
------------------------------------------------------------------------------------------------------------------------------------
11-82 X - 4 53 267 480 580 615 619 652 643 608 514 252 - 343 463581 501701
------------------------------------------------------------------------------------------------------------------------------------
91-99 X 1000 996 947 733 520 420 385 381 348 357 392 486 748 1000 657 889477 957022
------------------------------------------------------------------------------------------------------------------------------------
11-99 X# 1000 999 1001 1002 1000 1000 1002 999 999 999 1002 1000 1001 1000 10011353058 1458723
------------------------------------------------------------------------------------------------------------------------------------
PDAYS.DIST# 105 112 114 108 97 87 78 71 57 48 35 28 60 0 1000 XXX XXX
------------------------------------------------------------------------------------------------------------------------------------
ES.PDAYS000 142491 150976 154920 145957 131009 117435 104992 96700 76935 64934 47774 38189 80550 1961353058 XXX XXX
------------------------------------------------------------------------------------------------------------------------------------
SAMP.PDAYS. 146279 157668 164738 156562 140872 126508 112623 105392 85603 73521 55447 42336 90993 1821458723 XXX XXX
------------------------------------------------------------------------------------------------------------------------------------
#: THE DIFFERENCE OF ENTRY IN COL.3..17 FROM 1000 UNDER STATUS 11-99/ COL.17 UNDER PER 1000 DISTRIBUTION FROM 1000 (ROUNDING OFF ERROR)
IS ADJUSTED WITH THE ROW/ COLUMN HAVING MAXIMUM ENTRY MAKING RESPECTIVE ROW-SUM/ COL-SUM EQUALS TO 1000

70
NATIONAL SAMPLE SURVEY, 50TH ROUND : JULY 1993--JUNE 1994
TABLE (2): PER 1000 DISTRIBUTION OF PERSONS OF AGE 5 YEARS AND ABOVE BY GENERAL
EDUCATION CATEGORY FOR EACH PRINCIPAL USUAL ACTIVITY
RURAL ALL-INDIA MALE
------------------------------------------------------------------------------------------------------------------------------------
USUAL ACTIVITY GENERAL EDUCATION
-------------- ------------------------------------------------------------------------------------------- ESTIMATED SAMPLE
STATUS INDUSTRY NOT LIT.& UPTO HIGHER GRADUATE & NOT SECONDARY & PERSONS PERSONS
LITERATE PRIMARY MIDDLE SECONDARY SECONDARY ABOVE RECORDED ABOVE ALL (00)
------------------------------------------------------------------------------------------------------------------------------------
(1) (2) (3) (4) (5) (6) (7) (8) (9) (10) (11)# (12) (13)
------------------------------------------------------------------------------------------------------------------------------------
11,12,21 0 430 303 145 73 32 17 0 122 1001 714778 48010
1-5 381 365 147 69 24 14 0 107 1001 67516 3761
6-9 277 345 192 103 46 36 1 185 1001 136352 8585
------------------------------------------------------------------------------------------------------------------------
0-9 404 314 152 77 33 20 0 130 1001 918646 60356
------------------------------------------------------------------------------------------------------------------------------------
31 0 656 219 68 35 14 8 - 57 999 22075 1385
1-5 198 289 196 190 56 71 0 317 1000 34381 1929
6-9 87 174 174 224 140 201 0 565 1000 84865 6872
------------------------------------------------------------------------------------------------------------------------
0-9 203 209 163 186 100 139 0 425 1000 141321 10186
------------------------------------------------------------------------------------------------------------------------------------
41&51 0 627 264 76 24 7 2 0 33 1000 450883 20985
1-5 445 361 133 50 10 1 0 61 999 80727 4071
6-9 398 355 162 53 26 6 - 85 1000 27021 1806
------------------------------------------------------------------------------------------------------------------------
0-9 589 283 89 29 8 2 0 39 1000 558631 26862
------------------------------------------------------------------------------------------------------------------------------------
11-51 0 510 287 117 53 22 11 0 86 1000 1187736 70380
1-5 375 349 150 83 24 19 0 126 1000 182624 9761
6-9 225 289 182 139 76 89 0 304 999 248238 17263
------------------------------------------------------------------------------------------------------------------------
0-9 451 294 131 70 30 24 0 124 1000 1618598 97404
------------------------------------------------------------------------------------------------------------------------------------
81 X 73 117 206 253 166 185 0 604 999 32374 2255
11-81 X 445 290 132 73 33 27 0 133 998 1650972 99659
91 X 56 700 144 61 33 5 1 99 1000 698185 45806
92 X 627 237 80 42 8 6 - 56 1000 7942 529
93 X 781 147 42 17 7 6 - 30 1000 6717 493
94-97 X 814 137 31 12 3 3 0 18 999 257593 14154
------------------------------------------------------------------------------------------------------------------------------------
91-97 X 267 543 113 48 24 4 1 76 1000 970546 60990
------------------------------------------------------------------------------------------------------------------------------------
11-97 X 378 384 125 64 30 19 0 113 1000 2621518 160649
------------------------------------------------------------------------------------------------------------------------------------
PER 1000 378 384 125 64 30 19 0 113 1000 XXX XXX
DISTRIBUTION
------------------------------------------------------------------------------------------------------------------------------------
ESTD. PERS.(00) 990765 1006447 328240 167434 78313 49140 1179 294887 2621518 XXX XXX
------------------------------------------------------------------------------------------------------------------------------------
SAMPLE PERSON 52668 62263 22462 12683 6139 4364 70 23186 160649 XXX XXX
------------------------------------------------------------------------------------------------------------------------------------
#: THE DIFFERENCE OF ENTRY IN COL.11 FROM 1000(ROUNDING OFF ERROR) IS ADJUSTED
WITH THE COLUMN HAVING MAXIMUM ENTRY MAKING RESPECTIVE COL-SUM EQUALS TO 1000

71
NATIONAL SAMPLE SURVEY, 50TH ROUND : JULY 1993--JUNE 1994
TABLE (2): PER 1000 DISTRIBUTION OF PERSONS OF AGE 5 YEARS AND ABOVE BY GENERAL
EDUCATION CATEGORY FOR EACH PRINCIPAL USUAL ACTIVITY
RURAL
ALL-INDIA FEMALE
------------------------------------------------------------------------------------------------------------------------------------
USUAL ACTIVITY GENERAL EDUCATION
-------------- ------------------------------------------------------------------------------------------- ESTIMATED SAMPLE
STATUS INDUSTRY NOT LIT.& UPTO HIGHER GRADUATE & NOT SECONDARY & PERSONS PERSONS
LITERATE PRIMARY MIDDLE SECONDARY SECONDARY ABOVE RECORDED ABOVE ALL (00)
------------------------------------------------------------------------------------------------------------------------------------
(1) (2) (3) (4) (5) (6) (7) (8) (9) (10) (11)# (12) (13)
------------------------------------------------------------------------------------------------------------------------------------
11,12,21 0 800 148 38 11 2 1 0 14 999 283353 19193
1-5 657 252 65 19 5 1 1 25 1000 30144 1483
6-9 650 208 73 40 15 10 4 65 1000 24592 1380
------------------------------------------------------------------------------------------------------------------------
0-9 775 162 43 14 3 2 1 19 1001 338089 22056
------------------------------------------------------------------------------------------------------------------------------------
31 0 857 93 39 5 6 - - 11 1000 4028 229
1-5 488 224 112 64 63 49 - 176 999 5635 263
6-9 257 130 117 235 121 140 - 496 999 14364 1267
------------------------------------------------------------------------------------------------------------------------
0-9 412 146 103 156 88 95 - 339 999 24027 1759
------------------------------------------------------------------------------------------------------------------------------------
41&51 0 865 109 21 4 1 - - 5 1001 273160 11814
1-5 747 190 46 13 4 - - 17 1001 23648 1077
6-9 736 154 62 12 2 10 24 24 1001 5034 370
------------------------------------------------------------------------------------------------------------------------
0-9 855 116 23 5 1 0 0 6 999 301842 13261
------------------------------------------------------------------------------------------------------------------------------------
11-51 0 832 128 30 8 2 0 0 10 1000 560541 31236
1-5 676 225 62 21 10 5 1 36 1001 59427 2823
6-9 532 176 86 100 48 53 5 201 1000 43990 3017
------------------------------------------------------------------------------------------------------------------------
0-9 800 140 36 15 5 4 0 24 998 663958 37076
------------------------------------------------------------------------------------------------------------------------------------
81 X 187 96 141 261 153 162 - 576 1000 9399 736
11-81 X 789 140 38 19 7 7 0 33 1001 673357 37812
91 X 71 761 112 40 14 2 0 56 998 427220 30156
92 X 623 219 97 43 13 5 0 61 1000 533165 34028
93 X 737 172 57 24 7 3 0 34 998 550064 33192
94-97 X 928 61 8 2 0 0 1 2 999 292133 16371
------------------------------------------------------------------------------------------------------------------------------------
91-97 X 577 307 74 30 9 3 0 42 999 1802582 113747
------------------------------------------------------------------------------------------------------------------------------------
11-97 X 634 262 64 27 9 4 0 40 1000 2475939 151559
------------------------------------------------------------------------------------------------------------------------------------
PER 1000 DISTRN. 634 262 64 27 9 4 0 40 1000 XXX XXX
------------------------------------------------------------------------------------------------------------------------------------
ESTD. PERS.(00) 1569841 648076 158711 66417 21938 9850 1106 98205 2475939 XXX XXX
------------------------------------------------------------------------------------------------------------------------------------
SAMPLE PERSON 85927 44090 12567 5821 2055 1028 71 8904 151559 XXX XXX
------------------------------------------------------------------------------------------------------------------------------------
#: THE DIFFERENCE OF ENTRY IN COL.11 FROM 1000(ROUNDING OFF ERROR) IS ADJUSTED
WITH THE COLUMN HAVING MAXIMUM ENTRY MAKING RESPECTIVE COL-SUM EQUALS TO 1000

72
NATIONAL SAMPLE SURVEY, 50TH ROUND : JULY 1993--JUNE 1994
TABLE (2): PER 1000 DISTRIBUTION OF PERSONS OF AGE 5 YEARS AND ABOVE BY GENERAL
EDUCATION CATEGORY FOR EACH PRINCIPAL USUAL ACTIVITY
RURAL
ALL-INDIA PERSONS
------------------------------------------------------------------------------------------------------------------------------------
USUAL ACTIVITY GENERAL EDUCATION
-------------- ------------------------------------------------------------------------------------------- ESTIMATED SAMPLE
STATUS INDUSTRY NOT LIT.& UPTO HIGHER GRADUATE & NOT SECONDARY & PERSONS PERSONS
LITERATE PRIMARY MIDDLE SECONDARY SECONDARY ABOVE RECORDED ABOVE ALL (00)
------------------------------------------------------------------------------------------------------------------------------------
(1) (2) (3) (4) (5) (6) (7) (8) (9) (10) (11)# (12) (13)
------------------------------------------------------------------------------------------------------------------------------------
11,12,21 0 537 259 114 55 23 12 0 90 999 998132 67203
1-5 467 330 122 53 18 10 0 81 1000 97660 5244
6-9 334 325 174 93 41 32 1 166 1000 160944 9965
------------------------------------------------------------------------------------------------------------------------
0-9 505 273 122 60 25 15 0 100 999 1256736 82412
------------------------------------------------------------------------------------------------------------------------------------
31 0 687 199 64 30 13 7 - 50 999 26103 1614
1-5 239 280 184 172 57 68 0 297 1000 40016 2192
6-9 111 168 166 225 138 192 0 555 1000 99229 8139
------------------------------------------------------------------------------------------------------------------------
0-9 233 200 154 182 98 133 0 413 1000 165348 11945
------------------------------------------------------------------------------------------------------------------------------------
41&51 0 718 206 55 16 4 1 0 21 999 724042 32799
1-5 513 323 113 42 9 0 0 51 1000 104376 5148
6-9 452 323 146 47 22 6 4 75 999 32055 2176
------------------------------------------------------------------------------------------------------------------------
0-9 682 224 66 21 6 1 0 28 1000 860473 40123
------------------------------------------------------------------------------------------------------------------------------------
11-51 0 613 236 89 39 15 8 0 62 1000 1748277 101616
1-5 450 318 129 68 20 15 0 103 999 242052 12584
6-9 271 271 168 133 72 84 1 289 1001 292228 20280
------------------------------------------------------------------------------------------------------------------------
0-9 553 249 103 54 23 18 0 95 999 2282557 134480
------------------------------------------------------------------------------------------------------------------------------------
81 X 99 112 192 254 163 180 0 597 1000 41773 2991
11-81 X 544 247 105 57 26 21 0 104 1000 2324330 137471
91 X 62 722 132 53 26 4 1 83 1000 1125404 75962
92 X 624 220 96 43 12 5 0 60 1000 541107 34557
93 X 737 172 57 24 7 3 0 34 999 556781 33685
94-97 X 873 97 19 7 2 1 1 10 1001 549726 30525
------------------------------------------------------------------------------------------------------------------------------------
91-97 X 466 390 88 36 15 4 1 55 1002 2773127 174737
------------------------------------------------------------------------------------------------------------------------------------
11-97 X 501 325 96 46 20 12 0 78 1001 5097457 312208
------------------------------------------------------------------------------------------------------------------------------------
PER 1000 501 325 96 46 20 12 0 78 1001 XXX XXX
DISTRIBUTION
------------------------------------------------------------------------------------------------------------------------------------
ESTD. PERS.(00) 2560607 1654524 486951 233851 100251 58989 2284 393091 5097457 XXX XXX
------------------------------------------------------------------------------------------------------------------------------------
SAMPLE PERSON 138595 106353 35029 18504 8194 5392 141 32090 312208 XXX XXX
------------------------------------------------------------------------------------------------------------------------------------
#: THE DIFFERENCE OF ENTRY IN COL.11 FROM 1000(ROUNDING OFF ERROR) IS ADJUSTED
WITH THE COLUMN HAVING MAXIMUM ENTRY MAKING RESPECTIVE COL-SUM EQUALS TO 1000

73
NATIONAL SAMPLE SURVEY, 50TH ROUND : JULY 1993--JUNE 1994
TABLE (2): PER 1000 DISTRIBUTION OF PERSONS OF AGE 5 YEARS AND ABOVE BY GENERAL
EDUCATION CATEGORY FOR EACH PRINCIPAL USUAL ACTIVITY
URBAN
ALL-INDIA MALE
------------------------------------------------------------------------------------------------------------------------------------
USUAL ACTIVITY GENERAL EDUCATION
-------------- ------------------------------------------------------------------------------------------- ESTIMATED SAMPLE
STATUS INDUSTRY NOT LIT.& UPTO HIGHER GRADUATE & NOT SECONDARY & PERSONS PERSONS
LITERATE PRIMARY MIDDLE SECONDARY SECONDARY ABOVE RECORDED ABOVE ALL (00)
------------------------------------------------------------------------------------------------------------------------------------
(1) (2) (3) (4) (5) (6) (7) (8) (9) (10) (11)# (12) (13)
------------------------------------------------------------------------------------------------------------------------------------
11,12,21 0 335 300 157 119 40 48 1 207 999 26600 3506
1-5 187 326 171 134 74 108 0 316 999 48663 5044
6-9 184 266 185 160 86 119 0 365 999 138976 15613
------------------------------------------------------------------------------------------------------------------------
0-9 203 283 179 149 78 108 0 335 1000 214239 24163
------------------------------------------------------------------------------------------------------------------------------------
31 0 351 363 94 58 44 90 - 192 1001 2175 231
1-5 121 248 183 196 106 145 1 447 1000 81271 7697
6-9 79 176 163 185 125 272 0 582 1001 138746 15915
------------------------------------------------------------------------------------------------------------------------
0-9 97 204 169 188 118 224 0 530 1000 222192 23843
------------------------------------------------------------------------------------------------------------------------------------
41&51 0 546 327 98 22 3 2 2 27 1001 16493 1596
1-5 366 384 167 67 10 6 - 83 1001 42811 3926
6-9 350 358 182 75 25 10 - 110 1000 25213 2599
------------------------------------------------------------------------------------------------------------------------
0-9 397 365 158 61 13 6 0 80 999 84517 8121
------------------------------------------------------------------------------------------------------------------------------------
11-51 0 412 313 133 81 27 33 1 141 1001 45268 5333
1-5 201 303 175 147 74 100 0 321 1001 172745 16667
6-9 150 232 175 164 99 180 0 443 1000 302935 34127
------------------------------------------------------------------------------------------------------------------------
0-9 189 264 171 151 84 141 0 376 999 520948 56127
------------------------------------------------------------------------------------------------------------------------------------
81 X 45 151 218 217 167 202 - 586 1000 24795 2689
11-81 X 183 258 173 154 88 144 0 386 1000 545743 58816
91 X 37 600 157 97 82 26 1 205 1000 286777 31212
92 X 376 311 153 83 59 18 - 160 1001 2878 357
93 X 450 190 173 98 57 32 - 187 1000 1175 137
94-97 X 458 231 88 111 40 71 1 222 1000 71431 7557
------------------------------------------------------------------------------------------------------------------------------------
91-97 X 124 525 143 99 73 35 1 207 999 362261 39263
------------------------------------------------------------------------------------------------------------------------------------
11-97 X 159 365 161 132 82 100 1 314 999 908004 98079
------------------------------------------------------------------------------------------------------------------------------------
PER 1000 159 365 161 132 82 100 1 314 999 XXX XXX
DISTRIBUTION
------------------------------------------------------------------------------------------------------------------------------------
ESTD. PERS.(00) 144653 330376 146576 120222 74596 90993 588 285811 908004 XXX XXX
------------------------------------------------------------------------------------------------------------------------------------
SAMPLE PERSON 13994 34616 16336 13535 8536 10991 71 33062 98079 XXX XXX
------------------------------------------------------------------------------------------------------------------------------------
#: THE DIFFERENCE OF ENTRY IN COL.11 FROM 1000(ROUNDING OFF ERROR) IS ADJUSTED
WITH THE COLUMN HAVING MAXIMUM ENTRY MAKING RESPECTIVE COL-SUM EQUALS TO 1000

74
NATIONAL SAMPLE SURVEY, 50TH ROUND : JULY 1993--JUNE 1994
TABLE (2): PER 1000 DISTRIBUTION OF PERSONS OF AGE 5 YEARS AND ABOVE BY GENERAL
EDUCATION CATEGORY FOR EACH PRINCIPAL USUAL ACTIVITY
URBAN
ALL-INDIA FEMALE
------------------------------------------------------------------------------------------------------------------------------------
USUAL ACTIVITY GENERAL EDUCATION
-------------- ------------------------------------------------------------------------------------------- ESTIMATED SAMPLE
STATUS INDUSTRY NOT LIT.& UPTO HIGHER GRADUATE & NOT SECONDARY & PERSONS PERSONS
LITERATE PRIMARY MIDDLE SECONDARY SECONDARY ABOVE RECORDED ABOVE ALL (00)
------------------------------------------------------------------------------------------------------------------------------------
(1) (2) (3) (4) (5) (6) (7) (8) (9) (10) (11)# (12) (13)
------------------------------------------------------------------------------------------------------------------------------------
11,12,21 0 714 188 65 20 6 5 2 31 1000 9359 1302
1-5 505 311 100 39 23 20 2 82 1001 14044 1460
6-9 469 228 106 73 39 83 2 195 1000 17265 2075
------------------------------------------------------------------------------------------------------------------------
0-9 538 248 94 49 26 43 2 118 1000 40668 4837
------------------------------------------------------------------------------------------------------------------------------------
31 0 572 371 25 4 2 26 - 32 999 343 37
1-5 298 210 144 139 61 148 - 348 1000 6433 657
6-9 219 119 59 153 124 326 0 603 1000 33172 3995
------------------------------------------------------------------------------------------------------------------------
0-9 234 136 73 150 112 295 0 557 1000 39948 4689
------------------------------------------------------------------------------------------------------------------------------------
41&51 0 820 142 28 8 0 2 - 10 1001 11839 1023
1-5 683 233 59 22 1 1 1 24 1000 12471 1132
6-9 727 212 37 12 5 4 3 21 1001 6446 687
------------------------------------------------------------------------------------------------------------------------
0-9 747 193 42 14 1 2 1 17 999 30756 2842
------------------------------------------------------------------------------------------------------------------------------------
11-51 0 769 166 44 13 3 4 1 20 1001 21541 2362
1-5 533 262 93 52 22 37 1 111 1000 32948 3249
6-9 352 163 71 113 84 216 1 413 1000 56883 6757
------------------------------------------------------------------------------------------------------------------------
0-9 486 193 72 76 50 122 1 248 1000 111372 12368
------------------------------------------------------------------------------------------------------------------------------------
81 X 29 91 155 213 161 351 - 725 1000 9972 1157
11-81 X 449 184 79 87 59 141 1 287 1000 121344 13525
91 X 37 627 154 90 70 20 2 180 999 226436 25040
92 X 360 261 155 116 49 58 1 223 1000 320303 34101
93 X 399 224 130 113 55 79 0 247 1000 91495 10163
94-97 X 753 172 35 23 7 8 2 38 1001 61800 6584
------------------------------------------------------------------------------------------------------------------------------------
91-97 X 296 366 141 99 53 44 1 196 1001 700036 75889
------------------------------------------------------------------------------------------------------------------------------------
11-97 X 318 339 132 97 54 59 1 210 1001 821380 89414
------------------------------------------------------------------------------------------------------------------------------------
PER 1000 318 339 132 97 54 59 1 210 1001 XXX XXX
DISTRIBUTION
------------------------------------------------------------------------------------------------------------------------------------
ESTD. PERS.(00) 261350 278934 108230 79732 44205 48108 821 172045 821380 XXX XXX
------------------------------------------------------------------------------------------------------------------------------------
SAMPLE PERSON 25757 30356 12575 9373 5313 5933 107 20619 89414 XXX XXX
------------------------------------------------------------------------------------------------------------------------------------
#: THE DIFFERENCE OF ENTRY IN COL.11 FROM 1000(ROUNDING OFF ERROR) IS ADJUSTED
WITH THE COLUMN HAVING MAXIMUM ENTRY MAKING RESPECTIVE COL-SUM EQUALS TO 1000

75
NATIONAL SAMPLE SURVEY, 50TH ROUND : JULY 1993--JUNE 1994
TABLE (2): PER 1000 DISTRIBUTION OF PERSONS OF AGE 5 YEARS AND ABOVE BY GENERAL
EDUCATION CATEGORY FOR EACH PRINCIPAL USUAL ACTIVITY
URBAN
ALL-INDIA PERSONS
------------------------------------------------------------------------------------------------------------------------------------
USUAL ACTIVITY GENERAL EDUCATION
-------------- ------------------------------------------------------------------------------------------- ESTIMATED SAMPLE
STATUS INDUSTRY NOT LIT.& UPTO HIGHER GRADUATE & NOT SECONDARY & PERSONS PERSONS
LITERATE PRIMARY MIDDLE SECONDARY SECONDARY ABOVE RECORDED ABOVE ALL (00)
------------------------------------------------------------------------------------------------------------------------------------
(1) (2) (3) (4) (5) (6) (7) (8) (9) (10) (11)# (12) (13)
------------------------------------------------------------------------------------------------------------------------------------
11,12,21 0 434 271 133 93 31 37 1 161 999 35959 4808
1-5 259 321 155 113 63 88 1 264 1001 62706 6504
6-9 215 261 177 151 81 115 0 347 1000 156241 17688
------------------------------------------------------------------------------------------------------------------------
0-9 257 278 165 133 70 97 0 300 999 254906 29000
------------------------------------------------------------------------------------------------------------------------------------
31 0 380 365 85 51 38 81 - 170 1001 2518 268
1-5 134 246 180 191 103 145 1 439 1000 87704 8354
6-9 106 165 143 179 125 282 0 586 1001 171918 19910
------------------------------------------------------------------------------------------------------------------------
0-9 118 194 155 182 117 234 0 533 1001 262140 28532
------------------------------------------------------------------------------------------------------------------------------------
41&51 0 661 250 68 16 2 2 1 20 1000 28332 2619
1-5 439 350 142 57 8 4 0 69 999 55282 5058
6-9 427 328 152 62 21 9 1 92 1000 31659 3286
------------------------------------------------------------------------------------------------------------------------
0-9 490 319 127 48 10 5 1 63 1000 115273 10963
------------------------------------------------------------------------------------------------------------------------------------
11-51 0 528 265 104 59 19 24 1 102 1000 66809 7695
1-5 254 298 162 131 65 90 0 286 999 205692 19916
6-9 182 221 158 156 97 186 0 439 1000 359818 40884
------------------------------------------------------------------------------------------------------------------------
0-9 242 250 154 138 78 138 0 354 1000 632319 68495
------------------------------------------------------------------------------------------------------------------------------------
81 X 40 134 200 216 165 245 - 626 999 34767 3846
11-81 X 231 245 156 142 83 143 0 368 999 667086 72341
91 X 37 611 156 94 77 24 1 195 1001 513214 56252
92 X 360 262 155 115 49 58 1 222 1000 323183 34458
93 X 400 224 130 113 55 78 0 246 1000 92669 10300
94-97 X 596 203 64 70 24 42 1 136 1000 133230 14141
------------------------------------------------------------------------------------------------------------------------------------
91-97 X 237 420 142 99 60 41 1 200 1000 1062298 115152
------------------------------------------------------------------------------------------------------------------------------------
11-97 X 235 352 147 116 69 80 1 265 1000 1729384 187493
------------------------------------------------------------------------------------------------------------------------------------
PER 1000 235 352 147 116 69 80 1 265 1000 XXX XXX
DISTRIBUTION
------------------------------------------------------------------------------------------------------------------------------------
ESTD. PERS.(00) 406003 609310 254806 199953 118801 139101 1410 457855 1729384 XXX XXX
------------------------------------------------------------------------------------------------------------------------------------
SAMPLE PERSON 39751 64972 28911 22908 13849 16924 178 53681 187493 XXX XXX
------------------------------------------------------------------------------------------------------------------------------------
#: THE DIFFERENCE OF ENTRY IN COL.11 FROM 1000(ROUNDING OFF ERROR) IS ADJUSTED
WITH THE COLUMN HAVING MAXIMUM ENTRY MAKING RESPECTIVE COL-SUM EQUALS TO 1000
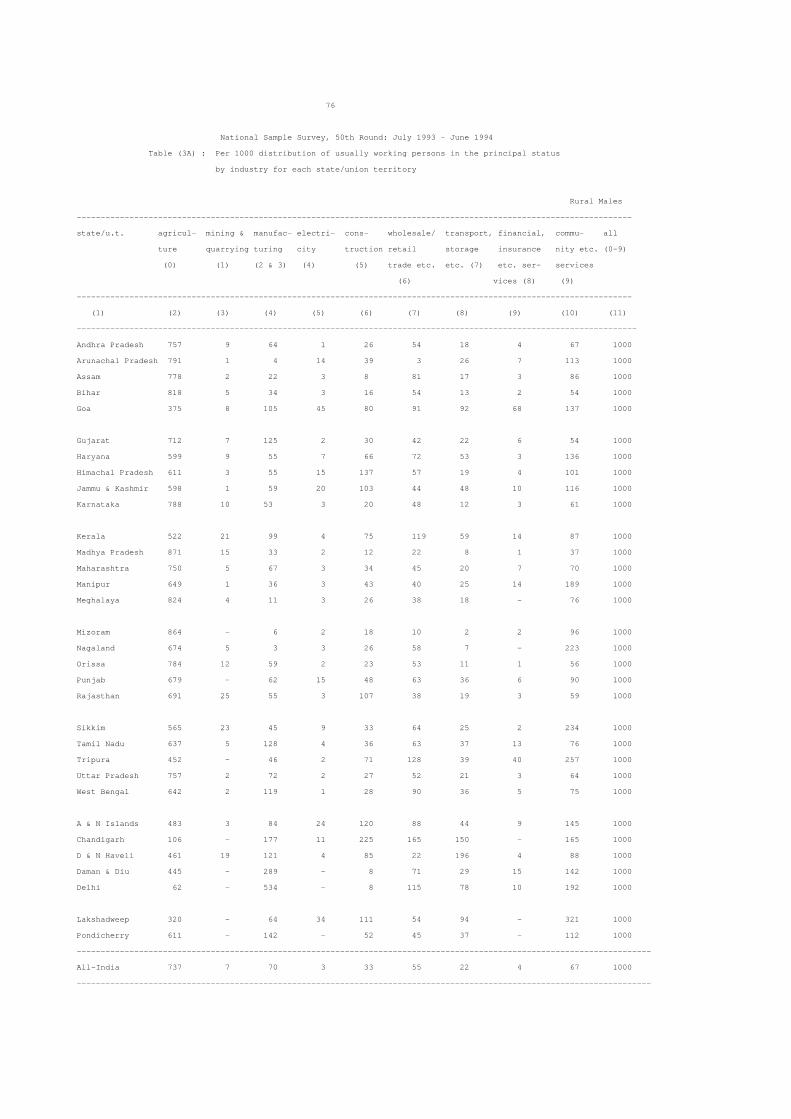
76
National Sample Survey, 50th Round: July 1993 - June 1994
Table (3A) : Per 1000 distribution of usually working persons in the principal status
by industry for each state/union territory
Rural Males
--------------------------------------------------------------------------------------------------------------------
state/u.t. agricul- mining & manufac- electri- cons- wholesale/ transport, financial, commu- all
ture quarrying turing city truction retail storage insurance nity etc. (0-9)
(0) (1) (2 & 3) (4) (5) trade etc. etc. (7) etc. ser- services
(6) vices (8) (9)
--------------------------------------------------------------------------------------------------------------------
(1) (2) (3) (4) (5) (6) (7) (8) (9) (10) (11)
---------------------------------------------------------------------------------------------------------------------
Andhra Pradesh 757 9 64 1 26 54 18 4 67 1000
Arunachal Pradesh 791 1 4 14 39 3 26 7 113 1000
Assam 778 2 22 3 8 81 17 3 86 1000
Bihar 818 5 34 3 16 54 13 2 54 1000
Goa 375 8 105 45 80 91 92 68 137 1000
Gujarat 712 7 125 2 30 42 22 6 54 1000
Haryana 599 9 55 7 66 72 53 3 136 1000
Himachal Pradesh 611 3 55 15 137 57 19 4 101 1000
Jammu & Kashmir 598 1 59 20 103 44 48 10 116 1000
Karnataka 788 10 53 3 20 48 12 3 61 1000
Kerala 522 21 99 4 75 119 59 14 87 1000
Madhya Pradesh 871 15 33 2 12 22 8 1 37 1000
Maharashtra 750 5 67 3 34 45 20 7 70 1000
Manipur 649 1 36 3 43 40 25 14 189 1000
Meghalaya 824 4 11 3 26 38 18 - 76 1000
Mizoram 864 - 6 2 18 10 2 2 96 1000
Nagaland 674 5 3 3 26 58 7 - 223 1000
Orissa 784 12 59 2 23 53 11 1 56 1000
Punjab 679 - 62 15 48 63 36 6 90 1000
Rajasthan 691 25 55 3 107 38 19 3 59 1000
Sikkim 565 23 45 9 33 64 25 2 234 1000
Tamil Nadu 637 5 128 4 36 63 37 13 76 1000
Tripura 452 - 46 2 71 128 39 40 257 1000
Uttar Pradesh 757 2 72 2 27 52 21 3 64 1000
West Bengal 642 2 119 1 28 90 36 5 75 1000
A & N Islands 483 3 84 24 120 88 44 9 145 1000
Chandigarh 106 - 177 11 225 165 150 - 165 1000
D & N Haveli 461 19 121 4 85 22 196 4 88 1000
Daman & Diu 445 - 289 - 8 71 29 15 142 1000
Delhi 62 - 534 - 8 115 78 10 192 1000
Lakshadweep 320 - 64 34 111 54 94 - 321 1000
Pondicherry 611 - 142 - 52 45 37 - 112 1000
------------------------------------------------------------------------------------------------------------------------
All-India 737 7 70 3 33 55 22 4 67 1000
------------------------------------------------------------------------------------------------------------------------

77
National Sample Survey, 50th Round: July 1993 - June 1994
Table (3A) : Per 1000 distribution of usually working persons in the principal status
by industry for each state/union territory
Rural Females
--------------------------------------------------------------------------------------------------------------------
state/u.t. agricul- mining & manufac- electri- cons- wholesale/ transport, financial, commu- all
ture quarrying turing city truction retail storage insurance nity etc. (0-9)
(0) (1) (2 & 3) (4) (5) trade etc. etc. (7) etc. ser- services
(6) vices (8) (9)
--------------------------------------------------------------------------------------------------------------------
(1) (2) (3) (4) (5) (6) (7) (8) (9) (10) (11)
---------------------------------------------------------------------------------------------------------------------
Andhra Pradesh 833 6 76 - 7 33 - 1 44 1000
Arunachal Pradesh 962 - 13 1 10 - 4 - 9 1000
Assam 846 - 31 - 3 22 2 2 95 1000
Bihar 908 4 43 - 2 22 - - 19 1000
Goa 517 - 136 - - 116 20 21 190 1000
Gujarat 882 2 54 1 20 8 - - 34 1000
Haryana 847 - 25 - 13 25 - - 90 1000
Himachal Pradesh 947 - 18 3 6 7 - - 19 1000
Jammu & Kashmir 863 4 20 - 29 - - - 78 1000
Karnataka 830 5 99 - 7 20 - 1 37 1000
Kerala 508 6 241 2 32 48 7 7 149 1000
Madhya Pradesh 933 9 36 - 4 8 - - 9 1000
Maharashtra 914 2 31 1 13 15 1 1 23 1000
Manipur 628 - 190 3 9 75 1 3 92 1000
Meghalaya 904 5 9 3 4 38 1 - 35 1000
Mizoram 931 - 4 - - 37 - - 28 1000
Nagaland 836 8 - - - 8 8 - 140 1000
Orissa 839 13 67 - 14 34 - - 33 1000
Punjab 645 - 63 12 - 27 - - 253 1000
Rajasthan 913 13 14 - 33 8 - - 19 1000
Sikkim 591 27 45 - 53 41 - - 243 1000
Tamil Nadu 775 2 137 - 8 26 1 3 49 1000
Tripura 527 - 84 - 65 21 7 - 297 1000
Uttar Pradesh 890 - 47 - 3 23 - 1 34 1000
West Bengal 449 4 358 - 28 40 6 1 115 1000
A & N Islands 620 9 5 - 69 61 7 219 160 1000
Chandigarh 374 - 81 - 59 3 - 482 202 1000
D & N Haveli 761 11 31 - 56 28 19 94 89 1000
Daman & Diu 647 - 286 - - 8 45 13 115 1000
Delhi 372 - 389 - - - - 238 195 1000
Lakshadweep 539 - 37 - 60 63 - 296 317 1000
Pondicherry 714 - 147 - - 36 - 104 110 1000
------------------------------------------------------------------------------------------------------------------------
All-India 847 5 75 - 11 22 1 39 59 1000
------------------------------------------------------------------------------------------------------------------------

78
National Sample Survey, 50th Round: July 1993 - June 1994
Table (3A) : Per 1000 distribution of usually working persons in the principal status
by industry for each state/union territory
Rural Persons
--------------------------------------------------------------------------------------------------------------------
state/u.t. agricul- mining & manufac- electri- cons- wholesale/ transport, financial, commu- all
ture quarrying turing city truction retail storage insurance nity etc. (0-9)
(0) (1) (2 & 3) (4) (5) trade etc. etc. (7) etc. ser- services
(6) vices (8) (9)
--------------------------------------------------------------------------------------------------------------------
(1) (2) (3) (4) (5) (6) (7) (8) (9) (10) (11)
---------------------------------------------------------------------------------------------------------------------
Andhra Pradesh 790 8 69 - 18 45 10 2 57 1000
Arunachal Pradesh 864 1 8 8 27 2 16 4 69 1000
Assam 786 2 23 3 8 73 15 3 87 1000
Bihar 835 5 36 3 13 48 11 2 48 1000
Goa 415 6 114 32 57 98 72 55 151 1000
Gujarat 761 5 104 2 27 32 16 4 48 1000
Haryana 624 8 52 6 60 67 48 3 131 1000
Himachal Pradesh 756 2 39 10 80 35 11 2 65 1000
Jammu & Kashmir 640 1 53 17 91 37 40 8 110 1000
Karnataka 803 8 69 2 16 38 8 2 53 1000
Kerala 518 17 134 3 64 102 46 12 102 1000
Madhya Pradesh 891 13 34 2 9 17 5 1 28 1000
Maharashtra 819 4 52 2 25 32 12 4 50 1000
Manipur 642 1 85 3 32 51 17 10 158 1000
Meghalaya 859 5 10 3 16 38 11 - 58 1000
Mizoram 886 - 6 2 12 20 1 1 72 1000
Nagaland 706 6 2 3 21 48 7 - 206 1000
Orissa 799 12 61 1 21 48 8 1 50 1000
Punjab 677 - 62 15 45 61 34 5 100 1000
Rajasthan 767 21 41 2 82 27 12 2 45 1000
Sikkim 569 24 45 7 37 60 21 2 236 1000
Tamil Nadu 694 4 132 3 24 48 22 9 65 1000
Tripura 463 - 51 2 70 111 34 40 263 1000
Uttar Pradesh 782 2 67 2 23 46 17 2 59 1000
West Bengal 617 2 151 1 28 84 32 5 80 1000
A & N Islands 511 4 68 19 110 82 37 9 160 1000
Chandigarh 137 - 166 10 206 147 132 - 202 1000
D & N Haveli 536 17 99 3 77 23 152 3 89 1000
Daman & Diu 487 - 289 - 6 58 32 12 115 1000
Delhi 84 - 525 - 8 107 72 9 195 1000
Lakshadweep 359 - 60 28 102 55 77 - 317 1000
Pondicherry 642 - 143 - 37 42 26 - 110 1000
------------------------------------------------------------------------------------------------------------------------
All-India 769 7 71 2 26 46 16 3 59 1000
------------------------------------------------------------------------------------------------------------------------

79
National Sample Survey, 50th Round: July 1993 - June 1994
Table (3A) : Per 1000 distribution of usually working persons in the principal status
by industry for each state/union territory
Urban Males
--------------------------------------------------------------------------------------------------------------------
state/u.t. agricul- mining & manufac- electri- cons- wholesale/ transport, financial, commu- all
ture quarrying turing city truction retail storage insurance nity etc. (0-9)
(0) (1) (2 & 3) (4) (5) trade etc. etc. (7) etc. ser- services
(6) vices (8) (9)
--------------------------------------------------------------------------------------------------------------------
(1) (2) (3) (4) (5) (6) (7) (8) (9) (10) (11)
---------------------------------------------------------------------------------------------------------------------
Andhra Pradesh 109 23 180 14 86 217 117 36 218 1000
Arunachal Pradesh 65 - 141 39 97 167 62 31 396 1000
Assam 27 66 94 7 31 325 89 21 340 1000
Bihar 107 42 160 35 46 242 93 27 271 1000
Goa 86 14 117 34 171 172 135 39 233 1000
Gujarat 47 6 382 9 69 199 95 25 210 1000
Haryana 56 3 263 8 80 225 93 24 247 1000
Himachal Pradesh 72 9 42 41 89 209 31 41 466 1000
Jammu & Kashmir 66 3 84 33 80 238 78 35 382 1000
Karnataka 122 31 216 18 73 195 80 46 220 1000
Kerala 209 5 165 6 102 209 107 36 161 1000
Madhya Pradesh 123 28 167 16 59 205 102 28 270 1000
Maharashtra 62 5 272 11 61 211 114 53 211 1000
Manipur 300 - 42 17 39 110 47 21 423 1000
Meghalaya 24 2 19 6 92 219 20 22 591 1000
Mizoram 356 1 47 3 66 104 19 1 402 1000
Nagaland 45 6 49 3 83 252 44 21 498 1000
Orissa 125 13 163 23 58 185 123 26 281 1000
Punjab 65 1 264 17 55 282 67 28 221 1000
Rajasthan 79 11 200 19 96 213 104 44 233 1000
Sikkim 10 - 97 - 78 380 12 12 409 1000
Tamil Nadu 80 4 279 9 85 216 105 37 183 1000
Tripura 56 7 90 4 26 212 75 42 483 1000
Uttar Pradesh 119 2 223 10 47 242 85 37 235 1000
West Bengal 43 24 305 12 63 206 99 42 205 1000
A & N Islands 57 5 95 56 137 141 168 16 323 1000
Chandigarh 6 - 249 6 101 201 41 62 333 1000
Dadra & N Haveli 136 - 293 - 80 203 42 37 201 1000
Daman & Diu 101 - 206 9 44 224 85 - 330 1000
Delhi 11 1 262 8 112 238 75 49 242 1000
Lakshadweep 418 - 23 37 97 47 72 11 290 1000
Pondicherry 128 - 193 31 123 180 40 34 269 1000
------------------------------------------------------------------------------------------------------------------------
All-India 87 13 236 12 70 219 98 38 226 1000
------------------------------------------------------------------------------------------------------------------------

80
National Sample Survey, 50th Round: July 1993 - June 1994
Table (3A) : Per 1000 distribution of usually working persons in the principal status
by industry for each state/union territory
Urban Femles
--------------------------------------------------------------------------------------------------------------------
state/u.t. agricul- mining & manufac- electri- cons- wholesale/ transport, financial, commu- all
ture quarrying turing city truction retail storage insurance nity etc. (0-9)
(0) (1) (2 & 3) (4) (5) trade etc. etc. (7) etc. ser- services
(6) vices (8) (9)
--------------------------------------------------------------------------------------------------------------------
(1) (2) (3) (4) (5) (6) (7) (8) (9) (10) (11)
---------------------------------------------------------------------------------------------------------------------
Andhra Pradesh 278 9 216 2 69 140 7 8 270 1000
Arunachal Pradesh 130 - 89 16 70 47 - 17 629 1000
Assam 13 39 104 - 11 40 - 20 772 1000
Bihar 130 22 184 71 76 137 12 6 429 1000
Goa 223 40 68 - - 156 56 44 412 1000
Gujarat 111 10 186 - 61 116 16 9 492 1000
Haryana 96 - 138 - 198 56 20 28 465 1000
Himachal Pradesh 330 - 19 21 35 57 - 17 520 1000
Jammu & Kashmir 145 6 45 - 4 49 18 26 687 1000
Karnataka 244 8 291 1 51 95 18 32 260 1000
Kerala 210 6 287 9 39 72 13 19 345 1000
Madhya Pradesh 274 8 189 2 43 92 22 28 336 1000
Maharashtra 175 10 177 4 44 130 30 46 385 1000
Manipur 191 - 297 - 5 260 3 18 226 1000
Meghalaya 21 - 34 5 50 332 10 8 539 1000
Mizoram 519 1 37 2 8 220 3 1 207 1000
Nagaland 106 - - 14 63 64 - - 752 1000
Orissa 204 41 201 12 55 50 16 4 417 1000
Punjab 60 - 67 13 16 107 7 34 696 1000
Rajasthan 315 - 182 7 56 66 24 10 341 1000
Sikkim - - - - 42 154 - - 798 1000
Tamil Nadu 191 2 349 1 56 118 5 13 264 1000
Tripura 36 10 34 - 41 24 - 19 836 1000
Uttar Pradesh 221 - 299 12 16 87 10 15 340 1000
West Bengal 37 12 266 - 19 53 22 21 571 1000
A & N Islands 27 20 7 79 110 99 19 68 568 1000
Chandigarh - - 29 - - 99 - - 872 1000
Dadra & N Haveli 473 9 152 24 - 57 - 27 247 1000
Daman & Diu 81 - 102 - - 352 - - 463 1000
Delhi 27 - 80 - 65 130 14 62 622 1000
Lakshadweep 480 - 61 - 118 - - - 336 1000
Pondicherry 170 - 261 - 82 118 10 42 316 1000
------------------------------------------------------------------------------------------------------------------------
All-India 193 7 236 3 49 107 15 22 366 1000
------------------------------------------------------------------------------------------------------------------------

81
National Sample Survey, 50th Round: July 1993 - June 1994
Table (3A) : Per 1000 distribution of usually working persons in the principal status
by industry for each state/union territory
Urban Persons
--------------------------------------------------------------------------------------------------------------------
state/u.t. agricul- mining & manufac- electri- cons- wholesale/ transport, financial, commu- all
ture quarrying turing city truction retail storage insurance nity etc. (0-9)
(0) (1) (2 & 3) (4) (5) trade etc. etc. (7) etc. ser- services
(6) vices (8) (9)
--------------------------------------------------------------------------------------------------------------------
(1) (2) (3) (4) (5) (6) (7) (8) (9) (10) (11)
---------------------------------------------------------------------------------------------------------------------
Andhra Pradesh 148 20 188 11 82 200 92 29 230 1000
Arunachal Pradesh 74 - 134 36 93 151 54 29 428 1000
Assam 26 63 95 6 29 290 78 21 392 1000
Bihar 109 40 163 39 49 232 85 25 287 1000
Goa 119 20 105 25 129 168 116 40 276 1000
Gujarat 56 6 316 8 68 187 84 23 250 1000
Haryana 60 3 251 7 92 208 85 24 269 1000
Himachal Pradesh 121 7 38 37 79 180 25 36 477 1000
Jammu & Kashmir 77 3 82 29 70 212 69 34 423 1000
Karnataka 147 26 231 14 68 175 67 43 228 1000
Kerala 209 5 193 7 87 178 85 32 203 1000
Madhya Pradesh 151 25 171 13 56 184 88 28 282 1000
Maharashtra 84 6 253 10 58 196 98 52 244 1000
Manipur 271 - 110 12 30 150 35 20 370 1000
Meghalaya 23 1 23 6 81 249 17 18 578 1000
Mizoram 411 1 43 3 46 144 14 1 337 1000
Nagaland 54 5 41 4 80 224 37 18 535 1000
Orissa 139 17 169 21 58 162 105 22 304 1000
Punjab 64 - 247 17 52 267 62 29 262 1000
Rajasthan 119 9 197 17 89 189 90 38 251 1000
Sikkim 9 - 82 - 73 347 10 10 466 1000
Tamil Nadu 110 3 298 7 78 190 79 31 204 1000
Tripura 52 7 80 3 29 178 61 38 547 1000
Uttar Pradesh 130 2 231 11 43 224 76 35 247 1000
West Bengal 42 23 300 10 57 184 88 39 257 1000
A & N Islands 53 7 83 59 133 135 147 23 358 1000
Chandigarh 5 - 211 5 84 183 34 52 427 1000
D & N Haveli 208 2 263 5 63 172 33 35 211 1000
Daman & Diu 97 - 184 7 35 250 67 - 358 1000
Delhi 12 1 242 8 107 225 68 51 286 1000
Lakshadweep 429 - 29 30 101 39 59 9 298 1000
Pondicherry 137 - 207 25 115 167 34 36 279 1000
------------------------------------------------------------------------------------------------------------------------
All-India 106 12 236 11 66 199 84 35 251 1000
------------------------------------------------------------------------------------------------------------------------

82
National Sample Survey, 50th Round: July 1993 - June 1994
Table (3B) : Per 1000 distribution of usually working persons in the principal and subsidiary
status taken together by industry for each state/union territory
Rural Males
--------------------------------------------------------------------------------------------------------------------
state/u.t. agricul- mining & manufac- electri- cons- wholesale/ transport, financial, commu- all
ture quarrying turing city truction retail storage insurance nity etc. (0-9)
(0) (1) (2 & 3) (4) (5) trade etc. etc. (7) etc. ser- services
(6) vices (8) (9)
--------------------------------------------------------------------------------------------------------------------
(1) (2) (3) (4) (5) (6) (7) (8) (9) (10) (11)
---------------------------------------------------------------------------------------------------------------------
Andhra Pradesh 756 9 65 1 26 54 19 4 67 1000
Arunachal Pradesh 792 1 4 14 39 3 25 7 112 1000
Assam 782 2 22 3 8 82 16 3 82 1000
Bihar 820 5 34 3 16 53 13 2 54 1000
Goa 384 8 107 43 76 87 88 71 136 1000
Gujarat 711 7 123 2 30 42 25 6 54 1000
Haryana 609 8 53 6 63 74 51 3 131 1000
Himachal Pradesh 658 2 48 13 119 52 16 4 88 1000
Jammu & Kashmir 613 1 57 20 99 43 46 9 112 1000
Karnataka 788 10 54 3 20 48 12 3 61 1000
Kerala 532 20 97 4 75 116 58 14 86 1000
Madhya Pradesh 872 15 32 2 12 22 7 1 36 1000
Maharashtra 753 5 66 3 34 45 19 7 69 1000
Manipur 660 1 37 3 41 38 24 13 183 1000
Meghalaya 825 4 11 3 25 38 18 - 75 1000
Mizoram 866 - 6 2 18 9 2 2 94 1000
Nagaland 685 5 2 3 25 57 6 - 215 1000
Orissa 787 11 57 2 22 52 11 1 56 1000
Punjab 681 - 62 15 47 63 36 6 90 1000
Rajasthan 696 25 53 3 105 37 19 3 58 1000
Sikkim 567 23 45 9 33 63 25 2 233 1000
Tamil Nadu 640 5 128 4 36 64 36 13 76 1000
Tripura 455 - 45 2 71 127 38 4 255 1000
Uttar Pradesh 763 2 70 2 26 51 21 2 63 1000
West Bengal 647 2 117 1 27 90 35 5 75 1000
A & N Islands 520 2 75 21 110 88 44 8 132 1000
Chandigarh 106 - 177 11 225 165 150 - 165 1000
D & N Haveli 463 19 120 4 84 22 194 4 87 1000
Daman & Diu 438 - 285 - 8 86 28 15 140 1000
Delhi 62 - 534 - 8 115 78 10 192 1000
Lakshadweep 320 - 64 34 111 54 94 - 321 1000
Pondicherry 603 - 140 - 52 57 37 - 111 1000
------------------------------------------------------------------------------------------------------------------------
All-India 741 7 70 3 32 55 22 4 66 1000
------------------------------------------------------------------------------------------------------------------------

83
National Sample Survey, 50th Round: July 1993 - June 1994
Table (3B) : Per 1000 distribution of usually working persons in the principal and subsidiary
status taken together by industry for each state/union territory
Rural Females
--------------------------------------------------------------------------------------------------------------------
state/u.t. agricul- mining & manufac- electri- cons- wholesale/ transport, financial, commu- all
ture quarrying turing city truction retail storage insurance nity etc. (0-9)
(0) (1) (2 & 3) (4) (5) trade etc. etc. (7) etc. ser- services
(6) vices (8) (9)
--------------------------------------------------------------------------------------------------------------------
(1) (2) (3) (4) (5) (6) (7) (8) (9) (10) (11)
---------------------------------------------------------------------------------------------------------------------
Andhra Pradesh 837 5 74 - 6 34 - 1 42 1000
Arunachal Pradesh 962 - 13 1 10 - 4 - 10 1000
Assam 832 - 87 - 1 19 1 1 58 1000
Bihar 919 3 39 - 2 19 - - 16 1000
Goa 591 - 122 - - 102 14 15 155 1000
Gujarat 906 1 41 1 14 10 - - 26 1000
Haryana 932 - 14 - 4 13 4 - 34 1000
Himachal Pradesh 955 - 16 2 4 6 - - 15 1000
Jammu & Kashmir 954 1 9 - 7 2 - - 25 1000
Karnataka 846 4 84 - 7 22 - 1 35 1000
Kerala 630 4 192 1 21 36 4 5 106 1000
Madhya Pradesh 939 8 32 1 4 7 1 - 9 1000
Maharashtra 912 2 30 - 12 18 1 1 24 1000
Manipur 603 - 262 2 6 56 - 4 66 1000
Meghalaya 905 5 9 3 4 39 1 - 34 1000
Mizoram 934 - 4 - - 35 - - 27 1000
Nagaland 893 14 - - - 16 4 - 74 1000
Orissa 850 10 75 - 11 29 - - 26 1000
Punjab 927 - 13 2 - 10 - - 47 1000
Rajasthan 930 10 14 - 25 7 - - 15 1000
Sikkim 657 22 43 - 42 43 - - 193 1000
Tamil Nadu 785 2 129 - 7 28 1 2 45 1000
Tripura 566 - 90 - 55 22 5 - 261 1000
Uttar Pradesh 900 - 47 - 2 21 - - 28 1000
West Bengal 589 2 300 - 16 27 3 1 63 1000
A & N Islands 813 6 18 - 34 35 3 32 88 1000
Chandigarh 342 - 74 - 54 3 - - 526 1000
D & N Haveli 877 20 12 - 33 12 7 - 39 1000
Daman & Diu 737 - 119 - - 5 29 - 26 1000
Delhi 517 - 299 - - - - - 183 1000
Lakshadweep 661 - 27 - 44 47 - - 218 1000
Pondicherry 740 - 134 - - 32 - - 94 1000
------------------------------------------------------------------------------------------------------------------------
All-India 862 4 70 1 9 21 1 1 33 1000
------------------------------------------------------------------------------------------------------------------------

84
National Sample Survey, 50th Round: July 1993 - June 1994
Table (3B) : Per 1000 distribution of usually working persons in the principal and subsidiary
status taken together by industry for each state/union territory
Rural Persons
--------------------------------------------------------------------------------------------------------------------
state/u.t. agricul- mining & manufac- electri- cons- wholesale/ transport, financial, commu- all
ture quarrying turing city truction retail storage insurance nity etc. (0-9)
(0) (1) (2 & 3) (4) (5) trade etc. etc. (7) etc. ser- services
(6) vices (8) (9)
--------------------------------------------------------------------------------------------------------------------
(1) (2) (3) (4) (5) (6) (7) (8) (9) (10) (11)
---------------------------------------------------------------------------------------------------------------------
Andhra Pradesh 793 7 69 - 17 45 10 2 56 1000
Arunachal Pradesh 864 1 8 8 26 2 16 4 68 1000
Assam 792 2 35 3 7 69 13 2 77 1000
Bihar 843 5 34 3 13 45 10 1 45 1000
Goa 454 5 112 28 50 92 63 52 143 1000
Gujarat 787 5 92 2 24 29 15 3 43 1000
Haryana 719 6 40 4 43 53 35 2 98 1000
Himachal Pradesh 803 1 33 8 63 30 8 2 53 1000
Jammu & Kashmir 758 1 36 11 60 25 27 5 75 1000
Karnataka 812 7 67 2 15 37 7 2 50 1000
Kerala 564 15 128 3 57 90 40 11 92 1000
Madhya Pradesh 898 12 32 2 9 16 5 - 25 1000
Maharashtra 826 4 50 2 24 33 11 4 48 1000
Manipur 638 1 123 3 28 45 15 9 137 1000
Meghalaya 860 5 10 3 16 38 11 - 58 1000
Mizoram 889 - 5 1 12 19 1 1 71 1000
Nagaland 749 8 2 2 18 45 6 - 171 1000
Orissa 809 11 64 1 18 44 7 1 46 1000
Punjab 747 - 49 12 35 49 26 4 79 1000
Rajasthan 799 18 36 2 70 24 10 2 39 1000
Sikkim 586 22 44 7 35 59 20 2 224 1000
Tamil Nadu 705 4 129 2 23 48 20 8 62 1000
Tripura 476 - 54 2 68 107 32 - 257 1000
Uttar Pradesh 800 2 64 1 20 43 15 2 53 1000
West Bengal 633 2 161 1 24 75 27 4 72 1000
A & N Islands 633 4 53 13 81 67 28 6 115 1000
Chandigarh 136 - 164 10 204 145 131 - 210 1000
D & N Haveli 660 19 69 2 60 17 106 2 64 1000
Daman & Diu 524 - 261 - 6 62 29 11 107 1000
Delhi 103 - 514 - 8 105 71 9 191 1000
Lakshadweep 399 - 56 26 96 52 72 - 297 1000
Pondicherry 647 - 138 - 35 49 25 - 105 1000
------------------------------------------------------------------------------------------------------------------------
All-India 784 6 70 2 24 43 14 3 54 1000
------------------------------------------------------------------------------------------------------------------------

85
National Sample Survey, 50th Round: July 1993 - June 1994
Table (3B) : Per 1000 distribution of usually working persons in the principal and subsidiary
status taken together by industry for each state/union territory
Urban Males
--------------------------------------------------------------------------------------------------------------------
state/u.t. agricul- mining & manufac- electri- cons- wholesale/ transport, financial, commu- all
ture quarrying turing city truction retail storage insurance nity etc. (0-9)
(0) (1) (2 & 3) (4) (5) trade etc. etc. (7) etc. ser- services
(6) vices (8) (9)
--------------------------------------------------------------------------------------------------------------------
(1) (2) (3) (4) (5) (6) (7) (8) (9) (10) (11)
---------------------------------------------------------------------------------------------------------------------
Andhra Pradesh 113 23 177 14 86 218 116 35 217 1000
Arunachal Pradesh 65 - 141 39 97 167 62 31 396 1000
Assam 29 65 95 7 31 325 87 21 340 1000
Bihar 110 41 160 35 46 243 92 27 270 1000
Goa 85 14 115 33 168 168 132 38 247 1000
Gujarat 49 6 337 9 69 199 95 25 210 1000
Haryana 60 3 261 8 80 226 92 23 247 1000
Himachal Pradesh 88 8 41 40 87 208 30 40 458 1000
Jammu & Kashmir 76 2 87 32 79 234 76 34 377 1000
Karnataka 125 31 216 19 72 197 79 45 218 1000
Kerala 223 5 163 6 100 206 104 35 159 1000
Madhya Pradesh 126 28 166 15 58 206 102 29 268 1000
Maharashtra 64 4 270 11 61 213 113 53 211 1000
Manipur 309 - 44 16 38 108 46 20 417 1000
Meghalaya 27 2 19 6 91 221 20 22 587 1000
Mizoram 354 2 47 3 70 105 19 1 399 1000
Nagaland 45 6 48 3 82 250 43 20 501 1000
Orissa 125 17 162 23 57 186 124 25 278 1000
Punjab 65 1 264 17 56 282 67 28 221 1000
Rajasthan 82 11 199 19 95 215 102 43 232 1000
Sikkim 10 - 96 5 77 378 12 12 407 1000
Tamil Nadu 83 4 279 9 84 216 104 37 183 1000
Tripura 58 6 89 4 26 211 74 44 482 1000
Uttar Pradesh 121 2 222 10 47 243 84 37 234 1000
West Bengal 44 24 302 12 61 206 98 42 212 1000
A & N Islands 82 4 89 58 147 135 159 15 309 1000
Chandigarh 6 - 246 6 100 211 40 62 328 1000
D & N Haveli 132 - 315 - 78 197 40 36 195 1000
Daman & Diu 101 - 206 9 44 224 85 - 330 1000
Delhi 11 1 262 8 112 238 75 49 242 1000
Lakshadweep 425 - 23 36 95 46 75 11 284 1000
Pondicherry 138 - 191 31 122 178 39 34 266 1000
------------------------------------------------------------------------------------------------------------------------
All-India 90 13 235 12 69 219 97 38 226 1000
------------------------------------------------------------------------------------------------------------------------

86
National Sample Survey, 50th Round: July 1993 - June 1994
Table (3B) : Per 1000 distribution of usually working persons in the principal and subsidiary
status taken together by industry for each state/union territory
Urban Females
--------------------------------------------------------------------------------------------------------------------
state/u.t. agricul- mining & manufac- electri- cons- wholesale/ transport, financial, commu- all
ture quarrying turing city truction retail storage insurance nity etc. (0-9)
(0) (1) (2 & 3) (4) (5) trade etc. etc. (7) etc. ser- services
(6) vices (8) (9)
--------------------------------------------------------------------------------------------------------------------
(1) (2) (3) (4) (5) (6) (7) (8) (9) (10) (11)
---------------------------------------------------------------------------------------------------------------------
Andhra Pradesh 308 9 227 2 59 139 6 7 243 1000
Arunachal Pradesh 167 - 86 15 67 45 - 16 602 1000
Assam 29 33 165 - 9 73 - 17 674 1000
Bihar 157 18 218 57 61 129 16 21 376 1000
Goa 221 35 64 - 38 145 48 37 410 1000
Gujarat 209 7 202 - 48 100 11 7 416 1000
Haryana 320 - 195 - 91 38 9 19 328 1000
Himachal Pradesh 444 - 16 15 39 41 - 12 432 1000
Jammu & Kashmir 403 4 53 - 2 53 11 17 457 1000
Karnataka 296 7 281 2 40 87 16 27 245 1000
Kerala 333 4 251 6 30 65 10 16 284 1000
Madhya Pradesh 301 7 188 2 38 93 20 25 323 1000
Maharashtra 191 8 178 3 38 137 24 39 382 1000
Manipur 261 - 342 - 3 195 2 26 170 1000
Meghalaya 39 - 33 4 48 339 10 8 518 1000
Mizoram 519 1 40 1 8 224 3 1 201 1000
Nagaland 154 - - 13 58 59 - - 716 1000
Orissa 277 36 182 9 55 76 12 3 349 1000
Punjab 276 - 102 8 10 82 4 21 495 1000
Rajasthan 426 - 173 4 43 50 16 7 281 1000
Sikkim - - - - 39 224 - - 732 1000
Tamil Nadu 217 1 352 1 50 114 5 11 248 1000
Tripura 66 9 81 - 37 21 - 17 768 1000
Uttar Pradesh 304 - 313 9 12 71 7 10 275 1000
West Bengal 86 9 305 - 15 47 19 18 501 1000
A & N Islands 365 11 12 57 63 88 11 39 351 1000
Chandigarh - - 28 - - 97 - 16 858 1000
D & N Haveli 598 6 159 15 - 37 - 17 160 1000
Daman & Diu 81 - 102 - - 352 - - 463 1000
Delhi 25 - 101 - 63 130 13 60 608 1000
Lakshadweep 525 - 55 - 107 - - - 306 1000
Pondicherry 213 - 247 - 81 115 7 39 296 1000
------------------------------------------------------------------------------------------------------------------------
All-India 247 6 241 3 41 100 13 19 331 1000
------------------------------------------------------------------------------------------------------------------------

87
National Sample Survey, 50th Round: July 1993 - June 1994
Table (3B) : Per 1000 distribution of usually working persons in the principal and subsidiary
status taken together by industry for each state/union territory
Urban Persons
--------------------------------------------------------------------------------------------------------------------
state/u.t. agricul- mining & manufac- electri- cons- wholesale/ transport, financial, commu- all
ture quarrying turing city truction retail storage insurance nity etc. (0-9)
(0) (1) (2 & 3) (4) (5) trade etc. etc. (7) etc. ser- services
(6) vices (8) (9)
--------------------------------------------------------------------------------------------------------------------
(1) (2) (3) (4) (5) (6) (7) (8) (9) (10) (11)
---------------------------------------------------------------------------------------------------------------------
Andhra Pradesh 164 19 191 11 79 198 87 28 224 1000
Arunachal Pradesh 79 - 133 36 93 150 53 29 425 1000
Assam 30 61 104 6 28 290 75 20 386 1000
Bihar 115 38 167 37 47 230 83 26 282 1000
Goa 121 19 101 24 133 162 110 38 291 1000
Gujarat 80 6 310 7 65 180 79 22 250 1000
Haryana 111 2 249 6 82 189 76 22 263 1000
Himachal Pradesh 175 6 35 34 75 168 23 33 452 1000
Jammu & Kashmir 140 3 80 26 64 199 64 31 393 1000
Karnataka 166 25 231 15 64 170 64 41 224 1000
Kerala 253 5 188 6 80 167 78 30 193 1000
Madhya Pradesh 163 24 170 13 54 183 85 28 279 1000
Maharashtra 93 5 249 9 56 196 93 50 249 1000
Manipur 293 - 144 11 26 137 31 22 333 1000
Meghalaya 30 1 22 5 80 252 17 18 569 1000
Mizoram 410 2 44 3 48 146 13 1 331 1000
Nagaland 62 5 41 4 78 220 37 17 535 1000
Orissa 157 21 166 20 57 163 100 21 293 1000
Punjab 93 - 242 16 50 256 59 27 257 1000
Rajasthan 161 9 194 16 83 178 83 35 243 1000
Sikkim 9 - 81 4 71 354 10 10 458 1000
Tamil Nadu 122 3 299 7 75 186 76 30 202 1000
Tripura 60 7 87 3 28 173 60 39 538 1000
Uttar Pradesh 149 1 236 10 41 217 72 33 240 1000
West Bengal 51 21 302 10 53 177 83 37 265 1000
A & N Islands 142 6 72 58 129 125 128 20 318 1000
Chandigarh 5 - 208 5 82 191 33 54 421 1000
D & N Haveli 266 2 270 4 56 151 29 31 185 1000
Daman & Diu 97 - 184 7 35 250 67 - 358 1000
Delhi 12 1 143 7 106 225 68 51 286 1000
Lakshadweep 444 - 28 29 97 38 61 9 289 1000
Pondicherry 158 - 205 23 111 162 31 35 274 1000
------------------------------------------------------------------------------------------------------------------------
All-India 123 12 236 10 63 194 79 34 248 1000
------------------------------------------------------------------------------------------------------------------------