key words - national library of serbia · ereign ratings across five agencies, and report that...
TRANSCRIPT

PANOECONOMICUS, 2018, Vol. 65, Issue 1, pp. 95-115 Received: 11 March 2015; Accepted: 24 October 2015.
UDC 336.774.3 ”1994/2014”DOI: https://doi.org/10.2298/PAN150311002S
Original scientific paper
Hami Saka
Istanbul University, Department of Economics, Istanbul
Mehmet Orhan Corresponding author
International Burch University, Department of International Business, Sarajevo
Are Sovereign Ratings by CRAs Consistent? Summary: This study is an attempt to compare and contrast the credit ratingsgranted by prominent agencies, the so-called Big Three namely S&P, Moody’s and Fitch, that dominate the market. The sovereign ratings are proven to moti-vate the CDS figures of countries empirically, and low ratings are known toincrease the interest paid to liabilities by these countries. We employ the histor-ical data over 1994-2014 on the sovereign ratings of 117 countries to test forwhether the ratings assigned by CRAs are significantly different or not, with thehelp of paired t and ANOVA tests. Hypothesis test results reveal that suchdifferences are significant for many countries and country groups, suggestingthat the ratings by CRAs are not consistent with each other. This is true forBRIC, OECD, and emerging market countries. Extra ANOVA tests that weconducted support our findings.
Key words: Credit rating agencies, Sovereign ratings, Rating discrepancy,Global financial crisis, Paired t-test, ANOVA.
JEL: E44, F34, G01, G15, G24, H63. Sovereign credit ratings announced for countries are default probability assessments evaluated by credit rating agencies. The ratings are based on a vast range of elements including main macroeconomic indicators and political stability indices of the coun-try under focus. Since the ratings are crucial for a country’s access to international finance and the interest paid therein, these assessments are highly critical for any country. Besides, many investors consider the rating of the country before they shape their portfolio, and high-rated countries attract more globally-flowing finance. That is why the role played by the credit rating agencies (CRAs) is sometimes more im-portant than that of governments. A wide range of groups, including issuers, inves-tors and regulators use the information provided by rating agencies in their decision-making. Low-rated countries are affected as they have less capital inflow and the debt they incur is more costly in terms of the interest paid. In this regard, rating is a crucial process and the rating agencies, especially the “Big Three” - namely Standard and Poor’s (S&P), Moody’s and Fitch, conduct vital procedures to assign ratings to countries. This fact renders the responsibilities of the credit rating agencies inevita-ble. The market dominated by the Big Three is almost oligopolistic: more than 80% is captured by Moody’s and S&P while Fitch has a share of more than 13%, totaling about 93% of the business. Since the rating process is not transparent, there is ambi-guity about how countries are granted their sovereign ratings.
96 Hami Saka and Mehmet Orhan
PANOECONOMICUS, 2018, Vol. 65, Issue 1, pp. 95-115
In this paper, we compare the ratings of the CRAs statistically to investigate their similarity and diversity. We make use of the largest data set of sovereign ratings available and utilize the most reliable hypothesis test technique to check beyond any question whether the ratings granted by prominent CRA pairs have equal means. Fur-thermore, we extend this test to check if the ratings by all three have equal means, or not, by the analysis of variance (ANOVA). This second test requires extra effort to calculate the different rating means in case all population means are not the same. We gathered the ratings from S&P, Moody’s and Fitch on 117 countries over 1994-2014 with emphasis on different country segments and time spans. This is the largest data set used in the literature to the best of our knowledge. Besides, we have not seen any study in the literature comparing and contrasting the sovereign ratings and we believe that our exploration will fill the gap. In Section 1 of the paper, related litera-ture including sovereign ratings is reviewed. We report our findings on rating dis-crepancies in Section 2. Finally, Section 3 lists our concluding remarks. 1. Literature Survey
There is a vast number of studies on CRAs in the literature since the topic has been popular especially for the last two decades due to crises contributed by the CRAs. However, study on sovereign ratings is relatively limited. António Afonso, Pedro M. Gomes, and Abderrahim Taamouti (2014) underline that the role played by the credit rating agencies (CRAs) is often more important than that of governments. According to Rasha Al-Sakka and Owain ap Gwilym (2010) a wide range of groups, including issuers, investors and regulators ask for the information provided by rating agencies. Christina E. Bannier and Christian W. Hirsch (2010) concentrate on watchlists to suggest that the agencies’ economic role appears to have been enhanced from a pure information certification function towards an active monitoring function. Angus Duff and Sandra Einig (2009) and Al-Sakka and Gwilym (2010) underline the domination of the market by the Big Three. Since the rating process is not transparent, there is a stream of research to explore both macroeconomic and political indicators to deter-mine the ratings of countries. In this regard, Afonso, Gomes, and Philipp Rother (2007) attempt to reduce these indicators to GDP per capita, GDP growth, govern-ment debt, government effectiveness indicators, external debt, external reserves, and default history. In a similar study, Richard Cantor and Frank Packer (1996) conclud-ed that the ratings can be explained by per capita income, GDP growth, inflation, external debt, level of economic development, and default history. On the other hand Al-Sakka and Gwilym (2009) stress outlook status, past rating changes, rating dura-tion or existing rating as predictors of rating changes.
There is sufficient research in the literature to claim that ratings have profound and significant consequences on countries. Afonso, Davide Furceri, and Gomes (2012), for instance, state that downgrades in ratings of European Union (EU) coun-tries reinforced upward movements in sovereign spreads. Similarly, Helmut Reisen and Julia Von Maltzan (1999), as well as Lars Norden and Martin Weber (2004), document that negative credit rating announcements have significant impacts on yields and CDS spreads. Afonso, Furceri, and Gomes (2012), define parametric vola-tilities using EGARCH specifications and make use of daily stock market and sover-

97 Are Sovereign Ratings by CRAs Consistent?
PANOECONOMICUS, 2018, Vol. 65, Issue 1, pp. 95-115
eign bond returns to conclude that upgrades do not have significant effects on volatil-ity, but downgrades increase stock and bond market volatility. Furthermore, they state that policymakers look at rating agencies as a possible source contributing to the increase in financial markets volatility after the 2008-2009 financial and econom-ic crisis in several EU countries. Volatility in such financial markets is addressed to trigger the amplification in output volatility. Iuliana Ismailescu and Hossein Kazemi (2010) demonstrate that positive announcements have a greater impact on CDS mar-kets with data from 22 emerging markets. More specifically, Joshua Aizenman, Mahir Binici, and Michael Hutchison (2013) report for the EU countries that a credit rating upgrade decreases CDS spreads by about 45 basis points, on average.
Cantor and Packer (1996) and Amadou N. R. Sy (2004) demonstrate that the bond spread of countries rise in response to negative rating announcements. A one-notch upgrade is calculated to decrease the spread by 14%. Furthermore, sovereign ratings have spillover effects to other countries’ bond markets (Afonso, Furceri, and Gomes 2012). In this regard, Graciela L. Kaminsky and Sergio L. Schmukler (2002) document that sovereign rating announcements lead to reactions in bonds and stock markets in emerging markets as well as neighboring countries. In a similar study, Amar Gande and David C. Parsley (2005) prove an asymmetric international spillo-ver effect of a sovereign rating adjustment on the sovereign credit spreads of other countries. All in all, the ratings do not only influence the access of countries to inter-national finance, but also affect the main macroeconomic indicators of the country. The criticisms pointed at the CRAs have become more intense since the global finan-cial crisis. Many blame the CRAs as the main actor triggering the crisis, by granting the highest ratings to shady bonds.
Although there is considerable research and literature on the inaccuracy of rat-ings, erroneous ratings are difficult to prove since the ratings are legally the opinions of the CRAs and are simply the likelihood of default, which is rare in sovereign his-tory. Still, there are numerous papers published in distinguished journals such as Al-Sakka and Gwilym (2010), for instance, which analyze lead-lag relationships in sov-ereign ratings across five agencies, and report that upgrade as well as downgrade probabilities are much higher, and downgrades as well as upgrade probabilities are much lower for a sovereign issuer with a recent upgrade (downgrade) by another agency. Adam B. Ashcraft, Paul Goldsmith-Pinkham, and James I. Vickery (2010) state that mistakes by CRAs are often cited as one of the causes of the recent finan-cial crisis. More than 80% of the subprime or Alt-A mortgage-backed-securities (MBS) were assigned the highest possible triple-A rating, but many such MBS have experienced large rating downgrades.
The other main criticism of the CRAs is about their failure in predicting the crisis. Sy (2004) documents that ratings do not predict currency crises and are instead downgraded ex post. A number of other papers conclude the same about the capabil-ity of CRAs in predicting the former upcoming crisis (Steven Radelet and Jeffrey Sachs 1998; Morris Goldstein, Kaminsky, and Carmen M. Reinhart 2000; Reinhart 2002). Various reasons are cited behind this failure, one of which is the difficulty CRAs face in getting timely information about the borrowing country. The second reason, according to Sy (2004) is a moral hazard and the third reason is that the CRA

98 Hami Saka and Mehmet Orhan
PANOECONOMICUS, 2018, Vol. 65, Issue 1, pp. 95-115
has limited motivation to downgrade since “…they receive fees from the sovereign borrowers they rate and because such downgrades can precipitate a crisis”. On the other hand, Frank Partnoy (2006) states that the ratings are subject to political pres-sure and mention that “…there is abundant anecdotal evidence of rating inaccuracy”. Partnoy (2006) gives the example of the highest short-term rating granted to the Or-ange County only months before it filed for bankruptcy. Similarly, Lawrence J. White (2009) not only blames the CRAs in failing to anticipate the global financial crisis but claims they contributed to it by stating “…by means of the high ratings that they awarded to subprime mortgage backed bonds, the three major rating agencies, Moody’s, Standard and Poor’s and Fitch, played a central role in the current financial crisis”. Pointed studies in the literature on the failure of the CRAs in predicting the global financial crisis can be read in Mehmet Orhan and Ramazan Alpay (2012).
Regarding the sovereign ratings in the ordinary framework of rating business-es, these ratings are designed to evaluate the sovereign risk. In comparison to sover-eign risk, country risk is defined as the exposure to a loss in cross-border lending, caused by events in a particular country which are - at least to some extent - under the control of the government but definitely not under the control of a private enter-prise or individual (Pancras J. Nagy 1984). Marwan Elkhoury (2008) mentions that all forms of cross-border lending in a country - whether to the government, a bank, a private enterprise or an individual - are included. That is why Elkhoury (2008) indi-cates that country risk is a broader concept than sovereign risk since the sovereign risk is attributed to the government of a sovereign nation though still the two risks are highly correlated.
In order to carry out the statistical analysis, the ratings expressed in letters have to be converted to real numbers. This is achieved by linear transformations us-ing various scales in the literature. Rolando Avendaño, Norbert Gaillard, and Sebastián Nieto-Parra (2011), for instance used a scale of 1-21 in accordance with Moody’s total number of letter grades. Similarly, Vanja Bozic and Cosimo Magazzino (2013) used the scale of 1-21 while Gaillard (2009) used a different scale for each agency. On the other hand, Bo Becker and Todd Milbourn (2011) used the scale of 1-28, and Kee-Hong Bae, Jun-Koo Kang, and Jin Wang (2013) classified the grades into 7 categories, and implemented a transformation in which the highest grade is 28 whereas Julia A. Bennell et al. (2006) assigned 16 to the highest rating. Ömer Veysel Çalışkan (2002) used a graded scale up to 100 in his study and Cecilia T. Valle and José Luis Martín Marín (2005) enumerated the letter grades from 1 to 8 with decimal points. 2. Rating Differences
One main motivation behind the paper is the investigation of whether the sovereign ratings assigned by prominent CRAs are significantly different or not. Since the Big Three are recognized worldwide by many countries and claim to assess the credit-worthiness of each and every country under observation, ratings by them are ex-pected to be similar. With this factor on the agenda, we employ one of the soundest and clearest statistical methods in our analysis, namely the paired t-test, to reveal the equality of ratings granted by different CRAs.

99 Are Sovereign Ratings by CRAs Consistent?
PANOECONOMICUS, 2018, Vol. 65, Issue 1, pp. 95-115
More technically, the paired t-test is an influential method to conclude wheth-er populations from which the samples are drawn have significantly different means or not. The test is used for a wide list of disciplines ranging from management to psychology. The method can only be used when there are matched samples. For ex-ample, if the comparison is made for a certain time span, it is necessary for both CRAs to rate the country under focus. As for a comparison based on country, or country groups, both CRAs must have rated at the same time.
The null hypothesis of the test claims that the population means of the ratings by the CRAs, say CRA1 and CRA2 are the same, or equivalently their difference is equal to 0, that is:
: − = 0 ⇔ = 0, : − ≠ 0 ⇔ ≠ 0.
In other words, H can be stated that there is no significant difference be-tween the means of two populations which are the “long-term sovereign ratings” of the two CRAs in the study.
The test statistic is: = / , (1)
where: - sample mean of difference; - standard deviation of differences; - number of pairs (sample size). Rejection of H means that the difference between the means of CRA1 and
CRA2 ratings is significant. It then enables us to reach the conclusion that these two CRAs do not agree with each other.
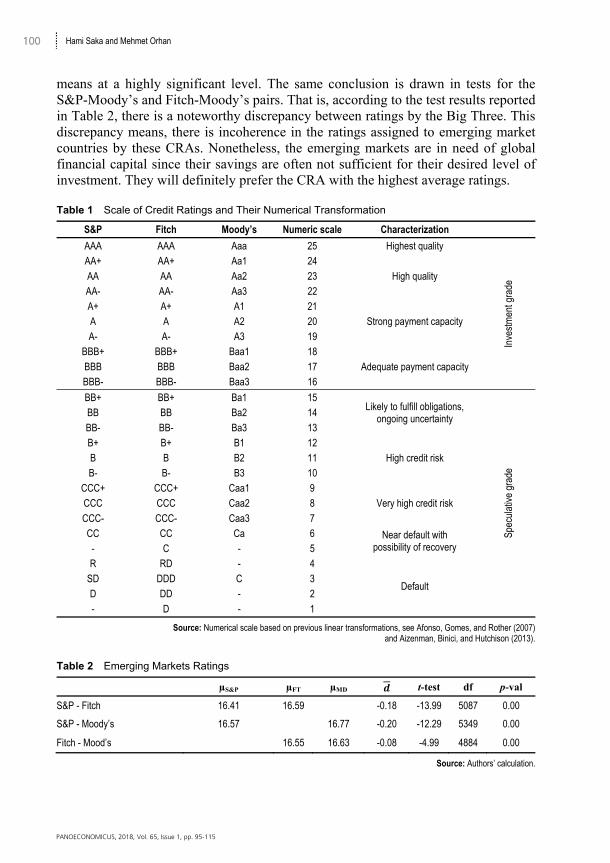
Regarding the transformation of ratings to numerical values, as it is evident from the references cited in the literature survey section, even though the linear trans-formations differ in many of the studies, there is an analogy between the definitions of the letter grades. In this paper we follow the linear transformations used in Afonso, Gomes, and Rother (2007) and Aizenman, Binici, and Hutchison (2013). We have prepared Table 1 to display the list of ratings with the integers we assign to them.
We first conduct the test for emerging market countries the list of which is taken from the official web site of the Morgan Stanley Capital International (MSCI)1. This index contains Brazil, Chile, China, Colombia, Czech Republic, Egypt, Greece, Hungary, India, Indonesia, South Korea, Malaysia, Mexico, Peru, Philippines, Po-land, Russia, South Africa, Taiwan, Thailand, and Turkey. We report the results of the tests in Table 2. The first raw results of the table compare the ratings of S&P and Fitch. The test statistic of -13.99 rejects the null hypothesis of equal population 1 Morgan Stanley Capital International (MSCI). 2014. The MSCI Global Investable Market Indexes (GIMI) Methodology. https://www.msci.com/market-cap-weighted-indexes (accessed March 19, 2014).
100 Hami Saka and Mehmet Orhan
PANOECONOMICUS, 2018, Vol. 65, Issue 1, pp. 95-115
means at a highly significant level. The same conclusion is drawn in tests for the S&P-Moody’s and Fitch-Moody’s pairs. That is, according to the test results reported in Table 2, there is a noteworthy discrepancy between ratings by the Big Three. This discrepancy means, there is incoherence in the ratings assigned to emerging market countries by these CRAs. Nonetheless, the emerging markets are in need of global financial capital since their savings are often not sufficient for their desired level of investment. They will definitely prefer the CRA with the highest average ratings. Table 1 Scale of Credit Ratings and Their Numerical Transformation
S&P Fitch Moody’s Numeric scale Characterization AAA AAA Aaa 25 Highest quality
Inve
stm
ent g
rade
AA+ AA+ Aa1 24 High quality AA AA Aa2 23
AA- AA- Aa3 22 A+ A+ A1 21
Strong payment capacity A A A2 20 A- A- A3 19
BBB+ BBB+ Baa1 18 Adequate payment capacity BBB BBB Baa2 17
BBB- BBB- Baa3 16
BB+ BB+ Ba1 15 Likely to fulfill obligations,
ongoing uncertainty
Spec
ulat
ive
grad
e
BB BB Ba2 14 BB- BB- Ba3 13 B+ B+ B1 12
High credit risk B B B2 11 B- B- B3 10
CCC+ CCC+ Caa1 9 Very high credit risk CCC CCC Caa2 8
CCC- CCC- Caa3 7 CC CC Ca 6 Near default with
possibility of recovery - C - 5 R RD - 4
Default SD DDD C 3 D DD - 2 - D - 1
Source: Numerical scale based on previous linear transformations, see Afonso, Gomes, and Rother (2007) and Aizenman, Binici, and Hutchison (2013).
Table 2 Emerging Markets Ratings
µS&P µFT µMD t-test df p-val
S&P - Fitch 16.41 16.59 -0.18 -13.99 5087 0.00
S&P - Moody’s 16.57 16.77 -0.20 -12.29 5349 0.00
Fitch - Mood’s 16.55 16.63 -0.08 -4.99 4884 0.00
Source: Authors’ calculation.

101 Are Sovereign Ratings by CRAs Consistent?
PANOECONOMICUS, 2018, Vol. 65, Issue 1, pp. 95-115
On the other hand, the average rating reported in Table 2 is slightly less than 17 which means countries taking part in emerging markets are positioned just above the investment grade.
In addition to the paired t-test, one can check for a similar hypothesis in the ANOVA framework enabling us to claim whether the ratings by all three CRAs are simultaneously the same, or not. In other words, rejection of the null hypothesis leaves us with limited information about the unequal CRA ratings. This time, the null hypothesis claims that the population means of the ratings by all CRAs are the same. That is, : = = . We employ the ANOVA method over the BRIC countries (namely, Brazil, Russia, India and China). Table 3 reports the con-clusions of the test where the null hypothesis claiming the equality of all ratings is rejected very significantly for long-term sovereign ratings. On the other hand, the CRA awarding the highest average rating to the BRIC countries is Moody’s, and S&P has the lowest average. The average of the ratings that the BRIC countries re-ceived over 1994-2014 is at the intersection of speculative and investment grades.
Table 3 ANOVA for BRIC Countries
Descriptive stat. ANOVA N Mean F-statistics Sig.
BRIC long-term sovereign ratings
S&P 1082 15.47
8.89 0.00 Fitch 947 15.90
Moody’s 1016 16.05
Total 3045 15.80
Before global financial crisis (June 2007-June 2008)
S&P 1811 17.50
11.28 0.00 Fitch 1634 17.84
Moody’s 1566 18.34
Total 5011 17.87
During global financial crisis (July 2008-July 2009)
S&P 1773 17.25
14.95 0.00 Fitch 1555 17.67
Moody’s 1488 18.25
Total 4816 17.69
Source: Authors’ calculation.
A key litmus test to CRAs in their consistency of ratings is over periods of cri-sis. With this in mind, Table 3 also summarizes the ANOVA outcomes around the global financial crisis. Test results reveal differences among the ratings not only dur-ing but also after the crisis. Before the crisis hit (June 2007-June 2008) S&P, Fitch and Moody’s averages were 17.50, 17.84 and 18.34, respectively. However, after the crisis, averages decreased and became 17.25, 17.67 and 18.25. The most optimistic CRA among the three is Moody’s with the highest average ratings for both periods.
We conducted a similar analysis with the OECD (Organization for Economic Co-operation and Development founded in 1961) countries to investigate the ratings for well-established economies. As known, the OECD includes 34 high-income countries.
102 Hami Saka and Mehmet Orhan
PANOECONOMICUS, 2018, Vol. 65, Issue 1, pp. 95-115
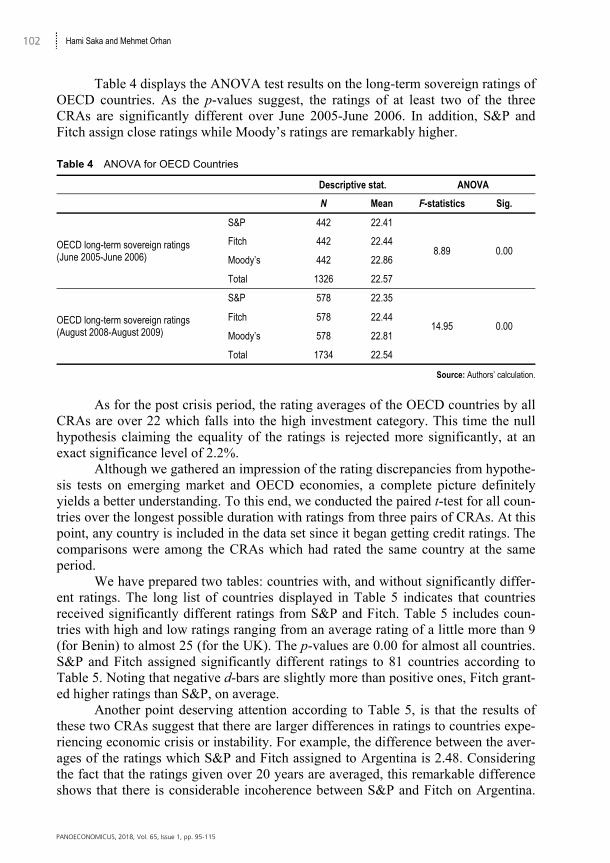
Table 4 displays the ANOVA test results on the long-term sovereign ratings of OECD countries. As the p-values suggest, the ratings of at least two of the three CRAs are significantly different over June 2005-June 2006. In addition, S&P and Fitch assign close ratings while Moody’s ratings are remarkably higher.
Table 4 ANOVA for OECD Countries
Descriptive stat. ANOVA N Mean F-statistics Sig.
OECD long-term sovereign ratings (June 2005-June 2006)
S&P 442 22.41
8.89 0.00 Fitch 442 22.44
Moody’s 442 22.86
Total 1326 22.57
OECD long-term sovereign ratings (August 2008-August 2009)
S&P 578 22.35
14.95 0.00 Fitch 578 22.44
Moody’s 578 22.81
Total 1734 22.54
Source: Authors’ calculation.
As for the post crisis period, the rating averages of the OECD countries by all CRAs are over 22 which falls into the high investment category. This time the null hypothesis claiming the equality of the ratings is rejected more significantly, at an exact significance level of 2.2%.
Although we gathered an impression of the rating discrepancies from hypothe-sis tests on emerging market and OECD economies, a complete picture definitely yields a better understanding. To this end, we conducted the paired t-test for all coun-tries over the longest possible duration with ratings from three pairs of CRAs. At this point, any country is included in the data set since it began getting credit ratings. The comparisons were among the CRAs which had rated the same country at the same period.
We have prepared two tables: countries with, and without significantly differ-ent ratings. The long list of countries displayed in Table 5 indicates that countries received significantly different ratings from S&P and Fitch. Table 5 includes coun-tries with high and low ratings ranging from an average rating of a little more than 9 (for Benin) to almost 25 (for the UK). The p-values are 0.00 for almost all countries. S&P and Fitch assigned significantly different ratings to 81 countries according to Table 5. Noting that negative d-bars are slightly more than positive ones, Fitch grant-ed higher ratings than S&P, on average.
Another point deserving attention according to Table 5, is that the results of these two CRAs suggest that there are larger differences in ratings to countries expe-riencing economic crisis or instability. For example, the difference between the aver-ages of the ratings which S&P and Fitch assigned to Argentina is 2.48. Considering the fact that the ratings given over 20 years are averaged, this remarkable difference shows that there is considerable incoherence between S&P and Fitch on Argentina.

103 Are Sovereign Ratings by CRAs Consistent?
PANOECONOMICUS, 2018, Vol. 65, Issue 1, pp. 95-115
This incoherence becomes more striking when updates of ratings are considered. For instance, while S&P raised Argentina’s rating from SD to B- in June 2005, Fitch raised the rating from DDD to B about 5 years later (in June 2010). Therefore, that the economy of a country which is in crises going through a delicate period, is rated differently by these two agencies, and that this difference lasts for many years is both to the detriment of the country and to the credibility of the two CRAs as well. Table 5 Countries with Significantly Different Ratings from S&P and Fitch
Countries & t-test df p-val Countries & t-test df p-val
Angola 12.40 12.73 -0.33 -4.98 51 0.00 Korea 19.03 19.77 -0.73 -21.88 251 0.00
Argentina 10.08 7.60 2.48 11.44 239 0.00 Kuwait 21.27 21.79 -0.52 -16.03 234 0.00
Australia 24.45 23.75 0.70 24.34 249 0.00 Lebanon 11.01 11.10 -0.09 -3.17 242 0.00
Austria 24.89 25.00 -0.11 -5.79 273 0.00 Libya 18.78 17.81 0.96 26.00 26 0.00
Azerbaijan 15.42 15.70 -0.28 -5.38 73 0.00 Lithuania 17.46 17.16 0.30 7.25 238 0.00
Bahrain 18.94 18.76 0.18 4.13 162 0.00 Macedonia 14.36 14.94 -0.58 -8.91 119 0.00
Belgium 23.88 23.34 0.55 11.36 273 0.00 Malaysia 18.33 17.94 0.39 9.71 220 0.00
Benin 11.24 11.00 0.24 5.71 103 0.00 Malta 19.99 20.36 -0.38 -6.18 250 0.00
Bermuda 22.95 23.35 -0.41 -11.49 250 0.00 Mongolia 12.56 11.77 0.78 8.93 123 0.00
Bulgaria 15.33 15.06 0.27 6.02 215 0.00 Morocco 15.55 16.00 -0.46 -9.04 98 0.00
Cameroon 10.56 10.89 -0.33 -5.56 144 0.00 Mozambique 11.60 11.00 0.60 13.21 118 0.00
Canada 24.50 24.16 0.34 11.84 273 0.00 New Zealand 23.80 23.69 0.11 4.48 166 0.00
Chile 19.96 19.59 0.36 11.99 270 0.00 Nigeria 12.60 13.00 -0.40 -8.83 116 0.00
China 19.28 19.91 -0.63 -8.90 231 0.00 Panama 14.94 15.42 -0.48 -14.04 218 0.00
Colombia 15.10 15.47 -0.37 -11.34 273 0.00 Papua New G. 11.61 11.70 -0.08 -3.15 213 0.00
Costa Rica 14.00 14.18 -0.18 -7.07 224 0.00 Philippines 13.99 14.50 -0.51 -14.64 204 0.00
Croatia 16.29 15.86 0.43 11.67 244 0.00 Poland 17.88 18.17 -0.29 -8.53 259 0.00
Cyprus 18.58 19.86 -1.27 -15.11 167 0.00 Portugal 21.01 21.62 -0.60 -12.50 273 0.00
Czech R. 19.77 19.48 0.29 4.78 261 0.00 Romania 13.66 14.08 -0.42 -11.01 254 0.00
Denmark 24.68 24.53 0.15 6.83 273 0.00 Russia 13.91 14.88 -0.97 -8.39 247 0.00
Ecuador 9.17 8.83 0.34 3.63 157 0.00 Saudi Arabia 21.60 21.45 0.15 4.84 131 0.00
Egypt 14.64 14.84 -0.20 -5.88 236 0.00 Serbia 13.15 12.99 0.16 4.37 125 0.00
El Salvador 14.40 14.61 -0.21 -8.19 248 0.00 Singapore 25.00 24.70 0.30 9.52 215 0.00
Estonia 19.58 19.13 0.45 10.95 231 0.00 Slovakia 18.19 18.30 -0.11 -3.42 249 0.00
Finland 24.25 24.62 -0.37 -10.01 273 0.00 Slovenia 21.23 20.89 0.34 11.39 252 0.00
France 24.88 24.97 -0.10 -5.35 273 0.00 South Africa 16.63 16.40 0.23 7.49 271 0.00
Georgia 11.97 12.50 -0.53 -9.97 95 0.00 Spain 23.15 23.38 -0.22 -6.83 273 0.00
Ghana 11.67 11.86 -0.19 -3.78 143 0.00 Sri Lanka 11.77 12.60 -0.82 -23.47 118 0.00
Greece 16.93 17.26 -0.33 -5.41 258 0.00 Suriname 11.66 11.41 0.25 3.50 137 0.00
Guatemala 13.96 15.00 -1.04 -55.53 116 0.00 Sweden 24.52 23.92 0.60 12.28 273 0.00
Hong Kong 21.93 22.21 -0.29 -5.51 273 0.00 Taiwan 22.09 21.00 1.09 50.39 171 0.00
Hungary 17.14 17.42 -0.28 -8.92 253 0.00 Thailand 17.26 16.88 0.37 11.34 224 0.00
Iceland 19.19 19.45 -0.26 -4.85 197 0.00 Tunisia 16.40 16.51 -0.11 -2.44 238 0.02
India 15.18 15.45 -0.27 -8.60 196 0.00 Turkey 12.31 12.86 -0.55 -12.57 273 0.00

104 Hami Saka and Mehmet Orhan
PANOECONOMICUS, 2018, Vol. 65, Issue 1, pp. 95-115
Indonesia 11.64 12.81 -1.17 -11.41 238 0.00 United King. 25.00 24.97 0.03 3.05 273 0.00
Ireland 23.13 23.44 -0.32 -7.94 271 0.00 United States 24.87 25.00 -0.13 -6.32 273 0.00
Israel 19.58 19.33 0.26 9.39 258 0.00 Uruguay 13.79 13.92 -0.13 -4.29 268 0.00
Jamaica 10.14 10.48 -0.34 -2.81 110 0.01 Venezuela 11.72 12.24 -0.52 -6.71 235 0.00
Japan 23.30 23.41 -0.11 -2.62 273 0.01 Vietnam 13.45 12.78 0.66 14.48 145 0.00
Kazakhstan 15.17 15.35 -0.18 -4.05 246 0.00 Zambia 12.00 11.90 0.10 2.08 40 0.04
Kenya 11.54 12.00 -0.46 -8.67 88 0.00
Source: Authors’ calculation.
It is not only Argentina that is being rated differently by S&P and Fitch. The discrepancies among ratings’ averages for countries like Turkey, Russia, Cyprus, Taiwan, South Korea and Libya are also high. What these countries have in common is that they were in crisis or are still in economic and/or political instability.
Table 6 Countries Whose Ratings Assigned by S&P and Fitch Are Not Significantly Different
Countries & t-test df p-val
Bolivia 10.84 10.89 -0.05 -1.30 140 0.20
Brazil 13.76 13.72 0.04 1.01 269 0.31
Cape Verde 11.97 12.00 -0.03 -1.42 73 0.16
Dominican R. 10.68 10.59 0.09 0.71 148 0.48
Italy 21.75 21.85 -0.10 -1.82 273 0.07
Latvia 17.05 17.11 -0.06 -1.79 223 0.08
Mexico 16.02 16.00 0.02 1.23 261 0.22
Netherlands 24.99 25.00 -0.01 -1.74 273 0.08
Peru 14.87 14.90 -0.03 -1.14 201 0.26
Ukraine 11.60 11.68 -0.08 -1.31 170 0.19
Bolivia 10.84 10.89 -0.05 -1.30 140 0.20
Source: Authors’ calculation.
In addition to Table 5, we have prepared Table 6 to include countries for which the rating difference is not significant. Note that this table is much shorter than Table 5.
When the countries with similar ratings in Table 6 are examined, S&P and Fitch are noticed to be coherent in rating all developed, developing and underdevel-oped countries like Brazil and Bolivia.
Countries rated differently by S&P and Moody’s as well as test statistics of the ratings are listed in Table 7. According to these results, the ratings S&P and Moody’s assigned to 78 countries do not coincide with each other.
When values in Tables 5 and 7 are contrasted, it is seen that the difference between S&P and Moody’s is not as great as the one between S&P and Fitch. For example, S&P and Fitch are not coherent in the ratings given to Argentina, while S&P and Moody’s are. Besides, most values are less than or equal to 1.

105 Are Sovereign Ratings by CRAs Consistent?
PANOECONOMICUS, 2018, Vol. 65, Issue 1, pp. 95-115
Table 7 Countries with Significantly Different Ratings from S&P and Moody’s
Countries & t-test df p-val Countries & t-test df p-val Angola 12.40 12.71 -0.31 -4.76 51 0.00 Israel 19.59 20.07 -0.48 -15.42 257 0.00
Australia 24.45 24.27 0.18 6.70 249 0.00 Jamaica 10.67 11.41 -0.74 -9.14 200 0.00
Austria 24.89 25.00 -0.11 -5.78 281 0.00 Japan 23.34 24.13 -0.79 -10.21 281 0.00
Azerbaijan 15.42 15.32 0.09 2.76 73 0.01 Kazakhstan 15.17 15.35 -0.18 -3.63 245 0.00
Bahamas 18.35 18.90 -0.54 -9.18 143 0.00 Kuwait 21.27 20.73 0.54 6.76 234 0.00
Bahrain 18.94 18.45 0.50 4.96 162 0.00 Latvia 17.03 18.03 -1.01 -14.54 193 0.00
Barbados 17.76 16.66 1.10 17.93 192 0.00 Lebanon 11.01 11.24 -0.23 -4.40 242 0.00
Belgium 23.89 23.78 0.11 5.58 281 0.00 Malaysia 18.79 18.69 0.11 4.58 281 0.00
Bermuda 22.91 23.76 -0.85 -38.63 261 0.00 Malta 20.00 19.62 0.38 6.86 279 0.00
Bolivia 11.36 11.21 0.16 4.31 223 0.00 Mexico 15.92 16.48 -0.56 -16.49 281 0.00
Bosnia H. 11.57 10.68 0.89 24.54 73 0.00 Mongolia 12.60 12.00 0.60 9.02 120 0.00
Botswana 19.70 20.00 -0.30 -8.67 176 0.00 Montenegro 14.11 13.20 0.91 12.89 84 0.00
Brazil 13.76 13.36 0.40 8.52 269 0.00 Morocco 14.86 15.00 -0.14 -2.43 204 0.02
Bulgaria 15.33 14.50 0.83 20.67 215 0.00 New Zealand 23.75 24.25 -0.50 -8.78 281 0.00
Cambodia 11.53 11.00 0.53 10.47 97 0.00 Norway 25.00 24.84 0.16 7.40 281 0.00
Canada 24.48 24.35 0.13 3.74 281 0.00 Panama 14.95 15.28 -0.33 -10.09 244 0.00
Chile 20.28 19.65 0.63 11.71 207 0.00 Papua New G. 11.61 12.00 -0.39 -11.62 213 0.00
China 18.90 20.02 -1.12 -20.77 281 0.00 Peru 14.86 14.24 0.62 15.11 204 0.00
Colombia 15.13 14.90 0.23 8.90 281 0.00 Philippines 14.06 13.80 0.26 6.67 281 0.00
Costa Rica 14.00 15.20 -1.20 -46.31 237 0.00 Poland 17.82 18.73 -0.91 -18.37 263 0.00
Croatia 16.29 15.95 0.34 10.45 244 0.00 Portugal 21.04 21.26 -0.22 -3.43 281 0.00
Denmark 24.74 24.82 -0.08 -4.53 249 0.00 Russia 13.91 15.18 -1.27 -9.15 246 0.00
Dominican R. 11.16 11.61 -0.46 -4.24 204 0.00 Saudi Arabia 21.41 20.15 1.26 10.55 149 0.00
Ecuador 9.16 8.18 0.98 9.94 191 0.00 Singapore 24.95 24.48 0.47 13.26 281 0.00
Egypt 14.19 14.04 0.15 5.01 177 0.00 Slovakia 18.44 18.80 -0.36 -7.94 224 0.00
El Salvador 14.42 15.51 -1.09 -35.99 237 0.00 Slovenia 21.23 20.75 0.49 7.22 252 0.00
Estonia 19.79 20.31 -0.52 -6.90 204 0.00 South Africa 16.63 17.28 -0.65 -18.85 271 0.00
Fiji Islands 10.87 12.77 -1.90 -24.43 110 0.00 Suriname 11.61 12.14 -0.53 -6.29 141 0.00
Finland 24.19 24.67 -0.48 -12.60 281 0.00 Sweden 24.50 24.15 0.35 6.95 281 0.00
France 24.88 24.44 0.44 14.35 281 0.00 Taiwan 22.80 22.00 0.80 14.26 279 0.00
Georgia 12.65 13.00 -0.35 -4.17 45 0.00 Thailand 17.70 17.54 0.16 3.65 281 0.00
Greece 16.97 17.43 -0.46 -3.37 246 0.00 Turkey 12.35 12.92 -0.57 -11.55 281 0.00
Guatemala 13.77 14.29 -0.52 -13.77 173 0.00 Ukraine 11.60 11.31 0.29 3.55 170 0.00
Hong Kong 21.87 20.93 0.94 22.68 281 0.00 United King. 25.00 24.96 0.04 3.53 281 0.00
Hungary 17.38 18.61 -1.23 -18.16 211 0.00 United States 24.88 25.00 -0.12 -6.31 281 0.00
Iceland 19.63 21.11 -1.47 -15.46 281 0.00 Uruguay 13.84 13.75 0.09 2.12 280 0.03
India 15.13 15.45 -0.32 -7.72 204 0.00 Venezuela 11.74 11.48 0.26 2.61 281 0.01
Indonesia 12.37 12.82 -0.45 -4.40 279 0.00 Vietnam 13.57 12.58 0.99 23.46 113 0.00
Source: Authors’ calculation.

106 Hami Saka and Mehmet Orhan
PANOECONOMICUS, 2018, Vol. 65, Issue 1, pp. 95-115
Countries rated by S&P and Moody’s experiencing crisis are more distinctly incoherent with each other than others over 1994-2014.
Table 8 Countries Whose Ratings Assigned by S&P and Moody’s Are Not Significantly Different
Countries & t-test df p-val
Argentina 10.52 10.49 0.04 0.26 281 0.80
Belarus 11.20 11.18 0.02 1.42 93 0.16
Belize 10.25 10.26 -0.01 -0.09 190 0.93
Cyprus 19.16 19.14 0.01 0.19 229 0.85
Czech R. 19.62 19.59 0.03 0.37 281 0.72
Ireland 23.09 23.04 0.05 0.61 281 0.54
Italy 21.78 21.87 -0.09 -1.05 281 0.29
Korea 18.94 18.92 0.03 0.72 225 0.47
Lithuania 17.46 17.47 -0.01 -0.12 238 0.90
Netherlands 24.99 25.00 -0.01 -1.74 281 0.08
Pakistan 10.34 10.32 0.02 0.19 270 0.85
Paraguay 10.64 10.49 0.15 1.13 221 0.26
Qatar 20.95 20.85 0.10 1.48 201 0.14
Romania 13.70 13.77 -0.07 -1.29 238 0.20
Spain 23.15 23.23 -0.08 -1.75 281 0.08
Tunisia 16.47 16.49 -0.02 -0.35 186 0.72
Source: Authors’ calculation.
The 16 countries in which S&P and Moody’s are coherent with each other are listed in Table 8. These countries include Italy and the Netherlands which were in-volved in the former comparison as well. Indeed, the ratings for many of the devel-oped countries are triple A, regardless of the CRA. In addition to these, S&P and Moody’s are also coherent in the example of Argentina. S&P gives higher ratings than Fitch as was stated in the former example. The situations in which the CRAs rate identically or give different ratings, change from CRA to CRA and from country to country, as well.
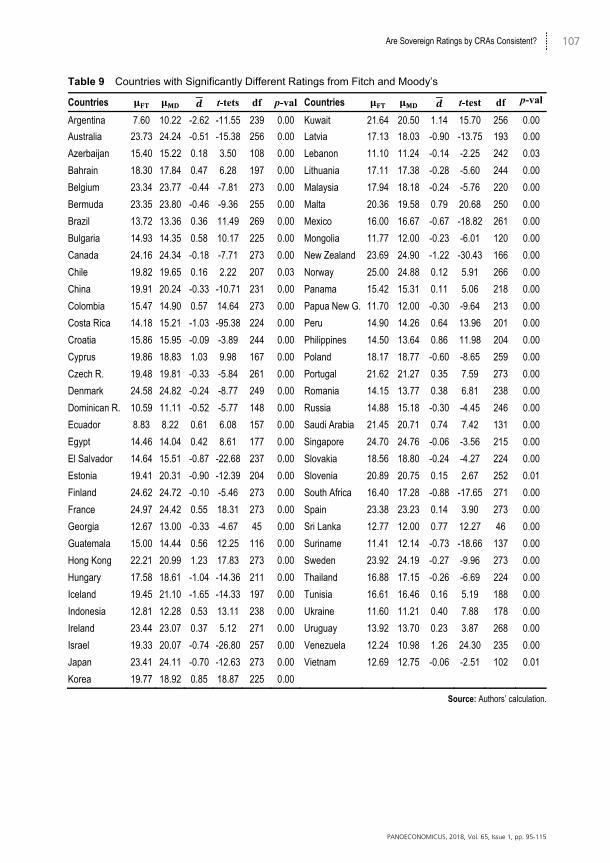
Test results between Fitch and Moody’s are documented in Tables 9 and 10. According to Table 9, a significant difference between these two CRAs is found in 77 countries. The values representing this difference in countries such as Argenti-na, Costa Rica, Cyprus and New Zealand are more than 1 and these differences are critical for the long duration of 1994-2014. The difference among the ratings of 22 countries is not found to be significant. Table 10 lists nine countries for which the null hypothesis of equal ratings by Fitch and Moody’s is not rejected. Hami Saka (2014) includes a more detailed analysis and comments on similar test results.
107 Are Sovereign Ratings by CRAs Consistent?
PANOECONOMICUS, 2018, Vol. 65, Issue 1, pp. 95-115
Table 9 Countries with Significantly Different Ratings from Fitch and Moody’s
Countries t-tets df p-val Countries t-test df p-val
Argentina 7.60 10.22 -2.62 -11.55 239 0.00 Kuwait 21.64 20.50 1.14 15.70 256 0.00
Australia 23.73 24.24 -0.51 -15.38 256 0.00 Latvia 17.13 18.03 -0.90 -13.75 193 0.00
Azerbaijan 15.40 15.22 0.18 3.50 108 0.00 Lebanon 11.10 11.24 -0.14 -2.25 242 0.03
Bahrain 18.30 17.84 0.47 6.28 197 0.00 Lithuania 17.11 17.38 -0.28 -5.60 244 0.00
Belgium 23.34 23.77 -0.44 -7.81 273 0.00 Malaysia 17.94 18.18 -0.24 -5.76 220 0.00
Bermuda 23.35 23.80 -0.46 -9.36 255 0.00 Malta 20.36 19.58 0.79 20.68 250 0.00
Brazil 13.72 13.36 0.36 11.49 269 0.00 Mexico 16.00 16.67 -0.67 -18.82 261 0.00
Bulgaria 14.93 14.35 0.58 10.17 225 0.00 Mongolia 11.77 12.00 -0.23 -6.01 120 0.00
Canada 24.16 24.34 -0.18 -7.71 273 0.00 New Zealand 23.69 24.90 -1.22 -30.43 166 0.00
Chile 19.82 19.65 0.16 2.22 207 0.03 Norway 25.00 24.88 0.12 5.91 266 0.00
China 19.91 20.24 -0.33 -10.71 231 0.00 Panama 15.42 15.31 0.11 5.06 218 0.00
Colombia 15.47 14.90 0.57 14.64 273 0.00 Papua New G. 11.70 12.00 -0.30 -9.64 213 0.00
Costa Rica 14.18 15.21 -1.03 -95.38 224 0.00 Peru 14.90 14.26 0.64 13.96 201 0.00
Croatia 15.86 15.95 -0.09 -3.89 244 0.00 Philippines 14.50 13.64 0.86 11.98 204 0.00
Cyprus 19.86 18.83 1.03 9.98 167 0.00 Poland 18.17 18.77 -0.60 -8.65 259 0.00
Czech R. 19.48 19.81 -0.33 -5.84 261 0.00 Portugal 21.62 21.27 0.35 7.59 273 0.00
Denmark 24.58 24.82 -0.24 -8.77 249 0.00 Romania 14.15 13.77 0.38 6.81 238 0.00
Dominican R. 10.59 11.11 -0.52 -5.77 148 0.00 Russia 14.88 15.18 -0.30 -4.45 246 0.00
Ecuador 8.83 8.22 0.61 6.08 157 0.00 Saudi Arabia 21.45 20.71 0.74 7.42 131 0.00
Egypt 14.46 14.04 0.42 8.61 177 0.00 Singapore 24.70 24.76 -0.06 -3.56 215 0.00
El Salvador 14.64 15.51 -0.87 -22.68 237 0.00 Slovakia 18.56 18.80 -0.24 -4.27 224 0.00
Estonia 19.41 20.31 -0.90 -12.39 204 0.00 Slovenia 20.89 20.75 0.15 2.67 252 0.01
Finland 24.62 24.72 -0.10 -5.46 273 0.00 South Africa 16.40 17.28 -0.88 -17.65 271 0.00
France 24.97 24.42 0.55 18.31 273 0.00 Spain 23.38 23.23 0.14 3.90 273 0.00
Georgia 12.67 13.00 -0.33 -4.67 45 0.00 Sri Lanka 12.77 12.00 0.77 12.27 46 0.00
Guatemala 15.00 14.44 0.56 12.25 116 0.00 Suriname 11.41 12.14 -0.73 -18.66 137 0.00
Hong Kong 22.21 20.99 1.23 17.83 273 0.00 Sweden 23.92 24.19 -0.27 -9.96 273 0.00
Hungary 17.58 18.61 -1.04 -14.36 211 0.00 Thailand 16.88 17.15 -0.26 -6.69 224 0.00
Iceland 19.45 21.10 -1.65 -14.33 197 0.00 Tunisia 16.61 16.46 0.16 5.19 188 0.00
Indonesia 12.81 12.28 0.53 13.11 238 0.00 Ukraine 11.60 11.21 0.40 7.88 178 0.00
Ireland 23.44 23.07 0.37 5.12 271 0.00 Uruguay 13.92 13.70 0.23 3.87 268 0.00
Israel 19.33 20.07 -0.74 -26.80 257 0.00 Venezuela 12.24 10.98 1.26 24.30 235 0.00
Japan 23.41 24.11 -0.70 -12.63 273 0.00 Vietnam 12.69 12.75 -0.06 -2.51 102 0.01
Korea 19.77 18.92 0.85 18.87 225 0.00
Source: Authors’ calculation.

108 Hami Saka and Mehmet Orhan
PANOECONOMICUS, 2018, Vol. 65, Issue 1, pp. 95-115
Table 10 Countries Whose Ratings Given by Fitch and Moody’s Are Not Significantly Different
Countries t-test df p-val
Angola 12.73 12.71 0.02 1.00 51 0.32
Bolivia 10.89 10.91 -0.02 -1.14 140 0.26
Greece 17.32 17.43 -0.11 -0.81 246 0.42
India 15.45 15.51 -0.06 -1.53 196 0.13
Italy 21.85 21.90 -0.05 -0.98 273 0.33
Jamaica 10.48 10.49 -0.01 -0.13 110 0.89
Kazakhstan 15.36 15.35 0.00 0.08 245 0.93
Turkey 12.86 12.88 -0.02 -0.30 273 0.76
United King. 24.97 24.96 0.01 1.74 273 0.08
Source: Authors’ calculation.
If the CRAs assign exactly the same ratings to countries, the d-bar of the test statistic would be 0. When the difference gets larger d-bar deviates from 0 more. In Figure 1 we plot the behavior of the d-bar over the whole range of time spans for 64 countries over 2000-2014. The SP-FT line representing the d-bar of S&P and Fitch displays more stable behavior closer to 0 than others with lower deviations. On the other hand, S&P-Moody’s and Moody’s-Fitch d-bar lines behave similarly; the dif-ference gets larger in late 2003, early 2004 and late 2010.
Source: Authors’ own elaboration based on the credit ratings by S&P, Fitch and Moody’s.
Figure 1 The Behaviours of d-bar for CRA Pairs
-0,600
-0,500
-0,400
-0,300
-0,200
-0,100
0,000
0,100
0,200
0,300
SP-FT FT-MD SP-MD

109 Are Sovereign Ratings by CRAs Consistent?
PANOECONOMICUS, 2018, Vol. 65, Issue 1, pp. 95-115
We present the behavior of the d-bar by S&P and Fitch for the same 64 coun-tries (black line) as well as 20 countries (gray line) experiencing stressful times, in Figure 2 to illustrate the difference in the behaviors of them. These countries are Ar-gentina, Brazil, Bulgaria, Chile, China, Greece, Hong Kong, Iceland, Indonesia, Ire-land, Korea, Lebanon, Malaysia, Mexico, Romania, Russia, Singapore, Thailand, Turkey, and Uruguay. Figure 2 explicitly shows that the rating difference gets larger for countries under stress especially around mid-2002, early 2010 and early 2013.
Source: Authors’ own elaboration based on the credit ratings by S&P and Fitch.
Figure 2 The Behaviours of d-bar for 64 Countries and 20 Countries Experiencing Hard Times
The CRAs are particularly criticized for abruptly changing countries’ ratings at times of crisis. As an example of such a crisis, the 1997-1998 period is critical since it belongs to the break out of the East Asian Crisis in Thailand. After this crisis, the CRAs were exposed to severe criticisms and accused of not foreseeing it (Gold-stein, Kaminsky, and Reinhart 2000; Sy 2004; John Kiff, Sylwia Barbara Nowak, and Liliana Schumacher 2012). The CRAs had downgraded Indonesia by 8, 6, and 6 notches, respectively at the end of the crisis whilst it was rated at investible levels a priori (S&P: BBB, Fitch: BBB- and Moody’s: Baa3). The case of South Korea is even worse: S&P increased the rating by 3 notches, which it then decreased by 10 notches. Similarly, a 5-notch upgrade followed Fitch’s 12-notch downgrade. Consid-ering that all these changes were made in a period of less than 2 years and that the changes were made with the ratings announced as “long-term”, it can be clearly seen that the CRAs had failed in foreseeing the crisis. In addition, Malaysia, Pakistan, Russia and Thailand were countries whose ratings were reduced by high-notch dif-ferences.
-0,700
-0,500
-0,300
-0,100
0,100
0,300
0,500
AV(SP-FT) AV(SP-FT) (Crisis Countries)
110 Hami Saka and Mehmet Orhan
PANOECONOMICUS, 2018, Vol. 65, Issue 1, pp. 95-115
Failures in the ratings the CRAs assigned to countries are not limited to the East Asian Crisis. The global financial crisis has similar cases and it is claimed that the CRAs were a main factor causing it (see for instance Marco Pagano and Paolo Volpin 2010; Miloš Božović, Branko Urošević, and Boško Živković 2011; Bruce G. Carruthers 2013). A good reason for the collapse of the AAA ratings maybe the con-flict of interest suggested by Patrick Bolton, Xavier Freixas, and Joel Shapiro (2012). For instance, Fitch assigning RD to Argentina at the beginning of 2008 upgrading the rating by 7 notches in the aforesaid period. Similarly, Greece received BB+, BBB- and Ba1 from S&P, Fitch, and Moody’s at the end of 2010 while these ratings were A, A and A1 at the beginning of that year which indicates 5, 4, and 6-notch differ-ences. Rating downgrades that started with the crisis were extensive within a few months and changed the position of some countries from investment to speculative level. Indeed, the CRAs are supposed to assess the rating before the event and warn accordingly, not decrement the rating when the process of economic downfall starts.
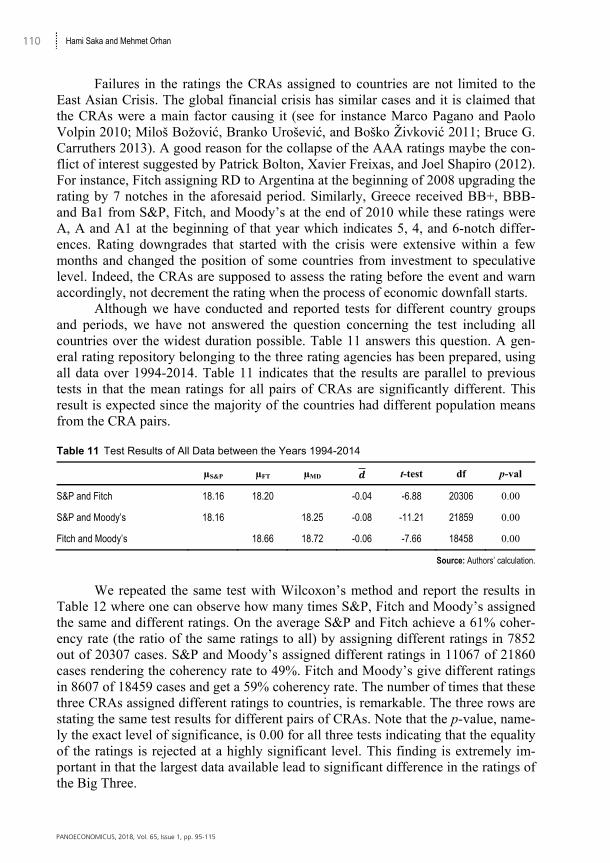
Although we have conducted and reported tests for different country groups and periods, we have not answered the question concerning the test including all countries over the widest duration possible. Table 11 answers this question. A gen-eral rating repository belonging to the three rating agencies has been prepared, using all data over 1994-2014. Table 11 indicates that the results are parallel to previous tests in that the mean ratings for all pairs of CRAs are significantly different. This result is expected since the majority of the countries had different population means from the CRA pairs.
Table 11 Test Results of All Data between the Years 1994-2014
µS&P µFT µMD t-test df p-val
S&P and Fitch 18.16 18.20 -0.04 -6.88 20306 0.00
S&P and Moody’s 18.16 18.25 -0.08 -11.21 21859 0.00
Fitch and Moody’s 18.66 18.72 -0.06 -7.66 18458 0.00
Source: Authors’ calculation.
We repeated the same test with Wilcoxon’s method and report the results in Table 12 where one can observe how many times S&P, Fitch and Moody’s assigned the same and different ratings. On the average S&P and Fitch achieve a 61% coher-ency rate (the ratio of the same ratings to all) by assigning different ratings in 7852 out of 20307 cases. S&P and Moody’s assigned different ratings in 11067 of 21860 cases rendering the coherency rate to 49%. Fitch and Moody’s give different ratings in 8607 of 18459 cases and get a 59% coherency rate. The number of times that these three CRAs assigned different ratings to countries, is remarkable. The three rows are stating the same test results for different pairs of CRAs. Note that the p-value, name-ly the exact level of significance, is 0.00 for all three tests indicating that the equality of the ratings is rejected at a highly significant level. This finding is extremely im-portant in that the largest data available lead to significant difference in the ratings of the Big Three.

111 Are Sovereign Ratings by CRAs Consistent?
PANOECONOMICUS, 2018, Vol. 65, Issue 1, pp. 95-115
Table 12 Test Results of Wilcoxon Signed Rank for All Sovereign Rating Data between the Years 1994-2014
N Mean rank Z p-val
Fitch sovereign ratings, Jan 2007, all countries - S&P sovereign ratings, Jan 2007, all countries
Neg. ranks 3443 3951.54 -9.92 0.00
Pos. ranks 4409 3906.94
Ties 12455
Total 20307
Moody’s sovereign ratings, Jan 2007, all countries - S&P sovereign ratings, Jan 2007, all countries
Neg. ranks 5165 5342.78 -9.56 0.00
Pos. ranks 5902 5701.34
Ties 10793
Total 21860
Moody’s sovereign ratings, Jan 2007, all countries - Fitch sovereign ratings, Jan 2007, all countries
Neg. ranks 3960 4356.95 -5.86 0.00
Pos. ranks 4647 4258.87
Ties 9852
Total 18459
Source: Authors’ calculation.
Indeed, it is interesting to note that the CRAs differentiate in their ratings, yet it maybe more interesting to explore when, why and how they differentiate. It would be naive to think that a CRA has a perfect model to predict default risk. CRAs determine their ratings as a result of different data sets input to different methods by different personnel. The CRAs list numerous economic, social, and political factors that underline their sovereign credit ratings in their statement on rating criteria.
Further research is required to identify the main reasons behind the differ-ences in ratings. Diversities ranging from data sets to methodologies and from even basic definitions to weights assigned to variables may lead to such differences. As a first step in this exploration one can perform a rigorous analysis of the factors leading to differences. That is, one can regress the difference in ratings based on the charac-teristics of the sovereign, time period, and possible other variables that may influence the ratings including whether the ratings are unsolicited or not. Furthermore, one can study the degree of difference between ratings as well as how often and for which countries there is more disagreement.
The first main point of conflict among the CRAs is the set of variables they emphasize. As Al-Sakka and Gwilym (2010) indicate the Big Three use default his-tory, exports-to-GDP and reserves-to-imports as important drivers of downgrading. However, there are variables that are not common to all three. Reserves-to-foreign debt and GDP growth are key aspects for the downgrading and upgrading decisions by Moody’s. Similarly, external balance, fiscal balance and reserves-to-foreign debt are more relevant to the rating change process for S&P. Finally, external debt, fiscal balance, exports-to-GDP, debt service-to-exports and reserves-to-imports are taken into account more in the rating decisions by Fitch. In a lead-lag analysis, S&P has been identified as the first to change the ratings they have granted. On the other hand, Moody’s is the most hesitant of the three. That is why the ratings by S&P and

112 Hami Saka and Mehmet Orhan
PANOECONOMICUS, 2018, Vol. 65, Issue 1, pp. 95-115
Moody’s may differ due to Moody’s taking more time to make the assessment. One other technical point to address the rating differences is that Moody’s does not rate defaults.
Besides, it is not easy to index some variables, especially the ones on social and political factors, to real numbers. For instance, it is really hard to quantify politi-cal risk which is a key factor in sovereign ratings. Although there are objective indi-cators of political risk, working out a unique figure from these indicators to model risk is quite complicated and subjective. In addition, political instability is a complex and sophisticated concept that cannot be measured with a single variable. Some cru-cial political indicators are not accessible for many developing and underdeveloped countries. One other point to note is the weight assigned to factors. Even if the CRAs make use of exactly the same variables, their ratings can be different due to the weights assigned to these factors. 3. Concluding Remarks
We hypothesized the equality of population means belonging to the sovereign ratings by prominent CRAs and tested these with well-established statistical techniques. Our results revealed that ratings by S&P and Fitch are significantly different for 81 coun-tries but the test does fail to reject the equality of the ratings for 11 countries. Simi-larly, ratings by S&P and Moody’s are significantly different for 78 countries but the difference is not rejected for 16 sovereign ratings. As for the ratings by Fitch and Moody’s, 77 countries have significantly different ratings while for 9 countries sig-nificant difference is not documented.
The difference in ratings for emerging market countries is documented as well. We have executed the tests by the paired t-test framework and the other tech-niques we employed for cross checking, namely the Wilcoxon and ANOVA, have supported our findings.
Test for OECD countries reveals similar results whereas for BRIC countries the ratings are demonstrated to be significantly different for all cases but one. Ratings to countries under stressful times by CRAs are more different as are the ratings granted to emerging markets of BRIC countries.
Concerning future research, one maybe interested in the reasons for such dif-ferences of rating means. Although we are not concerned with the objectivity of the CRAs in the business of rating there are studies exploring the subjectivity of a partic-ular CRA. John M. Griffin and Dragon Yongjun Tang (2012) state that they docu-mented a top CRA making positive adjustments beyond its main model that amount-ed to increasingly larger AAA’s in collateralized debt obligations (CDOs). Another line of research should be directed towards further studies to explore subjectivity in sovereign ratings. Such studies may lead to rating-agency reform, as suggested by Anthony Phillip O’Hara (2011).
113 Are Sovereign Ratings by CRAs Consistent?
PANOECONOMICUS, 2018, Vol. 65, Issue 1, pp. 95-115
References
Afonso, António, Pedro M. Gomes, and Philipp Rother. 2007. “What ‘Hides’ Behind Sovereign Debt Ratings?” European Central Bank Working Paper 711.
Afonso, António, Davide Furceri, and Pedro M. Gomes. 2012. “Sovereign Credit Ratings and Financial Markets Linkages: Application to European Data.” Journal of International Money and Finance, 31(3): 606-638. http://dx.doi.org/10.1016/j.jimonfin.2012.01.016
Afonso, António, Pedro M. Gomes, and Abderrahim Taamouti. 2014. “Sovereign Credit Ratings, Market Volatility, and Financial Gains.” Computational Statistics & Data Analysis, 76: 20-33. http://dx.doi.org/10.1016/j.csda.2013.09.028
Aizenman, Joshua, Mahir Binici, and Michael Hutchison. 2013. “Credit Ratings and the Pricing of Sovereign Debt during the Euro Crisis.” Oxford Review of Economic Policy, 29(3): 582-609. http://dx.doi.org/10.1093/oxrep/grt036
Al-Sakka, Rasha, and Owain ap Gwilym. 2009. “Heterogeneity of Sovereign Rating Migrations in Emerging Countries.” Emerging Markets Review, 10(2): 151-165. http://dx.doi.org/10.1016/j.ememar.2008.12.001
Al-Sakka, Rasha, and Owain ap Gwilym. 2010. “Leads and Lags in Sovereign Credit Ratings.” Journal of Banking & Finance, 34(11): 2614-2626. http://dx.doi.org/10.1016/j.jbankfin.2010.05.001
Ashcraft, Adam B., Paul Goldsmith-Pinkham, and James I. Vickery. 2010. “Mbs Ratings and the Mortgage Credit Boom.” Federal Reserve Bank of New York Staff Report 449.
Avendaño, Rolando, Norbert Gaillard, and Sebastián Nieto-Parra. 2011. “Are Working Remittances Relevant for Credit Rating Agencies?” Review of Development Finance, 1(1): 57-78. http://dx.doi.org/10.1016/j.rdf.2010.10.003
Bae, Kee-Hong, Jun-Koo Kang, and Jin Wang. 2013. “Does Increased Competition Affect Credit Ratings? A Reexamination of the Effect of Fitch’s Market Share on Credit Ratings in the Corporate Bond Market.” Journal of Financial and Quantitative Analysis, 50(5): 1011-1035. http://dx.doi.org/10.1017/S0022109015000472
Bannier, Christina E., and Christian W. Hirsch. 2010. “The Economic Function of Credit Rating Agencies - What Does the Watchlist Tell Us?” Journal of Banking & Finance, 34(12): 3037-3049. http://dx.doi.org/10.1016/j.jbankfin.2010.07.002
Becker, Bo, and Todd Milbourn. 2011. “How Did Increased Competition Affect Credit Ratings?” Journal of Financial Economics, 101(3): 493-514. http://dx.doi.org/10.1016/j.jfineco.2011.03.012
Bennell, Julia A., David Crabbe, Stephen Thomas, and Owain ap Gwilym. 2006. “Modelling Sovereign Credit Ratings: Neural Networks versus Ordered Probit.” Expert Systems with Applications, 30(3): 415-425. http://dx.doi.org/10.1016/j.eswa.2005.10.002
Bolton, Patrick, Xavier Freixas, and Joel Shapiro. 2012. “The Credit Ratings Game.” The Journal of Finance, 67(1): 85-111. http://dx.doi.org/85-111. 10.1111/j.1540-6261.2011.01708.x
Bozic, Vanja, and Cosimo Magazzino. 2013. “Credit Rating Agencies: The Importance of Fundamentals in the Assessment of Sovereign Ratings.” Economic Analysis and Policy, 43(2): 157-176. http://dx.doi.org/10.1016/S0313-5926(13)50016-6

114 Hami Saka and Mehmet Orhan
PANOECONOMICUS, 2018, Vol. 65, Issue 1, pp. 95-115
Božović, Miloš, Branko Urošević, and Boško Živković. 2011. “Credit Rating Agencies and Moral Hazard.” Panoeconomicus, 58(2): 219-227. http://dx.doi.org/10.2298/PAN1102219B
Cantor, Richard, and Frank Packer. 1996. “Determinants and Impact of Sovereign Credit Ratings.” Economic Policy Review, 2(2): 37-53.
Carruthers, Bruce G. 2013. “From Uncertainty toward Risk: The Case of Credit Ratings.” Socio-Economic Review, 11(3): 525-551. http://dx.doi.org/10.1093/ser/mws027
Çalışkan, Ömer Veysel. 2002. “Kredi Derecelendirme Kuruluşları ve Risk Değerlendirme Kriterleri.” İktisadi ve İdari Bilimler Fakültesi Dergisi, 4: 1-13.
Duff, Angus, and Sandra Einig. 2009. “Understanding Credit Ratings Quality: Evidence from UK Debt Market Participants.” The British Accounting Review, 41(2): 107-119. http://dx.doi.org/10.1016/j.bar.2009.02.001
Elkhoury, Marwan. 2008. “Credit Rating Agencies and Their Potential Impact on Developing Countries.” United Nations Conference on Trade and Development Discussion Paper 186.
Gaillard, Norbert. 2009. “The Determinants of Moody’s Sub-Sovereign Ratings.” International Research Journal of Finance and Economics, 31(1): 194-209.
Gande, Amar, and David C. Parsley. 2005. “News Spillovers in the Sovereign Debt Market.” Journal of Financial Economics, 75(3): 691-734. http://dx.doi.org/10.1016/j.jfineco.2003.11.003
Goldstein, Morris, Graciela L. Kaminsky, and Carmen M. Reinhart. 2000. Assessing Financial Vulnerability: An Early Warning System for Emerging Markets. Washington, DC: Peterson Institute for International Economics.
Griffin, John M., and Dragon Yongjun Tang. 2012. “Did Subjectivity Play a Role in CDO Credit Ratings?” The Journal of Finance, 67(4): 1293-1328. http://dx.doi.org/10.1111/j.1540-6261.2012.01748.x
Ismailescu, Iuliana, and Hossein Kazemi. 2010. “The Reaction of Emerging Market Credit Default Swap Spreads to Sovereign Credit Rating Changes.” Journal of Banking & Finance, 34(12): 2861-2873. http://dx.doi.org/10.1016/j.jbankfin.2010.05.014
Kaminsky, Graciela L., and Sergio L. Schmukler. 2002. “Emerging Market Instability: Do Sovereign Ratings Affect Country Risk and Stock Returns?” The World Bank Economic Review, 16(2): 171-195. http://dx.doi.org/10.1093/wber/16.2.171
Kiff, John, Sylwia Barbara Nowak, and Liliana Schumacher. 2012. “Are Rating Agencies Powerful? An Investigation into the Impact and Accuracy of Sovereign Ratings.” International Monetary Fund Working Paper 12/23.
Nagy, Pancras J. 1984. Country Risk. London: Euromoney Publications. Norden, Lars, and Martin Weber. 2004. “Informational Efficiency of Credit Default Swap
and Stock Markets: The Impact of Credit Rating Announcements.” Journal of Banking & Finance, 28(11): 2813-2843. http://dx.doi.org/10.1016/j.jbankfin.2004.06.011
O’Hara, Anthony Phillip. 2011. “International Subprime Crisis and Recession: Emerging Macroprudential, Monetary, Fiscal and Global Governance.” Panoeconomicus, 58(1): 1-17. http://dx.doi.org/10.2298/PAN1101001O
Orhan, Mehmet, and Ramazan Alpay. 2012. “Towards a More Objective Credit Rating.” Iktisat Isletme ve Finans, 27(317): 115-136. http://dx.doi.org/10.3848/iif.2012.317.3330
115 Are Sovereign Ratings by CRAs Consistent?
PANOECONOMICUS, 2018, Vol. 65, Issue 1, pp. 95-115
Pagano, Marco, and Paolo Volpin. 2010. “Credit Ratings Failures and Policy Options.” Economic Policy, 25(62): 401-431. http://dx.doi.org/10.1111/j.1468-0327.2010.00245.x
Partnoy, Frank. 2006. “How and why Credit Rating Agencies Are Not Like Other Gatekeepers.” University of San Diego School of Law, Legal Studies Research Paper 07-46.
Radelet, Steven, and Jeffrey Sachs. 2000. “The Onset of the East Asian Financial Crisis.” In Currency Crisis, ed. Paul Krugman, 105-153. Chicago: University of Chicago Press.
Reinhart, Carmen M. 2002. “Credit Ratings, Default and Financial Crises: Evidence from Emerging Markets.” World Bank Economic Review, 16(2): 151-170.
Reisen, Helmut, and Julia Von Maltzan. 1999. “Boom and Bust and Sovereign Ratings.” International Finance, 2(2): 273-293. http://dx.doi.org/10.1111/10.1111/1468-2362.00028
Saka, Hami. 2014. “Analysis of the Rating Discrepancies Assigned by Credit Rating Agencies.” PhD diss. Fatih University.
Sy, Amadou N. R. 2004. “Rating the Rating Agencies: Anticipating Currency Crises or Debt Crises?” Journal of Banking & Finance, 28(11): 2845-2867. http://dx.doi.org/10.1016/j.jbankfin.2004.06.012
Valle, Cecilia T., and José Luis Martín Marín. 2005. “Sovereign Credit Ratings and Their Determination by the Rating Agencies.” Investment Management and Financial Innovations, 4: 159-173. http://dx.doi.org/10.3232/GCG.2014.V8.N1.01
White, Lawrence J. 2009. “The Credit‐Rating Agencies and the Subprime Debacle.” Critical Review, 21(2-3): 389-399. http://dx.doi.org/10.1080/08913810902974964

116 Hami Saka and Mehmet Orhan
PANOECONOMICUS, 2018, Vol. 65, Issue 1, pp. 95-115
THIS PAGE INTENTIONALLY LEFT BLANK