keynesian government spending multipliers and spillovers in the
TRANSCRIPT

Work ing PaPer Ser i e Sno 1267 / november 2010
keyneSian
government
SPending
multiPlierS
and SPilloverS
in the euro area
by Tobias Cwik and Volker Wieland

WORKING PAPER SER IESNO 1267 / NOVEMBER 2010
In 2010 all ECB publications
feature a motif taken from the
€500 banknote.
KEYNESIAN GOVERNMENT
SPENDING MULTIPLIERS
AND SPILLOVERS IN
THE EURO AREA 1
by Tobias Cwik 2 and Volker Wieland 3
1 Tobias Cwik is a doctoral candidate in economics at Goethe University Frankfurt. Volker Wieland is Professor for Monetary Theory and Policy at
Goethe University of Frankfurt. Wieland thanks the European Central Bank for support as Willem Duisenberg Research Fellow when the first
version of this paper was written. Wieland also acknowledges research assistance funding from European Community grant
MONFISPOL under grant agreement SSH-CT-2009-225149. We are grateful for helpful comments on an earlier version
by Michel Juillard, Gabriel Fagan, Harris Dellas, Philip Lane and participants at the Bank of Spain 2010 conference
on fiscal policy, the Hydra Workshop on Dynamic Macroeconomics, the 11th EABCN Workshop, seminar
participants at the Federal Reserve Bank of New York and University of Munich, and four anonymous
referees. This version was presented at the 52nd Panel Meeting of Economic Policy in Rome.
2 House of Finance, Goethe University of Frankfurt, Grueneburgplatz 1, D-60323 Frankfurt am Main, Germany;
e-mail: [email protected]
3 House of Finance, Goethe University of Frankfurt, Grueneburgplatz 1, D-60323 Frankfurt am Main,
Germany and CEPR; e-mail: [email protected]
This paper can be downloaded without charge from http://www.ecb.europa.eu or from the Social Science Research Network electronic library at http://ssrn.com/abstract_id=1705013.
NOTE: This Working Paper should not be reported as representing the views of the European Central Bank (ECB). The views expressed are those of the authors
and do not necessarily reflect those of the ECB.
© European Central Bank, 2010
AddressKaiserstrasse 2960311 Frankfurt am Main, Germany
Postal addressPostfach 16 03 1960066 Frankfurt am Main, Germany
Telephone+49 69 1344 0
Internethttp://www.ecb.europa.eu
Fax+49 69 1344 6000
All rights reserved.
Any reproduction, publication and reprint in the form of a different publication, whether printed or produced electronically, in whole or in part, is permitted only with the explicit written authorisation of the ECB or the authors.
Information on all of the papers published in the ECB Working Paper Series can be found on the ECB’s website, http://www.ecb.europa.eu/pub/scientific/wps/date/html/index.en.html
ISSN 1725-2806 (online)
3ECB
Working Paper Series No 1267November 2010
Abstract 4
Non-technical summary 5
1 Introduction 7
2 Euro area fi scal stimulus packages for 2009 and 2010 9
3 Estimating the GDP impact of announced government spending 12
4 Issues regarding fi scal stimulus in the current recession and fi nancial crisis 19
5 Model uncertainty and decision criteria 27
6 Other approaches in the literature 30
7 Government spending spillover effects in the euro area 33
8 Government investment and transfers 35
9 What has happened so far? A 2010 perspective 37
10 Consolidation-cum-stimulus: Estimated effects of government savings packages 38
11 Conclusions 41
References 43
Appendix 48
CONTENTS

4ECBWorking Paper Series No 1267November 2010
Abstract
The global financial crisis has lead to a renewed interest in discretionary fiscal stimulus. Ad-vocates of discretionary measures emphasize that government spending can stimulate additionalprivate spending — the Keynesian multiplier effect. Thus, we investigate whether the spendingpackage announced by Euro area governments for 2009 and 2010 is likely to boost GDP by morethan one for one. Because of modeling uncertainty, it is essential that such policy evaluations berobust to alternative modeling assumptions and parameterizations. We use five different empiri-cal macroeconomic models with Keynesian features such as price and wage rigidities to evaluatethe impact of the fiscal stimulus. Four of them suggest that the planned increase in governmentspending will reduce private consumption and investment significantly. Only a model that largelyignores the forward-looking behavioral response of consumers and firms implies crowding-in ofprivate spending. We review a range of issues that may play a role in the recession of 2008-2009.Implementation lags are found to reinforce crowding-out and may even cause an initial contrac-tion. Zero-bound effects may lead the central bank to abstain from interest rate hikes and increasethe GDP impact of government spending. Crowding-in, however, requires an immediate anticipa-tion of at least two years at the zero bound. Using a multi-country model, we find that spilloversbetween euro area countries are negligible or even negative, because direct demand effects areoffset by the indirect effect of an euro appreciation. New-Keynesian DSGE models provide astrong case for government savings packages. Announced with sufficient lead time, spending cutsinduce a significant short-run stimulus and crowding-in of private spending.
Keywords: fiscal policy, government spending multipliers, model uncertainty, New-Keynesian models.JEL-Codes: E62, E63, H31

5ECB
Working Paper Series No 1267November 2010
Non-technical Summary
The global financial crisis has lead to a renewed interest in discretionary fiscal stimulus. Pro-
ponents of fiscal stimulus emphasize the Keynesian multiplier effect. It follows from the national
accounts’ spending identity when combined with the text-book Keynesian consumption function. A
country’s gross domestic product is equated with total spending, which consists of private consump-
tion, investment, net exports and government expenditures. Consumption is believed to increase with
after-tax income. Consequently, a debt-financed increase in government spending boosts total spend-
ing (and therefore total GDP) more than one for one. Thus, we investigate whether the spending
package announced by Euro area governments for 2009 and 2010 is likely to have such a multi-
plicative effect on euro area GDP. Because of modeling uncertainty, it is essential that such policy
evaluations be robust to alternative modeling assumptions and parameterizations.
For this reason, we compare the impact of the fiscal packages using several empirically-estimated
macroeconomic models of the euro area. The main focus is on model simulations of the planned
increase in government spending rather than increases in transfers and tax rebates, because spending is
supposed to exhibit the largest Keynesian multiplier effect. The models considered in this comparison
are due to Smets and Wouters (2003), Laxton and Pesenti (2003), Ratto, Roeger, and in’t Veld (2009),
Taylor (1993) and Fagan, Henry, and Mestre (2005). They exhibit Keynesian features such as price
and wage rigidities and were estimated to fit euro area data. All but the model of Fagan et al. (2005)
incorporate forward-looking decision-making by households and firms and are best characterized as
New Keynesian models. The first three models incorporate extensive microeconomic foundations and
are typically referred to as DSGE (dynamic stochastic general equilibrium) models. All the models
are made available in a new macroeconomic model archive for comparative analysis described in
more detail in Wieland, Cwik, Mueller, Schmidt, and Wolters (2009).
In the baseline scenario, New-Keynesian models provide no support for a traditional Keynesian
multiplier effect. The European spending plans would result in a reduction in private sector spending
for consumption and investment purposes. Households and firms reduce spending in anticipation of
future tax burdens and higher interest rates. By contrast, the model of Fagan et al. (2005) largely
ignores forward-looking motives for private decision-making and provides a more traditional Keyne-
sian perspective. This model supports a strong Keynesian multiplier effect, but the boom is followed
by a bust. Thus, the cumulative effect of government on private spending eventually turns negative.
More importantly, models with backward-looking dynamics are not as well-suited for the analysis of
major policy changes as the New-Keynesian models. Instead, they are used primarily for short-term
forecasting.
We then discuss a number of factors that may have played a role in the recession of 2008 and
2009. Time lags arise because of the steps needed to move from a timely announcement to actual
6ECBWorking Paper Series No 1267November 2010
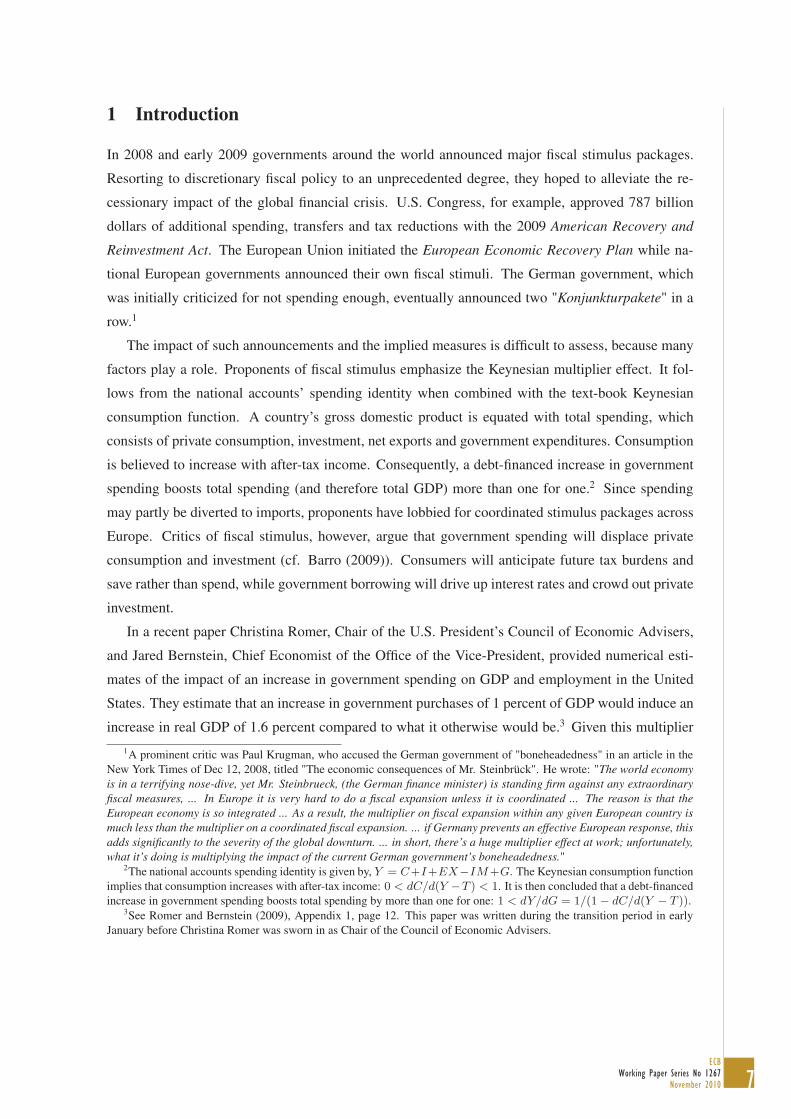
implementation of government spending plans. Such implementation lags lead to more crowding out
and may even cause an initial contraction. In a deep recession, the zero-bound on nominal interest
rates may cause the central bank to abstain to raise interest rates in response to a fiscal stimulus as
in normal times, because its notional interest target is below zero. Such implicit monetary accom-
modation increases the GDP impact of government spending. Crowding-in, however, requires an
immediate anticipation of at least two years at the zero bound.
In addition, we use the multi-country model of Taylor (1993) to assess the likely spill-over effects
within the euro area. Since half of the euro area stimulus is derived from the German stimulus plan,
we investigate the spill-over effect of German spending in the absence of similar measures in other
euro area countries. We find that the positive direct demand effect of German spending on other euro
area economies is largely offset by the indirect negative effect of an euro appreciation.
We also investigate the implications of government investment and transfers in one of the above-
mentioned models. Finally, we review the recent data on government spending and the recovery from
recession, and turn to the question of fiscal consolidation. We illustrate that New-Keynesian DSGE
models provide a strong-case for government savings packages. Announced with sufficient lead time,
anticipated future spending cuts induce a significant short-run stimulus and sustained crowding-in of
private spending.
7ECB
Working Paper Series No 1267November 2010
1 Introduction
In 2008 and early 2009 governments around the world announced major fiscal stimulus packages.
Resorting to discretionary fiscal policy to an unprecedented degree, they hoped to alleviate the re-
cessionary impact of the global financial crisis. U.S. Congress, for example, approved 787 billion
dollars of additional spending, transfers and tax reductions with the 2009 American Recovery and
Reinvestment Act. The European Union initiated the European Economic Recovery Plan while na-
tional European governments announced their own fiscal stimuli. The German government, which
was initially criticized for not spending enough, eventually announced two "Konjunkturpakete" in a
row.1
The impact of such announcements and the implied measures is difficult to assess, because many
factors play a role. Proponents of fiscal stimulus emphasize the Keynesian multiplier effect. It fol-
lows from the national accounts’ spending identity when combined with the text-book Keynesian
consumption function. A country’s gross domestic product is equated with total spending, which
consists of private consumption, investment, net exports and government expenditures. Consumption
is believed to increase with after-tax income. Consequently, a debt-financed increase in government
spending boosts total spending (and therefore total GDP) more than one for one.2 Since spending
may partly be diverted to imports, proponents have lobbied for coordinated stimulus packages across
Europe. Critics of fiscal stimulus, however, argue that government spending will displace private
consumption and investment (cf. Barro (2009)). Consumers will anticipate future tax burdens and
save rather than spend, while government borrowing will drive up interest rates and crowd out private
investment.
In a recent paper Christina Romer, Chair of the U.S. President’s Council of Economic Advisers,
and Jared Bernstein, Chief Economist of the Office of the Vice-President, provided numerical esti-
mates of the impact of an increase in government spending on GDP and employment in the United
States. They estimate that an increase in government purchases of 1 percent of GDP would induce an
increase in real GDP of 1.6 percent compared to what it otherwise would be.3 Given this multiplier1A prominent critic was Paul Krugman, who accused the German government of "boneheadedness" in an article in the
New York Times of Dec 12, 2008, titled "The economic consequences of Mr. Steinbrück". He wrote: "The world economyis in a terrifying nose-dive, yet Mr. Steinbrueck, (the German finance minister) is standing firm against any extraordinaryfiscal measures, ... In Europe it is very hard to do a fiscal expansion unless it is coordinated ... The reason is that theEuropean economy is so integrated ... As a result, the multiplier on fiscal expansion within any given European country ismuch less than the multiplier on a coordinated fiscal expansion. ... if Germany prevents an effective European response, thisadds significantly to the severity of the global downturn. ... in short, there’s a huge multiplier effect at work; unfortunately,what it’s doing is multiplying the impact of the current German government’s boneheadedness."
2The national accounts spending identity is given by, Y = C+I+EX−IM+G. The Keynesian consumption functionimplies that consumption increases with after-tax income: 0 < dC/d(Y −T ) < 1. It is then concluded that a debt-financedincrease in government spending boosts total spending by more than one for one: 1 < dY/dG = 1/(1 − dC/d(Y − T )).
3See Romer and Bernstein (2009), Appendix 1, page 12. This paper was written during the transition period in earlyJanuary before Christina Romer was sworn in as Chair of the Council of Economic Advisers.

8ECBWorking Paper Series No 1267November 2010
effect they project that a package similar in size to the ARRA legislation would boost U.S. GDP by
3.6 percent. Cogan, Cwik, Taylor, and Wieland (2010), however, show that this conclusion is not
robust.4 Government spending multipliers in alternative, empirically estimated New-Keynesian mod-
els are much smaller. For example, estimates of the GDP effects of ARRA legislation obtained with
the model of Smets and Wouters (2007) are only one-sixth as large as the estimates of Romer and
Bernstein (2009).
This paper aims to assess the magnitude of the stimulus programs announced by Euro area gov-
ernments in 2008 and 2009 and quantify their effect on economic activity. A macroeconomic model is
needed to distinguish the impact of government actions on the economy from other factors. Because
of modeling uncertainty, it is essential that policy evaluations be robust to alternative assumptions.
For this reason, we compare the impact of the fiscal packages using several empirically-estimated
macroeconomic models of the euro area. The main focus is on model simulations of the planned
increase in government spending rather than increases in transfers and tax rebates, because spending
is supposed to exhibit the largest Keynesian multiplier effect.
The models considered in this comparison are due to Smets and Wouters (2003), Laxton and
Pesenti (2003), Ratto et al. (2009), Taylor (1993) and Fagan et al. (2005).5 All five models exhibit
Keynesian features such as sluggish adjustment due to price and wage rigidities. Thus, they are well-
suited to investigate possible rationales for Keynesian demand management. Several of these models
have been developed and used at policy institutions such as the European Central Bank, the European
Commission, or the International Monetary Fund. The first four model are best described as New-
Keynesian models. These models account for forward-looking decisions by households and firms
that anticipate future changes in government policies. The models of Smets and Wouters (2003),
Laxton and Pesenti (2003) and Ratto et al. (2009) also belong to the class of models often referred
to as New-Keynesian dynamic stochastic general equilibrium (DSGE) models. Such models fully
incorporate recent advances in terms of microeconomic foundations from real-business-cycle models
and combine them with Keynesian-style rigidities.
In the baseline scenario, New-Keynesian models provide no support for a traditional Keynesian4The working paper version of Cogan, Cwik, Taylor, and Wieland (2009) appeared shortly after the ARRA had passed
the House and the Senate.5The models are made available in a new macroeconomic model archive for comparative analysis described in more
detail in Wieland et al. (2009). While macroeconomic model comparison projects have helped produce some very influentialinsights such as the Taylor rule, they have been infrequent and costly, because they require the input of many teams ofresearchers and multiple meetings to obtain a limited set of comparative findings (see, for example, Taylor (1999) andHughes-Hallett and Wallis (2004)). The new comparative approach to model-based research and policy analysis presentedin Wieland et al. (2009) instead enables individual researchers to conduct model comparisons easily, frequently, at low costand on a large scale. Note, the models collected were not available "off-the-shelf". Rather the above-mentioned projectinvolved a substantial work effort in order to create such a "shelf" with models that have been checked for replicability andaugmented with a common variable, shock and policy rule space to allow proper comparative exercises. For analysis ofmonetary policy in the United States and the euro area see Taylor and Wieland (2009) and Kuester and Wieland (2010),respectively.
9ECB
Working Paper Series No 1267November 2010
multiplier effect. The European spending plans would result in a reduction in private sector spending
for consumption and investment purposes. Households and firms reduce spending in anticipation of
future tax burdens and higher interest rates. By contrast, the model of Fagan et al. (2005) largely
ignores forward-looking motives for private decision-making and provides a more traditional Keyne-
sian perspective. This model supports a strong Keynesian multiplier effect, but the boom is followed
by a bust. Thus, the cumulative effect of government on private spending eventually turns negative.
More importantly, models with backward-looking dynamics are not as well-suited for the analysis of
major policy changes as the New-Keynesian models. Instead, they are used primarily for short-term
forecasting.
We then discuss a number of factors that may have played a role in the recession of 2008 and
2009. Time lags arise because of the steps needed to move from a timely announcement to actual
implementation of government spending plans. Such implementation lags lead to more crowding out
and may even cause an initial contraction. In a deep recession, the zero-bound on nominal interest
rates may cause the central bank to abstain to raise interest rates in response to a fiscal stimulus as
in normal times, because its notional interest target is below zero. Such implicit monetary accom-
modation increases the GDP impact of government spending. Crowding-in, however, requires an
immediate anticipation of at least two years at the zero bound.
In addition, we use the multi-country model of Taylor (1993) to assess the likely spill-over effects
within the euro area. Since half of the euro area stimulus is derived from the German stimulus plan,
we investigate the spill-over effect of German spending in the absence of similar measures in other
euro area countries. We find that the positive direct demand effect of German spending on other euro
area economies is largely offset by the indirect negative effect of an euro appreciation.
We also investigate the implications of government investment and transfers in one of the above-
mentioned models. Finally, we review the recent data on government spending and the recovery from
recession, and turn to the question of fiscal consolidation. We illustrate that New-Keynesian DSGE
models provide a strong-case for government savings packages. Announced with sufficient lead time,
anticipated future spending cuts induce a significant short-run stimulus and sustained crowding-in of
private spending.
2 Euro area fiscal stimulus packages for 2009 and 2010
As the first step of this project, we investigated the magnitude of the different stimulus measures an-
nounced by national euro area governments under the auspices of the European Economic Recovery
Plan. To this end, we reviewed the stability programs that national finance ministries publicly sub-
mitted to the ECOFIN Council in line with the Stability and Growth Pact in 2008 and 2009 (see, for
example, French Ministry of Finance (2009) or Spanish Ministry of Finance (2009)). On this basis,
10ECBWorking Paper Series No 1267November 2010
we obtained numerical estimates of the amounts to be allocated to additional government purchases,
transfers and tax reductions for 2009 and 2010. In doing so we compared our estimates against those
obtained by Saha and von Weizsäcker (2009) for spending, transfers and tax measures in 2009. Thus,
our findings made available in the working paper version in July 2009 comprised the first set of such
estimates that covered both years of the stimulus plan.6
The total sum of measures we were able to identify for the eleven largest economies of the euro
area comes to 95.5 bln Euro in 2009 and 78.6 bln Euro in 2010. This is 1.04 percent of euro area
GDP in 2009 and 0.86 per cent in 2010. Indeed, the euro area stimulus package is much smaller than
the ARRA legislation in the United States that amounted to roughly 5 percent of GDP.7 However, the
European package is concentrated on two years and front-loaded in 2009, while the U.S. stimulus is
spread over five years building up towards a peak in 2010 and declining slowly over 2011 and 2012
(see Cogan et al (2010)). In this manner, the European authorities appeared to adhere more to the
idea of "temporary" stimulus, favored by institutions such as the International Monetary Fund, rather
than the sustained stimulus advocated by advisers of the U.S. administration.
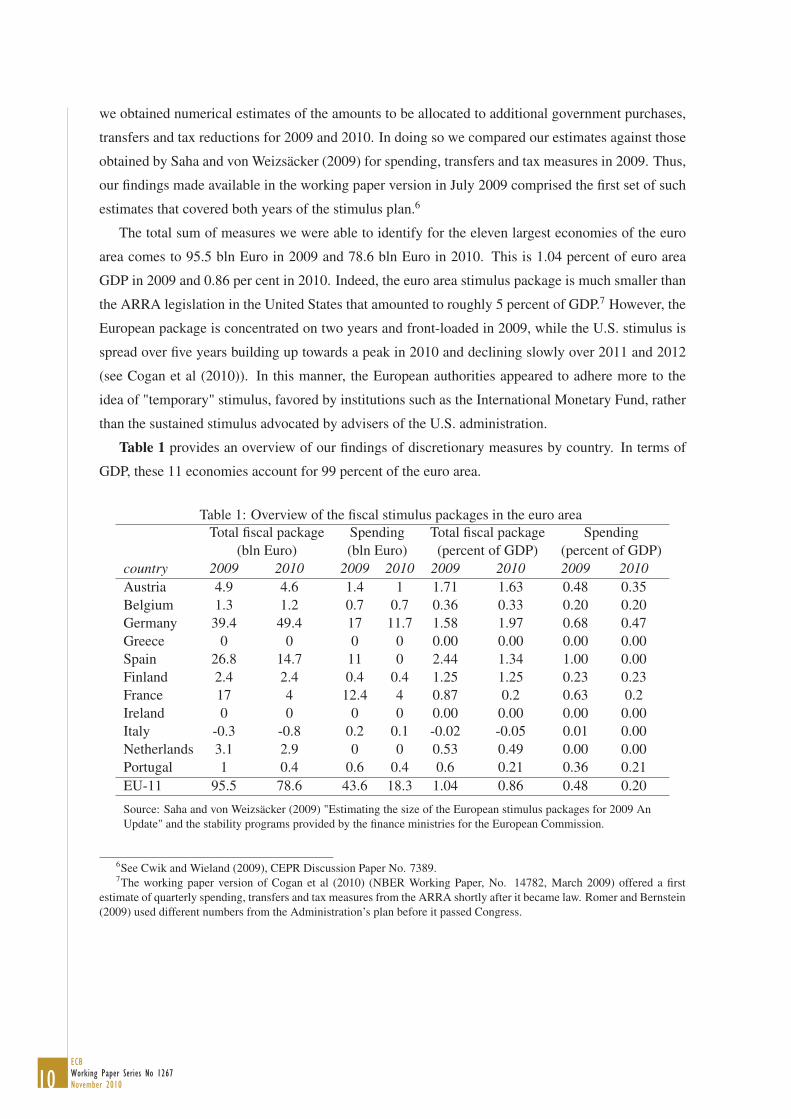
Table 1 provides an overview of our findings of discretionary measures by country. In terms of
GDP, these 11 economies account for 99 percent of the euro area.
Table 1: Overview of the fiscal stimulus packages in the euro areaTotal fiscal package Spending Total fiscal package Spending
(bln Euro) (bln Euro) (percent of GDP) (percent of GDP)country 2009 2010 2009 2010 2009 2010 2009 2010Austria 4.9 4.6 1.4 1 1.71 1.63 0.48 0.35Belgium 1.3 1.2 0.7 0.7 0.36 0.33 0.20 0.20Germany 39.4 49.4 17 11.7 1.58 1.97 0.68 0.47Greece 0 0 0 0 0.00 0.00 0.00 0.00Spain 26.8 14.7 11 0 2.44 1.34 1.00 0.00Finland 2.4 2.4 0.4 0.4 1.25 1.25 0.23 0.23France 17 4 12.4 4 0.87 0.2 0.63 0.2Ireland 0 0 0 0 0.00 0.00 0.00 0.00Italy -0.3 -0.8 0.2 0.1 -0.02 -0.05 0.01 0.00Netherlands 3.1 2.9 0 0 0.53 0.49 0.00 0.00Portugal 1 0.4 0.6 0.4 0.6 0.21 0.36 0.21EU-11 95.5 78.6 43.6 18.3 1.04 0.86 0.48 0.20
Source: Saha and von Weizsäcker (2009) "Estimating the size of the European stimulus packages for 2009 AnUpdate" and the stability programs provided by the finance ministries for the European Commission.
6See Cwik and Wieland (2009), CEPR Discussion Paper No. 7389.7The working paper version of Cogan et al (2010) (NBER Working Paper, No. 14782, March 2009) offered a first
estimate of quarterly spending, transfers and tax measures from the ARRA shortly after it became law. Romer and Bernstein(2009) used different numbers from the Administration’s plan before it passed Congress.
11ECB
Working Paper Series No 1267November 2010
More detailed information on the specific measures in each country and a breakdown in terms of
government spending, transfers, tax cuts and other measures is provided in Appendix A. Since we
focus on studying the effect of discretionary measures, changes in fiscal balances resulting from au-
tomatic stabilizers are not included. Table 1 reports information on the total amount of the respective
fiscal package and the implied increase in government spending separately. The total also includes
temporary tax cuts and transfers. The amounts are reported in billions of Euro and in relative shares
in percent of 2008 GDP.
The fiscal stimuli differ substantially in terms of magnitude and composition. By far the largest
stimulus package has been enacted in Germany: 88.8 bln Euro spread over 2009 and 2010. In relative
terms these measures amount to 3.55 percent of GDP. Thus, the German package is approaching the
magnitude of the ARRA stimulus in the United States adjusted for the size of the economy. However,
the U.S. measures are spread over four years. The German stimulus corresponds to 51 percent of
the total EU-11 stimulus according to the information we have been able to put together. In terms of
government expenditures, the German share in the EU-11 stimulus comes to 46 percent.
The second largest package was announced by the Spanish government, roughly 41.5 billion Euro,
and the third largest is the French stimulus of about 21 billion Euro. Measures in some smaller
countries such as Austria and Finland are also significant relative to GDP. Other countries launched
smaller fiscal measures. Some countries that were in a particularly weak fiscal position such as
Greece or Ireland initiated no significant stimulus. Also, Italy apparently initiated very little additional
spending and increased some taxes and tax collection.
The fiscal stimulus packages vary in terms of the measures undertaken. Finland and the Nether-
lands adopted measures mainly on the revenue side whereas Portugal and France increased govern-
ment spending. In the euro area as a whole roughly 36 percent of the fiscal stimulus packages are
increases in direct government spending. Roughly 9 percent are transfers and 55 percent are attributed
to tax cuts.
The largest multiplier effect is to be expected from government purchases. Direct purchases and
similar spending as part of the euro area stimulus come to 0.48 percent of 2008 GDP in 2009 and
0.20 percent in 2010. Among such purchases, those with an investment character offer the possibility
of a longer-term improvement in the productive capacity of the euro area economy. Of course, there
may exist a tendency by national authorities to describe as many government spending initiatives as
possible as a form of investment. Thus we try to separate out spending measures that are clearly aimed
at creating new infrastructure that may help develop private business. Such infrastructure government
spending amounts to 0.19 and 0.13 percent of GDP in 2009 and 2010 respectively. Country-specific
breakdowns are reported in the appendix.

12ECBWorking Paper Series No 1267November 2010
3 Estimating the GDP impact of announced government spending
A macroeconomic model is needed to evaluate the impact of government policy measures on eco-
nomic activity in isolation from other disturbances that may currently influence actual economic
outcomes. Structural models make it possible to identify the role of market expectations, the effect
of announcements of plans for future policy decisions, and the impact of fiscal measures under alter-
native assumptions of likely monetary policy responses. In their analysis of the U.S. stimulus, Cogan
et al. (2010) considered two empirically estimated macroeconomic models of the U.S. economy, one
developed by Taylor (1993) and the other one by Smets and Wouters (2007). The Smets and Wouters
model, in particular, is representative of current thinking in macroeconomics. It is very similar to,
and "largely based on" according to Smets and Wouters, another well-known empirically-estimated
New-Keynesian DSGE model developed by Christiano, Eichenbaum, and Evans (2005). In a related
paper that came out of a new modeling effort at the European Central Bank, Smets and Wouters
(2003) estimated such a model for the euro area.
The euro area is still a young monetary union. Historical relationships may have changed due to
the shift in monetary regime and comparable cross-country data series are limited and short. The euro
area model of Smets and Wouters (2003), for example, is estimated with historical, pre-EMU data.
Their euro area measures are artificial aggregates obtained by adding up national data from a period
of differential monetary policies and fixed but adjustable exchange rates. As shown by Kuester and
Wieland (2010) modeling uncertainty is particularly pronounced in the euro area and comparative
analysis is crucial to obtain robust policy conclusions. To this end we make use of the new database
of macroeconomic models designed explicitly with the purpose of doing such policy evaluations and
robustness studies (see Wieland et al. (2009) and Taylor and Wieland (2009)).
Text-book Keynesian analysis suggests that direct government purchases have a greater multiplier
effect than tax reductions or additional transfers. Thus, we start by comparing the estimated impact of
the additional spending announced by national governments (7th and 8th column in Table 1) on euro
area GDP in three medium-scale New-Keynesian DSGE models: the Smets-Wouters (SW) model
developed at the European Central Bank, the model of Laxton and Pesenti (2003) developed at the
International Monetary Fund, and the model of European Commission researchers Ratto et al. (2009).
The Laxton and Pesenti (2003) model was created about at the same time as the SW model. It
includes two countries, the euro area and the Czech republic. Its parameters were not estimated with
macroeconomic data but calibrated to values considered reasonable by the modelers in light of other
studies and euro area and Czech macroeconomic volatility. In our model comparison it is labeled
the "Small IMF model" because IMF researchers have also developed several larger macroeconomic
models of the world economy.8 The open-economy model of the euro area by Ratto et al. (2009)8One such model is MULTIMOD, a dynamic multi-country macro model of the world economy (see Laxton, Isard,
13ECB
Working Paper Series No 1267November 2010
is estimated with quarterly euro area data from 1981Q1 to 2006Q1 thereby including a large part of
EMU history. They named their model "QUEST III" and we refer to it as the "EU-Quest" model.
All three models assume forward-looking (rational) expectations by individuals and firms, mo-
nopolistic competition and nominal rigidities in goods and labor markets. Price and wage rigidities
are motivated with Calvo-style staggered contracts (SW model) or adjustment costs (Small IMF and
EU-Quest models). The models fully incorporate microeconomic foundations consistent with the op-
timizing decision-making of representative households and firms, similar to earlier real-business cycle
models that assumed fully flexible prices. The models have in common that they include a number
of additional constraints or frictions that help in matching the dynamics and persistence of some key
macroeconomic time series. These frictions include price and wage indexation, habit-persistence in
consumption, investment adjustment costs, serially correlated shocks and costs related to variable
capital utilization (SW and EU-Quest models).
With regard to the analysis of fiscal stimulus it is important to highlight the following differ-
ences between the three models. The Laxton and Pesenti (2003) model is the only one which allows
for the possibility that additional demand is diverted towards cheaper imports in place of domestic
goods, though perhaps to limited extent because the foreign country from the perspective of the euro
area is rather small. The EU-Quest model provides a more thorough treatment of the government
sector than the other two models. It includes policy rules for government spending, transfers and
consumption, capital and income tax rates and uses data on these variables in estimation. Another
important departure from the assumptions made by Smets and Wouters (2003) and Laxton and Pe-
senti (2003) concerns the treatment of households. These models have been criticized for assuming
that all households are forward-looking and optimize their spending decisions. Instead, it has been
proposed that one allows for the possibility that many households follow "rules of thumb" like the
original Keynesian consumption function with a constant marginal propensity to consume, or that
they are constrained to consume all their current income (see, for example, Gali, López-Salido, and
Vallés (2007)). Ratto et al. (2009) estimate that 35 % of households in the euro area are liquidity-
constrained in this manner.9
Figure 1 reports the increase in government expenditures (bar chart) together with the resulting
effect on euro area real GDP in each of the three models. It is assumed that governments are able
to start spending immediately in the first quarter of 2009. The initial increase is phased in below the
Faruqee, Prasad, and Turtelboom (1998) for an introduction). Its companion model with microeconomic foundations iscalled Global Economy Model (GEM) and described in Pesenti (2008). More recently, IMF researchers developed anotherstructural model for the analysis of fiscal and monetary policy called GIMF that is described in Kumhof and Laxton (2007)and used in recent contributions to the policy debate. Unfortunately, the parameters of the GIMF model are also calibratedand not estimated.
9This finding is similar to euro area estimates of 25 to 35% by Coenen and Straub (2005) and 30 to 40% by Forni,Monteforte, and Sessa (2009). For the United States Cogan et al. (2010) obtained an estimate of 27% rule-of-thumbhouseholds.

14ECBWorking Paper Series No 1267November 2010
average of 0.48 percent of GDP for 2009 and increases above the average level in the second part of
the year.
Figure 1: Estimated GDP impact of government spending stimulus
New-Keynesian DSGE models of ECB, IMF and EU researchers
2009 2010 2011 2012 2013 2014
−0.2
−0.1
0
0.1
0.2
0.3
0.4
0.5
0.6
0.7 Government spendingSmets and Wouters (2003)Small IMF ModelEU Quest Model
Notes: Quarterly annualized government spending is depicted by the bars in percent of GDP: 0.24 in 2009Q1, 0.48 in
2009Q2, 0.60 in 2009Q3 and 2009Q4 and 0.20 in 2010.
Euro area GDP increases as a result of additional government spending. However, the model
simulations do not exhibit the text-book multiplier effect that would imply a greater than one-for-
one increase in GDP relative to government spending. Instead, the increase in GDP is significantly
smaller than the associated boost to government expenditures. Once government spending returns to
baseline at the end of 2010, GDP even falls below baseline in the SW and Small IMF model. By
implication, the increase in government spending must be displacing rather than multiplying private
spending. As shown in Figure 2, the dynamic response of private sector demand for consumption
or investment purposes is negative in all three models. Private consumption and investment decline
immediately and stay below baseline until well after the end of the fiscal stimulus. The simulation
assumes that consumers’ and firms’ expectations incorporate the time profile of government spending
as announced by national governments.
These findings on European stimulus are similar to the results for the U.S. economy reported by
Cogan et al. (2009). The mechanism of private sector displacement is related to the forward-looking
perspective of households and firms. Households and firms anticipate from the start that government
expenditures increase for two years in a row. They also anticipate that debt-financed expenditures will
ultimately lead to higher taxes in the future. The negative wealth effect on private consumption of
higher anticipated future taxes reduces the positive impact of the stimulus. In the SW and Small IMF
15ECB
Working Paper Series No 1267November 2010
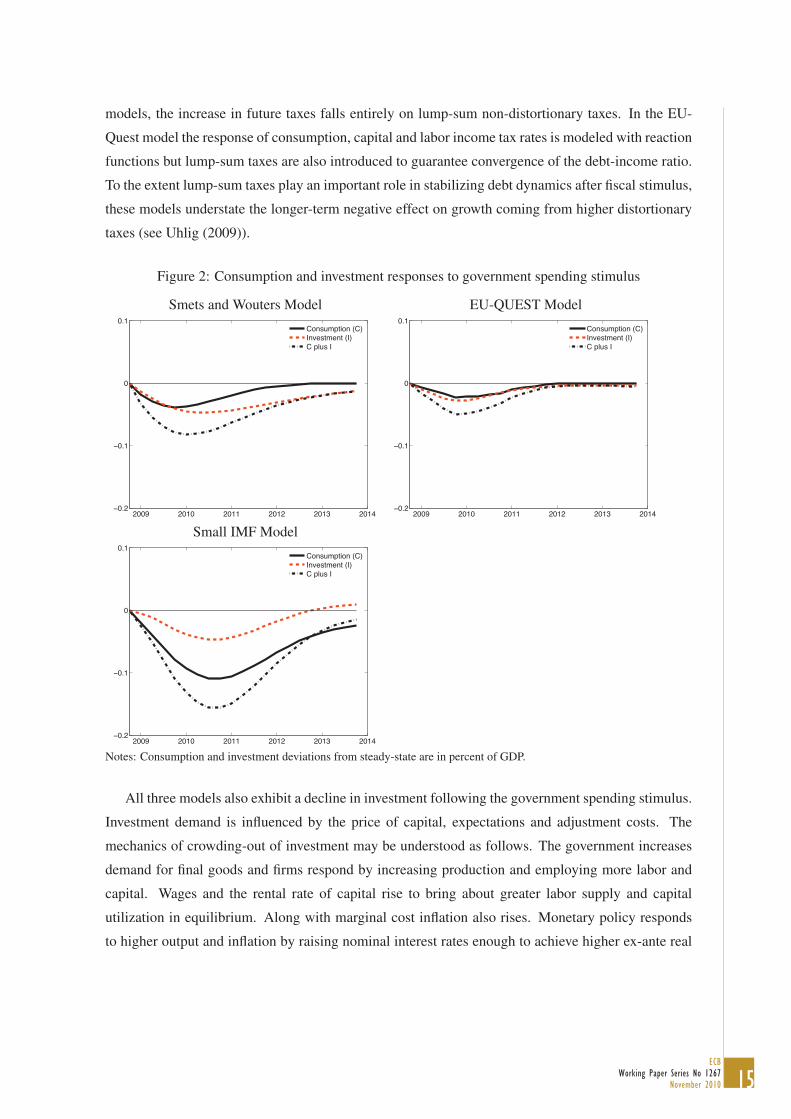
models, the increase in future taxes falls entirely on lump-sum non-distortionary taxes. In the EU-
Quest model the response of consumption, capital and labor income tax rates is modeled with reaction
functions but lump-sum taxes are also introduced to guarantee convergence of the debt-income ratio.
To the extent lump-sum taxes play an important role in stabilizing debt dynamics after fiscal stimulus,
these models understate the longer-term negative effect on growth coming from higher distortionary
taxes (see Uhlig (2009)).
Figure 2: Consumption and investment responses to government spending stimulus
Smets and Wouters Model EU-QUEST Model
2009 2010 2011 2012 2013 2014−0.2
−0.1
0
0.1Consumption (C)Investment (I)C plus I
2009 2010 2011 2012 2013 2014−0.2
−0.1
0
0.1Consumption (C)Investment (I)C plus I
Small IMF Model
2009 2010 2011 2012 2013 2014−0.2
−0.1
0
0.1Consumption (C)Investment (I)C plus I
Notes: Consumption and investment deviations from steady-state are in percent of GDP.
All three models also exhibit a decline in investment following the government spending stimulus.
Investment demand is influenced by the price of capital, expectations and adjustment costs. The
mechanics of crowding-out of investment may be understood as follows. The government increases
demand for final goods and firms respond by increasing production and employing more labor and
capital. Wages and the rental rate of capital rise to bring about greater labor supply and capital
utilization in equilibrium. Along with marginal cost inflation also rises. Monetary policy responds
to higher output and inflation by raising nominal interest rates enough to achieve higher ex-ante real

16ECBWorking Paper Series No 1267November 2010
interest rates. Expected higher real-interest rates depress the price of capital and discourage new
investment. Though future increases in the rental rate of capital tend to boost the price of capital, the
interest rate effect is found to dominate in the model simulations reported in Figure 2.
The crowding-out effect in 2010 and 2011 is largest in the Small IMF model, perhaps because
it is a two-country model in which households have the option to buy more foreign goods if the
price of domestic goods is pushed up by government demand. The EU-Quest model with 35 %
rule-of-thumb households also exhibits crowding-out of consumption and investment. Output in
EU-Quest increases initially even a bit less than in the other two models, but is slightly higher in
2010 and 2011. This finding may appear surprising, because it has been suggested that the presence
of liquidity-constrained households can induce crowding-in of consumption following a government
spending shock in New-Keynesian DSGE models (see for example Gali, Lopez-Salido, Valles
(2007)). Indeed, if one takes a given model and increases the share of rule-of-thumb households
while keeping all other parameters constant, the GDP effect of government stimulus increases, and
with a large enough share consumption is crowded-in and a text-book Keynesian multiplier effect is
realized. However, Coenen and Straub (2005) have shown that the empirically estimated share of
constrained households is not sufficient to overturn the negative wealth effects that are internalized
by the forward-looking households. This finding is confirmed by the EU-Quest model. Furthermore,
Cogan et al. (2009) also estimate a model with rule-of-thumb households and find that the GDP
impact of the ARRA government spending only increases by a small amount relative to a simulation
with the model of Smets and Wouters (2007).
Other Keynesian-style models
Some have criticized New-Keynesian DSGE models for being too similar to real business cycle
models and incorporating too little of the lessons derived from earlier New Keynesian models with
rational expectations or more traditional Keynesian models with backward-looking dynamics. Thus,
we introduce two more models in the comparison, the model of the G7 economies by Taylor (1993)
and the ECB’s area-wide model of Fagan et al. (2005).10
The Taylor model is interesting because it is a multi-country model. It allows us to look at euro
area member economies such as France, Germany and Italy, separately. It is also best characterized
as a New-Keynesian model because it combines forward-looking, rational expectations with nominal
rigidities due to overlapping wage contracts. The model equations exhibit many similarities to those
in the above-mentioned current-generation New-Keynesian DSGE models, but they are not derived as
stringently from the optimization problems of representative households and firms. Consumption de-10We use the linearized version of Dieppe, Kuester, and McAdam (2005).

17ECB
Working Paper Series No 1267November 2010
mand is with the exception of Germany and Italy disaggregated into durable, nondurable and services
consumption. Demand for these components is then modeled as a function of lagged consumption,
current income, and expectations of future income and real interest rates over the next two years. The
sensitivity of consumption demand to current income has an equivalent effect to the presence of rule-
of-thumb consumers in the EU-Quest model. Fixed investment demand is also modeled as a function
of lagged values, current and expected future demand and real interest rates over the next two years.
The Taylor model assumes that monetary policy is set independently from seigniorage and govern-
ment finance considerations and successfully controls inflation in the long-run. Thus, implicitly it is
assumed that the long-run government budget constraint is satisfied, but tax and debt dynamics are
not modeled explicitly as in the EU-Quest model. Output is assumed to return to its long-run potential
that is treated as exogenous to monetary policy and government spending.
We simulate a euro area-wide fiscal stimulus for Germany, France and Italy combined. The ex-
change rates between these three economies are fixed. Short-term nominal interest rates are identical
and set according to a policy rule with area-wide targets.11 As shown in Figure 3 the initial boost to
GDP in the first three quarters of 2009 is slightly greater than in the SW, Small IMF and EU-Quest
models. The effect on GDP is smaller than in the SW and EU-Quest models, however, in 2010 and
slightly more negative in 2011. The left panel in Figure 4 depicts the response of consumption and
investment. A small crowding-in effect is observed in the first two quarters, but it is quickly over-
whelmed and followed by a decline in consumption and investment. Some of the euro area stimulus
is dissipated to increased demand for imports from outside the euro area.
Figure 3: The Taylor (1993) G-7 model and the ECB’s area-wide model
Government spending and real GDP
2009 2010 2011 2012 2013−0.3
−0.2
−0.1
0
0.1
0.2
0.3
0.4
0.5
0.6
0.7 Government spendingSmets and Wouters (2003)Small IMF ModelEU Quest ModelECB Area Wide ModelTaylor (1993)
11Wieland (1996) previously used the Taylor model to study the implications of a shift from the Bundesbank-dominatedEuropean Monetary System with policy focused on German targets to a monetary union with area-wide targets.
18ECBWorking Paper Series No 1267November 2010
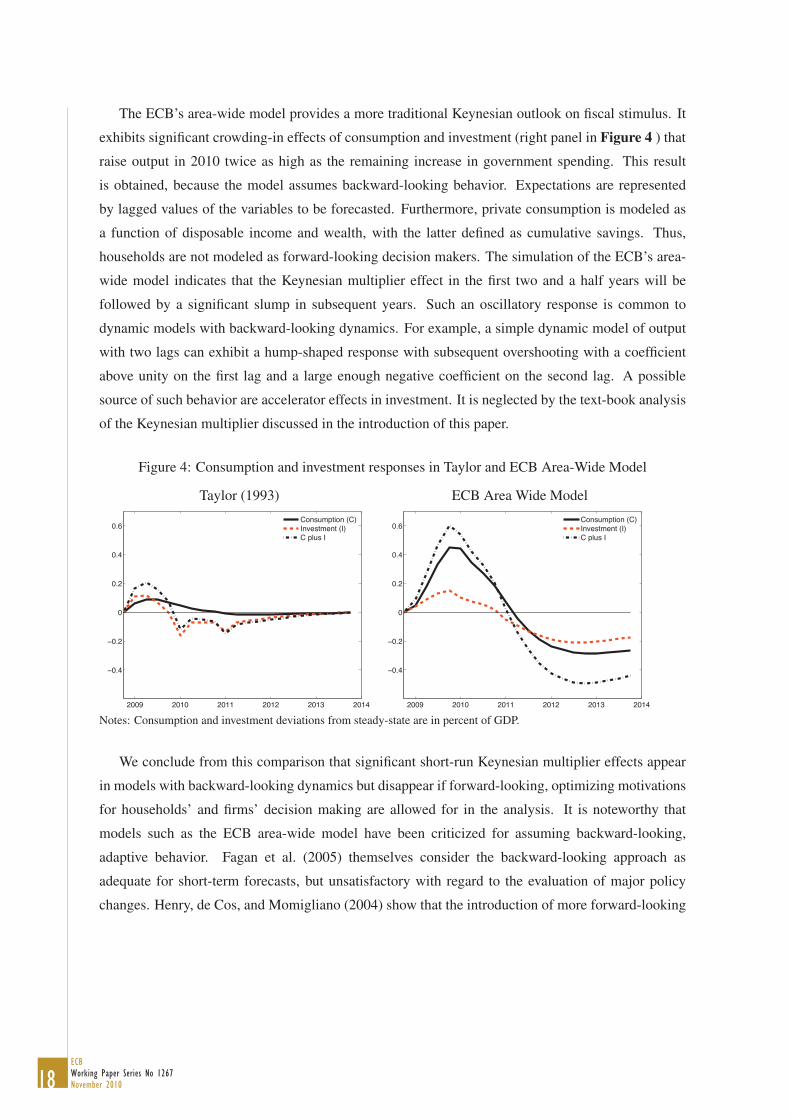
The ECB’s area-wide model provides a more traditional Keynesian outlook on fiscal stimulus. It
exhibits significant crowding-in effects of consumption and investment (right panel in Figure 4 ) that
raise output in 2010 twice as high as the remaining increase in government spending. This result
is obtained, because the model assumes backward-looking behavior. Expectations are represented
by lagged values of the variables to be forecasted. Furthermore, private consumption is modeled as
a function of disposable income and wealth, with the latter defined as cumulative savings. Thus,
households are not modeled as forward-looking decision makers. The simulation of the ECB’s area-
wide model indicates that the Keynesian multiplier effect in the first two and a half years will be
followed by a significant slump in subsequent years. Such an oscillatory response is common to
dynamic models with backward-looking dynamics. For example, a simple dynamic model of output
with two lags can exhibit a hump-shaped response with subsequent overshooting with a coefficient
above unity on the first lag and a large enough negative coefficient on the second lag. A possible
source of such behavior are accelerator effects in investment. It is neglected by the text-book analysis
of the Keynesian multiplier discussed in the introduction of this paper.
Figure 4: Consumption and investment responses in Taylor and ECB Area-Wide Model
Taylor (1993) ECB Area Wide Model
2009 2010 2011 2012 2013 2014
−0.4
−0.2
0
0.2
0.4
0.6Consumption (C)Investment (I)C plus I
2009 2010 2011 2012 2013 2014
−0.4
−0.2
0
0.2
0.4
0.6Consumption (C)Investment (I)C plus I
Notes: Consumption and investment deviations from steady-state are in percent of GDP.
We conclude from this comparison that significant short-run Keynesian multiplier effects appear
in models with backward-looking dynamics but disappear if forward-looking, optimizing motivations
for households’ and firms’ decision making are allowed for in the analysis. It is noteworthy that
models such as the ECB area-wide model have been criticized for assuming backward-looking,
adaptive behavior. Fagan et al. (2005) themselves consider the backward-looking approach as
adequate for short-term forecasts, but unsatisfactory with regard to the evaluation of major policy
changes. Henry, de Cos, and Momigliano (2004) show that the introduction of more forward-looking

19ECB
Working Paper Series No 1267November 2010
elements in the ECB area-wide model substantially reduce the government spending multiplier.12
Recently, ECB staff have introduced a New-Area-Wide model, which is more similar to the Smets
and Wouters and EU-Quest models (see Christoffel, Coenen, and Warne (2008)).
4 Issues regarding fiscal stimulus in the current recession and financial
crisis
Recently, certain critics have demanded that policy makers completely disregard any analysis with
current-generation macroeconomic models, because these models have failed to predict the global
financial crisis and the ensuing recession of 2008 and 2009. Truth is, that these models did not only
fail to predict this recession, but would also have failed to predict most if not all previous recessions.
Wieland and Wolters (forthcoming), for example, investigate the forecasting performance of such
models in the five most recent NBER-dated U.S. recessions based on the historically available data
vintages. None of the models succeeds in predicting one of these recessions. However, this negative
finding also applies to earlier generation macroeconomic models and structural VAR models. The
models considered tend to attribute the onset of recessions to unexpected negative macroeconomic
shocks. Interestingly, Wieland and Wolters (forthcoming) find that expert forecasts available from
the Federal Reserve Staff and the consensus forecast from the Survey of Professional Forecasters
also fail to predict recessions. They perform better than the macroeconomic models in estimating
current quarter output by using higher frequency information available prior to the release of quarterly
GDP data, but such "nowcasts" can similarly be used as initial conditions for model-based forecasts.
Wieland and Wolters (forthcoming)) find that mean model forecasts compare particularly well to
professional forecasts at a horizon of three to four quarters and during recoveries, including the current
recovery phase. Thus, we believe such models should not be so easily dismissed as tools for analyzing
policy measures such as fiscal stimulus that form part of such economic recoveries from recession.
A related criticism points to the lack of a fully developed banking sector in these models. These
critics argue therefore that such models do not help in understanding the aggregate consequences
of the risks faced by banks in the current crisis. Indeed, that is true and the particular models we
consider in this comparison have nothing to say on the effect of government actions such as credit
guarantees or re-capitalization measures for struggling banks. Thus, this paper remains silent on these
policy initiatives, except for noting that if they achieve their aim, they will support the predictability
of the speed of return to more normal growth conditions by means of such models. The government12Interestingly, the comparison of euro area macroeconomic models in Kuester and Wieland (2010) suggests that models
which allow for an important influence of forward-looking decision-making by households and firms have fared better interms of fitting euro area inflation and output dynamics since the start of monetary union.
20ECBWorking Paper Series No 1267November 2010
spending stimulus we aim to assess, however, works directly via purchases of goods and services and
generates additional demand that firm’s satisfy by increasing labor input and capital utilization. This
channel of transmission is very well captured in the models we consider in our analysis. Moreover, for
those models that predict crowding-out of private investment due to the increase in government debt,
potential difficulties in obtaining bank-based credit for new private sector investments would be less of
a concern. A risk of greater-than-expected crowding-out, however, would have to be acknowledged.
Another concern regarding the relevance of the findings in the preceding section is that these
simulations are initiated from the steady-state of the model rather than a deep recession state that
would be more appropriate to the situation at the beginning of 2009. A first point in response is
that for linear models, or the linearized versions of nonlinear models that we consider, there is no
difference between an impulse response simulation initiated at the steady-state and one initiated at
any other state. The marginal response of endogenous variables is independent of the state. To give an
example, the marginal increase in the nominal interest rate in response to a given increase in output
and inflation due to fiscal stimulus is the same, whether it occurs below, at, or above the neutral
steady-state level of the nominal interest rate.
Of course, such a linear approach may not be considered fully satisfactory. Fortunately, however,
we employ nonlinear solution techniques for rational expectations models in our simulations.13 The
nonlinear approach makes it possible to account for the anticipation of the announced time profile of
the fiscal stimulus. Thus, our simulations do not treat each quarter increase to spending as a separate
unexpected shock, nor are expectations computed based on the assumption of a simple auto-correlated
process as in typical linear fiscal impulse simulations. Instead, households and firms anticipate the
announced plan as of the first quarter of 2009. With the help of the nonlinear solution approach we
will also address other nonlinearities that appear particularly relevant to this recession.
In the following we investigate three issues in further detail, the possibility of fiscal implementa-
tion lags, the possibility of an increase in so-called rule-of-thumb or liquidity-constrained households
and the implications of the zero bound on nominal interest rates.
Implementation lags and negative stimulus
A great advantage of the automatic fiscal stabilizers such as unemployment insurance or the tax
system is that they apply immediately to cushion the consequences of a recession on households
and firms and possibly even before the decline in economic activity has become widely apparent. If
discretionary fiscal stimulus is intended to offset recessions then timeliness is of the essence but may
be difficult to achieve. For example, the current recession in the euro area started in January 2008,13The particular methodology we use is described in Juillard (1996) and implemented in DYNARE. This solution ap-
proach builds on earlier work by Laffarge (1990) and Fair and Taylor (1983).
21ECB
Working Paper Series No 1267November 2010
according to the CEPR Business Cycle Dating Committee’s judgement published in March 2009.
The EERP and national stimulus were only announced by the end of 2008 or the beginning of 2009,
once the onset of recession had become apparent. Given the difficulties of business and government
experts in predicting recessions, this is not surprising.
More importantly, even if governments may be able to rush through legislation and make a rapid
announcement, the actual implementation of the stimulus will still take more time. While some in-
creases in transfers, such as the U.S. tax rebates in 2008 and 2009, may be delivered effectively within
a few months of the announcement, it is more difficult to execute major new spending effectively in
a short time. Certainly, getting started with the building of new infrastructure such as roads, bridges
or canals, the improvement of facilities for delivery of government services, the repair of educational
institutions and the hiring of new professional staff requires at least several months if it is done in
an effective manner. Once government authorities have decided and planned specific budgets, the
particular work projects still need to be selected. The offers of companies applying for tenders need
to be prepared and then compared by the authorities. Furthermore, if such spending is pushed through
too quickly chances for wastage increase because projects and labor are contracted without soliciting
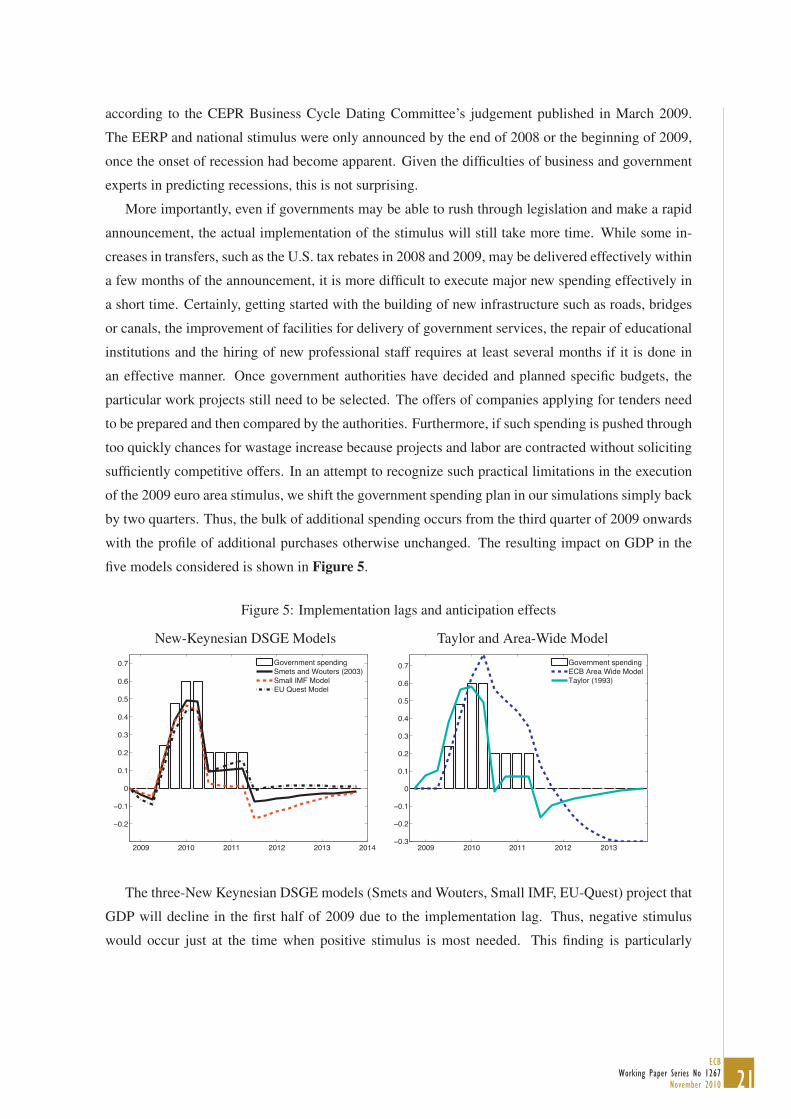
sufficiently competitive offers. In an attempt to recognize such practical limitations in the execution
of the 2009 euro area stimulus, we shift the government spending plan in our simulations simply back
by two quarters. Thus, the bulk of additional spending occurs from the third quarter of 2009 onwards
with the profile of additional purchases otherwise unchanged. The resulting impact on GDP in the
five models considered is shown in Figure 5.
Figure 5: Implementation lags and anticipation effects
New-Keynesian DSGE Models Taylor and Area-Wide Model
2009 2010 2011 2012 2013 2014
−0.2
−0.1
0
0.1
0.2
0.3
0.4
0.5
0.6
0.7 Government spendingSmets and Wouters (2003)Small IMF ModelEU Quest Model
2009 2010 2011 2012 2013−0.3
−0.2
−0.1
0
0.1
0.2
0.3
0.4
0.5
0.6
0.7 Government spendingECB Area Wide ModelTaylor (1993)
The three-New Keynesian DSGE models (Smets and Wouters, Small IMF, EU-Quest) project that
GDP will decline in the first half of 2009 due to the implementation lag. Thus, negative stimulus
would occur just at the time when positive stimulus is most needed. This finding is particularly

22ECBWorking Paper Series No 1267November 2010
disconcerting for proponents of fiscal stimulus, because this class of models is judged by many to be
the best currently available framework for policy evaluation.14 By contrast, the traditional backward-
looking features of the ECB’s area-wide model ensure that output remains unchanged in the first
two quarters of 2009. In this model, the stimulative effects are realized once government spending
is implemented successfully from summer 2009 onwards. Interestingly, the model of Taylor (1993)
indicates the possibility of a slight boost ahead of the delayed stimulus.
Further insight regarding these differential results may be obtained from the comparison of con-
sumption and investment responses. In the Smets and Wouters model and the Small IMF model the
negative impact of the delayed government spending and the negative wealth effect on private con-
sumption of higher anticipated future taxes combine to slow down the economy. Households and
firms see through the future discretionary spending stimulus. They reduce spending immediately to
save for higher taxes later. This effect also dominates in the EU-QUEST model even though one third
of the households are constrained to consume current income. Similarly, the expectation of higher
real interest rates down the line triggers a decline in investment demand following the announcement
of fiscal stimulus, even if the actual government spending is only implemented by the third quarter of
2009.
The earlier-generation New-Keynesian model of Taylor (1993) does not generate the same strong
Ricardian effects as the current vintage of New-Keynesian DSGE models. Households and firms
in that make forward-looking decisions but only based on a two-year forecasting horizon. Thus,
their expectations are influenced more by the positive impact of additional government spending
in the near term. This expectation leads to additional spending in the first two quarters. Finally,
the ECB’s area-wide model essentially delivers the same assessment as in the simulation without
implementation lag, except that the crowding-in of consumption and investment is delayed by two
quarters. Again, backward-looking dynamics induce a big oscillatory effect. The boost is followed
by a slump.
The share of rule-of-thumb households in the recession
So far we have treated the parameters of the models as constant throughout the analysis. One may
well argue that some of those parameters may change in such a deep recession as observed in 2008
and 2009. In particular, the share of rule-of-thumb or liquidity-constrained households could change
over time. This share is hard-wired into models such as EU-QUEST and implicit in the response to
current income in models such as Taylor (1993) and the ECB’s Area-Wide Model. Theoretically, one
motivation for including such behavior in general equilibrium models is to approximate the share of14See for example the survey of Woodford (2008).

23ECB
Working Paper Series No 1267November 2010
households that would like to consume more and become borrowers in the current period. However,
they are not able to obtain credit from banks on future expected income. Thus, they tend to consume
any additional increase in current income.
A possible concern is that the share of similarly constrained households’ has increased in the
course of the financial crisis because banks were more reluctant to extend credit. Increasing the
share of constrained households in the DSGE models considered previously while keeping all other
parameters constant would reduce the crowding-out effect on consumption. As a result, the GDP
effect of government spending would increase. At some point, with shares near or above 50 % a
model such as the one developed by Smets and Wouters would imply that government spending
increases output by more than one for one, because consumption rises too. The greater the share of
rule-of-thumb consumers the more consumption demand in these models behaves as in the text-book
Keynesian consumption function and induces the respective multiplier effect.
By contrast, it is also possible that the share of consumers that want to borrow declined during
this deep recession. In particular, households who expect a longer-term reduction in life-time income,
because of less promising job opportunities, asset losses, sustained unemployment, or higher taxes
may decide to save more. In this manner some of those households that were borrowing-constrained
before, may now want to save rather than spend any additional income they might receive due to gov-
ernment stimulus in form of a temporary increase in work hours in response to government purchases
or in form of direct transfers.
The share of rule-of-thumb consumers in the three New-Keynesian DSGE models that we have
considered ranges from 0% to 35%. Rather than running a range of simulations with other values we
review recent empirical evidence on household behavior during this recession. In the United States,
there have been two policy initiatives that offer useful natural experiments to shed light on the ques-
tion of the share of households that consume any temporary increases in disposable income. These
are the tax rebates in spring 2008 and spring 2009 issued by the Bush and Obama Administration. An
aggregate comparison of disposable personal income and consumption is provided in Taylor (2009)
and Taylor (2010a). The rebate payments are directly apparent as upward spikes in personal income
in May-June 2008 and 2009 respectively. Aggregate consumption in those periods grows slowly and
smoothly. It shows no immediate increase that would be a mirror image of these one-time transfers
as it should be the case for rule-of-thumb consumers. Thus, the aggregate data does not indicate
a straightforward inconsistency with the forward-looking consumption-smoothing behavior of opti-
mizing households faced with temporary windfall income. A recent survey by Claudia Sahm and
Slemrod (2010) sheds additional light on this issue. They find that 25 percent of households reported
that the one-time economic stimulus payment in 2008 led them mostly to increase their spending. In
2009, it was 13 percent of households that report to have mostly spent the extra pay from the lower
24ECBWorking Paper Series No 1267November 2010
withholding.
Another U.S. policy initiative, the "Cash for Clunkers" program in 2009, may also generate in-
sights in optimizing versus rule-of-thumb behavior of households. Mian and Sufi (2010) claim ev-
idence that almost all of the additional purchases under the program were pulled forward from the
very near future, and that the effect was almost completely reversed by March 2010. Again this may
be interpreted as evidence of large forward-looking optimizing consumption behavior.
Turning to Europe, some interesting survey evidence has been collected by Boersch-Supan,
Bucher-Koenen, Gasche, and Ziegelmeyer (2010). They survey households in Germany and obtain
the following findings. About a third of the households respond that they have received additional
income from the "Konjunkturpaket II" and have spent about 75% of this additional income on con-
sumption. Asked whether they would spend a possible "consumption voucher" on goods that they
would have bought anyway, or whether they would use it to increase their consumption, 73% of
households answered that they would not increase overall consumption in case of receipt of such a
voucher. Finally, this survey also included a question aimed to elicit the extent of Ricardian behavior
in terms of the expectation of increased taxation following a rise a government spending. Interest-
ingly, 75% of surveyed German households answered that they expect tax increases in the near future,
and an additional 15% expected such tax increases somewhat later in the future.
We conclude from this recent empirical evidence regarding the consumption behavior of U.S.
and German households during the financial crisis, that the range of assumptions regarding the share
of rule-of-thumb consumers in the models used in our analysis already brackets the likely extent of
such behavior during the crisis and recession. Thus, we do not further modify our simulation results
in this regard.
Monetary policy and the zero bond on nominal interest rates
While fiscal policy is subject to political approval and suffers from implementation lags if ad-
ditional spending is to be used effectively, the central bank can react immediately to the onset of
recession by lowering nominal interest rates. Thus, monetary policy has a natural advantage over
fiscal policy as a tool for recession fighting. However, monetary policy also faces certain constraints
regarding the use of its most popular instrument. Currency provides savers with a non-interest bearing
nominal store of value. The resulting zero-lower-bound on nominal interest rates puts a limit on the
extent of interest rate easing. The implications of this constraint for monetary policy were analyzed
almost 14 years ago by Fuhrer and Madigan (1997), Krugman (1998) and Orphanides and Wieland
(1998). Orphanides and Wieland (1998)15 evaluated the impact of this constraint on output and infla-15A revised version was published as Coenen, Orphanides, and Wieland (2004).

25ECB
Working Paper Series No 1267November 2010
tion variability in an estimated macroeconomic model of the U.S. economy with rational expectations
and nominal rigidity similar to the Taylor (1993) model. They showed that large recessions would
be deepened and disinflationary or deflationary effects strenghtened when the zero-lower-bound is
binding. However, the central bank does not turn powerless. Orphanides and Wieland (2000) find
that optimal monetary policy involves preemptive interest reductions followed by quantitative eas-
ing. Direct asset purchases allow the reduction of risk and term premia and exploit real-balance
and portfolio-balance effects in order to stimulate inflation and lower real interest rates. McCallum
(2002), Svensson (2001) and Coenen and Wieland (2003) emphasized exchange rate policy as an ad-
ditional tool when the space for interest rate easing is exhausted. Reifschneider and Williams (2000)
showed how an announcement extending the period over which nominal interest rates are kept at zero
in the future reduces the recessionary and deflationary consequences of the zero bound.
The zero-bound becomes a binding constraint when the central bank’s notional interest target
implied by a reaction function that describes its desired response to macroeconomic conditions turns
negative. Cogan et al. (2010) have investigated to what extent this was the case in the U.S. economy
in 2009. They simulated the Smets-Wouters (2007) model with the actual U.S. data through the first
quarter of 2009. Then, they computed projections of the recovery implied by this model using a
version that incorporated the non-negativity restriction on the federal funds rate. Whether or not the
federal funds rate endogenously visits the zero bound is found to depend on the monetary policy
rule that captures the Federal Reserve’s response to economic developments. Under the well-known
Taylor rule the simulated recovery is sufficiently quick so that Taylor’s rule would prescribe an interest
rate tightening away from zero. Under the estimated policy rule in the Smets-Wouters model the
endogenous visit at the zero bounds lasts two quarters.
The euro area model simulations presented so far have been conducted under the assumption that
ECB monetary policy follows an interest rate rule that stabilizes output and inflation. The partic-
ular policy rule that we have implemented in all the models considered in this paper is taken from
Gerdesmeier and Roffia (2004). Including the same monetary policy rules in each model guarantees
that diverging effects of fiscal stimulus are due to the economic structure rather than different mone-
tary policy assumptions. The rule is estimated with euro area data. It was also used by Kuester and
Wieland (2010) in a comparative study of the first generation of euro area models developed at the
ECB. It is a rule for setting the short-time nominal interest rate, rt as a function of inflation, output
and the lagged interest rate:
rt = 0.66rt−1 + 0.66πt + 0.10yt (1)
Here, rt is the quarterly nominal interest rate (annualized), πt is the year-on-year inflation rate and yt
is the output gap. Monthly data from 1985 to 2002 was used in estimation.
Next, we consider the possibility that the euro area recession is deep enough to ensure that the zero

26ECBWorking Paper Series No 1267November 2010
bound is binding for one year. This assumption introduces an important nonlinearity in the model
simulation. Because the notional interest rate target of the central bank is below zero, the nominal
interest rate does not increase in response to fiscal stimulus. Instead, the nominal interest rate remains
constant. As a result, the real interest rate falls somewhat during the first few quarters. The zero-
lower-bound implicitly causes monetary accommodation of the increase in government spending.
The simulation is identical to a scenario in which the ECB is assumed to promise keeping the nominal
interest rate constant throughout 2009. In 2010 policy is assumed to return to the policy rule, thereby
keeping inflation under control in the longer run.
Figure 6: GDP impact of stimulus when nominal interest remains constant
Constant rates in 2009 Constant rates in 2009 and 2010
2009 2010 2011 2012 2013 2014
−0.2
−0.1
0
0.1
0.2
0.3
0.4
0.5
0.6
0.7 Government spendingSmets and Wouters (2003)Small IMF ModelEU Quest Model
2009 2010 2011 2012 2013 2014
−0.1
0
0.1
0.2
0.3
0.4
0.5
0.6
0.7
0.8 Government spendingSmets and Wouters (2003)Small IMF ModelEU Quest Model
The effect of euro area government spending on GDP with constant interest rates in 2009 is shown
in the left panel of Figure 6. Only the outcome for the three New-Keynesian DSGE models is shown
and there is no implementation lag. Compared to the simulations in Figure 1 GDP increases a bit
more in response to the spending stimulus. The decline in real interest rates in the first few quarters
holds up investment and consumption and reduces the crowding-out effect. Even so, crowding-out
still dominates for the SW and Small IMF model. In the EU-Quest model, output roughly moves
one-for-one with government spending.
The right panel in Figure 6 displays simulations in which households and firms anticipate that the
zero bound remains binding for two years. Thus, the nominal interest rate is anticipated to remain
constant and does not rise in response to the fiscal stimulus until the first quarter of 2011. The
expectation of rising inflation and falling real interest rates boosts consumption and investment and
induces a noticeable crowding-in effect of consumption and investment in 2009 and 2010 in the EU-
Quest and Small IMF models. In the SW model output roughly mirrors the movement in GDP. It is
important to point out that this boost relies on the anticipation of two years of constant rates as of
the first quarter of 2009. For example, if private sector participants anticipate interest rates to rise at

27ECB
Working Paper Series No 1267November 2010
the end of 2009 and only realize towards the end of that year that the zero bound will remain binding
throughout 2010, the GDP impact of the government spending stimulus will turn out more similar to
the simulations in the left panel.
Recently, other studies have investigated the consequences of fiscal policy when monetary policy
is constrained at the zero bound (see Christiano, Eichenbaum, and Rebelo (2009) and Bodenstein,
Erceg, and Guerrieri (2009)). Christiano et al. (2009), in particular, have emphasized that under
certain conditions fiscal multipliers can get very large, with the GDP impact being three or four times
as large as the increase in government spending. The differences between their findings and ours
are not due to fundamental differences in the models, but to the nature of the question that is posed.
While Cogan et al. (2009) and this paper focus on the expected outcome in scenarios we consider
most likely at the current juncture, Christiano et al. (2009) ask what scenarios would generate a very
large multiplier. Such cases arise in situations when the zero bound is binding for a much longer
time, or in the case of deflation scares that may then averted by fiscal stimulus. Consider a deflation
scare that implies an expectation of -4% deflation. If fiscal stimulus is effective in reversing inflation
expectations, real interest rates drop dramatically and a large multiplier effect results. For this reason,
Coenen et al. (2004) assumed an endogenous response of government spending to deflation below
a certain threshold to rule out deflationary spirals. However, such outcomes are contingent on the
absence of any other monetary policy action that would avert the deflation and deflation scares such
as quantitative easing and large-scale asset purchases as proposed in Orphanides and Wieland (2000)
and Coenen and Wieland (2003). Given that the Federal Reserve used asset purchases aggressively to
avoid sustained deflation expectations in the United States and euro area inflation expectations largely
remained positive, neither the ARRA legislation nor the EERP stimulus should be expected to deliver
multiplier effects of the magnitude studied in Christiano et al. (2009).
5 Model uncertainty and decision criteria
What should one make of these differential assessments with multiple macroeconomic models? We
propose to focus on the cumulative effect of government expenditures on GDP relative to the re-
sources spent by the government. This difference provides a sharp distinction between crowding-in
and crowding-out effects and should be of particular interest to policymakers. If increased govern-
ment spending is likely to stimulate additional private spending, the case for discretionary stimulus
is strengthened. But if on top of the recessionary impact on consumption and investment, private
spending is pushed further down by crowding-out effects from government spending, such policy
action would appear much less attractive. Policymakers may replace it with direct transfers or tax
cuts, which would at least avoid reducing private spending, or they may want to forego discretionary
stimulus altogether and rely on the automatic fiscal stabilizers and monetary policy for cushioning
28ECBWorking Paper Series No 1267November 2010
the effect of recessions. Even more so as the discretionary stimulus will add further to government
debt down the road. We will abstain from an analysis of economic welfare. Although, some of the
models considered would allow us to calculate consumer welfare, the utility of representative house-
holds may not be considered very practical by policy makers as a guide in a downturn that imposes
unemployment or asset losses on some households but not on others.
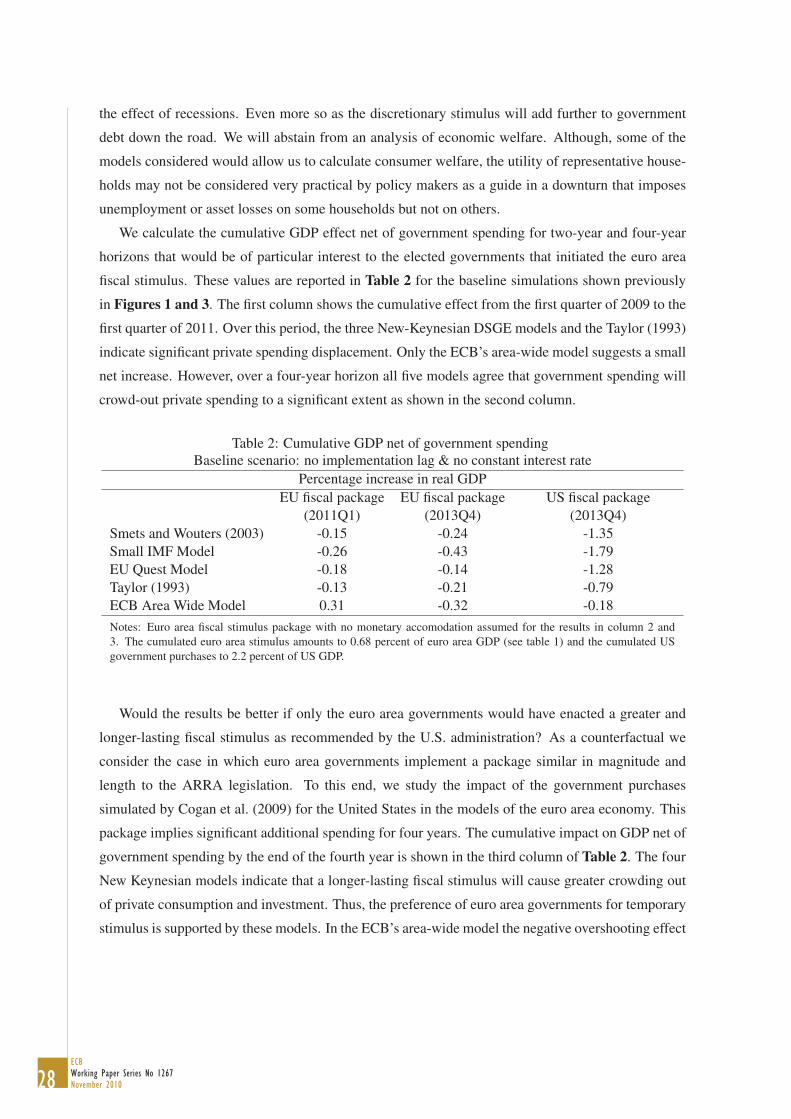
We calculate the cumulative GDP effect net of government spending for two-year and four-year
horizons that would be of particular interest to the elected governments that initiated the euro area
fiscal stimulus. These values are reported in Table 2 for the baseline simulations shown previously
in Figures 1 and 3. The first column shows the cumulative effect from the first quarter of 2009 to the
first quarter of 2011. Over this period, the three New-Keynesian DSGE models and the Taylor (1993)
indicate significant private spending displacement. Only the ECB’s area-wide model suggests a small
net increase. However, over a four-year horizon all five models agree that government spending will
crowd-out private spending to a significant extent as shown in the second column.
Baseline scenario: no implementation lag & no constant interest ratePercentage increase in real GDP
EU fiscal package EU fiscal package US fiscal package(2011Q1) (2013Q4) (2013Q4)
Smets and Wouters (2003) -0.15 -0.24 -1.35Small IMF Model -0.26 -0.43 -1.79EU Quest Model -0.18 -0.14 -1.28Taylor (1993) -0.13 -0.21 -0.79ECB Area Wide Model 0.31 -0.32 -0.18Notes: Euro area fiscal stimulus package with no monetary accomodation assumed for the results in column 2 and3. The cumulated euro area stimulus amounts to 0.68 percent of euro area GDP (see table 1) and the cumulated USgovernment purchases to 2.2 percent of US GDP.
Would the results be better if only the euro area governments would have enacted a greater and
longer-lasting fiscal stimulus as recommended by the U.S. administration? As a counterfactual we
consider the case in which euro area governments implement a package similar in magnitude and
length to the ARRA legislation. To this end, we study the impact of the government purchases
simulated by Cogan et al. (2009) for the United States in the models of the euro area economy. This
package implies significant additional spending for four years. The cumulative impact on GDP net of
government spending by the end of the fourth year is shown in the third column of Table 2. The four
New Keynesian models indicate that a longer-lasting fiscal stimulus will cause greater crowding out
of private consumption and investment. Thus, the preference of euro area governments for temporary
stimulus is supported by these models. In the ECB’s area-wide model the negative overshooting effect
Table 2: Cumulative GDP net of government spending

29ECB
Working Paper Series No 1267November 2010
is delayed resulting in a smaller crowding-out effect than under the two-year euro area package.
In the preceding section we investigated several issues that may influence the GDP effect of gov-
ernment spending recession, focusing in particular on implementation lags and zero bound effects.
Table 3 assesses these effects in combination. Implementation lags clearly reinforce the message of
the baseline simulations. Crowding out of consumption and investment dominates all cases over the
four-year horizon, and for all four New-Keynesian models over the two-year horizon. The cumula-
tive reduction in private-spending in the three DSGE models is noticeably greater than in the baseline
scenario in Table 2.
EU fiscal package: Percentage increase in real GDPcumulated to 2011Q1 cumulated to 2013Q4Implementation lag
Smets and Wouters (2003) -0.25 -0.33Small IMF Model -0.32 -0.54EU Quest Model -0.30 -0.24Taylor (1993) -0.10 -0.21ECB Area Wide Model 0.20 -0.16
Implementation lag & constant interest in 2009Smets and Wouters (2003) -0.22 -0.30Small IMF Model -0.26 -0.48EU Quest Model -0.16 -0.07Taylor (1993) 0.02 -0.09ECB Area Wide Model 0.22 -0.11
Implementation lag & constant interest 2009-2010Smets and Wouters (2003) -0.11 -0.16Small IMF Model 0.10 -0.10EU Quest Model 0.35 0.61Taylor (1993) 0.51 0.45ECB Area Wide Model 0.32 0.34
Implementation lag & constant interest in 2009 anticipated 09Q1& constant interest in 2010 anticipated in 10Q1
Smets and Wouters (2003) -0.19 -0.25Small IMF Model -0.16 -0.33EU Quest Model -0.01 0.16Taylor (1993) 0.20 0.14ECB Area Wide Model 0.29 0.29Notes: The table includes robustness scenarios. We consider monetary accommodation of 1 and2 years and an implementation lag of 2 quarters. The cumulated euro area stimulus amounts to0.68 percent of euro area GDP (see table 1).
If the notional interest target of the central bank moves below zero during the recession and stays
there long enough for the zero bound to bind throughout all of 2009, interest rates would not rise as
Table 3: Cumulative GDP net of government spending
30ECBWorking Paper Series No 1267November 2010
usually implied by the policy rule in response to fiscal stimulus throughout that year. This effect is
taken into account in our simulations by the anticipation of constant interest rates throughout 2009.
As a result the initial GDP effect of government spending is somewhat greater because the usual
increase in real interest rates is delayed. The cumulative sums net of government spending in the five
models are reported in the second set of rows in Table 2. Again, crowding-out of private spending
occurs the three current-generation New-Keynesian models over two- and four-year horizons, and in
all five models over the four-year horizon.
Crowding-in of private consumption and investment only occurs to a noticeable extent if interest
rates are anticipated to remain constant till the end of 2010 as early as the first quarter of 2009.
Of course, in this simulation inflation also increases more. In the New-Keynesian models the date
and extent of the anticipation of households and firms play an important role. We illustrate this by
analyzing the following scenario. Initially market participants expect monetary accommodation in
2009 but a return to the policy rule in 2010. New information on the central bank’s intentions then
leads them to update their expectations for another year of monetary accommodation at the beginning
of 2010. The resulting outcomes for the GDP impact of fiscal stimulus in the DSGE models are
closer to the case with 1-year of constant interest rates with crowding out of private consumption and
investment.16
6 Other approaches in the literature
In our analysis of the effects of government spending, we have focused on estimates obtained with
structural models of the euro area. Structural models are needed to dissect the effects of anticipations
by market participants under alternative assumptions regarding the timing of fiscal stimulus and the
interaction with monetary policy. We found that such anticipation effects have important implications
for the degree of crowding-out of private spending by increased government purchases.
However, there also exists a large empirical literature that utilizes reduced-form methods in order
to identify the likely effects of government spending shocks. Many of these studies focus on U.S.
data, but other also cover a wide range of OECD economies. As emphasized by Ramey (2009)
the U.S. studies remain divided on central questions such as whether the GDP effect is greater than
unity and whether private spending rises or falls in response to additional government purchases.
VAR techniques in which identification is achieved by assuming that government spending is pre-
determined within the quarter typically find a larger effect of government spending on GDP and
crowding-in of consumption (e.g. Blanchard and Perotti (2002), Fatas and Mihov (2001), Beetsma,16As to actual developments in the euro area, the ECB stopped lowering its overnight lending rate at 1% and its deposit
rate at 0.25% in May 2009 calling this an appropriate level. As of September 2009 it already started to lay out its strategy forexit from this monetary policy stance. The advent of European fiscal crisis in spring 2010 instead provided a new motivationfor maintaining the low level of nominal policy rates.
31ECB
Working Paper Series No 1267November 2010
Giuliodori, and Klaassen (2006) or Gali et al. (2007)) while studies using the Ramey-Shapiro "war
dates" (e.g. Ramey and Shapiro (1998), Burnside, Eichenbaum, and Fisher (2004), Ramey (2009))
indicate a smaller GDP effect and crowding-out of consumption. Indeed, these studies and other
more recent ones reveal a wide range of estimates of the GDP impact of government spending due
to difficulties in identifying the presumed government spending shocks. Using VAR techniques,
Blanchard and Perotti (2002) find a government spending multiplier close to one, Fatas and Mihov
(2001) estimate it to be greater than one, Beetsma et al. (2006) put it at 1.5 by the second year for
a range of European economies, while Gali et al. (2007) obtain a high-end estimate of 1.7 after two
years. These studies suggest that private consumption increases following a government spending
shock. Perotti (2005) looks at data from five OECD countries including Germany. He finds that
the effects of government spending on GDP tend to be small and below unity except for the U.S.
data. Furthermore, the GDP effect of government spending appears to have become weaker since
the 1980s. Using a different identification approach based on sign restrictions, Mountford and Uhlig
(2009) estimate a multiplier well below one for a deficit financed government spending shock with
substantial crowding-out of investment.
Clearly, identification is a problem. Ramey (2009) shows that increases in U.S. military spending
and non-defense spending are anticipated several quarters before they occur. Consequently, it is
important to capture the timing of the news about future increases government spending correctly.
Her multiplier estimates based on an war dates and defense news lie between 0.6 and 0.8 when
World War II is excluded, and near unity with World War II included. Similar empirical findings
are reported by Barro and Redlick (2009). They identify a defense spending multiplier of 0.6 to 0.7
including the World War II period and find a significant negative effect of defense-spending shocks
on private investment. A recent paper by Afonso, Grüner, and Kolerus (2010) analyses empirically if
the impact of government spending on GDP differs in crisis and non crisis times. They employ data
of OECD and non-OECD countries for the period 1981-2007 and use panel regression techniques. To
overcome endogeneity problems they use the distance to next and past elections and lagged budget
balance-to-GDP ratios as instruments for government spending. They cannot reject the hypothesis
that crisis spending and regular spending have the same impact on GDP and find an average fiscal
multiplier between 0.6 and 0.8 for the full sample.
How does this work relate to our analysis of the U.S. and euro area stimulus packages with struc-
tural models? The timing and nature of the anticipation of fiscal spending packages due to the ARRA
and EERP is known and need not be identified from macroeconomic time series. Of course, in esti-
mating the structural models one also obtains empirical monetary and fiscal policy reaction functions.
In Cogan et al. (2010) we use them to conduct simulations that are similar to the experiments in VAR
studies, namely a one-time surprise increase in government spending that dies out slowly according

32ECBWorking Paper Series No 1267November 2010
to an anticipated autoregressive process. They show that the effect of a typical government spend-
ing shock in the DSGE models with and without rule-of-thumb consumers estimated for the United
States is about 0.8 averaged over the first year, and thus similar to several of the above-mentioned
reduced-form studies. The euro area DSGE models considered in this paper fit well in this range.
Following the 2009 working papers by Romer and Bernstein (2009), Cogan et al. (2009) and
Cwik and Wieland (2009) an increasing number of studies have used other structural macroeconomic
models to assess the impact of different fiscal policy tools. An interesting extension of the EU-Quest
model by Roeger and in’t Veld (2009) includes a third type of households that are credit-constrained.
Their benchmark calibration apparently has 40% liquidity-constrained households and another 20%
credit constrained households, which would be too high relative to the survey evidence available
regarding the share of such households during the financial crisis. The IMF’s new preferred model
for fiscal policy analysis, the so-called GIMF model, has been used by Freedman, Kumhof, Laxton,
Muir, and Mursula (2010) to analyze the consequences of different fiscal measures. An innovative
element of this model is that it features overlapping generations of households with finite horizons. As
shown by Taylor (2010b) the effects of longer-lasting or permanent fiscal stimuli in the GIMF are very
close to the effects reported by Cogan et al. (2010) for New-Keynesian DSGE models. A short-term
government spending shock in GIMF has a multiplier of unity under normal circumstances which is
larger than in the DSGE models considered in Cogan et al. (2010) and this paper. Unfortunately, the
GIMF model is calibrated and not estimated with state-of-the-art methods to fit US or euro area data.
It would be very useful to see how it fares in estimation relative to the estimated models we have
used.
Recently, a very commendable model comparison study was executed by 17 researchers from the
IMF, OECD, ECB, Federal Reserve and European Commission in Coenen, Erceg, Freedman, Furceri,
Kumhof, Lalonde, Laxton, Lindé, Mourougane, Muir, Mursula, de Resende, Roberts, Roeger, Snud-
den, Trabandt, and in’t Veld (2010). It covers seven structural models used at policy institutions
including GIMF, the modified version of EU-Quest with additional constrained households, the Fed’s
SIGMA and FRB-US models, the OECD Fiscal Model, the Bank of Canada-GEM model and the
ECB’s New Area-Wide Model. The study refers to Cogan et al. (2009) but ignores the model com-
parison for the euro area by Cwik and Wieland (2009) from July 2009. They mostly find somewhat
higher short-run government purchases multipliers than Cogan et al. (2009) and attribute this differ-
ence to the assumption of rule-of-thumb households. Indeed, three of these models includes shares of
40 or 50% which is higher than the 28% share estimated by Cogan et al. (2009) and the shares of 13
to 25 % reported by the survey studies cited earlier. Coenen et al. (2010) tend to put greater emphasis
on the simulations with anticipation of two full years of monetary accommodation right at the start
of 2009 when fiscal stimulus was announced. However, they ignore the possibility of even moderate
33ECB
Working Paper Series No 1267November 2010
implementation lags.
Further comparison of our findings with those by Coenen et al. (2010) would be very useful. Un-
fortunately, Coenen et al. (2010) employ a traditional model comparison as in Taylor (1999) whereby
separate teams of researchers conduct a specific set of experiments, each team in their own model and
report outcomes. It would be very useful if the policy institutions that are represented by these re-
searcher teams would choose to create a platform for model comparison as in Wieland et al. (2009) or
add their models to this new model database. Such a platform would render their model simulations
also directly replicable and transparent to researchers outside these teams and institutions. Repli-
cability is a basic scientific standard that ensures that correct comparisons can be made and policy
recommendations can be properly scrutinized. Several of these institutions have already made earlier
models publicly available for such purposes and the publication of the Coenen et al. (2010) would
seem to provide a perfect occasion to proceed accordingly.
7 Government spending spillover effects in the euro area
Advocates of fiscal stimulus in the euro area were particularly concerned with spillover effects and
the potential for free-riding. The rationale was that unilateral stimulus in one country, for example in
Spain, would partly be diverted to a greater demand for import goods. As a result, other euro area
trading partners, say Germany, France or Italy, would benefit from Spanish fiscal stimulus. They
would even have an incentive to go slow on domestic stimulus while encouraging other countries,
a behavior referred to as "free-riding". This criticism was directed in particular at the German gov-
ernment that was perceived to have most room for additional fiscal spending thanks to past budget
consolidation.17 As indicated by our review of announced fiscal packages in the euro area, the Ger-
man government eventually announced by far the largest fiscal stimulus measures accounting for 51
% of the total euro area stimulus. Thus, the question now is whether the effect of German govern-
ment spending increases will pull along other euro area countries. Analyzing this question requires
an estimated macroeconomic multi-country model that accounts for a sufficient number of euro area
member economies separately. Unfortunately, such models are still relatively rare. One model at
our disposal is the Taylor (1993) model of the G7 economies. We use it to quantify the effect of the
spending measures announced by the German government on Germany, France and Italy.
Table 4 reports the effects on German, French and Italian GDP from the first quarter of 2009
to the fourth quarter of 2012. The first three rows indicate the outcome when these countries form
a monetary union, in other words, when the exchange rates are fixed and monetary policy aims at
stabilizing union-wide targets. Interestingly, the spill-over effects are rather small. In Italy they even
turn negative by the end of 2009. This finding is obtained even though the estimated export demand17An example, is the contribution of Paul Krugman cited in the first footnote in the introduction.

34ECBWorking Paper Series No 1267November 2010
equations for Italy and France indicate an economically significant direct foreign demand effect with
Germany as an important trading partner. This direct demand effect is overwhelmed by the indirect
effect of a real appreciation of the Euro. The fiscal expansion in Germany puts upward pressure on
the euro relative to the currencies of countries outside the monetary union (United States, Canada,
United Kingdom and Japan). As a result, France and Italy loose competitiveness and exports to
countries outside the euro area decline.
Table 4: Impact of German government expendituresPercentage increase in real GDP
2009Q1 2009Q4 2010Q4 2011Q4 2012Q4Monetary unionFrance 0.037 0.035 0.010 -0.009 0.002Germany 0.700 0.645 0.368 -0.078 -0.136Italy 0.014 -0.009 -0.046 -0.052 -0.018Flexible exchange ratesFrance 0.053 0.060 0.019 -0.018 -0.012Germany 0.636 0.493 0.224 -0.112 -0.063Italy 0.043 0.052 0.023 -0.014 -0.015Notes: The impact of the German fiscal stimulus package is simulatedwith the Taylor-Model. Euro area inflation and output gap are defined asa weighted average of German, French and Italian values. In the case of themonetary union simulation the euro area nominal interest rate reacts to euroarea inflation and output gap. We assume no change in the fiscal policy ofFrance and Italy.
Our findings differ from estimates of intra-European spillover effects obtained by Beetsma et al.
(2006). They estimate reduced-form trade equations and link them to VAR-based estimates of do-
mestic demand effects of government spending. A government spending increase of 1% of GDP in
Germany is then estimated to raise output in other euro area countries by 0.05 to 0.45 percent. How-
ever, Wieland (2006) points out that the data sample used by Beetsma et al. (2006), namely 1965 to
2004, covers monetary and exchange rate regime changes. At the beginning, exchange rates were
flexible, during the EMS period they were temporarily fixed but regularly adjusted in exchange rate
re-alignments until they became permanently fixed at the start of the euro area. Monetary policy
changed from independent national monetary policies, then some period of Bundesbank leadership in
the EMS to a single euro area policy. The estimates obtained by Beetsma et al. (2006) may be unduly
biased by ignoring these regime changes. In particular, positive spillovers in periods of fairly flexible
exchange rates contrast with small or even negative spillovers in periods of fixed exchange rates as
shown in Wieland (1996).
To further explore the role of the exchange rate in fiscal stimulus we conduct a counterfactual
simulation with flexible exchange rates between France, Germany and Italy and independent mon-
35ECB
Working Paper Series No 1267November 2010
etary policies. In this case, the effect of fiscal stimulus in Germany is reduced, because it is faced
with a larger appreciation of its currency vis-a-vis others. The spill-over effects to France and Italy,
however, would be positive. As emphasized by Wieland (2006) it is important to account for this
regime change in assessing the extent of likely spill-overs between euro area member economies.
The exchange rate appreciates on impact of the stimulus, because interest rates are expected to rise
and capital flows into the country. While empirical VAR studies that use data from before and after
monetary union will confound the differential spill-over effects from these two periods, they may be
distinguished by using a structural model. It would be of interest to estimate a New-Keynesian DSGE
model of the G-7 economies with more recent data and conduct a robustness analysis.
8 Government investment and transfers
Advocates of fiscal stimulus also often praise the additional benefits that can be obtained from gov-
ernment spending on infrastructure and other private sector productivity enhancing investments to
further the case for fiscal stimulus. Indeed, government expenditure on such infrastructure is impor-
tant but it may not be advisable to tie such construction to stimulus packages that are aimed to be
executed rapidly. Implementation lags are sure to be greatest with regard to major new infrastructure
construction. Leeper, Walker, and Yang (2009), for example, argue that due to implementation lags
expansionary government investment can cause a short-run contraction of output. And if pressure
is applied to accelerate spending of allocated funds, inefficient use and wastage due to inadequate
planning and insufficient competition is likely to be the result.
We have reviewed the stability programmes of national governments from 2008/2009 to separate
spending on infrastructure from other spending measures. We have focused on infrastructure rather
than simply checking whether the label "investment" is assigned to a particular measure. The reason
is that there is a natural tendency to qualify government initiatives as a form of investment rather
than consumption for public relations purposes. In some cases, in which measures were targeted only
partly at building new infrastructure without specification of the share, we assumed a share of 50 %.
Further details for each country are reported in the appendix.
To investigate the potential GDP impact of government investment, we turn to the EU-Quest
model. This model assumes that government investment helps raise overall production in the longer
run. The extent of this effect is shown in the top right panel of Figure 7. The bars refer to the
amount of infrastructure spending as a percent of GDP. The solid line depicts the impact of this
spending on GDP in the EU-Quest model. In this simulation, we abstract from implementation lags
or monetary accommodation. For comparison, the effect of the non-infrastructure component of
spending is simulated in the top left panel. Throughout 2009, government investment has similar
effect as government consumption in the EU-Quest model. In the second and subsequent years the
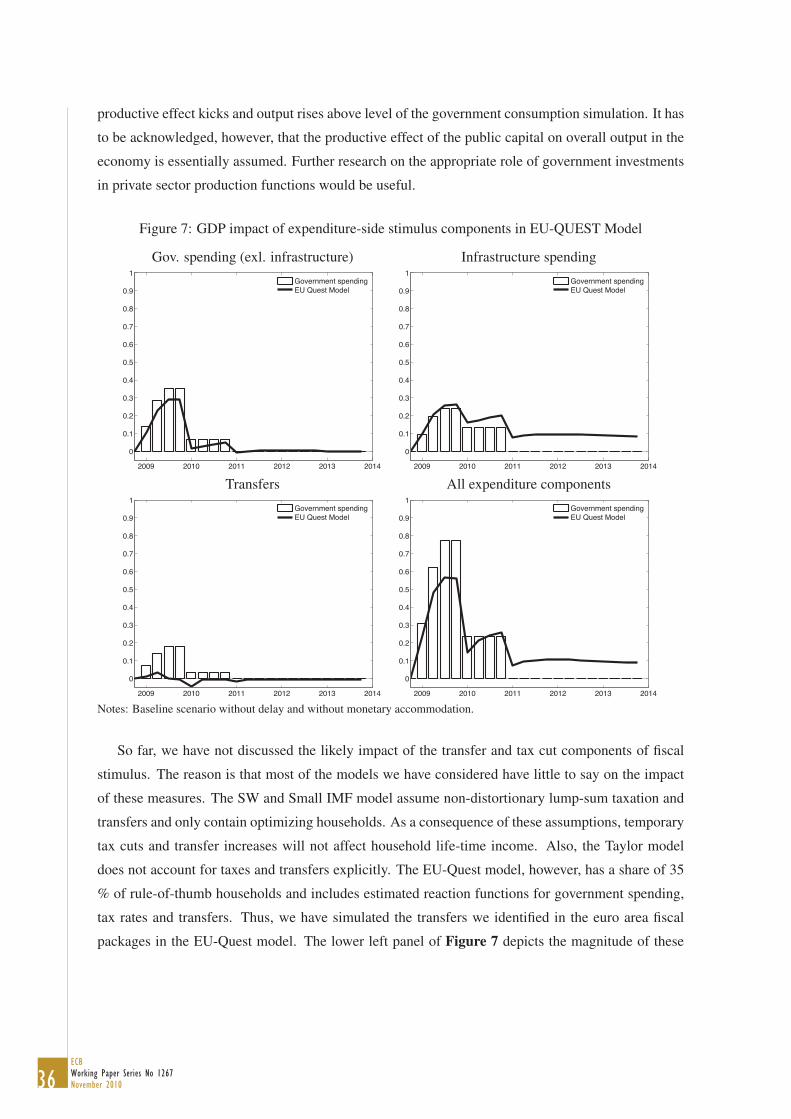
36ECBWorking Paper Series No 1267November 2010
productive effect kicks and output rises above level of the government consumption simulation. It has
to be acknowledged, however, that the productive effect of the public capital on overall output in the
economy is essentially assumed. Further research on the appropriate role of government investments
in private sector production functions would be useful.
Figure 7: GDP impact of expenditure-side stimulus components in EU-QUEST Model
Gov. spending (exl. infrastructure) Infrastructure spending
2009 2010 2011 2012 2013 2014
0
0.1
0.2
0.3
0.4
0.5
0.6
0.7
0.8
0.9
1Government spendingEU Quest Model
2009 2010 2011 2012 2013 2014
0
0.1
0.2
0.3
0.4
0.5
0.6
0.7
0.8
0.9
1Government spendingEU Quest Model
Transfers All expenditure components
2009 2010 2011 2012 2013 2014
0
0.1
0.2
0.3
0.4
0.5
0.6
0.7
0.8
0.9
1Government spendingEU Quest Model
2009 2010 2011 2012 2013 2014
0
0.1
0.2
0.3
0.4
0.5
0.6
0.7
0.8
0.9
1Government spendingEU Quest Model
Notes: Baseline scenario without delay and without monetary accommodation.
So far, we have not discussed the likely impact of the transfer and tax cut components of fiscal
stimulus. The reason is that most of the models we have considered have little to say on the impact
of these measures. The SW and Small IMF model assume non-distortionary lump-sum taxation and
transfers and only contain optimizing households. As a consequence of these assumptions, temporary
tax cuts and transfer increases will not affect household life-time income. Also, the Taylor model
does not account for taxes and transfers explicitly. The EU-Quest model, however, has a share of 35
% of rule-of-thumb households and includes estimated reaction functions for government spending,
tax rates and transfers. Thus, we have simulated the transfers we identified in the euro area fiscal
packages in the EU-Quest model. The lower left panel of Figure 7 depicts the magnitude of these

37ECB
Working Paper Series No 1267November 2010
transfers (bars) and the resulting impact on GDP in that model (solid line). The effect on GDP remains
very small. The lower-right panel reports the total euro area measures on the expenditure-side of the
government budget and their impact on GDP in the EU-Quest model.
9 What has happened so far? A 2010 perspective
Having focused so far, on investigating the likely effect of announced government spending in the
context of the EERP and national stimulus packages, it is worth taking stock of what has happened
since these announcements. One question of great interest would be whether these plans were carried
and to what extent they were implemented with some delay. For the United States, the Bureau of
Economic Analysis has published information on the stimulus money spent and its impact on the
government sector in the quarterly national accounts. A comparison between the planned increases
in government purchases underlying the simulations conducted by Cogan et al. (2010) and the actual
spending up to the second quarter of 2010 indicates that spending built up over time but stayed a
bit below the projected amounts. It would be very useful if the European Commission and national
euro area governments would similarly publish information on the actual spending pattern regarding
the announced measures. This information is crucial for appropriate ex-post evaluations of their
effectiveness. We have contacted experts at the European Commission and at the German finance
ministry but so far we have not been able to obtain such information nor to find out whether authorities
are conducting or planning to conduct such an ex-post assessment.
A narrative that we have heard repeatedly being told in policy circles or the media is that fiscal
stimulus played a crucial role in the recovery that started in the second quarter of 2009, and that its
removal at the end of 2010 may cause economies to fall back into recession. In the absence of any
information on actual stimulus spending carried out, we take a look at the available aggregate national
accounts data on government spending. The top left panel of Figure 8 reports the real GDP growth
contribution of government spending (red line) in the euro area from the first quarter of 2007 up to
and including the second quarter of 2010. It is rather flat and declines slightly towards the second
half of 2009. By contrast, real GDP growth (blue line) collapsed from the first quarter of 2008 to
the second quarter of 2009 and then started to recover in the second half of 2009 and accelerated at
the beginning of 2010. It would seem to be difficult to make a case for a crucial role of government
spending in stimulating growth based on the inspection of this chart.
The lower-left panel plots the real GDP growth contribution coming from private consumption.
Consumption declines somewhat during the recession and picks up again in the second half of 2009.
Consumption growth variation, however, is rather small relative to variation in GDP growth. This ob-
servation, at least, is not inconsistent with the consumption-smoothing implication of the permanent-
income hypothesis. As shown in the top right panel, the real GDP growth contribution of fixed invest-

38ECBWorking Paper Series No 1267November 2010
ment explains much of the variation in GDP growth, together with significant contributions coming
from net exports and inventory investment (lower right panel). This observation suggests that factors
such as real interest rates, risk premia and credit availability that influence investment and net exports
receive a crucial role in any explanation of the recession and recovery. Regarding policy actions,
possible candidates that may have influenced the cost and availability of credit include central bank
interest rate cuts, credit and quantitative easing measures, as well as guarantees and capital injections
for financial institutions.
Figure 8: GDP growth contributions throughout the 2008-2010 recession and recovery
Government spending vs GDP Private investment vs GDP
Private consumption vs GDP Net exports and inventories vs GDP
Notes: Real GDP growth and growth contributions of GDP components. Source: ECB. Vintage: September 2010.
10 Consolidation-cum-stimulus: Estimated effects of government sav-
ings packages
Looking forward, the observed rapid increase in government indebtedness raises the question of when
and how to start consolidating government finances. Many supporters of fiscal stimulus in the re-
cession tend to worry about negative fall-out for economic activity coming from the expectation of
fiscal consolidation. We aim to address this concern by simulating the consequences of government
spending cuts in the models under consideration. Not surprisingly, the ECB’s Area-Wide model that
assumes largely backward-looking behavior exhibits symmetric behavior under government spend-
ing and government savings packages and supports concerns about the negative impact of impending
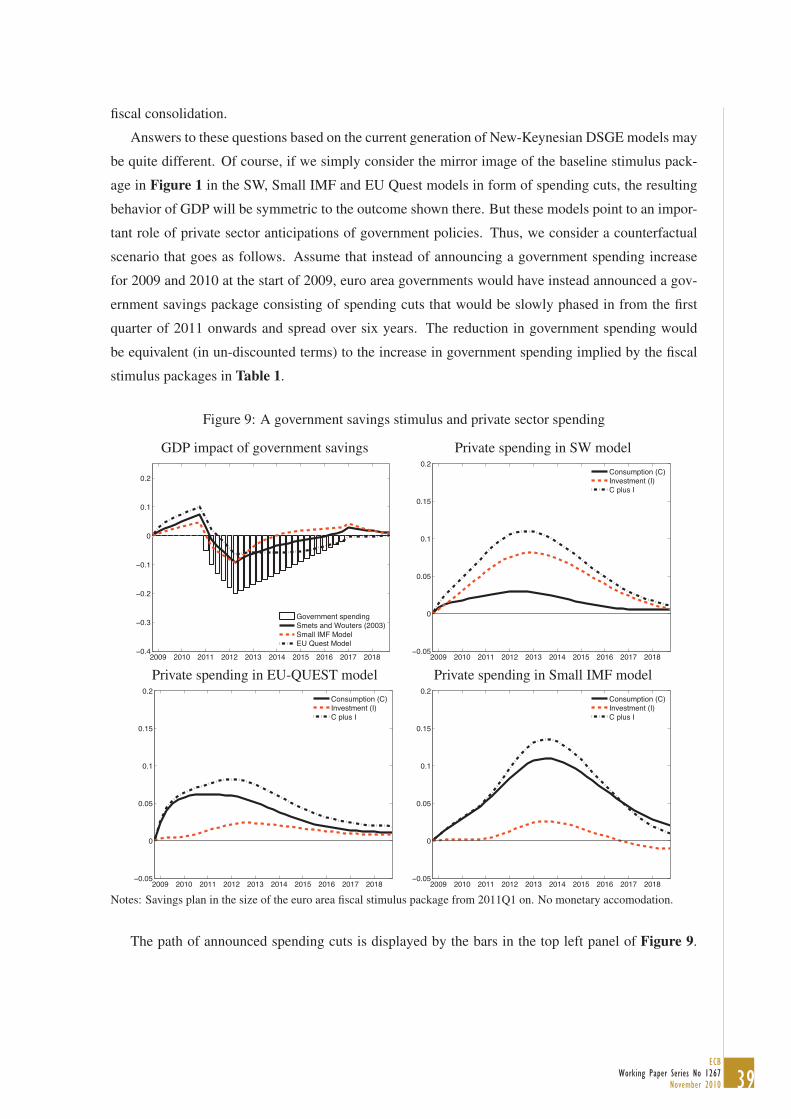
39ECB
Working Paper Series No 1267November 2010
fiscal consolidation.
Answers to these questions based on the current generation of New-Keynesian DSGE models may
be quite different. Of course, if we simply consider the mirror image of the baseline stimulus pack-
age in Figure 1 in the SW, Small IMF and EU Quest models in form of spending cuts, the resulting
behavior of GDP will be symmetric to the outcome shown there. But these models point to an impor-
tant role of private sector anticipations of government policies. Thus, we consider a counterfactual
scenario that goes as follows. Assume that instead of announcing a government spending increase
for 2009 and 2010 at the start of 2009, euro area governments would have instead announced a gov-
ernment savings package consisting of spending cuts that would be slowly phased in from the first
quarter of 2011 onwards and spread over six years. The reduction in government spending would
be equivalent (in un-discounted terms) to the increase in government spending implied by the fiscal
stimulus packages in Table 1.
Figure 9: A government savings stimulus and private sector spending
GDP impact of government savings Private spending in SW model
2009 2010 2011 2012 2013 2014 2015 2016 2017 2018−0.4
−0.3
−0.2
−0.1
0
0.1
0.2
Government spendingSmets and Wouters (2003)Small IMF ModelEU Quest Model
2009 2010 2011 2012 2013 2014 2015 2016 2017 2018−0.05
0
0.05
0.1
0.15
0.2Consumption (C)Investment (I)C plus I
Private spending in EU-QUEST model Private spending in Small IMF model
2009 2010 2011 2012 2013 2014 2015 2016 2017 2018−0.05
0
0.05
0.1
0.15
0.2Consumption (C)Investment (I)C plus I
2009 2010 2011 2012 2013 2014 2015 2016 2017 2018−0.05
0
0.05
0.1
0.15
0.2Consumption (C)Investment (I)C plus I
Notes: Savings plan in the size of the euro area fiscal stimulus package from 2011Q1 on. No monetary accomodation.
The path of announced spending cuts is displayed by the bars in the top left panel of Figure 9.

40ECBWorking Paper Series No 1267November 2010
Implementation lags are no issue, because government authorities have two years lead-time for plan-
ning and executing this reduction in government purchases. Given the consolidation plan is credible,
households and firms will anticipate it as of the first quarter of 2009. It will imply a reduction in cur-
rent or future taxation that increases household life-time income. As a result, households will start to
consume more. Similarly, the positive wealth effect impacts investment. Expected real interest rates
decline, the price of capital rises and private investment goes up. As a consequence GDP increases
throughout 2008 and 2009 in all three New-Keynesian DSGE models as indicated by the solid, dashed
and dotted lines in the top-left panel of Figure 9. This crowding-in effect is largest in the EU-Quest
model due to the presence of 35% of rule-of-thumb consumers. The short-run multiplier in 2009
and 2010 is infinite because no government spending occurs. From 2011 onwards GDP declines as
government spending cuts kick in. The trough is reached in 2012. It is of similar absolute magnitude
as the peak effect in 2010. As can be seen in the top right and bottom panels of Figure 9, private
consumption and investment spending remains above baseline throughout the full 6-year period of
fiscal consolidation.
In practice, taxes are mostly distortionary and not lump-sum. Thus, spending cuts would allow
a reduction in distortionary taxation with positive effect on longer-run growth. If consolidation and
debt reduction are a priority, then some of the savings could be applied to debt reduction rather than
tax cuts and short-run stimulus.
The idea for the proposal of government savings packages is related to the analysis of government
spending shocks by Corsetti, Meier, and Mueller (2009) and Corsetti, Meier, and Mueller (2010).
Based on VAR studies they argue that positive government spending shocks are following by a de-
cline in government spending that turns to spending cuts about 9 quarters after the initial shock. Then
they implement this government spending process in a calibrated New-Keynesian DSGE model and
show that the anticipation of future spending cuts induces a greater initial multiplier effect with some
crowding in of consumption. Wieland (2010) finds that the ratio of anticipated spending cuts to spend-
ing increases in absolute value is 1.1. Thus, future spending cuts are greater than initial increases.
Neither the ARRA nor the EERP stimulus packages included announcements of such substantial fu-
ture spending cuts. Furthermore, there is no indication that market participants in the United States or
Europe formed an expectation of spending cuts of equal or greater size than these stimulus packages
in the first quarter of 2009. Wieland (2010) therefore concludes that the empirical case for expecting
such cuts upon announcement of the stimulus packages is rather weak.
New-Keynesian DSGE models, however, generate a strong normative prescription. Properly de-
signed government savings packages announced with sufficient lead time can provide significant
short-run stimulus. If such a plan had been announced in the beginning of 2009 it could have boosted
private spending in 2009 and 2010. This boost would have been re-inforced further in case of mon-

41ECB
Working Paper Series No 1267November 2010
etary accommodation due to zero-bound effects. Figure 10 illustrates the additional boost to private
spending and GDP if nominal interest rates are anticipated to remain constant in 2009 and 2010.
Figure 10: Government savings stimulus when nominal interest remains constant
Constant rates in 2009 Constant rates in 2009 and 2010
2009 2010 2011 2012 2013 2014 2015 2016 2017 2018−0.4
−0.3
−0.2
−0.1
0
0.1
0.2
Government spendingSmets and Wouters (2003)Small IMF ModelEU Quest Model
2009 2010 2011 2012 2013 2014 2015 2016 2017 2018−0.4
−0.3
−0.2
−0.1
0
0.1
0.2
Government spendingSmets and Wouters (2003)Small IMF ModelEU Quest Model
11 Conclusions
In this paper we have constructed an estimate of the additional government expenditures in the euro
area in conjunction with the measures announced in national fiscal stimulus packages for 2009 and
2010. According to our calculations the euro area stimulus is primarily driven by measures taken
by the German government and to a smaller part by the Spanish and French governments. We have
then used a comparative, model-based approach to assess the likely impact of these measures on
euro area GDP. Proponents of discretionary fiscal stimulus emphasize the Keynesian multiplier effect
that implies that additional government spending would induce an increase in private spending and
therefore a greater than one-for-one effect on aggregate GDP. We investigate this proposition by using
empirical macroeconomic models with Keynesian features such as price and wage rigidities. Four of
the models we use have been developed and estimated at central banks and international institutions.
Three of these models are New-Keynesian DSGE models that represent the current state of the art of
policy analysis.
In the baseline scenario, New-Keynesian models do not support a text-book Keynesian multi-
plier effect. The European government spending plans would result in a reduction in private sector
spending for consumption and investment purposes. The reason is the forward-looking behavior
of households and firms. They anticipate higher tax burdens and higher interest rates in the future
and therefore reduce consumption and investment. Only the ECB’s area-wide model, which largely
ignores forward-looking behavior, is found to generate government spending multipliers that are sig-
nificantly above one. Although such models are useful for short-term forecasting in the absence of
42ECBWorking Paper Series No 1267November 2010
major policy changes they are not well-suited for analyzing the effect of such changes. The New-
Keynesian models instead account for the likely response of forward-looking optimizing households
and firms.
We then discuss a number of factors that may have played a role in the recession of 2008 and 2009.
Time lags arise because of the steps needed to move from a timely announcement to actual imple-
mentation of government spending plans. Such implementation lags lead to more crowding out and
may even cause an initial contraction. In a deep recession, the zero-bound on nominal interest rates
may cause the central bank to abstain to raise interest rates in response to fiscal stimulus as in nor-
mal times, because its notional interest target is below zero. Such implicit monetary accommodation
increases the GDP impact of government spending. Crowding-in, however, requires an immediate
anticipation of at least two years at the zero bound.
We have also analyzed the possibility of spillover effects within the euro area using the Taylor
(1993) model. This model, which assumes forward-looking, rational expectations and price and wage
rigidities, accounts for the French, German and Italian economies separately. The spillover effects of
the German stimulus measures with regard to France are very small. They even turn slightly negative
in the case of Italy at the end of 2009. Direct demand effects are overwhelmed by the indirect effect of
an euro appreciation. For further research on euro area spillovers it would be of interest to estimate a
multi-country New-Keynesian DSGE model with more recent data and conduct a robustness analysis.
In this paper, we have investigated the possibility of Keynesian multiplier effects using empirical
macroeconomic models with Keynesian features. In contrast with real business cycle models, the
estimated New-Keynesian models assume "sticky prices" by introducing staggered price and wage
setting. But as Chari, Kehoe, and McGrattan (2009) have emphasized the models go further in the
Keynesian direction by assuming "the backward indexation of prices" in "a mechanical way" which
amplifies Keynesian aggregate demand effects of policy. Addressing this criticism by eliminating
these features from the New Keynesian models would tend to further strengthen the case against dis-
cretionary fiscal stimulus. For example, Uhlig (2009) considers a neoclassical growth model with
endogenous labor and various fiscal instruments and concludes that massive expansions in govern-
ment spending such as the ARRA package in the United States come at substantial costs in terms of
total output over the longer run.
Finally, we have turned to the question of fiscal consolidation. We illustrate that New-Keynesian
DSGE models provide a strong-case for government savings packages. Announced with sufficient
lead time, anticipated future spending cuts induce a significant short-run stimulus and sustained
crowding-in of private spending.

43ECB
Working Paper Series No 1267November 2010
References
A. Afonso, H. P. Grüner, and C. Kolerus. Fiscal policy and growth: do financial crises make a
difference? ECB Working Paper Series No 1217, 2010.
R. Barro. Voodoo multipliers. Economist’sVoice, February 2009, 2009.
R. Beetsma, M. Giuliodori, and F. Klaassen. Trade spill-overs of fiscal policy in the european union:
a panel analysis. Economic Policy, 21(48):639–687, October 2006.
O. Blanchard and R. Perotti. An empirical characterization of the dynamic effects of changes in
government spending and taxes on output. Quarterly Journal of Economics, 117:1329–1368, 2002.
M. Bodenstein, C. J. Erceg, and L. Guerrieri. The effects of foreign shocks when interest rates are at
zero. International Finance Discussion Papers, 2009.
A. Boersch-Supan, T. Bucher-Koenen, M. Gasche, and M. Ziegelmeyer. Deutsche privathaushalte in
der finanz- und wirtschaftskrise - betroffenheit und reaktionen. MEA Studies 10, 2010.
C. Burnside, M. Eichenbaum, and J. Fisher. Fiscal shocks and their consequences. Journal of Eco-
nomic Theory, 115:89–117, 2004.
V. V. Chari, P. J. Kehoe, and E. R. McGrattan. New keynesian models: Not yet useful for policy
analysis. American Economic Journal Macroeconomics, 1 (1):242–266, 2009.
L. Christiano, M. Eichenbaum, and S. Rebelo. When is the government spending multiplier large?
NBER Working Paper 15394, 2009.
L. J. Christiano, M. Eichenbaum, and C. L. Evans. Nominal rigidities and the dynamic effects of a
shock to monetary policy. Journal of Political Economy, 113 (1):1–45, 2005.
K. Christoffel, G. Coenen, and A. Warne. The new area-wide model of the euro area: a micro-founded
open-economy model for forecasting and policy analysis. ECB Working Paper 944, 2008.
M. S. Claudia Sahm and J. Slemrod. Check in the mail or more in the paycheck: Does the effective-
ness of fiscal stimulus depend on how it is delivered? NBER Working Paper 16246, 2010.
G. Coenen and R. Straub. Does government spending crowd in private consumption? theory and
empirical evidence for the euro area. International Finance, 8(3):435–470, 2005.
G. Coenen and V. Wieland. The zero-interest-rate bound and the role of the exchange rate for mone-
tary policy in japan. Journal of Monetary Economics, 50, 2003.
G. Coenen, A. Orphanides, and V. Wieland. Price stability and monetary policy effectiveness when
44ECBWorking Paper Series No 1267November 2010
nominal interest rates are bounded at zero. Berkeley Electronic Press: Advances in Macroeco-
nomics 4, issue1, Article1, January, 2004.
G. Coenen, C. J. Erceg, C. Freedman, D. Furceri, M. Kumhof, R. Lalonde, D. Laxton, J. Lindé,
A. Mourougane, D. Muir, S. Mursula, C. de Resende, J. Roberts, W. Roeger, S. Snudden, M. Tra-
bandt, and J. in’t Veld. Effects of fiscal stimulus in structural models. IMF Working Papers, 2010.
J. F. Cogan, T. Cwik, J. B. Taylor, and V. Wieland. New keynesian versus old keynesian government
spending multipliers. NBER Working Paper Series No. 14782, 2009.
J. F. Cogan, T. Cwik, J. B. Taylor, and V. Wieland. New keynesian versus old keynesian government
spending multipliers. Journal of Economic Dynamics and Control, 34:281–295, 2010.
G. Corsetti, A. Meier, and G. Mueller. Fiscal stimulus with spending reversals. IMF Working Paper
09/106, 2009.
G. Corsetti, A. Meier, and G. Mueller. Cross-border spillovers from fiscal stimulus. International
Journal of Central Banking, 2010.
A. Dieppe, K. Kuester, and P. McAdam. Optimal monetary policy rules for the euro area: An analysis
using the area wide model. Journal of Common Market Studies, 43(3):507–537, 2005.
Dutch Ministry of Finance. Netherlands stability programme, addendum. December 2008.
G. Fagan, J. Henry, and R. Mestre. An area-wide model for the euro area. Economic Modelling, 22:
39–59, 2005.
R. Fair and J. Taylor. Solution and maximum likelihood estimation of dynamic nonlinear rational
expectations models. Econometrica, 51:1169–1185, 1983.
A. Fatas and I. Mihov. The effects of fiscal policy on consumption and employment: Theory and
evidence. CEPR Discussion Papers 2760, 2001.
Finnish Ministry of Finance. Stability programme update for finland, information on the fiscal mea-
sures. December 2008.
L. Forni, L. Monteforte, and L. Sessa. The general equilibrium effects of fiscal policy: Estimates for
the euro area. Journal of Public Economics, 93:559–585, 2009.
C. Freedman, M. Kumhof, D. Laxton, D. Muir, and S. Mursula. Global effects of fiscal stimulus
during the crisis. Journal of Monetary Economics, 57:506–526, 2010.
French Ministry of Finance. French stability programme 2009-2012. 2009.

45ECB
Working Paper Series No 1267November 2010
J. Gali, J. D. López-Salido, and J. Vallés. Understanding the effects of government spending on
consumption. Journal of the European Economic Association, 5 (1):227–270, 2007.
D. Gerdesmeier and B. Roffia. Empirical estimates of reaction functions for the euro area. Swiss
Journal of Economics and Statistics, 140:37–66, 2004.
German Ministry of Finance. Brot und butter brief "der wirtschaftskrise entgegensteuern". 2009.
Greek Ministry of Finance. Addendum to the 2008 update of the hellenic stability and growth pro-
gramme 2008 - 2011. February 2009.
J. Henry, P. H. de Cos, and S. Momigliano. The short-term impact of government budgets on prices:
Evidence from macroeconometric models. Banca d’Italia Working Paper, 2004.
A. Hughes-Hallett and K. F. Wallis, editors. EMU Macroeconomic Model Comparison excercise for
the Euroconference 7-8 June 2002, 2004. Economic Modelling 21(5).
Irish Ministry of Finance. Addendum to the irish stability programme update. January 2009.
Italian Ministry of Finance. Italys stability programme 2008 update, decree-law no. 185/2008. 2009.
M. Juillard. Dynare: a program for the resolution and simulation of dynamic models with forward
variables through the use of a relaxation algorithm. CEPREMAP Working Paper 9602, 1996.
P. R. Krugman. It’s baaack: Japan’s slump and the return of the liquidity trap. Brookings Papers on
Economic Activity, 29(1998-2):137–206, 1998.
K. Kuester and V. Wieland. Insurance policies for monetary policy in the euro area. Journal of the
European Economic Association, 8:872–912, 2010.
M. Kumhof and D. Laxton. A party without a hangover? on the effects of u.s. government deficits.
IMF Working Paper 07/202, 2007.
D. Laxton and P. Pesenti. Monetary rules for small, open emerging economies. Journal of Monetary
Economics, 50:1109–1146, 2003.
D. Laxton, P. Isard, H. Faruqee, E. Prasad, and B. Turtelboom. Multimod mark iii the core dynamic
and steady-state models. IMF Occasional Paper No. 164, 1998.
E. Leeper, T. Walker, and S.-C. Yang. Government investment and fiscal stimulus in the short and
long runs. NBER Working paper 15153, 2009.
B. T. McCallum. Inflation targeting and the liquidity trap. Working Papers Central Bank of Chile,
2002.

46ECBWorking Paper Series No 1267November 2010
A. Mian and A. Sufi. The effects of fiscal stimulus: Evidence from the 2009 ’cash for clunkers’
program. NBER Working Paper 16351, 2010.
A. Mountford and H. Uhlig. What are the effects of fiscal policy shocks? Journal of Applied
Econometrics, 24:960–992, 2009.
A. Orphanides and V. Wieland. Price stability and monetary policy effectiveness when nominal
interest rates are bounded at zero. Finance and Economics Discussion Series No. 1998-3, 1998.
A. Orphanides and V. Wieland. Efficient monetary policy design near price stability. Journal of the
Japanese and International Economics, 14, 2000.
R. Perotti. Estimating the effects of fiscal policy in oecd countries. CEPR Discussion Paper 4842,
2005.
P. Pesenti. The global economy model: Theoretical framework. IMF Staff Papers 55, 2008.
Portuguese Ministry of Finance. Portuguese republic stability and growth programme 2008 - 2011,
update, "investment and employment initiative (iei)" programme. January 2009.
V. Ramey. Identifying government spending shocks: It’s all in the timing. NBER Working paper
15464, 2009.
V. Ramey and M. Shapiro. Costly capital reallocation and the effects of government spending.
Carnegie Rochester Conference on Public Policy, 1998.
M. Ratto, W. Roeger, and J. in’t Veld. Quest iii: An estimated open-economy dsge model of the euro
area with fiscal and monetary policy. Economic Modelling, 26(1):222–233, 2009.
D. Reifschneider and J. C. Williams. Three lessons for monetary policy in a low-inflation era. Journal
of Money, Credit and Banking, 32:936–966, 2000.
W. Roeger and J. in’t Veld. Fiscal policy with credit constrained households. Working Paper, 2009.
C. Romer and J. Bernstein. The job impact of the american recovery and reinvestment plan. 2009.
D. Saha and J. von Weizsäcker. Estimating the size of the european stimulus packages for 2009 an
update. Briefing Paper for the Annual Meeting of the Committee on Economic and Monetary Af-
fairs with the National Parliaments on 11-12 February 2009 at the European Parliament in Brussels,
2009.
F. Smets and R. Wouters. An estimated stochastic dynamic general equilibrium model of the euro
area. Journal of the European Economic Association, 1:1123–1175, 2003.

47ECB
Working Paper Series No 1267November 2010
F. Smets and R. Wouters. Shocks and frictions in u.s. business cycles: A bayesian dsge approach.
American Economic Review, 97:506–606, 2007.
Spanish Ministry of Finance. Stability programme update spain 2008-2011. 2009.
L.-E.-O. Svensson. The zero bound in an open economy: A foolproof way of escaping from a liquidity
trap. Monetary and Economic Studies, 19(S1):277–312, February 2001.
J. Taylor. The lack of an empirical rationale for a revival of discretionary fiscal policy. American
Economic Review, 99, 2009.
J. Taylor. Getting back on track: Policy lessons from the financial crisis. Federal Reserve Bank of St.
Louis Review, 92:165–176, 2010a.
J. B. Taylor. Macroeconomic Policy in a World Economy: From Econometric Design to Practical
Operation. WW Norton, New York, 1993.
J. B. Taylor. Monetary Policy Rules. NBER and Chicago Press, 1999.
J. B. Taylor. Comment on "global effects of fiscal stimulus during the crisis". Journal of Monetary
Economics, 57:527–530, 2010b.
J. B. Taylor and V. Wieland. Surprising comparative properties of monetary models: Results from a
new data base. NBER Working Paper 14849, 2009.
H. Uhlig. Some fiscal calculus. draft, May 2009.
V. Wieland. Monetary policy targets and the stabilization objective: a source of tension in the ems.
Journal of International Money and Finance, 15:95–116, 1996.
V. Wieland. "comment on ’trade spill-overs of fiscal policy in the european union: A panel analysis’.
Economic Policy, 48:680–684, 2006.
V. Wieland. Fiscal stimulus and the promise of future spending cuts. International Journal of Central
Banking, 6(1), 2010.
V. Wieland and M. Wolters. The diversity of forecasts from macroeconomic models of the u.s. econ-
omy. Economic Theory, forthcoming.
V. Wieland, T. Cwik, G. Mueller, S. Schmidt, and M. Wolters. A new comparative approach to
macroeconomic modelling and policy analysis. Manuscript, Center for Financial Studies, Frank-
furt, 2009.
M. Woodford. Convergence in macroeconomics: Elements of the new synthesis. AEA meeting,
January 2008, 2008.

48ECBWorking Paper Series No 1267November 2010
A Country details on the fiscal packages in the euro area (in bln Euro)
A.1 Austria
Category Measure 2009 2010
Early implementation of income tax reform 2.30 2.30Degressive depreciation deduction 0.23 0.34
Tax cuts Reduced VAT rate on medication 0.28 0.28Tax exemptions 0.16 0.16Burden reduction for families with children 0.51 0.51
3.48 3.59
Mandatory kindergarten year for all 0.07 0.07Regional employment initiatives 0.08 0.08
Government spending Spending package, September 2008 0.40 0.00(excl. infrastructure) Investment in public facilities 0.36 0.52
Energy saving cheques 0.10 0.00Additional research expenditure 0.05 0.05"Mittelstandsfonds"- venture capital fund for SMEs 0.04 0.04
1.10 0.76
Government spending Advancing of railroad investments 0.24 0.24(infrastructure) Investments into broad-band internet infrastructure 0.01 0.00
0.25 0.24
Transfers Subsidies to house saving scheme 0.02 0.020.02 0.02
Source: Saha and von Weizsäcker (2009): "Estimating the size of the European stimulus packages for 2009 An Update",Österreichisches Finanzministerium.
A.2 Ireland
Category 2009 2010
Tax cuts 0 0Government spending 0 0
Transfers 0 0Source: Saha and von Weizsäcker (2009): "Estimating the size of the European stimulus packages for 2009 An Update",Irish Ministry of Finance (2009): "Addendum to the Irish Stability Programme Update January 2009".

49ECB
Working Paper Series No 1267November 2010
A.3 Germany
Category Measure 2009 2010
Degressive depreciation deduction 1.94 4.33Higher tax-free allowances for companies 0.24 0.37Suspension of car tax on on new vehicles 0.44 0.13Tax deductibility of professionel commute 4.00 4.00Package for tax burden reduction, stabilisation of
Tax cuts Social security contributions and investment in families 4.22 12.04Income tax cut 2.90 6.04Reduction in health insurance contributions 3.00 6.50State payment of 50 percent social insurance forshort-time workers 1.15 1.15Reform of car tax 0.09 0.17
17.98 34.73
Premium for new car purchases 5.00 0.00Government spending Retraining and stronger job service 1.59 1.59(excl. infrastructure) Improvement of regional economic structure 0.30 0.00
Innovation support programme 0.45 0.457.34 2.04
Government spending Investments into transport infrastructure 1.00 1.00(infrastructure) Infrastructure investment programme 8.65 8.68
9.65 9.68
Transfers Increased child benefits 4.42 2.84Increased housing benefits 0.06 0.06
4.48 2.90
Source: Saha and von Weizsäcker (2009): "Estimating the size of the European stimulus packages for 2009 An Update",German Ministry of Finance (2009): Brot und Butter Brief " Der Wirtschaftskrise entgegensteuern", GDP: OECDEconomic Outlook, Gross domestic product, value, market prices.
A.4 Greece
Category 2009 2010
Tax cuts 0 0Government spending 0 0
Transfers 0 0Source:Saha and von Weizsäcker (2009): "Estimating the size of the European stimulus packages for 2009 An Update",Greek Ministry of Finance (2009): "Addendum to the 2008 update of the Hellenic Stability and Growth Programme2008 - 2011".
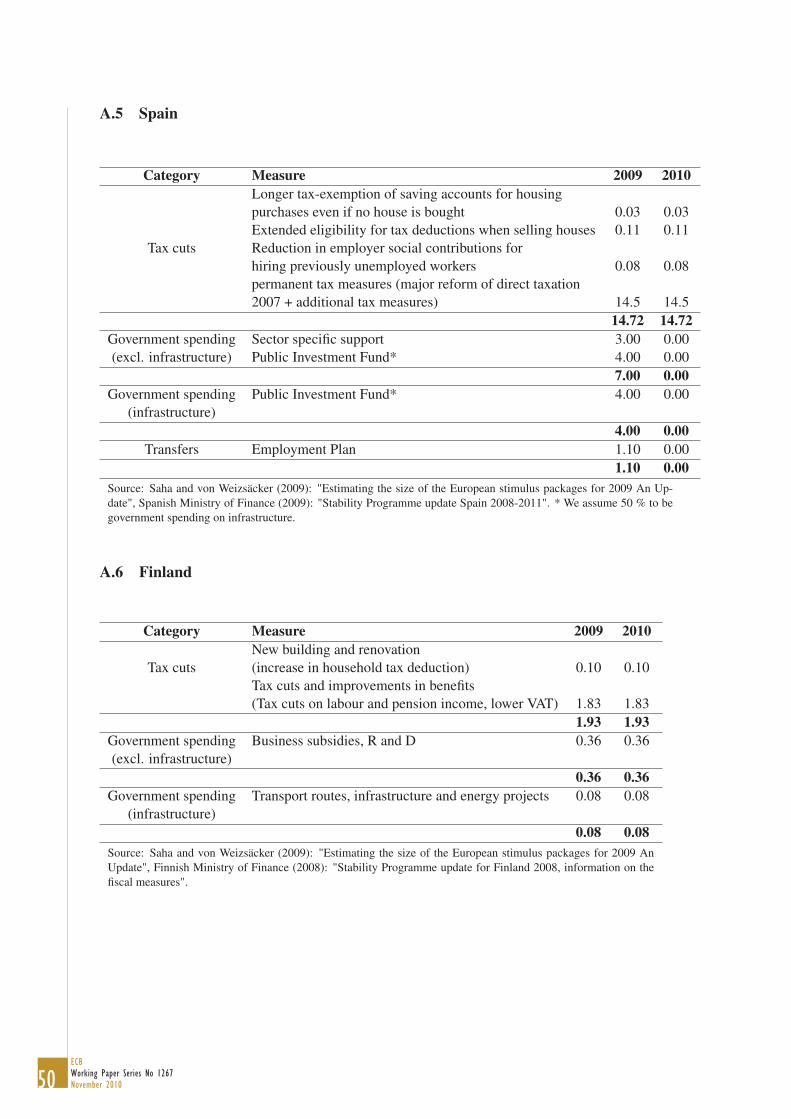
50ECBWorking Paper Series No 1267November 2010
A.5 Spain
Category Measure 2009 2010
Longer tax-exemption of saving accounts for housingpurchases even if no house is bought 0.03 0.03Extended eligibility for tax deductions when selling houses 0.11 0.11
Tax cuts Reduction in employer social contributions forhiring previously unemployed workers 0.08 0.08permanent tax measures (major reform of direct taxation2007 + additional tax measures) 14.5 14.5
14.72 14.72
Government spending Sector specific support 3.00 0.00(excl. infrastructure) Public Investment Fund* 4.00 0.00
7.00 0.00
Government spending Public Investment Fund* 4.00 0.00(infrastructure)
4.00 0.00
Transfers Employment Plan 1.10 0.001.10 0.00
Source: Saha and von Weizsäcker (2009): "Estimating the size of the European stimulus packages for 2009 An Up-date", Spanish Ministry of Finance (2009): "Stability Programme update Spain 2008-2011". * We assume 50 % to begovernment spending on infrastructure.
A.6 Finland
Category Measure 2009 2010
New building and renovationTax cuts (increase in household tax deduction) 0.10 0.10
Tax cuts and improvements in benefits(Tax cuts on labour and pension income, lower VAT) 1.83 1.83
1.93 1.93
Government spending Business subsidies, R and D 0.36 0.36(excl. infrastructure)
0.36 0.36
Government spending Transport routes, infrastructure and energy projects 0.08 0.08(infrastructure)
0.08 0.08
Source: Saha and von Weizsäcker (2009): "Estimating the size of the European stimulus packages for 2009 AnUpdate", Finnish Ministry of Finance (2008): "Stability Programme update for Finland 2008, information on thefiscal measures".

51ECB
Working Paper Series No 1267November 2010
A.7 France
Category Measure 2009 2010
Tax cuts Reduced obligation to contribute to social insuranceconditional on new hiring, for very small firms 0.70 0.00
0.70 0.00
Sectoral subsidies: housing industry, subsidies to building,Government spending renovation, buyers and renters 1.20 0.00(excl. infrastructure) State-owned enterprises investment 4.05 0.00
Sectoral subsidies: car industry 0.60 0.00Direct public investment (government and local government)* 3.25 2.00
9.10 2.00
Government spending Direct public investment (government and local government)* 3.25 2.00(infrastructure)
3.25 2.00
Increased payment to the endowment for the basicTransfers income provision 0.80 0.00
Social package (announced on 18.02.2009) 2.60 0.00Employment policies 0.50 0.00
3.90 0.00
Source: Saha and von Weizsäcker (2009): "Estimating the size of the European stimulus packages for 2009 An Update",French Ministry of Finance (2009): "French Stability Programme 2009-2012". * We assume 50 % to be governmentspending on infrastructure.
A.8 Belgium
Category Measure 2009 2010
Tax cuts Measures for construction sector 0.30 0.30No tax on credit insurance 0.02 0.02
0.32 0.32
Higher social security allocations 0.51 0.51Government spending Lower cost of using food safety agency 0.03 0.03(excl. infrastructure) Investments into green technology 0.02 0.02
Larger fund for energy cost reduction 0.01 0.010.57 0.57
Government spending Accelerated public investments 0.12 0.12(infrastructure)
0.12 0.12
Transfers Higher unemployment pay 0.10 0.00Energy subsidy to households 0.14 0.14
0.24 0.14
Source: Saha and von Weizsäcker (2009): "Estimating the size of the European stimulus packages for 2009 An Update".
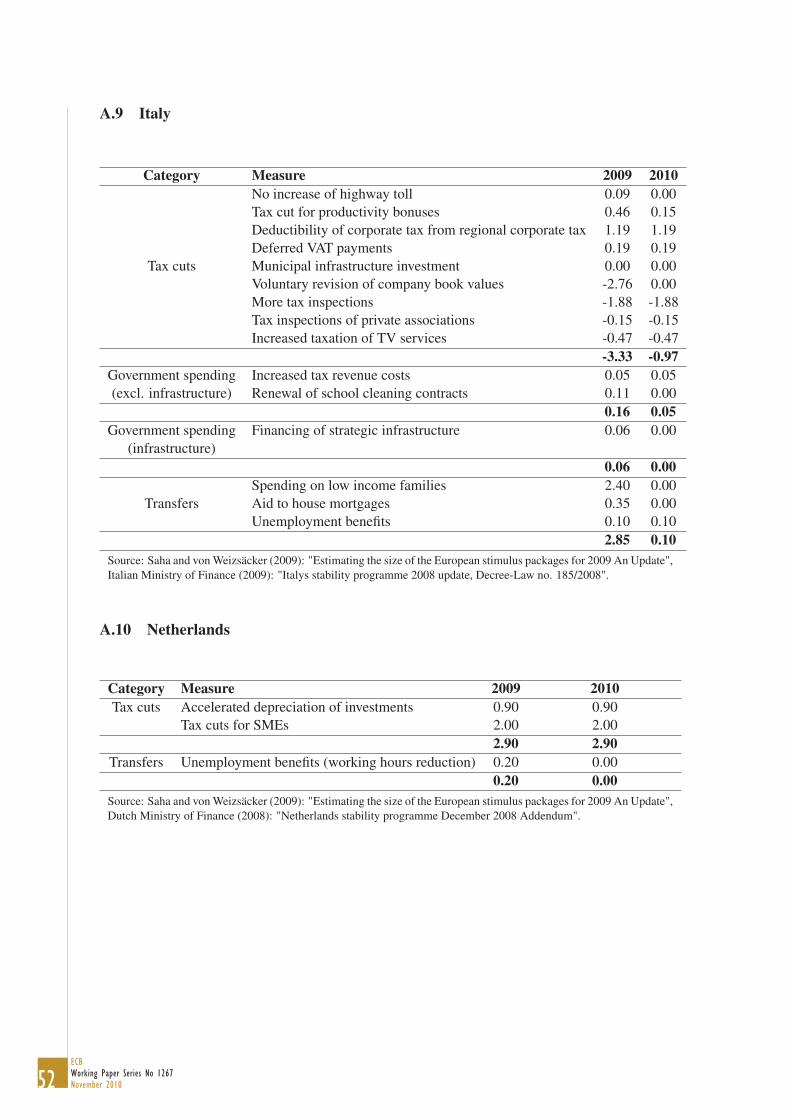
52ECBWorking Paper Series No 1267November 2010
A.9 Italy
Category Measure 2009 2010
No increase of highway toll 0.09 0.00Tax cut for productivity bonuses 0.46 0.15Deductibility of corporate tax from regional corporate tax 1.19 1.19Deferred VAT payments 0.19 0.19
Tax cuts Municipal infrastructure investment 0.00 0.00Voluntary revision of company book values -2.76 0.00More tax inspections -1.88 -1.88Tax inspections of private associations -0.15 -0.15Increased taxation of TV services -0.47 -0.47
-3.33 -0.97
Government spending Increased tax revenue costs 0.05 0.05(excl. infrastructure) Renewal of school cleaning contracts 0.11 0.00
0.16 0.05
Government spending Financing of strategic infrastructure 0.06 0.00(infrastructure)
0.06 0.00
Spending on low income families 2.40 0.00Transfers Aid to house mortgages 0.35 0.00
Unemployment benefits 0.10 0.102.85 0.10
Source: Saha and von Weizsäcker (2009): "Estimating the size of the European stimulus packages for 2009 An Update",Italian Ministry of Finance (2009): "Italys stability programme 2008 update, Decree-Law no. 185/2008".
A.10 Netherlands
Category Measure 2009 2010
Tax cuts Accelerated depreciation of investments 0.90 0.90Tax cuts for SMEs 2.00 2.00
2.90 2.90
Transfers Unemployment benefits (working hours reduction) 0.20 0.000.20 0.00
Source: Saha and von Weizsäcker (2009): "Estimating the size of the European stimulus packages for 2009 An Update",Dutch Ministry of Finance (2008): "Netherlands stability programme December 2008 Addendum".

53ECB
Working Paper Series No 1267November 2010
A.11 Portugal
Category Measure 2009 2010
Tax cuts Special support to economic activity, exports and SME 0.10 0.000.10 0.00
Government spending Modernisation of schools 0.30 0.30(excl. infrastructure)
0.30 0.30
Fostering Renewable Energies, Energy Efficiency andGovernment spending Energy Transmission Infrastructure 0.25 0.00
(infrastructure) Modernisation of technological infrastructure,new generation broadband networks 0.05 0.05
0.30 0.05
Transfers Protecting employment and strengthening social protection 0.30 0.000.30 0.00
Source: Portuguese Ministry of Finance (2009): Portuguese Republic Stability and Growth Programme 2008 - 2011,January 2009 Update, "Investment and Employment Initiative (IEI)" Programme.

Work ing PaPer Ser i e Sno 1118 / november 2009
DiScretionary FiScal PolicieS over the cycle
neW eviDence baSeD on the eScb DiSaggregateD aPProach
by Luca Agnello and Jacopo Cimadomo