keysight analog demodulation x-series measurement ... n9063a... · analog demodulation x-series...
TRANSCRIPT
KeysightAnalog Demodulation X-Series Measurement Application N9063A & W9063A
Technical Overview

Introduction
– Demodulate AM, FM, or PM – Quad view, simultaneously displays RF spectrum, demodulated
waveform, AF spectrum, demod metrics, and transient events such as attack/release time
– Analyze FM stereo signals for MPX, mono, stereo, channel characterization, and RDS/RBDS decoding
– Most complete set of post-demod filters – Speaker out (tune and listen) and analog output – Smooth migration from 8901A/B modulation analyzers

3
Available on all Keysight Technologies, Inc. X-Series signal analyzers, the analog demodulation measurement application transforms the X-Series into an easy-to-use transmitter tester for analog modulated signals, including AM, FM, PM, and FM stereo. By adding fast, one-button measurements, the analog demodulation measurement application helps you design, evaluate, and manufacture your analog devices quickly and accurately. Even in the modern digital world, the analog demodulation measurement application helps you to troubleshoot distortions due to unintentional, analog modulation from digitally modulated transmitters—allowing you to stay on the leading edge of your design and manufacturing challenges.
The analog demodulation measurement application is just one in a common library of more than 25 measurement applications in the Keysight X-Series, an evolutionary approach to signal analysis that spans instrumentation, measurements, and software. The X-Series analyzers, with upgradeable CPU, memory, solid-state drives, and I/O ports, enable you to keep your test assets current and extend instrument longevity. Proven algorithms, 100% code-compatibility, and a common UI across the X-Series create a consistent measurement framework for signal analysis that ensures repeatable results and measurement integrity so you can leverage your test system software through all phases of product development. In addition to fixed, perpetual licenses for our X-Series measurement applications, we also offer transportable licenses which can increase the value of your investment by allowing to you transport the application to multiple X-Series instruments.
Figure 1. The quad view allows you to watch the RF spectrum, demod, waveform, AF spectrum, and demodulation metrics simultaneously.
Analog Demodulation Measurement Application
Choosing Between X-Series Applications and 89600 VSA SoftwareX-Series measurement applications provide embedded format-specific, one button measurements for X-Series analyzers. With fast measurement speed, SCPI programmability, pass/fail testing and simplicity of operation, these applications are ideally suited for design verification and manufacturing. 89600 VSA software is a comprehensive set of tools for demodulation and vector signal analysis. These tools enable you to explore virtually every facet of a signal and optimize your most advanced designs. Use the 89600 VSA software with a variety of Keysight hardware platforms to pinpoint the answers to signal problems in R&D.
www.keysight.com/find/89600vsa

4
Analog Modulation and Demodulation Overview
Modulation is the process of translating some low-frequency or baseband signal (such as voice, music, or data) to a higher frequency (carrier signal). The primary reasons for modulation include allowing the simultaneous transmission of two or more baseband signals by translating them to different frequencies, and to take advantage of the greater efficiency and smaller size of higher-frequency antennae.
Analog modulation is the most fundamental modulation method. In analog modulation, the variations to the carrier are applied continuously in response to the analog information signal. By definition, the analog signal is continuous in time and amplitude, as opposed to a digital or discrete signal.
A high-frequency carrier signal commonly has sinusoidal form. There are two properties of a carrier signal that can be altered: 1) the amplitude (A) and 2) the angular position. Thus, there are amplitude modulation (AM) and angle modulation. Angle modulation can be further characterized as either frequency modulation (FM) or phase modulation (PM).
FM stereo is an enhancement to FM that uses stereo multiplexing. An FM stereo signal carries stereophonic programs in which signals are transmitted for L (left) and R (right) audio channels. Radio data system (RDS) consists of the text information such as traffic, weather, and radio station information carried in the FM signals. This information can be displayed on the screen of the end-user's device. RBDS is the United States version of RDS.
Table 1 summarizes these three formats of analog modulation.
Analog demodulation is a reverse process of the analog modulation. It offers quantitative assessments for analog modulation qualities. Analog demodulation is not only essential in testing FM or AM transmitters, but is also a powerful troubleshooting tool for analyzing unintentional signals from digitally modulated transmitters such as 2G/3G cellular phones, and wireless LAN and WiMAX™ devices. The FM demodulation measurement is also an excellent alternative for high-volume manufacturing of low-price digital wireless devices, such as Bluetooth®, where test throughput and manufacturing costs are critical.
The analog demodulation measurement application runs on the Keysight X-Series signal analyzers and provides fast, complete, and easy-to-use measurements of AM, FM, PM, or FM stereo/RDS signals.*
The primary targeted markets and use cases for the analog demodulation measurement application include:
– Radio transmitter tests – Signal generator calibration – FM stereo transmitter tests – HP/Keysight 8901A/B replacement – Incidental modulation analysis (such as AM to PM, AM to FM, etc.)
– Transient events and signal settling time analysis
*: FM stereo/RDS analysis requires N9063A-3FP
Table 1. Analog modulation formats
Modulation format
Modulation nature Primary characteristics
Amplitude modulation (AM)
Amplitude of carrier signal var-ies in direct proportion to the instantaneous amplitude of the baseband signal
AM depth, AM rate, modulation distortion
Frequency modulation (FM)
Frequency of carrier signal var-ies in direct proportion to the instantaneous amplitude of the baseband signal
FM deviation, FM rate, modula-tion distortion
Phase modulation (PM)
Phase shift of carrier signal varies in direct proportion to the instantaneous amplitude of the baseband signal
Phase deviation, PM rate, modu-lation distortion
FM stereo/RDS FM stereo is an enhancement to FM that uses stereo multiplexing consisting of a mono (L+R) signal, a stereo signal (L-R) and a pilot signal
FM deviation, FM rate, SINAD, distortion, THD, mono to stereo ratio, left to right ratio, 38 kHz pilot carrier freq error and phase error, RDS decoding
5
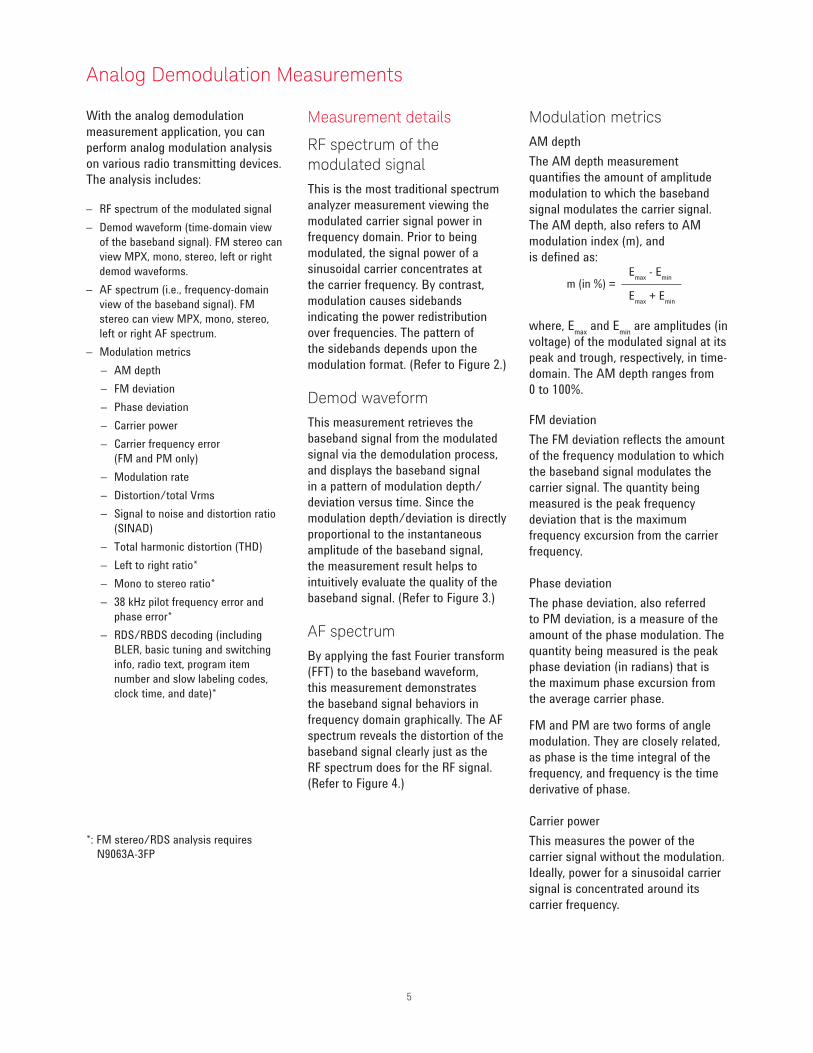
With the analog demodulation measurement application, you can perform analog modulation analysis on various radio transmitting devices. The analysis includes:
– RF spectrum of the modulated signal – Demod waveform (time-domain view
of the baseband signal). FM stereo can view MPX, mono, stereo, left or right demod waveforms.
– AF spectrum (i.e., frequency-domain view of the baseband signal). FM stereo can view MPX, mono, stereo, left or right AF spectrum.
– Modulation metrics – AM depth – FM deviation – Phase deviation – Carrier power – Carrier frequency error
(FM and PM only) – Modulation rate – Distortion/total Vrms – Signal to noise and distortion ratio
(SINAD) – Total harmonic distortion (THD) – Left to right ratio* – Mono to stereo ratio* – 38 kHz pilot frequency error and
phase error* – RDS/RBDS decoding (including
BLER, basic tuning and switching info, radio text, program item number and slow labeling codes, clock time, and date)*
*: FM stereo/RDS analysis requires N9063A-3FP
Measurement details
RF spectrum of the modulated signalThis is the most traditional spectrum analyzer measurement viewing the modulated carrier signal power in frequency domain. Prior to being modulated, the signal power of a sinusoidal carrier concentrates at the carrier frequency. By contrast, modulation causes sidebands indicating the power redistribution over frequencies. The pattern of the sidebands depends upon the modulation format. (Refer to Figure 2.)
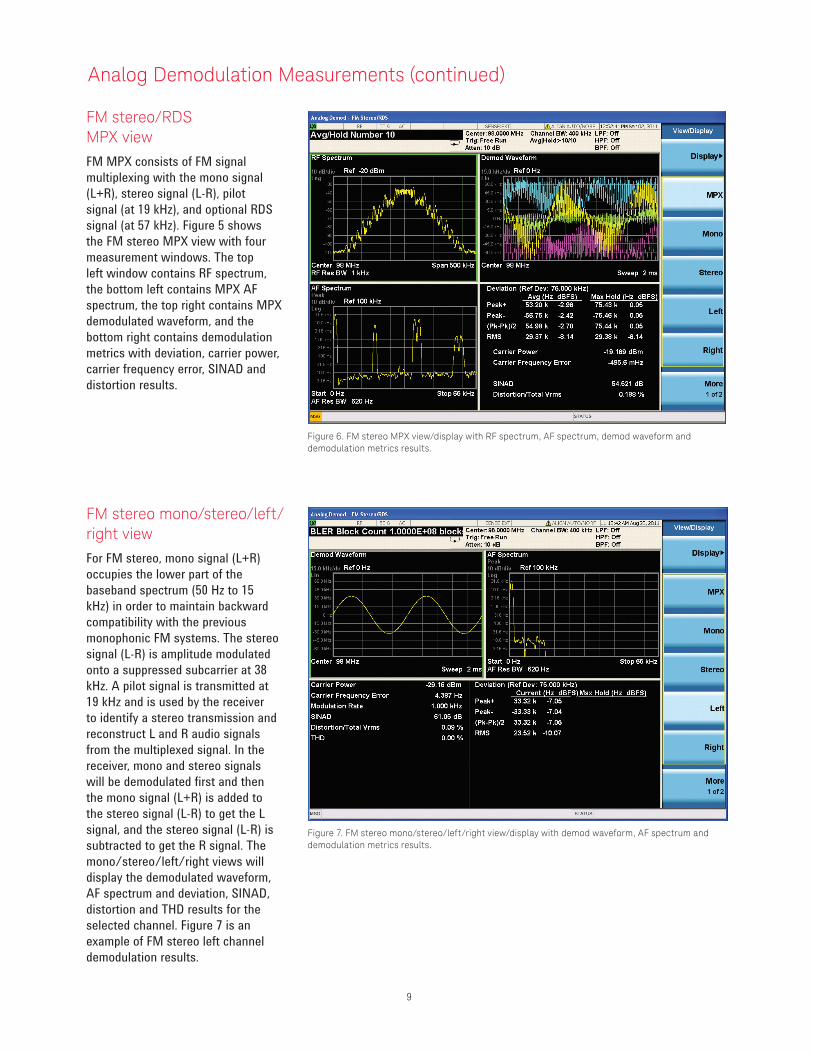
Demod waveformThis measurement retrieves the baseband signal from the modulated signal via the demodulation process, and displays the baseband signal in a pattern of modulation depth/deviation versus time. Since the modulation depth/deviation is directly proportional to the instantaneous amplitude of the baseband signal, the measurement result helps to intuitively evaluate the quality of the baseband signal. (Refer to Figure 3.)
AF spectrumBy applying the fast Fourier transform (FFT) to the baseband waveform, this measurement demonstrates the baseband signal behaviors in frequency domain graphically. The AF spectrum reveals the distortion of the baseband signal clearly just as the RF spectrum does for the RF signal. (Refer to Figure 4.)
Modulation metricsAM depthThe AM depth measurement quantifies the amount of amplitude modulation to which the baseband signal modulates the carrier signal. The AM depth, also refers to AM modulation index (m), and is defined as: Emax - Emin m (in %) = ————— Emax + Emin
where, Emax and Emin are amplitudes (in voltage) of the modulated signal at its peak and trough, respectively, in time-domain. The AM depth ranges from 0 to 100%.
FM deviationThe FM deviation reflects the amount of the frequency modulation to which the baseband signal modulates the carrier signal. The quantity being measured is the peak frequency deviation that is the maximum frequency excursion from the carrier frequency.
Phase deviationThe phase deviation, also referred to PM deviation, is a measure of the amount of the phase modulation. The quantity being measured is the peak phase deviation (in radians) that is the maximum phase excursion from the average carrier phase.
FM and PM are two forms of angle modulation. They are closely related, as phase is the time integral of the frequency, and frequency is the time derivative of phase.
Carrier powerThis measures the power of the carrier signal without the modulation. Ideally, power for a sinusoidal carrier signal is concentrated around its carrier frequency.
Analog Demodulation Measurements

6
Figure 2. The RF spectrum view presents the modulated signal along with the results of demodulation.
Carrier frequency errorThis measurement reports the difference between the nominal frequency and the actual frequency of the carrier. It is only available for the FM and PM.
Modulation rateThe modulation rate quantifies how fast the modulation is and equates to the frequency of the baseband signal that modulates the carrier.
Distortion/total VrmsModulation distortion is the undesired alterations added to the modulated signal by modulation processes. To assess the modulation quality of a transmitter, the modulation distortion needs to be quantified.
Modulation distortion is usually measured in a relative term against the total signal power:
where, Ptotal is the power of the total signal; Psignal is the power of the wanted modulating signal; and Ptotal - Psignal is the total unwanted signal
which can be further divided into the components of noise and harmonic distortion.
SINADAnother commonly used distortion measure is signal to noise and distortion ratio (SINAD). SINAD, in nature, is the reciprocal of the modulation distortion provided by the “distortion/total Vrms,” but the SINAD is usually expressed in a logarithmic term as follows:
SNRSignal to noise ratio (SNR) is defined as the ratio of total signal power to noise power:SNR = PSignal /PNoiseHowever, in practice, when the signal power PSignal is hard to get, and Pdistortion and PNoise are substantially smaller than PSignal . SNR can be approximated as:SNR ~ (PSignal + Pdistortion + PNoise)/PNoise.
This approximation has been adopted by HP/Keysight 8903A and therefore inherited to the N9063A analog demod application.
THDThe total harmonic distortion (THD) measurement further isolates the total harmonic distortion component from the noise component in the total unwanted signal. It helps the user to troubleshoot the root causes of modulation distortion.
Other featuresSelection of detectors Four types of detectors are provided: positive peak (Peak+), negative peak (Peak-), Peak/Peak average ((Pk-Pk)/2), and RMS. The Max Hold values for each detector are also displayed.
Comparing the result from the Peak+ detector and from the Peak- detector allows you to check modulation symmetry. For symmetric modulation, the Peak+, Peak-, and the (Pk-Pk)/2 detectors result in identical readings. For asymmetric modulation, the readings generated by the Peak+ and Peak- are different, and using the (Pk-Pk)/2 values is recommended.
The RMS detector results in the RMS (root-mean-square) value of modulation. It is a good choice when measuring noise or residual modulation, where the RMS value is generally more desirable than the peak value. The RMS detector is also a good choice for measuring non-sinusoidal signals.
½total signal
½total
(P - P )Modulation distortion (in %) = x 100%
(P )Modulation distortion (in %)
½total
½total signal
(P )SINAD (in dB) = 20 x log
(P - P )
Analog Demodulation Measurements (continued)
7
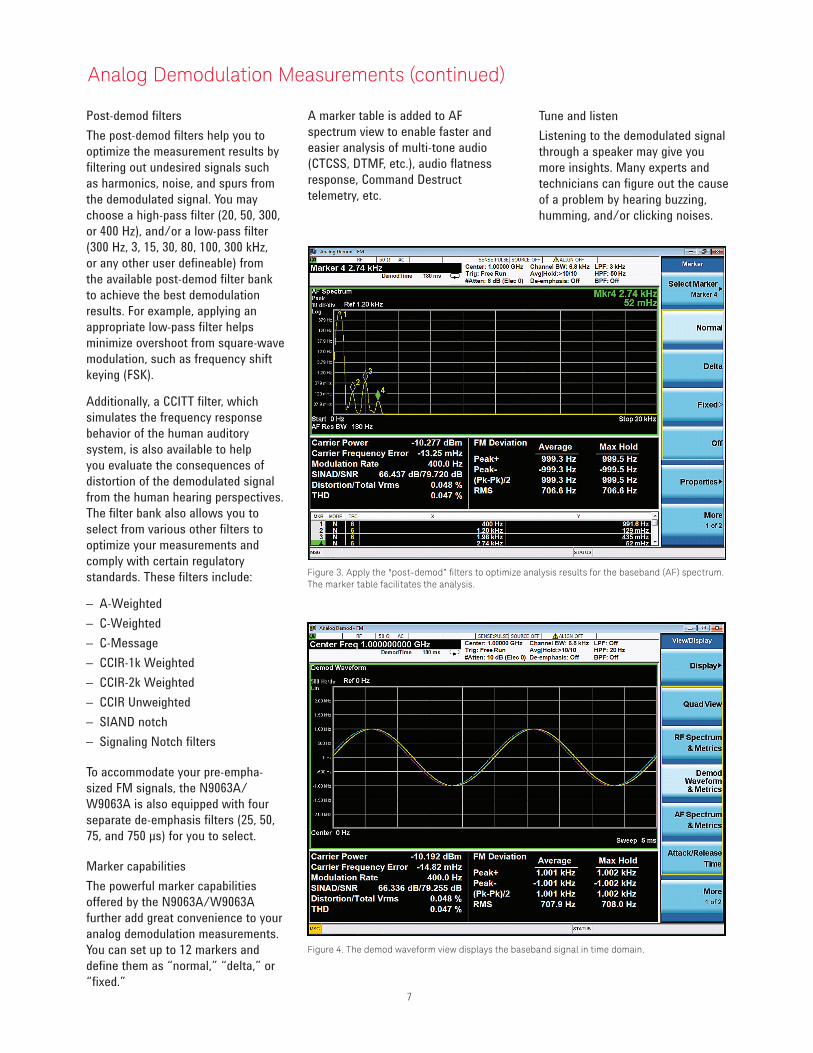
Post-demod filtersThe post-demod filters help you to optimize the measurement results by filtering out undesired signals such as harmonics, noise, and spurs from the demodulated signal. You may choose a high-pass filter (20, 50, 300, or 400 Hz), and/or a low-pass filter (300 Hz, 3, 15, 30, 80, 100, 300 kHz, or any other user defineable) from the available post-demod filter bank to achieve the best demodulation results. For example, applying an appropriate low-pass filter helps minimize overshoot from square-wave modulation, such as frequency shift keying (FSK).
Additionally, a CCITT filter, which simulates the frequency response behavior of the human auditory system, is also available to help you evaluate the consequences of distortion of the demodulated signal from the human hearing perspectives. The filter bank also allows you to select from various other filters to optimize your measurements and comply with certain regulatory standards. These filters include:
– A-Weighted – C-Weighted – C-Message – CCIR-1k Weighted – CCIR-2k Weighted – CCIR Unweighted – SIAND notch – Signaling Notch filters
To accommodate your pre-empha-sized FM signals, the N9063A/W9063A is also equipped with four separate de-emphasis filters (25, 50, 75, and 750 μs) for you to select.
Marker capabilitiesThe powerful marker capabilities offered by the N9063A/W9063A further add great convenience to your analog demodulation measurements. You can set up to 12 markers and define them as “normal,” “delta,” or “fixed.”
A marker table is added to AF spectrum view to enable faster and easier analysis of multi-tone audio (CTCSS, DTMF, etc.), audio flatness response, Command Destruct telemetry, etc.
Figure 3. Apply the "post-demod” filters to optimize analysis results for the baseband (AF) spectrum. The marker table facilitates the analysis.
Figure 4. The demod waveform view displays the baseband signal in time domain.
Analog Demodulation Measurements (continued)
Tune and listenListening to the demodulated signal through a speaker may give you more insights. Many experts and technicians can figure out the cause of a problem by hearing buzzing, humming, and/or clicking noises.

8
Accelerating measurements furtherThe X-Series signal analyzers offer great advantages in throughput with their industry-leading speed for measurements including the analog demodulation. By turning off the unneeded metrics, the analog demod measurement application allows you to further speed up your measurements.
Quantify the transient events with "Attack/Release" time viewAttack / Release Time is a new view type for measuring transient events, such as “attack” (transmitter turn-on), “release” (transmitter turn-off), and VCO settling characteristics. The upper display is RF Envelope (magnitude) vs. time; the lower display is FM Demod Waveform (frequency) vs. time. Transient measurements are single-shot, and require an External trigger edge to establish time t=0 (e.g. from the PTT button).
Certain measurements from TIA-603 - such as Carrier Attack Time, Transient Frequency Behavior, and Encoder Response Time - are much easier to make with this new view. The view can be used for general amplitude and frequency transient or settling measurements. And transmitters that use FM or FSK in a burst can also be captured and measured, with RF Burst trigger.
The view supports long post-demod waveforms, storing a post-demod FM Waveform up to 3.6M samples (previously limited to 1001 pts); this data is available for query via SCPI. Additionally, limit lines for FM Waveform can be imported from customer-defined CSV files and displayed.
Figure 5. "Attack/Release Time" view helps quantify the transient events in time domain.
The InfoBW control allows the user to trade off the bandwidth of the measurement (frequency range of demod) with the noise in the frequency measurement. Figure 5, the "Attack/Release view", captures the transient events in time domain when the modulation starts and the carrier power switches to different levels.
Analog Demodulation Measurements (continued)
9
FM stereo/RDS MPX viewFM MPX consists of FM signal multiplexing with the mono signal (L+R), stereo signal (L-R), pilot signal (at 19 kHz), and optional RDS signal (at 57 kHz). Figure 5 shows the FM stereo MPX view with four measurement windows. The top left window contains RF spectrum, the bottom left contains MPX AF spectrum, the top right contains MPX demodulated waveform, and the bottom right contains demodulation metrics with deviation, carrier power, carrier frequency error, SINAD and distortion results.
FM stereo mono/stereo/left/right viewFor FM stereo, mono signal (L+R) occupies the lower part of the baseband spectrum (50 Hz to 15 kHz) in order to maintain backward compatibility with the previous monophonic FM systems. The stereo signal (L-R) is amplitude modulated onto a suppressed subcarrier at 38 kHz. A pilot signal is transmitted at 19 kHz and is used by the receiver to identify a stereo transmission and reconstruct L and R audio signals from the multiplexed signal. In the receiver, mono and stereo signals will be demodulated first and then the mono signal (L+R) is added to the stereo signal (L-R) to get the L signal, and the stereo signal (L-R) is subtracted to get the R signal. The mono/stereo/left/right views will display the demodulated waveform, AF spectrum and deviation, SINAD, distortion and THD results for the selected channel. Figure 7 is an example of FM stereo left channel demodulation results.
Figure 6. FM stereo MPX view/display with RF spectrum, AF spectrum, demod waveform and demodulation metrics results.
Figure 7. FM stereo mono/stereo/left/right view/display with demod waveform, AF spectrum and demodulation metrics results.
Analog Demodulation Measurements (continued)

10
RDS/RBDS decoding results viewThe main objectives of FM RDS/RBDS are:
– To enhance functionality for FM receivers
– To make the receivers more user-friendly by using features such as PI (program identification), PS (program service) name display, and, if applicable, automatic tuning for portable and car radios.
RDS/RBDS uses the 57 kHz subcar-rier to carry the data at 1.1875 kbps bitrate. The 57 kHz subcarrier is chosen to be the third harmonic of the pilot tone. The deviation range of the FM carrier due to the unmodulated RDS/RBDS subcarrier is 1.0 kHz ± 7.5 kHz. Figure 8 is an example of the RDS/RBDS decoding view showing the results of the BLER, basic tuning and switching info, radio text, program item number and slow labeling codes, clock-time, and date information.
FM stereo numeric result summary viewFigure 9 shows the numeric result summary view with detailed MPX, mono, stereo, left, right, pilot, and RDS deviation, mod rate, SINAD and THD results in the top section. Furthermore, the left to right ratio, mono to stereo ratio, RF carrier power, RF carrier frequency error, 38 kHz carrier frequency error, and 38 kHz carrier phase error will be shown on the bottom section.
Figure 8. FM stereo RDS/RBDS decoding results view/display with BLER and decoded RDS information.
Figure 9. FM stereo numeric result metrics view/display with deviation, mod rate, SINAD, THD, left to right ratio, mono to stereo ratio and 38 kHz carrier frequency error, and phase error.
Analog Demodulation Measurements (continued)

11
Measurement detailsAll of these measurements are available with the press of a button (Table 2). The measurements are fully remote controllable via the IEC/IEEE bus or LAN, using SCPI commands.
Table 2. One-button measurements provided by the N/W9063A measurement application.
Technology AM PM FM FM stereo/RDS
Measurement applicationN9063A-2FPW9063A-2FP
N9063A-2FPW9063A-2FP
N9063A-2FPW9063A-2FP
N9063A-3FPW9063A-3FP
X-Series signal analyzer PXA, MXA, EXA, CXA, MXE
Measurement
RF spectrum ● ● ● ●RF carrier power (dBm) ● ● ● ●RF carrier freq error (Hz) ● ● ●
AF spectrum ● ● ● MPX, mono, stereo, left, right
Demodulated waveform ● ● ● MPX, mono, stereo, left, right
Demodulation AM depth (%) PM deviation (rad, deg) FM deviation (Hz) FM deviation (Hz)
Peak+ ● ● ● ●Peak– ● ● ● ●(Pk-Pk)/2 ● ● ● ●RMS ● ● ● ●Modulation rate (Hz) ● ● ● ●SINAD (dB)/SNR (dB) ● ● ● ●THD (dB or %) ● ● ● ●Distortion/total power (dB or %)
● ● ● ●
Left to right ratio (dB) ●Mono to stereo ratio (dB) ●38 kHz carrier power (dB) ●38 kHz freq error (Hz) ●RDS/RBDS decoding ●BLER ●Radio text ●Attack/release time ●Long capture (3.6 MSa) ● ● ● ●
Analog Demodulation Measurements (continued)

12
Key Specifications
Definitions – Specifications describe the performance of parameters covered by the product warranty.
– Nominal values are designated with the abbreviation "nom." These values indicate expected performance, or describe product performance that is useful in the application of the product, but is not covered by the product warranty.
Note: Data subject to change
Performance specificationsDescription PXA MXA EXA CXA MXE
Analog demodulation performance
Maximum safe input level +30 dBm (1 W)
RF frequency range
Minimum frequency 3 Hz 10 Hz 10 Hz 9 kHz 20 Hz
Maximum frequency
Option 503 3.6 GHz 3.6 GHz 3.6 GHz 3.0 GHz
Option 507 7.0 GHz 7.5 GHz
Option 508 8.4 GHz 8.4 GHz 8.4 GHz
Option 513 13.6 GHz 13.6 GHz 13.6 GHz 13.6 GHz
Option 526 26.5 GHz 26.5 GHz 26.5 GHz 26.5 GHz 26.5 GHz
Option 532 32 GHz
Option 543 43 GHz
Option 544 44 GHz 44 GHz 44 GHz
Option 550 50 GHz
Demodulation bandwidth Up to 160 MHz Up to 160 MHz Up to 40 MHz Up to 25 MHz Up to 40 MHz
Capture memory 3.6 MSa
Filters
Low pass 300 Hz, 3 kHz, 15 kHz, 30 kHz, 80 kHz, 300 kHz, 100 kHz (> 20 kHz Bessel), and manually settable by user
High pass 20, 50, 300, 400 Hz
Band pass CCITT A-Weighted, C-Weighted, C-Message, CCIR-1k Weighted, CCIR-2k Weighted, CCIR Unweighted
De-emphasis (FM only) 25, 50, 75, 750 µs
Notch SINAD notch, signaling notch
You Can Upgrade!Options can be added after your initial purchase. All of our X-Series application options are license-key upgradeable.

13
Key Specifications (continued)
Description PXA MXA1 EXA1 CXA1 MXE
FM demodulation (all in nominal)
FM deviation accuracy ± 0.2%2 ± 0.2%2 ± 0.4%2 ± 0.4%2 ± 0.4%2
FM rate accuracy ± 0.001% x rate ± 0.001% x rate ± 0.01% x rate ± 0.01% x rate ± 0.001% x rate
Carrier frequency accuracy ± 0.1 Hz ± 0.2 Hz ± 0.2 Hz ± 0.5 Hz ± 0.2 Hz
Residual
THD 0.25%3 0.25%3 0.35%3 0.4%3 0.25%3
Distortion 0.10% 0.18% 0.30% 0.30% 0.18%
SINAD 60 dB 55 dB 50 dB 50 dB 55 dB
AM rejection 2.9 Hz 3.9 Hz 4 Hz 4 Hz 4 Hz
Residual FM 1 Hz 1 Hz 4 Hz 2 Hz 1 Hz
AM demodulation
AM depth accuracy ± 0.2% + 0.002 x reading (nom)
AM rate accuracy ± 0.05 Hz (nom)
Residual
THD 0.16% (nom) 0.16% (nom) 0.16% (nom) 0.16% (nom) 0.16% (nom)
Distortion 0.1% (nom) 0.17% (nom) 0.3% (nom) 0.3% (nom) 0.17% (nom)
SINAD 60.0 dB (nom) 55.5 dB (nom) 50 dB (nom) 50 dB (nom) 55.5 dB (nom)
FM rejection 0.05% AM peak 0.05% AM peak 0.5% (nom) 0.5% (nom) 0.5% (nom)
Residual AM 0.02% AM rms 0.02% AM rms 0.2% (nom) 0.2% (nom) 0.2% (nom)
PM demodulation
PM deviation accuracy ± 0.1%4 ± 0.2%5 ±(1 rad x (0.05 + (Rate/1 MHz))) (nom)
PM rate accuracy ± 0.1 Hz (nom) ± 0.1 Hz (nom) ± 0.2 Hz (nom) ± 0.2 Hz (nom) ± 0.2 Hz (nom)
Residual
THD 0.1% (nom) 0.1% (nom) 0.1% (nom) 0.1% (nom) 0.1% (nom)
Distortion 0.5% (nom) 0.5% (nom) 0.8% (nom) 0.8% (nom) 0.5% (nom)
SINAD 45 dB (nom) 45 dB (nom) 42 dB (nom) 42 dB (nom) 45 dB (nom)
AM rejection 3 mrad (nom) 3 mrad (nom) 4 mrad (nom) 4 mrad (nom) 3 mrad (nom)
Residual PM 2 mrad (nom) 2 mrad (nom) 4 mrad (nom) 4 mrad (nom) 2 mrad (nom)
FM stereo/RDS (all in nominal) FM stereo with 67.5 kHz reference deviation and 1 kHz modulation rate plus 6.75 kHz pilot deviation
SINAD (with A-Weighted filter) 69 dB 62 dB 61 dB 59 dB 62 dB
SINAD (with CCITT filter) 71 dB 69 dB 68 dB 67 dB 69 dB
Left to right ratio (with A-Weighted filter)
72 dB 63 dB 61 dB 59 dB 63 dB
Left to right ratio (with CCITT filter) 76 dB 72 dB 69 dB 68 dB 72 dB
1. FM performance listed is for newer vintage of MXA (SN prefix ≥ MY/SG/US5233, ship standard with Option EP2) or EXA (SN prefix ≥ MY/SG/US5340, ship standard with Option EP3) or CXA (SN prefix ≥ MY/SG/US5423, ship standard with Option EP4).
2. Value times (deviation + rate)3. Value times square root of ModIndex 4. Value times (reading + 2 mrad)5. Value times (reading + 3 mrad)
For a complete list of specifications, refer to the appropriate specifications guide:PXA: www.keysight.com/find/pxa_specifications MXA: www.keysight.com/find/mxa_specifications EXA: www.keysight.com/find/exa_specifications CXA: www.keysight.com/find/cxa_specifications MXE: www.keysight.com/find/mxe_specifications
Performance specifications (continued)
14
Ordering Information
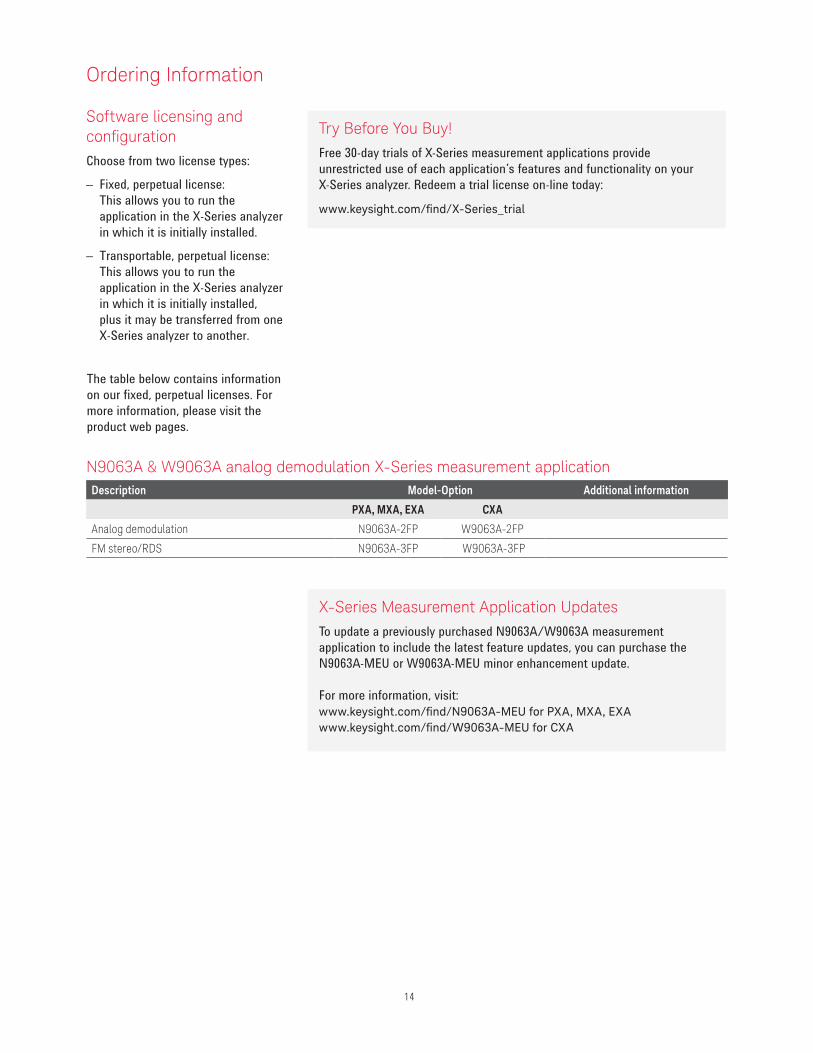
Software licensing and configurationChoose from two license types:
– Fixed, perpetual license: This allows you to run the application in the X-Series analyzer in which it is initially installed.
– Transportable, perpetual license: This allows you to run the application in the X-Series analyzer in which it is initially installed, plus it may be transferred from one X-Series analyzer to another.
The table below contains information on our fixed, perpetual licenses. For more information, please visit the product web pages.
Try Before You Buy!Free 30-day trials of X-Series measurement applications provide unrestricted use of each application’s features and functionality on your X-Series analyzer. Redeem a trial license on-line today:
www.keysight.com/find/X-Series_trial
X-Series Measurement Application UpdatesTo update a previously purchased N9063A/W9063A measurement application to include the latest feature updates, you can purchase the N9063A-MEU or W9063A-MEU minor enhancement update.
For more information, visit:www.keysight.com/find/N9063A-MEU for PXA, MXA, EXA www.keysight.com/find/W9063A-MEU for CXA
N9063A & W9063A analog demodulation X-Series measurement applicationDescription Model-Option Additional information
PXA, MXA, EXA CXA
Analog demodulation N9063A-2FP W9063A-2FP
FM stereo/RDS N9063A-3FP W9063A-3FP

15
Ordering Information (continued)
Related Literature
N9063A & W9063A Analog Demodulation, Self-Guided Demonstration, literature number 5990-5921ENSpectrum Analysis Amplitude and Frequency Modulation, Application Note 150-1, literature number 5954-9130ENN9063A & W9063A Analog Demod, Measurement Guide, part number: N9063-90006
Web
Product page: www.keysight.com/find/N9063A www.keysight.com/find/W9063A
X-Series measurement applications: www.keysight.com/find/X-Series_Apps
X-Series signal analyzers: www.keysight.com/find/X-Series
Hardware configuration
N9030A PXA signal analyzerDescription Model-Option Additional information
3.6, 8.4, 13.6, 26.5, 43, 44, or 50 GHz frequency range
N9030A-503, -508, -513, -526, -543, -544 or -550 One required
N9020A MXA signal analyzerDescription Model-Option Additional information
3.6, 8.4, 13.6, or 26.5 GHz frequency range N9020A-503, -508, -513 or -526 One required
N9010A EXA signal analyzerDescription Model-Option Additional information
3.6, 7.0, 13.6, 26.5, 32, or 44 GHz frequency range N9010A-503, -507, -513, -526, -532 or -544 One required
N9000A CXA signal analyzerDescription Model-Option Additional information
3.0, 7.5, 13.6, or 26.5 GHz frequency range N9000A-503, -507, -513 or -526 One required
N9038A MXE EMI receiverDescription Model-Option Additional information
8.4 , 26.5, or 44 GHz frequency range N9038A-508, -526, or -544 One required
myKeysight
www.keysight.com/find/mykeysightA personalized view into the information most relevant to you.
www.lxistandard.org
LAN eXtensions for Instruments puts the power of Ethernet and the Web inside your test systems. Keysight is a founding member of the LXI consortium.
Three-Year Warranty
www.keysight.com/find/ThreeYearWarrantyKeysight’s commitment to superior product quality and lower total cost of ownership. The only test and measurement company with three-year warranty standard on all instruments, worldwide.
Keysight Assurance Planswww.keysight.com/find/AssurancePlansUp to five years of protection and no budgetary surprises to ensure your instruments are operating to specification so you can rely on accurate measurements.
www.keysight.com/go/qualityKeysight Technologies, Inc.DEKRA Certified ISO 9001:2008 Quality Management System
Keysight Channel Partnerswww.keysight.com/find/channelpartnersGet the best of both worlds: Keysight’s measurement expertise and product breadth, combined with channel partner convenience.
WiMAX, Mobile WiMAX, WiMAX Forum, the WiMAX Forum logo, WiMAX Forum Certified, and the WiMAX Forum Certified logo are US trademarks of the WiMAX Forum.
Bluetooth and the Bluetooth logos are trademarks owned by Bluetooth SIG, Inc, U.S.A. and licensed to Keysight Technologies, Inc.
For more information on Keysight Technologies’ products, applications or services, please contact your local Keysight office. The complete list is available at:www.keysight.com/find/contactus
Americas Canada (877) 894 4414Brazil 55 11 3351 7010Mexico 001 800 254 2440United States (800) 829 4444
Asia PacificAustralia 1 800 629 485China 800 810 0189Hong Kong 800 938 693India 1 800 112 929Japan 0120 (421) 345Korea 080 769 0800Malaysia 1 800 888 848Singapore 1 800 375 8100Taiwan 0800 047 866Other AP Countries (65) 6375 8100
Europe & Middle EastAustria 0800 001122Belgium 0800 58580Finland 0800 523252France 0805 980333Germany 0800 6270999Ireland 1800 832700Israel 1 809 343051Italy 800 599100Luxembourg +32 800 58580Netherlands 0800 0233200Russia 8800 5009286Spain 0800 000154Sweden 0200 882255Switzerland 0800 805353
Opt. 1 (DE)Opt. 2 (FR)Opt. 3 (IT)
United Kingdom 0800 0260637
For other unlisted countries:www.keysight.com/find/contactus(BP-09-23-14)
16 | Keysight | Analog Demodulation X-Series Measurement Application N9063A & W9063A – Technical Overview
This information is subject to change without notice.© Keysight Technologies, 2013 - 2014Published in USA, August 3, 20145989-6535ENwww.keysight.com