keysight technologies understanding cdma measurements for...
TRANSCRIPT
Keysight Technologies Understanding CDMA Measurements for Base Stations and Their Components
Application Note
Keysight Wireless CDMA Solutions
02 | Keysight | Understanding CDMA Measurements for Base Stations and Their Components - Application Note
Introduction ................................................................................................................................................................................. 3
Testing CDMA Base Stations and Their Components ............................................................................................................... 4 Where do tests come from? ................................................................................................................................................... 4 Test phases .............................................................................................................................................................................. 4 Testing challenges and issues ............................................................................................................................................... 6
Test Configurations ...................................................................................................................................................................... 7 Test sets................................................................................................................................................................................... 7 Distributed test elements ....................................................................................................................................................... 7 CDMA signal generator ...................................................................................................................................................... 7 Signal analyzer ................................................................................................................................................................... 8 Which configuration to use .................................................................................................................................................... 8
RF Parametric Measurements in CDMA ..................................................................................................................................... 9 Transmitter .............................................................................................................................................................................. 9 In-channel measurements ................................................................................................................................................. 9 Channel power ............................................................................................................................................................... 9 Swept-frequency method ....................................................................................................................................... 10 FFT method ............................................................................................................................................................. 11 Occupied bandwidth ................................................................................................................................................... 11 Modulation quality ....................................................................................................................................................... 11 Rho ........................................................................................................................................................................... 11 Frequency error ....................................................................................................................................................... 12 Time offset ............................................................................................................................................................... 12 Carrier feedthrough ................................................................................................................................................. 13 Code-domain analysis ................................................................................................................................................. 13 Code-domain power ............................................................................................................................................... 14 Code-domain timing ............................................................................................................................................... 16 Code-domain phase ............................................................................................................................................... 16 In-band/out-of-channel measurements ......................................................................................................................... 17 In-band spurious emissions ........................................................................................................................................ 17 Adjacent Channel Power Ratio ................................................................................................................................... 17 Out-of-band measurements ............................................................................................................................................ 19 Harmonics .................................................................................................................................................................... 19 Out-of-band spurious, nonharmonic .......................................................................................................................... 19 Receiver ................................................................................................................................................................................. 20 Metrics .............................................................................................................................................................................. 20 FER ............................................................................................................................................................................... 20 Eb/No ..................................................................................................................................................................................................................................................................... 20 Measurements .................................................................................................................................................................. 21 Sensitivity ..................................................................................................................................................................... 21 Dynamic range ............................................................................................................................................................. 21 Spurious immunity ....................................................................................................................................................... 22 Performance in AWGN ................................................................................................................................................ 22 Performance in multipath fading environment .......................................................................................................... 23
Summary ....................................................................................................................................................................................24
References ................................................................................................................................................................................. 24 Related literature .................................................................................................................................................................. 24
Table of Contents

This application note presents the fundamental measurement principles for the RF parametric tests performed on Code Division Multiple Access (CDMA) base stations and their components. It primarily focuses on selected tests specified for the IS-95-based systems, although other tests commonly made in the industry are also covered. While these measurements are made in most phases of the product lifecycle, the emphasis is on those tests made in manufacturing and product development/ design verification. Mobiles are not covered because they have unique testing challenges.
The CDMA industry is growing rapidly throughout the world. For a variety of technical, economic, and even political reasons, base stations are becoming smaller, using less power, costing less, covering a smaller area, and providing higher capacity than ever before.
In the product development area, designers must be aware of new technology trends and have in-depth knowledge of the advantages and disadvantages. Some examples of technology trends include:
– the use of multi-carrier linear power amplifiers for wider bandwidth and lower distortion – higher-performance DAC/ADCs for increased flexibility and lower cost – higher integration of components for smaller footprint, size, weight and power – less expensive memory – improved DSP algorithms with dedicated chipsets – a doubling of microprocessing capacity every two years
In manufacturing there is a completely different set of issues. Manufacturing engineers are faced with needs such as:
– decreasing time-to-volume – reducing costs – increasing production flexibility using multiple-format lines – increasing asset utilization and re-use – exceeding quality thresholds – maintaining high test-equipment uptime – providing coordinated global support of all virtual manufacturing lines
With all of these challenges facing manufacturing and product development engineers and managers, there is little time to study industry standards for a thorough understanding of the tests they specify. This application note provides the fundamental information you need to feel confident that you are making the measurements correctly.
The complexities of the IS-95-based CDMA system have created the need for highly specialized test equipment, unique measurements, and new ways of using traditional tests and measurement tech-niques. The particular characteristics of CDMA signals also require that measurements be interpreted with CDMA properties in mind. In the pages that follow you will find descriptions of the most common measurements made in CDMA, along with measurement results obtained with Keysight Technologies, Inc. test equipment.
Note: it is assumed that the reader has a basic understanding of CDMA technology (see reference #1 for CDMA basics).
Introduction
04 | Keysight | Understanding CDMA Measurements for Base Stations and Their Components - Application Note
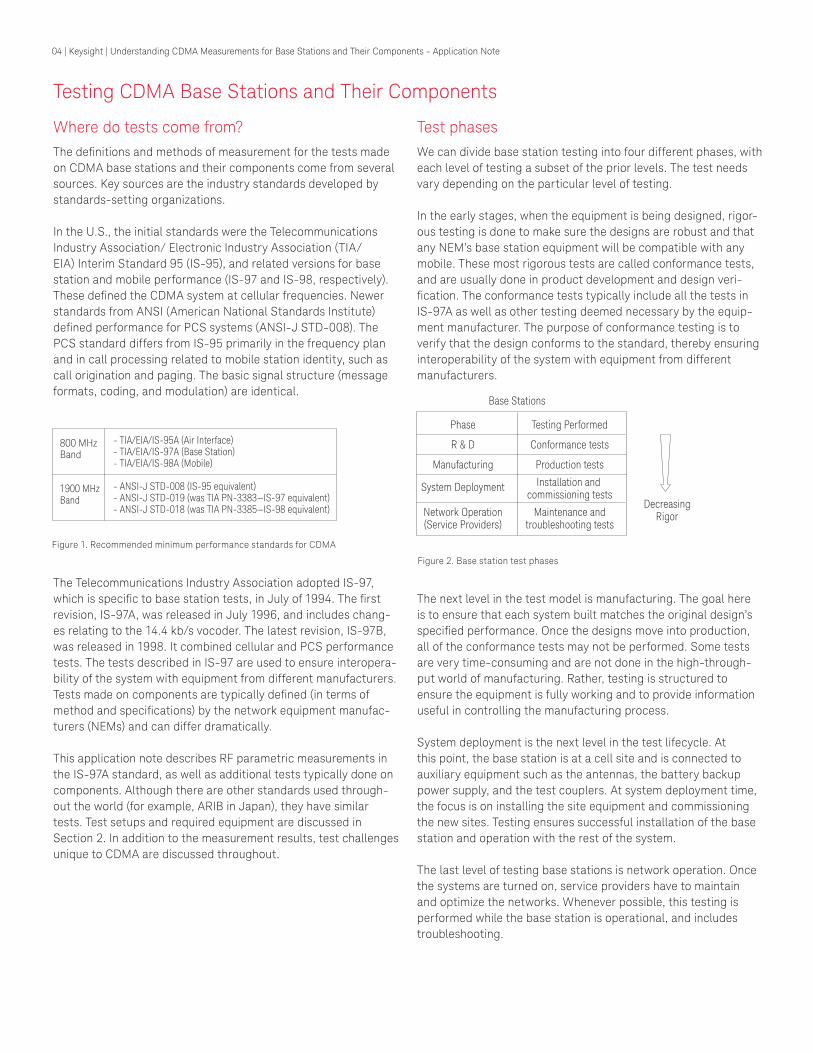
Where do tests come from?The definitions and methods of measurement for the tests made on CDMA base stations and their components come from several sources. Key sources are the industry standards developed by standards-setting organizations.
In the U.S., the initial standards were the Telecommunications Industry Association/ Electronic Industry Association (TIA/EIA) Interim Standard 95 (IS-95), and related versions for base station and mobile performance (IS-97 and IS-98, respectively). These defined the CDMA system at cellular frequencies. Newer standards from ANSI (American National Standards Institute) defined performance for PCS systems (ANSI-J STD-008). The PCS standard differs from IS-95 primarily in the frequency plan and in call processing related to mobile station identity, such as call origination and paging. The basic signal structure (message formats, coding, and modulation) are identical.
The Telecommunications Industry Association adopted IS-97, which is specific to base station tests, in July of 1994. The first revision, IS-97A, was released in July 1996, and includes chang-es relating to the 14.4 kb/s vocoder. The latest revision, IS-97B, was released in 1998. It combined cellular and PCS performance tests. The tests described in IS-97 are used to ensure interopera-bility of the system with equipment from different manufacturers. Tests made on components are typically defined (in terms of method and specifications) by the network equipment manufac-turers (NEMs) and can differ dramatically.
This application note describes RF parametric measurements in the IS-97A standard, as well as additional tests typically done on components. Although there are other standards used through-out the world (for example, ARIB in Japan), they have similar tests. Test setups and required equipment are discussed in Section 2. In addition to the measurement results, test challenges unique to CDMA are discussed throughout.
Testing CDMA Base Stations and Their Components
- TIA/EIA/IS-95A (Air Interface)- TIA/EIA/IS-97A (Base Station)- TIA/EIA/IS-98A (Mobile)
- ANSI-J STD-008 (IS-95 equivalent)- ANSI-J STD-019 (was TIA PN-3383—IS-97 equivalent)- ANSI-J STD-018 (was TIA PN-3385—IS-98 equivalent)
800 MHzBand
1900 MHzBand
Phase
R & D
Manufacturing
System Deployment
Network Operation(Service Providers)
Testing Performed
Conformance tests
Production tests
Installation and commissioning tests
Maintenance andtroubleshooting tests
Base Stations
DecreasingRigor
Test phasesWe can divide base station testing into four different phases, with each level of testing a subset of the prior levels. The test needs vary depending on the particular level of testing.
In the early stages, when the equipment is being designed, rigor-ous testing is done to make sure the designs are robust and that any NEM’s base station equipment will be compatible with any mobile. These most rigorous tests are called conformance tests, and are usually done in product development and design veri-fication. The conformance tests typically include all the tests in IS-97A as well as other testing deemed necessary by the equip-ment manufacturer. The purpose of conformance testing is to verify that the design conforms to the standard, thereby ensuring interoperability of the system with equipment from different manufacturers.
The next level in the test model is manufacturing. The goal here is to ensure that each system built matches the original design’s specified performance. Once the designs move into production, all of the conformance tests may not be performed. Some tests are very time-consuming and are not done in the high-through-put world of manufacturing. Rather, testing is structured to ensure the equipment is fully working and to provide information useful in controlling the manufacturing process.
System deployment is the next level in the test lifecycle. At this point, the base station is at a cell site and is connected to auxiliary equipment such as the antennas, the battery backup power supply, and the test couplers. At system deployment time, the focus is on installing the site equipment and commissioning the new sites. Testing ensures successful installation of the base station and operation with the rest of the system.
The last level of testing base stations is network operation. Once the systems are turned on, service providers have to maintain and optimize the networks. Whenever possible, this testing is performed while the base station is operational, and includes troubleshooting.
Figure 2. Base station test phases
Figure 1. Recommended minimum performance standards for CDMA
05 | Keysight | Understanding CDMA Measurements for Base Stations and Their Components - Application Note
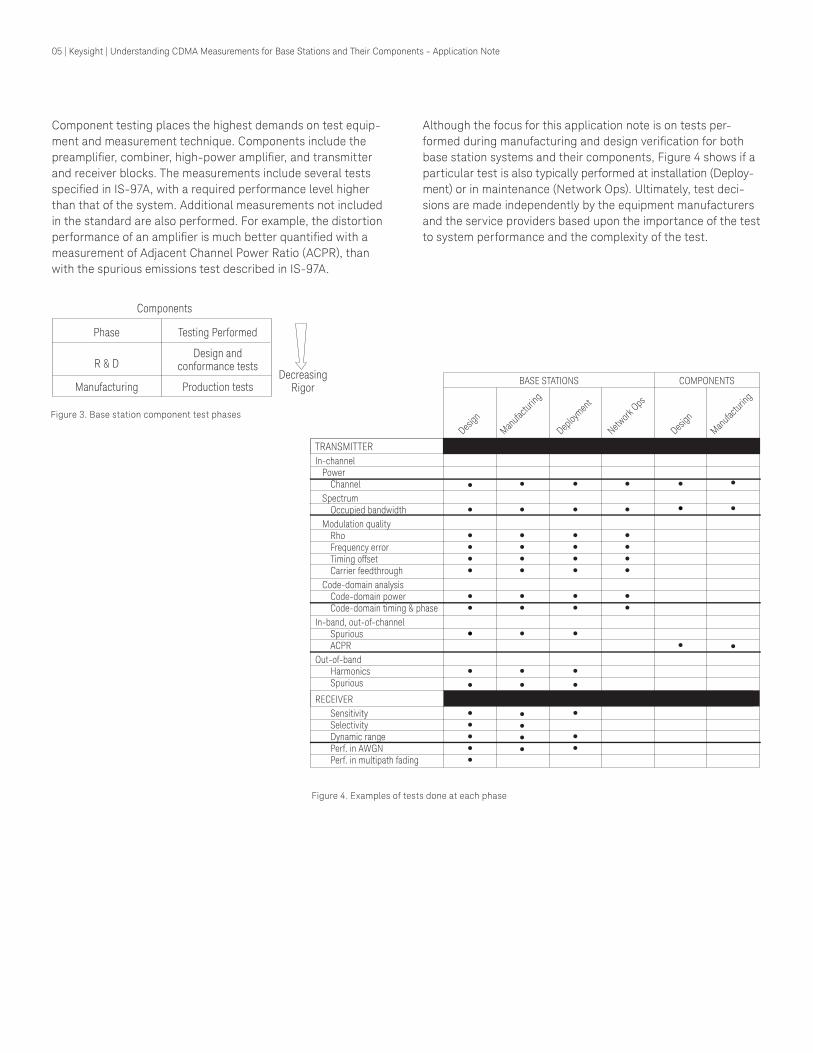
Component testing places the highest demands on test equip-ment and measurement technique. Components include the preamplifier, combiner, high-power amplifier, and transmitter and receiver blocks. The measurements include several tests specified in IS-97A, with a required performance level higher than that of the system. Additional measurements not included in the standard are also performed. For example, the distortion performance of an amplifier is much better quantified with a measurement of Adjacent Channel Power Ratio (ACPR), than with the spurious emissions test described in IS-97A.
Although the focus for this application note is on tests per-formed during manufacturing and design verification for both base station systems and their components, Figure 4 shows if a particular test is also typically performed at installation (Deploy-ment) or in maintenance (Network Ops). Ultimately, test deci-sions are made independently by the equipment manufacturers and the service providers based upon the importance of the test to system performance and the complexity of the test.
Phase
R & D
Manufacturing
Testing Performed
Design andconformance tests
Production tests
Components
DecreasingRigor
TRANSMITTERIn-channel Power Channel Spectrum Occupied bandwidth Modulation quality Rho Frequency error Timing offset Carrier feedthrough Code-domain analysis Code-domain power Code-domain timing & phaseIn-band, out-of-channel Spurious ACPROut-of-band Harmonics Spurious
RECEIVER Sensitivity Selectivity Dynamic range Perf. in AWGN Perf. in multipath fading
Design
Deploy
ment
Manufa
cturin
g
Network
Ops
Design
Manufa
cturin
g
6
6
6666
66
6
66
66666
6
6
6666
66
6
66
6666
6
6
6666
66
6
66
6
66
6
6
6666
66
6
6
6
6
6
6
BASE STATIONS COMPONENTS
Figure 4. Examples of tests done at each phase
Figure 3. Base station component test phases

06 | Keysight | Understanding CDMA Measurements for Base Stations and Their Components - Application Note
Testing challenges and issuesCDMA is very different from other communication systems. CDMA puts several users on one frequency channel, but different code channels. The data rate varies with voice activity (digital speech interpolation). The data is spread with error-correcting codes to a chip rate of 1.2288 MHz. Also, the environment in which CDMA operates is interference limited. Only a few percent of the energy at the receive antenna port is the desired signal for any one channel. The rest is the combined interference of other users and the background noise. (For more detail, see reference #1, Concepts of CDMA.)
These conditions lead to unique testing methods and mea-surements. For example, we need to simulate the interference environment just described. Another challenge is simulating the in-channel CDMA signal itself. It has been found that different stimulus signals (depending upon their peak-to-average ratio) will stress units under test (UUTs) differently, and therefore produce different measurement results. (For a more detailed discussion on this topic, see “Adjacent Channel Power Ratio” in Section 3.) Another key difference in testing CDMA systems is that, since the signal is noise-like in nature, the testing must use statistical methods. For example, a typical receiver test specifies that the receiver must achieve better than 1% Frame Error Rate (FER) with 95% confidence under certain test conditions.
CDMA also has unique timing issues. In order for any direct-se-quence spread-spectrum radio system to operate, all mobiles and base stations must be precisely synchronized. If they are not synchronized, it becomes nearly impossible to recover the codes used to identify individual radio signals. In the IS-95 system, synchronization is based on the Global Positioning Satellite (GPS) system time. Each CDMA base station incorporates a GPS receiv-er to provide exact system timing information for the cell. The base station sends this information to each mobile via a dedicated cod-ed channel. In this manner, all radios in the system can maintain near-perfect synchronization.
This precise synchronization may be part of the manufacturing test procedure. If it is, there will be an impact on the test equip-ment interface. In this case, in addition to a “house frequency standard,” there will be a “house timing standard,” also called the “even-second clock.” The availability of an even-second clock to the base station and test equipment speeds up some measure-ments, reducing test time.
Manufacturers must also be able to control the base station for testing purposes. The interface that controls the base station is often NEM proprietary, which requires the NEMs to have the pro-gramming skill, or to work closely with a test equipment manufac-turer to provide internal control of the test instruments. In design and manufacturing, this backbone control is often done using a Base Station Control (BSC) simulator. In installation and mainte-nance, where a test set is typically the instrument of choice, the test set can provide some of this control.
On top of these unique testing challenges and issues, there is the constant challenge of reducing test time in a manufacturing fa-cility. A fundamental method for reducing test time is to increase the speed of the measurement. Test equipment manufacturers are acutely aware of this challenge, and are continually improving measurement speed in their instruments.

07 | Keysight | Understanding CDMA Measurements for Base Stations and Their Components - Application Note
There are two different test configurations generally used to test base stations and their components. These are: (1) a “one-box” test set, and (2) a custom combination of source, receiver, and software (referred to as distributed test elements). In general, test sets are used in system deployment and network operation, whereas distributed test elements are used in manufacturing and design verification. This section will explain the advantages and disadvantages of each configuration.
Test setsThe shaded area in Figure 5 contains the elements that typically comprise a test set. Both source and receiver are in the same instrument with enough internal processing power for the combi-nation to perform a dedicated task. The advantages are conve-nience of packaging (everything is in one instrument), a single user-interface, and a single connection interface. This type of carry-around test set is ideal for installation/commissioning and maintenance of a cell site.
The Keysight 8935 CDMA base station test set is an excellent solution designed to meet the needs of installation teams and service providers doing maintenance. It features a convenient connector section to allow out-of-the-way hook up. It also pro-vides portability, a rugged design, and a user-friendly interface. See related literature #1 for more information.
Source Receiver
SignalCreation
• Baseband• I-Q• IF• RF
SignalAnalysis
• PA• Conv.• Tx• Rx
UUT
• Simulation• Data import• Data export• Control
Computation
• Bits• Baseband• I-Q• IF• RF
Connectivity • GPIB • LAN • RS-232
Figure 5. Test set versus distributed test elements
Test Configurations Distributed test elementsMany manufacturers are adopting distributed test elements with software control in their manufacturing and design verification phases. When a flexible source and receiver are used, software can be written that not only controls the suite of tests, but also provides the protocol necessary to communicate with the unit un-der test (UUT). Modern manufacturing facilities, for example, rely heavily on sophisticated ATE (Automated Test Equipment) systems to maximize test efficiency. In these test systems, the flexible signal generation and analysis components work together via test executive software to conduct a full set of measurements that characterize the UUT. By separating the elements, we gain access to all aspects of the test instrument I/O ports, for complete flex-ibility and control of the test suite. Test engineers know exactly what is happening to their data and are able to customize the test routine for a competitive advantage. This configuration, however, requires more software development and testing expertise.
CDMA signal generatorCDMA places unique requirements on the signal stimulus used to make measurements. A “real world” CDMA signal is superficially noise-like, and can exhibit extreme peak-to-average ratio (or crest factor) variability. To properly test base stations and their compo-nents, the test signal should be able to provide these same char-acteristics. This is in addition to providing the correct modulation, filtering and symbol rate for the system. (A noise source is not a good simulation of a CDMA signal—see “Adjacent Channel Power Ratio” in Section 3 for more detail.)
When making base station component transmitter measurements, it is important that the signal generator be capable of simulating the forward link. To do this, it must generate multiple Walsh codes within the RF channel bandwidth. Some required performance parameters of the signal generator depend on whether the test is in-channel or out-of-channel. For in-channel measurements, high waveform quality is important. This ensures a spectrally correct signal within the 1.23 MHz channel bandwidth. For out-of-channel measurements, the signal generator must have excellent adja-cent-channel-power performance. It is important that the signal generator performance be much better than the component per-formance so that it doesn’t affect the measurement results.
When making base station receiver measurements, the signal generator must be able to simulate the reverse link. This requires that a single Walsh-coded channel be provided to the receiver under test. As discussed in Section 3 under “Receiver,” the figure of merit for receiver tests is Frame Error Rate (FER). Measuring FER requires that the signal generator also provide known frames or data streams.
The Keysight ESG-D series digital signal generators offer an ex-cellent source for CDMA base station and base station component testing. These sources provide multiple Walsh code generation as well as excellent waveform quality and adjacent-channel-power performance. See related literature #2 for more information.

08 | Keysight | Understanding CDMA Measurements for Base Stations and Their Components - Application Note
Signal analyzerThe CDMA signal also challenges an analyzer’s ability to measure the signal correctly and accurately. The nature of the challenge depends upon the type of architecture used in the analyzer. There are currently two distinct architectures: (1) swept-frequency spectrum analyzers, and (2) FFT-based vector signal analyzers (VSAs). Although there are specific advantages for each, they are starting to merge, providing more advantages in one instrument. The advantages of the different architectures depend on the types of measurements being made.
When making in-channel and adjacent-channel measurements, a vector signal analyzer provides excellent accuracy for power measurements. When making in-band/out-of-channel and out-of-band measurements, a swept spectrum analyzer provides excellent dynamic range for measuring harmonics and spurious emissions.
Much of the vector signal analyzer architecture is implemented digitally using Digital Signal Processing (DSP). DSP provides demodulation capabilities for modulation quality measurements such as code-domain power and rho. Vector signal analyzers digitize an IF signal, not its amplitude envelope, and thus can compute phase as well as amplitude with the FFT (Fast Fourier Transform) process.
Traditional swept spectrum analyzers measure only the ampli-tude of a signal, so we can refer to them as “scalar” analyzers. They have several frequency conversion stages, which results in very good dynamic range. These conversion stages do, howev-er, introduce loss and uncertainties. Also, this type of analyzer typically employs a logarithmic amplifier, and analog detection that requires special settings when making power measure-ments. This is discussed in more detail under “Channel power” in Section 3.
The recommended vector signal analyzer is the Keysight VSA series transmitter tester, which provides very fast, focused mea-surements for CDMA testing. The Keysight spectrum analyzers of choice for out-of-band measurements include the 8590 E series with Keysight 85725C CDMA measurement personality, or the higher-performance 8560 E series. See related literature #’s 3, 4, 5, and 6 for more information.
Which configuration to useSince most CDMA systems utilize a proprietary interface, the use of distributed test elements with specific NEM software for control has become the more common configuration in design and manufacturing. Therefore, this application note focuses on the use of distributed test elements. In general, test sets are used during installation and maintenance because of their por-tability and ease of use, whereas distributed test elements are best suited for design and most manufacturing environments.
09 | Keysight | Understanding CDMA Measurements for Base Stations and Their Components - Application Note
As in the IS-95 standard, the RF parametric measurements described in this section are divided into two areas: those that characterize transmitter performance, and those that charac-terize receiver performance.
TransmitterThe transmitter tests are broken down into the different fre-quency ranges of interest. The basic transmitter tests are done on the signal intentionally sent to the transmitting antenna; these are called the in-channel measurements. These tests verify performance within the 1.23 MHz channel bandwidth. In-band/out-of-channel measurements verify performance within the system band, but outside of the actual transmitting channel bandwidth; that is, these tests verify how the transmit-ting channel is affecting adjacent channels. And finally, out-of-band measurements characterize the performance outside the system band in order to verify minimal interference with other communication systems.
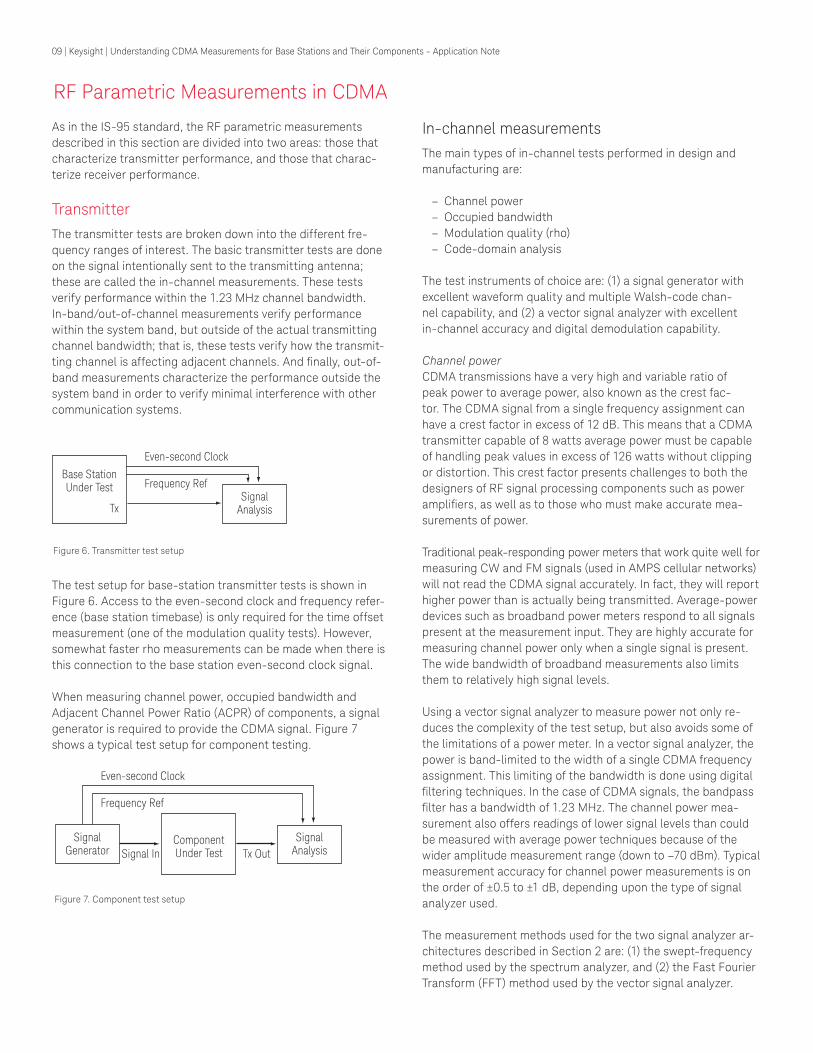
The test setup for base-station transmitter tests is shown in Figure 6. Access to the even-second clock and frequency refer-ence (base station timebase) is only required for the time offset measurement (one of the modulation quality tests). However, somewhat faster rho measurements can be made when there is this connection to the base station even-second clock signal.
When measuring channel power, occupied bandwidth and Adjacent Channel Power Ratio (ACPR) of components, a signal generator is required to provide the CDMA signal. Figure 7 shows a typical test setup for component testing.
In-channel measurements The main types of in-channel tests performed in design and manufacturing are:
– Channel power – Occupied bandwidth – Modulation quality (rho) – Code-domain analysis
The test instruments of choice are: (1) a signal generator with excellent waveform quality and multiple Walsh-code chan-nel capability, and (2) a vector signal analyzer with excellent in-channel accuracy and digital demodulation capability.
Channel power CDMA transmissions have a very high and variable ratio of peak power to average power, also known as the crest fac-tor. The CDMA signal from a single frequency assignment can have a crest factor in excess of 12 dB. This means that a CDMA transmitter capable of 8 watts average power must be capable of handling peak values in excess of 126 watts without clipping or distortion. This crest factor presents challenges to both the designers of RF signal processing components such as power amplifiers, as well as to those who must make accurate mea-surements of power.
Traditional peak-responding power meters that work quite well for measuring CW and FM signals (used in AMPS cellular networks) will not read the CDMA signal accurately. In fact, they will report higher power than is actually being transmitted. Average-power devices such as broadband power meters respond to all signals present at the measurement input. They are highly accurate for measuring channel power only when a single signal is present. The wide bandwidth of broadband measurements also limits them to relatively high signal levels.
Using a vector signal analyzer to measure power not only re-duces the complexity of the test setup, but also avoids some of the limitations of a power meter. In a vector signal analyzer, the power is band-limited to the width of a single CDMA frequency assignment. This limiting of the bandwidth is done using digital filtering techniques. In the case of CDMA signals, the bandpass filter has a bandwidth of 1.23 MHz. The channel power mea-surement also offers readings of lower signal levels than could be measured with average power techniques because of the wider amplitude measurement range (down to –70 dBm). Typical measurement accuracy for channel power measurements is on the order of ±0.5 to ±1 dB, depending upon the type of signal analyzer used.
The measurement methods used for the two signal analyzer ar-chitectures described in Section 2 are: (1) the swept-frequency method used by the spectrum analyzer, and (2) the Fast Fourier Transform (FFT) method used by the vector signal analyzer.
RF Parametric Measurements in CDMA
Even-second Clock
Frequency RefSignal
Analysis
Base StationUnder Test
Tx
Figure 6. Transmitter test setup
Even-second Clock
Frequency Ref
SignalGenerator
SignalAnalysis
ComponentUnder TestSignal In Tx Out
Figure 7. Component test setup

10 | Keysight | Understanding CDMA Measurements for Base Stations and Their Components - Application Note
Swept-frequency methodMeasurements are performed in the frequency domain using a spectrum analyzer. After the analyzer is set up properly, the power versus frequency curve is integrated over the precise bandwidth and the power is calculated.
Equation 1.
Measuring the power in a CDMA signal on a spectrum analyz-er involves several measurement considerations. Traditional spectrum analyzers were designed to measure CW signals with known and predictable amplitude distributions. However, a CDMA signal is noise-like, with a varying amplitude distribution that depends upon the combinations of Walsh-code channels. Therefore, it is important when using a spectrum analyzer that a few simple rules are followed to produce an accurate and repeatable result:
1. Because CDMA is noise-like, the sample detector should be used. This will ensure that the noise-like voltages of the signal are accurately captured.
2. The resolution bandwidth should be set at approximately 1% of the 1.23 MHz channel bandwidth. This will provide selec-tivity at the channel edge as well as a lower noise floor, for a more accurate measurement.
3. The video bandwidth must be greater than the resolution bandwidth by three times or more. This allows the noise-like voltages to vary through their full range of values.
If these rules are followed, the detected voltages can be con-verted to power, summed, and averaged using Equation 1 to provide the true absolute power in the CDMA channel.
One common mistake is narrowing the video bandwidth so that a smooth trace is seen on the screen. Narrowing the video filter bandwidth averages the log of the power inside the resolution bandwidth, rather than the power itself. This incorrectly filters the CDMA signal and causes a skewed result. See reference #2 for more detail.
Another common mistake is using video or trace averaging (not the same as video filtering) to smooth out the trace and improve repeatability. The video-averaging feature in a spectrum analyzer is designed to average the logarithmic values of the trace ele-ments. This introduces amplitude errors with non-CW signals, where the errors can vary depending upon the signal charac-teristics. It is therefore very important that the video-averaging feature not be used. This will avoid the classic 2.5 dB error in the measurement result; see reference #3 for more detail. To improve repeatability and ensure an accurate test result, true power averaging is needed. This requires the ability to average several power measurements and is done through software (either by a downloadable program in the spectrum analyzer or on a PC).
A third mistake is using a marker to measure the power in a signal displayed on a spectrum analyzer. This is not an accurate method for a CDMA signal. A spectrum analyzer marker reads the power in its resolution bandwidth. The power in narrow-band signals can be read directly from the marker. IS-95 CDMA power, however, is distributed over a 1.23 MHz bandwidth and therefore requires an integration measurement. While it is possi-ble to correct the marker reading for the ratio of bandwidths, the ripple (about ±2 dB) caused by the CDMA modulation filter is not easily taken into account.
Where:
PT = channel power (watts) Bs = channel bandwidth (Hz) Bn = noise equivalent bandwidth (Hz) N = number of measurement cells within channel limit Pi = power in one spectrum analyzer measurement cell (watts)
Bn N i=1
PT = Bs 1 N
Pi S
Figure 8. Channel power measurement using an Keysight 8590 E-series spectrum analyzer with Keysight 85725C CDMA measurement personality

11 | Keysight | Understanding CDMA Measurements for Base Stations and Their Components - Application Note
FFT method Signals are captured in the time domain and converted to the frequency domain using the FFT. Measurements are then per-formed in the frequency domain using a vector signal analyzer.
As mentioned in Section 2, vector signal analyzers have a differ-ent architecture than spectrum analyzers. While spectrum analyz-ers sweep in the frequency domain, measuring amplitude versus frequency, the vector signal analyzer measures time-domain information and converts to the frequency domain via the Fast Fourier Transform. (See reference #3 for more information.)
A vector signal analyzer must use the rms detector mode when measuring CDMA signals. While viewing the signal in the frequency domain, the user chooses the FFT window that will properly capture the signal of interest. A flat-top window is used for maximum amplitude accuracy. To provide the true power averaging discussed earlier, the signal analyzer should be set to rms averaging. The CDMA channel power measurement in the Keysight VSA performs these functions automatically.
Why are power measurements important?Power is the fundamental parametric of any communication system. It is critical in defining a system’s capacity, coverage and signal quality. Accurate control of the transmitted power is cru-cial to system performance.
In CDMA, for example, one of the fundamental enabling tech-nologies is power control. Since the limiting factor for CDMA system capacity is the total interference, controlling the power of each mobile is essential to achieve maximum capacity.Power control must be functioning properly in both forward and reverse directions. The accuracy of the power control system depends greatly on the base station’s ability to monitor and transmit the proper values of power. Consequently, it is very important to accurately measure the power transmitted by the base station.
Occupied bandwidth Occupied bandwidth measurements express the percentage (typically 99%) of the transmitted power that lies in a specified bandwidth. In principle, any distortion (for example, harmon-ics or intermodulation) produces power outside the specified bandwidth.
The spectrum shape can give useful qualitative insight into transmitter operation. Any distortions to the CDMA spectrum shape can indicate problems. For example, “shoulders” on either side of the spectrum indicate spectral regrowth and intermod-ulation. Rounding or sloping of the top can indicate filter shape problems.
Modulation quality After the power measurement, the measure of modulation quality is probably the most important quantifier of transmitter performance.
All communications systems have a measure of modulation quality. FM-based systems measure FM deviation and distor-tion. NADC and PDC use Error Vector Magnitude (EVM). GSM uses the Global Phase Error. CDMA, which relies on correlation for its operation, uses a parameter called rho (p).
Rho Rho is a measure of the correlated power to total power. The correlated power is computed by removing frequency, phase and time offsets, and performing a cross correlation between the corrected measured signal and the ideal reference. Only the pilot Walsh code can be active for this measurement to be valid.
Figure 9. Channel power measurement using an Keysight VSA series transmitter tester
Figure 10. Occupied bandwidth measurement

12 | Keysight | Understanding CDMA Measurements for Base Stations and Their Components - Application Note
If a transmitted signal matches perfectly, correlation will be one-to-one, for a rho of 1.000 (another way of thinking of this is that 100% of the power transmitted is useful information to the mobile radio receiver).
Figure 11 shows the ideal pilot signal at the top and the actual, transmitted pilot on the bottom. If some of the transmitted en-ergy does not correlate, this excess power will appear as added noise that may interfere with other users on the system. Rho is therefore also the ratio of signal power to signal power plus error power.
The rho measurement indicates the overall modulation perfor-mance level of a CDMA transmitter. It accounts for all possible error mechanisms in the entire transmission chain, including baseband filtering and timing errors, I/Q modulation anomalies, filter amplitude and phase non-linearities, coding problems, and power amplifier distortions.
The rho limit for CDMA base stations as specified in the TIA IS-97 document is 0.912, indicating that 91.2% of the correlated pilot power is contained in the total transmission power. At this level of performance, 8.8% of the total power is wasted and a potential cause of interference to other Walsh channels.
Why is rho important?Poor rho performance will affect the cell’s capacity. This is because the uncorrelated power appears as interference to the mobiles. The added interference can require that the signal on traffic channels be raised to overcome the interference. This in turn may be seen as additional interference. At some point, the site will have to shed calls in order to supply the remaining calls with an adequate signal-to-interference ratio.
Potential causes of poor rho performance are:
– Compression in linear amplifiers – Magnitude and phase errors in the I/Q modulator – Spurious signals in the transmission channel – Carrier feedthrough
Frequency error, time offset, and carrier feedthrough are often measured in conjunction with rho. These measurements provide insight into the overall health of the CDMA base station’s trans-mitted signal.
Frequency error As with any communication system, we must be sure that the transmitter is operating on the correct frequency. The problem is verifying this frequency.
Many communications engineers are accustomed to using fre-quency counters to accurately measure frequency. A frequency counter, in principle, counts the number of zero crossings in a signal. CW, constant-envelope signals, or signals with a large carrier can be accurately counted in this way. Digitally modulat-ed signals cannot. For example, CDMA signals are broadband (1.23 MHz) and use pseudo-random sequences, and therefore resemble band-limited noise. In this case, the number of zero crossings is not equal to the center frequency. A new measure-ment technique is therefore needed. This technique uses DSP algorithms such as those used in signal analyzers.
To ensure that each CDMA transmitter is on its frequency and not interfering with other CDMA channels, the standards specify very tight frequency error performance, known as frequency tolerance. In the PCS bands, the specification is ±0.05 parts per million, which translates to only ±99 Hz at a carrier frequency of 1980 MHz. In the cellular bands, a CDMA transmitter must be within about 40 Hz of absolute frequency (±0.05 ppm at a carrier frequency of 800 MHz).
Why is frequency error important?If a site loses its reference to GPS time, its reference signals will begin to drift over time. Mobiles already using the site can remain on the air because they derive their timing from the signals transmitted by the base station. However, mobiles using other sites or sectors may be prevented from using the site because they are confused by the error in frequency. This creates what is known as the “island cell” effect. By itself, the cell is still func-tional. To the rest of the system, it’s inaccessible.
The island cell effect can be caused by a failure in the site’s GPS receiver or timebase distribution network. To accurately measure the frequency, the test equipment must have access to the reference frequency from the GPS receiver. Note that the absolute measurement is only as good as the reference to which it is compared.
Time offsetIn CDMA, each sector of each base station site operates on the same frequency channel, and is distinguished from the others by a “short code” sequence (also known as a PN offset). These sequences are applied to the I and Q signals before modulation. The short sequences are offset in time by 52.08 µs (64 chips) each and they repeat every 26.666 ms (32768 chips). This yields 512 short sequence codes (32768/64), where each has a unique offset.
Power that correlateswith ideal
Total Power
Signal Power
Signal Power +Error Power
> 0.912 Figure 11. Waveform quality, rho

13 | Keysight | Understanding CDMA Measurements for Base Stations and Their Components - Application Note
The “boundary” where the codes repeat is fifteen zeros followed by a one. The time offset (also called pilot time tolerance) mea-surement compares the time of the repeat to the offset from the even-second clock (base station, or GPS time). For example, PN 0 should have its repeat occur exactly on the rising edge of the even-second clock. PN 1 should have the repeat occur 52.08 µs after the rising edge of the even-second clock, and so forth (see Figure 12).
Any error in time from that event is reported as a time offset. The CDMA standards specify a maximum offset of 10 microsec-onds, but 3 microseconds is a recommended maximum.
When testing time offset, the timing of the even second to GPS must be verified independently. Time offset is reported as part of rho and code-domain measurements (relative to the even-second clock). This is the only transmitter test that re-quires the even-second clock signal from the base station. Other transmitter tests can be performed without this connection.
Why is time offset important?The “island cell” effect can also occur if the pilot time tolerances are out of specifications.
A mobile moving outwards toward the limit of its cell will need to acquire the adjacent cell in order to hand off. If the time off-set of the target cell is too far from that of the current site, the handoff will not happen.
Carrier feedthrough (I/Q origin offset)Excessive DC offsets in the base station’s I/Q modulator cause high levels of carrier feed-through. This results in degraded modulation quality (rho), and is typically reported as part of the rho measurement. Low results indicate a good I/Q modulator, whereas higher values indicate potential problems. A value of approximately –25 dBc or greater tells us that there is a problem with the I/Q modulator or its input I or Q signals.
Modulation quality exampleThis example shows rho, frequency error, pilot time offset and carrier feedthrough for a forward signal containing only a pilot (Walsh code 0) channel.
In Figure 13, the display on the left shows a signal that is well within specifications. The right display shows a signal whose frequency, pilot time offset and carrier feedthrough have been degraded. In this case, the pilot time offset and frequency error do not degrade rho. The entire degradation was caused by the carrier feedthrough.
Figure 13. Rho degradation due to carrier feedthrough
Using the example from Figure 11, one can calculate the effect of the carrier feedthrough as follows:
Where: Wideal = power that correlates with ideal pilot channel Wtotal = total power in pilot channel
In the right graph, the total has been further increased by a carrier feedthrough of –20.7 dB or 0.00851.
As expected, this matches the rho result on the right display.
Code-domain analysisBefore the advent of the CDMA system, most analysis tools used to design, test, and repair cellular telephone systems operated in one of two modes: time-domain analysis or frequency-domain analysis. Familiar time-domain analyzers include oscilloscopes, voltmeters, and power meters. The most familiar frequency-do-main analyzer is the spectrum analyzer. These tools are still very useful in working with CDMA. However, because CDMA uses digital coding to define channels, a new mode, called code-do-main analysis, is required.
A typical CDMA base station has a number of Walsh-coded channels that are all active in the same 1.23 MHz bandwidth. These channels include the Pilot Channel (Walsh Code 0), Pag-ing Channels (Walsh Codes 1 to 7), a Sync Channel (Walsh code 32) and a number of active traffic channels (any of the remaining Walsh codes). To analyze such a composite waveform, a code-do-
110... 011...101 000... 000000... 001...111... 010...011... 100...110... 011...101 000... 000PN Offset 2
32768chips
110... 011...101 000... 000000... 001...111... 010...011... 100...110... 011...101 000... 000PN Offset 1
32768chips
110... 011...101 000... 000000... 001...111... 010...011... 100...110... 011...101 000... 000PN Offset 0
32768chips
15 zeros
64 chips 64 chips 64 chips
Even Second
Figure 12. Pilot time tolerance (time offset)
left = Wideal = 0.9884Wtotal
r
right = Wideal = 0.980
Wtotal (1+0.00851) r

14 | Keysight | Understanding CDMA Measurements for Base Stations and Their Components - Application Note
main analyzer receives the CDMA signal and then decodes each channel using a Walsh code correlation algorithm. The cor-relation algorithm searches the waveform for a high correlation factor for each Walsh code. Once the channels are decoded, the analyzer determines the relative power in each Walsh channel relative to the total power in the CDMA signal. The result of this measurement is a graphical display of the relative power in each channel, called a code-domain-power graph (see bottom graph of Figure 14).
By using this measurement, the health of a CDMA transmitter can be quickly determined. This measurement allows you to verify that each Walsh channel is operating at its proper level, and quantify the inactive traffic noise level.
Code-domain powerOn a spectrum analyzer, you can view the 1.23 MHz forward link channel; it would appear as the envelope of the top graph in Figure 14. Note that the addition of a traffic channel does not change the spectrum shape, only its magnitude. But how much of the total signal, as viewed on the spectrum analyzer, is attributed to each Walsh code? You cannot tell using frequen-cy-domain analysis; code-domain analysis is required.
Code-domain power measures the fraction of total power trans-mitted in each Walsh channel. The contribution of each Walsh channel to the total signal is measured and displayed as a bar indicating the relative power in the channel. A Walsh-code-do-main power display has Walsh codes 0–63 displayed horizontal-ly, with the power in each Walsh code displayed vertically. The measured values for all 64 Walsh codes will add to unity.
The bottom graph of Figure 14 shows a typical display of code-domain power. Note the contribution to the total signal from the pilot, sync, and paging channels. In this example, there are also three users of traffic channels on the forward link.
Figure 14. Code-domain power
Note also the noncorrelated data on the inactive channels. The amount of power in the inactive codes indicates the amount of excess power being transmitted. The 64 Walsh codes are orthogonal, so they do not interfere with each other. All of the power in the 1.23 MHz bandwidth must appear somewhere in the 64 possible codes. Any error power will show up as power in all the other codes, including the inactive codes. The CDMA standards require all inactive codes to be at least 27 dB below total channel power. This is a moderately tight specification considering the waveform quality specification. Some power that is uncorrelated to the pilot channel is allowed. It is assumed that the other code channels will have similar uncorrelated power. The sum of all the uncorrelated power will create a noise floor in all the code channels. This is of no consequence for the active channels, but sets the performance limit for the inactive channels.
Another code-domain-power test specified in the IS-97 stan-dard is pilot power ratio. It is defined as the power attributed to the pilot channel divided by the total power, expressed in dB. The specification is the equipment manufacturer’s configured value ±0.5 dB.
Why is code-domain power important?Walsh codes are the fundamental channelization mechanism for CDMA. Measuring code-domain power is essential for verifying that the base station is transmitting the correct power in each of the channels (that is, the power in each channel relative to the total power and relative to the power in each of the other channels is correct).
The measurement of code-domain power is similar to measure-ments made with a spectrum analyzer on AMPS and TDMA sys-tems. With a spectrum analyzer, you are able to view the control channels and traffic channels individually. You can quickly check for the presence and the signal level of any of these channels. The code-domain power measurement provides comparable in-formation for CDMA systems. It is a quick look at all the channel elements’ contributions for a given frequency assignment and PN offset.
Code-domain power is especially important for the installer and service provider. The absence of a pilot or sync channel will render the sector useless to mobiles in that geography. In some cases, providers have been unable to determine if a pilot signal is on or if only a pilot signal is on; code-domain power shows this instantly. These are insidious failures, as often the “green lights” at the site and switch will indicate that nothing is amiss.
It is also important to check the code-domain power levels of the “inactive” channels. This is power that correlates to unused Walsh channels. Excess power in the inactive channels means reduced capacity for the cell.
PilotSynchPaging
frequency1.2288 MHz
inactive channels
Frequency Domain
Code Domain
User #3User #2User #1
Walsh Code
0 1 2 3 4 5 6 7 8 9 32 40 63
Pilot User #1
User #2
SynchUser #3Paging

15 | Keysight | Understanding CDMA Measurements for Base Stations and Their Components - Application Note
Interpreting code-domain power measurements Walsh code mixingWalsh codes share many properties with sine waves. One of these properties is that a nonlinear device can cause Walsh codes to mix in a process that behaves much like intermodula-tion.
The plot on the top in Figure 15 shows an IS-95 CDMA for-ward-link signal in what is essentially a linear system. Walsh codes 0, 1, 17, and 32 are active and there is some residual error that forms the noise floor.
The plot on the bottom was obtained by taking the same signal and feeding it through an amplifier that was driven into com-pression. It can be seen that the noise floor was degraded in a very specific way. Walsh code 1 was mixed with Walsh codes 17 and 32, causing power to show up on Walsh codes 16 and 33. Walsh code 17 mixed with 32 to create power on Walsh code 49. Excessive power on individual inactive Walsh codes is often an indication of nonlinear operation.
NoiseCDMA systems are often degraded by noise. We will consider an example of a Gaussian noise source that has a flat power spec-tral density over the 1.23 MHz bandwidth of the CDMA signal, and see how this affects the code domain.
The PN spreading and de-spreading used in IS-95 CDMA takes the energy in the noise interference and spreads it equally among all Walsh codes. Therefore, it looks like white noise in the code-domain (see Figure 16).
To calculate the noise in the code-domain, we use the fact that 1/64 of the noise energy occupies each Walsh Code.
Let:
If we use the fact that = signal power/(signal power + error power), then for the ith Walsh code:
Each active Walsh code contains its allotted power as well as a fraction of error power that is assumed to be equally distributed among all Walsh codes.
For unused Walsh codes where there is no signal power, Wi=0:
In this example, the noise has the same power as the CDMA signal; therefore the total power (denominator) is twice the power in the interference.
The value of the average code-domain floor in this case is –21 dB.
All sources of uncorrelated interference behave similarly in the code-domain. The power of the interference is spread equally over all Walsh codes, and contributes to the code-domain noise floor.
The code-domain timing and phase measurements are similar to code-domain power, in that they show the performance of individual Walsh channels.
Let:
ri
= code-domain power coefficient, rho, for the ith active Walsh code. There are N active Walsh codes.
rj = average of the code-domain power
reading for the jth inactive Walsh code. There are 64 – N inactive Walsh codes. Wi = power in ith active Walsh channel Wnoise = total power in the noise
S (Wi + Wnoise) i =
Wi + Wnoise 64r
(Wi + Wnoise) j =
Wnoise
64r
Figure 15. Nonlinearities in Walsh code domain
2Wnoisej =
Wnoise
= –21 dB 64r

16 | Keysight | Understanding CDMA Measurements for Base Stations and Their Components - Application Note
Code-domain timingWalsh codes are useful for distinguishing forward-link traffic channels because they are orthogonal and do not interfere with each other. The orthogonality of Walsh codes is lost when they are not time aligned. With the loss of time alignment, one traffic channel can interfere with others.
Code-domain timing, also known as the Pilot-to-Walsh-Channel Time Tolerance, measures the time offset or timing error be-tween the pilot (Walsh 0) and each of the other 63 Walsh codes. A Walsh-Code-Domain Timing measurement displays codes 0–63 horizontally and the time offset between each Walsh Channel and the Pilot vertically. Typically, only the timing for active Walsh codes is shown (see Figure 17). The noisy nature of inactive codes yields rather messy results.
The time alignment between Walsh channels is carefully deter-mined by design. Base station ASICs have several adjustments to ensure that timing is properly aligned when all of the Walsh codes reach the antenna.
Sources of timing errors can be errors in ASIC time adjustment parameters, actual time delays in baseband signal paths or intermodulation between Walsh codes. The CDMA standards specify a Pilot-to-Walsh-Channel Time Tolerance of less than 50 nanoseconds.
Code-domain phaseThe IS-95 CDMA forward link uses separate and distinct I and Q PN spreading sequences. The same sequences are used for the Pilot and all the Walsh Channels. The mobile receiver uses the received pilot to synchronize its spreading sequences and phase align its local oscillator (LO). The LO is then assumed to also be phase aligned with each of the different Walsh codes. Any phase misalignment between the transmitted Pilot and other Walsh channels will result in a de-spreading error and cause additional interference at the mobile receiver.
A phase error between the receiver LO and its Walsh channel results in interference from I to Q and from Q to I. Phase errors are essentially a loss of orthogonality between I and Q (see Figure 18). These can result from cross talk between I and Q in the base station baseband processing section, misaligned LOs or intermodulation between Walsh codes.
Code-domain phase is the phase difference between the pilot channel and each Walsh channel. The CDMA standards call for a Pilot-to-Code-Channel Phase Tolerance of less than 50 milliradi-ans or 2.86 degrees.
Why are code-domain timing and phase important?Orthogonality is only achieved if the codes are aligned in time. If alignment is poor, the other Walsh channels begin to look like additional noise in the system, and capacity and coverage will decrease. CDMA mobiles use synchronous detection, with the pilot’s phase as the reference. They assume there is phase co-herence on the other channels in the sector. If there is not, the mobile may have difficulty demodulating data from the traffic channel.
Q-to-I interference
I-to-Q interference
Figure 16. Noise in Walsh code domain
Figure 17. Code-domain timing
Figure 18. Phase error
Figure 19. Code-domain phase
17 | Keysight | Understanding CDMA Measurements for Base Stations and Their Components - Application Note
In-band/out-of-channel measurementsThe in-band/out-of-channel measurements are those that measure distortion and interference within the system band, but outside of the transmitting channel. They include:
– In-band spurious emissions – Adjacent Channel Power Ratio (ACPR; also called spectral
regrowth)
There are stringent regulatory controls on the amount of inter-ference that a transmitter can cause to neighboring channels. The standards specify the amount of interference allowed by the system. This is the in-band spurious emissions measure-ment. For components, on the other hand, the individual NEMs will typically specify Adjacent Channel Power Ratio or spectral regrowth as the figure of merit. This is a better measure of the distortion performance of the components to be used in the base station system. The component ACPRs will always be tighter than the system specifications, but can vary in degree depending upon the system design.
The distributed test elements recommended here include: (1) a signal generator with good adjacent-channel-power perfor-mance (out-of-channel measurements) and multiple Walsh-code channel capability (transmitter tests), and (2) a vector sig-nal analyzer with excellent accuracy. If the measurement requires high dynamic range (that is, very tight ACPR specifications), a swept spectrum analyzer is recommended. Both analyzers will be discussed.
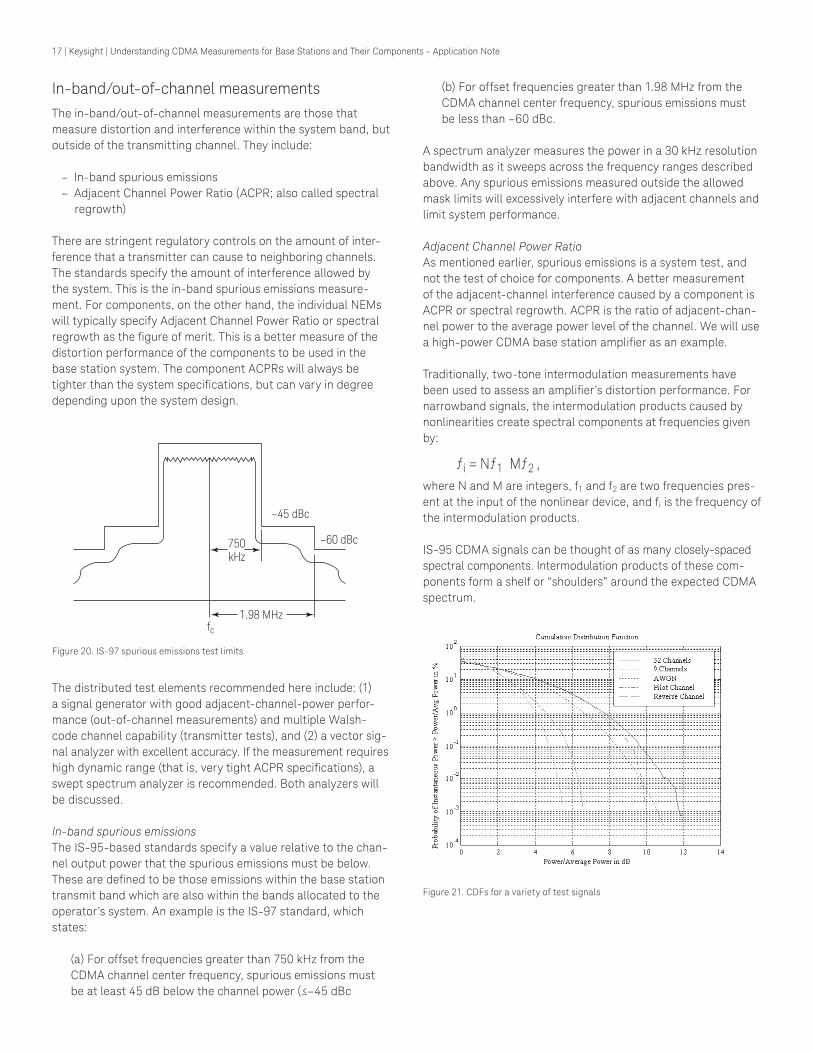
In-band spurious emissions The IS-95-based standards specify a value relative to the chan-nel output power that the spurious emissions must be below. These are defined to be those emissions within the base station transmit band which are also within the bands allocated to the operator’s system. An example is the IS-97 standard, which states:
(a) For offset frequencies greater than 750 kHz from the CDMA channel center frequency, spurious emissions must be at least 45 dB below the channel power (≤–45 dBc
(b) For offset frequencies greater than 1.98 MHz from the CDMA channel center frequency, spurious emissions must be less than –60 dBc.
A spectrum analyzer measures the power in a 30 kHz resolution bandwidth as it sweeps across the frequency ranges described above. Any spurious emissions measured outside the allowed mask limits will excessively interfere with adjacent channels and limit system performance.
Adjacent Channel Power RatioAs mentioned earlier, spurious emissions is a system test, and not the test of choice for components. A better measurement of the adjacent-channel interference caused by a component is ACPR or spectral regrowth. ACPR is the ratio of adjacent-chan-nel power to the average power level of the channel. We will use a high-power CDMA base station amplifier as an example.
Traditionally, two-tone intermodulation measurements have been used to assess an amplifier’s distortion performance. For narrowband signals, the intermodulation products caused by nonlinearities create spectral components at frequencies given by:
ƒi = Nƒ1 Mƒ2 ,where N and M are integers, f1 and f2 are two frequencies pres-ent at the input of the nonlinear device, and fi is the frequency of the intermodulation products.
IS-95 CDMA signals can be thought of as many closely-spaced spectral components. Intermodulation products of these com-ponents form a shelf or “shoulders” around the expected CDMA spectrum.
–45 dBc
–60 dBc750kHz
fc1.98 MHz
Figure 20. IS-97 spurious emissions test limits
Figure 21. CDFs for a variety of test signals

18 | Keysight | Understanding CDMA Measurements for Base Stations and Their Components - Application Note
The measurement of intermodulation products is complicated by the fact that IS-95 signals have a large crest factor (ratio of peak to average power). Therefore, the traditional two-tone signal is not an appropriate stimulus. Tests made with a two-tone stim-ulus do not provide a useful measure of the operational perfor-mance of CDMA base station amplifiers. Network equipment manufacturers are instead requiring component manufacturers to provide ACPR results as the figure of merit for distortion performance.
The stimulus chosen for ACPR measurements can greatly affect the outcome of the test. Some commonly chosen signals include noise that covers the CDMA channel bandwidth, signals with multiple Walsh-code channels activated, and proprietary signals. Each of these signals will cause a different amount of stress to an amplifier operating near its maximum power level. In fact, amplifiers that pass ACPR tests with one source may fail with another.
Experimentally, it has been found that ACPR results can vary as much as 17 dB depending on the stimulus. The stress of a stimulus can be characterized by a statistical method called the Cumulative Distribution Function (CDF). See reference #4 for more information.
Figure 21 shows the CDFs for several stimuli. It tells us the prob-ability that samples of the signal are greater than x dB above the average power level of the signal. For example, 0.1% of the samples in the Additive White Gaussian Noise (AWGN) source are greater than 9.1 dB above the average power output. This will cause a certain amount of adjacent channel interference.
The noise source was found to provide the least amount of stress and therefore give the best ACPR results. (The pilot and reverse channels are only included for comparison purposes and are not considered appropriate signals for base station tests.) A noise source does not correctly simulate real-life operating conditions. A more realistic high-stress stimulus signal uses the 9-channel signal (six traffic, the pilot, sync, and one paging) given in the IS-97 standard. The combination of Walsh-code channels selected, however, will also affect the results of the ACPR measurements (see Figure 22).
The safest approach is to use at least one of the realistic high-stress stimulus signals, and test with various combinations of Walsh-code channels. Therefore, a signal generator with this flexibility is highly recommended.
An additional requirement for the CDMA signal generator is that its ACP performance be very good. This ensures that the power measured in the adjacent channels is caused by the device un-der test, and not the signal generator or the signal analyzer.
The specification for measuring ACPR requires a comparison of the power in the RF channel to the power at several offsets. This can be done either as a power ratio or a power density.
0 2 4 6 8 1210
100
10
1
0.1
0.01
0.001
Prob
abili
ty (%
)
dB Above Average Power
9 ch CDMA #16
9 ch CDMA #1
9 ch CDMA #7
Pseudonoise
Figure 23. Adjacent Channel Power Ratio specification
The power-ratio method compares the power in the speci-fied adjacent-channel bandwidth (for example, 30 kHz) to the total power of the carrier across the entire carrier bandwidth (1.23 MHz). From Figure 23, the +885 kHz ACPR result would be C dBc (relative to A).
The power density method compares the power density at the offset frequency, in a 30 kHz bandwidth, to the power within an average bandwidth of the same (30 kHz) width in the carri-er-channel bandwidth. From Figure 23, the +885 kHz ACPR re-sults would be C/B dB. This can be calculated by normalizing the 1.23 MHz-channel-power result to a 30 kHz bandwidth (subtract 10 log[1.23 MHz/30 kHz] = 16.13 dB from A).
Figure 22. CDFs for three 9-channel signals with different traffic chan-nels active
30 kHz
885kHz
1.98 MHz
885kHz
1.98 MHz
30 kHz
30 kHz
1.23 MHz
B = average power in 30 kHz bandwidthA = total power across
1.23 MHz channel bandwidth
C = total power within 30 kHz bandwidth at offset
19 | Keysight | Understanding CDMA Measurements for Base Stations and Their Components - Application Note
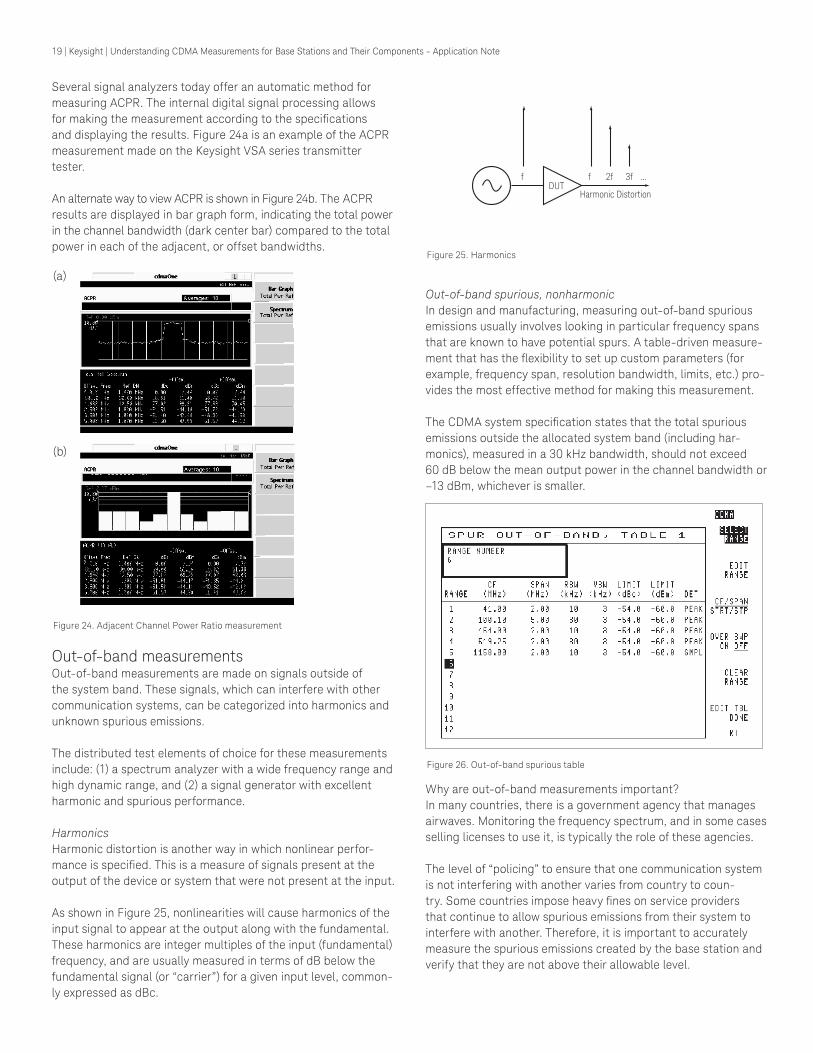
Several signal analyzers today offer an automatic method for measuring ACPR. The internal digital signal processing allows for making the measurement according to the specifications and displaying the results. Figure 24a is an example of the ACPR measurement made on the Keysight VSA series transmitter tester.
An alternate way to view ACPR is shown in Figure 24b. The ACPR results are displayed in bar graph form, indicating the total power in the channel bandwidth (dark center bar) compared to the total power in each of the adjacent, or offset bandwidths.
Out-of-band measurementsOut-of-band measurements are made on signals outside of the system band. These signals, which can interfere with other communication systems, can be categorized into harmonics and unknown spurious emissions.
The distributed test elements of choice for these measurements include: (1) a spectrum analyzer with a wide frequency range and high dynamic range, and (2) a signal generator with excellent harmonic and spurious performance.
Harmonics Harmonic distortion is another way in which nonlinear perfor-mance is specified. This is a measure of signals present at the output of the device or system that were not present at the input.
As shown in Figure 25, nonlinearities will cause harmonics of the input signal to appear at the output along with the fundamental. These harmonics are integer multiples of the input (fundamental) frequency, and are usually measured in terms of dB below the fundamental signal (or “carrier”) for a given input level, common-ly expressed as dBc.
Out-of-band spurious, nonharmonicIn design and manufacturing, measuring out-of-band spurious emissions usually involves looking in particular frequency spans that are known to have potential spurs. A table-driven measure-ment that has the flexibility to set up custom parameters (for example, frequency span, resolution bandwidth, limits, etc.) pro-vides the most effective method for making this measurement.
The CDMA system specification states that the total spurious emissions outside the allocated system band (including har-monics), measured in a 30 kHz bandwidth, should not exceed 60 dB below the mean output power in the channel bandwidth or –13 dBm, whichever is smaller.
Figure 26. Out-of-band spurious table
Why are out-of-band measurements important?In many countries, there is a government agency that manages airwaves. Monitoring the frequency spectrum, and in some cases selling licenses to use it, is typically the role of these agencies.
The level of “policing” to ensure that one communication system is not interfering with another varies from country to coun-try. Some countries impose heavy fines on service providers that continue to allow spurious emissions from their system to interfere with another. Therefore, it is important to accurately measure the spurious emissions created by the base station and verify that they are not above their allowable level.
(a)
(b)
Figure 24. Adjacent Channel Power Ratio measurement
Figure 25. Harmonics
DUTHarmonic Distortion
f 3ff 2f ...
20 | Keysight | Understanding CDMA Measurements for Base Stations and Their Components - Application Note
ReceiverReceiver tests attempt to quantify the performance of a receiver in the presence of degradations in the signal path between the transmitter and the receiver. In the case of CDMA base-station receivers, the figure of merit is the Frame Error Rate or FER (discussed below). Receiver tests consist of measuring FER as a function of various reverse-link degradations. Some common receiver tests include:
– Sensitivity – Dynamic range – Spurious immunity – Performance in Additive White Gaussian Noise (AWGN) – Performance in an environment with multipath interference
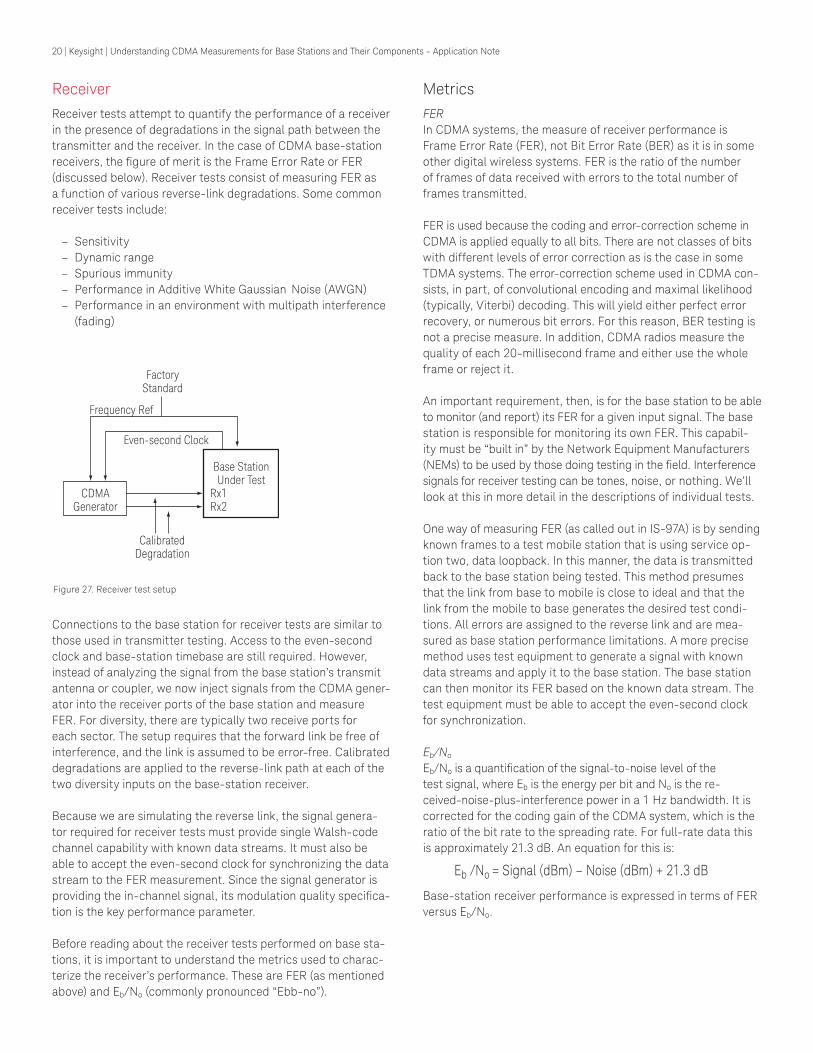
(fading)
Connections to the base station for receiver tests are similar to those used in transmitter testing. Access to the even-second clock and base-station timebase are still required. However, instead of analyzing the signal from the base station’s transmit antenna or coupler, we now inject signals from the CDMA gener-ator into the receiver ports of the base station and measure FER. For diversity, there are typically two receive ports for each sector. The setup requires that the forward link be free of interference, and the link is assumed to be error-free. Calibrated degradations are applied to the reverse-link path at each of the two diversity inputs on the base-station receiver.
Because we are simulating the reverse link, the signal genera-tor required for receiver tests must provide single Walsh-code channel capability with known data streams. It must also be able to accept the even-second clock for synchronizing the data stream to the FER measurement. Since the signal generator is providing the in-channel signal, its modulation quality specifica-tion is the key performance parameter.
Before reading about the receiver tests performed on base sta-tions, it is important to understand the metrics used to charac-terize the receiver’s performance. These are FER (as mentioned above) and Eb/No (commonly pronounced “Ebb-no”).
MetricsFER In CDMA systems, the measure of receiver performance is Frame Error Rate (FER), not Bit Error Rate (BER) as it is in some other digital wireless systems. FER is the ratio of the number of frames of data received with errors to the total number of frames transmitted.
FER is used because the coding and error-correction scheme in CDMA is applied equally to all bits. There are not classes of bits with different levels of error correction as is the case in some TDMA systems. The error-correction scheme used in CDMA con-sists, in part, of convolutional encoding and maximal likelihood (typically, Viterbi) decoding. This will yield either perfect error recovery, or numerous bit errors. For this reason, BER testing is not a precise measure. In addition, CDMA radios measure the quality of each 20-millisecond frame and either use the whole frame or reject it.
An important requirement, then, is for the base station to be able to monitor (and report) its FER for a given input signal. The base station is responsible for monitoring its own FER. This capabil-ity must be “built in” by the Network Equipment Manufacturers (NEMs) to be used by those doing testing in the field. Interference signals for receiver testing can be tones, noise, or nothing. We’ll look at this in more detail in the descriptions of individual tests.
One way of measuring FER (as called out in IS-97A) is by sending known frames to a test mobile station that is using service op-tion two, data loopback. In this manner, the data is transmitted back to the base station being tested. This method presumes that the link from base to mobile is close to ideal and that the link from the mobile to base generates the desired test condi-tions. All errors are assigned to the reverse link and are mea-sured as base station performance limitations. A more precise method uses test equipment to generate a signal with known data streams and apply it to the base station. The base station can then monitor its FER based on the known data stream. The test equipment must be able to accept the even-second clock for synchronization.
Eb/No
Eb/No is a quantification of the signal-to-noise level of the test signal, where Eb is the energy per bit and No is the re-ceived-noise-plus-interference power in a 1 Hz bandwidth. It is corrected for the coding gain of the CDMA system, which is the ratio of the bit rate to the spreading rate. For full-rate data this is approximately 21.3 dB. An equation for this is:
Base-station receiver performance is expressed in terms of FER versus Eb/No.
Even-second Clock
Frequency Ref
Base StationUnder Test
Rx1Rx2
CDMAGenerator
FactoryStandard
CalibratedDegradation
Figure 27. Receiver test setup
Eb /No = Signal (dBm) – Noise (dBm) + 21.3 dB

21 | Keysight | Understanding CDMA Measurements for Base Stations and Their Components - Application Note
MeasurementsSensitivitySensitivity is a measure of the lowest signal level that can be received for an acceptable FER. This requires accurate level control and is best accomplished if power control is disabled in the mobile station simulator or AGC (automatic gain control) is disabled in the signal generator. Disabling of power control is needed because mobile power is increased when the base station receives low signal levels.
The sensitivity of the receiver can also be thought of as a mea-sure of the noise figure of the receiver (without interference, the noise floor of the receiver sets the performance limits). Sensitivity is the ability of the base station to recover digital data even when the signal level input is quite low.
A common method of measurement is to apply equal signal lev-els from the CDMA generator to each receiver input of the base station under test. Using a predefined bit pattern, the receiver must decode the data, reporting frame errors.
The sensitivity specification for a CDMA base station receiver is that an FER better than 1% must be achieved for a level of –117 dBm at each receiver input. This is 4 dB below kTB ( –113 dBm) in a 1.23 MHz bandwidth at room temperature. The base station expects to receive signals well below thermal noise because of the high coding gain (approximately +20 dB) of the CDMA system. The sensitivity of the receiver is mostly affected by its noise figure.
Dynamic rangeDynamic range is the ability of the receiver to receive signals that are very weak or very strong. It is the ratio, expressed in dB, of the highest-level signal that can be received to the lowest-level signal that can be received. As with sensitivity, dynamic range requires accurate level control.
Dynamic range uses the same setup as sensitivity; however, the signal is very large (–65 dBm). This tests the overload capability of the base station.
The highest-level signal that can be received for the same 1% FER must then be measured to determine dynamic range. In this case, the input signal level is increased until 1% FER is achieved. The dynamic range of a receiver is affected by its linearity and noise figure.
Base StationUnder Test
CDMAGenerator
CDMA Time Base
RX (A)
RX (B)
Even-Second Clock
Frequency REF
Duplex Out
Reported FER
Figure 28. Sensitivity measurement setup

22 | Keysight | Understanding CDMA Measurements for Base Stations and Their Components - Application Note
Spurious immunitySpurious immunity measures the base station’s ability to reject unwanted CW signals. In the IS-97 standard, there are two tests: (1) single-tone desensitization, and (2) intermodulation-spuri-ous-response attenuation. Both tests are measured in terms of the change of in-band power required to maintain the link at 1.5% FER.
The method used to perform the single-tone desensitization test involves injecting a single CW tone just outside the channel bandwidth. This test measures the sharpness of the IF filters. The intermodulation test uses two interference CW tones that are set outside the channel in such a way that the third-order in-termodulation distortion products fall inside the CDMA channel. This test measures the linearity of the receiver’s front end.
The test set up is similar to the sensitivity test except that one or more interfering CW tones, from CW signal generators, are added to the CDMA signal (see Figure 29).
Performance in AWGNAnother test that is specified in the CDMA standards is the receiver’s performance in the presence of Additive White Gaussian Noise (AWGN). This setup tests the receiver’s ability to properly decode the desired CDMA data in an environment of high interference. This test measures the fundamental ability of the receiver to find and demodulate the desired signal in the presence of noise.
In this setup, we now add interference from the AWGN genera-tor (see Figure 30). This emulates the interference the receiver would see from mobiles in other sites and sectors, plus any additional system interference.
RX (A)
RX (B)
CW Tone(s)
Reported FER
RF in/out
CDMASignalS
RX (A)
RX (B)
AWGN
Reported FER
RF in/out
CDMASignalS
Figure 29. Spurious immunity test setup
Figure 30. Performance in AWGN test setup

23 | Keysight | Understanding CDMA Measurements for Base Stations and Their Components - Application Note
AWGN tests are done at receive signal levels substantially above the sensitivity of the receiver and are largely unaffected by noise figure or linearity. The performance in AWGN is mostly affected by the design of the baseband portions of the receiver.
The table shown in Figure 31 shows the FER values expected of the receiver for various Eb/No settings and data bit rates. The test signals were set well above the noise floor of the receiver with the noise set to a value of –84 dBm. The test CDMA chan-nel was then set to a value that resulted in an Eb/No of 4.1 dB and 4.7 dB. This was done for several data rates. The perfor-mance curve shown on the right is for the 9600 bps rate.
Note that at the 9600 bps rate, a change of only 0.6 dB in Eb/No results in a drastic change in FER. We can see that changing the level of the CDMA channel by 0.6 dB changes the specified FER by a factor of more than 10, from 0.2% to 2.5%. This steep slope of FER change is an indication of the effect of the system’s error-correction capability.
In design and manufacturing, the test setup typically includes dual AWGN generators with individual level control. The amount of equipment and complexity involved in setting this up prohib-its this approach in field-testing. Installation and maintenance therefore typically use a test set that has AWGN capability.
Performance in multipath fading environmentThe test setup changes for the fading test (see Figure 32). A channel simulator is used to provide specified fading profiles. The AWGN source is added after the channel simulator. In this test, reverse-link power control is disabled, which is quite different from actual conditions. The test was designed this way to check that the fundamental receiver capabilities are met at a specified level.
Figure 33 shows the channel models for fading tests. Tests using these profiles are performed at all data rates. This tests the re-ceiver’s performance separate from the system’s performance. The receiver requires higher average Eb/No than when power control is working.
Data rate(kbps)
9.6
4.8
2.4
1.2
At 4.7 Eb/No
0.2
0.9
5.0
3.2
At 4.1 Eb/No
2.5
6.6
23.0
9.4
FER limits (%)
3
2.5
2
1.5
1
0.5
04 4.1 4.2 4.3 4.4 4.5 4.6 4.7 4.8
Eb/No dB
FER%
Figure 31. Performance in AWGN limits
CDMA TestTranscevier
Fading Simulator
NoiseGenerator
Receiver Under Test
Fading Simulator
NoiseGenerator
Number ofPaths
1
2
3
VehicleSpeed
30 km/hr
8 km/hr
100 km/hr
Path 2Power
(relative toPath 1)
N/A
0 dB
0 dB
Path 3Power
(relative toPath 1)
N/A
N/A
-3 dB
Path 3Delay
(relative toPath 1)
N/A
N/A
14.5 sec
Path 2Delay
(relative toPath 1)
N/A
2.0 sec
2.0 sec
Figure 32. Performance in fading setup
Figure 33. Receiver test fading profiles
24 | Keysight | Understanding CDMA Measurements for Base Stations and Their Components - Application Note
These channel models were chosen to best test the base-sta-tion implementations, not because they represent a channel condition that is likely to occur.
Why are receiver measurements important?The sensitivity test is basically a measure of the receiver’s noise figure performance. Poor sensitivity means higher FER for a giv-en level from a mobile. This forces the base station to order the mobile to increase its power until the FER is acceptable.Because the mobiles are at a higher level, capacity is reduced.Because the receiver dynamic range test measures the receiv-er’s ability to process data with large input signals, it is a key test for determining immunity to what is called the “near/far” problem of the CDMA system: strong signals near a CDMA re-ceiver can overload the receiver section, blocking any reception of desired signals.
The performance in AWGN test is a key receiver measure, as it tests the receiver in its normal operating environment (receiving desired signals in the presence of system interference). There-fore, the AWGN generator plays an important part in receiver measurements. Performance in AWGN also affects the coverage and capacity in a given sector. Calls should be handed off if the mobile is at its maximum power level and the link does not meet FER criteria. This condition can be worsened as more subscrib-ers are added to the system.
Summary
IS-95 CDMA signals have unique characteristics. They are spread-spectrum signals that are noise-like in their behavior. CDMA signals have high crest factors and their power is variable. The unique method of code channelization used by IS-95 CDMA requires new measurements that are system specific. The mea-surement of Walsh-code-domain power allows one to distin-guish the power in a particular code channel; this is analogous to the way spectrum analyzers measure power in the frequen-cy domain for conventional communications systems. Many well-understood sources of interference, such as spurs, noise, or intermodulation behave uniquely in a CDMA system. CDMA measurement results can also yield useful computed results, such as calibrated Eb/No measurements and rho estimation.Understanding these complexities is important for ensuring accurate CDMA measurement results. This application note is intended to be used as a guide in this endeavor.
References
1. Concepts of CDMA, 1997, Keysight literature number 1000-1403.
2. Spectrum Analyzer Measurements and Noise, Application Note 1303, Keysight literature number 5966-4008E.
3. Spectrum Analysis, Application Note 150, Keysight litera-ture number 5952-0292.
4. Nick Kuhn, Bob Matreci, and Peter Thysell, Proper Stimulus Ensures Accurate Tests of CDMA Power, (Article Reprint) Keysight literature number 5966-4786E.
5. Marcus Da Silva, CDMA Base Station Test Challenges, 1997, Keysight part number 1000-1480.
6. Ken Thompson, CDMA System and Base Station Test Over-view, 1997, Keysight part number 1000-1507.
7. CDMA Base Station Test Methods, 1995, Keysight part number 1000-1306.
8. Marcus Da Silva, Interpreting CDMA Measurements, 1997, Keysight part number 1000-1510.
Related literature 8590 E-Series Spectrum Analyzer - Data Sheet, 5963-6908E85725C CDMA Measurement Personality - Technical Overview, 5963-9969Ecdma2000 X-Series Measurement Application N9072A & W9072A - Technical Overview, 5989-6533ENPerforming cdma2000 Measurements Today - Application Note, 5968-5858E

myKeysight
www.keysight.com/find/mykeysightA personalized view into the information most relevant to you.
Keysight Assurance Plans
www.keysight.com/find/AssurancePlansUp to five years of protection and no budgetary surprises to ensure your instruments are operating to specification so you can rely on accurate measurements.
Keysight Infoline
www.keysight.com/find/serviceKeysight’s insight to best in class information management. Free access to your Keysight equipment company reports and e-library.
Online Assistance
www.keysight.com/find/assist
By internet, phone, or fax, get assistance with all your test & measurement needs.
www.keysight.com/find/cdma2000
This document was formerly known as application note number 1311.
From Hewlett-Packard through Agilent to KeysightFor more than 75 years, we‘ve been helping you unlock measurement insights.
Our unique combination of hardware, software and people can help you reach
your next breakthrough. Unlocking measurement insights since 1939.
1939 THE FUTURE
For more information on Keysight Technologies’ products, applications or services, please contact your local Keysight office. The complete list is available at:www.keysight.com/find/contactus
Americas Canada (877) 894 4414Brazil 55 11 3351 7010Mexico 001 800 254 2440United States (800) 829 4444
Asia PacificAustralia 1 800 629 485China 800 810 0189Hong Kong 800 938 693India 1 800 11 2626Japan 0120 (421) 345Korea 080 769 0800Malaysia 1 800 888 848Singapore 1 800 375 8100Taiwan 0800 047 866Other AP Countries (65) 6375 8100
Europe & Middle EastAustria 0800 001122Belgium 0800 58580Finland 0800 523252France 0805 980333Germany 0800 6270999Ireland 1800 832700Israel 1 809 343051Italy 800 599100Luxembourg +32 800 58580Netherlands 0800 0233200Russia 8800 5009286Spain 800 000154Sweden 0200 882255Switzerland 0800 805353
Opt. 1 (DE)Opt. 2 (FR)Opt. 3 (IT)
United Kingdom 0800 0260637
For other unlisted countries:www.keysight.com/find/contactus(BP-07-24-15)
www.keysight.com/go/qualityKeysight Technologies, Inc.DEKRA Certified ISO 9001:2008 Quality Management System
25 | Keysight | Understanding CDMA Measurements for Base Stations and Their Components - Application Note
This information is subject to change without notice.© Keysight Technologies, 2000 - 2014Published in USA, July 31, 20145968-0953Ewww.keysight.com