kibi project - xtra-gold resources corp. technical report kibi...page 4.9 staking applications 15...
TRANSCRIPT

KIBI PROJECT Eastern Region, Ghana
NATIONAL INSTRUMENT 43‐101 TECHNICAL REPORT
REPORT PREPARED FOR:
Suite 301, 360 Bay Street Toronto ON, M5H 2V6
TEL: (416) 366‐4227 E‐MAIL: [email protected] WEB SITE: www.xtragold.com
REPORT PREPARED BY:
17 Orphan Crescent, Labone, Accra P.O. Box 2805, Osu, Accra, Ghana
TEL: +233 21 784 124 E‐MAIL: ghana@sems‐exploration.com WEB SITE: www.sems‐exploration.com


KIBI PROJECT
NATIONAL INSTRUMENT 43-101 TECHNICAL REPORT
TABLE OF CONTENTS
Page
1. SUMMARY ............................................................................................................ 1 1.1 Overview of the Republic of Ghana ........................................................... 1 1.2 Property Description and Location ............................................................. 2 1.3 Ownership ................................................................................................... 3 1.3.1 The Apapam Concession................................................................ 3 1.3.2 Other Properties ............................................................................. 3 1.4 Geology ...................................................................................................... 6 1.4.1 Regional Geology of Ghana .......................................................... 6 1.4.2 Property Geology .......................................................................... 7 1.5 Mineralization ............................................................................................. 7 1.6 Exploration ................................................................................................. 7 1.6.1 Exploration Concept ...................................................................... 7 1.6.2 Status of Exploration ..................................................................... 7 1.7 Development ............................................................................................... 7 1.7.1 Status of Development ................................................................... 7 1.8 Operations ................................................................................................... 7 1.8.1 Status of Operations ...................................................................... 7 1.9 Conclusions and Recommendations ........................................................... 8 1.9.1 Conclusions ................................................................................... 8 1.9.2 Recommendations ......................................................................... 8 2. INTRODUCTION ................................................................................................. 9 2.1 Introduction ................................................................................................ 9 2.2 Qualification of SEMS ............................................................................... 10 2.3 Purpose of the Report ................................................................................. 10 2.4 Scope of Work ............................................................................................ 10 2.5 Sources of Information and Data ................................................................ 11 2.6 Site Visit ..................................................................................................... 11 3. RELIANCE ON OTHER EXPERTS .................................................................. 11 4. PROPERTY DESCRIPTION AND LOCATION .............................................. 12 4.1 Property Area .............................................................................................. 12 4.2 Location ...................................................................................................... 12 4.3 Types of Mineral Licenses ......................................................................... 12 4.4 Title ............................................................................................................ 12 4.5 Surface Rights ............................................................................................ 13 4.6 Obligations ................................................................................................. 13 4.6.1 Work Obligations .......................................................................... 13 4.6.2 Financial Obligations .................................................................... 13 4.7 Concession Boundaries ............................................................................... 13 4.8 Small Scale Mining Licenses ..................................................................... 14

Page 4.9 Staking Applications .................................................................................. 15 4.9.1 Apapam Mining Lease Extension Application .............................. 15 4.9.2 Akim Apapam Reconnaissance License Application .................... 16 4.10 Other Properties .......................................................................................... 17 4.11 Location of Known Mineralized Zones, Mineral Resources, Mineral Reserves, Mine Workings and Important Natural Features .......... 17 4.12 Royalties, Back-in Rights, Payments, Agreements and Encumbrances ...................................................................................... 17 4.12.1 Royalties ........................................................................................ 17 4.12.2 Back-in Rights, Payments, Agreements and Encumbrances ......... 17 4.13 Environmental Liabilities ........................................................................... 17 4.14 Permits ........................................................................................................ 17 5. ACCESSIBILITY, CLIMATE, LOCAL RESOURCES, INFRASTRUCTURE AND PHYSIOGRAPHY ................................................. 18 5.1 Topography, Elevation and Vegetation ...................................................... 18 5.2 Accessibility ................................................................................................ 19 5.3 Proximity and Nature of Transport ............................................................. 19 5.4 Climate and Length of Operating Season ................................................... 19 5.5 Surface Rights ............................................................................................ 19 5.6 Local Resources .......................................................................................... 19 5.7 Infrastructure .............................................................................................. 19 6. HISTORY .............................................................................................................. 20 6.1 General History .......................................................................................... 20 6.2 Alluvial Mining and Exploration History ................................................... 20 6.3 Historic Lode Gold Prospect Development ................................................ 22 6.3.1 Kibi Mine (Clearing Reef) ............................................................ 22 6.3.2 Hill Reef (Gold Mountain) ............................................................ 22 6.3.3 Kwabeng Mine and Tumfa Mines ................................................. 23 6.4 Historical Alluvial Gold Exploration ......................................................... 23 6.5 Production from the Property ..................................................................... 28 7. GEOLOGICAL SETTING .................................................................................. 28 7.1 Regional Geology ....................................................................................... 28 7.2 Kibi Gold Belt – Atewa Range Geology .................................................... 29 7.3 Property Geology ........................................................................................ 30 7.3.1 Property Geology: Lithology ........................................................ 30 7.3.2. Property Geology: Structure ......................................................... 32 7.3.3 Property Geology: Lateritic Weathering ...................................... 34 8. DEPOSIT TYPES .................................................................................................. 35 8.1 Lode Gold Deposits .................................................................................... 35 8.2 Exploration Model ...................................................................................... 36 8.3 Alluvial Gold Deposits ............................................................................... 37 8.3.1 Summary ....................................................................................... 37 8.3.2 Geomorphic Setting and Deposit Characteristics .......................... 38 8.3.3 Gold Provenance Discussion ......................................................... 39 9. MINERALIZATION ............................................................................................ 40

Page 10. EXPLORATION ................................................................................................... 45 10.1 General ....................................................................................................... 45 10.2 2006-2007 Exploration Programs ............................................................... 45 10.2.1 Phase I Exploration Program (2006) ............................................. 46 10.2.1.1 Stream Sediment Sampling ......................................... 46 10.2.1.2 Soil Geochemical Sampling ....................................... 46 10.2.1.3 Rock and Historical Adit Sampling ............................ 47 10.2.2 Phase II Exploration Program (2007) ............................................ 48 10.3 2008-2010 Exploration Programs................................................................ 50 10.3.1 Soil Geochemistry ......................................................................... 51 10.3.2 Ground Geophysics ....................................................................... 53 10.3.3 Prospecting .................................................................................... 58 10.3.4 Trenching ..................................................................................... 58 10.3.4.1 Zone 2 Trenching ........................................................ 59 10.3.4.2 Zone 3 Trenching ........................................................ 60 11. DRILLING ............................................................................................................. 61 11.1 General ....................................................................................................... 61 11.2 Drill Programs ............................................................................................ 61 11.3 Drilling Methodology ................................................................................. 63 11.4 Drilling Results ........................................................................................... 63 11.4.1 General .......................................................................................... 63 11.4.2 Drilling Results – Zone 2 – Kibi Project ....................................... 64 11.4.2.1 Trench TKB005 Zone ................................................. 64 11.4.2.2 Trench TKB004 Zone ................................................. 67 11.4.2.3 Trench TKB006 Zone ................................................. 68 11.4.2.4 Trench TKB014E-14F Zone ....................................... 69 11.4.2.5 Trench TKB010 Zone ................................................. 70 11.4.3 Drilling Results – Zone 3 – Kibi Project ....................................... 75 11.4.3.1 Trench TAD019 Zone ................................................ 75 11.4.3.2 Trench TAD001-TAD004 Zone ................................. 76 11.4.4 Drilling Results – Zone 1 – Kibi Project ....................................... 79 12. SAMPLING APPROACH AND METHODOLOGY ........................................ 80 12.1 Control Grid Establishment ........................................................................ 80 12.2 Soil Sampling ............................................................................................. 80 12.3 Auger Sampling .......................................................................................... 80 12.4 Trench and Road Cut Sampling .................................................................. 80 12.5 Drill Core Sampling ................................................................................... 81 12.6 Reverse Circulation (“RC”) Drill Sampling ............................................... 82 12.7 Geological/Analytical Data Management .................................................. 83 13. SAMPLING PREPARATION, ANALYSES AND SECURITY ....................... 84 13.1 Sample Preparation and Analysis ............................................................... 84 13.1.1 ALS Chemex Sample Preparation and Analysis ........................... 84 13.2 Sample Security and Chain of Custody ...................................................... 88 14. DATA VERIFICATION ....................................................................................... 88 14.1 General ....................................................................................................... 88 14.2 Summary .................................................................................................... 89 14.2.1 Laboratory Standards .................................................................... 89 14.2.2 Client Standards ............................................................................ 89 14.2.3 Laboratory and Client Blanks ....................................................... 91

Page 14.2.4 Laboratory Duplicates and Check Repeats ................................... 92 14.2.5 Xtra-Gold Duplicates .................................................................... 92 14.2.6 Xtra-Gold Quarter Core Submission ............................................. 92 14.2.7 Coarse RC Chip Resubmission ..................................................... 93 14.2.8 Screen Fire Assay vs Fire Assay ................................................... 93 14.2.9 Splitting Error: Laboratory and Field ........................................... 94 14.3 Conclusions ................................................................................................ 94 14.4. Recommendations ...................................................................................... 95 15. ADJACENT PROPERTIES ................................................................................. 95 16. MINERAL PROCESSING AND METALLURGICAL TESTING ................. 97 17. MINERAL RESOURCE AND MINERAL RESERVE ESTIMATES ............ 97 18. OTHER RELEVANT DATA AND INFORMATION ....................................... 97 19. INTERPRETATION AND CONCLUSIONS ..................................................... 97 20. RECOMMENDATIONS ...................................................................................... 98 21. REFERENCES ...................................................................................................... 100 22. DATE AND SIGNATURE PAGE ....................................................................... 102

LIST OF FIGURES Page FIGURES Figure 1.1.A Location of Ghana ................................................................................. 1 Figure 1.1.B Regions of Ghana .................................................................................. 1 Figure 1.2 Location of Apapam Concession .......................................................... 2 Figure 1.3.2.A Xtra-Gold Concessions Located in the Kibi Gold Belt ......................... 4 Figure 1.3.2.B Location of Xtra-Gold Concessions ...................................................... 5 Figure 1.4.1 Four Main Birimian Gold Belts of Southern Ghana ............................. 6 Figure 4.7 Apapam Concession Boundary Coordinates ......................................... 14 Figure 4.8 Cadastre Map depicting Two Third Party Small Scale Mining within the Apapam Concession ............................................................. 15 Figure 4.9.1 Staking Application Area for Extension of the Existing Concession ... 16 Figure 5.1 Typical Landscape within the Kibi Project ........................................... 18 Figure 6.4.A Alluvial Gold Deposits – Kibi Gold Belt .............................................. 27 Figure 7.3.1 A Map Showing the Kibi Greenstone Belt Geology ............................. 31 Figure 7.3.2 Diagrammatic Summary of the Structural History and Timing of Xtra-Gold’s Kibi Project Mineralization in the Deformation Framework of Ghana ............................................................................. 34 Figure 9.A A Sample Indicating Altered Granitoid with Plagioclase Feldspar and Opaque Minerals Surrounded by Secondary Carbonate ................. 42 Figure 9.B Thin Section of Relatively Fresh Granite Indicating Equal Composition of K-Feldspar and Plagioclase ......................................... 42 Figure 9.C A Polished Section Showing Granodiorite Consisting of Corroded Sphalerite, Pyrrhotite and Pyrite ........................................................... 43 Figure 9.D Polished Section of Altered Granitoid Showing Relicts of Pyrrhotite, Sphene, Magnetite and Pyrite ............................................................... 43 Figure 9.E Hole KB08014 (115-130m): Quartz-albite-carbonate Vein Stockwork in Auriferous Quartz Diorite between Greywacke (GW) and Mafic Volcanic Rocks (MV). (photo by SRK Consulting) ................... 44 Figure 9.F Road cut exposing Auriferous Quartz-carbonate Vein Stockwork in Saprolitic Quartz Diorite (Zone 2 - trench TKB005 granitoid zone) .... 44 Figure 10.3.1 Soil Geochemistry Survey ..................................................................... 52 Figure 10.3.2.A Apparent Resistivity (z = 50 m)/Soil Geochemistry ............................. 55 Figure 10.3.2.B IP/Resistivity Interpretation - Compilation ........................................... 56 Figure 11.2 Borehole Trace/Zone Location Plan ..................................................... 62 Figure 11.4.2.A Zone 2 – 2008/2009 – Significant Drill Intercept Plan ......................... 65 Figure 11.4.2.B Zone 2 – 2008/2009 –Drill Intercepts – Surface Geology .................... 66 Figure 12.4 Channel Sampling in Trench at Apapam Concession ........................... 81 Figure 13.1.1.A Standard Sample Analysis Flow Chart (Fire Assay with 0.01 ppm Au detection limit) ..................................... 85 Figure 13.1.1.B Screen Fire Assay Standard Sample Analysis Flow Sheet ................... 86

LIST OF TABLES Page TABLES Table 1 Significant Trench Intercepts – Apapam Concession ........................... 49 Table 2 Significant Trench Intercepts – Kibi Project (2008-2009) .................... 60 Table 3 Significant Drill Intercepts - Kibi Project – Zone 2 and Zone 1 Diamond Core Holes KBD08001 to KBD08018 and Reverse Circulation Holes KBRC09042 to KBRC09068 ..................... 71 Table 4 Significant Drill Intercepts - Kibi Project – Zone 3 Reverse Circulation Holes KBRC09019 to KBRC09041 ..................... 77 Table 5 Summary Results: Precision and Accuracy Laboratory and Client Standards ............................................................................. 91 Table 6 Summary Statistics: Duplicates, Check Repeats, Quartered Core, Screen Fire Assay vs Fire Assay and Resubmitted Samples ................. 93

LIST OF APPENDICES Page APPENDICES Appendix 1 Apapam Mining Lease .......................................................................... 104 Appendix 2 Supporting Staking Application Documentation for the Apapam ML Extension .............................................................. 134 Appendix 3 Supporting Staking Application Documentation for the Akim-Apapam Concession ........................................................ 136 Appendix 4 Drill Hole Strip Logs (Holes KBD08004 to KBD08018 and Holes KBRC09019 to KBRC09068) .................................................... 162 Appendix 5 QA-QC Report entitled “Quality Control of Assay Results Related to Exploration Activities During the Period 2008 and 2008 with Specific Emphasis on Diamond Core and Reverse Circulation Drilling” ................................................................................................ 232

LIST OF ABBREVIATED TERMS “amsl” above mean sea level “Au” gold “Az” azimuth “BP” before present “cm” centimetres “cu” cubic “°” degree “DD” diamond drilling “DGPS” differential global positioning system “g” or “gm” gram “Ga” billion of years ago “GHS” new Ghana cedis currency “g/m3” grams per cubic metre “GPS” global positioning system “g/t” grams per tonne “ha” hectare “kg” kilogram “km” kilometre “m” metre “m3” cubic metres “Ma” millions of years ago “ml” millilitre “mm” millimetre “oz” ounce “ppb” parts per billion “ppm” parts per million “RC” reverse circulation “RQD” rock quality designation “sq” square “sq km” square kilometres “UTM” Universal Transverse Mercator “WGS 84” World Geodetic Survey 1984 “yd3” cubic yards

CONVERSION FACTORS
Metric Unit = Imperial Measure Imperial Measure = Metric Unit
LENGTH 1 millimetre (mm) 0.03937 inches (in) 1 inch (in) 25.40 millimetres (mm)
1 centimetre (cm) 0.394 inches (in) 1 inch (in) 2.540 centimetres (cm)
1 metre (m) 3.281 feet (ft) 1 foot (ft) 0.3048 metres (m)
1 kilometre (km) 0.6214 mile (mi) 1 mile (mi) 1.609 kilometres (km)
AREA 1 sq centimetre (cm2) 0.1550 sq inches (in2) 1 sq inch (in2) 6.452 sq centimetres (cm2)
1 sq metre (m2) 10.76 feet (ft2) 1 foot (ft) 0.0929 sq metres (m2)
1 hectare (ha) (10,000 m2) 2.471 acres 1 acre 0.4047 hectare (ha)
1 hectare (ha) 0.003861 sq miles (mi2) 1 sq mile (mi2) 640 acres
1 hectare (ha) 0.01 sq kilometres (km2) 1 sq mile (mi2) 259.0 hectares (ha)
1 sq kilometre (km2) 0.3861 sq miles (mi2) 1 sq mile (mi2) 2.590 sq kilometres (km2)
VOLUME
1 cu centimetre (cc) 0.06102 cu inches (in3) 1 cu inch (in3) 16.39 cu centimetres (cm3)
1 cu metre (m3) 1.308 cu yards (yd3) 1 cu yard (yd3) 0.7646 cu metres (m3)
1 cu metre (m3) 35.310 cu feet (ft3) 1 cu foot (ft3) 0.02832 cu metres (m3)
1 litre (l) 0.2642 gallons (gal) (U.S.) 1 gallon (gal) (U.S.) 3.785 litres (l)
1 litre (1) 0.2200 gallons (gal) (U.K.) 1 gallon (gal) (U.K.) 4.546 litres (l)
WEIGHT 1 gram (g) 0.03215 troy ounce (20 dwt) 1 troy ounce (oz) 31.1034 grams (g)
1 gram (g) 0.6430 pennyweight (dwt) 1 pennyweight (dwt) 1.555 grams (g)
1 gram (g) 0.03527 oz avoirdupois 1 oz avoirdupois 28.35 grams (g)
1 kilogram (kg) 2.205 lb avoirdupois 1 lb avoirdupois 0.4535 kilograms (kg)
1 tonne (t) (metric) 1.102 tons (T) (short ton) 1 ton (T) (short ton) (2,000 lb) 0.9072 tonnes (t)
1 tonne (t) 0.9842 long ton 1 long ton (2,240 lb) 1.016 tonnes (t)
MISCELLANEOUS 1 cm/second 0.01967 ft/min 1 ft/min 50.81 cm/second
1 cu m/second 22.82 million gal/day 1 million gal/day 0.04382 m3/second
1 cu m/minute 264.2 gal/min 1 gal/min 0.003785 m3/second
1 g/cu m 62.43 lb/cu ft 1 lb/cu ft3 0.01602 g/m3
1 g/cu m 0.02458 oz/cu yd 1 oz/cu yd3 40.6817 g/m3
1 Pascal (Pa) 0.000145 psi 1 psi 6,895 Pascal
1 gram/tonne (g/t) 0.029216 troy ounce/short ton (oz/T) 1 troy ounce/short ton (oz/T) 34.2857 grams/tonne (g/t)
1 g/t 0.583 dwt/short ton 1 dwt/short ton 1.714 g/t
1 g/t 0.653 dwt/long ton 1 dwt/long ton 1.531 g/t
1 g/t 0.0001%
1 g/t 1 part per million (ppm)
1% 10,000 part per million (ppm)
1 part per million (ppm) 1,000 part per billion (ppb)
1 part per billion (ppb) 0.001 part per million (ppm)

XTRA-GOLD RESOURCES CORP. KIBI PROJECT NATIONAL INSTRUMENT 43-101 TECHNICAL REPORT 1
SEMS EXPLORATION SERVICES LTD. JULY 12, 2010
1. Summary 1.1 Overview of the Republic of Ghana The Republic of Ghana (“Ghana”), formerly known as the Gold Coast, is located in West Africa on the Gulf of Guinea (Figure 1.1.A) and shares borders with Côte d'Ivoire to the west, Togo to the east and Burkina Faso (Burkina, formerly Upper Volta) to the north. To the south are the Gulf of Guinea and the Atlantic Ocean. Ghana has a total land area of approximately 239,540 square kilometres (“sq km”) or (approximately 23,954,000 hectares (“ha”) and is about the size of Britain. Ghana’s capital city, Accra, is located along the south eastern coast. In March 1957, Ghana was the first country in sub-Saharan Africa to gain independence from Britain. Following a national referendum in July 1960, Ghana became a republic. Ghana has a population of approximately 24 million people, most of whom are English-speaking. Ghana is comprised of 10 regions as depicted in Figure 1.1.B. The regions are subdivided into 138 districts.
Figure 1.1.A: Location of Ghana Figure 1.1.B: Regions of Ghana
XTRA-GOLD RESOURCES CORP. KIBI PROJECT NATIONAL INSTRUMENT 43-101 TECHNICAL REPORT 2
SEMS EXPLORATION SERVICES LTD. JULY 12, 2010
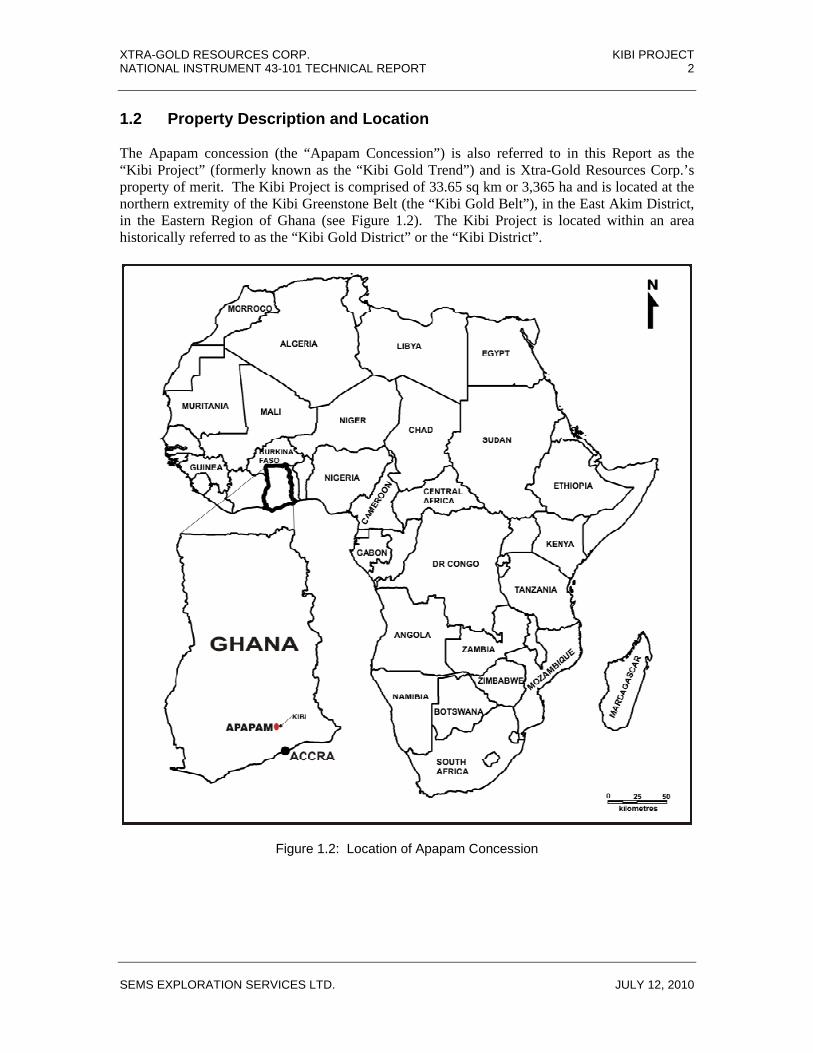
1.2 Property Description and Location The Apapam concession (the “Apapam Concession”) is also referred to in this Report as the “Kibi Project” (formerly known as the “Kibi Gold Trend”) and is Xtra-Gold Resources Corp.’s property of merit. The Kibi Project is comprised of 33.65 sq km or 3,365 ha and is located at the northern extremity of the Kibi Greenstone Belt (the “Kibi Gold Belt”), in the East Akim District, in the Eastern Region of Ghana (see Figure 1.2). The Kibi Project is located within an area historically referred to as the “Kibi Gold District” or the “Kibi District”.
Figure 1.2: Location of Apapam Concession

XTRA-GOLD RESOURCES CORP. KIBI PROJECT NATIONAL INSTRUMENT 43-101 TECHNICAL REPORT 3
SEMS EXPLORATION SERVICES LTD. JULY 12, 2010
1.3 Ownership 1.3.1 The Apapam Concession The Kibi Project is owned by Xtra-Gold Resources Corp. (“Xtra-Gold”), a Nevada,
U.S.A. corporation through its Ghanaian subsidiary, Xtra-Gold Mining Limited (“XG Mining”) pursuant to the registration of a mining lease on the Apapam Concession (the “Apapam ML”) (see Appendix 1). XG Mining is controlled by Xtra-Gold, as to a 90% interest. The remaining 10% interest is held by the Government of Ghana. Pursuant to the Minerals and Mining Act, 2006 (Act 703) (the “Mining Act”), the Government of Ghana acquires a 10% free carried interest in all mining leases by way of 10% share ownership in all Ghanaian corporations who hold mining leases.
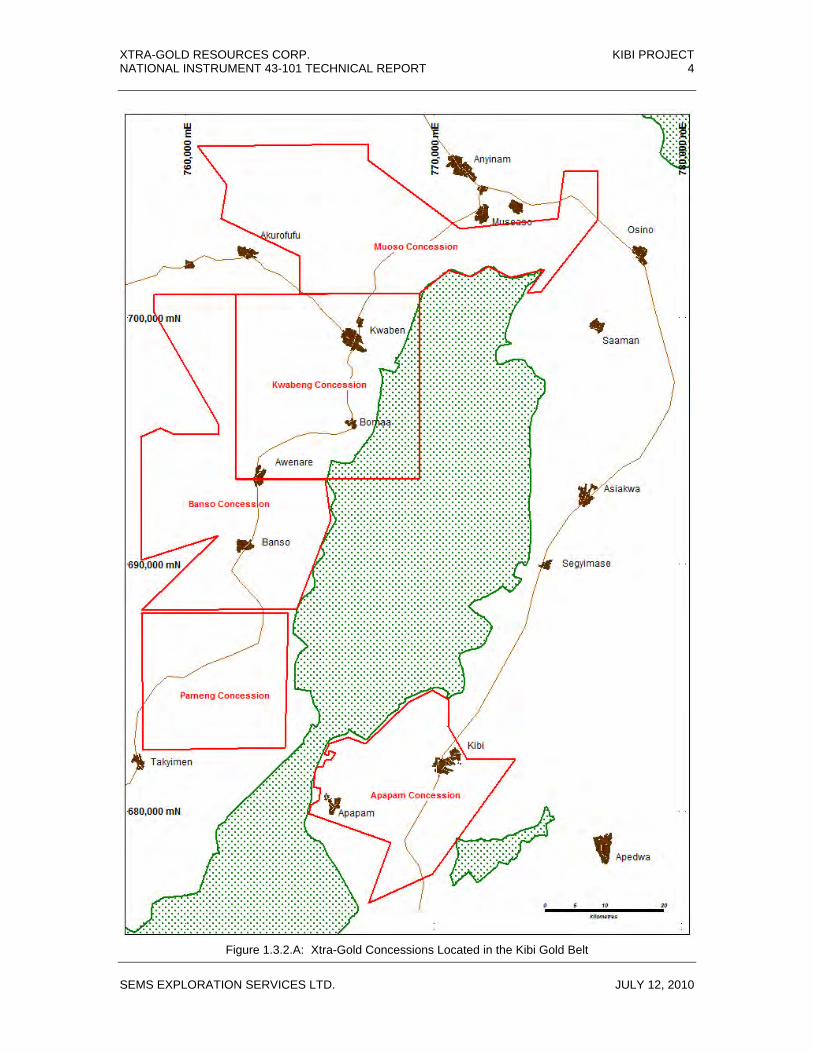
1.3.2 Other Properties Xtra-Gold holds another four (4) concessions that are contiguous (Figure 1.3.2.A) and are
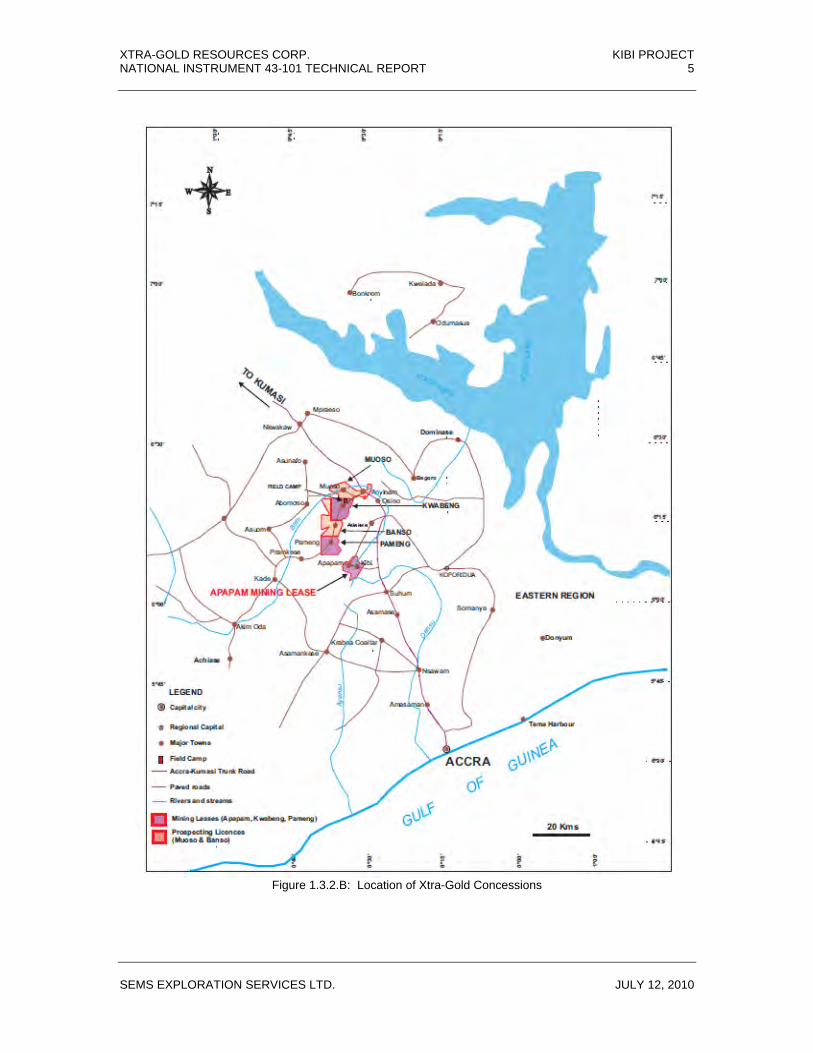
located in the Kibi Gold Belt along the northern (Muoso Concession) and south western (Kwabeng, Banso and Pameng Concessions) flanks of the Atewa Range, for a total land position in the Kibi Gold Belt of approximately 226 sq km (22,600 ha). The Apapam Concession (southernmost of Xtra-Gold’s concessions) and Xtra-Gold’s other Kibi Gold Belt concessions are depicted in Figure 1.3.2.B.
XTRA-GOLD RESOURCES CORP. KIBI PROJECT NATIONAL INSTRUMENT 43-101 TECHNICAL REPORT 4
SEMS EXPLORATION SERVICES LTD. JULY 12, 2010
Figure 1.3.2.A: Xtra-Gold Concessions Located in the Kibi Gold Belt
XTRA-GOLD RESOURCES CORP. KIBI PROJECT NATIONAL INSTRUMENT 43-101 TECHNICAL REPORT 5
SEMS EXPLORATION SERVICES LTD. JULY 12, 2010
Figure 1.3.2.B: Location of Xtra-Gold Concessions

XTRA-GOLD RESOURCES CORP. KIBI PROJECT NATIONAL INSTRUMENT 43-101 TECHNICAL REPORT 6
SEMS EXPLORATION SERVICES LTD. JULY 12, 2010
1.4 Geology 1.4.1 Regional Geology of Ghana The regional geology of southern Ghana is comprised of thick sequences of steeply
dipping metasediments, alternating with metavolcanic units of Proterozoic age (~2.2-2.3 Ga). These sequences, which belong to the Birimian Supergroup, extended approximately 200 kilometres (“km”) along strike, in a number of northeasterly trending belts. The four (4) main gold belts in Ghana (see Figure 1.4.1) are:
● Kibi Belt ● Ashanti Belt ● Asankrangwa Belt ● Sefwi Belt
Figure 1.4.1: Four Main Birimian Gold Belts of Southern Ghana
XTRA-GOLD RESOURCES CORP. KIBI PROJECT NATIONAL INSTRUMENT 43-101 TECHNICAL REPORT 7
SEMS EXPLORATION SERVICES LTD. JULY 12, 2010
Syn- and post-tectonic granitoids intruded both the metasediments and metavolcanics of the Birimian Supergroup as a result of the Eburnean Orogeny. The granitoids can be broadly grouped into two types; namely Basin and Belt types. Basin granitoids intrude the metasedimentary basin whereas Belt type intrudes the volcanic and volcanosedimentary assemblages.
1.4.2 Property Geology Underlying the Apapam Concession are steeply dipping, isoclinally folded and sheared
Birimian Supergroup metamorphosed sediments and volcanics of Precambrian Age. The Kibi Gold District is dominated by the prominent Atewa Range (also referred to herein as the “Range”) and has been known as an area with large alluvial gold resources, which have been mined extensively by local inhabitants for many generations.
1.5 Mineralization To date, the mineralization is mainly observed and hosted within the granitoid rocks being in quartz stockwork. There are several similarities between the Kibi Project mineralization type and known gold deposits of the granitoid hosted-type, i.e. the Central Ashanti Gold Project, formerly known as the Ayanfuri deposit (Perseus Mining Limited), and the Ayankyerim and Nhyiaso deposits (AngloGold Ashanti Ltd.) located within the adjacent Ashanti Belt and the Subika deposit (Newmont Mining Limited) and the Chirano deposit (Red Back Mining Limited) located within the Sefwi Belt. 1.6 Exploration 1.6.1 Exploration Concept The Kibi Project is an intermediate stage exploration gold project located in the Kibi
Gold Belt, Ghana. Xtra-Gold’s goal is to define a Mineral Resource. 1.6.2 Status of Exploration Xtra-Gold carried out a Phase II drill program on the Kibi Project from July 14 to
September 26, 2009. The Phase II drill program encompassed 50 reverse circulation (“RC”) holes for a total 4,715 linear metres.
1.7 Development 1.7.1 Status of Development As of the date of this Report, the Kibi Project is not in the development stage. 1.8 Operations 1.8.1 Status of Operations As of the date of this Report, there are no mining operations being conducted at the Kibi
Project.

XTRA-GOLD RESOURCES CORP. KIBI PROJECT NATIONAL INSTRUMENT 43-101 TECHNICAL REPORT 8
SEMS EXPLORATION SERVICES LTD. JULY 12, 2010
1.9 Conclusions and Recommendations 1.9.1 Conclusions SEMS Exploration Services Ltd. (“SEMS”) is of the opinion that Xtra-Gold has taken the
appropriate steps to explore for gold mineralization in the Apapam Concession using best exploration practices. In reviewing all of the data and information provided by Xtra-Gold, SEMS has concluded that the granitoids and associated metasediments and/or metavolcanics of the Kibi Project have the potential to host several economic mineral deposits.
1.9.2 Recommendations To advance the Kibi Project, SEMS has made the following recommendations: Phase 1 Scope of Work Estimated Cost (US$) ● infill trenching in between the known granitoid bodies 100,000 ● additional drilling (i) to clearly define and establish
the continuity and shape of granitoid hosted gold mineralization; and (ii) to expand the strike length of known mineralization 850,000
● structural work to ascertain the controls on mineralization and to assist with the planning of further drill programs 25,000
● detailed surface mapping of the mineralized trend 25,000
Total Estimated Phase 1 Budget 1,000,000
The following Phase 2 work is not contingent upon the results of the Phase 1 work. Phase 2 Scope of Work Estimated Cost (US$) ● definition drilling (i) to prove a Mineral Resource; and
(ii) to extend the strike length of known mineralization 2,500,000 ● metallurgical work on mineralized material 100,000 ● VTEM airborne survey 100,000
Total Estimated Phase 2 Budget 2,700,000
The following Phase 3 work is contingent upon the results of the Phase 2 work.
Phase 3 Scope of Work Estimated Cost (US$) ● further definition drilling (i) to prove a Mineral
Resource; and (ii) to extend the strike length of known mineralization 2,500,000
Total Estimated Phase 3 Budget 2,500,000
XTRA-GOLD RESOURCES CORP. KIBI PROJECT NATIONAL INSTRUMENT 43-101 TECHNICAL REPORT 9
SEMS EXPLORATION SERVICES LTD. JULY 12, 2010
2. Introduction 2.1 Introduction On February 18, 2010, Xtra-Gold commissioned SEMS Exploration Services Ltd. (“SEMS”) to prepare an independent technical report (the “Report”) consistent with the Canadian Securities Administrators National Instrument 43-101 and Form 43-101F1 for the Apapam Concession. SEMS is an independent West African based firm of consulting geologists, engineers and surveyors that provides full service mineral exploration and mining consulting services. SEMS’ head office is located in Accra, Ghana at 17 Orphan Crescent, North Labone, Accra. SEMS has other offices in Burkina Faso and Côte d’lvoire. The e-mail address is [email protected] and the website is www.sems-exploration.com. SEMS offer a wide range of technical services and has demonstrated a track record undertaking independent assessments of mineral exploration, project evaluations and audits, technical reports and independent feasibility evaluations to bankable standards on behalf of exploration and mining companies and financial institutions mainly in West Africa. SEMS has also worked with a number of major mining companies and their projects, providing mining industry consultancy service inputs. Xtra-Gold was incorporated in the State of Nevada, USA on September 1, 1998 and maintains a corporate/administrative office located in Toronto, Ontario at 360 Bay Street, Suite 301, Toronto, Ontario, Canada, M5H 2V6. Xtra-Gold has the following subsidiaries: ● Xtra-Gold Mining Limited (“XG Mining”) - XG Mining, under the name of its
corporate predecessor, Goldenrae Mining Company Limited (“Goldenrae”), was incorporated in Ghana on June 7, 1989. In February 2004, Xtra-Gold acquired the Apapam Concession, one of the Goldenrae assets, through the purchase of the Goldenrae shares from the trustees of the note and debenture holders of the Canadian parent company, Akrokerri-Ashanti Gold Mines Inc. (“AAGM”) who had acquired Goldenrae from the European banks after Goldenrae ceased operations. The acquisition of the 90% controlling interest in Goldenrae by XG Mining was approved by the Bank of Ghana in December 2005. The remaining 10% interest in XG Mining is held by the Government of Ghana. The name change from Goldenrae Mining Company Limited to Xtra-Gold Mining Limited was approved by special resolution in a Certificate of Incorporation of the Company issued by the Registrar of Companies of Ghana on January 13, 2006. XG Mining maintains technical and administrative offices at its field camp (the “Field Camp”) located at 2 Masalakye Street, in the town of Kwabeng, Ghana. XG Mining holds three (3) mining leases; namely the Kwabeng mining lease, the Pameng mining lease and the Apapam ML (covering the Kwabeng Concession, the Pameng Concession and the Apapam Concession, respectively).

XTRA-GOLD RESOURCES CORP. KIBI PROJECT NATIONAL INSTRUMENT 43-101 TECHNICAL REPORT 10
SEMS EXPLORATION SERVICES LTD. JULY 12, 2010
● Xtra-Gold Exploration Limited (“XGEL”) - This is also a Ghanaian corporation owned by Xtra-Gold as to 100% which was acquired on February 16, 2004. XGEL holds one (1) exploration license covering the Muoso Concession and the Banso Concession).
2.2 Qualification of SEMS The SEMS Group comprises professionals, offering expertise in a wide range of exploration and engineering disciplines. The ownership of SEMS rests solely with its staff and its independence is ensured by the fact that it holds no equity in any project. SEMS is qualified to provide its clients with conflict-free and objective recommendations. SEMS has demonstrated a track record of undertaking independent assessments of mineral exploration, project evaluations and audits, technical reports and independent feasibility evaluations in West Africa. The independent technical report of Xtra-Gold presented herein was compiled by Simon Meadows Smith, Joe Amanor and Fred Nimoh. By virtue of their education, relevant work experience and affiliation to recognized professional associations, Simon Meadows Smith, Joe Amanor and Fred Nimoh are independent Qualified Persons as defined by National Instrument 43-101. Simon Meadows Smith is the Managing Director of SEMS and a key member of the geological consultancy staff. He is a “Qualified” person from Britain and has over 20 years’ working experience in the Achaean Terrains of Western Australia and the Proterozoic Terrains of West Africa. He has been working for SEMS since its inception in 2002. Joe Amanor is a consulting geologist with extensive experience in the surface and underground exploration, as well as Mineral Resource evaluation. Fred Nimoh is a resource geologist with more than 15 years of mining and consulting experience. 2.3 Purpose of the Report This Report is prepared to act as an accurate and current technical summary of the geology and gold potential of the Apapam Concession. 2.4 Scope of Work The scope of work, involves the preparation/compilation of an independent evaluation and accompanying technical report in compliance with National Instrument 43-101 guidelines including the review and auditing of 2008-2009 QA/QC procedures for drilling and sampling. The evaluation of the Kibi Project is a collaborative effort between personnel of Xtra-Gold and SEMS. The work conducted involved a visit to the Kibi Project and relevant sites pertaining to the evaluation of the Kibi Project.

XTRA-GOLD RESOURCES CORP. KIBI PROJECT NATIONAL INSTRUMENT 43-101 TECHNICAL REPORT 11
SEMS EXPLORATION SERVICES LTD. JULY 12, 2010
2.5 Sources of Information and Data Primarily, the Report is based on data obtained from Xtra-Gold and on SEMS’ geological expertise. SEMS reviewed all of the available historical exploration work conducted on the Apapam Concession. Data verification and quality assurance program were undertaken and completed by SEMS. The information contained in this Report is based on information believed to be reliable. SEMS compiled the Report in Accra, Ghana during June 2010. 2.6 Site Visit SEMS Exploration personnel, including Simon Meadows Smith, Managing Director, and geologists Joe Amanor and David Salem, initially visited the Kibi Project on the Apapam Concession on August 28, 2008, as part of a general project overview in preparation for SEMS providing drill core logging support to Xtra-Gold. Drill core was examined, and several trenches and core borehole collars were visited during this visit. David Salem undertook the geological logging of the Kibi Project drill core from September to November 2008, and Joe Amanor conducted several supervisory technical visits during this same time period. In addition, from August to October 2009, a SEMS survey team established a benchmark system along the Kibi Project area, and surveyed-in every core and RC borehole collar. In accordance with the National Instrument 43-101 guidelines, Fred Nimoh of SEMS conducted a site visit of the Kibi Project on the Apapam Concession from March 10 to 12, 2010 to audit the exploration work completed by Xtra-Gold since the last independent data verification program in December 2007. Fred Nimoh was accompanied by Joe Amanor (March 10 only), and Yves Clement and Ambrose Amoako of Xtra-Gold. The purpose of the visit was to ascertain the geology of the Kibi Project and review and audit exploration work completed by Xtra-Gold since 2008. SEMS examined drill core and collected core duplicate samples for re-analysis at Xtra-Gold’s Kwabeng exploration camp, and visited outcrop exposures in different portions of the Kibi Project where Xtra-Gold excavated trenches or drilled core and RC boreholes. SEMS was able to witness several trenching areas and core and RC borehole collars. 3. Reliance on Other Experts SEMS’ opinion contained herein is effective as of June 25, 2010 and, throughout the course of its investigation, is based on the information provided by Xtra-Gold. The information reflected on various technical and economic conditions at the time of writing this Report. Given the nature of the mining business, conditions can significantly change over relatively short periods of time. Consequently, actual results may be significantly more or less favourable and the disclosure represents no legal opinion of the authors. With respect to disclosure of information relating to socio–political, environment and other related issues, the author has relied on information obtained by SEMS from public sources.

XTRA-GOLD RESOURCES CORP. KIBI PROJECT NATIONAL INSTRUMENT 43-101 TECHNICAL REPORT 12
SEMS EXPLORATION SERVICES LTD. JULY 12, 2010
SEMS has no affiliation with nor is SEMS an insider or associate of Xtra-Gold in connection with the Kibi Project. SEM’s results of evaluation and any opinion or conclusion made by SEMS was not dependent upon any prior agreements or any undisclosed understandings concerning any future business dealings with Xtra-Gold. SEMS conducted a legal search with respect to the Apapam ML covering the Apapam Concession and confirmed that Xtra-Gold is the legal registered holder of the Apapam ML. 4. Property Description and Location 4.1 Property Area The Apapam Concession is comprised of 33.65 sq km or 3,365 ha. The irregularly shaped Apapam Concession extends to a maximum of approximately 8.6 km in a northeast direction by 8.2 km in a northwest direction. The Kibi Project land position also encompasses two (2) land staking applications, including a reconnaissance license covering a 7.0 sq km (700 ha) parcel of land contiguous to the southwest extremity of the Apapam Concession (i.e. Akim Apapam concession), and an approximately 1.42 sq km (142 ha) ground extension along the northwest boundary of the concession (i.e. Apapam Mining Lease Extension). Refer to Section 4.9 for further details on the staking applications. 4.2 Location The Apapam Concession lies within the Kibi Gold Belt and is located in the East Akim District, in the Eastern Region of Ghana on the eastern flank of the Atewa Range along the headwaters of the Birim River approximately 75 km NNW of Accra (see Figures 1.2, 1.3.2.A and 1.3.2.B). 4.3 Types of Mineral Licenses There are three (3) types of mineral concession is Ghana that are granted and registered by the Government of Ghana; namely (i) reconnaissance licenses; and (ii) prospecting licenses, to carry out exploration work; and (iii) mining leases (the most advanced license). The interest in the Apapam Concession is secured by way of the Apapam ML granted to Xtra-Gold by the Government of Ghana and registered as No. LVB 5191/09 (see Appendix 1). 4.4 Title The registered holder of the Apapam ML is XG Mining, a Ghanaian corporation that is owned and controlled by Xtra-Gold, as to a 90% interest. The remaining 10% interest is held by the Government of Ghana. Pursuant to the Minerals and Mining Act, 2006 (Act 703) (the “Mining Act”), the Government of Ghana acquires a 10% free carried interest in all mining leases by way of 10% share ownership in all Ghanaian corporations who hold mining leases. The term of the Apapam ML is seven (7) years and expires on December 17, 2015 (the “Expiry Date”). The Apapam ML can be renewed for a further 30 year term in accordance with the Mining Act by XG Mining making application not less than six months prior to the Expiry Date.
XTRA-GOLD RESOURCES CORP. KIBI PROJECT NATIONAL INSTRUMENT 43-101 TECHNICAL REPORT 13
SEMS EXPLORATION SERVICES LTD. JULY 12, 2010
Pursuant to the terms and conditions of the Apapam ML, Xtra-Gold was granted surface and mining rights by the Government of Ghana to work, develop and produce gold in the mining lease area (including the processing, storing and transportation of ore and materials). In addition to the Apapam ML, the Kibi Project also encompasses two (2) land staking applications currently being processed by the Minerals Commission of Ghana (“Mincom”), including: (i) a reconnaissance license contiguous to the southwest extremity of the Kibi Project (the “Akim Apapam Concession”); and (ii) a ground extension along the northwest boundary of the Kibi Project (the “Apapam ML Extension”) (see Figure 4.9.1). 4.5 Surface Rights Pursuant to the Apapam ML, Xtra-Gold was granted the mineral surface rights and the rights below the surface of the Apapam Concession. 4.6 Obligations Pursuant to the Apapam ML, Xtra-Gold has the following work and financial obligations: 4.6.1 Work Obligations Xtra-Gold shall continuously operate in the Apapam Concession area in accordance with
good mining practices until the earlier of: (i) such time as the reserves or deposits may be exhausted or the mine can no longer be economically worked; or (ii) until the expiry of the Apapam ML Xtra-Gold shall conduct all of its operations with due diligence in a proper and workmanlike manner, observing sound technical and engineering principles using appropriate modern and effective equipment, machinery, materials and methods, with particular regard to the conservation of resources, reclamation of land and environmental protection generally.
4.6.2 Financial Obligations Xtra-Gold shall pay rent half-yearly in advance on or before the 1st day of January and
July 1st in each year of the Apapam ML at the rate of GHS20.00 (US$13.76) per sq km. 4.7 Concession Boundaries The Apapam Concession boundaries have not been legally surveyed, but are described by latitude and longitude via decree (Figure 4.7). The concession is approximately centred on UTM coordinates 769,100 East and 680,600 North (WGS 84 Zone 30N datum) or 0 degrees 34 minutes longitude west and 6 degrees 9 minutes latitude north.

XTRA-GOLD RESOURCES CORP. KIBI PROJECT NATIONAL INSTRUMENT 43-101 TECHNICAL REPORT 14
SEMS EXPLORATION SERVICES LTD. JULY 12, 2010
Figure 4.7: Apapam Concession Boundary Co-ordinates
4.8 Small Scale Mining Licenses The Apapam Concession covers a 33.65 sq km (3,365 ha) area with the exception of two (2) small scale mining (SSM) licenses, comprising approximately 0.1012 sq km (10.12 ha) located within the northwest portion of the concession (Figure 4.8) which were granted by Mincom prior to Xtra-Gold’s application for the mineral rights (the Apapam ML) to the concession. None of the in situ, lode gold mineralization occurrences described in this Report are located within and/or proximal to these third party SSM licenses, and there is no current knowledge of any lode gold occurrences being present on these parcels. No information is available on past and/or current alluvial gold mining activity on these SSM licenses.

XTRA-GOLD RESOURCES CORP. KIBI PROJECT NATIONAL INSTRUMENT 43-101 TECHNICAL REPORT 15
SEMS EXPLORATION SERVICES LTD. JULY 12, 2010
Figure 4.8: Cadastre Map depicting Two Third Party Small Scale Mining within the Apapam Concession
4.9 Staking Applications
4.9.1 Apapam Mining Lease Extension Application The Kibi Project land position includes a staking application for an extension to the
Apapam ML along the northwest boundary of the Apapam Concession (Figure 4.9.1). The approximately 1.42 sq km (142 ha) parcel of crown land was staked to cover certain trench and drill gold intercepts along the northern margin of the Zone 3 gold-in-soil anomaly, which presently lie outside the boundaries of the Apapam Concession. See Section 11.4.3.2 (Trench TAD001-TAD004 Zone) for further details regarding the trench and drill results.
The staking application was submitted to Mincom by XG Mining on November 19, 2009,
after a professional land survey commissioned by the company delineated the wedge of open ground lying between the Apapam ML boundary and the Atewa Forest Reserve boundary. In accordance with Ghana government regulations, the staking application includes a 100 m buffer zone along the Forest Reserve boundary.
As at the date of this Report, the staking application is still being processed by the
Government of Ghana, and there is no assurance that XG Mining will ever receive legal title to this ground. Supporting staking application documentation for the Apapam ML Extension is presented in Appendix 2.
XTRA-GOLD RESOURCES CORP. KIBI PROJECT NATIONAL INSTRUMENT 43-101 TECHNICAL REPORT 16
SEMS EXPLORATION SERVICES LTD. JULY 12, 2010
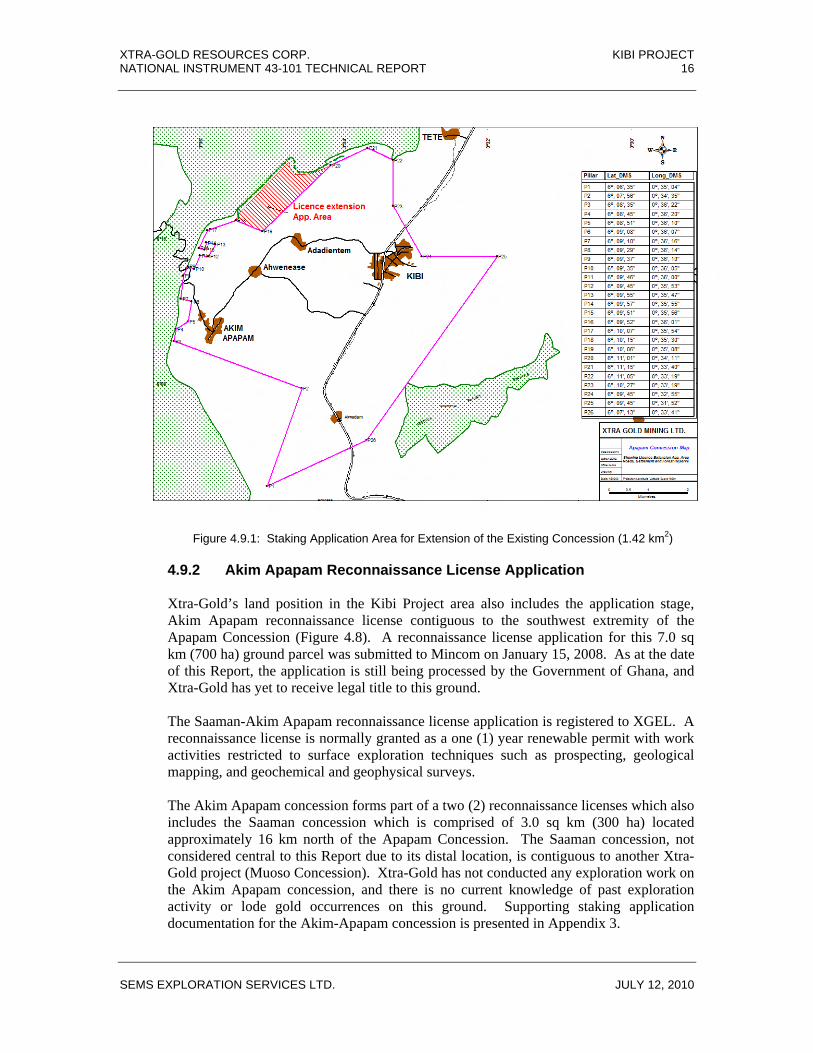
Figure 4.9.1: Staking Application Area for Extension of the Existing Concession (1.42 km2)
4.9.2 Akim Apapam Reconnaissance License Application Xtra-Gold’s land position in the Kibi Project area also includes the application stage,
Akim Apapam reconnaissance license contiguous to the southwest extremity of the Apapam Concession (Figure 4.8). A reconnaissance license application for this 7.0 sq km (700 ha) ground parcel was submitted to Mincom on January 15, 2008. As at the date of this Report, the application is still being processed by the Government of Ghana, and Xtra-Gold has yet to receive legal title to this ground.
The Saaman-Akim Apapam reconnaissance license application is registered to XGEL. A
reconnaissance license is normally granted as a one (1) year renewable permit with work activities restricted to surface exploration techniques such as prospecting, geological mapping, and geochemical and geophysical surveys.
The Akim Apapam concession forms part of a two (2) reconnaissance licenses which also
includes the Saaman concession which is comprised of 3.0 sq km (300 ha) located approximately 16 km north of the Apapam Concession. The Saaman concession, not considered central to this Report due to its distal location, is contiguous to another Xtra-Gold project (Muoso Concession). Xtra-Gold has not conducted any exploration work on the Akim Apapam concession, and there is no current knowledge of past exploration activity or lode gold occurrences on this ground. Supporting staking application documentation for the Akim-Apapam concession is presented in Appendix 3.

XTRA-GOLD RESOURCES CORP. KIBI PROJECT NATIONAL INSTRUMENT 43-101 TECHNICAL REPORT 17
SEMS EXPLORATION SERVICES LTD. JULY 12, 2010
4.10 Other Properties As previously mentioned in Section 1.3.2., Xtra-Gold holds another four (4) concessions that are contiguous (Figure 1.3.2.A) and are located in the Kibi Gold Belt along the northern (Muoso Concession) and the southwestern (Kwabeng, Banso and Pameng Concessions) flanks of the Atewa Range, for a total land position of approximately 226 sq km (22,600 ha). 4.11 Location of Known Mineralized Zones, Mineral Resources, Mineral Reserves, Mine Workings and Important Natural Features Except for alluvial mining being carried out by several local Ghanaians, there are no known mineralized zones, mineral resources, mineral reserves, mine workings or important natural features that occur within the boundaries of the Apapam Concession. 4.12 Royalties, Back-in Rights, Payments, Agreements and Encumbrances 4.12.1 Royalties Pursuant to the Mining Act, Xtra-Gold would be required to pay a royalty in the range of
3% to 6% to the Government of Ghana at the time of production from the Kibi Project. The current rate of royalty payments is 5%. The royalty shall be paid to the Government of Ghana based on the production for that quarter within 30 days from the end of the relevant quarter. A royalty shall be paid on all timber felled by Xtra-Gold in accordance with existing legislation.
4.12.2 Back-in Rights, Payments, Agreements and Encumbrances The Kibi Project is not subject to any back-in rights, payments or other agreements and
encumbrances. 4.13 Environmental Liabilities In accordance with the rules and regulations of the Environmental Protection Agency (“EPA”) of Ghana, the open trenches excavated by Xtra-Gold, to ascertain the continuity of underlying lithological units and the possible significance of gold mineralization, must be backfilled after sampling. Xtra-Gold has adopted a program of backfilling all excavations once sampled however, some trenches have been preserved for ongoing geological purposes and must be flagged. In addition to the trenches excavated by Xtra-Gold, diamond and reverse circulation drilling have resulted in a minimal environmental impact or deforestation. 4.14 Permits An annual environmental permit must be issued by the EPA in order to carry out exploration or mining activities. Xtra-Gold has been granted an environmental permit to carry out its exploration activities.

XTRA-GOLD RESOURCES CORP. KIBI PROJECT NATIONAL INSTRUMENT 43-101 TECHNICAL REPORT 18
SEMS EXPLORATION SERVICES LTD. JULY 12, 2010
5. Accessibility, Climate, Local Resources, Infrastructure and Physiography 5.1 Topography, Elevation and Vegetation Topography is characterized by steep sloping ridges and undulating mountains. The Apapam Concession is dominated by the prominent, NNE trending Atewa Range that is about 50 km long and 10-15 km wide. The steep flanks feature a wide variety of high canopy tropical hardwoods typical of southwestern Ghana whereas the summit has a diverse flora, including extensive hanging vines. Relief in most parts of the Apapam Concession is quite modest (10-30 m) but changes abruptly at the base of the steep-sided flanks of the Atewa Range. The maximum elevation on the Range is about 780 m AMSL and stands well above the surrounding lowlands, which are at approximately 180-200 m ASL (Figure 5.1). The Birim River has its headwaters in the Atewa Range and is one of the sources of water for the local villagers. Vegetation on the Apapam Concession consists of low, thick bush and open canopy, deciduous trees with occasional zones of moderately dense primary and secondary forest.
Figure 5.1: Typical Landscape within the Kibi Project
XTRA-GOLD RESOURCES CORP. KIBI PROJECT NATIONAL INSTRUMENT 43-101 TECHNICAL REPORT 19
SEMS EXPLORATION SERVICES LTD. JULY 12, 2010
5.2 Accessibility Two asphalted secondary highways provide access to the Kibi Project. Access to the Kibi Project is by driving northwest from Accra on the paved Accra-Kumasi Trunk Road which is the main national highway for approximately 75 km until the town of Kibi. A tarred road emanating from the Accra-Kumasi Trunk Road approximately 15 km northeast of Kibi dissects the north-central and south-eastern portions of the Kibi Project, while the tarred road servicing the town of Apapam provides access to the south-western extremity of the project. Xtra-Gold constructed a number of roads to provide access to the drill sites. 5.3 Proximity and Nature of Transport The Kibi Project is approximately 75 km NNW of Accra, the capital city of Ghana and approximately 20 km south-southeast from the Project Field Camp, owned and maintained by Xtra-Gold. Transportation to the Kibi Project is by vehicle, however 4 wheel drive vehicles are required to travel the system of drill access roads due to the steep topography. 5.4 Climate and Length of Operating Season The regional area experiences two (2) annual raining seasons (March to July and September to November). Annual rainfall is abundant with 1,500 to 2,000 millimeters (“mm”) for most of the area and 2,000+ mm in the summit area. Daytime temperatures peak in the range 30-35o Celsius and is usually 23-28o Celsius during the evening. The fieldwork operating season is all year long. 5.5 Surface Rights Pursuant to the Apapam ML, Xtra-Gold was granted the mineral surface rights and the rights below the surface of the Apapam Concession. 5.6 Local Resources Cocoa is the main local resource. Most of the inhabitants of the Apapam Concession area are subsistence farmers growing plantain, cassava and cocoyam. In addition, tomatoes, peppers and garden eggs are also cultivated. 5.7 Infrastructure Ghana has a fairly good network of paved highways and roads. Within the Apapam Concession, numerous tracks and paths are available for easy access to most areas of geological interest. Power is available in larger towns and cities. The electrical grid follows the main secondary roads and most of the major villages in the Kibi District have electrical power. When the national power grid is not available, generators are used for backup power. Telephone communications are fairly stable and mobile cellular phones are typically used outside of centralized areas of Ghana. The major towns (Kibi, Anyinam) have limited centralized pipe-born water supplies with most of the towns depending on wells and boreholes as well as nearby streams.

XTRA-GOLD RESOURCES CORP. KIBI PROJECT NATIONAL INSTRUMENT 43-101 TECHNICAL REPORT 20
SEMS EXPLORATION SERVICES LTD. JULY 12, 2010
The infrastructure in the Kibi District is fairly well developed. The town of Kibi is a major regional centre with a population of over 8,000. Kibi is connected to the national electricity supply network and hospital, postal and other community facilities are available. Extensive mining infrastructure is in place in all of the major gold producing areas of Ghana. 6. History 6.1 General History The Kibi Project is located at the northern extremity of the Kibi Gold Belt, in the East Akim District, in the Eastern Region of Ghana (see Figure 1.2). The Kibi Project is located within an area historically referred to as the “Kibi Gold District” or the “Kibi District”. The Kibi area is one of the oldest gold-producing camps in Ghana. Virtually all of the past gold mining activity has focused on alluvial (i.e. placer) gold occurrences in many river valleys throughout the Kibi area. In addition to detailing past exploration work and ownership of the concession, the following sections also summarize the alluvial gold mining and early lode gold prospecting history of the Kibi Gold Belt, and describes historic mine development work on lode gold prospects located on and around the Apapam Concession. 6.2 Alluvial Mining and Exploration History Long before Europeans arrived, the local villagers mined the Kibi area for generations using the traditional pitting methods to penetrate through 2 to 3 m of barren overburden into the underlying gravels. The Kibi District was very much coveted by the Ashantis in their rise to become a regional power over 200 years ago due to its known wealth in gold and it was one of their earliest conquests. Direct European interest in the Kibi Gold Belt started mainly in the frenzied but short-lived gold rush in 1898. The most famous of these areas was known as “Pusu Pusu”, a small village located at the base of the northeast flank of the Atewa Range, approximately 15 km northeast of the Apapam Concession. Junner (1935) reported that Europeans started alluvial mining operations in this area in 1903 and continued intermittently until 1930. This area was known for coarse nuggets of gold and recorded production from mining companies during the 1920s was more than 8,600 oz from about 390,000 yd3 with a recovered grade in the range 0.6 to 0.7 g/yd3 or about 0.8 to 0.9 g/m3. Two (2) dredges mined gold in the Birim River, in the Kibi District between 1904 and 1905, for total recorded production of 46.81 kg. The remains of one of these dredges still lie in the Birim River near Pano, just north of the Apapam Concession. Numerous gold reefs (i.e. veins) were reportedly discovered during the course of this early alluvial mining with the most noteworthy of these lode gold prospects being located on and/or in close proximity to Xtra-Gold land positions, including the Clearing Reef (Kibi Mine) and Hill Reef (Gold Mountain) lying at the north-central extremity of the Apapam Concession; the Kwabeng Mine located in Xtra-Gold’s Kwabeng Concession, approximately 15 km northwest of the Apapam Concession, along the western base of the Atewa Range; and the Tumfa Mine

XTRA-GOLD RESOURCES CORP. KIBI PROJECT NATIONAL INSTRUMENT 43-101 TECHNICAL REPORT 21
SEMS EXPLORATION SERVICES LTD. JULY 12, 2010
situated along the southwest margin of Xtra-Gold’s Banso Concession. Although these lode gold prospects were reportedly worked or subjected to underground development by London-based mining syndicates in the early 1900s, it is unclear if they ever reached actual commercial production as there are no known gold production figures available. See Sections 6.3.1 to 6.3.3 for summary descriptions of these historic lode gold prospects. The late 1980s saw an influx of foreign groups in the Kibi Gold Belt with their focus almost exclusively on alluvial gold mining. Goldenrae, XG Mining’s predecessor, started large scale alluvial operations in late 1990 at the Kwabeng gold deposit lying along the western base of the Atewa Range. This group was plagued by technical problems from the outset and once these were largely solved, the shareholders had severe financial problems and could no longer finance the operating losses until full production was achieved. The mining stopped at the end of 1993 after having recovered approximately 16,800 oz of alluvial gold (Griffis et al, 2002). The Kwabeng alluvial deposit was recently operated on a trial mining basis by XG Mining, from January 2007 to October 2008, with just over 8,800 fine oz of gold recovered from approximately 362,000 bank cubic metres of gravel. The general Apapam Concession area was first systematically explored in the late 1980s by WARDIG Plc (“WARDIG”) who held a large tract of land extending from Pawtroasi in the south-west to Sajumasi in the north-east, encompassing the present Apapam ML and the Akim Apapam reconnaissance license application areas. In 1987 to 1988, RTZ Consultants Limited (“RTZ Consultants”), on behalf of WARDIG, undertook preliminary exploration activities primarily designed to evaluate the alluvial gold potential but also included sampling of quartz veining in alluvial test pits and along roads, and a compilation of the historical data on the Kibi Mine (Clearing Reef) lode gold prospect. Results were generally encouraging however no follow up work was carried out (see Section 6.4 for work results). In 1991, EQ Resources carried out a successful alluvial pitting program in cooperation with Goldenrae over an 18 month period. In 1993, Goldenrae completed additional test pitting and an in-house study indicating an historic, non NI 43-101 compliant, resource of 3,717,000 cubic metres of gravel with a grade of 0.63 grams gold per cubic metre, equivalent to approximately 75,000 raw oz of gold. Goldenrae had the intention of setting up a satellite operation to its alluvial mine in neighbouring Kwabeng but the 1994 demise of its parent company left the project in limbo (see Section 6.5 for work results). In the late 1980s, most of the major valleys extending to the summit of the Atewa Range were subjected to geological mapping and stream geochemistry as part of a lateritic gold reconnaissance program conducted jointly by Sikaman Gold Resources and BHP Minerals Ghana Inc. This work was undertaken under a special permit issued by Mincom (see Section 7.2 for program results). In the mid-1990s, Ashanti Goldfields Company Limited (now AngloGold Ashanti Ltd.) held a reconnaissance license covering much of the area. They completed an airborne geophysical survey (magnetics and radiometrics) but apparently did very little follow-up work. In the late 1990s, Ashanti Goldfields set up an alluvial processing plant on the banks of the Birim River on the Midras Mining concession located immediately north of the Apapam Concession. The alluvial gold operation reportedly produced 7,510 oz in 1998 however the production dropped to 1,066 oz in 1999, and mining operations ceased in that year.

XTRA-GOLD RESOURCES CORP. KIBI PROJECT NATIONAL INSTRUMENT 43-101 TECHNICAL REPORT 22
SEMS EXPLORATION SERVICES LTD. JULY 12, 2010
6.3 Historic Lode Gold Prospect Development Historical records indicate the presence of at least three (3) lode gold prospects on the original Kyebi Land Corporation concession (circa 1901). Two (2) of the prospects, known as the Clearing Reef (Kibi Mine) and the Hill Reef, which underwent underground development work in the early 1900s, are located at the north-central extremity of Xtra-Gold’s Apapam Concession. The Kibi Mine is located in the northern part of the town of Kibi, while the Hill Reef lies on a 150 m high hill referred today by locals as “Gold Mountain”, located approximately 400 m northwest of the town. The Hill Reef structure appears to correspond to Xtra-Gold’s 2008 Zone 1 drill target. The location of a third vein referred to in a 1905 report is unknown. Xtra-Gold located what appears to be the main Kibi Mine shaft collar in the backyard of a family dwelling on the northern outskirts of Kibi town, within the extreme northeast portion of the Apapam Concession, approximately 200 m from the boundary. The Kibi Mine vein zone lies well within town limits, with extensive infrastructure located along the structure’s trend. The possible southwest extension of the Clearing Reef (Kibi Mine) structure within the forested, less populated area to the southeast of the town constitutes a more accessible exploration target. According to a Mincom report (1988a), the Akim Limited mining company obtained a lease on the adjoining Pano concession to cover the north-eastern extension of the Clearing Reef. A shaft located on the outskirts of the hamlet of Pano, approximately 1.5 km to the north of the Apapam Concession, on the neighbouring Midras Mining Limited concession, appears to correspond to the exploration efforts of Akim Limited on the north-eastern extension of the Clearing Reef. 6.3.1 Kibi Mine (Clearing Reef) The Clearing Reef structure was reportedly worked from 1925 to 1927 and 1936 to 1938,
by Akim Limited and Kyebi Land Corporation Limited, but it is unclear if the Kibi Mine ever reached actual commercial production as there are no known gold production figures available. Mine plans on file at Mincom (1988b) indicate the presence of 10 shafts (although some of these are believed to only be shallow test pits) and 19 trenches spread along an approximately 475 m distance along the trace of the Clearing Reef structure (the lateral extent of the vein at surface, as shown on one plan is only 274 m). The main shaft was sunk to a final depth of approximately 52 m, with drifting established on the 20 m, 36 m and 46 m levels.
The Birimian greywacke-hosted structure encompasses three (3) ENE-trending (070o/50
SE), auriferous quartz veins (or vein systems) ranging in width from a few centimetres to approximately 2 m, known as Main Reef; Middle Reefs; and South Reef. Gold grades for the 20 m level reportedly averaged 10.85 g/t, with higher grades being reported from the lowest level. According to an Akim Limited company report, a 60 m segment of one (1) vein, which was traced over a 305 m strike length, averaged 30 g/t gold over a 0.61 m vein width (Junner 1935, Kesse 1985, Minerals Commission 1988a, 1988b).
6.3.2 Hill Reef (Gold Mountain) Development work consisting of a shallow shaft (12 m) with limited drifting (45 m) was
undertaken by Kyebi Land Corporation Limited circa 1908 on Hill Reef, located on a 150 m high hill referred today by locals as “Gold Mountain”, approximately 400 m northwest

XTRA-GOLD RESOURCES CORP. KIBI PROJECT NATIONAL INSTRUMENT 43-101 TECHNICAL REPORT 23
SEMS EXPLORATION SERVICES LTD. JULY 12, 2010
of the town. Grades are reported to range from 2 g/t to 38 g/t gold over 0.15 m to 0.90 m vein widths (Minerals Commission, 1988a). The Hill Reef structure appears to correspond to Xtra-Gold’s 2008 Zone 1 drill target.
In addition, several hand-driven adits of unknown vintage, attaining up to 90 m in length,
are also present along the southern and western flanks of Gold Mountain. The purpose of these adits positioned at or just below the eluvium/lateritized bedrock interface is unknown however they appear to have been excavated in the search for quartz veins and/or to test the eluvial “gravels”.
6.3.3 Kwabeng Mine and Tumfa Mines The Kwabeng Mine, located on Xtra-Gold’s Kwabeng Concession, approximately 15 km
northwest of the Apapam Concession, along the west flank of the Atewa Range is described as follows in Gold Deposits of Ghana (R.J. Griffis, 2002).
Cogill (1904) reports “work done on a large quartz vein in the immediate vicinity of the
town of Kwabeng on the north western flank of the range at the beginning of the last century. At surface, the vein is quite massive and wide (up to about 7 to 8 m) and several shafts were sunk to test continuity and grade at depth. The vein strikes approximately ENE and dips 30 to 40o to the SE (Mining Yearbook, 1902-03 for Kwabeng Mines). The depth of the exploratory work was apparently at least 120 feet (37 m) however details are lacking; the vein is apparently quite patchy in gold values with some sections assaying at better than 1 oz/ton (34.285 g/t) but overall grades were considerably lower. There apparently were plans to develop this into a small mine in 1903-04 but these plans were never realized and development work ceased a few years later.”
Junner (1935) indicates the presence of a lode-gold prospect located at the village of
Tumfa, along the south-western flank of Xtra-Gold’s Banso Concession. The occurrence is described as a phyllite hosted, high-grade quartz vein with limited strike length. A field search by Xtra-Gold personnel failed to locate this lode gold prospect.
The reader is cautioned that the information regarding the nature of the mineralization
types for the above-named properties is not necessarily indicative of the mineralization that is the subject of this Report.
6.4 Historical Alluvial Gold Exploration The general Apapam Concession area was first subjected to systematic alluvial gold exploration in the late 1980s by WARDIG, who held a large tract of land extending from Pawtroasi in the south-west to Sajumasi in the north-east, encompassing the present Apapam ML and the Akim Apapam reconnaissance license application areas. In 1987 to 1988, RTZ Consultants, on behalf of WARDIG, undertook a reconnaissance pitting program with the aim of broadly defining the distribution and grade of auriferous gravels in the Birim and Krensen river valleys, located to the south-west and south of the town of Kibi, respectively, within the north-central portion of the Apapam Concession. A total of 132 pits were excavated along the Birim Valley at a 400 m x 200 m grid spacing; with 110 pits intersecting gravels, including: 92 pits intersecting alluvial gravels; 17 pits intersecting eluvial/colluvial gravels; and one pit intersecting both type of gravels. In the Krensen Valley a

XTRA-GOLD RESOURCES CORP. KIBI PROJECT NATIONAL INSTRUMENT 43-101 TECHNICAL REPORT 24
SEMS EXPLORATION SERVICES LTD. JULY 12, 2010
total of 30 pits were excavated of which 20 pits intersected gravels; with nine (9) pits intersecting alluvial gravels, and 11 pits intersecting eluvial gravels. The results of the reconnaissance pitting indicated that the area extent, as well as the gold values, of the gravels in the Birim Valley appeared considerably more encouraging than in the neighbouring Krensen river valley. Gold values for total gravel thicknesses, ranging from 0.35 m to 2.85 m, from the 20 most encouraging alluvial gravel pits located between Kibi and Afiesa, ranged from 0.47 g/t to 3.07 g/t gold, with individual sample values from these pits ranging from 0.07 g/t to 4.365 g/t gold. Sampling consisted of vertical channel samples across the gravel horizon; with approximately 40 kg of material collected per sample-metre. Channel samples were collected from all four walls of the pits. This preliminary work indicated that the alluvial gravels covered a total area of approximately 5 sq km, and defined seven (7) blocks considered to be promising targets for further evaluation. The alluvial pitting program identified two types of “gravel” on the Apapam Concession; alluvial (or water-lain) gravels and eluvial/colluvial gravels consisting of residual material derived by in situ rock weathering or weathering plus gravitational/slump movements, and loose rock/soil material deposited by gravity at the base of a steep slope. Auriferous eluvial/colluvial gravels are of considerable exploration significance in the search for bedrock gold sources due to the fact that they are formed in the weathered residuum over and/or in the immediate vicinity of primary gold occurrences. The eluvial/colluvial gravels tend to be characterized by angular-subangular quartz and laterite fragments, and subordinate greywacke fragments, within a reddish-brown lateritic clay matrix. These gravels typically lie on lateritic clay (mottled zone) or directly on weathered bedrock (saprolite). The eluvial/colluvial gravels range in thickness from thin, discontinuous layers (<10 cm) in lateritic clay to horizons attaining 5.5 m in thickness, with overburden cover ranging from 0.0m to 7.2 m in depth. Eluvial/colluvial gravels were intersected in 18 pits along the Birim Valley; with five (5) of these gravel occurrences yielding significant gold values from a bedrock source exploration viewpoint. Eluvial gravel horizons in Pits #39 and #97 returned strongly anomalous gold values of 2.25 g/t and 0.71 g/t over 1.10 m and 0.90 m thicknesses, respectively. Eluvial gravels in Pits #49, #57, and #122 yielded moderately anomalous gold values in the 0.12-0.16 g/t range. Eleven (11) pits intersected eluvial/colluvial gravels along the Krensen Valley; with two (2) of these gravel occurrences yielding anomalous gold values from a soil geochemistry point of view. Four (4) channel samples collected from a 40 cm layer of eluvial gravel intersected in Pit #29 returned an average grade of 0.32 g/t gold; including a high value of 0.49 g/t gold. A second anomalous value of 0.11 g/t gold was returned from a 50 cm layer of eluvial gravel in Pit #2. The exact location of these auriferous eluvial/colluvial gravel occurrences are presently unknown due to the fact that although grid coordinates for the pit samples are provided in the RTZ report, no maps depicting the pits and/or the control grid relative to topography are available to the author. Although no map is available to properly position individual test pits which intersected eluvial gravels, the RTZ report indicates that the northern portion of Block 6 near the hamlet of Afiesa, corresponding to the Block B area on Goldenrae’s alluvial resource map (Figure 6.4.A), consists of eluvial gravels, while the southern section consists of alluvial gravels. The northern eluvial
XTRA-GOLD RESOURCES CORP. KIBI PROJECT NATIONAL INSTRUMENT 43-101 TECHNICAL REPORT 25
SEMS EXPLORATION SERVICES LTD. JULY 12, 2010
gravel dominated portion of Block B exhibits a close spatial relationship with the south-west portion of Xtra-Gold’s Zone 4 gold-in-soil anomaly and a High Chargeability/High Resistivity IP anomaly associated with a prominent, geophysically inferred, NE-trending structural trend (Figure Figure 10.3.2.B). Although the WARDIG exploration program focused primarily on establishing the distribution and grade of gold-bearing gravels within the Birim and Krensen valleys, a number of bedrock quartz occurrences were intersected by alluvial pits along both valleys. A quartz vein system discovered along the Kibi-Apapam road (Birim Valley) was also subjected to trenching/sampling. Sampling of four (4) greywacke-hosted quartz veining occurrence intersected by test pits along the Birim Valley yielded gold values in the <0.01 g/t to 0.52 g/t range. Sampling of several quartz veins during the Krensen Valley alluvial pitting program yielded detection limit and/or just above detection limit gold values in the 0.01 g/t to 0.05 g/t range. Sample #WKBR12 collected within Pit #109 (Birim Valley) from a quartz vein exhibiting goethitic boxworks after pyrite returned the highest gold value of 0.52 g/t; with four samples from this vein averaging 0.48 g/t gold. A second vein from this pit yielded 0.16 g/t gold. Similarly the field location of this vein occurrence is presently unknown due to the fact that although grid coordinates for the pit samples are provided in the report, no maps depicting Pit #109 and/or the control grid relative to topography are available to the author. Trenching was proposed by RTZ Consultants to further evaluate this auriferous quartz veining but no information is available to substantiate if the work was ever carried out. A zone of quartz veining characterized by isolated quartz stringers, lenses, and a 1m wide vein system was also located along the Kibi-Apapam road (Birim Valley) during the 1987-1988 reconnaissance exploration program. A 32 m long trench was excavated to further expose the vein system and 11 samples collected from the more prominent quartz veins/lenses. This sampling yielded less than detection limit and/or just above detection limit gold values in the <0.01 g/t to 0.025 g/t range. This veining occurrence was located and sampled by Xtra-Gold in 2006; with seven (7) samples yielding similar detection limit gold values. It should be noted that the foregoing historic “resource estimate” predates and is non-compliant with NI 43-101. Furthermore, a Qualified Person has not done sufficient work to classify the historical estimate as current mineral resources or mineral reserves. The historical estimate is not being treated as current mineral resources or mineral reserves as defined in sections 1.2 and 1.3 of NI 43-101 and should not be relied upon. However, it is believed that this historical estimate provides a conceptual indication of the potential of the alluvial gold occurrence and is relevant to ongoing hard rock gold exploration. Five (5) resource blocks (i.e. Block A to E) were defined over an approximately 3.8 km section of the Birim River valley (Figure 6.4.A); with 65% of the resource present within Block A and Block E centred on the active river channel. Individual blocks range in gravel volume from 78,000 m3 to 1,436,000 m3, and in gravel grade from 0.227 g/m3 to 0.715 g/m3. The average thickness of the gold-bearing gravels is 2.2 m, with a waste to gravel ratio of 1.12:1. Goldenrae had the intention of setting up a satellite operation to its alluvial mine in neighbouring Kwabeng however the 1994 demise of its parent company left the project in limbo.
XTRA-GOLD RESOURCES CORP. KIBI PROJECT NATIONAL INSTRUMENT 43-101 TECHNICAL REPORT 26
SEMS EXPLORATION SERVICES LTD. JULY 12, 2010
Initial work by the EQ Resources–Goldenrae team (1991-1992) included a detail stream sediment sampling survey and a limited pitting program to further investigate significant stream sediment anomalies and to confirm the considerable gold-bearing gravels outlined by previous work along the upper section of the Birim River. The systematic stream sediment sampling program, which excluded the main Birim River channel due to its known auriferous nature, identified approximately 10 stream tributaries on the Apapam Concession exhibiting anomalous gold in the current active channels. Of particular interest was an array of good visible gold counts in the Akuasua tributary stream system, located near the hamlet of Ahwenease, along the northern side of the Birim River valley. The Akuasa tributary system drains Xtra-Gold’s Zone 3 and Zone 4 gold-in-soil anomaly areas lying along the flank of the Atewa Range. Once it was determined that potentially economic gold grades existed within the Birim Valley alluvial gravels, an in-fill program encompassing 182 test pits was carried out on a 400 m x 50 m grid in order to define a resource. An additional 40 in-fill pits were subsequently excavated to further define the resource along the uppermost sections of the Birim River from Anum Apapam to Adadentem, and to further test areas where previous work reported high grade anomalies. Test pit sampling followed standard procedures adopted for other alluvial gold exploration projects in the Kibi District. Pits are collared on surface with an accurately measured 1 m x 1 m area, and then hand dug vertically down through the layers of overburden and gravel into identifiable bedrock. Sampling is conducted in incremental depths of 0.5 m, yielding average sample volumes in excess of several cubic metres per pit. An additional 0.3 m of saprolitic bedrock is sampled to ensure the recovery of any gold trapped at the gravel/bedrock interface. The entire gravel sample excavated from each incremental depth of 0.5 m is treated through a small portable plant (the “Prospector”) to recover a concentrate of heavy minerals and gravel with a particle size of less than 6 mm. The concentrate is recovered from an astro-turf sluice located on the underside of the Prospector and then reduced in quantity by panning in the traditional manner using a calabash; it is then further reduced in a series of smaller dishes. Tertiary or final cleaning of the gold concentrate is by drying and hand picking. The gold is then weighed.

XTRA-GOLD RESOURCES CORP. KIBI PROJECT NATIONAL INSTRUMENT 43-101 TECHNICAL REPORT 27
SEMS EXPLORATION SERVICES LTD. JULY 12, 2010
Figure 6.4.A: Alluvial Gold Deposits – Kibi Gold Belt
XTRA-GOLD RESOURCES CORP. KIBI PROJECT NATIONAL INSTRUMENT 43-101 TECHNICAL REPORT 28
SEMS EXPLORATION SERVICES LTD. JULY 12, 2010
6.5 Production from the Property As of the date of this Report, there has been no production by Xtra-Gold from the Apapam Concession since Xtra-Gold’s acquisition of the concession. 7. Geological Setting 7.1 Regional Geology The regional geology of south-western Ghana is comprised of thick sequences of steeply dipping metasediments, alternating with metavolcanic units of Proterozoic age (~2.2-2.3 Ga). This sequence, which belongs to the Birimian Supergroup, extends approximately 200 km along strike, in a number of northeasterly trending belts (see Figure 1.4.1). The geological evolution of the Belt commenced with stabilization of the crust followed by an episode of rifting and incipient ocean floor spreading. Rifting gave rise to the formation of tectonically active basins and micro-plates. Along plate margins, volcanic island arc complexes were formed. Volcaniclastics associated with the island arc complexes, along with sediments derived from uplift and erosion of the craton margins, fed the elongated basins. Rifting was followed by compression during the Eburnean Orogeny in which the island arc and basinal assemblages were deformed. Under the compressional regime, the basinal sediments were folded and the island arc assemblages migrated along major thrust faults. Later deformation gave rise to major wrench faults, which occurred preferentially at the margins of the volcanic belts and basinal sediments. The Eburnean Orogeny gave rise to a series of northeast trending linear volcanic belts (greenstone belts) and resulted in intense deformation of basinal sediments. These sediments and associated volcanics collectively form the Birimian Supergroup. The Orogeny was associated with several phases of tectonic activity, not all of which were compressive. Periods of extension in the Winnebago-Kibi basins were tentatively related to renewed “hot spot” activity and the formation of deep-seated faults, which were located within the basinal metasediments. These faults trend northeast-southwest and were similar in genesis and characteristics to the Asankrangwa Fault in the Kumasi Basin. The faults have a strike extent exceeding 200 km and control the location of many granitoids in the basin. The margins of the belt and basin commonly exhibit faulting on local and regional scales. These structures are of fundamental importance in the development of gold deposits in the region. Syn- and post-tectonic granitoids intruded both the metasediments and metavolcanics of the Birimian Supergroup as a result of the Eburnean Orogeny. The granitoids can be broadly grouped into two (2) types; namely Basin and Belt types. Basin granitoids intruded the metasedimentary basin whereas Belt type intruded the volcanic and volcanosedimentary assemblages. Uplift and erosion, prior to the final stages of deformation, resulted in the deposition of intracratonic sediments; the Tarkwaian Supergroup, which unconformably overlie the Birimian. The contact between the Tarkwaian and Birimian Supergroup is always tectonic and may represent migration of the Tarkwaian along major thrusts.

XTRA-GOLD RESOURCES CORP. KIBI PROJECT NATIONAL INSTRUMENT 43-101 TECHNICAL REPORT 29
SEMS EXPLORATION SERVICES LTD. JULY 12, 2010
7.2 Kibi Gold Belt – Atewa Range Geology The Kibi Gold Belt is the easternmost Birimian volcano-sedimentary belt in southern Ghana. It is located south of, and parallel to, the prolific Ashanti Gold Belt, which hosts many of Ghana’s active producing gold mines. The NE-trending greenstone belt is approximately 60 km long; with its southern extremity truncated by a large granitoid batholith, and its northern extremity appearing to be overlain by younger, flat lying Voltaian sediments. The belt does not appear to have sharp margins however it is gradational into the adjacent Birim River sedimentary basin. It is generally accepted that the Kibi Gold Belt and the Winneba belt, located to the southwest in the Cape Coast area, formed one continuous volcanic belt at one point however were severed by late Eburnean granitic batholiths. The geology of the Kibi Gold Belt is not as well established as the other Birimian greenstone belts of Ghana due to the poor exposures, limited government survey mapping, and the lack of exploration activities. General property area geology is summarized from Griffis (1998) and Griffis et al (2002), and a Kibi Gold Belt geology map is provided in Figure 7.3.1. The property area is topographically dominated by the steep-sided Atewa Range exhibiting a relief of approximately 500 m with the surrounding valleys; with its flat summit attaining an elevation of approximately 780 m ASL. The Atewa Range is underlain by NE-trending Birimian units described as greenstones (altered basalts and andesites), phyllites, meta-tuffs, epi-diorite, meta-greywacke and chert. The broad valleys are underlain by thick sequences of metasediments (greywacke, argillite, phyllite). The north western extremity of the Atewa Range is the type-locality for the Birimian metasediments and metavolcanics (Lower and Upper Birimian, respectively). Regional traverses and airborne geophysical data indicate the presence of extensive volcanoclastics with narrower bands of mafic flows and mafic sills. Numerous, small, radiometrically inferred plutons of belt-type (or Dixcove-type) intrusives appear to be emplaced within the belt; and several northeast-elongated bodies of Basin-type (or Cape Coast-type) intrusive are inferred within the metasediments along the western margin of the belt. The Belt-type granitoids of southern Ghana, which can be considered I-type granites, are most commonly of diorite to granodiorite composition, and the Basin S-type granites of granodiorite to granite composition. The Belt-type granitoids were emplaced earlier as subvolcanic plutonism late in the development of the Birimian greenstone belts, between 2179 and 2136 Ma (Hirdes et al, 1992); and the Basin granitoids were emplaced mostly during the Eburnean Orogeny, between 2116 and 2088 Ma (Oberthür et al, 1998). A large batholith is located south of the Atewa Range and is likely related to the Cape Coast batholith complex. The belt exhibits a number of regional NE-trending structures inferred from airborne geophysical data and the topographic patterns. The topography also suggests several cross cutting features along several of the major valleys on the flanks of the Atewa Range. Some of these inferred structures correspond to valleys hosting significant alluvial gold occurrences which may be indicative of primary lode gold sources. Recent syn-depositional models for the basin and belt units suggest that the belt is an overturned antiformal structure with a major northeast-trending reverse fault (dipping northwest) along the eastern flank of the range ((Eisenlohr and Hirdes, 1992).

XTRA-GOLD RESOURCES CORP. KIBI PROJECT NATIONAL INSTRUMENT 43-101 TECHNICAL REPORT 30
SEMS EXPLORATION SERVICES LTD. JULY 12, 2010
7.3 Property Geology 7.3.1 Property Geology: Lithology The most recent Kibi Greenstone Belt geology map (Figure 7.3.1) is based on regional
geological survey traverses and airborne geophysics interpretation (aeromagnetic and radiometric). This map indicates that the concession is underlain by a series of NE-trending, early Proterozoic, Birimian units, including an extensive metavolcanic rock sequence dominating the north-western portion of the concession, within the core of the Kibi Gold Belt; a central metasedimentary and volcaniclastic rock package; and a potassium-rich sedimentary rock unit along the south-eastern margin of the concession. A regional, NE-trending structure is interpreted to dissect the central portion of the property, along the contact between the metasediment/volcaniclastic and potassium-rich sediment units. An ENE-trending, radiometrically inferred body of belt-type (or Dixcove-type) granitoid appears to be present along the north-western margin of the property. NE-trending mafic dykes and sills (diabase) of tentative late Mesozoic age also intrude the Birimian stratigraphy.
Detailed geological mapping has been confined to Zone 2, 3, and 1 of the Kibi Project
(Figure 11.2), located along the north-western margin of the Apapam Concession; where Xtra-Gold has also focused its trenching and drilling efforts. Due to the tropical vegetation and lateritic gravel cover, bedrock geology mapping, in addition to drill hole observations, is for the most part restricted to trenches and saprolite exposures along access roads and drill pads. At present, due to the limited surface exposures and relatively broad spacing of drill holes, correlation of lithologies between surface exposures and/or between surface exposures and drilling data remains tentative in nature.
Geological mapping, trenching, and drilling conducted by Xtra-Gold on the north-eastern
segment of the Kibi Gold Trend indicates that, unlike the regional geology map which indicates the area to be lithologically dominated by metavolcanic rocks, the north-western margin of the Apapam Concession is primarily underlain by metasedimentary rocks with relatively minor mafic metavolcanic flows and/or mafic sills; with widespread sills, dikes, and possibly small plutons of belt-type (or Dixcove-type) granitoids intruding the Birimian stratigraphy.
The metasedimentary rock package is characterized by two (2) dominant lithologies:
thinly bedded, medium to coarse grained greywacke with siltstone (+/- mudstone) intercalations; and phyllites (i.e. metamorphosed mudstone). These rocks are generally tight to isoclinally folded with a moderately to strongly developed NNW to NE-trending, steeply (east) dipping axial planar foliation (S2), and exhibit variable carbonate, chlorite, and sericite alteration. Transposition of bedding is commonly present within fine-grained units. Quartz-carbonate veining in metasedimentary rocks, with the exception of proximate to granitoid body margins, is pre-dominantly restricted to strongly foliated to sheared carbonaceous (graphitic) phyllite units.

XTRA-GOLD RESOURCES CORP. KIBI PROJECT NATIONAL INSTRUMENT 43-101 TECHNICAL REPORT 31
SEMS EXPLORATION SERVICES LTD. JULY 12, 2010
Figure 7.3.1: A Map Showing the Kibi Greenstone Belt Geology

XTRA-GOLD RESOURCES CORP. KIBI PROJECT NATIONAL INSTRUMENT 43-101 TECHNICAL REPORT 32
SEMS EXPLORATION SERVICES LTD. JULY 12, 2010
Mafic metavolcanic flows and/or mafic sills are characterized by massive, medium grained units typically ranging from 5 m to 30 m in thickness. These rocks are generally weakly foliated with 10 to 50 cm sheared intervals defined by strong foliation, and exhibit dominantly chloritic alteration with variable carbonate and leucoxene alteration. Mafic metavolcanic rocks are predominantly characterized by non-auriferous calcite veining but rare gold-bearing quartz-ankerite (+/- sulphide) veins exhibiting ankerite alteration selvages are present proximate to granitoid body margins.
The Birimian stratigraphy along the north-eastern segment (~ 2.1 km) of the Kibi Gold
Trend is intruded by widespread sills, dykes, and possibly small plutons of granodiorite, quartz diorite, and tonalite (Figure Figure 11.4.2.B). These granitoids are dark grey, medium to coarse grained, phaneritic rocks primarily composed of plagioclase and quartz; with minor hornblende, K-feldspar and biotite recognized in thin section. Granitoid sill/dykes exhibit highly variable dip attitudes and 3D geometry so additional work is required to define their true-width; but sill/dykes generally range from 5 m to 75 m in surface expression (i.e. apparent width). Similarly, insufficient work has been conducted to determine if the numerous, variably trending, granitoid bodies identified to date represent fold and/or fault-related repetitions or distinct bodies; however individual granitoid sill/dyke segments have been traced to distances of up to approximately 225 m. Some granitoid bodies with presently undefined margins (open-ended) may represent small plutons.
Generally narrow (<5 cm), up to 50 cm wide, N to NE-trending, steeply E to SE dipping
zones of strongly developed foliation cross-cut the granitoid bodies. Contacts between granitoids and greywacke are generally sheared. Granitoids exhibit variable quartz, carbonate, chlorite, and sericite alteration. Auriferous veining in the granitoid bodies, which represent the predominant host rocks in the Kibi Project, is characterized by mutually cross-cutting quartz-albite-carbonate veins (0.1 to 30 cm) forming a stockwork. Stockworking is typically comprised of shallow to moderate dipping extensional vein arrays with minor steeply dipping veins.
7.3.2 Property Geology: Structure The dominant foliation (S2) in Zones 2 and 3 consist of a NNW to NE-trending, steeply
(east) dipping axial planar foliation present throughout the metasedimentary rock sequence. This overall NE-trending axial planar foliation characterizing the Kibi Gold Trend appears to have developed during a regional NW-SE deformation event. Limited drill core and surface exposure observations indicate that Zone 1 is structurally characterized by a tightly folded metasedimentary (possibly turbiditic) sequence exhibiting a well-developed axial planar cleavage (S2). Shear bands and bed transpositions are developed along S2 cleavage in metasiltstones/metamudstones.
Several N to NE-trending, steeply E to SE dipping shear zones, appearing to have
developed contemporaneously with the regional NW-SE compression event, occur in Zone 2, including: a 1.5 m wide shear zone developed along the contact of the Trench TKB005 quartz diorite body; a 1.5 m wide graphitic shear zone within phyllites at the zone’s eastern extremity; a wide high-strain corridor reflected by numerous narrow shears developed in the Trench TKB010 tonalite body at the zone’s western extremity; and up to 1.5 m wide shear zones cross-cutting granitoid bodies throughout Zones 2 and 3.
XTRA-GOLD RESOURCES CORP. KIBI PROJECT NATIONAL INSTRUMENT 43-101 TECHNICAL REPORT 33
SEMS EXPLORATION SERVICES LTD. JULY 12, 2010
Shears and veins appear to have formed during a NW-SE reverse east over west
shortening structural regime. A SE over NW reverse sense of shear is indicated by the following structural observations: steeply plunging mineral lineation in sheared metasedimentary rocks indicative of dip-slip movement; rotation of foliation into shear zones in metasedimentary and mafic metavolcanic rocks indicative of SE over NW movement; and shallow-dipping extensional veins associated with steeply dipping fault-fill veins in granitoid bodies indicative of reverse sense of shear.
Auriferous veining in the granitoid bodies is characterized by mutually cross-cutting
quartz-albite-carbonate veins (0.1 to 30 cm) forming a stockwork. Stockworking is typically comprised of shallow to moderate dipping extensional vein arrays with minor steeply dipping veins. The three (3) dominant vein orientations are (i) shallow to moderate WNW-NNW dipping veins; (ii) steeply SE and NW dipping veins; and (iii) shallow east dipping veins. The veining cross-cuts the foliation at a high angle indicating that the emplacement of the vein stockworking in the granitoid bodies post-dates development of the ductile shear zones in the granitoid bodies indicating a protracted deformation event. Furthermore, this indicates that the gold mineralization post-dates (i.e. is not related to) the emplacement of the granitoid bodies, despite their spatial relationship.
In summary, it appears that regional NW-SE compression (D2) resulted in tight to
isoclinal folding in metasedimentary rocks, development of shear zones in metasedimentary and metavolcanic rocks and emplacement of vein stockworking in granitoid bodies. Structural relationships indicate that the NW-SE compression was prolonged and associated with gold mineralization. Refer to Figure 7.3.2 prepared by SRK Consulting (“SRK”) (Vol. I, April 2010) for a diagrammatic summary of the structural history and timing of Xtra-Gold’s Kibi Project mineralization in the deformation framework of Ghana. Xtra-Gold engaged SRK in February 2010 to conduct a full analysis and prepare a structural geological report of the Kibi Gold Trend.
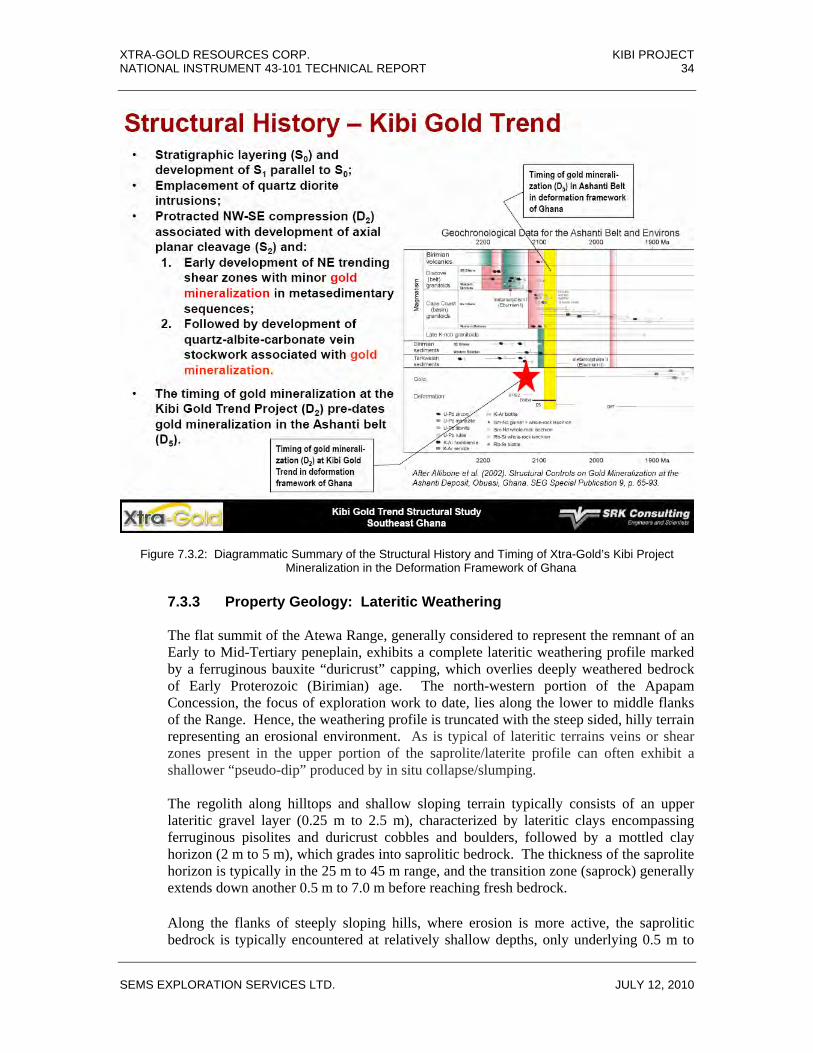
XTRA-GOLD RESOURCES CORP. KIBI PROJECT NATIONAL INSTRUMENT 43-101 TECHNICAL REPORT 34
SEMS EXPLORATION SERVICES LTD. JULY 12, 2010
Figure 7.3.2: Diagrammatic Summary of the Structural History and Timing of Xtra-Gold’s Kibi Project Mineralization in the Deformation Framework of Ghana
7.3.3 Property Geology: Lateritic Weathering The flat summit of the Atewa Range, generally considered to represent the remnant of an
Early to Mid-Tertiary peneplain, exhibits a complete lateritic weathering profile marked by a ferruginous bauxite “duricrust” capping, which overlies deeply weathered bedrock of Early Proterozoic (Birimian) age. The north-western portion of the Apapam Concession, the focus of exploration work to date, lies along the lower to middle flanks of the Range. Hence, the weathering profile is truncated with the steep sided, hilly terrain representing an erosional environment. As is typical of lateritic terrains veins or shear zones present in the upper portion of the saprolite/laterite profile can often exhibit a shallower “pseudo-dip” produced by in situ collapse/slumping.
The regolith along hilltops and shallow sloping terrain typically consists of an upper
lateritic gravel layer (0.25 m to 2.5 m), characterized by lateritic clays encompassing ferruginous pisolites and duricrust cobbles and boulders, followed by a mottled clay horizon (2 m to 5 m), which grades into saprolitic bedrock. The thickness of the saprolite horizon is typically in the 25 m to 45 m range, and the transition zone (saprock) generally extends down another 0.5 m to 7.0 m before reaching fresh bedrock.
Along the flanks of steeply sloping hills, where erosion is more active, the saprolitic
bedrock is typically encountered at relatively shallow depths, only underlying 0.5 m to
XTRA-GOLD RESOURCES CORP. KIBI PROJECT NATIONAL INSTRUMENT 43-101 TECHNICAL REPORT 35
SEMS EXPLORATION SERVICES LTD. JULY 12, 2010
1.5 m of mottled clays; with no lateritic gravel layer present. The thickness of the saprolite along steep slopes is highly variable however saprock and/or fresh bedrock is typically encountered at vertical depths of 2 m to 15 m.
The valley floors are dominated by alluvium and/or colluvium encompassing cobbles and
boulders of lateritic duricrust, derived from the capping on the summit of the Range, and of Birimian lithologies from the flanks. Past alluvial test pitting indicates average thicknesses of 3 m to 5 m for the alluvium/colluvial cover; however no information on the depth of the weathering profile in the valleys is available due to a lack of drilling activity.
8. Deposit Types 8.1 Lode Gold Deposits The deposit types being targeted at the Apapam Concession consist of mesothermal gold mineralization of the granitoid-hosted type and classic Ashanti-style sediment hosted shear zones; associated with a major northeast-trending reverse fault along the eastern flank of the Atewa Range. At the present, the granitoid-hosted type accounts for the majority of the identified gold occurrences of potentially economic significance on the concession, and is the current focus of Xtra-Gold’s exploration efforts, however soil geochemical, prospecting and geophysical results, and historic auriferous quartz vein showings, indicate that the concession is also prospective for Ashanti-style shear zone gold mineralization. Over 20 significant gold occurrences hosted by Belt (or Dixcove) and Basin (or Cape Coast) type granitoids are known in Ghana, with a number constituting significant deposits. The structural setting and mineralization style for Belt and Basin granitoid-hosted gold deposits are very similar in nature. These deposits represent a relatively new style of gold mineralization, or subtype, of the orogenic gold deposits of the Ghanaian Birimian terrane. Belt-type intrusive hosted gold deposits include Newmont Mining’s Subika deposit, the largest deposit of the Ahafo mine project, and Red Back Mining’s Chirano deposits, in the Sefwi Belt; and Golden Star Resources’ Hwini-Butre deposit at the southern extremity of the Ashanti Belt. Basin-type granitoid hosted gold deposits include Perseus Mining’s cluster of deposits at the Central Ashanti Gold Project, and AngloGold-Ashanti’s Ayankyerim and Nhyiaso deposits to the west of Obuasi, along the western flank of the Ashanti Belt. As opposed to the classical lode gold deposits of the Ashanti, Prestea and Bibiani districts, which were discovered by Europeans during the gold rush of the late 1800s, all of the aforementioned granitoid-hosted gold deposits were discovered during the last 20 years. Tectonically, the host intrusive bodies lie within or proximate to reactivated regional structures, and have deformed in a brittle fashion. In terms of lithology the Belt-type granitoids are most commonly of diorite to granodiorite composition, and the Basin-type granitoids of granodiorite to granite composition. The granitoids appear to have served as preferential conduits for fluid flow due to their brittle lithological characteristics. The emplacement of the granitoid-hosted mineralization is considered to have taken place during the main gold mineralizing episode that resulted in the more prevalent Ashanti-type Birimian metasediment/metavolcanic shear hosted deposits of Ghana (circa 2100 Ma). The mineralization typically consists of quartz veins/stockworks and pervasive alteration zones developed in brittle structures in the granitoids.

XTRA-GOLD RESOURCES CORP. KIBI PROJECT NATIONAL INSTRUMENT 43-101 TECHNICAL REPORT 36
SEMS EXPLORATION SERVICES LTD. JULY 12, 2010
The ore mineral assemblage is mainly composed of pyrite and arsenopyrite, with minor chalcopyrite, sphalerite, and rutile. Hydrothermal alteration minerals are dominated by quartz, sericite (muscovite), sulphides (mainly pyrite, arsenopyrite) and carbonates. Gold tends to be closely associated with the sulphides in both quartz veining and alteration zones. Characteristics of the Ashanti-style shear zone hosted (or boundary fault environment) gold deposits are described as follows by Naas (2008). For over a century, mineralization associated with belt-basin faults was the target for both local prospectors and foreign exploration companies; it was a primary exploration target due to the presence of coarse, visible gold. Deposits of this type in Ghana include Obuasi, Prestea, Bogoso, Konongo and Bibiani. There are a number of commonly observed associations with this mineralization environment, which include: ● located on, or close, to the lithological contact between greenstones and
metasediments; ● spatially related to deep-seated, high-angle wrench faults, which have a strike
extent exceeding 100 km. Cross-cutting northwest-southeast trending faults have also exerted an influence on the location of gold remobilized from the main zones;
● native gold is hosted by quartz veins, which may possess an en-echelon
character. Grade-width characteristics persist virtually unchanged to depths exceeding one (1) km. The veins broadly parallel the regional foliation but in detail are seen to cross-cut this foliation;
● disseminated sulphides in the wall rock are common; ● several generations of quartz veining are common and gold is seemingly
associated with the final phase; ● mineralization is spatially associated with graphitic phyllites and manganiferous
sediments; ● mineralogy is simple with a strong positive correlation between gold and
arsenopyrite. Accessory minerals include pyrite, chalcopyrite, pyrrhotite, and bornite;
● strong silicification is common, accompanied by sericite and carbonate alteration.
Tourmaline may also be present; and ● granitoids may or may not be spatially associated with mineralization. 8.2 Exploration Model Trenching and drilling efforts to date have identified widespread granitoid-hosted gold occurrences over an approximately 2,100 m distance along the north-eastern segment of the Kibi Gold Trend target; an over 5.5 km long, NE-trending, anomalous gold-in-soil trend characterized by four (4) extensive higher grade zones ranging from approximately 800 m by 75 to 300 m to 1,000 m by 100 to 500 m in area. All mineralization targets are near surface, remain open in all directions, and offer potential for shallow oxide mineralization amenable to bulk mining and heap

XTRA-GOLD RESOURCES CORP. KIBI PROJECT NATIONAL INSTRUMENT 43-101 TECHNICAL REPORT 37
SEMS EXPLORATION SERVICES LTD. JULY 12, 2010
leaching, as well as large primary gold systems at depth (see Section 9 for a detailed description of the mineralization). Xtra-Gold is employing trenching and drilling as the primary exploration means of delineating the granitoid bodies hosting the known gold occurrences, and prospecting, geophysics, and trenching to follow-up on the extensive, untested gold-in-soil anomalies along the Kibi Gold Trend target area. 8.3 Alluvial Gold Deposits 8.3.1 Summary Long before the arrival of the Europeans, the local villagers had been mining alluvial (or
placer) gold in the Kibi Gold Belt for generations using the traditional pitting methods to penetrate through 2 to 3 m of barren overburden into the underlying auriferous gravels. The Kibi District was very much coveted by the Ashantis in their rise to become a regional power over 200 years ago based on its known wealth in gold and it was one of their earliest conquests.
The Kibi Gold District is characterized by widespread alluvial gold occurrences present
along the base of the Atewa Range and surrounding drainage systems. The gravels occur as blanket-like units covering broad areas within and between river valleys. The blanket-like gravel units present along the lower flanks of the Atewa Range appear to reflect alluvial fans formed by fast flowing streams as they emerged into the lower valleys and onto adjacent plains. Most probably these developed in the Pleistocene Epoch at a time when uplift of an old peneplain surface, represented by the flat lateritic duricrust capping at the summit of the Range, was followed by extensive erosion. The general appearance and shape of the gold grains are indicative of only modest signs of transport which suggests proximal primary sources.
In early 1991 EQ Resources acquired the Apapam Concession and carried out a
successful alluvial pitting program in cooperation with Goldenrae over an 18 month period. In 1993, Goldenrae acquired the Apapam Concession from EQ Resources and completed additional test pitting, and an in-house feasibility study including an historic, non NI 43-101 compliant, resource estimate of 3,717,000 cubic metres of gravel with a grade of 0.63 grams gold per cubic metre, equivalent to approximately 75,000 raw oz of gold (see Section 8.3 for further details on the Apapam alluvial gold deposit).
It should be noted that the foregoing historic "resource estimate” predates and is non-
compliant with NI 43-101. Furthermore, a qualified person has not done sufficient work to classify the historical estimate as current mineral resources or mineral reserves. The historical estimate as current mineral resources or mineral reserves as defined in sections 1.2 and 1.3 of NI 43-101, and the historical estimate should not be relied upon. However, it is believed that this historical estimate provides a conceptual indication of the potential of the alluvial gold occurrence and is relevant to ongoing hard rock (primary source) exploration efforts.

XTRA-GOLD RESOURCES CORP. KIBI PROJECT NATIONAL INSTRUMENT 43-101 TECHNICAL REPORT 38
SEMS EXPLORATION SERVICES LTD. JULY 12, 2010
8.3.2 Geomorphic Setting and Deposit Characteristics The following summary description of the geology and geomorphology of the Kibi
District alluvial (or placer) gold deposits is primarily based on the extensive resource definition work conducted on the Kwabeng and Pameng concessions by Goldenrae in the late 1980s. The general characteristics of the Awasu and Merepong river valley deposits, located on Xtra-Gold’s Kwabeng and Pameng Concessions, respectively, are quite typical of the alluvial gold deposits over much of the Kibi Gold Belt, including the Birim valley alluvial deposit on the Apapam Concession. The principal sources of information are from Junner (1935), and Griffis and others (1991).
The Kibi District is characterized by widespread alluvial gold occurrences present along
the base of the Atewa Range and surrounding drainage systems. The gravels occur as blanket-like units covering broad areas within and between river valleys. The alluvial deposits tend to be relatively thin on the low-lying ridges between the valleys but are thicker within the more prominent river valleys. The auriferous gravel deposits within the Awasu and Merepong river valleys located on the west flank of the Range, average 2-3 m in thickness, attaining 4 m in some areas, and underlie 2-3 m of silt and clay overburden. The average thickness of the gold-bearing gravel deposits within the Birim River valley on the Apapam Concession is 2.2 m, with the overburden cover typically ranging from 1-2 metres in thickness. The gravels typically exhibit clearly defined contacts with both the overburden and underlying saprolitic bedrock. Within the principal valleys the gravel units can attain several hundred metres in width; being narrower in the upper sections of the valleys and spreading out laterally downstream over several kilometres to the confluence with the Birim River. Most of the other main river valleys of the Kibi District have very similar alluvial units.
The gravels within the upper reaches of the valleys, along the lower flanks of the Range,
tend to be quite coarse, commonly encompassing very large, rounded boulders, but clasts drop off significantly in size within a short distance downstream. The auriferous gravels typically consist of a mixture of boulders, cobbles, and pebbles (60%-70% coarse fraction) with a sand, silt, and clay matrix (30%-40%). The clay content can be quite substantial which can pose technical challenges in the processing of the pay gravels. The coarse clasts tend to be sub-rounded, matrix supported, and dominated by quartz but lateritic duricrust, metasediment, and metavolcanic clasts are also common. Although the gravels are essentially unconsolidated in active stream channels, in many other areas there is incipient laterization in both overburden and gravels, especially in areas between drainages where the overburden and gravel is relatively thin.
Gold fineness in the Kibi alluvial district is high; predominantly in the range of 900 to
940. The gold is normally quite coarse, especially in the upper reaches of the valleys, but the grain size decreases noticeably in the downstream direction through migration. In the upstream sections of the Awasu and Merepong river valleys, the coarsest fraction (+1.00 mm) makes up 30%-60% of the total gold, whereas the fine fraction (-0.2 mm) is usually only 4%-10% of the total gold. Even the downstream areas contain fairly coarse gold, with the -0.2 mm fraction being only 15%-20% of the total gold content. The coarser gold grains tend to be sub-rounded and irregular in shape whereas the finer particles are generally flaky. The general appearance and shape of the gold grains are indicative of only modest signs of transport which suggests proximal primary sources. Fragments of angular, intricately shaped vein quartz containing coarse, wiry gold, recovered from the
XTRA-GOLD RESOURCES CORP. KIBI PROJECT NATIONAL INSTRUMENT 43-101 TECHNICAL REPORT 39
SEMS EXPLORATION SERVICES LTD. JULY 12, 2010
Kwabeng alluvial operation, further supports proximal bedrock sources. However, a small percentage of gold grains are very well rounded and worn; these appear to be from a secondary source, possibly originating from the lateritic capping on the summit of the Atewa Range and representing paleoplacer deposits which are now being re-eroded.
The blanket-like gravel units present along the lower flanks of the Atewa Range appear to
reflect alluvial fans formed by fast flowing streams as they emerged into the lower valleys and onto adjacent plains. Most probably these developed in the Pleistocene Epoch at a time when uplift of an old peneplain surface, represented by the flat lateritic duricrust capping at the summit of the range, was followed by extensive erosion. Age-dating of buried logs recovered from Birim River gravels from alluvial diamond mining in the Akwatia area, to the south of the Kibi Project; appear to indicate that most of the alluvials were reworked under major flooding conditions approximately 10,000 BP. This flooding was followed by a relatively quiescent period, which resulted in the deposition of the finer silt and clay overburden material. The same scenario appears to apply for the entire region.
8.3.3 Gold Provenance Discussion In the pioneering days of the Gold Coast Geological Survey, Sir Alfred Kitson, the
survey Director, conducted reconnaissance geology of the Atewa Range where, in addition to identifying extensive bauxite deposits on the range plateau; he also observed the presence of widespread alluvial gold occurrences in many streams along the flank of the Range. Another survey geologist, D.P. McGregor, also noted the widespread alluvial gold occurrences while conducting geological traversing along the Range and commented that “... the bauxite cap also carried gold which suggests that the underlying rocks are auriferous” (in the Annual Report of the Geological Survey 1931-32, p11).
Griffis and others (2006) report that in the late 1980s most of the major valleys extending
to the summit of the Atewa Range were subjected to stream geochemistry as part of a lateritic gold reconnaissance program conducted jointly by Sikaman Gold Resources and BHP Minerals. He comments that “... details of this work are not available but, in general, most of the streams with elevated gold values appear to have the gold originating from sources, probably gold-bearing quartz veins, along the slopes of the range with little evidence of significant gold coming from the laterite capping. Limited sampling of laterite from the edges of the laterite plateau yielded no major anomalies but there were indications of minor gold within some areas of the laterite. Although the program was hardly exhaustive, the conclusion was that there were no obvious major laterite gold occurrences along the margins of the plateau”.
The base of the Atewa Range is characterized by extensive gravels derived from the
laterite capping on the summit and from Birimian units along the flanks, which include metavolcanics, metasediments, and subvolcanic mafic dikes and sills. Possible bedrock sources for the widespread alluvial gold deposits, in addition to gold mineralization of the granitoid hosted-type identified by Xtra-Gold along the eastern flank of the Atewa Range on the Apapam Concession, include typical “Ashanti” style shear zone hosted mineralization on either sides of the Range. Early stage exploration efforts by Xtra-Gold on its Ankaase gold trend project along the north-western flank of the Range has outlined a prominent, NE-trending deformation zone encompassing several sub parallel, shear hosted, gold-bearing quartz vein zones, which may represent a regional feature. It has
XTRA-GOLD RESOURCES CORP. KIBI PROJECT NATIONAL INSTRUMENT 43-101 TECHNICAL REPORT 40
SEMS EXPLORATION SERVICES LTD. JULY 12, 2010
also been suggested that the eastern flank of the Range hosts a major reverse fault, which also could have associated gold.
Although the aforementioned regional reconnaissance program of the late 1980s and
work to date by Xtra-Gold appear to indicate that most of the gold in the present drainages originates from bedrock sources along the flanks of the Atewa Range, it is also apparent that the numerous, generally isolated, gold-bearing veins lying some distance away from the steep flanks of the Range have also contributed to some degree to the alluvial gold occurrences (i.e. old Kibi, Kwabeng, and Puma mine reefs described in Sections 6.3.1 to 6.3.1).
9. Mineralization Mineralization of potentially economic significance discovered to date on the Apapam concession by Xtra-Gold consists predominantly of mesothermal gold mineralization of the granitoid-hosted type. The gold is associated with quartz-albite-carbonate-sulphide stockwork veining developed in sills, dykes, and possibly small plutons (stocks) of granodiorite, quartz diorite, and tonalite compositions. Low grade, but exploration significant, shear zone hosted gold mineralization developed within metasedimentary rocks also occurs on the concession. The type, characteristics, distribution, and relevant geological/structural controls of the mineralization are presented below; with the details pertaining to the mineralized zones provided in Section 11.4 – “Drilling Results”. Auriferous veining in the granitoid bodies is characterized for the most part by mutually cross-cutting quartz-albite-carbonate veins forming a stockwork; with veining ranging from millimetre-scale to 0.5 m in thickness but generally averaging 2 to 10 cm. Stockworking is typically comprised of shallow to moderate dipping extensional vein arrays with minor steeply dipping veins. The three (3) dominant vein orientations are: (i) shallow to moderate WNW-NNW dipping veins; (ii) steeply SE and NW dipping veins; and (iii) shallow east dipping veins. Strong carbonate-quartz (+/- pyrrhotite, pyrite) selvages tend to be associated with quartz-albite-carbonate veining; with the bleached selvages being particular apparent in weakly oxidized (saprock) granitoid. Hydrothermal alteration is highly variable but in heavily veined granitoid the assemblage is characterized by moderate-strong, semi-pervasive to pervasive quartz, carbonate, chlorite, and sericite; with associated patchy to pervasive sulphidization in the form of disseminated pyrrhotite, pyrite, and arsenopyrite (+/- sphalerite). Variations in gold grade appear to reflect alteration mineralogy in granitoid host with the gold grade appearing to increase with stronger carbonate-quartz-pyrrhotite-arsenopyrite mineralization that is spatially associated with quartz-carbonate stockwork veining. Sulphide mineralogy in strongly veined granitoid typically consists of 1-3%, locally up to 5%, fine to medium grained, disseminated pyrrhotite (+/- pyrite, sphalerite) and trace – 3%, locally up to 5%, very fine to coarse grained, euhedral, disseminated arsenopyrite (+/- pyrite); with rare to trace chalcopyrite and galena. Rare native gold occurs as very fine to fine grains along sulphide grain margins and in fine fractures in sulphides. Petrography indicates that pyrrhotite and sphalerite are corroded and overgrown by euhedral pyrite and arsenopyrite; and that three (3) generations of pyrite appear to be present. Pyrrhotite appears to be oldest and sphalerite, which is closely associated with the pyrrhotite, representing the next mineral in the paragenesis. Sulphide mineralization in the quartz-albite-carbonate veining is characterized by highly variable concentrations of patchy and/or fracture-controlled pyrite and arsenopyrite with minor pyrrhotite,

XTRA-GOLD RESOURCES CORP. KIBI PROJECT NATIONAL INSTRUMENT 43-101 TECHNICAL REPORT 41
SEMS EXPLORATION SERVICES LTD. JULY 12, 2010
and rare native gold. Visible gold present as fine to coarse isolated grains, commonly occurring along chloritic clots, and as fine to medium grains rimming arsenopyrite crystal margins. The veining, alteration, and mineralization is generally restricted to within and immediately adjacent to the granitoid intrusive bodies; with gold grades in the metasediments and mafic metavolcanics typically dropping off to background or weakly anomalous levels within a few metres of the contact. Although additional trenching and drilling is required to better define the extent and contacts of the granitoid bodies it appears at this stage that the veining/mineralization tends to be better developed along the margins (i.e. inner margin) of the host intrusions, except where the host intrusion consists of a relatively narrow sill / dyke (i.e. Trench TKB005 granitoid at east end of Zone 2). Rare, isolated, up to 5 cm, shallow dipping quartz-carbonate veins containing auriferous sulphides and/or visible gold occur within mafic metavolcanic rocks in close proximity to the contact of a granitoid body. These auriferous quartz-carbonate veins typically exhibit distinct Fe-carbonate (ankerite) alteration selvages. Generally narrow (<5 cm), up to 50 cm wide, N to NE-trending, steeply E to SE dipping zones of strongly developed foliation cross-cut the granitoid bodies. Unmineralized granitoid tends to be massive and unaltered, with little or no veining. The veining cross-cuts the foliation at a high angle indicating that the emplacement of the vein stockworking in the granitoid bodies post-dates development of the ductile shear zones in the granitoid bodies indicating a protracted deformation event. These timing relationships appear to indicate that granitoid emplacement and hydrothermal activity associated with the gold mineralization are separated by ductile deformation; which indicates that the gold mineralization post-dates (i.e. is not related to) the emplacement of the granitoid bodies, despite their spatial relationship. The veining, alteration, and mineralization is restricted to within and immediately adjacent to the granitoid bodies and appears to indicate that the granitoids served as preferential conduits for fluid flow due to their brittle lithological characteristics compared to the metasediments. Zone 1 of the Kibi Gold Trend is characterized by low-grade gold mineralization associated with deformed, foliation-parallel quartz-carbonate-pyrite (+/- arsenopyrite) veins within shear zones developed within a tightly folded metasedimentary (possibly turbiditic) sequence; representing a prospective target for Saddle Reef or Bendigo type gold mineralization. Petrological studies have been completed on samples of specific drill holes in the Apapam concession. The medium-grained, plutonic rocks consist mainly of plagioclase feldspar and quartz to a lesser extent as the primary minerals. These samples are weathered and consist of appreciable amounts of carbonate, sericite and some opaque secondary ore minerals. Muscovite also occurs. Figure 9.A shows sample 0103201 an altered granitoid with corroded laths of plagioclase feldspar and opaque ore minerals surrounded by secondary carbonate. Observation of thin section 0103216 displays a relatively fresh granite with equal composition of K-feldspars and plagioclase, suggesting adamellite composition (Figure 9.B). The petrographic studies indicate that these rocks are highly deformed and most of the primary minerals are fractured. Mineralization is mainly disseminated and is structurally controlled, with the granitoid mineralization being hosted in quartz stockwork. The primary ore mineral assemblage is pyrrhotite, sphalerite, pyrite, plus or minus magnetite, ilmenite and rutile. Studies of polished sections indicate that pyrrhotite and sphalerite are intensely corroded and are affected by later hydrothermal alteration. Intense alteration, mainly hydrothermal, of the granitoid has changed the primary minerals to sericite, carbonate and quartz.

XTRA-GOLD RESOURCES CORP. KIBI PROJECT NATIONAL INSTRUMENT 43-101 TECHNICAL REPORT 42
SEMS EXPLORATION SERVICES LTD. JULY 12, 2010
Figure 9.A: A Sample indicating Altered Granitoid with Plagioclase
Feldspar and Opaque Minerals surrounded by Secondary Carbonate
Figure 9.B: Thin Section of Relatively Fresh Granite indicating
Equal Composition of K-Feldspar and Plagioclase

XTRA-GOLD RESOURCES CORP. KIBI PROJECT NATIONAL INSTRUMENT 43-101 TECHNICAL REPORT 43
SEMS EXPLORATION SERVICES LTD. JULY 12, 2010
Figure 9.C: A Polished Section showing Granodiorite consisting of Corroded Sphalerite, Pyrrhotite and Pyrite
Figure 9.D: Polished Section of Altered Granitoid showing
Relicts of Pyrrhotite, Sphene, Magnetite and Pyrite
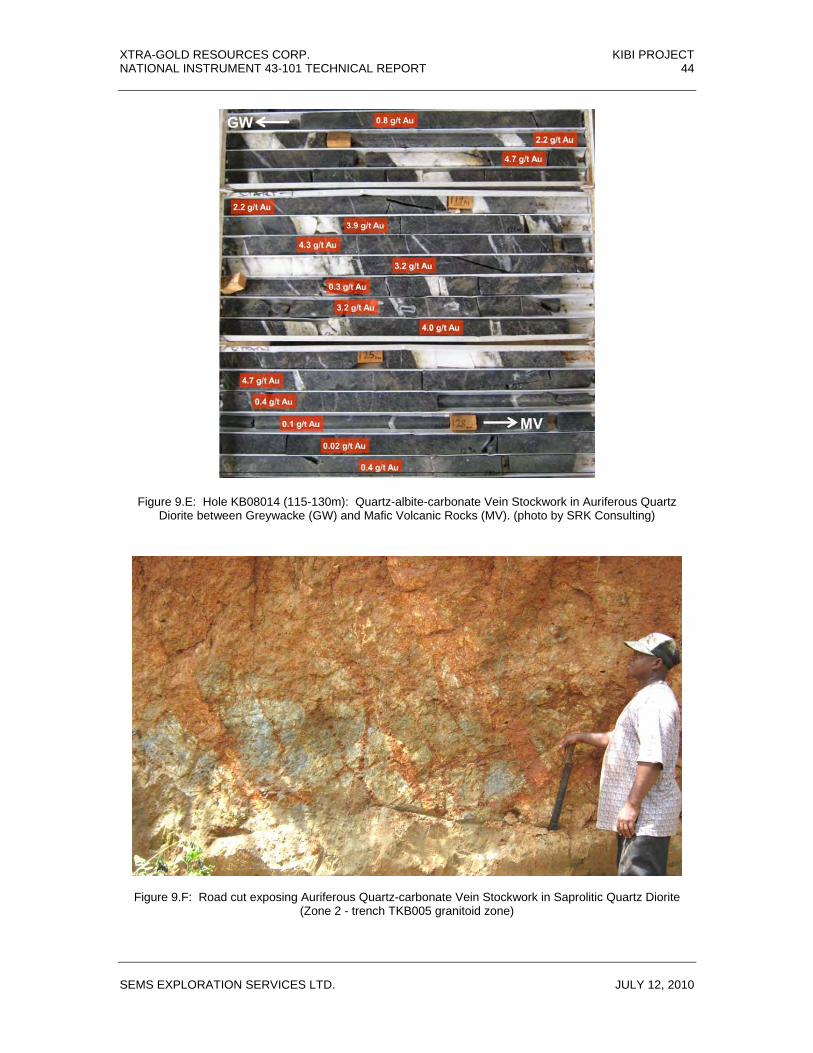
XTRA-GOLD RESOURCES CORP. KIBI PROJECT NATIONAL INSTRUMENT 43-101 TECHNICAL REPORT 44
SEMS EXPLORATION SERVICES LTD. JULY 12, 2010
Figure 9.E: Hole KB08014 (115-130m): Quartz-albite-carbonate Vein Stockwork in Auriferous Quartz Diorite between Greywacke (GW) and Mafic Volcanic Rocks (MV). (photo by SRK Consulting)
Figure 9.F: Road cut exposing Auriferous Quartz-carbonate Vein Stockwork in Saprolitic Quartz Diorite (Zone 2 - trench TKB005 granitoid zone)

XTRA-GOLD RESOURCES CORP. KIBI PROJECT NATIONAL INSTRUMENT 43-101 TECHNICAL REPORT 45
SEMS EXPLORATION SERVICES LTD. JULY 12, 2010
10. Exploration 10.1 General The exploration work conducted during 2006-2007, and forming part of the previous NI 43-101 technical report on the Apapam Concession (Naas, 2007), is summarized in Section 10.2; with the exploration work conducted during 2008-2010, and forming part of the present technical review, presented in Section 10.3. 10.2 2006 – 2007 Exploration Programs Two (2) separate work programs were conducted on the Apapam Concession during 2006-2007. The first work program was undertaken and managed by CME Consultants Inc. (“CME”); a Canada-based geological consultancy with over 15 years of project management experience in Ghana. The second program was undertaken and managed by Xtra-Gold personnel. The Phase I exploration program was designed to test the Apapam Concession on a regional scale. The field work was implemented by CME from August 12 to September 23, 2006 and included: ● concession-wide stream sediment sampling (88 samples collected from 44 sites); ● survey grid establishment (33.78 line-km); ● soil sampling (1,306 samples); ● GPS surveying (33.78 line-km); ● rock sampling (89 samples); and ● historical adit and bulldozer cut sampling (100 samples). The Phase II exploration program consisted of a reconnaissance trenching program intermittently implemented by the Xtra-Gold exploration staff from February 2007 to December 2007. The trenching was carried out to test the geochemical signature at depth of the gold-in-soil anomalies detected within the north-western portion of the concession during the Phase I work program. A total of 542 channel samples were collected from 21 trenches totalling 1,090 linear-metres. In order to obtain an independent assessment of the 2007 Xtra-Gold trenching results, a NI 43-101 compliant data verification program was undertaken by CME in December, 2007. The program involved the re-sampling of selected trenches which yielded exploration-significant gold mineralization intervals. The findings of the Phase I and Phase II exploration programs are summarized below, and details of the work programs can be found in (Naas, 2007) and (Naas, 2008), respectively. The soil geochemistry and trenching results from these programs are incorporated in the maps and technical discussions of the present report.
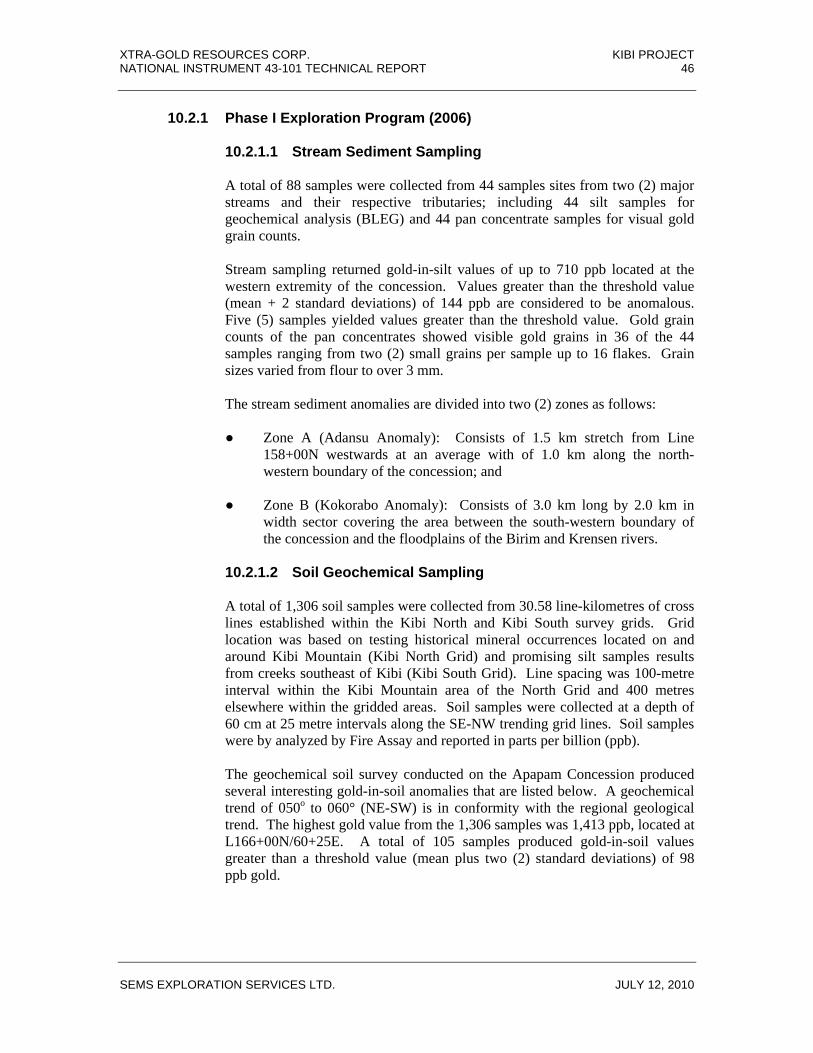
XTRA-GOLD RESOURCES CORP. KIBI PROJECT NATIONAL INSTRUMENT 43-101 TECHNICAL REPORT 46
SEMS EXPLORATION SERVICES LTD. JULY 12, 2010
10.2.1 Phase I Exploration Program (2006) 10.2.1.1 Stream Sediment Sampling A total of 88 samples were collected from 44 samples sites from two (2) major
streams and their respective tributaries; including 44 silt samples for geochemical analysis (BLEG) and 44 pan concentrate samples for visual gold grain counts.
Stream sampling returned gold-in-silt values of up to 710 ppb located at the
western extremity of the concession. Values greater than the threshold value (mean + 2 standard deviations) of 144 ppb are considered to be anomalous. Five (5) samples yielded values greater than the threshold value. Gold grain counts of the pan concentrates showed visible gold grains in 36 of the 44 samples ranging from two (2) small grains per sample up to 16 flakes. Grain sizes varied from flour to over 3 mm.
The stream sediment anomalies are divided into two (2) zones as follows:
● Zone A (Adansu Anomaly): Consists of 1.5 km stretch from Line
158+00N westwards at an average with of 1.0 km along the north-western boundary of the concession; and
● Zone B (Kokorabo Anomaly): Consists of 3.0 km long by 2.0 km in
width sector covering the area between the south-western boundary of the concession and the floodplains of the Birim and Krensen rivers.
10.2.1.2 Soil Geochemical Sampling A total of 1,306 soil samples were collected from 30.58 line-kilometres of cross
lines established within the Kibi North and Kibi South survey grids. Grid location was based on testing historical mineral occurrences located on and around Kibi Mountain (Kibi North Grid) and promising silt samples results from creeks southeast of Kibi (Kibi South Grid). Line spacing was 100-metre interval within the Kibi Mountain area of the North Grid and 400 metres elsewhere within the gridded areas. Soil samples were collected at a depth of 60 cm at 25 metre intervals along the SE-NW trending grid lines. Soil samples were by analyzed by Fire Assay and reported in parts per billion (ppb).
The geochemical soil survey conducted on the Apapam Concession produced
several interesting gold-in-soil anomalies that are listed below. A geochemical trend of 050o to 060° (NE-SW) is in conformity with the regional geological trend. The highest gold value from the 1,306 samples was 1,413 ppb, located at L166+00N/60+25E. A total of 105 samples produced gold-in-soil values greater than a threshold value (mean plus two (2) standard deviations) of 98 ppb gold.

XTRA-GOLD RESOURCES CORP. KIBI PROJECT NATIONAL INSTRUMENT 43-101 TECHNICAL REPORT 47
SEMS EXPLORATION SERVICES LTD. JULY 12, 2010
Area 1: The area consists of the following geochemical anomalous zones extending over a 400 metre distance on five (5) adjacent grid lines. The limits of this anomaly located on the north-western flank of Kibi Mountain are well defined by the present soil survey.
● L162+00N, at 51+50E (single point anomaly), 175 ppb Au ● L163+00N, from 51+75E to 52+75E (100 metres), 75 to 195 ppb Au ● L164+00N, from 51+75E to 53+00E (125 metres), 105 to 630 ppb Au ● L165+00N, from 52+75E to 53+25E (50 metres), 145 to 330 ppb Au ● L166+00N, at 54+00E (single point anomaly), 865 ppb Au Area 2: The area is defined by three (3) 125 to 250 metre wide anomalous
zone extending over a 600 metre distance on the following three (3) grid lines. Further detailed soil sampling is required to better define limits of the area.
● L166+00N, from 39+75E to 42+25E (250 metres), 75 to 585 ppb Au ● L170+00N, from 44+00E to 45+75E (175 metres), 290 to 630 ppb Au ● L172+00N, from 45+75E to 47+00E (125 metres), 100 to 775 ppb Au Area 3: This area consists of a single 225 metre wide gold-in-soil anomalous
zone (110 to 390 ppb) extending from 42+75E to 45+00E on L 158+00N. Further detailed soil sampling is required to better define limits of the area.\
Area 4: This area consists of a single 100 metre wide gold-in-soil anomalous
zone (120 to 360 ppb) extending from 41+00E to 42+00E on L 170+00N. Further detailed soil sampling is required to better define limits of the area.
10.2.1.3 Rock and Historical Adit Sampling A total of 89 rock samples were collected during stream sediment and soil
sampling traversing. In addition three (3) historical adits ranging from 7 to 85 metres in length and a bedrock face exposed along a bulldozer cut, located on and in the vicinity of Kibi Mountain were also sampled during the Apapam Phase I exploration program. A total of 77 samples were collected from the three adits and 23 samples from the bulldozer cut face. Rock and adit samples were analyzed by Fire Assay and reported in parts per billion (ppb). Rock and adit samples returning greater than 1,000 ppb gold were re-analyzed by Fire Assay with results reported in grams per tonne (g/t).
Seven (7) out of the 89 rock samples returned values greater than the threshold
value of 82 ppb gold. The highest gold value recorded is 1.01 g/t; with the remaining anomalous values falling in the 140 ppb to 970 ppb gold range. No significant gold values were returned from the Adit 1 and Adit 3 sampling but the six (6) samples collected from Adit 2 yielded economically significant values between 710 ppb and 6.36 g/t gold from chip and channel samples.
Rock (float) and adit sampling has also confirmed that a potential for lode gold
mineralization exists on the Apapam Concession, especially in the vicinity of Kibi Mountain. Three (3) of the anomalous rock samples are located at the base of Kibi Mountain (1.01 g/t Au, 255 ppb Au and 385 ppb Au) and also fall

XTRA-GOLD RESOURCES CORP. KIBI PROJECT NATIONAL INSTRUMENT 43-101 TECHNICAL REPORT 48
SEMS EXPLORATION SERVICES LTD. JULY 12, 2010
in the Area 1 gold-in-soil anomaly discussed above. Another anomalous rock sample (510 ppb Au) is located within the Area 4 gold-in-soil anomaly, thus confirming mineralization within the vicinity. Results returned from rock samples indicate that float of fractured and limonitic rock can be a useful tool for future prospecting programs.
Three (3) adits and a bulldozer cut were located and sampled during the current
exploration program. Adit 1 was extensively sampled but no significant values reported. Adit 2 has indicated potential for significant gold mineralization in the Kibi Mountain area. Channel sampling in this adit returned a length weighted average grade of 3.47 g/t Au over 3.80 m; including 6.36 g/t over 1.7 m. Grab samples returned values of 1.0 g/t Au and 1.58 g/t Au. Adit 2 falls within the Area 1 gold-in-soil anomaly. No significant values were returned from Adit 3, although sampling was not able to reach the end of the adit due to unsafe ground conditions. Sampling in the bulldozer cut on the southwest side of Kibi Mountain returned 1.52 g/t Au over 1.0 m.
10.2.2 Phase II Exploration Program (2007) A total of 21 reconnaissance trenches ranging from 2 m to 224 m in length were
excavated by Xtra-Gold personnel during the 2007 Phase II exploration program. A total of 542 channel samples (2 m) were collected from the 21 trenches totaling 1,090 linear-metres. Trenches were manually excavated by pickaxes and shovels to a typical width of 1 m and an average depth of 3 m, with some sections of the trenches reaching 4.0 m in depth. Trenching typically extended down to the saprolite horizon but locally the saprolite could not be reached due to safety concerns. Sampling consisted of a continuous channel sample collected from a canal excavated along the trench floor.
Prior to sampling, the floor of the trench was cleaned of any loose material and an
approximately 10 cm wide by 2-3 cm deep canal excavated along the center-line of the trench; all this material was discarded.
The bulk of the trenching efforts, including eight (8) trenches totaling 834 linear-metres
(approx. 75%), focused on testing the Area 1, 2 and 3 gold-in-soil anomalies detected during the 2006 Phase I work program. Eight (8) trenches totaling 144 m were excavated to test the subsurface in an area of extensive Ashanti-style pits discovered by prospecting in what is now the north-central portion of the Zone 3 gold-in-soil anomaly (i.e. trench TAD001-TAD004 granitoid zone). An additional five (5) trenches totaling 112 m were excavated to test the subsurface in areas of mineralized rock floats.
In order to obtain an independent assessment of the 2007 Xtra-Gold trenching results, a
NI 43-101 compliant data verification program was undertaken by CME in December 2007. The program involved the re-sampling of selected trenches which yielded exploration-significant gold mineralization intervals. The trenching program results noted hereunder correspond to the results returned by the independent CME data verification program.
Four (4) out of the 21 trenches yielded length-weighted average grade intervals greater
than the arbitrarily set exploration-significant threshold of 1.0 g/t gold, including: trench TKB003 in gold-in-soil anomaly Area 1 (i.e. Kibi Mountain); trenches TKB004 and

XTRA-GOLD RESOURCES CORP. KIBI PROJECT NATIONAL INSTRUMENT 43-101 TECHNICAL REPORT 49
SEMS EXPLORATION SERVICES LTD. JULY 12, 2010
TKB005 in gold-in-soil anomaly Area 2; and trench TAD001 in the Adadietem Area (i.e. present Zone 3). The independent data verification program undertaken by CME encompassed the complete re-sampling of the exploration-significant intervals (≥ 1.0 g/t Au) from the four (4) aforementioned trenches.
The CME re-sampling included 116 channel samples totaling 115.41 linear metres.
Sampling consisted of a horizontal channel cut along the sidewall of the trench, approximately 0.2 m above the trench floor. Sampling was typically established at one (1) metre intervals, with sample lengths locally adjusted to accommodate geological features. Forty-six (46) out of the 116 channel samples collected by CME returned values greater than 1.0 g/t gold. Exploration-significant gold intercepts (≥ 1 g/t Au) from the independent data validation program are presented in Table 1. The reported mineralized intercepts represent trench lengths and are not necessarily indicative of the true width of the mineralization.
Table 1: Significant Trench Intercepts – Apapam Concession
INTERVALS (metres)
TRENCH ID
ZONE / AREA FROM TO TRENCH LENGTH (1)
GOLD (g/t)
TKB003 Area 1 46.36 54.10 7.74 1.60
TKB003 Area 1 64.10 74.55 10.45 1.62
including 68.00 70.25 2.25 4.64
TKB004 Area 2 194.00 196.00 2.00 1.70
TKB004 Area 2 203.00 214.00 11.00 (2) 4.07
TKB005 Area 2 61.00 74.00 13.00 5.23
including 69.00 71.00 2.00 14.45
TAD001 Adadietem 0.00 1.00 1.00 4.95
TAD001 Adadietem 4.00 8.00 4.00 1.82
TAD001 Adadietem 11.00 15.00 4.00 1.18
(1) Reported intercepts are trench-lengths; true width of mineralization is unknown at this time. (2) Apparent Width: Estimated to represent a true width of 3 to 4 m based on shallow dipping (“flat
lying”) nature of the quartz veining. Gold mineralization on the Apapam Concession was found to occur in several different
geological setting, including steeply and flat-lying quartz veins and alteration haloes proximate to the quartz veining. The presence of shallow dipping (“flat lying”) veins may produce an exaggeration in both the width and grade of the mineralization. The effect of shallow veining is apparent in trench TKB004 where a 4.07 g/t gold grade over an 11.0 m trench-length is estimated to represent a true width of 3 to 4 m due to the flat lying nature of the quartz veins. Calculation of true widths within trenches can be difficult, as not all of the geological features are properly exposed.
XTRA-GOLD RESOURCES CORP. KIBI PROJECT NATIONAL INSTRUMENT 43-101 TECHNICAL REPORT 50
SEMS EXPLORATION SERVICES LTD. JULY 12, 2010
Trenching was found to be an effective way to test gold-in-soil anomalies on the Apapam Concession. The following best practices sampling techniques were recommended for future trenching programs:
(1) Channel samples should be taken from the side wall of the trench and not from
the floor of the trench in order to mitigate contamination issues and eliminate sampling bias when sampling exposed, shallow dipping quartz veins.
(2) Sampling must be constrained by alteration, structure and lithology. (3) if two (2) metre sampling widths are to be used for budget reasons, detailed
sampling of anomalous areas must be undertaken as follow-up. 10.3 2008 – 2010 Exploration Programs Exploration work on the Apapam Concession during the 2008-2010 reporting period was aimed at advancing the Kibi Project consisting of an over 5.5 km long mineralized trend delineated from gold-in-soil anomalies, trenching, drilling, and geophysical interpretations along the northwest margin of the Apapam Concession; and characterized by widespread gold occurrences of the granitoid hosted-type. An extensive soil geochemistry survey covering approximately 47 line-kilometres (1,827 samples) was implemented in early 2008 to further define the extensive Kibi Project gold-in-soil trend. The entire Kibi Project grid was also covered by IP/Resistivity (~ 64 km) and ground magnetometer (~79 km) surveys to help define the lithological and structural pattern of the mineralized trend, and prioritized trench/drill targets. Exploration activities in 2008 also included a manual trenching program encompassing 18 trenches totalling approximately 1,217 linear-metres, including: 4 trenches (302 m) on Zone 2 (TKB006-009); and 14 trenches (915 m) on Zone 3 (TAD008-021) of the 5.5 km long Kibi gold-in-soil trend. In addition, 67 mechanical (i.e. excavator) trenches totalling approximately 2,223 m were also excavated in conjunction with the 2008 and 2009 drilling programs. As part of the ongoing exploration efforts Xtra-Gold commissioned SRK Consulting (Canada) Inc (“SRK”) to conduct a structural study of the Apapam Concession. The goal of the study was to investigate key exposures and available drill core to document and understand the structural controls on gold mineralization at the Kibi Project. SRK reviewed 14 diamond core holes (Zone 1 and 2) as well as available trench exposures (Zone 2 and 3) on the Apapam concession from March 16 to 27, 2010. Due to diamond drilling density and accessible trenches, SRK’s structural study focused largely on Zone 2 of the Kibi Project. SRK also reviewed Xtra-Gold’s geological and structural mapping to date for zones 1, 2 and 3 of the Kibi Project. A petrographic study was also implemented in March 2010 to characterize the lithological units and ore mineralogy of the Kibi Project. A total of 36 thin sections and nine (9) polished sections were studied by Professor K. Dzigbodi-Adjimah of the University of Mines and Technology, Tarkwa, Ghana. The findings of the structural and petrographic studies are incorporated in the property structure and mineralization sections of the technical report, respectively.
XTRA-GOLD RESOURCES CORP. KIBI PROJECT NATIONAL INSTRUMENT 43-101 TECHNICAL REPORT 51
SEMS EXPLORATION SERVICES LTD. JULY 12, 2010
10.3.1 Soil Geochemistry In early 2008, the Kibi Project grid was expanded to provide control for follow-up soil
sampling and geophysical surveys. A total of 54.45 line-kilometres of cross-lines (sample lines) and 2.1 km of baselines were established. The expanded grid now covers the entire north-western portion of the concession with a total of 78.8 line-kilometres of SE-trending cross-lines extending along a 6.1 km baseline.
An extensive soil geochemistry survey was undertaken on the Kibi Project to provide
detailed (100 m) soil sampling coverage of the gold-in-soil anomalies yielded by the Phase I (2006) work program and the bedrock gold occurrences identified in the 2007 trenching, and for reconnaissance (200 m) soil sampling to follow-up on anomalous gold-in-silt samples identified in streams at the south-western extremity of property during the 2006 regional exploration program. A total of 1,827 soil samples were collected at 25 m station spacing along 46.975 line-kilometres of cross lines. Including the Phase I (2006) work program, a total of 2,859 soil samples have been collected on the Kibi Project. Grid establishment and soil sampling methodology is provided in Section 12.1 and Section 12.2, respectively.
Regolith development in most of the Kibi Project area is favourable for soil sampling. As
discussed in Section 7.3.3, the generally steep topography along the flank of the Atewa Range as resulted in relatively thin colluvial (lateritic gravel) cover in the project area. As a result, gold-in-soil anomalies on steeper slopes and ridges probably reflect a good, although not exactly quantitative, measure of gold distribution in the underlying saprolite. Similarly soil sampling has been primarily completed across areas of stronger, positive, topographic relief where alluvial gold deposits are unlikely to have developed. On very steep slopes, the anomalies show some asymmetry due to down-slope dispersion, however the core of these anomalies are not significantly displaced downhill from the source. This close reflection of saprolitic bedrock gold distribution associated with gold-in-soil anomalies developed on steep slopes is demonstrated by trench TAD019, located at the south-eastern extremity of the Zone 3 gold-in-soil anomaly; which returned a channel sample intercept of 4.93 g/t gold over a 45 m trench-length, including 10.12 g/t gold over 12 m, from a 75 m long, 620 ppb to 2,280 ppb target gold-in-soil anomaly. In areas exhibiting less relief and more extensive development of laterite, the resulting geochemical patterns tend to be characterized by much broader dispersion haloes producing gold-in-soil anomalies reaching 200 m or more in width.
The anomalous threshold for the soil sample results was arbitrarily set at 75 ppb gold
based on past exploration experience by Xtra-Gold in the Kibi Greenstone Belt. A total of 666 (23%) out of the 2,859 soil samples returned gold values greater than the 75 ppb anomalous threshold, including: 253 (9%) samples from 76 ppb to 100 ppb gold; 297 (10%) samples from 101 ppb to 250 ppb gold; and 116 (4%) samples above 251 ppb gold (11,410 ppb Au maximum). The expanded Kibi Project soil survey outlined an approximately 5.5 km long, NE-trending, anomalous gold-in-soil trend (“Kibi Project gold-in-soil trend”) characterized by several clusters of anomalous sample values (Figure 10.3.1.A). The typically NE-trending clusters are defined by discontinuous/patchy, greater than 75 ppb gold, anomalous gold-in-soil envelopes ranging from 50 m to 250 m by 900 m to 250 m – 1,200 m by 2,500 m in area.
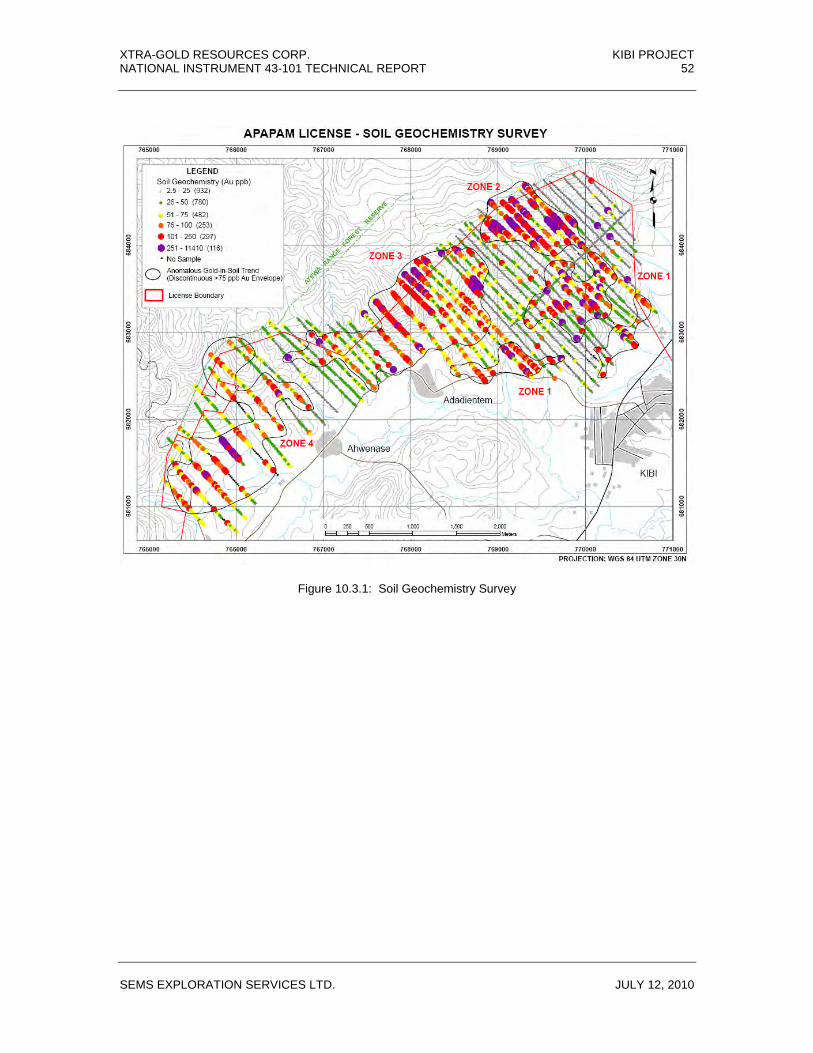
XTRA-GOLD RESOURCES CORP. KIBI PROJECT NATIONAL INSTRUMENT 43-101 TECHNICAL REPORT 52
SEMS EXPLORATION SERVICES LTD. JULY 12, 2010
Figure 10.3.1: Soil Geochemistry Survey

XTRA-GOLD RESOURCES CORP. KIBI PROJECT NATIONAL INSTRUMENT 43-101 TECHNICAL REPORT 53
SEMS EXPLORATION SERVICES LTD. JULY 12, 2010
The Kibi Project gold-in-soil anomalies are considered significant based on the fact that in Ghana soil geochemistry values greater than 50 ppb gold can normally be considered anomalous (Griffis, 2002). For instance in the Obuasi gold camp, AngloGold-Ashanti reportedly follows up all soil anomalies greater than 50 ppb gold by trenching or drilling. At the Ahafo mine project, gold-in-soil anomalies in the 100 ppb to 200 ppb range led to multimillion ounce gold discoveries (Griffis, 2002).
The best indication that the Kibi Project anomalous gold-in-soil trend is considered to be
significant is the fact that trenching and/or drilling of soil anomalies has yielded significant, saprolitic bedrock, gold intercepts in three (3) of the main four (4) anomalous gold-in-soil clusters/envelopes (i.e. Zone 2, Zone 3, Zone 1); with five (5) zones of granitoid-hosted gold mineralization having been discovered to date within the approximately 1,200 m by 500 m to 800 m, Zone 2 gold-in-soil anomaly. The Zone 4 gold-in-soil anomaly has yet to be tested by trenching/drilling but its spatial association with a prominent, linear, high chargeability/low resistivity IP anomaly, and the eluvial/colluvial gravel-characterized, northern portion of the historical, alluvial gold resource Block B renders the area prospective for shear hosted gold mineralization.
10.3.2 Ground Geophysics The entire 5.5 km length of the Kibi Project anomalous gold-in-soil trend was covered by
pole-dipole Induced Polarization (IP)/Resistivity and Magnetometer surveys to help define the lithological and structural pattern of the mineralized trend and prioritized trench/drill targets. The geophysical surveys were implemented in August to September 2008 by Sagax Afrique of Ouagadougou, Burkina Faso.
The approximately 64 line-kilometre IP/Resistivity (Time Domain) survey, covering the
entire extent of the Kibi gold-in-soil trend at 200 m spacing, with some 100 m detail sections centred on known gold showings (38 survey lines), was conducted using a Pole-Dipole Array with a dipole length of 50 m and dipole separations of n = 1 to 6. This survey design should yield an approximate depth of investigation of about 175 to 200 m at n = 6. The ground magnetometer survey covered the entire Kibi Project soil geochemical grid totalling approximately 79 line-kilometres at 12.5 m station readings.
The IP/Resistivity survey identified 2 main resistive domains (Figure 10.3.2.A)
exhibiting a close spatial relationship with the main four (4) gold-in-soil anomalies of the Kibi Project (Zone 1 to 4); the resistive terrain is interpreted to reflect the widespread granitoids and/or carbonate-silica alteration associated with the known gold mineralization. A total of 36 chargeable anomaly axes have been identified (A1 to A36 on Figure 10.3.2.B), including 24 interpreted as priority anomalies; with the majority of these anomalies yet to be field tested. The survey outlined a prominent NE trending, high chargeability, typically with high conductivity (i.e. low resistivity), central corridor possibly reflecting a regional graphite-bearing shear zone. The continuity of the central anomalous chargeability corridor is intermittently dissected by inferred, NW-trending structures; with some exhibiting anomalous geophysical and soil geochemical signatures. The northeast extremity of the anomalous chargeability corridor is associated with a non-magnetic domain (Mag Low) possibly reflecting alteration related magnetite destruction of the host-rock.
XTRA-GOLD RESOURCES CORP. KIBI PROJECT NATIONAL INSTRUMENT 43-101 TECHNICAL REPORT 54
SEMS EXPLORATION SERVICES LTD. JULY 12, 2010
Hydrothermal alteration processes such as silicification and carbonatization typically reduce the porosity and hence increase the resistivity of the rock. The resistivity and conductivity maps greatly reflect the thickness variations of the lateritic weathering profile. These variations mostly correspond to the different structures and geological units in place. For example, faults and shear zones which are more prone to erosion will be associated with a thickening of the clayey weathering, which will be reflected by a local conductor or a conductive zone. Generally, a granitic intrusion which is less porous will be more resistive to weathering; and will appear as a more resistive area than a sedimentary unit. Siliceous units, such as quartz veins and structure controlled silicification, will appear as local resistive anomalies. Graphitic metasediments (i.e. carbonaceous phyllites) will produce a conductive anomaly. On the other hand, a high chargeability response is an indication of the presence of metallic (disseminated) sulphides; but graphite, oxides, and cation-rich clays can also produce a chargeability anomaly. One of the major alteration processes commonly associated with lode gold deposits is sulphidization (i.e. pyritization); which constitutes the target for most IP surveys in gold exploration.
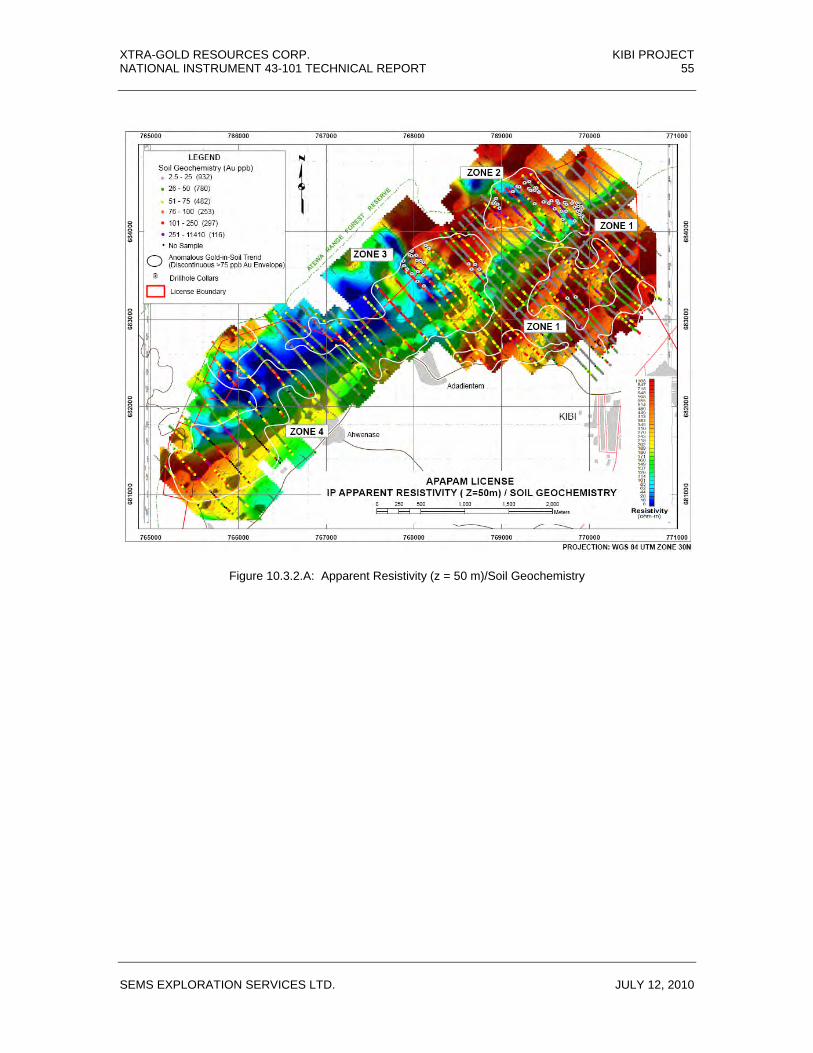
XTRA-GOLD RESOURCES CORP. KIBI PROJECT NATIONAL INSTRUMENT 43-101 TECHNICAL REPORT 55
SEMS EXPLORATION SERVICES LTD. JULY 12, 2010
Figure 10.3.2.A: Apparent Resistivity (z = 50 m)/Soil Geochemistry

XTRA-GOLD RESOURCES CORP. KIBI PROJECT NATIONAL INSTRUMENT 43-101 TECHNICAL REPORT 56
SEMS EXPLORATION SERVICES LTD. JULY 12, 2010
Figure 10.3.2.B: IP/Resistivity Interpretation - Compilation
XTRA-GOLD RESOURCES CORP. KIBI PROJECT NATIONAL INSTRUMENT 43-101 TECHNICAL REPORT 57
SEMS EXPLORATION SERVICES LTD. JULY 12, 2010
Although the widespread granitoid-hosted gold mineralization in Zone 2 is typically characterized by 1-3%, locally up to 5%, disseminated sulphides (pyrrhotite, pyrite, arsenopyrite), the known mineralization occurrences failed to produce a chargeability response. The entire extent of Zone 2 is characterized by a resistive to strongly resistive signature; but individual granitoid bodies are not discernible on the resistivity map. A narrow shear zone exhibiting low grade gold values associated with quartz-carbonate veining, developed within graphitic phyllites in the eastern portion of Zone 2, is spatially associated with a NE-trending, moderate chargeability/moderate resistivity anomaly (i.e. A48). Trenching and drilling observations indicate that the broad, highly chargeable/highly conductive, NE-trending anomaly lying at the southeast extremity of Zone 2 reflects a graphitic metasediment rock sequence (i.e. A1).
The Trench TAD001 to TAD004 granitoid-hosted gold zone located within the north-
central portion of the Zone 3 gold-in-soil anomaly is spatially associated with an approximately 800 m long IP chargeability anomaly exhibiting a spatial relationship with a geophysically inferred, NE-trending, regional structural trend. Limited scout RC drilling along the north-eastern, moderate chargeability/very high resistivity portion (200 m) of the IP anomaly outlined an approximately 135.0 m wide, NE-trending, granitoid hosted, structural corridor appearing to encompass at least five (5) distinct, gold-bearing, sheeted to stockworked vein zones.
Trench TKB003 excavated on the Zone 1 gold-in-soil anomaly exposed a system of
foliation parallel quartz-carbonate-pyrite (+/- arsenopyrite) veins hosted by shear zones developed within a tightly folded metasedimentary rock sequence; spatially associated with a high chargeability/low resistivity IP anomaly lying along a geophysically inferred, NE-trending, regional structural trend (i.e. A11). Scout drilling (KBD08017) of this zone yielded intermittent, exploration significant, anomalous gold values over a 60 m core length, including individual intercepts of 1.43 g/t gold over 13.5 m, 1.04 g/t gold over 6 m and 1.02 g/t gold over 8 m. In addition, trench TKB012 excavated on a gold-in-soil anomaly spatially associated with the southern margin of the same chargeability anomaly, approximately 100 m southwest of hole KBD08017, returned a channel sample intercept of 2.51g/t gold over a 4 m trench length.
The south-western portion of the Kibi Project gold-in-soil trend is characterized by an
approximately 3.5 km long, NE-trending, generally moderate to high chargeability/ moderate to high resistivity anomaly lying along or proximate to the contact between the southern resistive domain and the central conductive corridor; and exhibiting a spatial relationship with a geophysically inferred, NE-trending, regional structural trend (i.e. A19, A23, A30, A34, A35 anomalies).
The south-western segment of the chargeable/resistive anomaly exhibits a spatial
association with the Zone 4 gold-in-soil anomaly and with the northern portion of alluvial gold resource Block B; which according to historical alluvial exploration work consists of eluvial/colluvial gravels rather than alluvial gravels (sensu strict). Eluvial/colluvial gravels consisting of residual material derived by in situ rock weathering or weathering plus gravitational/slump movements, and loose rock/soil material deposited by gravity at the base of a steep slope. The north-eastern extremity of the chargeable/resistive response exhibits a spatial association with the south-western portion of the Zone 3 gold-in-soil anomaly. The central portion of the anomaly is not, for the most part, characterized by an anomalous gold-in-soil signature, which could reflect extensive
XTRA-GOLD RESOURCES CORP. KIBI PROJECT NATIONAL INSTRUMENT 43-101 TECHNICAL REPORT 58
SEMS EXPLORATION SERVICES LTD. JULY 12, 2010
alluvium/colluvium cover at the base of the Atewa Range, but prospecting efforts have identified an extensive gold anomalous float train spatially associated with this section of the IP/Resistivity anomaly (see Section 10.3.3 for mineralized float details).
10.3.3 Prospecting A total of 109 grab samples have been collected by Xtra-Gold during prospecting and
reconnaissance geology traverses primarily designed to follow-up on gold-in-soil anomalies. Sampling included 44 rock floats and 65 in situ samples consisting of saprolitic or saprock (weakly oxidized) bedrock material; with bedrock samples typically collected along road cuts and from historic workings. Eighteen (18) out of the 109 samples returned below detection limit gold values (<0.01 g/t); 63 samples yielded between 0.01-0.10 g/t gold; 20 samples yielded between 0.1-1.0 g/t gold; and eight (8) samples returned between 1.0-7.5 g/t gold. A fair portion of the 28 anomalous grab samples (> 0.1 g/t Au) were collected from areas that were subsequently tested by trenching and/or drilling; so the nature of the mineralization for these samples is covered by the drilling and trenching discussions.
Prospecting identified an extensive gold anomalous float train, exhibiting minimum 550
m x 325 m dimensions, along the south-western margin of the Kibi Project grid area. The float train is spatially associated with the northern flank, of the central portion, of an approximately 3.5 km long, NE-trending, moderate to high chargeability / moderate to high resistivity anomaly associated with a geophysically inferred, NE-trending, regional structural trend (A23 Anomaly on Figure 10.3.2.B). A total of 14 rock samples were collected from the float train, with seven (7) samples yielding anomalous values ranging from 0.16 g/t to 3.49 g/t gold; but including a 7.5 g/t gold value. Mineralized floats are sub-angular to sub-rounded, average 0.15 to 0.75 m in diameter (2.5 m max.), and generally consist of strongly silicified metasedimentary rock (possibly siltstone) cross-cut by sheeted to stockworked quartz stringers; with disseminated limonitic boxworks appearing to be after pyrite.
10.3.4 Trenching Reconnaissance trenching designed to test the geochemical signature at depth of the
approximately 5.5 km long Kibi Project gold-in-soil trend continued in 2008 with the implementation of a manual (i.e. hand dug) trenching program encompassing 18 trenches totalling approximately 1,217 linear-metres, including 4 trenches (302 m) on Zone 2 (TKB006-009) and 14 trenches (915 m) on Zone 3 (TAD008-021). In addition, 67 mechanical (i.e. excavator) trenches totalling approximately 2,223 linear-metres were also excavated in conjunction with the 2008 and 2009 drilling programs, including 58 trenches (1,931 m) on Zone 2; 7 trenches (193 m) on Zone 3 and 2 trenches (99 m) on Zone 1 of the Kibi Project; with this trenching primarily designed to help map/trace the granitoid bodies hosting the gold mineralization.
The reconnaissance trenches designed to test the subsurface signature of the gold-in-soil
anomalies were sampled in their entirety; with a total of 629 channel samples collected. Only a small percentage (12%) of the mechanical trenches were sampled based on the fact that this trenching was predominantly designed to guide the drilling by mapping the contacts of the host granitoid bodies and, to a lesser degree, tracing the known mineralized vein zones. Only eight (8) out of the 67 granitoid mapping trenches were

XTRA-GOLD RESOURCES CORP. KIBI PROJECT NATIONAL INSTRUMENT 43-101 TECHNICAL REPORT 59
SEMS EXPLORATION SERVICES LTD. JULY 12, 2010
subjected to sampling, either in their entirety or partially, for a total of 132 channel samples (205 m). Xtra-Gold has now adopted the practice of completely sampling all trenches regardless of trenching purpose or target. Refer to Section 12.4 for details on trenching and sampling methodology.
10.3.4.1 Zone 2 Trenching A total of 62 trenches (7 m to 136 m) totalling 2,233 linear-metres were
excavated on the approximately 1,200 m by 500 m to 800 m, SE-trending, Zone 2 gold-in-soil anomaly during 2008-2009, including four (4) hand dug, reconnaissance trenches (302 m) and 58 mechanized, granitoid mapping/tracing trenches (1,931 m). For the aforementioned reasons, only five (5) out of the 58 mechanized trenches were sampled. To date, including the 2007 trenching (Section 10.1.2), a total of 106 trenches amounting to approximately 4,530 linear-metres have been excavated on the Kibi Project. Mineralized intercepts reported below are trench-lengths; true width of mineralization is unknown at this time.
Out of the four (4) reconnaissance trenches, only trench TKB006, located in the
north-central portion of the Zone 2 gold-in-soil anomaly, yielded a significant mineralized intercept. Trench TKB006, targeting a 120 ppb to 385 ppb gold-in-soil anomaly, returned a mineralized intercept of 1.46 g/t gold over 36.0 m, including 2.20 g/t gold over 17.0 m, from an extensive, granitoid-hosted, quartz vein system. Four (4) out of the five (5) mechanized trenches subjected to sampling returned significant mineralized intercepts (see Table 2 for significant trench results). Trench TKB010, designed to trace the mineralization intersected in scout drill hole KBD08008, at the north-western extremity of the Zone 2 gold-in-soil anomaly, returned a mineralized intercept of 1.29 g/t gold over 42.0 m, including 2.26 g/t gold over 13.0m, from an extensive system of NE to NW-trending quartz-carbonate veining developed along the margin of a tonalitic intrusive body. For comparison purposes, RC borehole KBRC09068, designed to undercut trench TKB010, yielded a mineralized intercept of 76.0 m grading 1.62 g/t gold, including 20.0 m grading 3.36 g/t gold.
Trenches TKB014E and TKB014F, targeting a gold-in-soil anomaly spatially
associated with a quartz float train, lying approximately 225 m west-northwest of the trench TKB006 gold occurrence, exposed an auriferous, granitoid-hosted, quartz-carbonate vein network. The two (2) trenches, positioned end to end on the same soil geochemical anomaly line, both returned significant channel sample intercepts separated by an approximately 20.5 m distance, including 8.49 g/t gold over a 5.0 m trench-length, including 2.0 m grading 14.85 g/t gold, in trench TKB014E and 6.86 g/t gold over an 8.0 m trench-length, including 1.0 m grading 22.4 g/t gold, in trench TKB014F.
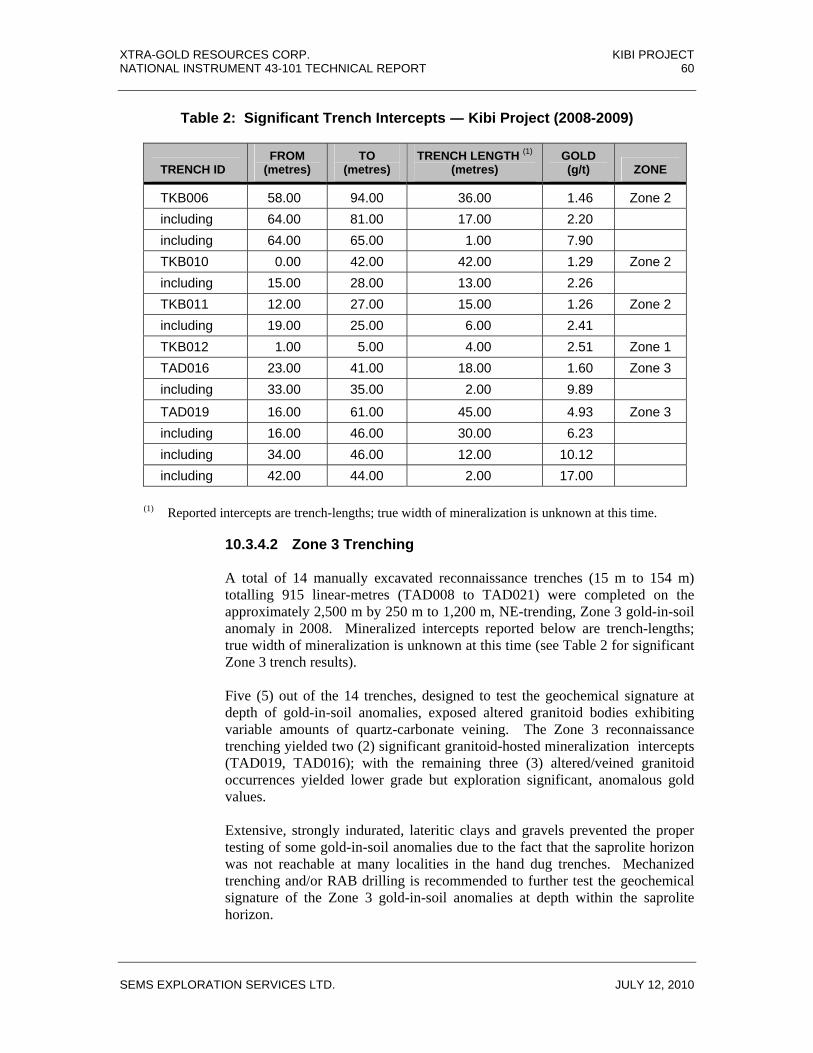
XTRA-GOLD RESOURCES CORP. KIBI PROJECT NATIONAL INSTRUMENT 43-101 TECHNICAL REPORT 60
SEMS EXPLORATION SERVICES LTD. JULY 12, 2010
Table 2: Significant Trench Intercepts ― Kibi Project (2008-2009)
TRENCH ID FROM
(metres) TO
(metres) TRENCH LENGTH (1)
(metres) GOLD (g/t) ZONE
TKB006 58.00 94.00 36.00 1.46 Zone 2 including 64.00 81.00 17.00 2.20 including 64.00 65.00 1.00 7.90 TKB010 0.00 42.00 42.00 1.29 Zone 2 including 15.00 28.00 13.00 2.26 TKB011 12.00 27.00 15.00 1.26 Zone 2 including 19.00 25.00 6.00 2.41 TKB012 1.00 5.00 4.00 2.51 Zone 1 TAD016 23.00 41.00 18.00 1.60 Zone 3 including 33.00 35.00 2.00 9.89
TAD019 16.00 61.00 45.00 4.93 Zone 3 including 16.00 46.00 30.00 6.23 including 34.00 46.00 12.00 10.12 including 42.00 44.00 2.00 17.00
(1) Reported intercepts are trench-lengths; true width of mineralization is unknown at this time. 10.3.4.2 Zone 3 Trenching A total of 14 manually excavated reconnaissance trenches (15 m to 154 m)
totalling 915 linear-metres (TAD008 to TAD021) were completed on the approximately 2,500 m by 250 m to 1,200 m, NE-trending, Zone 3 gold-in-soil anomaly in 2008. Mineralized intercepts reported below are trench-lengths; true width of mineralization is unknown at this time (see Table 2 for significant Zone 3 trench results).
Five (5) out of the 14 trenches, designed to test the geochemical signature at
depth of gold-in-soil anomalies, exposed altered granitoid bodies exhibiting variable amounts of quartz-carbonate veining. The Zone 3 reconnaissance trenching yielded two (2) significant granitoid-hosted mineralization intercepts (TAD019, TAD016); with the remaining three (3) altered/veined granitoid occurrences yielded lower grade but exploration significant, anomalous gold values.
Extensive, strongly indurated, lateritic clays and gravels prevented the proper
testing of some gold-in-soil anomalies due to the fact that the saprolite horizon was not reachable at many localities in the hand dug trenches. Mechanized trenching and/or RAB drilling is recommended to further test the geochemical signature of the Zone 3 gold-in-soil anomalies at depth within the saprolite horizon.

XTRA-GOLD RESOURCES CORP. KIBI PROJECT NATIONAL INSTRUMENT 43-101 TECHNICAL REPORT 61
SEMS EXPLORATION SERVICES LTD. JULY 12, 2010
Trench TAD019, targeting a 620 ppb to 2,280 ppb gold-in-soil anomaly (75 m), lying at the south-eastern extremity of the Zone 3 gold-in-soil trend, returned a mineralized intercept of 4.93 g/t gold over 45 m, including 10.12 g/t gold over 12 m, from an extensive, granitoid-hosted, quartz vein system; ranging from NE-trending, moderately NW-dipping, sheeted quartz veins to stockwork veining. For comparison purposes, RC borehole KBRC09019, designed to undercut trench TAD019, yielded a mineralized intercept of 30.0 m grading 3.52 g/t gold, including 14.0 m grading 6.47 g/t gold, from a down-hole depth of 8.0 m. The north-western extremity of trench TAD007 (2007 work program), located approximately 65 m west-southwest of the trench TAD019 mineralization intercept, also yielded a significant granitoid-hosted mineralization intercept of 0.49 g/t gold over 26 m. A zone of granitoid-hosted, northerly trending, quartz veining (2 to 75 cm) exposed in trench TAD016, in the north-central portion of the Zone 3 gold-in-soil anomaly, returned an intercept of 1.60 g/t gold over 18 m, including 9.89 g/t gold over 2 m.
11. Drilling 11.1 General To date, 68 boreholes totalling 7,716 linear metres have been drilled on the Apapam Concession; including 18 diamond core holes and 50 reverse circulation (“RC”) holes. The 2008-2009 drilling by Xtra-Gold is the first ever drilling conducted in the Apapam Concession area and, along with the 2006 Newmont Mining drilling further to the northeast (see Section 15 - Adjacent Properties), represents the only known drilling within the Kibi Greenstone Belt. The Xtra-Gold drilling focused on the Kibi Project consisting of an over 5.5 km long mineralized trend delineated from gold-in-soil anomalies, trenching, drilling, and geophysical interpretations along the northwest margin of the Apapam Concession; and characterized by widespread gold occurrences of the granitoid hosted-type. 11.2 Drill Programs The initial scout drilling program (the “Phase I Drill Program”) encompassed 18 diamond core boreholes ranging from 60 m to 320.5 m in length, and totalling 3,001 linear metres. The diamond drilling was conducted from August 30 to October 28, 2008 by Burwash Drilling of Cobble Hill, British Columbia, Canada utilizing a skid mounted Longyear 38 drill rig. The Phase I Drill Program was designed to test the depth continuity and character of gold mineralization discovered in reconnaissance trenches excavated on Zone 2 and Zone 1 of the Kibi Project; including 15 holes on Zone 2 and 3 holes on Zone 1 (Figure 11.2).

XTRA-GOLD RESOURCES CORP. KIBI PROJECT NATIONAL INSTRUMENT 43-101 TECHNICAL REPORT 62
SEMS EXPLORATION SERVICES LTD. JULY 12, 2010
Figure 11.2: Borehole Trace/Zone Location Plan
XTRA-GOLD RESOURCES CORP. KIBI PROJECT NATIONAL INSTRUMENT 43-101 TECHNICAL REPORT 63
SEMS EXPLORATION SERVICES LTD. JULY 12, 2010
Based on encouraging Phase I drilling results, a follow-up drill program (the “Phase II Drill Program”) encompassing 50 RC holes, ranging from 40 m to 150 m in length, and totaling 4,715 linear metres, was implemented on the Kibi Project from July 14 to September 26, 2009. The RC drilling was conducted by BLY Ghana Ltd., a subsidiary of Boart Longyear, utilizing an MPD1500 crawler mounted drill rig. The Phase II Drill Program was designed to: (i) test the dip and strike extensions of the four (4) gold target zones identified in Zone 2 of the Kibi Project during the Phase I Drill Program; (ii) assess the depth continuity and character of gold mineralization discovered in reconnaissance trenches excavated in Zone 3; and (iii) test IP/Resistivity anomalies spatially associated with the Kibi Project anomalous gold-in-soil trend. The program included 27 follow-up holes totaling 2,478 m on Zone 2 and 23 initial scout holes totaling 2,237 m on Zone 3. 11.3 Drilling Methodology Diamond drill core was HQ size (63.5 mm diameter) in upper oxidized material (regolith) and NQ2 size (50.6 mm diameter) in the lower fresh rock portion of the hole. RC drilling was typically conducted with a 5-¾ inch diameter bit; but reduction to 5-½ inch or 5-¼ inch diameter bits was on occasion required due to rock hardness and/or increasing hole depth. Core from five (5) of the 18 diamond drill holes was oriented utilizing the Ezy-Mark core orientation device. All boreholes (except for 3 holes) have been downhole surveyed (azimuth/inclination) at nominal 30 m interval utilizing an electronic single shot survey instrument; with the diamond drill and RC holes surveyed with the Flexit and Reflex EZ-Shot tools, respectively. Out of the 68 boreholes, two (2) diamond drill holes were only subjected to dip surveys using the acid etch method due to electronic survey tool technical difficulties, and one (1) short RC hole (62 m) was not subjected to any type of downhole survey due to ground collapse. The borehole survey azimuth measurements have been converted from magnetic north to geographic (true) north utilizing a magnetic declination factor of -4o (i.e. 4o West). Drill casings (PVC pipe) were left in all boreholes; with the casing secured in place by a concrete base. All borehole collars have been accurately located with a high degree of confidence by a professional surveyor from SEMS Exploration Services Ltd. A network of permanent survey benchmarks (concrete pillars) was established along the Kibi Project area utilizing a Differential GPS (DGPS). Individual borehole collars were subsequently tied-in to the survey hubs with a total station theodolite; with collar positions established in UTM coordinates using datum WGS84 Zone 30 North. The sampling and logging procedures, and sample quality assessment, followed during the diamond core and RC drilling programs are detailed in Sections 12 and 14, respectively. 11.4 Drilling Results 11.4.1 General Drilling efforts to date have focused on the Kibi Project consisting of an over 5.5 km long
mineralized trend delineated from gold-in-soil anomalies, trenching, drilling, and geophysical interpretations along the northwest margin of the Apapam Concession; and characterized by widespread gold occurrences of the granitoid hosted-type. Zone 2 of the Kibi Project, with 42 boreholes totalling 4,981 m, is the more advanced in terms of

XTRA-GOLD RESOURCES CORP. KIBI PROJECT NATIONAL INSTRUMENT 43-101 TECHNICAL REPORT 64
SEMS EXPLORATION SERVICES LTD. JULY 12, 2010
distribution/extent of the granitoid-hosted gold mineralization and characterization of the mineralization’s lithological and structural controls; with drilling to date on Zone 3 limited to 23 broadly spaced scout holes (2,237 m).
The relatively limited drilling has intermittently traced the granitoid-hosted gold
mineralization over an approximately 2,100 m distance along the NE-trending Kibi Project mineralized trend, including over an approximately 975 m distance in Zone 2; and over an approximately 825 m distance in Zone 3. To date, five (5) mineralized granitoid zones have been identified on Zone 2 with individual zones having been traced by drilling over approximately 150 m to 230 m strike lengths, and from surface to a maximum vertical depth of approximately 100 m; with all zones remaining open along both strike and dip.
All reported mineralized intercepts are core-lengths; true width of mineralization is
unknown at this time. Granitoid sill/dykes exhibit highly variable dip attitudes and 3D geometry so additional work is required to define their attitude in order to establish systematic drilling directions in order to determine the true-widths of the respective mineralization zones. Similarly, insufficient work has been conducted to determine if the numerous, variably trending, mineralized granitoid bodies identified to date represent fold and/or fault-related repetitions or distinct bodies. Some granitoid bodies with presently undefined margins (open-ended) may represent small plutons (stocks) which could host more extensive stockwork-type mineralization. At present, due to the limited surface exposures and relatively broad spacing of drill holes, correlation of lithologies between surface exposures and/or between surface exposures and drilling data often remains unclear.
References to “Significant” and “Anomalous” drill intercepts satisfy the following
protocols adapted by Xtra-Gold: “Significant Intercepts” satisfy the following criteria: greater than (>) 5.0 gram gold x metre product and > 0.5 grams per tonne (g/t) gold. “Anomalous” signifies at least one intercept > 2.0 gram gold x metre product and > 0.25 g/t gold. Intercepts are constrained with a 0.25 g/t gold minimum cut-off grade at the top and bottom of the intercept, with a 50 g/t upper cut-off grade applied, and a maximum of five (5) consecutive metres of internal dilution (less than 0.25 g/t gold). All internal intervals yielding above 10 g/t gold are indicated within the intercept.
11.4.2 Drilling Results – Zone 2 – Kibi Project
Forty-two (42) boreholes totaling 4,981 m have been drilled on Zone 2 of the Kibi Project, including 15 diamond core holes (2,503 m); and 27 RC holes (2,478 m). Thirty (30) out of the 42 holes returned significant granitoid-hosted gold mineralization intercepts (see Section 11.4.1 for “Significant” intercept criteria). Drilling focused on five (5) zones of granitoid-hosted gold mineralization (i.e. Trench TKB005 Zone) within the approximately 1,200 m by 500 m to 800 m, SE-trending Zone 2 gold-in-soil anomaly (Figures 11.4.2.A and 11.4.2.B).
11.4.2.1 Trench TKB005 Zone Thirteen (13) boreholes have been drilled on the Trench TKB005 granitoid
zone, lying at the eastern extremity of the approximately 1,200 m long Zone 2 gold-in-soil anomaly, including diamond core holes KBD08001 to KBD08004 and KBD08010 to KBD08011; and RC holes KBRC09042 to KBRC09047 and KBRC09051.

XTRA-GOLD RESOURCES CORP. KIBI PROJECT NATIONAL INSTRUMENT 43-101 TECHNICAL REPORT 65
SEMS EXPLORATION SERVICES LTD. JULY 12, 2010
Figure 11.4.2.A: Zone 2 – 2008/2009 – Significant Drill Intercept Plan

XTRA-GOLD RESOURCES CORP. KIBI PROJECT NATIONAL INSTRUMENT 43-101 TECHNICAL REPORT 66
SEMS EXPLORATION SERVICES LTD. JULY 12, 2010
Figure 11.4.2.B: Zone 2 – 2008/2009 Drill Intercepts – Surface Geology
XTRA-GOLD RESOURCES CORP. KIBI PROJECT NATIONAL INSTRUMENT 43-101 TECHNICAL REPORT 67
SEMS EXPLORATION SERVICES LTD. JULY 12, 2010
Trenching and drilling indicate that the Trench TKB005 zone mineralization is hosted by a northerly trending, moderately (east) dipping to sub-vertical, tabular, quartz diorite body ranging from approximately 5 m to 15 m in width; exhibiting variably developed shallow to moderate (NW, SW, N) dipping to sub-vertical, quartz-carbonate-albite stockwork veining. To date, gold mineralization at the Trench TKB005 zone has been traced by drilling over an approximately 220 m strike length and to a vertical depth of approximately 75 m. Current trenching/drilling observations appear to indicate that the granitoid sill/dyke is pinching out to the north; while at its southern extremity it appears to be expanding in width or possibly flaring-up into a stock-like body.
With the exception of holes KBD08001and KBD08002, which were drilled in
the wrong direction and failed to intersect the host intrusive body, all remaining 11 boreholes targeting the Trench TKB005 zone yielded granitoid-hosted gold mineralization intercepts ranging from 2.29 g/t gold over 2.0 m to 6.29 g/t gold over 23.0 m (See Table 4 for complete intercept listing). The two (2) aforementioned, SE-trending boreholes, reflecting the initial scout drilling to test the Trench TKB005 target, were unintentionally drilled sub-parallel to the footwall of the moderately (east) dipping granitoid sill/dyke based on the fact that this drilling was originally designed to cross-cut the westerly dipping veining observed in the trench; with subsequent trenching/drilling confirming that the westerly dipping veining was hosted/confined within the easterly dipping granitoid body. Hole KBD08001 intersected two (2) narrow quartz-carbonate veins within mafic metavolcanic rock, proximate to the granitoid body contact, returning 8.77 g/t gold and 13.65 g/t gold over 1.0 m core lengths, respectively. KBD08002 did not return any exploration significant gold values.
RC holes KBRC09042 and KBRC09047 drilled in a scissor pattern designed to
better define the structural controls of the mineralization within the central portion of the zone, immediately adjacent to trench TKB005, returned intercepts of 2.97 g/t gold over 18.0 m, including 6.32 g/t gold over 8.0 m; and 6.29 g/t gold over 23.0 m, including 8.55 g/t gold over 10.0 m, respectively. Hole KBRC09042 (270° Az/-50° dip) intersected the saprolitic quartz diorite intrusive at approximately right angles from a collar position on the eastern (hanging wall) flank of the host granitoid body. While hole KBRC09047 (090° Az/-55° dip) was drilled down the dip of the host granitoid sill/dyke in order to transect the predominantly, westerly dipping quartz veining at approximately right angles, with the hole remaining within the confines of the host granitoid body to a down hole depth of 23 m. Hole KBD08004 which tested the same section at a deeper level yielded an intercept of 8.49 g/t gold over 12.0 m at a vertical depth of approximately 75 m; within non-oxidized (fresh) quartz diorite.
11.4.2.2 Trench TKB004 Zone Eleven (11) boreholes have been drilled on the Trench TKB004 granitoid zone,
lying within the eastern portion of the approximately 1,200 m long Zone 2 gold-in-soil anomaly, including diamond core holes KBD08012 to KBD08015 and RC holes KBRC09048 to KBRC09050 and KBRC09053 to KBRC09056.

XTRA-GOLD RESOURCES CORP. KIBI PROJECT NATIONAL INSTRUMENT 43-101 TECHNICAL REPORT 68
SEMS EXPLORATION SERVICES LTD. JULY 12, 2010
Eight (8) out of the 11 holes yielded granitoid-hosted gold mineralization intercepts ranging from 7.53 g/t gold over 1.0 m to 1.44 g/t gold over 78 m, including 3.26 g/t gold over 13.0 m (see Table 4 for complete intercept listing). To date, granitoid-hosted gold mineralization has been traced by drilling over an approximately 230 m strike length and to a vertical depth of approximately 100 m.
Trenching and drilling observations appear to indicate that the Trench TKB004
zone mineralization is hosted by an east-southeast to southeast trending granitoid sill/dyke swarm or irregularly shaped granitoid body encompassing metasediment/metavolcanic rock rafts. Mineralized material is characterized by strongly veined (stockwork) granitoid exhibiting moderate-strong, semi-pervasive to pervasive quartz-carbonate-chlorite-sericite alteration; with associated patchy to pervasive sulphidization in the form of disseminated pyrrhotite, pyrite, and arsenopyrite (+/- sphalerite). The veining, alteration, and mineralization are generally restricted to within and immediately adjacent to the granitoid bodies.
RC holes KBRC09055 and KBRC09056 drilled in a scissor pattern designed to
better define the lithological and structural controls of the gold mineralization within the central portion of the Trench TKB004 granitoid zone returned intercepts of 1.44 g/t gold over 78 m, including 3.26 g/t gold over 13.0 m; and 1.33 g/t gold over 18.0 m, including 3.08 g/t gold over 6.0 m, and 2.01 g/t gold over 20.0 m, including 4.29 g/t gold over 6.0 m, respectively. Additional trenching/drilling is required to better define the distribution/extent of the granitoid bodies; with correlation of lithologies between surface exposures and/or between surface exposures and drilling data currently remaining unclear.
11.4.2.3 Trench TKB006 Zone Eight (8) boreholes have been drilled on the Trench TKB006 zone, located in
the north-central portion of the approximately 1,200 m long Zone 2 gold-in-soil anomaly, including diamond core holes KBD08005 to KBD08007 and RC holes KBRC09057, KBRC09059 to KBRC09061 and KBRC09065.
Trenching and drilling to date appear to indicate that gold mineralization at the
Trench TKB006 zone is hosted by two (2), NNW-trending, sub-parallel, granitoid sills/dykes lying approximately 25 m apart within a metasediment/metavolcanic rock sequence. Additional work is required to better define the dip attitudes and 3D geometry of the granitoid bodies, and hence the true width of the host intrusive bodies; but in general the sill/dykes appear to be approximately 8 m and 40 m in surface expression (i.e. apparent width), and exhibit a moderate westerly dip. Drilling to date has traced the Trench TKB006 zone gold mineralization over an approximately 160 m north-northwest strike distance.
The east trending KBRC09060 borehole, targeting an extensive system of
shallow to moderate westerly dipping quartz veining developed within the wider, eastern granitoid body, returned an intercept from surface of 39.0 m grading 9.23 g/t gold uncut (3.54 g/t gold cut), including 10.0 m grading 33.15

XTRA-GOLD RESOURCES CORP. KIBI PROJECT NATIONAL INSTRUMENT 43-101 TECHNICAL REPORT 69
SEMS EXPLORATION SERVICES LTD. JULY 12, 2010
g/t gold uncut (10.95 g/t gold cut). The initial SE-trending, scout drill hole KBD08005, drilled sub-parallel to the granitoid body from a collar position to the north of hole KBRC09060, returned intercepts of 1.18 g/t gold over 17.0 m and 1.02 g/t gold over 15.0 m. Hole KBRC09065 collared at the northern extremity of the zone yielded an intercept of 2.40 g/t gold over 3.0 m, including 4.87 g/t gold over 1.0 m.
Exploration significant mineralization in hole KBRC09057, drilled to the west
from the eastern flank of the granitoid body as part of a scissor drill pattern with KBRC09060, was limited to a single, near surface, 1.0 m intercept of 2.03 g/t gold; with the hole appearing to have passed below the shallow to moderately west dipping vein system. Similarly, hole KBRC09064 also drilled in a westerly direction from the eastern flank of the granitoid to the north of KBRC09057, failed to intersect the mineralized vein system; returning no exploration significant gold values. Holes KBD08007 and KBRC09059 targeting the narrower, western granitoid body returned intercepts of 1.02 g/t gold over 13.0 m, and 0.65 g/t gold over 9.0 m, respectively.
11.4.2.4 Trench TKB014E–14F Zone Drilling on the Trench TKB014E-14F occurrence, located approximately 225 m
west-northwest of the Trench TKB006 zone, is limited to three (3) RC holes (KBRC09062 to KBRC09064).
The SE-trending KBRC09062 hole designed to undercut a granitoid hosted,
gold-bearing vein network, discovered in trenches TKB014E and TKB014F, yielded a mineralized intercept of 4.03 g/t gold over 4.0 m including 1 m grading 9.32 g/t gold. The two (2) target trenches positioned end to end on the same soil geochemical anomaly line both returned significant channel sample intercepts separated by an approximately 20.5 m distance, including 8.49 g/t gold over a 5.0 m trench-length, including 2.0 m grading 14.85 g/t gold, in trench TKB014E and 6.86 g/t gold over an 8.0 m trench-length, including 1.0 m grading 22.4 g/t gold, in trench TKB014F. Additional trenching/drilling is required to define the extent and orientation of the host granitoid body, and hence of the mineralized vein system. This occurrence is considered especially interesting given the values defined at this early stage and the extent of the untested gold-in-soil anomalies present along lines 167N to L169N within the approximately 400 m gap between the neighbouring Trench TKB006 and TKB010 zones.
The remaining two (2) holes were drilled as a SW-trending drill fence to test a
moderate-high chargeability/low resistivity IP anomaly lying to the southwest of the trench TKB014E-14F gold zone. Hole KBRC09063 yielded a weak mineralized intercept of 0.98 g/t gold over 2.0 m and hole KBRC09064 failed to return any exploration significant anomalous values. Intervals of carbonaceous (graphitic) schist intersected in hole KBRC09064 appear to explain the chargeability anomaly.

XTRA-GOLD RESOURCES CORP. KIBI PROJECT NATIONAL INSTRUMENT 43-101 TECHNICAL REPORT 70
SEMS EXPLORATION SERVICES LTD. JULY 12, 2010
11.4.2.5 Trench TKB010 Zone Drilling on the Trench TKB010 zone, located at the north-western extremity of
the approximately 1,200 m long Zone 2 gold-in-soil anomaly, is limited to four (4) boreholes, including diamond core holes KBD08008 and KBD08009; and RC holes KBRC0906 and KBRC09068.
Hole KBRC09068 targeting an extensive system of NE to NW trending quartz
veining exposed in Trench TKB010 returned a granitoid-hosted gold mineralization intercept from surface of 76.0 m grading 1.62 g/t gold, including 20.0 m grading 3.36 g/t gold (and including 5.25 g/t gold over 9.0 m). For reference purposes, Trench TKB010 yielded a channel sample intercept of 1.29 g/t gold over 42 m, including 2.26 g/t gold over 13.0 m.
Other significant drill intercepts from this zone include 1.01 g/t gold over 45.0
m, including 2.01 g/t gold over 12.0 m, in initial scout drill hole KBD08008; and 1.16 g/t gold over 5.0 m and 1.99 g/t gold over 4.0 m, including 5.76 g/t gold over 1 m, in borehole KBRC09067. Hole KBD08009 returned a weak mineralized intercept of 1.37 g/t gold over 3.0 m from a narrow granitoid sill/dyke lying along the northern flank of the main TKB010 zone granitoid body.
Drilling and trenching to date have traced the Trench TKB010 gold zone
mineralization over an approximately 150 m distance along the inner, northern margin of an east to southeast trending granitoid body. Additional trenching/drilling is required to further define the trend of the northern contact of the host granitoid body, and hence of the Trench TKB010 mineralized vein system, and to test the yet to be located southern boundary of the granitoid intrusive body which could also host mineralization.

XTRA-GOLD RESOURCES CORP. KIBI PROJECT NATIONAL INSTRUMENT 43-101 TECHNICAL REPORT 71
SEMS EXPLORATION SERVICES LTD. JULY 12, 2010
Table 3: Significant Drill Intercepts – Kibi Project Zone 2 – Zone 1
Diamond Core Holes KBD08001 to KBD08018 Reverse Circulation Holes KBRC09042 to KBRC09068
INTERVALS (metres)
HOLE ID
FROM
TO
CORE LENGTH (1)
GOLD (g/t)
TARGET
ZONE (trench)
DIAMOND CORE DRILLING: ZONE 2
KBD08001 107 108 1 8.77 TKB005
KBD08001 132 133 1 13.65
KBD08002 no significant results TKB005
KBD08003 22.5 35 12.5 2.04 TKB005
including 22.5 24 1.5 5.51
including 29 32 3 3.65
KBD08004 76 88 12 8.49 TKB005
including 76 77 1 28.50
including 77 78 1 42.40
including 80 85 5 5.64
KBD08005 22 39 17 1.18 TKB006
including 33 39 6 2.04
KBD08005 45 60 15 1.02
KBD08006 116 117 1 31.30 TKB006
KBD08007 65 78 13 1.02 TKB006
including 72 76 4 2.06
KBD08008 15 60 45 1.01 TKB010
including 37 49 12 2.01
KBD08009 no significant results TKB010
KBD08010 47 54 7 4.83 TKB005
KBD08010 58 59 1 9.58
KBD08011 106 116 10 1.01 TKB005
including 115 116 1 4.53
KBD08012 46.6 72 25.4 2.11 TKB004
including 63 72 9 3.95
(including) 63 64 1 13.60
KDB08013 72 87 15 0.87 TKB004

XTRA-GOLD RESOURCES CORP. KIBI PROJECT NATIONAL INSTRUMENT 43-101 TECHNICAL REPORT 72
SEMS EXPLORATION SERVICES LTD. JULY 12, 2010
INTERVALS (metres) HOLE ID
FROM
TO
CORE LENGTH (1)
GOLD (g/t)
TARGET
ZONE (trench)
DIAMOND CORE DRILLING: ZONE 2
KBD08013 96 129 33 1.28
including 98.3 105 6.7 2.40
including 122 128 6 2.70
KBD08014 115 131 16 2.24 TKB004
including 116 126 10 3.23
KBD08015 20 35 15 2.78 TKB004
including 27 34 7 5.06
(including) 32 33 1 9.48
KBD08015 42 45 3 2.37
KBD08015 63 64 1 16.40
DIAMOND CORE DRILLING: ZONE 1
KBD08016 no significant results TKB001/Adit
KBD08017 82.5 96 13.5 1.43 TKB003
KBD08017 115 121 6 1.04
KBD08017 135 143 8 1.02
KBD08018 no significant results TKB002
REVERSE CIRCULATION DRILLING: ZONE 2
KBRC09042 19 37 18 2.97 TKB005
including 23 31 8 6.32
(including) 23 24 1 13.90
(including) 28 29 1 12.70
KBRC09043 23 34 11 2.27 TKB005
including 25 29 4 5.27
KBRC09044 25 27 2 2.29 TKB005
KBRC09045 22 32 10 2.48 TKB005
including 22 26 4 4.05
KBRC09046 41 54 13 1.04 TKB005
including 41 44 3 2.24
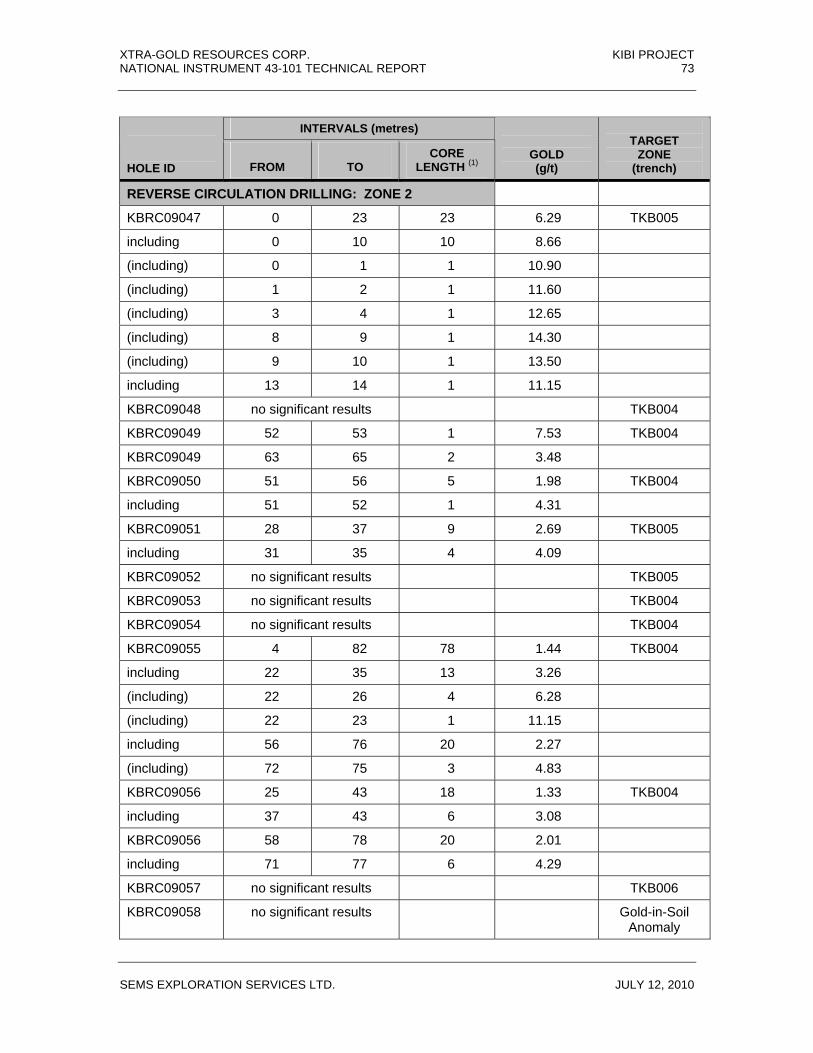
XTRA-GOLD RESOURCES CORP. KIBI PROJECT NATIONAL INSTRUMENT 43-101 TECHNICAL REPORT 73
SEMS EXPLORATION SERVICES LTD. JULY 12, 2010
INTERVALS (metres) HOLE ID
FROM
TO
CORE LENGTH (1)
GOLD (g/t)
TARGET
ZONE (trench)
REVERSE CIRCULATION DRILLING: ZONE 2
KBRC09047 0 23 23 6.29 TKB005
including 0 10 10 8.66
(including) 0 1 1 10.90
(including) 1 2 1 11.60
(including) 3 4 1 12.65
(including) 8 9 1 14.30
(including) 9 10 1 13.50
including 13 14 1 11.15
KBRC09048 no significant results TKB004
KBRC09049 52 53 1 7.53 TKB004
KBRC09049 63 65 2 3.48
KBRC09050 51 56 5 1.98 TKB004
including 51 52 1 4.31
KBRC09051 28 37 9 2.69 TKB005
including 31 35 4 4.09
KBRC09052 no significant results TKB005
KBRC09053 no significant results TKB004
KBRC09054 no significant results TKB004
KBRC09055 4 82 78 1.44 TKB004
including 22 35 13 3.26
(including) 22 26 4 6.28
(including) 22 23 1 11.15
including 56 76 20 2.27
(including) 72 75 3 4.83
KBRC09056 25 43 18 1.33 TKB004
including 37 43 6 3.08
KBRC09056 58 78 20 2.01
including 71 77 6 4.29
KBRC09057 no significant results TKB006
KBRC09058 no significant results Gold-in-Soil Anomaly
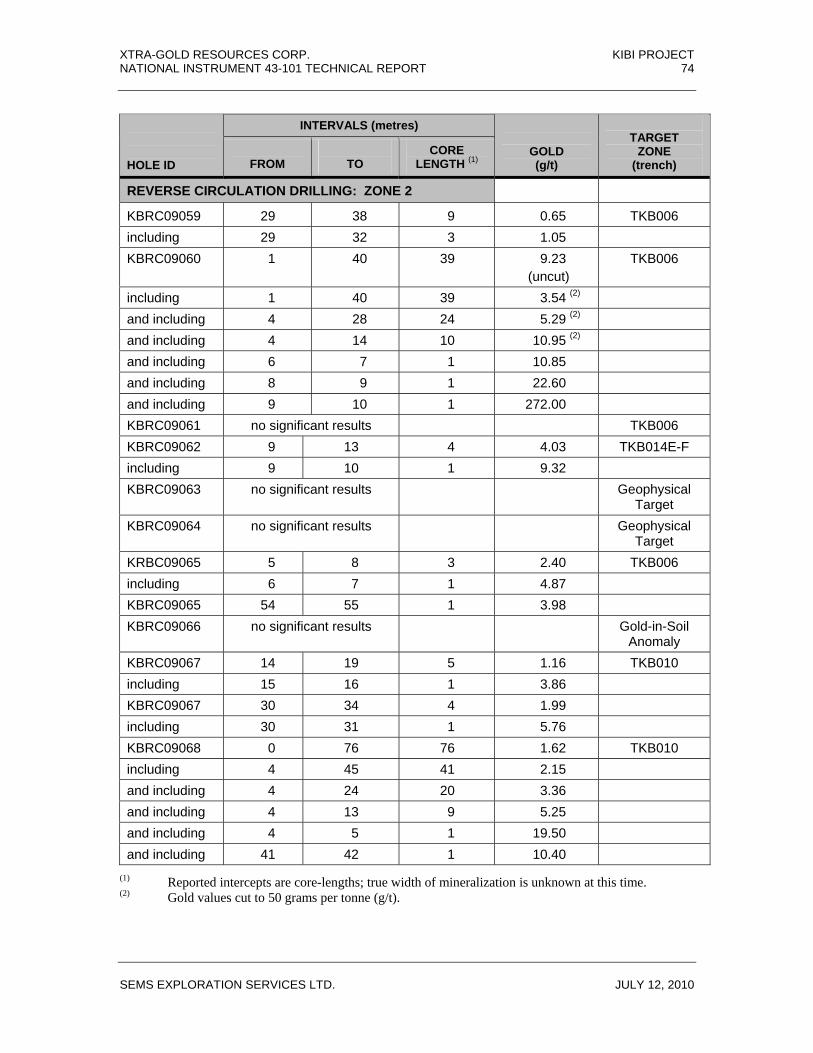
XTRA-GOLD RESOURCES CORP. KIBI PROJECT NATIONAL INSTRUMENT 43-101 TECHNICAL REPORT 74
SEMS EXPLORATION SERVICES LTD. JULY 12, 2010
INTERVALS (metres) HOLE ID
FROM
TO
CORE LENGTH (1)
GOLD (g/t)
TARGET
ZONE (trench)
REVERSE CIRCULATION DRILLING: ZONE 2
KBRC09059 29 38 9 0.65 TKB006 including 29 32 3 1.05 KBRC09060 1 40 39 9.23
(uncut) TKB006
including 1 40 39 3.54 (2) and including 4 28 24 5.29 (2) and including 4 14 10 10.95 (2) and including 6 7 1 10.85 and including 8 9 1 22.60 and including 9 10 1 272.00 KBRC09061 no significant results TKB006 KBRC09062 9 13 4 4.03 TKB014E-F including 9 10 1 9.32 KBRC09063 no significant results Geophysical
Target KBRC09064 no significant results Geophysical
Target KRBC09065 5 8 3 2.40 TKB006 including 6 7 1 4.87 KBRC09065 54 55 1 3.98 KBRC09066 no significant results Gold-in-Soil
Anomaly KBRC09067 14 19 5 1.16 TKB010 including 15 16 1 3.86 KBRC09067 30 34 4 1.99 including 30 31 1 5.76 KBRC09068 0 76 76 1.62 TKB010 including 4 45 41 2.15 and including 4 24 20 3.36 and including 4 13 9 5.25 and including 4 5 1 19.50 and including 41 42 1 10.40
(1) Reported intercepts are core-lengths; true width of mineralization is unknown at this time. (2) Gold values cut to 50 grams per tonne (g/t).
XTRA-GOLD RESOURCES CORP. KIBI PROJECT NATIONAL INSTRUMENT 43-101 TECHNICAL REPORT 75
SEMS EXPLORATION SERVICES LTD. JULY 12, 2010
Additional Notes: (a) “Significant Intercepts” satisfy following criteria: greater than (>) 5.0 gram gold x metre product
and > 0.5 grams per tonne (g/t) gold. Intercepts constrained with a 0.25 g/t gold minimum cut-off grade at the top and bottom of the intercept, with a 50 g/t upper cut-off grade applied, and a maximum of five (5) consecutive metres of internal dilution (less than 0.25 g/t gold). All internal intervals yielding above 10 g/t gold are indicated within the intercept.
11.4.3 Drilling Results – Zone 3 – Kibi Project Twenty-three (23) scout RC holes totaling 2,237 m were drilled on Zone 3 of the Kibi
Project during the 2009 Phase II Drill Program (i.e. holes KBRC09019 to KBRC09041). This initial drilling campaign was designed to undercut surface gold mineralization exposed in reconnaissance trenches, and to test geophysical IP/Resistivity and /or gold-in-soil anomalies on Zone 3; an approximately 2,500 m by 250 m to 1,200 m, NE-trending gold-in-soil anomaly located approximately 700 m to the southwest of the main Zone 2 drilling area.
The Zone 3 drilling included five (5) holes to test the Trench TAD019 and TAD007
targets located at the south-eastern extremity of the Zone 3 gold-in-soil anomaly and 18 holes to assess the Trench TAD001 to TAD004, TAD015 to TAD021 and TAD016 targets within the north-central portion of the gold-in-soil anomaly. Fourteen (14) out of the 23 scout holes returned significant gold intercepts, with an additional three (3) holes yielding anomalous gold intercepts (see Section 11.4.1 for “Significant” and “Anomalous” intercept criteria). All mineralized intercepts consisted of granitoid-hosted and/or granitoid-associated gold mineralization, with mineralized material typically consisting of altered quartz diorite and tonalite exhibiting quartz-iron carbonate veining and disseminated sulphides.
Drilling highlights for Zone 3 include gold mineralization intercepts of 30.0 m grading
3.52 g/t gold, including 14.0 m grading 6.47 g/t gold, from a down hole depth of 8.0 m in hole KBRC09019; 4.0 m grading 4.86 g/t gold from a down hole depth of 26 m in hole KBRC09023 and 8.0 m grading 4.95 g/t gold, including 3.0 m grading 12.89 g/t gold, from surface in hole KBRC09024. Drilling results for Zone 3 are summarized below and significant gold intercepts for holes KBRC09019 to KBRC09041 are set forth in Table 5.
11.4.3.1 Trench TAD019 Zone Hole KBRC09019 targeting an extensive granitoid-hosted vein system, ranging
from NE-trending, moderately NW-dipping, sheeted quartz veins to stockwork veining, discovered in Trench TAD019 returned a significant mineralized intercept of 30.0 m grading 3.52 g/t gold, including 14.0 m grading 6.47 g/t gold, from a down hole depth of 8.0 m. For reference purposes, Trench TAD019 yielded a channel sample intercept of 4.93 g/t gold over 45.0 m including 10.12 g/t gold over 12.0 m. Hole KBRC09039, representing the second hole of a scissor drill pattern designed to determine the dip attitude of the host granitoid body, returned an intercept of 39.80 g/t gold over 1.0 m from a quartz vein in mafic metavolcanic rock along the footwall flank of the granitoid body. Hole KBRC09020 targeting a zone of anomalous gold values in Trench TAD007, located approximately 65.0 m to the west of the
XTRA-GOLD RESOURCES CORP. KIBI PROJECT NATIONAL INSTRUMENT 43-101 TECHNICAL REPORT 76
SEMS EXPLORATION SERVICES LTD. JULY 12, 2010
KBRC09019 collar, yielded granitoid-hosted mineralization intercepts of 1.01 g/t gold over 3.0 m and 4.10 g/t gold over 2.0 m. Holes KBRC09040 and KBRC09041 which also tested the Trench TAD007 target failed to return any exploration significant gold values.
11.4.3.2 Trench TAD001-TAD004 Zone A total of 18 holes were drilled within the north-central portion of the Zone 3
gold-in-soil anomaly which is characterized by an approximately 800 m long IP Chargeability anomaly exhibiting a spatial relationship with a geophysically inferred, NE-trending, regional structural trend. Eleven (11) of these holes tested the north-eastern, moderate chargeability/very high resistivity portion (200 m) of the IP anomaly exhibiting a coincidental gold-in-soil signature and anomalous trench results, i.e. Trench TAD001-TAD004 Zone.
The limited, shallow RC drilling outlined an approximately 135.0 m wide, NE-
trending, granitoid hosted, structural corridor appearing to encompass at least five (5) distinct, gold-bearing, sheeted to stockworked vein zones ranging from 1.0 m to 31.0 m in core length. Eight (8) out of the 11 Trench TAD001-TAD004 Zone holes returned significant gold intercepts, including seven (7) holes yielding multiple significant and/or anomalous gold intercepts.
The mineralized structural corridor is characterized by significant gold
intercepts over 1.0 m to 8.0 m core lengths occurring within more extensive, lower grade, mineralization envelopes attaining 15.0 m to 31.0 m in core length. Holes KBRC09024 and KBRC0937, intersecting what appears to be the same vein zone approximately 35.0 m horizontally apart within the central section of the structural corridor returned mineralized intercepts of 8.0 m grading 4.95 g/t gold, including 3.0 m grading 12.89 g/t gold, and 28.0 m grading 0.87 g/t gold, respectively. Similarly, holes KBRC09023 and KBRC09038, drilled in a scissor pattern along the northern margin of the structural corridor, yielded 4.0 m grading 4.86 g/t gold and 31.0 m grading 0.57 g/t gold, respectively from intercepts located approximately 8.0 m horizontally apart along the same mineralized structure.
Thirteen (13) out of the 18 holes described above were drilled on open ground
along the northern flank of the Apapam ML, with the drill traces extending from approximately 50.0 m to 300.0 m outside the concession boundary, and two (2) additional holes straddle the concession boundary. Following the completion of a professional land survey, the approximately 1.42 sq km wedge of open ground lying between the Apapam ML and the Atewa Forest Reserve boundary was staked by Xtra-Gold to cover the mineralization targets identified by the holes in question. The staking application was formally received by Mincom on November 19, 2009 and is currently being processed, thus securing Xtra-Gold’s priority staking status; however, there is no absolute assurance that this parcel of ground will be granted to Xtra-Gold. See Table 5 for the claim status of individual Zone 3 drill holes.

XTRA-GOLD RESOURCES CORP. KIBI PROJECT NATIONAL INSTRUMENT 43-101 TECHNICAL REPORT 77
SEMS EXPLORATION SERVICES LTD. JULY 12, 2010
Table 4: Significant Drill Intercepts – Kibi Project Zone 3 – RC Holes KBRC09019 to KBRC09041
INTERVALS (metres)
HOLE ID
FROM
TO
CORE LENGTH (1)
GOLD (g/t)
TARGET
ZONE (trench)
CLAIM STATUS
KBRC09019 12 42 30 3.52 TAD019 Mining Lease
including 16 33 14 6.47
and including 26 30 4 14.27
and including 16 17 1 15.00
and including 26 27 1 19.10
and including 29 30 1 25.10
KBRC09020 36 39 3 1.01 TAD007 Mining Lease
KBRC09020 58 60 2 4.10
KBRC09021 5 14 9 0.94 TAD001-004 Staking Application (2)
including 5 6 1 4.92
KBRC09021 30 36 6 0.74
KBRC09022 no significant results TAD014 Staking Application (2)
KBRC09023 26 30 4 4.86 TAD001-004 Staking Application (2)
KBRC09023 36 42 6 0.42
KBRC09024 0 8 8 4.95 TAD001-004 Staking Application (2)
including 0 1 1 32.90
KBRC09024 24 46 22 0.29
KBRC09024 73 74 1 3.12
KBRC09025 22 29 7 0.91 TAD014 Staking Application (2)
KBRC09026 no significant results TAD001-004 Staking Application (2)
KBRC09027 27 42 15 1.18 TAD001-004 Staking Application (2)
including 34 37 3 4.09
KBRC09027 62 68 6 1.03
KBRC09028 48 60 12 0.25 TAD001-004 Staking Application (2)

XTRA-GOLD RESOURCES CORP. KIBI PROJECT NATIONAL INSTRUMENT 43-101 TECHNICAL REPORT 78
SEMS EXPLORATION SERVICES LTD. JULY 12, 2010
INTERVALS (metres)
HOLE ID
FROM
TO
CORE LENGTH (1)
GOLD (g/t)
TARGET
ZONE (trench)
CLAIM STATUS
KBRC09028 76 85 9 0.52
KBRC09029 5 35 30 0.84 TAD001-004 Staking Application (2)
including 5 9 4 2.00
KBRC09029 70 75 5 0.82
KBRC09030 30 43 13 0.67 TAD016 Mining Lease
including 31 36 5 1.21
KBRC09030 59 70 11 0.42
including 68 70 2 1.59
KBRC09031 19 26 7 0.74 TAD015-021 Mining Lease
including 22 24 2 1.63
KBRC09032 126 146 20 0.33 TAD015-021 Mining Lease
including 126 132 6 0.66
KBRC09033 no significant results TAD016 Staking Application (2)/ Mining Lease
KBRC09034 4 9 5 0.54 Gold-in-Soil Anomaly
Staking Application (2)/ Mining Lease
KBRC09035 no significant results TAD001-004 Staking Application (2)
KBRC09036 1 20 19 0.67 TAD001-004 Staking Application (2)
including 5 13 8 1.00
KBRC09037 3 10 7 0.36 TAD001-004 Staking Application (2)
KBRC09037 47 75 28 0.87
including 47 53 6 1.99
KBRC09038 61 92 31 0.57 TAD001-004 Staking Application (2)
including 61 70 9 1.01
and including 62 63 1 3.64
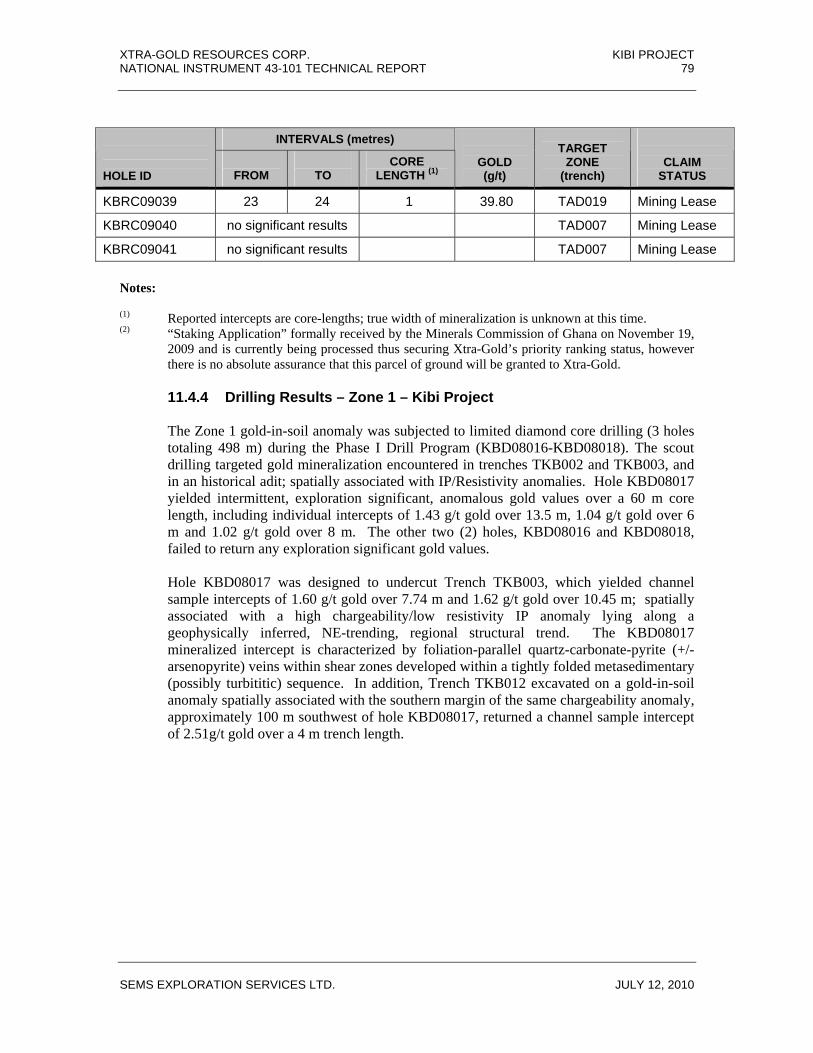
XTRA-GOLD RESOURCES CORP. KIBI PROJECT NATIONAL INSTRUMENT 43-101 TECHNICAL REPORT 79
SEMS EXPLORATION SERVICES LTD. JULY 12, 2010
INTERVALS (metres)
HOLE ID
FROM
TO
CORE LENGTH (1)
GOLD (g/t)
TARGET
ZONE (trench)
CLAIM STATUS
KBRC09039 23 24 1 39.80 TAD019 Mining Lease
KBRC09040 no significant results TAD007 Mining Lease
KBRC09041 no significant results TAD007 Mining Lease
Notes: (1) Reported intercepts are core-lengths; true width of mineralization is unknown at this time. (2) “Staking Application” formally received by the Minerals Commission of Ghana on November 19,
2009 and is currently being processed thus securing Xtra-Gold’s priority ranking status, however there is no absolute assurance that this parcel of ground will be granted to Xtra-Gold.
11.4.4 Drilling Results – Zone 1 – Kibi Project The Zone 1 gold-in-soil anomaly was subjected to limited diamond core drilling (3 holes
totaling 498 m) during the Phase I Drill Program (KBD08016-KBD08018). The scout drilling targeted gold mineralization encountered in trenches TKB002 and TKB003, and in an historical adit; spatially associated with IP/Resistivity anomalies. Hole KBD08017 yielded intermittent, exploration significant, anomalous gold values over a 60 m core length, including individual intercepts of 1.43 g/t gold over 13.5 m, 1.04 g/t gold over 6 m and 1.02 g/t gold over 8 m. The other two (2) holes, KBD08016 and KBD08018, failed to return any exploration significant gold values.
Hole KBD08017 was designed to undercut Trench TKB003, which yielded channel
sample intercepts of 1.60 g/t gold over 7.74 m and 1.62 g/t gold over 10.45 m; spatially associated with a high chargeability/low resistivity IP anomaly lying along a geophysically inferred, NE-trending, regional structural trend. The KBD08017 mineralized intercept is characterized by foliation-parallel quartz-carbonate-pyrite (+/- arsenopyrite) veins within shear zones developed within a tightly folded metasedimentary (possibly turbititic) sequence. In addition, Trench TKB012 excavated on a gold-in-soil anomaly spatially associated with the southern margin of the same chargeability anomaly, approximately 100 m southwest of hole KBD08017, returned a channel sample intercept of 2.51g/t gold over a 4 m trench length.

XTRA-GOLD RESOURCES CORP. KIBI PROJECT NATIONAL INSTRUMENT 43-101 TECHNICAL REPORT 80
SEMS EXPLORATION SERVICES LTD. JULY 12, 2010
12. Sampling Approach and Methodology 12.1 Control Grid Establishment The control grid for the Kibi Project was established by AMOFAH and Associates, a Ghanaian civil engineering firm with over 20 years’ experience in mining grid establishment. The theodolite controlled baselines and cross-lines (i.e. sample lines) were pegged at 25 m intervals; with aluminum tags indicating the grid coordinates of the respective sample stations secured to the wooden pegs. Labelled concrete pillars were established every 200 m along the baselines. Individual sample stations along the baselines and sample lines were surveyed-in by Differential GPS (DGPS) in UTM coordinates utilizing Datum WGS84 Zone 30 North. The NW-SE trending sample lines were oriented to dissect the interpreted NE-trending stratigraphy as close to possible to a normal angle. 12.2 Soil Sampling Soil samples are collected by teams of local labourers and experienced technicians under the supervision of a geologist. Samples are collected from hand-dug pits at depths of 50 cm to 60 cm with normal diameters not exceeding 30 cm using the local digging tool called “soso”. Approximately 2.5 kg of material is collected into labeled plastic bags with unique sample tickets stapled to inside lip of the bag, and securely sealed by staples. To avoid contamination wet samples and areas with readily apparent soil transport/disturbance are not sampled. See Section 14 - Data Verifications for sample QA-QC procedures for soil samples and all other sampling methods described in the present section. 12.3 Auger Sampling Hand auger sampling is routinely utilized to test the geochemical signature of gold-in-soil anomalies at depth within the saprolite horizon in order to better define trenching targets. The augering is carried out with a locally fabricated cutting tool made from a used drill rod; the cylindrical cutting edge being driven into the ground to recover the sample. A collar pit (~1m deep) is dug at each auger site in order to facilitate penetration through the quartz scree typically present at surface. Auger holes are typically sunk to a depth of 3 to 5 m. A one (1) m sample is typically collected from the saprolite horizon at the bottom of each hole. Auger hole spacing is typically at 25 m, with some 12.5 m in-filling. To avoid any contamination only dry samples are collected. 12.4 Trench and Road Cut Sampling Manual (pickaxe and shovel) and mechanical (excavator) trenches are typically excavated to widths of 1 m and 1.5 m, respectively, and an average depth of 3 m, with some sections of trenches reaching 4 to 5 m in depth. Trenching typically extends down to the saprolite horizon, or locally to saprock, but often the saprolite cannot be reached due to safety concerns. The entire length of the trench is subjected to systematic geological mapping and channel sampling; with wooden pegs stuck to the side of the trench at 2 m intervals. Prior to sampling the wall of the trench is cleaned of any loose material to avoid contamination.

XTRA-GOLD RESOURCES CORP. KIBI PROJECT NATIONAL INSTRUMENT 43-101 TECHNICAL REPORT 81
SEMS EXPLORATION SERVICES LTD. JULY 12, 2010
Samples consist of continuous, horizontal channels excavated along the bottom sidewall of the trench (~ 0.10 m above floor) with emphasis on constant sample volume over the length of the sample interval. Saprolite/rock chips are collected on a clean plastic sheet laid on the trench floor and immediately placed into a labeled plastic sample bag containing a unique sample ticket stapled to the inside lip of the bag, and securely sealed by staples. Figure 12.4 depicts channel sampling of a trench on the Apapam Concession. Samples are typically 2 m in length; with 1 m, to locally 0.5 m, samples being utilized in areas of geological interest and/or to delineate specific lithological/structural features. Any economically significant mineralized intersection yielded by 2 m sampling is re-sampled at 1 m intervals (this procedure implemented in 2010 sampling programs). The sample intervals (i.e. sample numbers) are marked on aluminum tags stapled to wooden pegs stuck to the sidewall of the trench. Samples are collected by a trained field assistant under the supervision of a company geologist. Road cut and drill pad face samples are collected using the same general methodology as the trench channel samples. First pass exploration trenches are located by tying-in the trench start and end points to the DGPS surveyed grid stations, or by hand held GPS readings if no grid is present, and azimuth and slope information collected by compass/inclinometer. Typically, any trenching in hilly terrain (> 10o slope) is excavated utilizing step-like benches in order to maintain horizontal sampling intervals. Since January 2010, trenches yielding significant mineralization and/or forming part of a detailed trenching program have been surveyed utilizing combined DGPS and Total Station defined control points. The survey crew also systematically record azimuth and slope measurements.
Figure 12.4: Channel Sampling in Trench at Apapam Concession
12.5 Drill Core Sampling Diamond drill core is HQ size (63.5 mm diameter) in upper oxidized material (regolith) and NQ size (47.6 mm diameter) in the lower fresh rock portion of the hole. Drill core obtained from diamond drilling is deposited directly from the core tube into wooden core boxes, marked with

XTRA-GOLD RESOURCES CORP. KIBI PROJECT NATIONAL INSTRUMENT 43-101 TECHNICAL REPORT 82
SEMS EXPLORATION SERVICES LTD. JULY 12, 2010
the borehole number and depth information, by the drill contractor under the supervision of trained Xtra-Gold technicians. In the case of saprolite material, the core is laid directly onto a strip of plastic wrap placed inside the box and then securely wrap around the core to stabilize and prevent the dehydration of the saprolite. Core recovery and any drilling problems are noted by company staff at the drill site. At the Field Camp core shack, the core is laid out along an angle iron on a work bench and meticulously re-assembled piece by piece. The core is then measured, core recovery and RQD information collected, and photographs of each individual box taken. A company geologist subsequently conducts geological logging of the core and marks the sample intervals. The core is sampled over nominal 1 m intervals; with adjustments where necessary for mineralized structures. Metal tags indicating the sample intervals (i.e. sample numbers) are stapled to the inside of the core box channels. More comprehensive geological logging (on half core) and petrographic studies are subsequently conducted after the reception of assays on significant gold intercepts. The diamond drill core is then saw-split lengthwise by trained Xtra-Gold personnel, and half the core is immediately placed into a labelled plastic bag with a unique sample ticket stapled to the inside lip of the bag, and securely sealed by staples. The remaining half of core is returned to the core box and the box stored in a secure facility. The samples are then laid-out in sequence in the designated sample room to avoid duplications and omissions of samples in the laboratory submission orders, and the sample bags placed in labelled rice sacks in sequence. The shipping sacks are immediately secured with a numbered security seal (i.e. nylon zap strap) and stored in a locked room pending shipment to the laboratory. 12.6 Reverse Circulation (“RC”) Drill Sampling Reverse circulation (5-½ inch diameter) drill samples are collected immediately at the borehole site under the supervision of an Xtra-Gold geologist. RC drilling is conducted under dry ground conditions to prevent sample contamination. Additional compressed air booster is routinely used in order to ensure dry samples below the water table. However, on occasion, drilling is conducted under wet conditions over short intervals at the bottom of holes for geological information purposes; the wet cuttings are collected and sampled but the samples are not considered to be representative of the drill intervals. The drill sample cuttings are collected in a cyclone over 1 m sample intervals; with the cyclone being purged after every 6 m drill run (i.e. hit with sledge hammer and air blown). The dry RC bulk chip sample (~ 25 to 30 kg) is passed through a two-tier riffle splitter to produce a nominal 2 to 3 kg sample for assay. The assay sample was weighted on site however the RC bulk chip samples were not weighted during the 2009 RC drill program. The splitter is thoroughly cleaned by hitting with a wooden club and a wire brush after every sample. The split sample is immediately placed into a labelled plastic bag with a unique sample ticket stapled to the inside lip of the bag, and securely sealed by staples. The remaining portion of the bulk drill chip samples are then stored in large, labelled plastic bags at the drill site for future reference. Drill cuttings from each sample interval are screened-washed and a “Quick Log” of the rock chips completed at the drill site by an Xtra-Gold geologist; noting amongst other things the sample quality/recovery, weathering profile, main lithologies, prominent alteration, and the character of the mineralization (i.e. oxide versus sulphide). Representative rock chips are also collected into a plastic sample tray for subsequent detail geological logging of the borehole by a

XTRA-GOLD RESOURCES CORP. KIBI PROJECT NATIONAL INSTRUMENT 43-101 TECHNICAL REPORT 83
SEMS EXPLORATION SERVICES LTD. JULY 12, 2010
senior geologist with the aid of a binocular microscope. The logging of RC holes is also recorded on a logging board, where the chips for each metre interval are glued to a board to form a visual strip log of the entire hole. Upon transport to the Field Camp by Xtra-Gold personnel at the end of the drill shift the samples are laid-out in sequence in a designated sample room to avoid duplications and omissions of samples in the laboratory submission orders, and the sample bags placed in labelled polyweave sacks in sequence. These sacks are immediately secured with a numbered security seal (i.e. nylon zap strap) and stored in a locked room pending shipment to the laboratory. The bulk reference samples for significant gold intercepts are subsequently transported to the Field Camp for safe keeping. 12.7 Geological/Analytical Data Management Xtra-Gold Resources utilizes the Century Systems Technologies Inc. geological data management system for the collection, reporting and management of its geological/analytical data. The integrated software system allows Xtra-Gold to manage all drill hole/trench, surface sampling, and Quality Control data from one location including managing reporting, analysis, and exporting data to GIS or modeling packages. Fusion Server: Fusion Server provides for one central location for the administration and
storage of all data (drill hole, samples, QA-QC, etc) in one central database.
DH Logger: Complete drill hole/trench data capture and management with embedded
QC (Quality Control) Management. Fully customizable interface for all types of geological data collection and management including geological, geochemical and geotechnical.
Lab import: Lab Import permits direct import of sample results from a commercial
laboratory. Lab import checks the contents of the file for errors, validates sample numbers and directly imports samples, field QC and lab QC into the database. Lab import automatically performs QC checks and presents a control chart showing the QC for that analytical batch.
Sample Station: Complete surface sample data capture and management with integrated
QC. Stores all data for rock, soil, and stream samples. All data is validated on input and all sample data is stored and can be reported on and used in Mine Modeling and GIS systems.
Query Builder: A querying tool to extract data from the Fusion Database. Includes
querying, graphing and reporting capabilities. The QC Charting Wizards plots for Standards, Duplicates, Lab Checks, Thompson Howarth, etc are quickly generated with the push of a button.

XTRA-GOLD RESOURCES CORP. KIBI PROJECT NATIONAL INSTRUMENT 43-101 TECHNICAL REPORT 84
SEMS EXPLORATION SERVICES LTD. JULY 12, 2010
13. Sample Preparation, Analyses and Security 13.1 Sample Preparation and Analysis Two (2) main laboratories (ALS Chemex and SGS Laboratory Services) have been used by Xtra-Gold for assaying samples from the Kibi Project since 2006. Since mid-September 2008, sample preparation and analysis for all of Xtra-Gold’s samples for the Kibi Project, including the 2008 core drilling and 2009 RC drilling programs, trench channel, soil, and surface chip/grab samples has been conducted by ALS Chemex (ALS Ghana Limited) at their analytical facility located in Kumasi, Ghana. ALS Chemex laboratory operations are covered by ISO 9001:2000 certification for the “provision of assay and geochemical analytical services” by QMI Quality Registrars, and are accredited to ISO 17025 standards in various jurisdictions. The quality system and work procedures used in the Kumasi laboratory are identical to those used in the ALS Chemex laboratory in Vancouver, Canada and are subject to regular internal audits by their global quality assurance team. The Kumasi laboratory also participates in a number of proficiency tests and round robins. Drill core, RC chip, trench channel, hand auger, and prospecting (grab) samples are analyzed for gold by industry standard 50 gm fire assay fusion with atomic absorption spectroscopy (AAS) finish; with gravimetric finish on samples exceeding 10 g/t gold. 13.1.1 ALS Chemex Sample Preparation and Analysis On reception at the laboratory, samples were sorted and numbers compared with the
sample submission sheet. The presence of missing or extra samples was reported by e-mail to Xtra-Gold. The consignment was assigned a job number followed by labelling, by laboratory number, using the GEMS laboratory information management system (LIMS). All original sample bags received a label produced by LIMS. In the event of bag damage, samples were replaced in a new bag and the situation was reported to Xtra-Gold. Flow charts for Fire Assay and Screen Fire Assay are shown in Figures 13.1.1.A and 13.1.1.B.
Each sample was placed in a clean stainless steel drying pan, together with any
identifying sample tag contained in the bag. The entire sample was then dried under thermostatically controlled conditions at 110o centigrade. The dry sample was weighed and crushed to nominally 70% passing –-2 mm (-10#) by Terminator crusher.
From the crushed diamond core, approximately 250g was sub-sampled by a two-sided
splitter. This 250 gm was pulverized to 85% passing - 200# (75μ). After pulverizing, a Kraft envelope, identified by LIMS label, was used to scoop the pulverised material for analysis. Pulp reject was discarded.
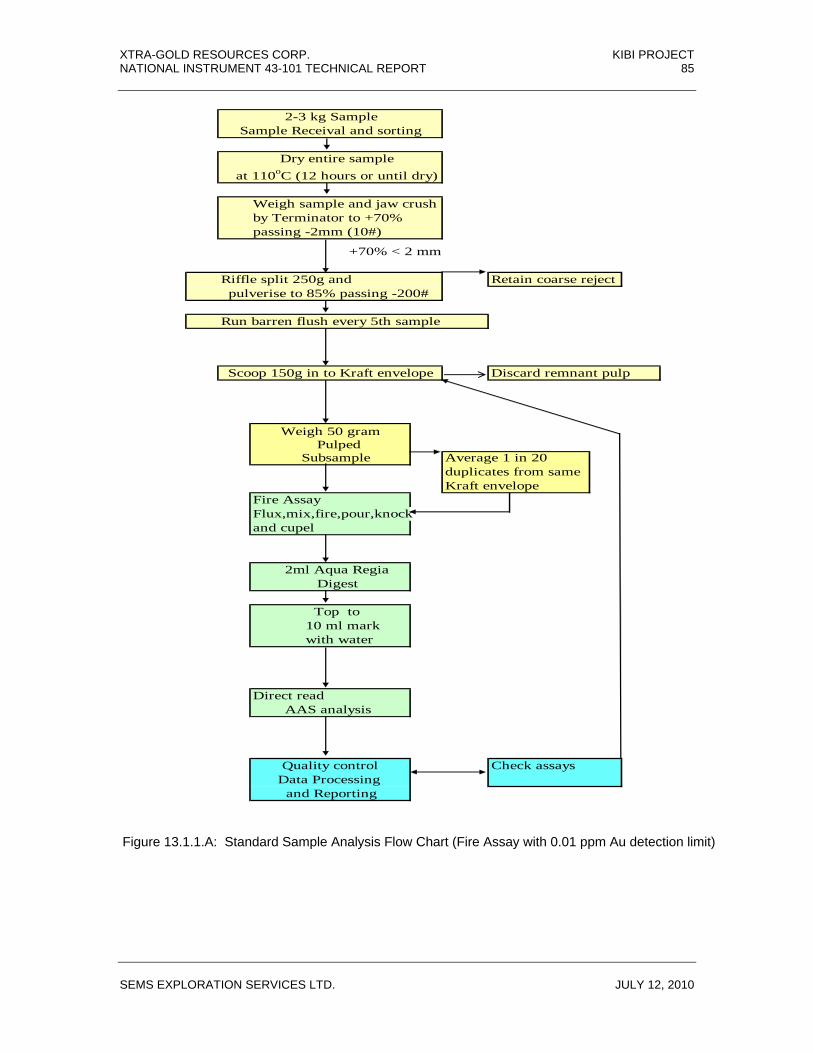
XTRA-GOLD RESOURCES CORP. KIBI PROJECT NATIONAL INSTRUMENT 43-101 TECHNICAL REPORT 85
SEMS EXPLORATION SERVICES LTD. JULY 12, 2010
2-3 kg SampleSample Receival and sorting
Dry entire sample at 110oC (12 hours or until dry)
Weigh sample and jaw crushby Terminator to +70%passing -2mm (10#)
+70% < 2 mm
Riffle split 250g and Retain coarse rejectpulverise to 85% passing -200#
Run barren flush every 5th sample
Scoop 150g in to Kraft envelope Discard remnant pulp
Weigh 50 gramPulped
Subsample Average 1 in 20 duplicates from sameKraft envelope
Fire AssayFlux,mix,fire,pour,knockand cupel
2ml Aqua RegiaDigest
Top to 10 ml mark with water
Direct readAAS analysis
Quality control Check assays Data Processing and Reporting
Figure 13.1.1.A: Standard Sample Analysis Flow Chart (Fire Assay with 0.01 ppm Au detection limit)

XTRA-GOLD RESOURCES CORP. KIBI PROJECT NATIONAL INSTRUMENT 43-101 TECHNICAL REPORT 86
SEMS EXPLORATION SERVICES LTD. JULY 12, 2010
2-3 kg SampleSample Receival and sorting
Dry entire sample at 110oC (12 hours or until dry)
Weigh sample and jaw crushby Terminator to +70%passing -2mm (10#)
+70% < 2mm
Riffle split +1000g and Bag and retain coarse rejectpulverise to 85% passing -200#
Run barren flush every 5th sample
Matroll and weigh 1 kg Discard remnant pulp
Wet sieve 1kg using -200# (-75 micron)
screen
Collect all oversize and dryCollect all undersize and dry
Fire all oversizeDissaggregate, homogeniseand Fire 2 x 50g sub-samples from the undersize
Fire Assay andAAS determination of Au
Quality control Check assays Data Processing (Undersize) and Reporting
Report all oversize Fireresults with weight used, and both undesize results
Figure 13.1.1.B: Screen Fire Assay Standard Sample Analysis Flow Sheet

XTRA-GOLD RESOURCES CORP. KIBI PROJECT NATIONAL INSTRUMENT 43-101 TECHNICAL REPORT 87
SEMS EXPLORATION SERVICES LTD. JULY 12, 2010
Samples varied in total weight from approximately 2 to 3 kg. With a 3 kg sample, splitting involved four (4) stages. Samples for assay were alternately selected from the left and right splitter pans (See Audit Report: App. 17). Coarse reject material was placed in the original bag, with LIMS label, and stored in rice sacks pending removal by Xtra-Gold. In 2009, the splitting protocol was revised. With RC chips, 1kg was split after crushing and pulverised. In the Weighing Section, 50 gm was weighed from the Kraft envelope and placed in a plastic bag within a Fire Assay pot (weighing utilized the LIMS catch-weight system where the actual weight varied between the limits 47-53 gm). Duplicate samples were taken from the original pulp envelope and analysed with a frequency of 1:20. Duplicates were not taken from the coarse reject material. Flux had previously been added to the Fire Assay pot with a flux-sample ratio of 3:1. Copper wire was added to three pots to effect a “Copper map”. Samples were fired in batches or 84 at 1,100oC for one hour. In each batch, ALS introduces three duplicates, one (1) blank and two (2) standards. After pouring and “knocking”, lead buttons were cupelled at 950oC for one (1) hour. The resultant “prill” was placed in a test tube using tweezers. A “Copper map” guided orientation and numbering of the prill location. Digestion entailed the addition of 0.5ml concentrated chemical grade HNO3 and heating at 90oC for 15 minutes. This was followed by the addition of 0.5ml 60% HCL and further digestion for 10 minutes. The test tubes were covered by cling film to minimise possible loss due to evaporation. Initially, digestion used a microwave oven at low energy. This method was discontinued in favour of a water bath with thermometer control. After digestion, the liquor was made up to the 4 ml mark followed by direct read of Au using a Varian AA240 spectrometer. The spectrometer was calibrated at the start, middle and end of each run to determine possible short-term calibration drift. The aspiration tube was purged with distilled water and wiped with a tissue between each sample. Reagent blanks were also used during the run to validate detection level and also test the efficiency of the Deuterium tube. All results were transferred electronically to the Reporting Chemist; there was no manual transfer. At the reporting stage, checks were selected in the event of a non-sequence (0.01, 0.01, 1.2, 0.01) or to validate high values. All results = >10 ppm Au were identified by LIMS and these samples were subject to gold determination by gravimetric method. ALS uses international standards manufactured by Rocklabs. For ppm work, seven (7) different standards cover the range 0.6-7.71 ppm Au for 50g Fire Assay. One (1) standard of 13.65 ppm is used for gravimetric determinations. In the event that one internal standard in a batch fails by more than + 2 standard deviations, re-assay of 10 samples either side of the failed standard is performed. These results, together with the new result for the re-assay standard, are entered in the hard copy for Xtra-Gold. In the event that both internal standards fail, the entire batch is re-analysed. With respect to internal standards, ALS is self-regulating. For this reason, control charts in this report relate to the standard deviation achieved by the laboratory and not the standard deviation proposed by the manufacturer. The LIMS is connected directly to the Internet enabling Xtra-Gold to download results and monitor progress of work. Hard copy results reported to Xtra-Gold are shown in three columns; Col.1: Original result, Col. 2: Check assay and Col. 3 Gravimetric result. Duplicates, laboratory blanks and internal standards are reported on a separate sheet.

XTRA-GOLD RESOURCES CORP. KIBI PROJECT NATIONAL INSTRUMENT 43-101 TECHNICAL REPORT 88
SEMS EXPLORATION SERVICES LTD. JULY 12, 2010
13.2 Sample Security and Chain of Custody Reverse circulation drill samples are collected immediately at the borehole site under the supervision of a company geologist which escorts the samples back to the Field Camp at the end of the shift. Drill core samples are saw-split and bagged under the supervision of a company geologist in a sample cutting room located adjacent to the core shack at the exploration camp. Trench, auger, soil, and surface rock chip/grab samples remain within sight of Xtra-Gold technical staff from collection in the field to transport to the Field Camp. All samples are laid-out in sequence in the designated sample room to avoid duplications and omissions of samples in the laboratory submission orders, and the sample bags placed in labelled rice sacks in sequence. The shipping sacks are immediately secured with a numbered security seal (i.e. nylon zap strap) and stored in a locked room pending shipment to the laboratory; with only the Project Geologist and the Chief Geotechnician having access to the key. The Field Camp is a fenced-in compound with 24 hour security. A record of all samples shipped, as well as the actual samples within the individual sacks and their security seal numbers, is kept by the project geologist. Depending on sample shipment size samples are either transported by Xtra-Gold personnel directly to the ALS Chemex analytical facility in Kumasi or scheduled for pickup by ALS Chemex at the Field Camp. A tracking record of all sample deliveries/pickups and pending analytical orders is kept by the project geologist, including: personnel in custody of samples and time of departure; laboratory drop-off site; status of security seals; and assay turnaround time. Upon delivery or pickup of samples, a signed copy of the Sample Submittal Form is provided to Xtra-Gold personnel by ALS Chemex sample reception staff. ALS Chemex Kumasi has been instructed to notify Xtra-Gold’s VP, Exploration (Y. Clement, P. Geo.) and/or Senior Project Geologist (A. Amoako) of any signs of tampering with the security seals or damage to the shipping sacks. 14. Data Verification 14.1 General Analytical protocols utilized by Xtra-Gold involved the insertion of quality control samples into the sample stream of assay samples submitted to the laboratory. As of September 2008, including the 2008 diamond core and 2009 RC drill programs, certified reference standards, coarse analytical blanks, and field duplicate samples are being inserted within sample streams at the following rate: one (1) of each for every 20 samples within batches of Drill Core, RC Chip, and Trench Channel samples; and one (1) of each for every 40 samples within batches of Geological/Characteristic (i.e. grab, composite chip), Hand Auger, and Soil samples. In February 2010, Xtra-Gold commissioned SEMS to conduct a detailed technical audit of Xtra-Gold’s drill sample QA-QC program. The results of the study are summarized below and the complete QA-QC report is presented in Appendix 5.

XTRA-GOLD RESOURCES CORP. KIBI PROJECT NATIONAL INSTRUMENT 43-101 TECHNICAL REPORT 89
SEMS EXPLORATION SERVICES LTD. JULY 12, 2010
With the presently increasing scope of exploration activities, Xtra-Gold is in the process of engaging the services of SEMS to serve as an Independent QP to monitor/audit all aspects of Xtra-Gold’s sample collection, analytical procedure, and sample result QA-QC and evaluate and implement any required changes to the present quality control program. 14.2 Summary Datasets assessed for quality control include:
● Laboratory standards, blanks, duplicates and check repeats (Fire Assay and
Gravimetric determinations) ● Client introduced standards, blanks and RC field duplicates ((Fire Assay and
Gravimetric determinations) ● Client resubmitted pulps ● Client quartered core ● SEMS quarter core control ● SEMS RC duplicates resubmitted to ALS Chemex and also Intertek, Tarkwa ● Check sieve test analysis ● Laboratory and field splitting error ● Results for Screen Fire assay vs 50 g Fire Assay Assessment includes precision and accuracy of all standards with time variation diagrams separating the results obtained from RC and diamond core drilling. All duplicates, check repeats and quarter core results are accompanied by precision assessment, at varying lower cuts, and are additionally supported by correlation diagrams. The latter diagrams show the total datasets and also datasets with “Flyers” omitted. All “Flyers” omitted are documented. Additionally, the ALS Chemex laboratory was audited. The assessment is, perforce, long and contains many diagrams and tables. For this reason, the detailed results are shown as a separate appendix (see Appendix 5). Statistical results are summarized in Table 5 and this is cross-referenced to figures set out in Appendix 5. 14.2.1 Laboratory Standards Precision and accuracy are well within industry tolerance. Precision varies 1.8 and 4.8%
where the accepted range is = <10%. Standards which are not accurate vary in the range -2.2 to +0.8% where the accepted range is better than +5%. Time variation diagrams show an absence of calibration shifts.
14.2.2 Client Standards Client standards, purchased from Canada, comprise samples derived from mines and also
standards manufactured using high grade gold diluted with granite. Three (3) of the standards may be refractory. These standards were submitted as “Round Robin” samples to laboratories in order to determine a recommended value and standard deviation. The recommended value is applied to ALS Chemex as a yardstick for accuracy. The standard deviation used to identify “Flyers” is determined from the results obtained by ALS Chemex; the standard deviation related to the “Round Robin” exercise is not applied.

XTRA-GOLD RESOURCES CORP. KIBI PROJECT NATIONAL INSTRUMENT 43-101 TECHNICAL REPORT 90
SEMS EXPLORATION SERVICES LTD. JULY 12, 2010
Precision of Client standards varies between 2.6 and 18.5% with five (5) of the 12 standards falling below 10%. In the main, accuracy is better than +5% although one standard shows an accuracy of +7.7%. The most inaccurate standard is +9.1% and this is related to gravimetric determinations where results are = > 10 g/t gold.
Time variation diagrams show natural negative and positive drift over time. Standard
CDN-GS-1E displays a weak calibration step (Figs 17 and 18, Table 5). Xtra-Gold has identified and requested re-analysis of batches containing results
exceeding +2 standard deviations as defined from laboratory results. A number of “Flyers” are identified in the current assessment that were not re-analysed but this should not materially detract from the overall results.
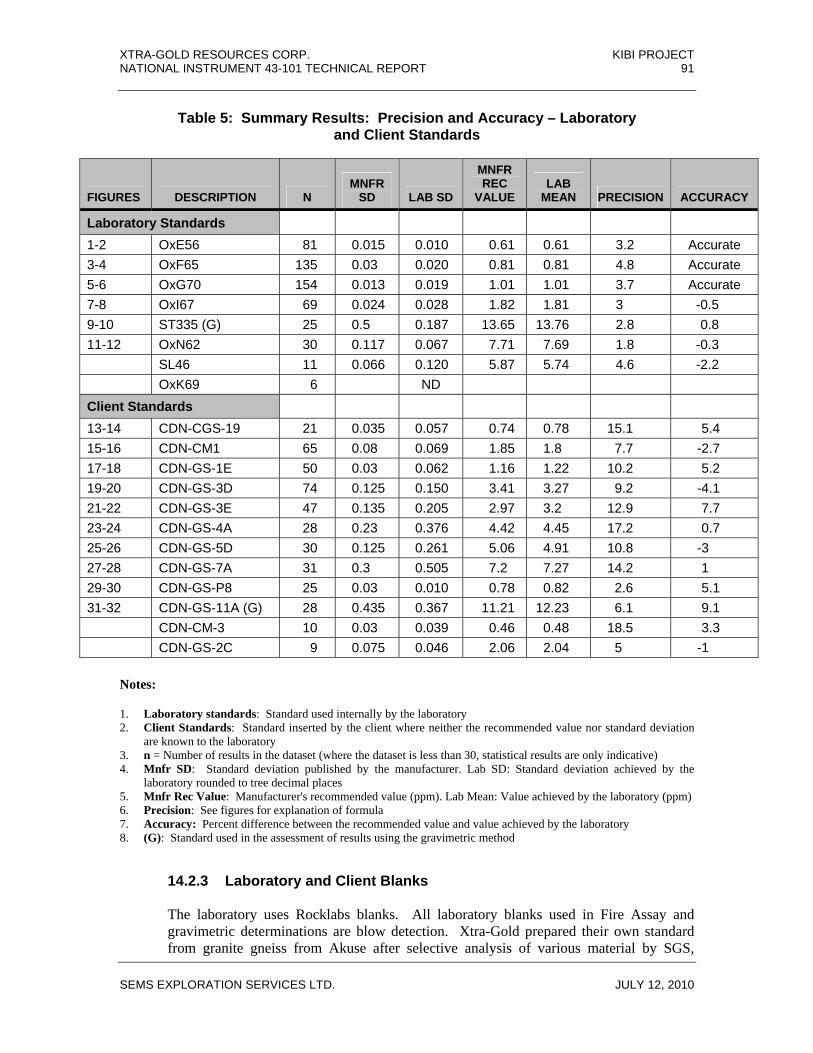
XTRA-GOLD RESOURCES CORP. KIBI PROJECT NATIONAL INSTRUMENT 43-101 TECHNICAL REPORT 91
SEMS EXPLORATION SERVICES LTD. JULY 12, 2010
Table 5: Summary Results: Precision and Accuracy – Laboratory and Client Standards
FIGURES DESCRIPTION N MNFR
SD LAB SD
MNFR REC
VALUE LAB
MEAN PRECISION ACCURACY
Laboratory Standards 1-2 OxE56 81 0.015 0.010 0.61 0.61 3.2 Accurate 3-4 OxF65 135 0.03 0.020 0.81 0.81 4.8 Accurate 5-6 OxG70 154 0.013 0.019 1.01 1.01 3.7 Accurate 7-8 OxI67 69 0.024 0.028 1.82 1.81 3 -0.5 9-10 ST335 (G) 25 0.5 0.187 13.65 13.76 2.8 0.8 11-12 OxN62 30 0.117 0.067 7.71 7.69 1.8 -0.3 SL46 11 0.066 0.120 5.87 5.74 4.6 -2.2 OxK69 6 ND Client Standards 13-14 CDN-CGS-19 21 0.035 0.057 0.74 0.78 15.1 5.4 15-16 CDN-CM1 65 0.08 0.069 1.85 1.8 7.7 -2.7 17-18 CDN-GS-1E 50 0.03 0.062 1.16 1.22 10.2 5.2 19-20 CDN-GS-3D 74 0.125 0.150 3.41 3.27 9.2 -4.1 21-22 CDN-GS-3E 47 0.135 0.205 2.97 3.2 12.9 7.7 23-24 CDN-GS-4A 28 0.23 0.376 4.42 4.45 17.2 0.7 25-26 CDN-GS-5D 30 0.125 0.261 5.06 4.91 10.8 -3 27-28 CDN-GS-7A 31 0.3 0.505 7.2 7.27 14.2 1 29-30 CDN-GS-P8 25 0.03 0.010 0.78 0.82 2.6 5.1 31-32 CDN-GS-11A (G) 28 0.435 0.367 11.21 12.23 6.1 9.1 CDN-CM-3 10 0.03 0.039 0.46 0.48 18.5 3.3 CDN-GS-2C 9 0.075 0.046 2.06 2.04 5 -1
Notes: 1. Laboratory standards: Standard used internally by the laboratory 2. Client Standards: Standard inserted by the client where neither the recommended value nor standard deviation
are known to the laboratory 3. n = Number of results in the dataset (where the dataset is less than 30, statistical results are only indicative) 4. Mnfr SD: Standard deviation published by the manufacturer. Lab SD: Standard deviation achieved by the
laboratory rounded to tree decimal places 5. Mnfr Rec Value: Manufacturer's recommended value (ppm). Lab Mean: Value achieved by the laboratory (ppm) 6. Precision: See figures for explanation of formula 7. Accuracy: Percent difference between the recommended value and value achieved by the laboratory 8. (G): Standard used in the assessment of results using the gravimetric method 14.2.3 Laboratory and Client Blanks The laboratory uses Rocklabs blanks. All laboratory blanks used in Fire Assay and
gravimetric determinations are blow detection. Xtra-Gold prepared their own standard from granite gneiss from Akuse after selective analysis of various material by SGS,
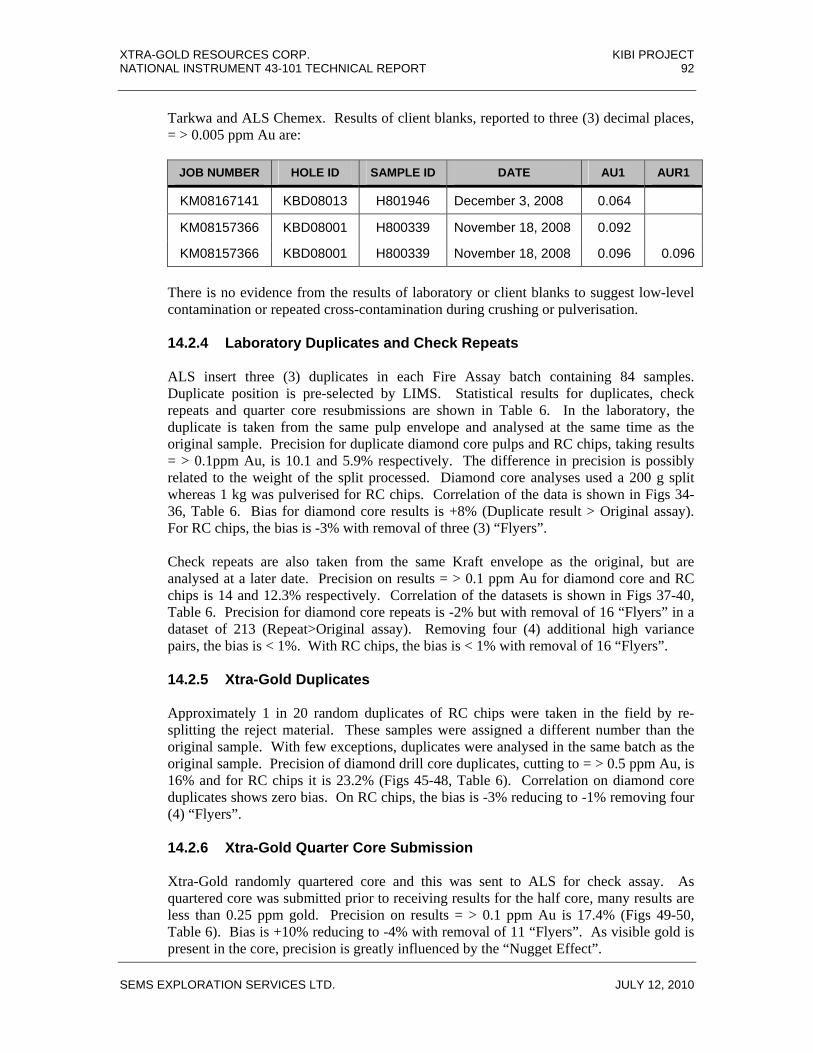
XTRA-GOLD RESOURCES CORP. KIBI PROJECT NATIONAL INSTRUMENT 43-101 TECHNICAL REPORT 92
SEMS EXPLORATION SERVICES LTD. JULY 12, 2010
Tarkwa and ALS Chemex. Results of client blanks, reported to three (3) decimal places, = > 0.005 ppm Au are:
JOB NUMBER HOLE ID SAMPLE ID DATE AU1 AUR1
KM08167141 KBD08013 H801946 December 3, 2008 0.064
KM08157366 KBD08001 H800339 November 18, 2008 0.092
KM08157366 KBD08001 H800339 November 18, 2008 0.096 0.096
There is no evidence from the results of laboratory or client blanks to suggest low-level
contamination or repeated cross-contamination during crushing or pulverisation. 14.2.4 Laboratory Duplicates and Check Repeats ALS insert three (3) duplicates in each Fire Assay batch containing 84 samples.
Duplicate position is pre-selected by LIMS. Statistical results for duplicates, check repeats and quarter core resubmissions are shown in Table 6. In the laboratory, the duplicate is taken from the same pulp envelope and analysed at the same time as the original sample. Precision for duplicate diamond core pulps and RC chips, taking results = > 0.1ppm Au, is 10.1 and 5.9% respectively. The difference in precision is possibly related to the weight of the split processed. Diamond core analyses used a 200 g split whereas 1 kg was pulverised for RC chips. Correlation of the data is shown in Figs 34-36, Table 6. Bias for diamond core results is +8% (Duplicate result > Original assay). For RC chips, the bias is -3% with removal of three (3) “Flyers”.
Check repeats are also taken from the same Kraft envelope as the original, but are
analysed at a later date. Precision on results = > 0.1 ppm Au for diamond core and RC chips is 14 and 12.3% respectively. Correlation of the datasets is shown in Figs 37-40, Table 6. Precision for diamond core repeats is -2% but with removal of 16 “Flyers” in a dataset of 213 (Repeat>Original assay). Removing four (4) additional high variance pairs, the bias is < 1%. With RC chips, the bias is < 1% with removal of 16 “Flyers”.
14.2.5 Xtra-Gold Duplicates Approximately 1 in 20 random duplicates of RC chips were taken in the field by re-
splitting the reject material. These samples were assigned a different number than the original sample. With few exceptions, duplicates were analysed in the same batch as the original sample. Precision of diamond drill core duplicates, cutting to = > 0.5 ppm Au, is 16% and for RC chips it is 23.2% (Figs 45-48, Table 6). Correlation on diamond core duplicates shows zero bias. On RC chips, the bias is -3% reducing to -1% removing four (4) “Flyers”.
14.2.6 Xtra-Gold Quarter Core Submission Xtra-Gold randomly quartered core and this was sent to ALS for check assay. As
quartered core was submitted prior to receiving results for the half core, many results are less than 0.25 ppm gold. Precision on results = > 0.1 ppm Au is 17.4% (Figs 49-50, Table 6). Bias is +10% reducing to -4% with removal of 11 “Flyers”. As visible gold is present in the core, precision is greatly influenced by the “Nugget Effect”.

XTRA-GOLD RESOURCES CORP. KIBI PROJECT NATIONAL INSTRUMENT 43-101 TECHNICAL REPORT 93
SEMS EXPLORATION SERVICES LTD. JULY 12, 2010
Table 6: Summary Statistics: Duplicates, Check Repeats, Quartered Core, Screen Fire Assay vs Fire Assay and Resubmitted Samples
FIGS
DATASET
N
PRECISIONTOTAL DATA
PRECISION= >0.1 PPM
N
PRECISION= >0.5 PPM
N
BIAS
BIAS CUT
DATA
FLYERS
REMOVED
34-35
Lab Duplicates DDC
86
12.9
10.1
21
+8
0
1
36
Lab duplicates RC Chips
157
13.7
5.9
47
-3
3
37-38
Lab Check Repeats DDC
213
17
14
170
11.8
98
-2
<1
20
9-40
Lab Check Repeats RC Chips
204
15.6
12.3
174
11.1
109
<1
<1
16
45-46
Client Pulp Duplicates DDC
59
16.6
16
52
0
0 (4 ppm)
0
47-48
Client Pulp Duplicates RC Chips
75
24.8
23.3
61
-3
-1
4
49-50
Quarter core submission
94
40.2
17.4
13
>+10
-4
11
51
Coarse RC Chip resubmission
189
39
20.9
73
-5
20
52-53
Screen Fire Assay vs Fire Assay
39
18.6
18.6
37
17.4
30
-6
<1 (5 ppm)
2
54-55
Gravimetric duplicates
7
ND
<1
1
14.2.7 Coarse RC Chip Resubmission Approximately 1 in 20 duplicate splits from RC chip samples were taken in the field.
Precision is 20.9% with results = >0.1 ppm gold (Figure 51, Table 6). Bias is -6% falling to < 1% after removal of 20 “Flyers”. The high number of “Flyers” is related, in part, to splitting error in the field and laboratory sub-sampling error.
14.2.8 Screen Fire Assay vs Fire Assay During the diamond drill campaign, samples of coarse reject were selected where gold
was visible or possibly present. These samples were sent for a 1 kg Screen Fire Assay determination and comparison to results for a 50 g Fire Assay. Precision of the total dataset, excluding two (2) “Flyers”, is 18.6% improving to 17.4% cutting results < 0.5 ppm gold. Cutting in the range = > 0.5 < 5 ppm Au saw a deterioration in precision to 19.6%.
Correlation shows divergence between regression and diagonal lines, reflecting a bias of
-6% (Figure 60, Table 6). Cutting results to <5 ppm Au, there is near-coincidence between regression and diagonal lines (Figure 61, Table 6). Bias is less than 1%.
XTRA-GOLD RESOURCES CORP. KIBI PROJECT NATIONAL INSTRUMENT 43-101 TECHNICAL REPORT 94
SEMS EXPLORATION SERVICES LTD. JULY 12, 2010
14.2.9 Splitting Error: Laboratory and Field An indication of splitting error in the laboratory is given by the difference in precision
obtained from duplicate analysis of diamond core, where both samples are taken from the same Kraft envelope, and the precision obtained by analysing two (2) separate splits of the total crushed core samples.
Precision of duplicates, cutting results < 0.1 ppm Au, is 10.1%. Precision of the two (2)
separate splits is 30.2% giving an indicated splitting error of 20.1%. This error is directly related to splitting 250 g from a sample of 2-3 kg crushed to 70% passing -2 mm. It does not accommodate splitting variance associated with selection of core after cutting.
Field splitting error is indicated by the difference in precision obtained from duplicate
analysis of RC chips in the laboratory, where both samples are taken from the same Kraft envelope, and the precision obtained by analysing two (2) separate splits of the total RC sample in the field.
Precision of duplicates, cutting results < 0.1 ppm Au, is 10.1%. Precision of the field
duplicates is 20.9% for results = >0.1 ppm Au. The indicated field splitting error is therefore 10.8%. It should be appreciated that this splitting error is assessed after the omission of “Flyers” and would be substantially higher had the “Flyers” been included.
Combined splitting error is the aggregate of laboratory and field splitting error and this is
30.9%. This is not unduly high for material with visible gold. 14.3 Conclusions A deterioration is noted comparing precision achieved by the laboratory using internal standards and those submitted by Xtra-Gold. However, with few exceptions precision for Xtra-Gold standards is close to, or better than 10% and this is acceptable. Accuracy of Xtra-Gold standards is mainly better than +5% and this is acceptable with the exception of the high bias associated with gravimetric determinations for grades exceeding 10 g/t gold. In general, precision shown for duplicates and all check submissions cutting results to = >0.1 ppm Au is great than 10% with a maximum of 20.9% shown for re-analysis of RC chips. However, in the presence of coarse particulate gold, precision exceeding 10% is to be expected. Bias for duplicates and checks, omitting “Flyers” is good with a maximum of -4%. Bias for total datasets is generally poor, with a maximum exceeding 10%, but this is to be expected with coarse gold. Splitting error in the laboratory is high at 20.1% but this may be improved in the future with improved protocols on splitting techniques. Currently, the pulp is split by scooping material with a Kraft envelope rather than using a small spoon and splitting by “Fractional shovelling”. The laboratory is aware of the high percentage of boil-overs and is taking steps to remedy this situation. In a field programme, especially diamond drilling, it is the norm for incoming results to outpace assessment. Xtra-Gold has shown a determined effort to maximize the quality of results obtained from the laboratory and are very mindful of the requirements for continual evaluation.
XTRA-GOLD RESOURCES CORP. KIBI PROJECT NATIONAL INSTRUMENT 43-101 TECHNICAL REPORT 95
SEMS EXPLORATION SERVICES LTD. JULY 12, 2010
14.4 Recommendations ● For all future diamond coring, all the sample must be pulverized to 90% passing -
200#. ● With RC sampling, the laboratory should be similarly instructed to pulverize all
the sample and not to split off 1 kg. ● The laboratory should be instructed to apply “Fractional shovelling” to split the
pulp. ● Periodically, at least once a month or more often, the laboratory should be visited
without warning to ensure splitting is being carried out according to instructions. ● A QC report should be prepared on a monthly basis assessing laboratory
standards for calibration jumps and blind standards for consecutive “Flyers” (at least 5% of standards will fail at the 95% confidence level. Such failures should not immediately require re-analysis of a batch. The report should also assess precision and bias of duplicates. If the precision starts to deteriorate, a visit to the laboratory may be necessary. Something will always go wrong; in the field or at the lab and a monthly report will help to move things back on a straight line.
● 1 in 20 samples in the laboratory should be a duplicate where the duplicate is taken from the entire pulp sample and NOT from the same Kraft envelope. Importantly, this allows assessment of splitting error in dealing with coarse gold.
● Xtra-Gold should request the laboratory to immediately return all pulp rejects to site. To this end, the project should have dry space to catalogue and store pulp rejects.
● On receipt of results, selected pulps should be re-numbered and sent to the laboratory. Re-numbering can be a hazardous exercise and to minimise possible problems the re-numbering should be carried out by a Project Geologist monitored by a Technician.
● It is commendable to randomize insertion of standards, blanks and field duplicates but a set numbering system minimizes possible numbering problems (Suggestion: every sample ID ending in 17, 37, 57, 77 and 97: Standard; ending in 20, 40, 60 and 80 blanks; ending in 10, 30, 50, 70 and 90: Duplicates). A standard cannot be hidden from a laboratory.
● Monitor the Fire Assay section of a laboratory and ensure that boil-overs are at a minimum and that samples showing boil-overs are automatically re-analysed.
● In core cutting and sample selection, it is a good idea to take alternate right and left parts of the core from the beginning of the hole- irrespective of large pieces of visible gold.
● In all results, aim for a precision = < 10% cutting values = > 0.1ppm Au. Bias, after removal of “Flyers” must be better than +5% and the target should be better than +2% (With coarse gold, achievement of these goals requires very strict protocols and supervision. “Flyers” will always occur but, ideally, there should be less than 5 “Flyers” in 100 results above 0.3 ppm Au).
15. Adjacent Properties Although the Kibi area is blanketed by mining concessions, very little systematic exploration work for bedrock gold deposits has been conducted over the years in the Kibi Greenstone Belt, reflecting the fact that the Kibi area has traditionally been recognized as an alluvial gold district,

XTRA-GOLD RESOURCES CORP. KIBI PROJECT NATIONAL INSTRUMENT 43-101 TECHNICAL REPORT 96
SEMS EXPLORATION SERVICES LTD. JULY 12, 2010
and the surrounding concessions have been held since the mid 1980s to early 1990s for their alluvial gold potential. At present the only larger scale, alluvial gold operation in the Kibi District is on the Med Mining Ltd. concession located approximately 1.5 km west of the Apapam Concession, along the western flank of the Atewa Range. This is a dry mining operation that has been operating for about 6 years. Gold production is reported to be 8,000 to 10,000 gm per month or about 250 to 325 oz per month. Historically, the biggest alluvial gold producer in the Kibi District has been Xtra-Gold at its Kwabeng Concession located approximately 12 km northwest of the Apapam Concession, along the western base of the Atewa Range. The Kwabeng alluvial gold deposit was mined in the early 1990s by Goldenrae, Xtra-Gold Mining Limited’s predecessor, and again on a production trial basis in 2007 and 2008 by XG Mining, for a total production of approximately 25,500 oz of gold. Numerous gold reefs (i.e. veins) were reportedly discovered in the Kibi area during the alluvial gold operations of the early 1900s, with the most noteworthy of these lode gold prospects being located on and/or in close proximity to Xtra-Gold land positions. In addition to the Clearing Reef (Kibi Mine) and Hill Reef (Gold Mountain) lying at the north-central extremity of the Apapam Concession, other historic lode gold prospects in the Kibi Gold Belt include; the Kwabeng Mine located in the Kwabeng Concession, approximately 15 km northwest of the Apapam Concession, along the western base of the Atewa Range and the Tumfa Mine situated along the southwest margin of Xtra-Gold’s Banso Concession. The Clearing Reef (Kibi Mine) structure is reported to extend approximately 1.5 km to the northeast of the Apapam Concession onto the neighbouring Midras Mining Limited concession. Although these lode gold prospects were reportedly worked or subjected to underground development by London-based mining syndicates between 1900 and 1938, it is unclear if they ever reached actual commercial production as there are no known gold production figures available. See Sections 6.3.1 to 6.3.3 and of this Report for further details regarding these historic lode gold prospects. In 2006, Newmont Mining tested two (2) anomalous gold-in-soil trends in the northern half of the Pusu Pusu concession located at the northeast extremity of the Kibi Greenstone Belt with a 51 hole RC drill program (4,848 m). The Pusu Pusu concession, held by a private Ghanaian company (Kibi Goldfields International), with its southern boundary located approximately 10 km north of the Apapam Concession, covers the northeast extension of the same regional structure dissecting the Apapam Concession. One (1) anomalous gold-in-soil trend lies along the flank of the Atewa Range west of Osino and the other to the south along strike of an historical adit near Saaman. The Saaman adit structure yielded several significant gold intercepts over a 600 m strike-length, including: 1.69 g/t gold over 8 m on Fence 8600E; 1.96 g/t gold over 18 m and 0.55 g/t gold over 51 m on Fence 8700E; 1.64 g/t gold over 14 m and 4.39 g/t gold over 8 m on Fence 9200E. Mineralization along this trend is associated with quartz stockworking and with carbonatized mafic volcanics with disseminated pyrite and arsenopyrite. The Osino target yielded intercepts of 1.56 g/t gold over 4 m and 1.89 g/t gold over 6 m from sulphide bearing quartz veins hosted by silicified turbiditic metasediments. The Saaman and Osino target drill results did not meet Newmont Mining’s economic criteria threshold and the option was terminated. Xtra-Gold is also conducting early stage exploration at its Ankaase gold trend project located on the Muoso Concession, adjoining Kibi Goldfields International’s Pusu Pusu property, approximately 19 km northeast of the Apapam Concession. The Ankaase Project is characterized
XTRA-GOLD RESOURCES CORP. KIBI PROJECT NATIONAL INSTRUMENT 43-101 TECHNICAL REPORT 97
SEMS EXPLORATION SERVICES LTD. JULY 12, 2010
by an over 3.5 km long, NE-trending, anomalous gold-in-soil trend characterized by the widespread occurrence of auriferous quartz floats. Highlights from a 2008 scout trenching program restricted to the southern 1.4 km extent of the over 3.5 km long Ankaase gold-in-soil anomaly include channel sample intercepts of 1.75 g/t gold over 18 m, 1.79 g/t gold over 24 m, 4.73 g/t gold over 6 m and 2.08 g/t gold over 14, including 6.52 g/t gold over 4 m. Trenching to date has intermittently traced an approximately 150 m to 200 m wide, NE-trending deformation zone over an approximately 1.4 km strike length. This structural corridor is characterized by several sub parallel, shear hosted, gold-bearing quartz vein zones ranging from less than 1 m to approximately 24 m in trench length; with individual quartz veins ranging from less than 1 cm to 5.5 m in trench length. A granitoid body exhibiting widespread, low grade gold mineralization (0.43 g/t gold over 62 m) was also exposed by trenching at the southwest extremity of the Ankaase gold-in-soil anomaly. The reader is cautioned that the information with regard to the nature of the mineralization types for the above-named concessions is not necessarily indicative of the mineralization that is the subject of this Report. 16. Mineral Processing and Metallurgical Testing As at the date of this Report, no mineral processing or metallurgical testing has been undertaken by Xtra-Gold. 17. Mineral Resource and Mineral Reserve Estimates As at the date of this Report, no mineral resource estimate has been done on the Kibi Project. 18. Other Relevant Data and Information SEMS is not aware of any other relevant data and information.
19. Interpretation and Conclusions Xtra-Gold personnel used diligence in monitoring field work activities, quality control protocols and assaying results. Xtra-Gold has also been diligent in investigating potential workplace failures and taking appropriate and corrective measures as and when necessary. SEMS is of the opinion that Xtra-Gold has undertaken the appropriate steps to explore for gold mineralization on the Apapam Concession using exploration practices best suited to the geological, climatic and cultural setting of Southern Ghana. SEMS is also of the opinion that exploration data, including soil, trench and drill information, was acquired using procedures that meet or exceed industry best practices. SEMS reviewed and audited the Xtra-Gold exploration

XTRA-GOLD RESOURCES CORP. KIBI PROJECT NATIONAL INSTRUMENT 43-101 TECHNICAL REPORT 98
SEMS EXPLORATION SERVICES LTD. JULY 12, 2010
database, the ALS laboratory facility and QA-QC protocols. In the opinion of SEMS, Xtra-Gold collected comprehensive quality control data that is generally acceptable for the purpose of gold exploration evaluation. The results of precision and correlation analyses of both diamond core and RC chip samples clearly indicate the presence of particulate gold, especially in samples reporting a grade above 4 ppm gold. The occurrence of regular pot boil-overs in the Fire Assay furnace should be resolved by the analysis laboratory, ALS. This is likely to be the result of high sulphide content to the sample. Pot boil-overs can cause the loss of gold and subsequent under reporting of grade. The Kibi Project has identified a new, hard rock, gold exploration zone within the Kibi Belt. This exciting new project is the first significant gold exploration success in what is traditionally considered an alluvial mining area. It is concluded that the Kibi Project has the potential to host economic quantities of gold mineralisation and that Xtra-Gold, if current exploration practices are maintained, have the ability to realize this potential. 20. Recommendations In reviewing all the data and information received from Xtra-Gold, SEMS has drawn the following conclusions and recommendations:
● continue the in-house QA/QC monitoring program in conjunction with a periodic external audit of analysis results and sampling methodologies.
● trenches should be excavated between the known granitoid bodies to improve
geological understanding of the dimensions to these bodies and prove or otherwise their continuity;
● additional drilling is required to clearly define the continuity of the gold
mineralization along strike from known occurrences; ● continue exploration of geochemical and geophysical targets to identify
additional zones of mineralization; ● review exploration strategies and results on a regular basis such that other styles
of gold mineralisation, not directly associated with granitoids, are considered; ● additional structural work to better define the controls on gold mineralization
and to assist with planning further drilling; ● metallurgical testwork should be undertaken to ascertain gold recoveries from
mineralized material within the various granitoid bodies; ● all trenches should be channel sampled as well as geologically mapped;

XTRA-GOLD RESOURCES CORP. KIBI PROJECT NATIONAL INSTRUMENT 43-101 TECHNICAL REPORT 99
SEMS EXPLORATION SERVICES LTD. JULY 12, 2010
● routinely measure the specific gravity (SG) of diamond core samples for use in a possible future Mineral Resource Estimation;
● insist that all samples submitted to the laboratory for analysis are pulverized to
90%, passing -200 mesh; ● Xtra-Gold should ensure and periodically monitor the manner in which the
laboratory sub-samples the total pulp material. This should be mat-rolled and then sub-sampled by fractional shovelling, using a small spoon, taking ideally 30 separate samples from the total material;
● a duplicate should be taken from the remnant pulp every 20th sample to determine
possible splitting error;
● all pulps should be returned to Xtra-Gold as soon after analysis as possible. This must include the remnant pulp material, often weighing in excess of 1.5 kg ―as well as the 200g Kraft envelope;
● upon receipt of results from the laboratory, Xtra-Gold should periodically
resubmit pulp samples reporting a grade greater or equal to 0.4 ppm Au. Approximately 5% should be resubmitted; and
● insist that the laboratory use larger Fire Assay pots or reduce the size of the
charge to 25 g or 30 g for samples with high sulphide content.
• implement an exploration program that incorporates the points made above. It is recommended that this program be as follows:
Phase 1 Scope of Work Estimated Cost (US$) ● infill trenching in between the known granitoid bodies 100,000 ● additional drilling (i) to clearly define and establish
the continuity and shape of granitoid hosted gold mineralization; and (ii) to expand the strike length of known mineralization 850,000
● structural work to ascertain the controls on
mineralization and to assist with the planning of further drill programs 25,000
● detailed surface mapping of the mineralized trend 25,000
Total Estimated Phase 1 Budget 1,000,000

XTRA-GOLD RESOURCES CORP. KIBI PROJECT NATIONAL INSTRUMENT 43-101 TECHNICAL REPORT 100
SEMS EXPLORATION SERVICES LTD. JULY 12, 2010
The following Phase 2 work is not contingent upon the results of the Phase 1 work.
Phase 2 Scope of Work Estimated Cost (US$)
● definition drilling (i) to prove a Mineral Resource; and (ii) to extend the strike length of known mineralization 2,500,000
● metallurgical work on mineralized material 100,000 ● VTEM airborne survey 100,000
Total Estimated Phase 2 Budget 2,700,000
The following Phase 3 work is contingent upon the results of the Phase 2 work.
Phase 3 Scope of Work Estimated Cost (US$)
● further definition drilling (i) to prove a Mineral Resource; and (ii) to extend the strike length of known mineralization 2,500,000
Total Estimated Phase 3 Budget 2,500,000
21. References
Allibone, A.H., McCuaig, T.C., Harris, D., Etheridge, S.M., and Byrne, D., 2002. Structural Controls on Gold Mineralization at the Ashanti Deposit, Obuasi, Ghana. SEG Special Publication 9, p. 65-93.
Asiehene K.A.B., 1960. Unpublished Report on Geological Mapping, including stream sediment sampling of the Kibi SE field Sheet No.94.
David, J., 2009. A Report on Induced Polarisation/Resistivity and Magnetic Surveys Conducted over the Apapam Prospecting License, Ghana, West Africa, for Xtra-Gold Resources Corp., unpublished report by Sagax Afrique, S.A., June 2009, 2 volumes.
Dzigbodi-Adjimah, K., 2010, A Petrographic Report on Thirty-Six (36) Thin and Nine (9) Polish Sections from Xtra-Gold Concession, Kwabeng, Eastern Region, Ghana, for Xtra-Gold Exploration Ltd., unpublished report by Adjimah Consults, March 20, 2010, 31p.
Eisenlohr, B.N., 1989. The Structural Geology of Birimian and Tarkwaian Rocks of Southwest Ghana, BGR Report 80.2040.6.
Gold Coast Dept. Of Mines: Annual Reports for 1934-35, 1938-39. Dept. of Mines, Accra, Ghana.
Goldenrae Mining Company Limited, 1994, Feasibility Study on Apapam Prospecting Concession, Kibi District, Ghana, unpublished “in-house” evaluation for developing the Apapam alluvial resources as part of a larger, regional operation under Goldenrae management.
Griffis, R.J., Barning, K., Agezo, F.L., and Akosah, F.K. 2002. Gold Deposits of Ghana; Minerals Commission of Ghana, 432 p.
Griffis, R. J., 1998. Explanatory Notes - Geological Interpretation of Geophysical Data from Southwestern Ghana. Minerals Commission, Accra, 51p.
XTRA-GOLD RESOURCES CORP. KIBI PROJECT NATIONAL INSTRUMENT 43-101 TECHNICAL REPORT 101
SEMS EXPLORATION SERVICES LTD. JULY 12, 2010
Griffis, R.J., Rae, J. A., and K. Agyemang, 1991. A Case History of the Goldenrae Alluvial Gold Project: in K. Barning (ed.), Symposium on Gold Exploration in Tropical Rain Forest Belts of Southern Ghana, Minerals Commission, Accra, p.135-150.
Hirdes, W., Davis, D. W., and B. N. Eisenlohr, 1992. Reassessment of Proterozoic granitoid ages
in Ghana on the basis of U/Pb zircon and monazite dating. Precambian Research v.56, p. 89-96.
Junner, N.R., 1935. Gold in the Gold Coast, Ghana Geological Survey Department Memoir No.4
(revised 1973). Kesse, G.O., 1985. The Mineral and Rock Resources in Ghana. Balkema, Rotterdam-Boston,
pp. 610. Minerals Commission of Ghana, 1988a. Compilation of Historical Mining Company Data
relating to Sheet 94 (Kibi SE), Compiled by J W Peters. 1988b. Plans Relating to Kibi Mine.
Naas, C.O., 2008. Technical Report on the Banso and Apapam Concessions, Eastern Region,
Ghana, West Africa, for Xtra-Gold Resources Corp., unpublished report by CME Consultants Inc, April 9, 2008, 2 volumes.
Naas, C.O., 2007. Final Report on the Phase I Exploration Program of the Apapam Concession,
Eastern Region, Ghana, West Africa, for Xtra-Gold Resources Corp., unpublished report by CME and Company, January 10, 2007, 2 volumes.
Oburthur, T., Weiser, T., Vetter, V., Schmidt Mumm, A., Chryssoulis, S., Davis, D. W., and J. A.
Amanor, 1997. Gold mineralization in the Ashanti belt of Ghana: Stable isotope composition of hostrocks and ores, the distribution of gold and time constraints. Min. Deposita. v.32, pp. 257-260.
Rae, J. A., Griffis, R.J., and K. Agyemang, 2006. Goldenrae Evaluation Report, unpublished
report prepared for Xtra-Gold Resources Corp. March 7, 2006, 66p. RTZ Consultants Ltd., 1988. 1987 and 1988 Report on Reconnaissance Prospecting – Kibi
Concession (Southern area): unpublished report prepared by RTZ Consultants for Warding PLC, October-December 1987 and February-June 1988.
Vos, I., 2010. Structural Geology Investigations of the Kibi Gold Trend Project, Kibi-Winneba
Greenstone Belt, Southeast Ghana, for Xtra-Gold Resources Corp., unpublished report by SRK Consulting (Canada) Inc, April 2010, 39p.
Yao, Y., and Robb, L.J., 2000. Gold mineralization in Palaeoproterozoic granitoids at Obuasi,
Ashanti Region, Ghana: Ore geology, geochemistry and fluid characteristics. South African Journal of Geology, Volume 103, p. 255-278.


XTRA-GOLD RESOURCES CORP. KIBI PROJECT NATIONAL INSTRUMENT 43-101 TECHNICAL REPORT 104
SEMS EXPLORATION SERVICES LTD. JULY 12, 2010
APPENDIX 1
Apapam Mining Lease
XTRA-GOLD RESOURCES CORP. KIBI PROJECT NATIONAL INSTRUMENT 43-101 TECHNICAL REPORT 105
SEMS EXPLORATION SERVICES LTD. JULY 12, 2010

XTRA-GOLD RESOURCES CORP. KIBI PROJECT NATIONAL INSTRUMENT 43-101 TECHNICAL REPORT 106
SEMS EXPLORATION SERVICES LTD. JULY 12, 2010

XTRA-GOLD RESOURCES CORP. KIBI PROJECT NATIONAL INSTRUMENT 43-101 TECHNICAL REPORT 107
SEMS EXPLORATION SERVICES LTD. JULY 12, 2010
XTRA-GOLD RESOURCES CORP. KIBI PROJECT NATIONAL INSTRUMENT 43-101 TECHNICAL REPORT 108
SEMS EXPLORATION SERVICES LTD. JULY 12, 2010

XTRA-GOLD RESOURCES CORP. KIBI PROJECT NATIONAL INSTRUMENT 43-101 TECHNICAL REPORT 109
SEMS EXPLORATION SERVICES LTD. JULY 12, 2010

XTRA-GOLD RESOURCES CORP. KIBI PROJECT NATIONAL INSTRUMENT 43-101 TECHNICAL REPORT 110
SEMS EXPLORATION SERVICES LTD. JULY 12, 2010
XTRA-GOLD RESOURCES CORP. KIBI PROJECT NATIONAL INSTRUMENT 43-101 TECHNICAL REPORT 111
SEMS EXPLORATION SERVICES LTD. JULY 12, 2010

XTRA-GOLD RESOURCES CORP. KIBI PROJECT NATIONAL INSTRUMENT 43-101 TECHNICAL REPORT 112
SEMS EXPLORATION SERVICES LTD. JULY 12, 2010

XTRA-GOLD RESOURCES CORP. KIBI PROJECT NATIONAL INSTRUMENT 43-101 TECHNICAL REPORT 113
SEMS EXPLORATION SERVICES LTD. JULY 12, 2010

XTRA-GOLD RESOURCES CORP. KIBI PROJECT NATIONAL INSTRUMENT 43-101 TECHNICAL REPORT 114
SEMS EXPLORATION SERVICES LTD. JULY 12, 2010

XTRA-GOLD RESOURCES CORP. KIBI PROJECT NATIONAL INSTRUMENT 43-101 TECHNICAL REPORT 115
SEMS EXPLORATION SERVICES LTD. JULY 12, 2010

XTRA-GOLD RESOURCES CORP. KIBI PROJECT NATIONAL INSTRUMENT 43-101 TECHNICAL REPORT 116
SEMS EXPLORATION SERVICES LTD. JULY 12, 2010

XTRA-GOLD RESOURCES CORP. KIBI PROJECT NATIONAL INSTRUMENT 43-101 TECHNICAL REPORT 117
SEMS EXPLORATION SERVICES LTD. JULY 12, 2010

XTRA-GOLD RESOURCES CORP. KIBI PROJECT NATIONAL INSTRUMENT 43-101 TECHNICAL REPORT 118
SEMS EXPLORATION SERVICES LTD. JULY 12, 2010
XTRA-GOLD RESOURCES CORP. KIBI PROJECT NATIONAL INSTRUMENT 43-101 TECHNICAL REPORT 119
SEMS EXPLORATION SERVICES LTD. JULY 12, 2010

XTRA-GOLD RESOURCES CORP. KIBI PROJECT NATIONAL INSTRUMENT 43-101 TECHNICAL REPORT 120
SEMS EXPLORATION SERVICES LTD. JULY 12, 2010
XTRA-GOLD RESOURCES CORP. KIBI PROJECT NATIONAL INSTRUMENT 43-101 TECHNICAL REPORT 121
SEMS EXPLORATION SERVICES LTD. JULY 12, 2010
XTRA-GOLD RESOURCES CORP. KIBI PROJECT NATIONAL INSTRUMENT 43-101 TECHNICAL REPORT 122
SEMS EXPLORATION SERVICES LTD. JULY 12, 2010
XTRA-GOLD RESOURCES CORP. KIBI PROJECT NATIONAL INSTRUMENT 43-101 TECHNICAL REPORT 123
SEMS EXPLORATION SERVICES LTD. JULY 12, 2010
XTRA-GOLD RESOURCES CORP. KIBI PROJECT NATIONAL INSTRUMENT 43-101 TECHNICAL REPORT 124
SEMS EXPLORATION SERVICES LTD. JULY 12, 2010
XTRA-GOLD RESOURCES CORP. KIBI PROJECT NATIONAL INSTRUMENT 43-101 TECHNICAL REPORT 125
SEMS EXPLORATION SERVICES LTD. JULY 12, 2010

XTRA-GOLD RESOURCES CORP. KIBI PROJECT NATIONAL INSTRUMENT 43-101 TECHNICAL REPORT 126
SEMS EXPLORATION SERVICES LTD. JULY 12, 2010

XTRA-GOLD RESOURCES CORP. KIBI PROJECT NATIONAL INSTRUMENT 43-101 TECHNICAL REPORT 127
SEMS EXPLORATION SERVICES LTD. JULY 12, 2010

XTRA-GOLD RESOURCES CORP. KIBI PROJECT NATIONAL INSTRUMENT 43-101 TECHNICAL REPORT 128
SEMS EXPLORATION SERVICES LTD. JULY 12, 2010

XTRA-GOLD RESOURCES CORP. KIBI PROJECT NATIONAL INSTRUMENT 43-101 TECHNICAL REPORT 129
SEMS EXPLORATION SERVICES LTD. JULY 12, 2010

XTRA-GOLD RESOURCES CORP. KIBI PROJECT NATIONAL INSTRUMENT 43-101 TECHNICAL REPORT 130
SEMS EXPLORATION SERVICES LTD. JULY 12, 2010

XTRA-GOLD RESOURCES CORP. KIBI PROJECT NATIONAL INSTRUMENT 43-101 TECHNICAL REPORT 131
SEMS EXPLORATION SERVICES LTD. JULY 12, 2010
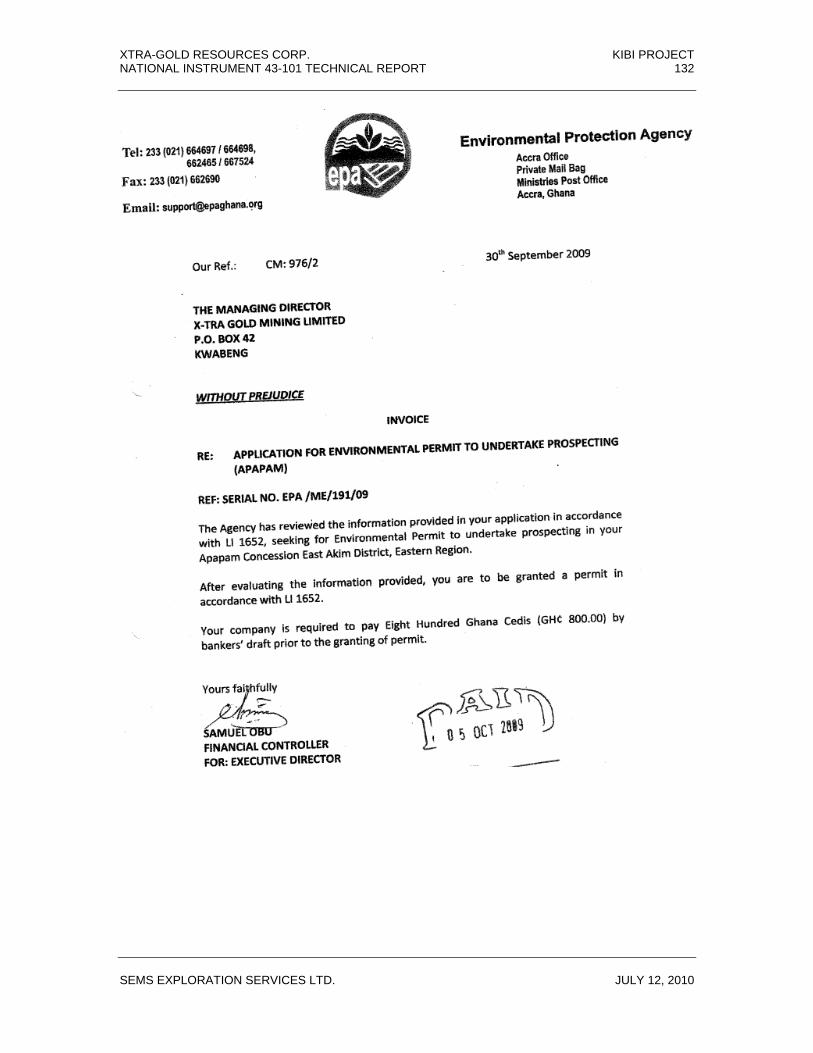
XTRA-GOLD RESOURCES CORP. KIBI PROJECT NATIONAL INSTRUMENT 43-101 TECHNICAL REPORT 132
SEMS EXPLORATION SERVICES LTD. JULY 12, 2010
XTRA-GOLD RESOURCES CORP. KIBI PROJECT NATIONAL INSTRUMENT 43-101 TECHNICAL REPORT 133
SEMS EXPLORATION SERVICES LTD. JULY 12, 2010

XTRA-GOLD RESOURCES CORP. KIBI PROJECT NATIONAL INSTRUMENT 43-101 TECHNICAL REPORT 134
SEMS EXPLORATION SERVICES LTD. JULY 12, 2010
APPENDIX 2
Supporting Staking Application Documentation for the Apapam ML Extension

XTRA-GOLD RESOURCES CORP. KIBI PROJECT NATIONAL INSTRUMENT 43-101 TECHNICAL REPORT 135
SEMS EXPLORATION SERVICES LTD. JULY 12, 2010

XTRA-GOLD RESOURCES CORP. KIBI PROJECT NATIONAL INSTRUMENT 43-101 TECHNICAL REPORT 136
SEMS EXPLORATION SERVICES LTD. JULY 12, 2010
APPENDIX 3
Supporting Staking Application Documentation for the Akim-Apapam Concession
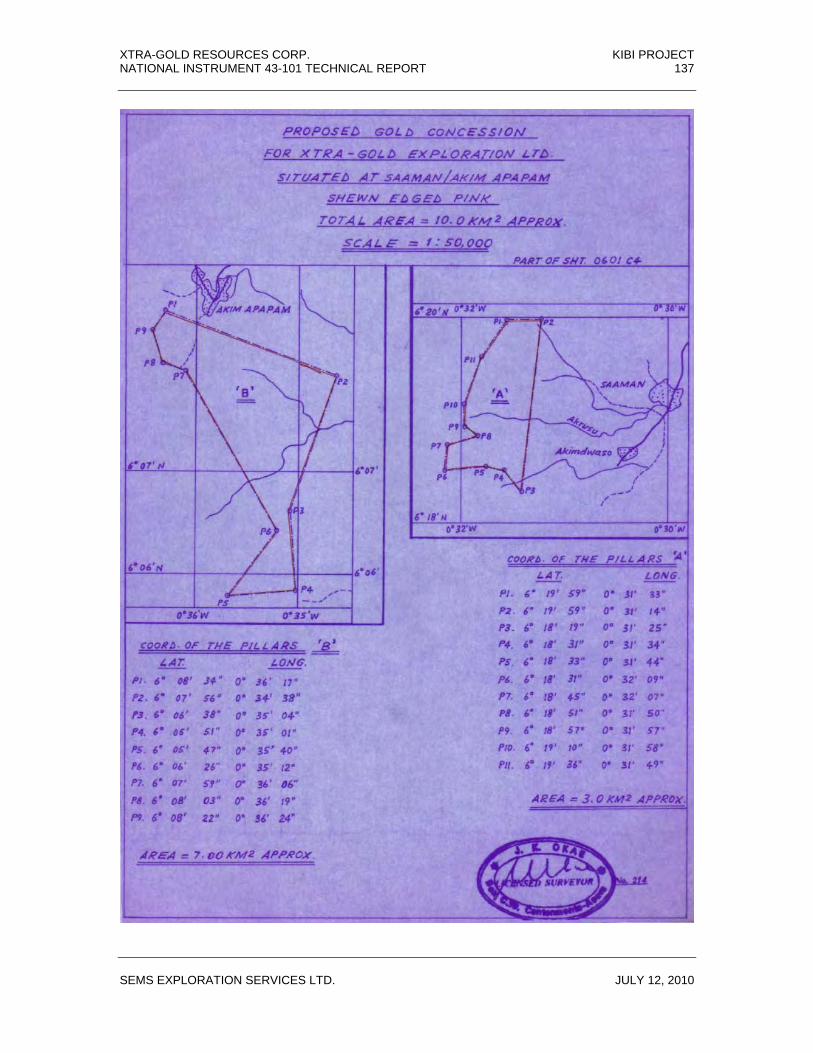
XTRA-GOLD RESOURCES CORP. KIBI PROJECT NATIONAL INSTRUMENT 43-101 TECHNICAL REPORT 137
SEMS EXPLORATION SERVICES LTD. JULY 12, 2010
XTRA-GOLD RESOURCES CORP. KIBI PROJECT NATIONAL INSTRUMENT 43-101 TECHNICAL REPORT 138
SEMS EXPLORATION SERVICES LTD. JULY 12, 2010
XTRA-GOLD EXPLORATION LIMITED
(XGEL)
PROPOSED WORK PROGRAM
FOR
SAAMAN/AKIM-APAPAM
RECONNAISSANCE LICENCE
PREPARED BY
AMBROSE AMOAKO (MGhIG 331)

XTRA-GOLD RESOURCES CORP. KIBI PROJECT NATIONAL INSTRUMENT 43-101 TECHNICAL REPORT 139
SEMS EXPLORATION SERVICES LTD. JULY 12, 2010
JANUARY 2008
CONTENTS PAGE GENERAL 1 INTRODUCTION LOCATION 1 ACCESSIBILITY 3 GEOGRAPHICAL SETTING 3 INFRASTRUCTURE 3 GEOLOGICAL ENVIRONMENT 4 REGIONAL GEOLOGY 4 REGIONAL MINERALIZATION 6 LOCAL GEOLOGY 10 PREVIOUS WORK 10 PROSPECTS 11 GOLD POTENTIAL 12 PROPOSED EXPLORATION PROGRAM 13 INTRODUCTION 13 DESK STUDY AND RECONNAISSANCE FIELD VISITS 14 STREAM SEDIMENT SAMPLING 14 ROCK CHIP SAMPLING 15 GEOLOGICAL MAPPING 15 ASSESSMENT OF OLD WORKINGS 15 RECONNAISSANCE SOIL GEOCHEMISTRY 16 ENVIRONMENT ISSUES 16 PROPOSED EXPLORATION BUDGET 18 PROGRAM SCHEDULE 19

XTRA-GOLD RESOURCES CORP. KIBI PROJECT NATIONAL INSTRUMENT 43-101 TECHNICAL REPORT 140
SEMS EXPLORATION SERVICES LTD. JULY 12, 2010
GENERAL
INTRODUCTION
Xtra-Gold Exploration Limited (XGEL) a subsidiary of Xtra Gold Resources Corporation
has been incorporated and authorized in Ghana to invest in and acquire mineral rights and
license to undertake mineral exploration.
XGEL is well resourced and capable of conducting suitable exploration programs on the
reconnaissance license, which is being applied for.
As one of its prime objectives, XGEL is applying for the Saaman/ Akim-Apapam gold
concessions and keen on committing its resources to the exploration and discovery of
economic gold deposit on the proposed concession.
LOCATION
The proposed Saaman/Akim Apapam (Area A/Area B) concessions reconnaissance
license covers an area of 3.0sqkm and 7.0sqkm respectively and located in Eastern
Region of Ghana on field sheet 0601D1 and 0601C4. The concession ‘A’ lies between
longitudes 00 31` 14"west and 00 32' 09" west and latitudes 60 18' 31" North and 60 19'
59" North. The concession ‘B’ lies between longitudes 0º 34' 38" west and longitudes 0º
36’ 24” west and latitudes 6º 05’ 47” North and 6º 08’ 34” North. The areas are shown
edged red on the attached site plan of the concession areas.
Below are the co-ordinates of the concession pillars:
1
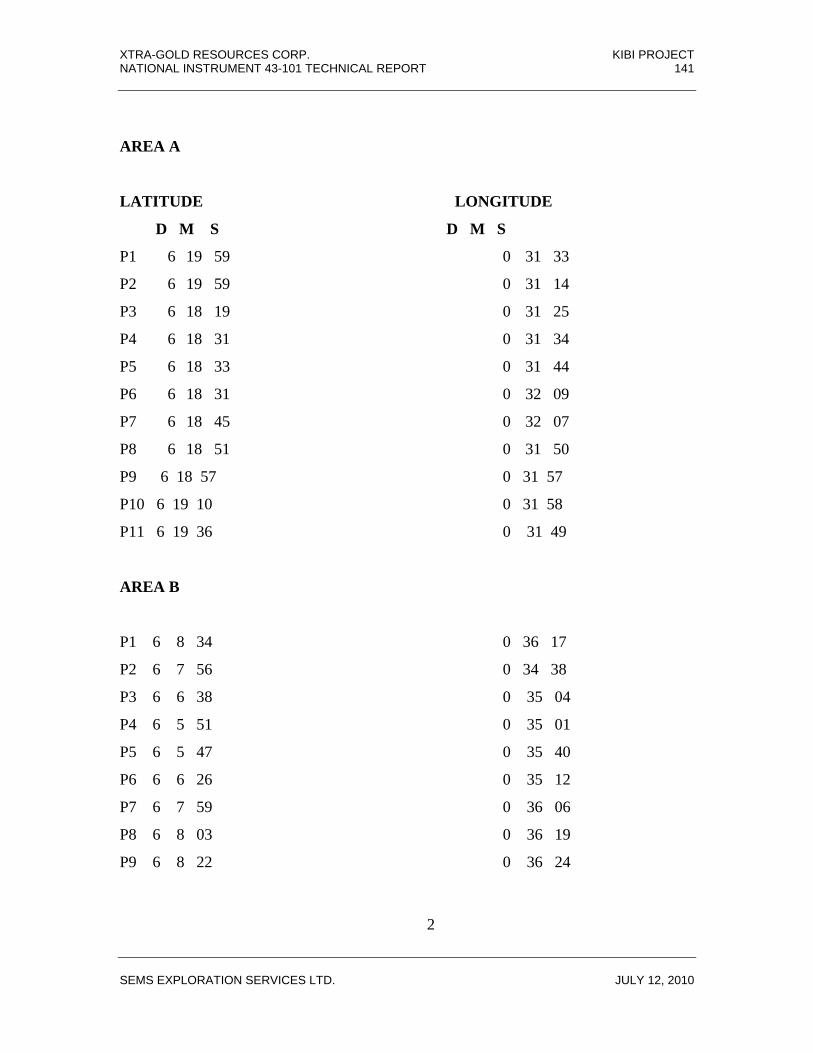
XTRA-GOLD RESOURCES CORP. KIBI PROJECT NATIONAL INSTRUMENT 43-101 TECHNICAL REPORT 141
SEMS EXPLORATION SERVICES LTD. JULY 12, 2010
AREA A
LATITUDE LONGITUDE
D M S D M S
P1 6 19 59 0 31 33
P2 6 19 59 0 31 14
P3 6 18 19 0 31 25
P4 6 18 31 0 31 34
P5 6 18 33 0 31 44
P6 6 18 31 0 32 09
P7 6 18 45 0 32 07
P8 6 18 51 0 31 50
P9 6 18 57 0 31 57
P10 6 19 10 0 31 58
P11 6 19 36 0 31 49
AREA B
P1 6 8 34 0 36 17
P2 6 7 56 0 34 38
P3 6 6 38 0 35 04
P4 6 5 51 0 35 01
P5 6 5 47 0 35 40
P6 6 6 26 0 35 12
P7 6 7 59 0 36 06
P8 6 8 03 0 36 19
P9 6 8 22 0 36 24
2

XTRA-GOLD RESOURCES CORP. KIBI PROJECT NATIONAL INSTRUMENT 43-101 TECHNICAL REPORT 142
SEMS EXPLORATION SERVICES LTD. JULY 12, 2010
ACESSIBILITY
The concession area A is approximately 120 km NE of Accra and accessible from the
main Kumasi – Accra highway via Osino – Saaman paved road, whilst the concession B
is approximately 5km southwest of Kibi town. A network of foot paths and tracks link
most of the communities within the concession areas.
GEOGRAPHICAL SETTING
The climate within the area is equatorial with relatively high humidity throughout the
year. Rainfall is of two maxima, high and unpredictable especially during the peak period
which falls between May and June with minor rain in August. The rainfall per annum is
1500mm – 2000mm.
The dry season is generally from January to February. Temperatures ranges between 220
C and 300 C. the dominant topographic expression is the Atiwa Range in the northwestern
part of concession ‘B’.
The Birim River and its tributaries drain both concessions.
INFRASTRUCTURE
The proposed license area features two main towns, Asaaman and Apapam. Water is
abundant in the areas throughout the year for both domestic and mining.
Modern economic infrastructure such as schools, potable water, electricity, hospitals are
available at Osino and Kibi. Communication is fairly easy due to the availability of the
mobile communication network companies such as One Touch, Areeba and Tigo.
3
XTRA-GOLD RESOURCES CORP. KIBI PROJECT NATIONAL INSTRUMENT 43-101 TECHNICAL REPORT 143
SEMS EXPLORATION SERVICES LTD. JULY 12, 2010
GEOLOGICAL ENVIRONMENT
REGIONAL GEOLOGY
A complete and detailed description of the geology of Ghana can be found in Kesse
(1985). Structural and lithological evolution is also discussed by Eisenlohr (1989), Leube
and Hirdes (1986) and Leube et al (1990).
The proposed concessions are underlain by Birimian volcanic and sedimentary rocks of
the Kibi – Winneba belt which have been metarmorphosed to greenschist facies. The Kibi
– Winneba belt also trend in the NE – SW and is approximately 70km with an average
width of approximately 25km.
The geological evolution of the Kibi – Winneba belt commenced with stabilization of the
crest followed by an episode of rifting and incipient ocean floor spreading. Rifting gave
rise to the formation of tectonically active basin and micro – plates. Along plate margins,
volcanic island – arc complexes formed. Volcaniclastic associated with the island arc
complexes, along with sediments derived from uplift and erosion of the craton margins,
fed the Basins.
Rifting was followed by compression during the Eburnean Orogeny in which the island
arc and basinal assemblages were deformed. Under the compressional regime, the basinal
sediments were folded and the island arc assemblages migrated along major thrust faults.
Later deformation gave rise to major wrench faults, which occurred preferentially at the
margins of the volcanic belts and basinal sediments.
4

XTRA-GOLD RESOURCES CORP. KIBI PROJECT NATIONAL INSTRUMENT 43-101 TECHNICAL REPORT 144
SEMS EXPLORATION SERVICES LTD. JULY 12, 2010
The Eburnean Orogeny gave rise to a series of northeast trending linear volcanic belts
(greenstone belts) and resulted in intense deformation of basinal sediments.
These sediments and associated volcanics collectively form the Birimian supergroup. The
Orogeny was associated with several phases of tectonic activity, not all of which were
compressive. Periods of extension in the Kibi – Winneba Basin and tentatively related to
renewed “hot spot” activity and the formation of deep – seated faults, which are located
within the basinal metasediments. These faults trend northeast-southwest and are similar
in genesis and characteristic of the Asankragwa fault in the Kumasi Basin.
The margins of the belt and basin commonly exhibit faulting on local and regional scales
and these structures are of fundamental importance in the development of gold deposits
in the region.
Syn – and post – tectonic granitoids intruded both the metasediments and metavolcanics
of the Birimian Supergroup as a result of the Eburnean Orogeny. The granitoids can be
broadly group into two types; Basin and Belt types.
Basin granitoids intrude the metasedimentary basin whereas Belt type intrudes the
volcanic and volcano sedimentary assemblages.
Uplift and erosion, prior to the final stages of deformation, resulted in the deposition of
intracratonic sediments; the Tarkwaian Supergroup, which unconformably overlie the
Birimian. The contact between the Tarkwaian and Birimian Supergroups is always
tectonic and may represent migration of the Tarkwaian along major trusts.
5
XTRA-GOLD RESOURCES CORP. KIBI PROJECT NATIONAL INSTRUMENT 43-101 TECHNICAL REPORT 145
SEMS EXPLORATION SERVICES LTD. JULY 12, 2010
REGIONAL MINERALIZATION
In – situ mineralization has not been defined on both concessions. To date, most
exploration has been focused on the development of alluvial occurrences. Gold bearing
quartz veins are noted in several localities, the most notable at Kibi and Kwabeng. Early
exploration and development on the Kibi veins indicated fairly high but erratic grades.
Gold associated with pyrite and vein widths vary between 0.1 and 1 meter. The vein has
been traced over 300 meters (griffs et al, 2002).
On the whole, mineralization in the country can be divided into two main environments
based on spatial associations. The first environment lays close to boundary faults that
separate greenstone belts from basinal sediment whilst the second is found within the
intrabasinal assemblage. The age of mineralization is known.
Boundary Fault Environment
For over a century, mineralization associated with belt – basin faults was the target for
both local prospectors and foreign exploration companies; it was a primary exploration
target due to the presence of coarse, visible gold. Deposits of this type in Ghana include
Obuasi, Prestea, Bogosu, Konongo, and Bibiani. There are a number of commonly
observed associations with this mineralization environment, which include:
• Located on, or close to the lithological contact between greenstones and
metasediments;
• Spatially related to deep-seated, high-angle wrench faults, which have a strike
extent exceeding 100 kilometers. Cross-cutting northwest-southeast trending
faults have also exerted an influence on the location of gold remobilized from the
main zones;
6

XTRA-GOLD RESOURCES CORP. KIBI PROJECT NATIONAL INSTRUMENT 43-101 TECHNICAL REPORT 146
SEMS EXPLORATION SERVICES LTD. JULY 12, 2010
• Native gold is hosted by quartz veins, which may posses an en-echelon character.
Grade-width characteristics persist virtually unchanged to depths exceeding one
kilometer. The veins broadly parallel the regional foliation but in detail are seen to
cross-cut this foliation.
• Disseminated sulphides in the wall rock are common;
• Several generations of quartz veining are common and gold is seemingly
associated with the final phase;
• Mineralization is spatially associated with graphitic phyllites and manganiferous
sediments;
• Mineralogy is simple with a strong positive correlation between gold and
arsenopyrite. Accessory minerals include pyrite, chalcopyrite, pyrrhotite, and
bornite;
• Strong silicification is common, accompanied by sericite and carbonate alteration.
Tourmaline may also be present; and,
• Granitoids may or may not be spatially associated with mineralization.
Intrabasinal Environment
Although mineralization associated with intrabasinal sediments has received less
exploration attention, the significance of these deposits is now being recognized. The
Kumasi Basin, southeast of Sefwi Belt best represents this style of mineralization, which
is also encountered in the northerly Sunyani Basin. Two different associations are
recognized in this style of mineralization, as outlined below.
Sedimentary Association
• Disseminated mineralization, hosted by graphitic and manganiferous argillite and
tufaceous phyllite, with a strike extent exceeding 1,000 meters and a width in
excess of 30 meters;
•
7

XTRA-GOLD RESOURCES CORP. KIBI PROJECT NATIONAL INSTRUMENT 43-101 TECHNICAL REPORT 147
SEMS EXPLORATION SERVICES LTD. JULY 12, 2010
• A direct association with intrabasinal faults; the Asankragwa fault is the prime
example in the Kumasi Basin and the Yamfo trend has a similar association in the
Sunyani Basin;
• Mineralogy is simple with disseminated pyrite-arsenopyrite with subordinate
chalcopyrite. Silicification is common; and,
• Mineralization is spatially associated with late-stage granitoids which are
controlled along the major intrabasinal shears.
Intrabasinal Granitoid Association
Mineralization associated with granitoids within the intrabasinal environment contains
two sub-groups, Type I and Type II mineralization.
Type I
Type I mineralization is represented by the Bokitisi Mine at Ayanfuri, between Bogosu
and Dunkwa. Characteristics;
• The granitoid is related to a northeast-southwest trending spur from the main
Ashanti Belt and shows affinity with a swarm of east-northeast to west southwest
trending parasitic shears.
• Pervasive sericitic alteration accompanied by silification
• Mineralogy is simple with gold –pyrite accompanied by subordinate pyrrhotite
and chalcopyrite. Minor tellurides are reported.
• Grade drops sharply to background level at the country rock contact. The thermal
aurole is some tens of meters wide and is associated with pyrite-carbonate
alteration.
Bokitisi is the only granite which has been exploited in Ghana, although disseminated
gold is hosted by granite at the Ity occurrence in Cote d’Ivoire. The existence of similar
occurrences, offering the potential for low grade-bulk tonnage resources, is good.
8

XTRA-GOLD RESOURCES CORP. KIBI PROJECT NATIONAL INSTRUMENT 43-101 TECHNICAL REPORT 148
SEMS EXPLORATION SERVICES LTD. JULY 12, 2010
Type II
Type II mineralization is well represented by the Nkran Hill deposit and the Bilpraw
mine where it is associated with deep seated intrabasinal shears. Characteristics of the
Type II style of mineralization include;
• A close spatial association with major northeast-southwest trending faults. These
faults have a strike extent exceeding 200 kilometers and are associated with
secondary, parallel faults, which may be mineralized. Secondary faults are
oblique to the major faults and are locally en-echelon.
• Close spatial association with Dixcove and Cape Coast granitic intrusives. Both
types of granite may be found in one area as demonstrated at the Ntubia Mine.
• Presence of biotite porphyry dykes from granitoids at depth.
• Simple mineralogy with gold-arsenopyrite and subordinate chalcopyrite. Gold is
hosted by quartz veins and stockwork zones.
• Typically associated with manganiferous sediments with sulphidic lenses and
silica-carbonate alteration.
• Lithologies close to mineralization consist of tufaceous phyllites, locally graphitic
in zones of structural complexity, with greywacke and sparse volcanics.
• Soil anomalies associated with mineralization may extend up 4 kilometers along
strike with a width of 2 kilometers.
9

XTRA-GOLD RESOURCES CORP. KIBI PROJECT NATIONAL INSTRUMENT 43-101 TECHNICAL REPORT 149
SEMS EXPLORATION SERVICES LTD. JULY 12, 2010
LOCAL GEOLOGY
The concessions fall in the north-eastern and southwestern corners of the Kibi – Winneba
belt. They are underlain by Birimian metavolcanic and metasediments. An inferred
contact between volcanics and sediments runs NE-SW near the concession ‘A’. Rock
exposures are generally poor except for few places such as road cuts.
Outcrops and rock boulders of volcanic origin are prevalent on hills. The rocks found on
hills slopes and bottom of hills slopes are mainly volcanics, quartzite and greywacke. The
Birimian metasedimentary rocks found in the low lying areas are phyllite, greywackes,
and quartzite. However, minor quartz veins and sulphide dissemination are observed in
some of the outcrops and boulders.
In general, dips of both bedding and foliations lie in the range 300-800. Quartzites of the
Voltaian system form a prominent escarpment of the north-east of the Birim River in
concession ‘A’.
PREVIOUS WORK
Past gold .production in the district has been almost extensively come from alluvial
deposits on the Birim River and its tributaries. No bedrock sources of gold have been
identified although some mineralized quartz veins and lodes have been identified in the
Kibi district.
There is abundant evidence of small scale mining activity in the area i.e. the presence of
numerous circular shafts and pits are enough evidence. Small Scale mining probably
occurred prior to the start of European based mining activity in the late 19th century.
10

XTRA-GOLD RESOURCES CORP. KIBI PROJECT NATIONAL INSTRUMENT 43-101 TECHNICAL REPORT 150
SEMS EXPLORATION SERVICES LTD. JULY 12, 2010
On the Birim River flood plain near Apapam, additional evidence was discovered of
some previous large scale mining activity. Large heaps of washed gravels, covering an
area of several hectares are present, but there are no other indications of what sort of
machinery was used, or whether the work was carried out for diamonds or gold.
However, the past work is an encouraging indication of the prospectivity of the area.
In February, 1990 Kibi Goldfields International Ltd which is just sharing boundary on the
eastern side of Saaman concession under the instructions of Minproc Engineers, a
consulting company carried out a pitting program involving ten reconnaissance pits.
Quite recently from October 2006, a vigorous ‘galamsey’ activity for hardrock is on-
going at Abompe also near the area. Extensive workings, including very numerous pits
and underground stopes extend over their working area and this revealed the presence of
mineralized sheared quartz veins hosted in phyllite.
PROSPECTS
The alluvial gold in the areas have been documented by the existence of Birim River flats
and more so the proximity of Saaman to the Kibi Goldfields prospects may also consist
of the gold bearing quartz veins and sulphide mineralization in iron-carbonate altered
meta-mafic volcanic and meta-sedimentary rocks which has recently been reported.
11

XTRA-GOLD RESOURCES CORP. KIBI PROJECT NATIONAL INSTRUMENT 43-101 TECHNICAL REPORT 151
SEMS EXPLORATION SERVICES LTD. JULY 12, 2010
GOLD POTENTIAL
The proximity of the Saaman concession to an inferred contact between the
metavolcanics and metasediments in the Kibi Goldfields area which is one of the targeted
environments for gold mineralization within the region and also with the Apapam
concession near the Atiwa range and source of the river Birim shows evidence of areas
quite favourable for vein and stockwork systems as experienced in some parts of the
region.
12

XTRA-GOLD RESOURCES CORP. KIBI PROJECT NATIONAL INSTRUMENT 43-101 TECHNICAL REPORT 152
SEMS EXPLORATION SERVICES LTD. JULY 12, 2010
PROPOSED EXPLORATION PROGRAM
INTRODUCTION
The presence of alluvial gold in the beds and valleys flats of the Birim river and its
tributaries flowing through the concession areas together with the contact between the
metavolcanics and metasediments also running near the concession area A are good
indications of bedrock gold mineralization. The exploration work in the proposed
concession areas will be handled by 2 Geologists, 2 geological Technicians, 4 field
assistants and forty (40) unskilled casual labourers.
Preference of the unskilled labour will come from communities within the concession.
Exploration work will be directed from company’s office in Akyem Kwabeng.
Detailed research analysis will be carried out on historical geological information of the
concession and its surrounding areas; their classification and interpretation.
Prior to the commencement of any field work, Xtra-Gold Exploration Ltd. will hold
meetings with District Assembly Officials, traditional rulers and elders, opinion leaders
and the general public to fully inform the local population of XGEL aims and objectives.
A committee involving farmers, assembly members and XGEL will be formed so that
reasonable terms of rates of crop compensation of any damage property or crops during
the activities are well negotiated for.
13
XTRA-GOLD RESOURCES CORP. KIBI PROJECT NATIONAL INSTRUMENT 43-101 TECHNICAL REPORT 153
SEMS EXPLORATION SERVICES LTD. JULY 12, 2010
DESK STUDY AND RECONNAISSANCE FIELD VISITS
All known information on the general area as regards to lithology, structure, types of
mineralization, location of old workings, geochemical, geophysical, aerial photos and
Landsat ETM scenes will be collated and evaluated. Assessment of availability of local
labour and their caliber will be made during the visits.
Interviews with the inhabitants of the area to verify information on past and present
mining activities in the area will also be included in this phase of the program.
REGIONAL STREAM SEDIMENT SAMPLING
The stream sediment sampling program will be designed to cover the entire concessions.
A sampling density of 1 sample per sq. km will be adopted in order to effectively locate
possible gold bearing structures or bodies.
The program will in addition involve the collection to minus 80 mesh silt fraction and
minus I mm Bulk Leach Extractable Gold (BLEG) samples and heavy mineral
concentrate.
Silt Fraction samples will be analyzed by Fire Assay and BLEG samples will be by
Bottle Roll Cyanide leach extraction with AAS finish.
14

XTRA-GOLD RESOURCES CORP. KIBI PROJECT NATIONAL INSTRUMENT 43-101 TECHNICAL REPORT 154
SEMS EXPLORATION SERVICES LTD. JULY 12, 2010
ROCK CHIP SAMPLING
Outcrop and float sampling will be routinely undertaken in areas drained by streams from
which visible gold would be recorded in panned concentrates. Particular attention would
also be paid to limonite and iron-stained and bedrock exposures.
GEOLOGICAL MAPPING
Geological Mapping which involves traversing on cut lines, footpaths, hunters trails, and
examination of excavations and road cuttings would be carried on along side the stream
sediments sampling program. Particular attention will be paid to quartz reef veins,
outcrops, alteration and mineralized zones as well as structural control associated with
gold occurrences and represented on a scale of 1:10000
ASSESSMENT OF OLD WORKINGS
The aim of this assessment is to describe and categorize the likely type of occurrences,
rank them according to priority for further work and to determine the nature of such
further work. The following geological and sampling techniques will be employed.
• Rehabilitation of old workings i.e. trench, pits, shaft, adits etc
• Sketch geological mapping
• Grab / selective sampling of outcrops or tailings.
15

XTRA-GOLD RESOURCES CORP. KIBI PROJECT NATIONAL INSTRUMENT 43-101 TECHNICAL REPORT 155
SEMS EXPLORATION SERVICES LTD. JULY 12, 2010
RECONNAISSANCE SOIL GEOCHEMISTRY
This will mainly be carried out based on the results of the stream sediment anomalies and
favourable geological structures inferred from the landsat and airborne geophysical
interpretation. A base line will be set out and grid cross lines will be cut at 400m interval
to provide control for a reconnaissance soil sampling program.
Significant anomalies will be resurveyed and an in fill lines at 200m and 100m- line
spacing will be cut. Soil sampling will be taken at 400m by 50m spacing and based on the
results, an in-fill of 25m would be done. Samples will be taken from the B-C horizon at
an average depth of 60cm with an improvised tool locally called taper’s axe. The last
batch of material from the hole will be put in a calico bag to a weight of 3-4kg and
labeled. Duplicate samples will be taken on every tenth sample position together with
standard and blank references in the sample sequence to monitor the integrity of the
geochemical database and also to provide a measure of precision, accuracy and
confidence on the analysis.
ENVIRONMENTAL ISSUES
The environmental impact of the proposed exploration program will be minimal to
negligible, very temporary and wholly reversible. Much of the initial work can be
describe as “Non-Earth Moving Activities” that have minimal environmental impact.
It is only on receiving positive results of this work that the next stage of the pitting and
trenching will be employed. Line cutting for soil sampling will be controlled to minimize
cutting and felling of trees. Access to most of the project areas will be by way of tracks
and footpaths. These are extensive and no additional access is required at present.
16

XTRA-GOLD RESOURCES CORP. KIBI PROJECT NATIONAL INSTRUMENT 43-101 TECHNICAL REPORT 156
SEMS EXPLORATION SERVICES LTD. JULY 12, 2010
Farmers who fall victim to crop damages will be compensated at an agreed rate by the
farmers committee.
17
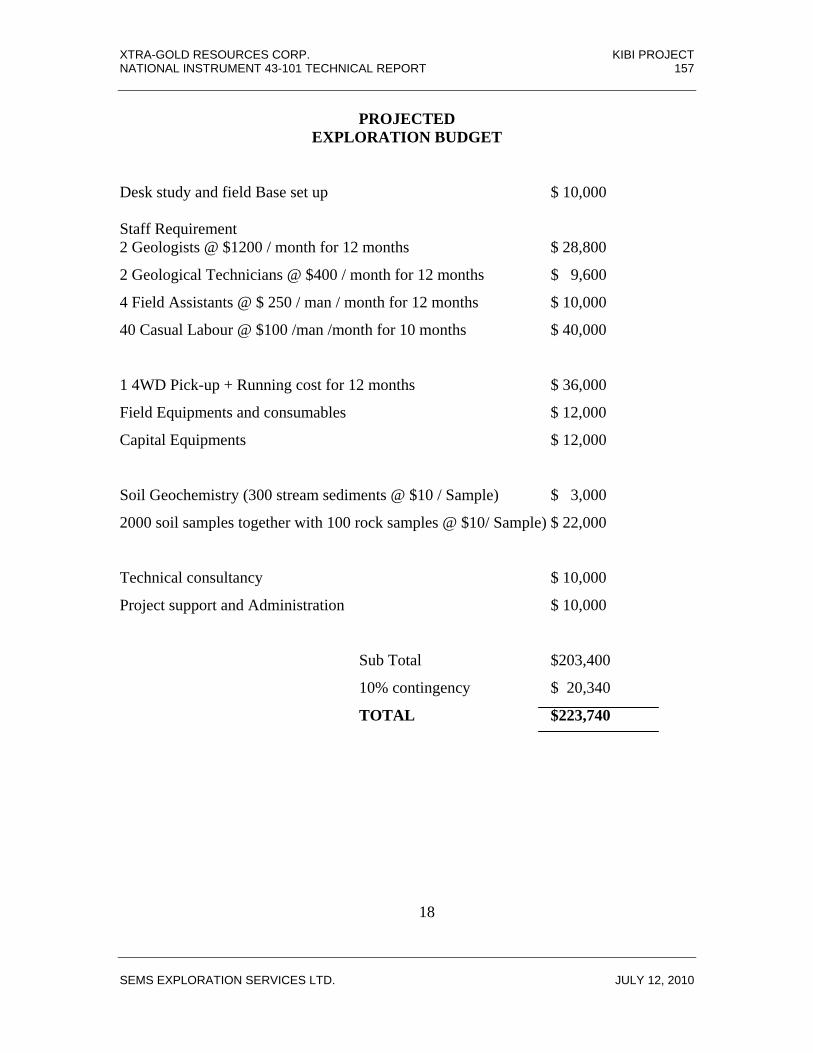
XTRA-GOLD RESOURCES CORP. KIBI PROJECT NATIONAL INSTRUMENT 43-101 TECHNICAL REPORT 157
SEMS EXPLORATION SERVICES LTD. JULY 12, 2010
PROJECTED EXPLORATION BUDGET
Desk study and field Base set up $ 10,000 Staff Requirement 2 Geologists @ $1200 / month for 12 months $ 28,800
2 Geological Technicians @ $400 / month for 12 months $ 9,600
4 Field Assistants @ $ 250 / man / month for 12 months $ 10,000
40 Casual Labour @ $100 /man /month for 10 months $ 40,000
1 4WD Pick-up + Running cost for 12 months $ 36,000
Field Equipments and consumables $ 12,000
Capital Equipments $ 12,000
Soil Geochemistry (300 stream sediments @ $10 / Sample) $ 3,000
2000 soil samples together with 100 rock samples @ $10/ Sample) $ 22,000
Technical consultancy $ 10,000
Project support and Administration $ 10,000
Sub Total $203,400
10% contingency $ 20,340
TOTAL $223,740
18

XTRA-GOLD RESOURCES CORP. KIBI PROJECT NATIONAL INSTRUMENT 43-101 TECHNICAL REPORT 158
SEMS EXPLORATION SERVICES LTD. JULY 12, 2010

XTRA-GOLD RESOURCES CORP. KIBI PROJECT NATIONAL INSTRUMENT 43-101 TECHNICAL REPORT 159
SEMS EXPLORATION SERVICES LTD. JULY 12, 2010

XTRA-GOLD RESOURCES CORP. KIBI PROJECT NATIONAL INSTRUMENT 43-101 TECHNICAL REPORT 160
SEMS EXPLORATION SERVICES LTD. JULY 12, 2010
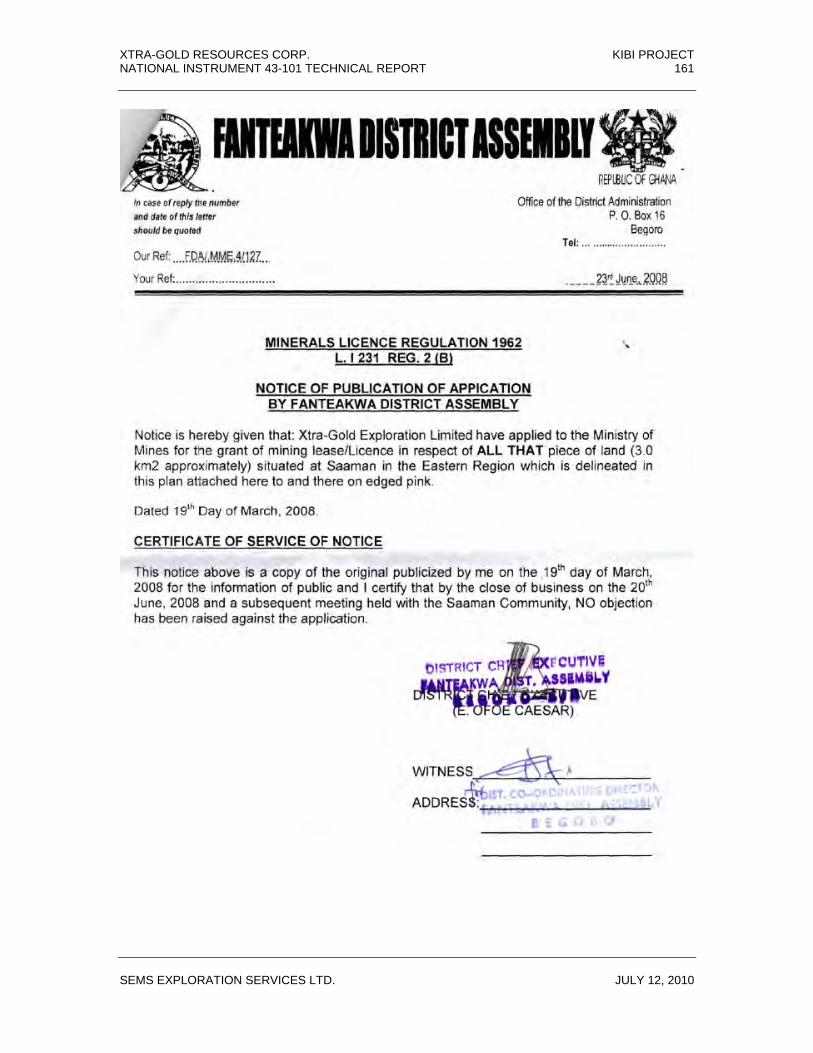
XTRA-GOLD RESOURCES CORP. KIBI PROJECT NATIONAL INSTRUMENT 43-101 TECHNICAL REPORT 161
SEMS EXPLORATION SERVICES LTD. JULY 12, 2010

XTRA-GOLD RESOURCES CORP. KIBI PROJECT NATIONAL INSTRUMENT 43-101 TECHNICAL REPORT 162
SEMS EXPLORATION SERVICES LTD. JULY 12, 2010
APPENDIX 4
Drill Hole Strip Logs Holes KBD08004 to KBD08018
and Holes KBRC09019 to KBRC09068
(68 pages of strip logs (pages 163 to 231) can be inspected at the offices of Xtra-Gold Resources Corp. upon written request)

XTRA-GOLD RESOURCES CORP. KIBI PROJECT NATIONAL INSTRUMENT 43-101 TECHNICAL REPORT 232
SEMS EXPLORATION SERVICES LTD. JULY 12, 2010
APPENDIX 5
QA-QC Report
Xtra-Gold (Ghana)
Quality control of assay results related to exploration activities
during the Period 2008 and 2009 with specific emphasis on
Diamond Core and Reverse Circulation drilling
Prepared
By
SEMS-Exploration (Ghana)
In fullfillment of Instrument “43-101” of the Toronto Stock Exchange
Tarkwa 20 March 2010
XTRA-GOLD RESOURCES CORP. KIBI PROJECT NATIONAL INSTRUMENT 43-101 TECHNICAL REPORT 233
SEMS EXPLORATION SERVICES LTD. JULY 12, 2010
CONTENTS 1. INTRODUCTION 2. SAMPLEPREPARATION
Laboratory 3. STANDARDS 3.1. Introduction 3.2. Laboratory standards
3.3. Client standards 3.3.1. Client standard failures and reassay
3.4. Conclusions 4. BLANKS
4.1. Laboratory blanks 4.2. Client blanks
5. DUPLICATES
5.1. Introduction 5.2. Laboratory duplicates
5.2.1. Diamond core 5.2.2. RC Chips
5.3. Client duplicates RC Chips 5.3.1. Splitting error
6. LABORATORY CHECK REPEATS
6.1. Introduction 6.2. Diamond core 6.3. RC Chips
7. MEAN PERCENT DIFFERENCE (CHECK REPEATS)
7.1. Diamond core 7.2. RC Chips
8. Q-Q PLOTS CHECK REPEATS 9. RESUBMITED REJECTS (XTRA-GOLD)
9.1. Diamond core 9.2. RC Chips 9.3. Conclusions
10. QUARTER CORE ANALYSIS (XTRA-GOLD) 11. SCREEN FIRE ASSAY 12. DUPLICATE ANALYSIS OF SELECTED COARSE REJECTS (SEMS)
12.1. Splitting error 13. GRAVIMETRIC REPEATS 14. QUARTER CORE ANALYSIS (SEMS) 15. LABORATORY AUDIT 16. CONCLUSIONS AND RECOMMENDATIONS References Certificate
XTRA-GOLD RESOURCES CORP. KIBI PROJECT NATIONAL INSTRUMENT 43-101 TECHNICAL REPORT 234
Figures can be inspected at the offices of Xtra-Gold Resources Corp. upon written request.
SEMS EXPLORATION SERVICES LTD. JULY 12, 2010
LIST OF FIGURES
1. Flow chart Fire Assay 2. Flow chart Screen Fire Assay 3-4 Histogram and time variation: OxE56 5-6 Histogram and time variation: OxF65 7-8 Histogram and time variation: OxG70 9-10 Histogram and time variation: OxI67 11-12 Histogram and time variation: ST 335 13-14 Histogram and time variation: OxN62 15 Precision and accuracy: Laboratory standards 16 Comparision: Laboratory and manufacturer defined standard deviations 17-18 Histogram and time variation: CDN-GS-19 19-20 Histogram and time variation: CDN-CM1 21-22 Histogram and time variation: CDN-GS-1E 23-24 Histogram and time variation: CDN-GS-3D 25-26 Histogram and time variation: CDN-GS-3E 27-28 Histogram and time variation: CDN-GS-4A 29-30 Histogram and time variation: CDN-GS-5D 31-32 Histogram and time variation: CDN-GS-7A 33-34 Histogram and time variation: CDN-GS-P8 35-36 Histogram and time variation: CDN-GS-11A (Gravimetric) 37 Standard type vs precision and accuracy 38 Correlation of reassay pairs 39 Client blanks 40-41 Correlation laboratory duplicates: Diamond core 42 Correlation laboratory duplicates: RC chips 43 Correlation Xtra-Gold RC duplicates 44-45 Correlation laboratory check repeats: Diamond core 46-47 Correlation laboratory check repeats: RC chips 48-49 Mean percent difference and MPD vs grade: Diamond core 50-51 Mean percent difference and MPD vs grade: RC chips 52-53 Q-Q plots Diamond core and RC chips 54-55 Resubmitted diamond core reject (Xtra-Gold) 56-57 Resubmitted RC chips (Xtra-Gold) 58-59 Correlation quartered core (Xtra-Gold) 60-61 Correlation Screen Fire Assay vs Fire Assay 61A-61B Correlation gravimetric determinations 62 Correlation duplicate coarse rejects (SEMS) 63 Particulate sampling chart: Gy LIST OF TABLES 1. Summary statistics: Precision and accuracy laboratory and client standards 2. Summary statistics: Precision and bias (Duplicates and repeats) 3. Summary description: Client standards 4. Standard deviations and ranges: Manufacturer vs ALS Chemex 5. Sieve test data 6. Gravimetric repeats
XTRA-GOLD RESOURCES CORP. KIBI PROJECT NATIONAL INSTRUMENT 43-101 TECHNICAL REPORT 235
Appendices can be inspected at the offices of Xtra-Gold Resources Corp. upon written request.
SEMS EXPLORATION SERVICES LTD. JULY 12, 2010
APPENDICES
1. Results laboratory standards 2. Results client standards 3. Failed client standards 4. Laboratory blanks 5. Test analyses on blanks (Xtra-Gold) 6. Results client blanks 7. Laboratory duplicates 8. Client field duplicates: RC chips 9. Laboratory check repeats 10. Mean Percent Difference: Check repeats 11. Q-Q dataset 12. Results of diamond core reject submission (Xtra-Gold) 13. Results quarter core re-analysis (Xtra-Gold) 14. Screen Fire Assay results 15. Results re-submitted coarse diamond core rejects (SEMS) 16. Results Screen Fire Assay on quarter core (SEMS) 17. Laboratory audit sheets

XTRA-GOLD RESOURCES CORP. KIBI PROJECT NATIONAL INSTRUMENT 43-101 TECHNICAL REPORT 236
SEMS EXPLORATION SERVICES LTD. JULY 12, 2010
1. INTRODUCTION
This report concerns the precision and accuracy of samples collected by Xtra- Gold (XG) during their field operations in 2008 and 2009 at Kwabeng, Ghana. Drilling was carried out on previously defined soil anomalies. Neither the quality of these soil results nor the manner in which they were contoured or otherwise treated statistically is central to this report. Throughout the drilling campaigns, all samples were analysed by ALS Chemex (ALS) at their laboratory based in Kumasi, Ghana. All datasets used in this assessment are derived directly from hard copy reports submitted by ALS. This does not include laboratory duplicates. These, together with laboratory standards and blanks, are shown on a separate sheet attached to the hard copy of results. Duplicate assays, internal standards and blanks were tabulated by XG and subsequently validated by SEMS-Exploration (SEMS) against results sent by ALS. Datasets assessed are: Description Description Laboratory standards XG resubmitted quartered core XG standards XG resubmitted RC duplicates XG Batch reasssay XG Screen Fire Assay vs Fire Assay Laboratory blanks SEMS coarse reject duplicates XG blanks SEMS coarse reject screening Laboratory duplicates (Fire Assay) SEMS resubmitted quartered core Laboratory check repeats SEMS Screen Fire Assay vs coarse reject
duplicates XG field duplicates In addition, ALS Chemex was audited as part of the validation process. In 2008, all drilling was by NQ size diamond core. In 2009, anomaly definition was carried out by reverse circulation drilling. Laboratory jobs associated with this work are: Diamond Drill Core
JobNo JobNo JobNo JobNo JobNo JobNo
KM08137734 KM08157367 KM08159340 KM08167140 KM08167143 KM08167146 KM08157365 KM08157368 KM08159341 KM08167141 KM08167144 KM08176290 KM08157366 KM08157369 KM08159342 KM08167142 KM08167145 KM09000908 (SFA) Reverse Circulation Drilling
JobNo JobNo JobNo JobNo JobNo JobNo
KM09070671 KM09079720 KM09086029 KM09088046 KM09097540 KM09103354 KM09070672 KM09079721 KM09088040 KM09088047 KM09097541 KM09104237 KM09073945 KM09086026 (Reassay) KM09088041 KM09094807 KM09103351 KM09104238 KM09073946 KM09086027 KM09088042 KM09094808 KM09103352 KM09104239 KM09073947 KM09086028 KM09088045 KM09094809 KM09103353
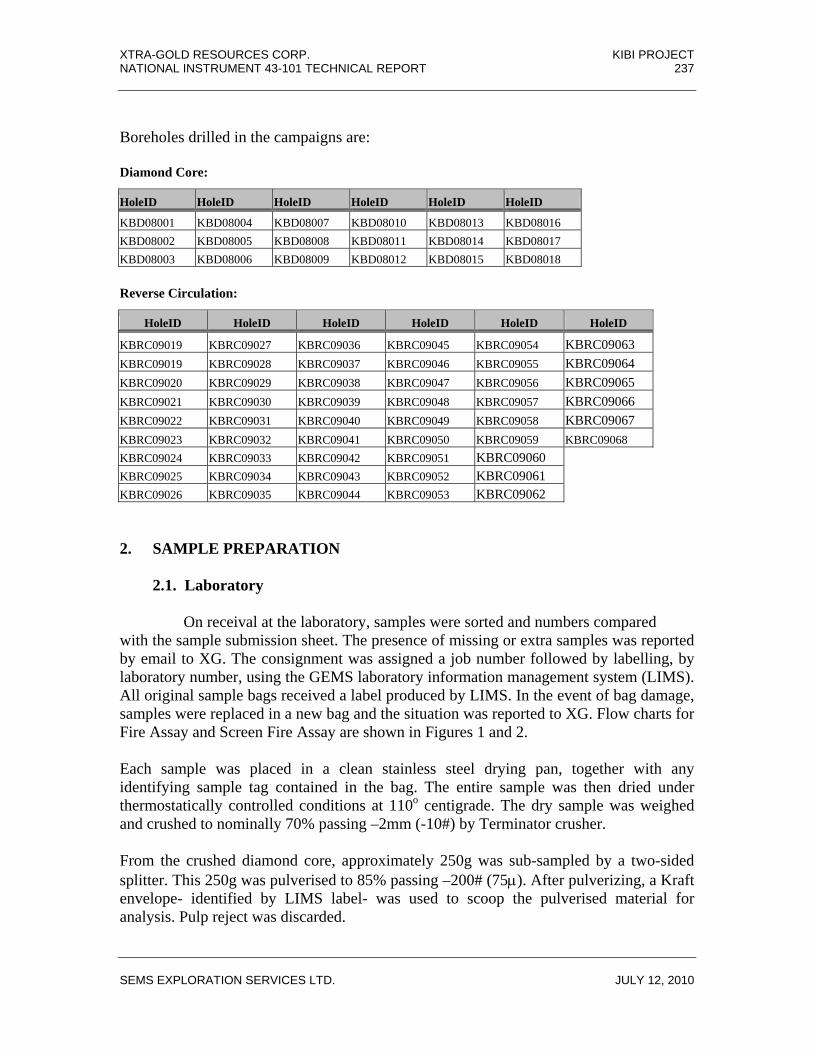
XTRA-GOLD RESOURCES CORP. KIBI PROJECT NATIONAL INSTRUMENT 43-101 TECHNICAL REPORT 237
SEMS EXPLORATION SERVICES LTD. JULY 12, 2010
Boreholes drilled in the campaigns are: Diamond Core:
HoleID HoleID HoleID HoleID HoleID HoleID
KBD08001 KBD08004 KBD08007 KBD08010 KBD08013 KBD08016 KBD08002 KBD08005 KBD08008 KBD08011 KBD08014 KBD08017 KBD08003 KBD08006 KBD08009 KBD08012 KBD08015 KBD08018 Reverse Circulation:
HoleID HoleID HoleID HoleID HoleID HoleID
KBRC09019 KBRC09027 KBRC09036 KBRC09045 KBRC09054 KBRC09063 KBRC09019 KBRC09028 KBRC09037 KBRC09046 KBRC09055 KBRC09064 KBRC09020 KBRC09029 KBRC09038 KBRC09047 KBRC09056 KBRC09065 KBRC09021 KBRC09030 KBRC09039 KBRC09048 KBRC09057 KBRC09066 KBRC09022 KBRC09031 KBRC09040 KBRC09049 KBRC09058 KBRC09067 KBRC09023 KBRC09032 KBRC09041 KBRC09050 KBRC09059 KBRC09068 KBRC09024 KBRC09033 KBRC09042 KBRC09051 KBRC09060 KBRC09025 KBRC09034 KBRC09043 KBRC09052 KBRC09061 KBRC09026 KBRC09035 KBRC09044 KBRC09053 KBRC09062 2. SAMPLE PREPARATION
2.1. Laboratory
On receival at the laboratory, samples were sorted and numbers compared with the sample submission sheet. The presence of missing or extra samples was reported by email to XG. The consignment was assigned a job number followed by labelling, by laboratory number, using the GEMS laboratory information management system (LIMS). All original sample bags received a label produced by LIMS. In the event of bag damage, samples were replaced in a new bag and the situation was reported to XG. Flow charts for Fire Assay and Screen Fire Assay are shown in Figures 1 and 2. Each sample was placed in a clean stainless steel drying pan, together with any identifying sample tag contained in the bag. The entire sample was then dried under thermostatically controlled conditions at 110o centigrade. The dry sample was weighed and crushed to nominally 70% passing –2mm (-10#) by Terminator crusher. From the crushed diamond core, approximately 250g was sub-sampled by a two-sided splitter. This 250g was pulverised to 85% passing –200# (75μ). After pulverizing, a Kraft envelope- identified by LIMS label- was used to scoop the pulverised material for analysis. Pulp reject was discarded.
XTRA-GOLD RESOURCES CORP. KIBI PROJECT NATIONAL INSTRUMENT 43-101 TECHNICAL REPORT 238
SEMS EXPLORATION SERVICES LTD. JULY 12, 2010
Samples varied in total weight from approximately 2 to 3kg. With a 3kg sample, splitting involved four stages. Samples for assay were alternately selected from the left and right splitter pans (See Audit Report: App. 17). Coarse reject material was placed in the original bag, with LIMS label, and stored in rice sacks pending removal by XG. In 2009, the splitting protocol was revised. With RC chips, 1kg was split after crushing and pulverised. In the Weighing Section, 50g was weighed from the Kraft envelope and placed in a plastic bag within a Fire Assay pot (Weighing utilized the LIMS catchweight system where the actual weight varied between the limits 47-53g). Duplicate samples were taken from the original pulp envelope and analysed with a frequency of 1:20. Duplicates were not taken from the coarse reject material. Flux had previously been added to the Fire Assay pot with a flux-sample ratio of 3:1. Copper wire was added to three pots to effect a “Copper map”. Samples were fired in batches or 84 at 1100oC for one hour. In each batch, ALS introduces three duplicates,1 blank and 2 standards. After pouring and “knocking”, lead buttons were cupelled at 950oC for one hour. The resultant “prill” was placed in a test tube using tweezers. A “Copper map” guided orientation and numbering of the prill location. Digestion entailed the addition of 0.5ml concentrated chemical grade HNO3 and heating at 90oC for 15 minutes. This was followed by the addition of 0.5ml 60% HCl and further digestion for 10 minutes. The test tubes were covered by cling film to minimise possible loss due to evapouration. Initially, digestion used a microwave oven at low energy. This method was discontinued in favour of a water bath with thermometer control. After digestion, the liquor was made up to the 4ml mark followed by direct read of Au using a Varian AA240 spectrometer. The spectrometer was calibrated at the start, middle and end of each run to determine possible short-term calibration drift. The aspiration tube was purged with distilled water and wiped with a tissue between each sample. Reagent blanks were also used during the run to validate detection level and also test the efficiency of the Deuterium tube. All results were transferred electronically to the Reporting Chemist; there was no manual transfer. At the reporting stage, checks were selected in the event of a non-sequence (0.01, 0.01, 1.2, 0.01) or to validate high values. All results =>10 ppm Au were identified by LIMS and these samples were subject to gold determination by gravimetric method. ALS uses international standards manufactured by Rocklabs. For ppm work, seven different standards cover the range 0.6-7.71 ppm Au for 50g Fire Assay. One standard of 13.65 ppm is used for gravimetric determinations. In the event that one internal standard in a batch fails by more than + 2 standard deviations, reassay of 10 samples either side of the failed standard is performed. These results, together with the new result for the

XTRA-GOLD RESOURCES CORP. KIBI PROJECT NATIONAL INSTRUMENT 43-101 TECHNICAL REPORT 239
SEMS EXPLORATION SERVICES LTD. JULY 12, 2010
reassay standard, are entered in the hard copy for XG. In the event that both internal standards fail, the entire batch is re-analysed. With respect to internal standards, ALS is self-regulating. For this reason, control charts in this report relate to the standard deviation achieved by the laboratory and not the standard deviation proposed by the manufacturer. The LIMS is connected directly to the Internet enabling XG to download results and monitor progress of work. Hard copy results reported to XG are shown in three columns; Col.1: Original result, Col. 2: Check assay and Col. 3 Gravimetric result. Duplicates, laboratory blanks and internal standards are reported on a separate sheet. 3. STANDARDS
3.1. Introduction Standards are accompanied by recommended (Certified) values and standard deviations. Rocklabs define recommended values to three decimal places but assessment in this report rounds them off to two decimal places. Precision achieved by a laboratory in the analysis of standards should be better than 10 percent. Bias- assessed by comparing the mean of standards against the recommended or certified value- is subject to the following classification (SEMS):
<1% Excellent >1<2% Good
>2<4% Acceptable >4<5% Marginal >5 Cause for concern
Although one standard may exceed 5% bias, the true state of results should also consider bias associated with other standards in general and also both laboratory and XG standards in specific batches. It is not unknown for standards to behave in an irregular fashion or to show recommended values departing from the manufacturer’s certified value. It should also be appreciated that in using laboratory defined standard deviations, at least five standards in 100 will fail (This relates to the 95% probability in defining standard deviation; 95 will pass and 5 will fail). Failures, when present, should be random and not grouped. Random failures if marginally above or below 2 standard deviations are of little material consequence and should not immediately trigger reassay of a batch. XG uses standards manufactured in Canada. It is pertinent to briefly discuss the method by which the standards were prepared. The manufacturer states, “ Reject ore material was dried, crushed, pulverised and then passed though a 200 mesh screen. The +200 material was discarded. The –200 material was mixed for 6 days in a double-cone blender. Splits were taken and sent to 13 laboratories for round robin assaying”. Results of means and standard deviations from each laboratory were statistically assessed, using the Students t-test. Results from laboratories that proved to fall outside the population limits were excluded from compilation of recommended value and standard deviation. The manufacturer further sates that standard deviations should not be applied in control charts for individual laboratories.
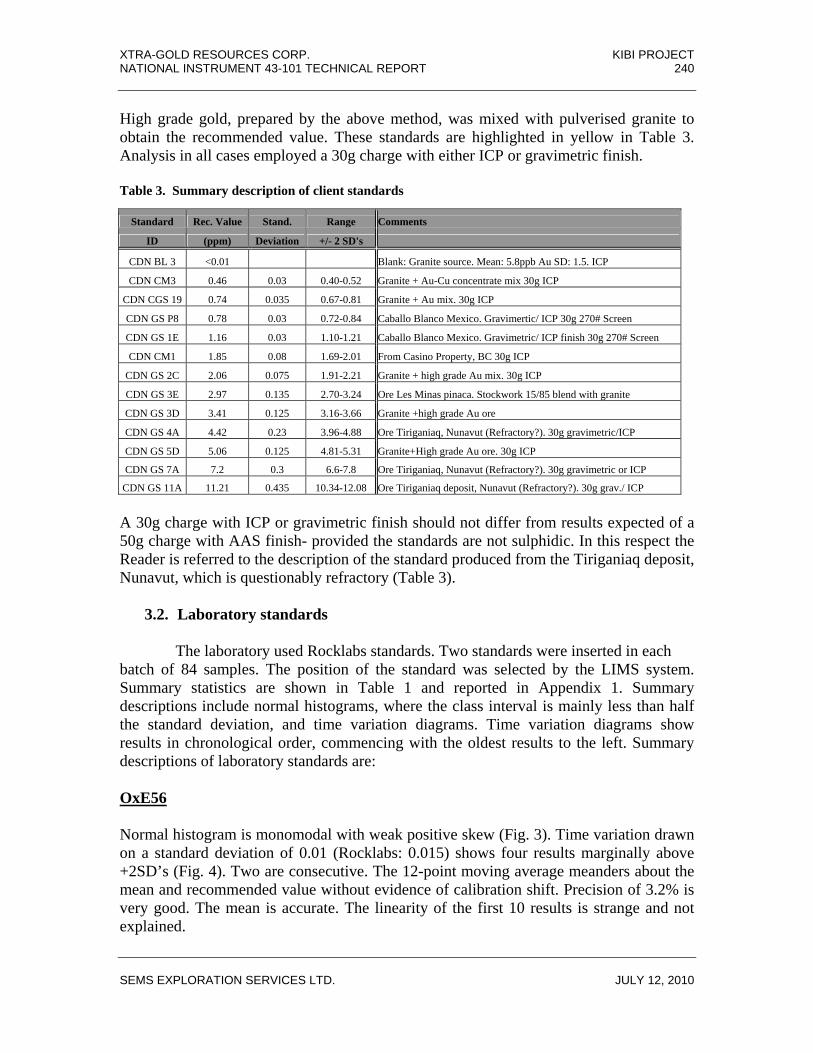
XTRA-GOLD RESOURCES CORP. KIBI PROJECT NATIONAL INSTRUMENT 43-101 TECHNICAL REPORT 240
SEMS EXPLORATION SERVICES LTD. JULY 12, 2010
High grade gold, prepared by the above method, was mixed with pulverised granite to obtain the recommended value. These standards are highlighted in yellow in Table 3. Analysis in all cases employed a 30g charge with either ICP or gravimetric finish. Table 3. Summary description of client standards
Standard Rec. Value Stand. Range Comments
ID (ppm) Deviation +/- 2 SD's
CDN BL 3 <0.01 Blank: Granite source. Mean: 5.8ppb Au SD: 1.5. ICP
CDN CM3 0.46 0.03 0.40-0.52 Granite + Au-Cu concentrate mix 30g ICP
CDN CGS 19 0.74 0.035 0.67-0.81 Granite + Au mix. 30g ICP
CDN GS P8 0.78 0.03 0.72-0.84 Caballo Blanco Mexico. Gravimertic/ ICP 30g 270# Screen
CDN GS 1E 1.16 0.03 1.10-1.21 Caballo Blanco Mexico. Gravimetric/ ICP finish 30g 270# Screen
CDN CM1 1.85 0.08 1.69-2.01 From Casino Property, BC 30g ICP
CDN GS 2C 2.06 0.075 1.91-2.21 Granite + high grade Au mix. 30g ICP
CDN GS 3E 2.97 0.135 2.70-3.24 Ore Les Minas pinaca. Stockwork 15/85 blend with granite
CDN GS 3D 3.41 0.125 3.16-3.66 Granite +high grade Au ore
CDN GS 4A 4.42 0.23 3.96-4.88 Ore Tiriganiaq, Nunavut (Refractory?). 30g gravimetric/ICP
CDN GS 5D 5.06 0.125 4.81-5.31 Granite+High grade Au ore. 30g ICP
CDN GS 7A 7.2 0.3 6.6-7.8 Ore Tiriganiaq, Nunavut (Refractory?). 30g gravimetric or ICP
CDN GS 11A 11.21 0.435 10.34-12.08 Ore Tiriganiaq deposit, Nunavut (Refractory?). 30g grav./ ICP
A 30g charge with ICP or gravimetric finish should not differ from results expected of a 50g charge with AAS finish- provided the standards are not sulphidic. In this respect the Reader is referred to the description of the standard produced from the Tiriganiaq deposit, Nunavut, which is questionably refractory (Table 3).
3.2. Laboratory standards
The laboratory used Rocklabs standards. Two standards were inserted in each batch of 84 samples. The position of the standard was selected by the LIMS system. Summary statistics are shown in Table 1 and reported in Appendix 1. Summary descriptions include normal histograms, where the class interval is mainly less than half the standard deviation, and time variation diagrams. Time variation diagrams show results in chronological order, commencing with the oldest results to the left. Summary descriptions of laboratory standards are: OxE56 Normal histogram is monomodal with weak positive skew (Fig. 3). Time variation drawn on a standard deviation of 0.01 (Rocklabs: 0.015) shows four results marginally above +2SD’s (Fig. 4). Two are consecutive. The 12-point moving average meanders about the mean and recommended value without evidence of calibration shift. Precision of 3.2% is very good. The mean is accurate. The linearity of the first 10 results is strange and not explained.
XTRA-GOLD RESOURCES CORP. KIBI PROJECT NATIONAL INSTRUMENT 43-101 TECHNICAL REPORT 241
SEMS EXPLORATION SERVICES LTD. JULY 12, 2010
OxF65 Histogram shows weak positive skew with a separate low and small high peak (Fig. 5). This is shown on the time variation diagram and coincides with a slightly erratic response for Jobs KM08157365-KM08159340 (Fig. 6). This erratic nature is reflected in the standard deviation of 0.03 vs recommended of 0.013. All results are in the range + 2 SD’s from the recommended value. Trendline on a 12-point moving average is without marked change; there is no calibration shift. Standard deviation applied was 0.03 comparable with the manufacturer’s specifications. Precision of 4.5% is good. The mean is accurate. OxG70 Normal histogram shows a weakly developed lower population and both low and high point weak “Flyers” (Fig. 7). Results are erratic in part but only two results are below –2SD’s (Fig. 8). These are random. The erratic section is comparable to standard OxF65. Standard deviation is 0.02 compared with a recommended 0.013. Trendline on an 8-point moving average is without marked shift; there is no calibration jump. OxI67 Histogram displays a spread of low results (Fig. 9). Trend on an 8-point moving average is “spiky” in part, with two results < 2 SD’s (Fig. 10). Standard deviation is 0.03 compared to a recommended 0.024. There is no calibration shift. Precision at 3.9% and accuracy of –0.5% is very good. ST335 This standard, with a value of 13.65ppm Au, was used in gravimetric determinations. Normal histogram is monomodal although the class interval is a bit high (Fig. 11). Time variation shows two very low-order failures above +2 SD’s (Fig. 12). These are consecutive but the trend is immediately followed by shift to the recommended value. Trendline on a 4-point moving average departs from the recommended value and moves without shift along the analytical mean. Applied standard deviation is 0.03 compared to the recommended 0.024. Precision of 2.8% is very good. Bias of +0.8% is excellent. OxN62 With a recommended value of 7.71 ppm Au, this standard was used in gravimetric determinations. The normal histogram is distinctly bimodal (Fig. 13). Separate populations are clearly seen on the time variation diagram, associated with a high plateau between Jobs KM09086027-KM09088041 (Fig. 14). This suggests a weak calibration shift. Results after KM09088041 fall below the mean value and compound the presence of a “lower” population. Notwithstanding the slight calibration “Blip” and bimodal nature, the precision of 1.8% is and negative bias of 0.3% is excellent. Standard deviation applied was 0.07 compared to the recommended 0.117.
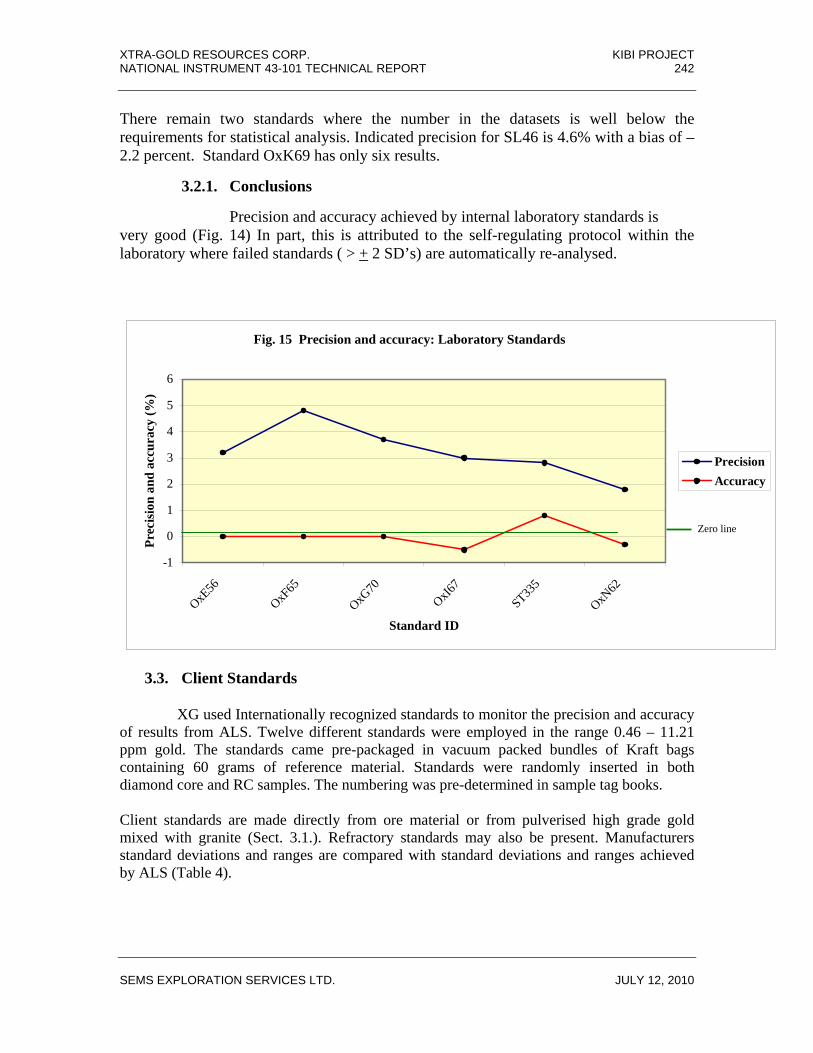
XTRA-GOLD RESOURCES CORP. KIBI PROJECT NATIONAL INSTRUMENT 43-101 TECHNICAL REPORT 242
SEMS EXPLORATION SERVICES LTD. JULY 12, 2010
There remain two standards where the number in the datasets is well below the requirements for statistical analysis. Indicated precision for SL46 is 4.6% with a bias of –2.2 percent. Standard OxK69 has only six results.
3.2.1. Conclusions
Precision and accuracy achieved by internal laboratory standards is very good (Fig. 14) In part, this is attributed to the self-regulating protocol within the laboratory where failed standards ( > + 2 SD’s) are automatically re-analysed.
Precision and Accuracy: Laboratory Standards
-1
0
1
2
3
4
5
6
OxE56
OxF65
OxG70
OxI67
ST335
OxN62
Standard ID
Prec
isio
n an
d ac
cura
cy (%
)
PrecisionAccuracy
3.3. Client Standards
XG used Internationally recognized standards to monitor the precision and accuracy of results from ALS. Twelve different standards were employed in the range 0.46 – 11.21 ppm gold. The standards came pre-packaged in vacuum packed bundles of Kraft bags containing 60 grams of reference material. Standards were randomly inserted in both diamond core and RC samples. The numbering was pre-determined in sample tag books. Client standards are made directly from ore material or from pulverised high grade gold mixed with granite (Sect. 3.1.). Refractory standards may also be present. Manufacturers standard deviations and ranges are compared with standard deviations and ranges achieved by ALS (Table 4).
Fig. 15 Precision and accuracy: Laboratory Standards
Zero line
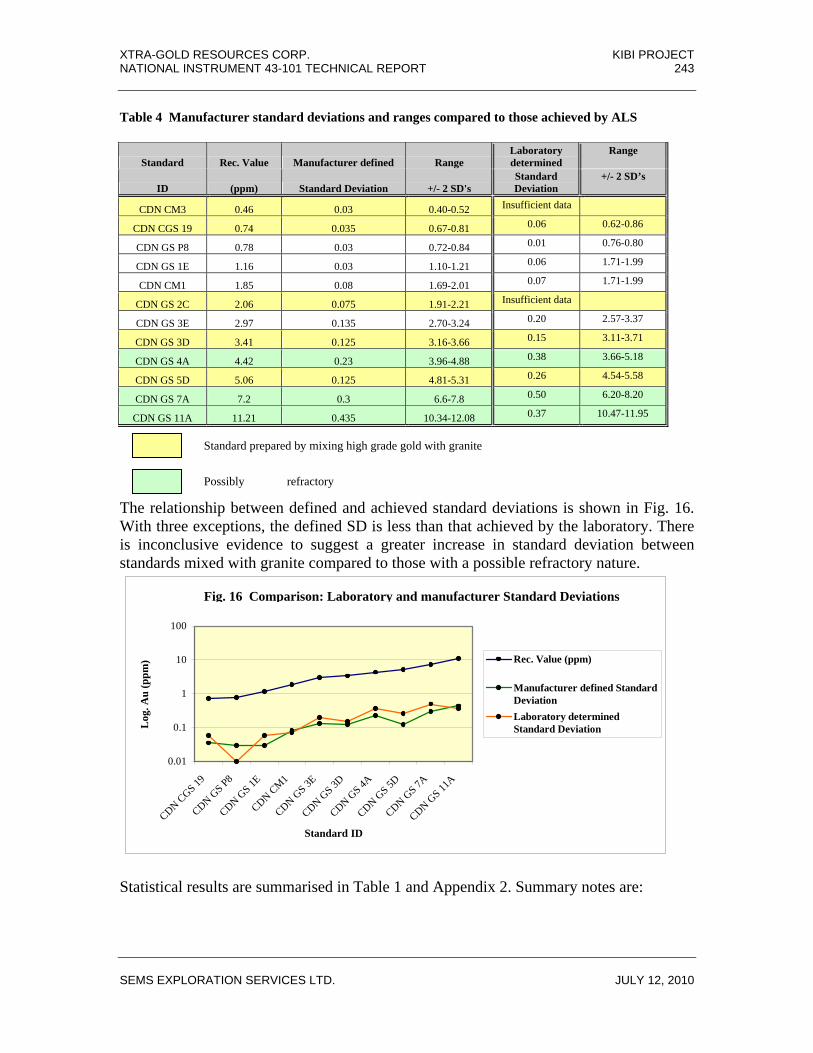
XTRA-GOLD RESOURCES CORP. KIBI PROJECT NATIONAL INSTRUMENT 43-101 TECHNICAL REPORT 243
SEMS EXPLORATION SERVICES LTD. JULY 12, 2010
Table 4 Manufacturer standard deviations and ranges compared to those achieved by ALS
Standard Rec. Value Manufacturer defined Range Laboratory determined
Range
ID (ppm) Standard Deviation +/- 2 SD's Standard Deviation
+/- 2 SD’s
CDN CM3 0.46 0.03 0.40-0.52 Insufficient data
CDN CGS 19 0.74 0.035 0.67-0.81 0.06 0.62-0.86
CDN GS P8 0.78 0.03 0.72-0.84 0.01 0.76-0.80
CDN GS 1E 1.16 0.03 1.10-1.21 0.06 1.71-1.99
CDN CM1 1.85 0.08 1.69-2.01 0.07 1.71-1.99
CDN GS 2C 2.06 0.075 1.91-2.21 Insufficient data
CDN GS 3E 2.97 0.135 2.70-3.24 0.20 2.57-3.37
CDN GS 3D 3.41 0.125 3.16-3.66 0.15 3.11-3.71
CDN GS 4A 4.42 0.23 3.96-4.88 0.38 3.66-5.18
CDN GS 5D 5.06 0.125 4.81-5.31 0.26 4.54-5.58
CDN GS 7A 7.2 0.3 6.6-7.8 0.50 6.20-8.20
CDN GS 11A 11.21 0.435 10.34-12.08 0.37 10.47-11.95
The relationship between defined and achieved standard deviations is shown in Fig. 16. With three exceptions, the defined SD is less than that achieved by the laboratory. There is inconclusive evidence to suggest a greater increase in standard deviation between standards mixed with granite compared to those with a possible refractory nature.
Fig. A Standard deviations in retion to standard type
0.01
0.1
1
10
100
CDN CGS 19
CDN GS P8
CDN GS 1E
CDN CM1
CDN GS 3E
CDN GS 3D
CDN GS 4A
CDN GS 5D
CDN GS 7A
CDN GS 11
A
Standard ID
Log
. Au
(ppm
) Rec. Value (ppm)
Manufacturer defined StandardDeviationLaboratory determinedStandard Deviation
Statistical results are summarised in Table 1 and Appendix 2. Summary notes are:
Standard prepared by mixing high grade gold with granite
Possibly refractory
Fig. 16 Comparison: Laboratory and manufacturer Standard Deviations

XTRA-GOLD RESOURCES CORP. KIBI PROJECT NATIONAL INSTRUMENT 43-101 TECHNICAL REPORT 244
SEMS EXPLORATION SERVICES LTD. JULY 12, 2010
CDN-CGS-19 Histogram displays negative skew with the evidence of one high result (Fig. 17). The time variation diagram shows one value at +3SD’s from the recommended value (Fig. 18). There is no evidence of calibration shift. Precision is 15.5% with +5.4% bias. This is slightly high. CDN-CM1 Normal histogram is weakly bimodal with a small population of low results (Fig. 19). Time variation shows the Trendline on an 8-point moving average meandering about the mean value without calibration shift (Fig. 20). The lower population is clearly seen Between Jobs KM08167142-KM08167144. In this range, three standards are between –2 and 3SD’s from the recommended value. Precision at 7.7% and bias of –2.7% is acceptable. CDN-GS-1E Histogram is bimodal (Fig. 21). The bimodal nature is clearly shown on the time variation diagram between Jobs KM09079720-KM09086026 (Fig. 22). Trendline on a 3-point moving average closely follows the mean, jumps to a higher population and then falls sharply to the recommended value. This higher population, probably in response to a calibration shift, is marginally above +2 SD’s. Precision at 10.2% is acceptable but the bias of +5.2 is marginally high. CDN-GS-3D Histogram is bimodal showing a small concentration of low results (Fig. 23). Distribution of results in the time variation diagram is slightly erratic (Fig. 24). The lower population is formed mainly by results between KM08167142-KM08167145 where seven results are close to –3 SD’s from the recommended value. This erratic behavior mimics the results seen for Standard CDN-CM1. Precision of 9.2% and bias of –4.1% is acceptable. CDN-GS-3E The histogram is quite strongly bimodal (Fig. 25). Low results are seen on the time variation diagram between Jobs KM09073945-KM09104238. All results are, however, within the limits + 2 SD’s from the recommended value (Fig. 26). Trendline on an 8-point moving average shows gradual increase, leveling to a plateau from Job KM09086026. The trendline is close to the +2SD limit and has resulted in a positive bias of 7.7%, which is marginally high. Precision of 12.9% reflects the bimodal nature of the distribution.
XTRA-GOLD RESOURCES CORP. KIBI PROJECT NATIONAL INSTRUMENT 43-101 TECHNICAL REPORT 245
SEMS EXPLORATION SERVICES LTD. JULY 12, 2010
CDN-GS-4A The histogram is monomodal but shows two low results (Fig. 27). Trendline on a 4-point moving average meanders about the mean without obvious shift (Fig. 28). Precision at 17.2% is high but bias of 0.7% is good. One result is marginally below 2 SD’s. CDN-GS-5D Histogram is bimodal with a scatter of low results (Fig. 29). The division between the two populations is not well defined on the time variation diagram (Fig. 30). The 4-point moving average shows slightly elevated values between Jobs KM09070672-KM09088040. This bears comparison with Standard CDN-GS-1E (Fig. 18). Precision at 10.8% and bias of 3.0% is acceptable. CDN-GS-7A Bimodal with two high “Flyers” (Fig. 31). Trendline on a 4-point moving average shows a gradually declining shift towards lower values from Job KM09088046 and directly mimics the low values seen in Standard CDN-GS-1E (Fig. 32). There are two random high results at +3 SD’s. Precision of 14.2% is slightly high but bias of +1.0% is good. CDN-GS-P8 The normal histogram shows little dispersion (Fig. 33). Trendline on a 3-point moving average shows a shift from low to slightly higher values from Job KM09079720 (Fig. 34). Again, this is comparable to results seen for Standard CDN-GS-1E. Precision of 2.6% is very good. Bias of +5.1% is slightly high. CDN-GS-11A (Gravimetric) Normal histogram is monomodal (Fig. 35). Time variation diagram and defining 4-point moving average shows departure from the recommended value (Fig. 36). All but eight results are above 2 SD’s. Although the precision of 6.1% is acceptable, the bias at 9.1% is high.
3.3.1. Client standard failures and reassay Client standard failures (“Flyers”) are shown in Appendix 3 and listed in Table 5. Results of batch re-assay associated with failed standards are shown in Appendix 3. Many “Flyers” identified by XG were reassayed by ALS. There is one case of sample switch between a standard and field sample. This may have occurred in the field or in the laboratory. Two reassays were called on standards which fell within the range + 2SD’s from the recommended value.
XTRA-GOLD RESOURCES CORP. KIBI PROJECT NATIONAL INSTRUMENT 43-101 TECHNICAL REPORT 246
SEMS EXPLORATION SERVICES LTD. JULY 12, 2010
Many of the failed standards are randomly situated and occur within batches where one other client passes. Correlation of the reassay pairs is shown in Figure 38. Correlation coefficient on 36 pairs is 0.996 with a bias of +4% (Au1>AuRA) although there is distortion from two high results. The “Flyer” omitted is not necessarily a function of a failed standard and may reflect the natural consequence of spotty gold. Weak “Flyer” omitted:
JobNo HoleID SampleID Date Au1 Reassay SpleID Date JobNo AuRA KM09070671 KBRC09020 H803624 22-Jul-09 5.76 H803624 28-Aug-09 KM09086026 6.88
3.3.2. Conclusions Minor calibration shifts occur but, as results are assessed over two years, this is not surprising. It is assumed that the standards used over this time have not been replenished; had this occurred, the standard identification would- should- have changed. There is no clear correlation between precision and accuracy with respect to the recommended value (Fig. 37). The worst precision is associated with Standards CDN-GS-4A (17.2%) and 7A (14.2%) although bias is good with respectively +0.7% and +1.0%. Both these standards are declared by the manufacturer to possess a possible refractory nature. This might explain the poor precision using a 50g charge in Fire assay. Standard CDN-GS-11A is also possibly refractory but shows a precision of 6.5% with high bias at 9.1 percent. Although this standard is used in gravimetric determinations, the prill is derived from a 50g Fire Assay. There is close correlation between original and reassay results from failed batches. Although not all “Flyers” were re-analysed, many occur in batches where second standards passed or where deviation from the accepted limits was random (From 100 results, 5 standards will fail). Table 5 Standard failures: “Flyers”, batch reassay and sample switches Standard CDN-CM-1 Recommended Value: 1.85 ppm Au SD: 0.08 Range: 1.69-2.01
KM09088042 KBRC09041 G487058 20-Aug-09 2.08 KM08159341 KBD08007 H801289 18-Nov-08 0.01 KM08167142 KBD08015 H802191 12-Mar-08 4.04 KM08167143 KBD08015 H802269 12-Mar-08 0.64
JobNo HoleID SampleID Date Au1 Standard CDN-GS-1E Recommended Value: 1.16 ppm Au SD: 0.03 Range: 1.10-1.21
KM09070671 KBRC09020 H803626 22-Jul-09 0.00 KM09073945 KBRC09023 H803960 8-May-09 1.15 KM09073947 KBRC09026 H804250 8-May-09 1.16
JobNo HoleID SampleID Date Au1 Standard CDN-GS-3D Recommended Value: 3.41 ppm Au SD: 0.125 Range: 3.16-3.66
JobNo HoleID SampleID Date Au1 KM09073945 KBRC09024 H803994 8-May-09 2.82 KM09086027 KBRC09032 H804861 20-Aug-09 4.59
XTRA-GOLD RESOURCES CORP. KIBI PROJECT NATIONAL INSTRUMENT 43-101 TECHNICAL REPORT 247
SEMS EXPLORATION SERVICES LTD. JULY 12, 2010
Standard CDN-GS-3E Recommended Value: 2.97 ppm Au SD: 0.135 Range: 2.70-3.24
JobNo HoleID SampleID Date Au1 KM09103353 KBRC09061 G489138 30-Sep-09 7.56 KM09104239 KBRC09067 G489835 10-Jul-09 1.25
Standard CDN-GS-4A Recommended Value: 4.42 ppm Au SD: 0.23 Range: 3.96-4.88
JobNo HoleID SampleID Date Au1 KM09073946 KBRC09024 H804078 8-May-09 <0.01 KM09104237 KBRC09064 G489489 10-Jul-09 1.25 KM09097541 KBRC09055 G488352 20-Sep-09 1.22 KM09073945 KBRC09023 H803858 8-May-09 3.34 KM09070671 KBRC09019 H803525 22-Jul-09 3.74 KM09070672 KBRC09020 H803674 22-Jul-09 3.54
Standard CDN-GS-5D Recommended Value: 5.06 ppm Au SD: 0.125 Range: 4.81-5.31
JobNo HoleID SampleID Date Au1 KM09073945 KBRC09023 H803960 8-May-09 1.15
Standard CDN-GS-7A Recommended Value: 7.2 ppm Au SD: 0.30 Range: 6.6-7.8
JobNo HoleID SampleID Date Au1 KM09103352 KBRC09058 G488873 30-Sep-09 4.26 KM09103353 KBRC09061 G489154 30-Sep-09 3.43
Standard CDN-GS-P8 Recommended Value: 0.78 ppm Au SD: 0.03 Range: 0.72-0.84
JobNo HoleID SampleID Date Au1 KM09103352 KBRC09058 G488856 30-Sep-09 0.41 KM09103353 KBRC09061 G489089 30-Sep-09 1.19 KM09103354 KBRC09062 G489225 30-Sep-09 1.16 KM09103351 KBRC09049 G488550 30-Sep-09 0.01 Switch
Standard CDN-GS-11A Gravimetric Rec. Value: 11.21 ppm Au SD: 0.435 Range: 10.34-12.08 ppm Au
JobNo HoleNo SampleID Date Au1 KM09088041 KBRC09041 G486929 20-Aug-09 9.4 KM09070672 KBRC09022 H803812 22-Jul-09 9.88
KM09073945 Batch reassayed KM09088041 "Flyer" not reassayed KM09103351 Sample switch
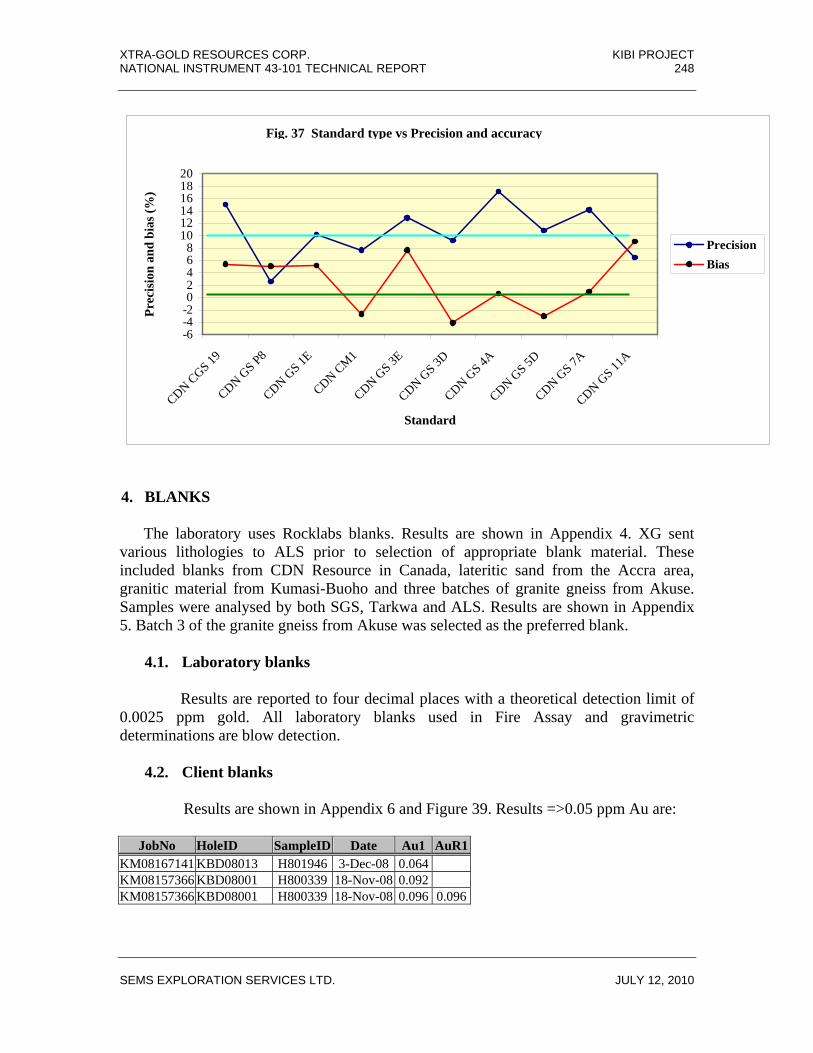
XTRA-GOLD RESOURCES CORP. KIBI PROJECT NATIONAL INSTRUMENT 43-101 TECHNICAL REPORT 248
SEMS EXPLORATION SERVICES LTD. JULY 12, 2010
Fig. B Standard vs Precision and bias
-6-4-202468
101214161820
CDN CGS 19
CDN GS P8
CDN GS 1E
CDN CM1
CDN GS 3E
CDN GS 3D
CDN GS 4A
CDN GS 5D
CDN GS 7A
CDN GS 11
A
Standard
Prec
isio
n an
d bi
as (%
)
Precision Bias
4. BLANKS The laboratory uses Rocklabs blanks. Results are shown in Appendix 4. XG sent various lithologies to ALS prior to selection of appropriate blank material. These included blanks from CDN Resource in Canada, lateritic sand from the Accra area, granitic material from Kumasi-Buoho and three batches of granite gneiss from Akuse. Samples were analysed by both SGS, Tarkwa and ALS. Results are shown in Appendix 5. Batch 3 of the granite gneiss from Akuse was selected as the preferred blank.
4.1. Laboratory blanks
Results are reported to four decimal places with a theoretical detection limit of 0.0025 ppm gold. All laboratory blanks used in Fire Assay and gravimetric determinations are blow detection.
4.2. Client blanks Results are shown in Appendix 6 and Figure 39. Results =>0.05 ppm Au are:
JobNo HoleID SampleID Date Au1 AuR1KM08167141 KBD08013 H801946 3-Dec-08 0.064 KM08157366 KBD08001 H800339 18-Nov-08 0.092 KM08157366 KBD08001 H800339 18-Nov-08 0.096 0.096
Fig. 37 Standard type vs Precision and accuracy
XTRA-GOLD RESOURCES CORP. KIBI PROJECT NATIONAL INSTRUMENT 43-101 TECHNICAL REPORT 249
SEMS EXPLORATION SERVICES LTD. JULY 12, 2010
There is no evidence from the results of laboratory or client blanks to suggest low-level contamination or repeated cross-contamination during crushing or pulverisation. 5. DUPLICATES
5.1. Introduction ALS insert three duplicates in each Fire Assay batch containing 84 samples. Duplicate position is pre-selected by LIMS. Duplicates are taken from the same Kraft envelope as the original sample. The results therefore test the combined precision related to the AAS instrument, the AAS operator and sample variance that might exist within the Kraft envelope. The duplicate does not test for possible error associated with riffle splitting of the submitted sample. Knowing that the ore contains visible gold and pulverisation was 85% passing –200#, variance within the envelope may exist. Field duplicates split from RC chip bulk samples were randomly inserted in the sample sequence by XG and submitted to ALS. These are “Blind” duplicates and their existence was unknown to ALS. With few exceptions, duplicates were analysed in the same batch as the original sample to minimise possible intra-batch variance.
5.2. Laboratory duplicates Results for diamond core and RC chips were assessed separately. Data was first ordered by Au1 (Original assay). Results below detection were separated but retained in the record. The standard deviation of the dataset was determined for all results =>0.1 ppm gold. This was multiplied by 2.5 to determine possible “Flyers” in the dataset. In many cases, “Flyers” were identified visually and removed prior to correlation analysis. These “Flyers” are recorded in the database. Not all results => 2.5 SD’s were removed from the database for correlation purposes. Those retained in the database are highlighted in green. 5.2.1. Diamond core There are no “Flyers” (App. 7). Precision of the total dataset is 12.9% reducing to10.1% with elimination of results <0.1 ppm gold. Only 21 results are found cutting to => 0.01 ppm gold Correlation of the total dataset with 94 pairs is 0.989 with appreciable deviation between the regression and diagonal lines (Fig. 40). Removing one high variance pair, the coefficient on 93 pair is 0.995 with coincidence between regression and diagonal; there is no bias (Fig. 41).
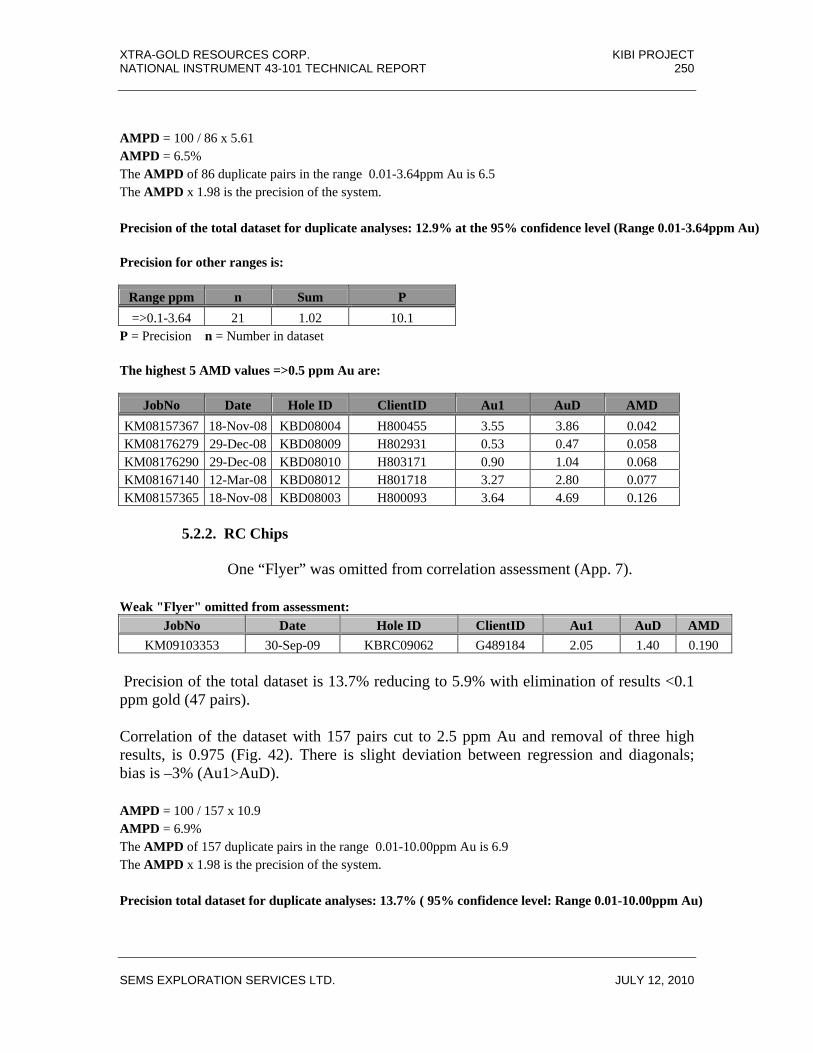
XTRA-GOLD RESOURCES CORP. KIBI PROJECT NATIONAL INSTRUMENT 43-101 TECHNICAL REPORT 250
SEMS EXPLORATION SERVICES LTD. JULY 12, 2010
AMPD = 100 / 86 x 5.61 AMPD = 6.5% The AMPD of 86 duplicate pairs in the range 0.01-3.64ppm Au is 6.5 The AMPD x 1.98 is the precision of the system. Precision of the total dataset for duplicate analyses: 12.9% at the 95% confidence level (Range 0.01-3.64ppm Au) Precision for other ranges is:
Range ppm n Sum P =>0.1-3.64 21 1.02 10.1
P = Precision n = Number in dataset The highest 5 AMD values =>0.5 ppm Au are:
JobNo Date Hole ID ClientID Au1 AuD AMD KM08157367 18-Nov-08 KBD08004 H800455 3.55 3.86 0.042 KM08176279 29-Dec-08 KBD08009 H802931 0.53 0.47 0.058 KM08176290 29-Dec-08 KBD08010 H803171 0.90 1.04 0.068 KM08167140 12-Mar-08 KBD08012 H801718 3.27 2.80 0.077 KM08157365 18-Nov-08 KBD08003 H800093 3.64 4.69 0.126
5.2.2. RC Chips One “Flyer” was omitted from correlation assessment (App. 7). Weak "Flyer" omitted from assessment:
JobNo Date Hole ID ClientID Au1 AuD AMD KM09103353 30-Sep-09 KBRC09062 G489184 2.05 1.40 0.190
Precision of the total dataset is 13.7% reducing to 5.9% with elimination of results <0.1 ppm gold (47 pairs). Correlation of the dataset with 157 pairs cut to 2.5 ppm Au and removal of three high results, is 0.975 (Fig. 42). There is slight deviation between regression and diagonals; bias is –3% (Au1>AuD).
AMPD = 100 / 157 x 10.9 AMPD = 6.9% The AMPD of 157 duplicate pairs in the range 0.01-10.00ppm Au is 6.9 The AMPD x 1.98 is the precision of the system. Precision total dataset for duplicate analyses: 13.7% ( 95% confidence level: Range 0.01-10.00ppm Au)
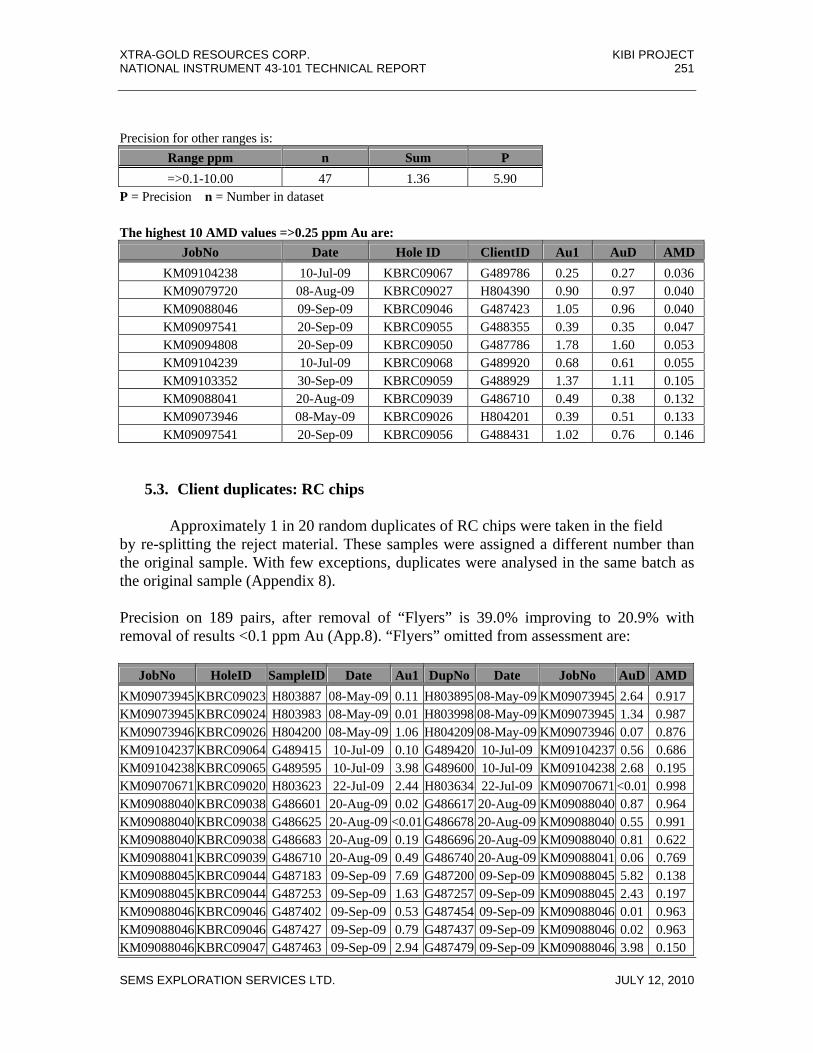
XTRA-GOLD RESOURCES CORP. KIBI PROJECT NATIONAL INSTRUMENT 43-101 TECHNICAL REPORT 251
SEMS EXPLORATION SERVICES LTD. JULY 12, 2010
Precision for other ranges is:
Range ppm n Sum P =>0.1-10.00 47 1.36 5.90
P = Precision n = Number in dataset The highest 10 AMD values =>0.25 ppm Au are:
JobNo Date Hole ID ClientID Au1 AuD AMD KM09104238 10-Jul-09 KBRC09067 G489786 0.25 0.27 0.036 KM09079720 08-Aug-09 KBRC09027 H804390 0.90 0.97 0.040 KM09088046 09-Sep-09 KBRC09046 G487423 1.05 0.96 0.040 KM09097541 20-Sep-09 KBRC09055 G488355 0.39 0.35 0.047 KM09094808 20-Sep-09 KBRC09050 G487786 1.78 1.60 0.053 KM09104239 10-Jul-09 KBRC09068 G489920 0.68 0.61 0.055 KM09103352 30-Sep-09 KBRC09059 G488929 1.37 1.11 0.105 KM09088041 20-Aug-09 KBRC09039 G486710 0.49 0.38 0.132 KM09073946 08-May-09 KBRC09026 H804201 0.39 0.51 0.133 KM09097541 20-Sep-09 KBRC09056 G488431 1.02 0.76 0.146
5.3. Client duplicates: RC chips
Approximately 1 in 20 random duplicates of RC chips were taken in the field by re-splitting the reject material. These samples were assigned a different number than the original sample. With few exceptions, duplicates were analysed in the same batch as the original sample (Appendix 8). Precision on 189 pairs, after removal of “Flyers” is 39.0% improving to 20.9% with removal of results <0.1 ppm Au (App.8). “Flyers” omitted from assessment are:
JobNo HoleID SampleID Date Au1 DupNo Date JobNo AuD AMDKM09073945 KBRC09023 H803887 08-May-09 0.11 H803895 08-May-09 KM09073945 2.64 0.917 KM09073945 KBRC09024 H803983 08-May-09 0.01 H803998 08-May-09 KM09073945 1.34 0.987 KM09073946 KBRC09026 H804200 08-May-09 1.06 H804209 08-May-09 KM09073946 0.07 0.876 KM09104237 KBRC09064 G489415 10-Jul-09 0.10 G489420 10-Jul-09 KM09104237 0.56 0.686 KM09104238 KBRC09065 G489595 10-Jul-09 3.98 G489600 10-Jul-09 KM09104238 2.68 0.195 KM09070671 KBRC09020 H803623 22-Jul-09 2.44 H803634 22-Jul-09 KM09070671 <0.01 0.998 KM09088040 KBRC09038 G486601 20-Aug-09 0.02 G486617 20-Aug-09 KM09088040 0.87 0.964 KM09088040 KBRC09038 G486625 20-Aug-09 <0.01 G486678 20-Aug-09 KM09088040 0.55 0.991 KM09088040 KBRC09038 G486683 20-Aug-09 0.19 G486696 20-Aug-09 KM09088040 0.81 0.622 KM09088041 KBRC09039 G486710 20-Aug-09 0.49 G486740 20-Aug-09 KM09088041 0.06 0.769 KM09088045 KBRC09044 G487183 09-Sep-09 7.69 G487200 09-Sep-09 KM09088045 5.82 0.138 KM09088045 KBRC09044 G487253 09-Sep-09 1.63 G487257 09-Sep-09 KM09088045 2.43 0.197 KM09088046 KBRC09046 G487402 09-Sep-09 0.53 G487454 09-Sep-09 KM09088046 0.01 0.963 KM09088046 KBRC09046 G487427 09-Sep-09 0.79 G487437 09-Sep-09 KM09088046 0.02 0.963 KM09088046 KBRC09047 G487463 09-Sep-09 2.94 G487479 09-Sep-09 KM09088046 3.98 0.150

XTRA-GOLD RESOURCES CORP. KIBI PROJECT NATIONAL INSTRUMENT 43-101 TECHNICAL REPORT 252
SEMS EXPLORATION SERVICES LTD. JULY 12, 2010
KM09094808 KBRC09050 G487742 20-Sep-09 <0.01 G487776 20-Sep-09 KM09094808 4.11 0.999 KM09097540 KBRC09054 G488181 20-Sep-09 0.92 G488200 20-Sep-09 KM09097540 0.44 0.356 KM09097541 KBRC09055 G488341 20-Sep-09 2.79 G488350 20-Sep-09 KM09097541 1.72 0.239 KM09103351 KBRC09049 G488529 30-Sep-09 0.13 G488535 30-Sep-09 KM09103351 0.01 0.830 KM09103353 KBRC09060 G489024 30-Sep-09 4.88 G489040 30-Sep-09 KM09103353 4.09 0.088 The omission of 20 results reflects the spotty nature of the ore and the practice of splitting 250g from the bulk material after crushing to 70% passing –2mm. Correlation of the dataset with removal of “Flyers” has a coefficient of 0.961 (Fig. 43). Diagonal and regression diverge with a bias of –5%. Reverse Circulation chips AMPD = 100 / 189 x 37.16 AMPD = 19.7% The AMPD of 189 duplicate pairs in the range 0.01-2.03 ppm Au is 19.7 The AMPD x 1.98 is the precision of the system. Precision total dataset duplicate RC chips: 39.0% (95% confidence level:Range 0.01-2.03 ppm Au) Precision for other ranges is: Range ppm n Sum P =>0.1-2.03 73 7.64 20.9
P = Precision n = Number in dataset The highest 10 AMD values =>0.1 ppm Au are:
JobNo HoleID SampleID Date Au1 DupNo Date JobNo AuD AMD KM09088040 KBRC09038 G486581 20-Aug-09 0.16 G486600 20-Aug-09 KM09088040 0.10 0.242 KM09070672 KBRC09022 H803805 22-Jul-09 0.15 H803816 22-Jul-09 KM09070672 0.25 0.248 KM09088046 KBRC09045 G487331 09-Sep-09 0.17 G487339 09-Sep-09 KM09088046 0.28 0.256 KM09088040 KBRC09037 G486489 20-Aug-09 0.12 G486500 20-Aug-09 KM09088040 0.07 0.283 KM09094808 KBRC09049 G487682 20-Sep-09 0.36 G487699 20-Sep-09 KM09094808 0.20 0.292 KM09094809 KBRC09051 G487889 20-Sep-09 0.48 G487897 20-Sep-09 KM09094809 0.21 0.390 KM09070672 KBRC09022 H803805 22-Jul-09 0.15 H803800 22-Jul-09 KM09070672 0.05 0.528 KM09073946 KBRC09025 H804176 08-May-09 0.10 H804144 08-May-09 KM09073946 0.02 0.622 KM09097540 KBRC09055 G488323 20-Sep-09 0.11 G488339 20-Sep-09 KM09097541 0.02 0.695 KM09103353 KBRC09061 G489124 30-Sep-09 0.14 G489132 30-Sep-09 KM09103353 0.01 0.816
5.3.1. Field splitting error An indication of splitting error is given by the difference in precision obtained from duplicate analysis of RC chips in the laboratory, where both samples are

XTRA-GOLD RESOURCES CORP. KIBI PROJECT NATIONAL INSTRUMENT 43-101 TECHNICAL REPORT 253
SEMS EXPLORATION SERVICES LTD. JULY 12, 2010
taken from the same Kraft envelope, and the precision obtained by analysing two separate splits of the total RC sample in the field. Precision of duplicates, cutting results <0.1 ppm Au, is 10.1 % (Sect. 3.5.1). Precision of the two separate splits is 20.9% for results =>0.1 ppm Au. The indicated field splitting error is 10.8% (Refer: Sect. 12.1). It should be appreciated that this splitting error is assessed after the omission of “Flyers” and would be substantially higher had the “Flyers” been included. 6. LABORATORY CHECK REPEATS
6.1. Introduction The laboratory check repeat is selected by the Reporting Chemist. It is determined by a series of high values- in order to validate the results- or, more importantly, by a non-sequence in results. In the sequence: 0.01, 0.02, 1.2, 0.1…, the result for 1.2 ppm Au would be checked. The check repeat is taken from the same Kraft envelope as the original assay. In this respect, there is no difference between an ALS duplicate and check repeat except that the duplicate is performed in the same batch as the original whereas a check repeat is carried out in a separate batch. This may lead to slight intra-batch variance. Results for diamond core and RC chips are assessed separately.
6.2. Diamond core
Eight “Flyers” are identified (App. 9):
JobNo HoleNo SampleID Date Au1 AuR AMD
KM08167141 KBD08013 H801992 12-Mar-08 1.38 0.81 0.261 KM08167145 KBD08017 H802670 12-Mar-08 1.08 0.57 0.305 KM08167142 KBD08014 H802094 12-Mar-08 0.53 0.27 0.317 KM08167142 KBD08014 H802051 12-Mar-08 0.34 0.83 0.415 KM08167144 KBD08017 H802599 12-Mar-08 0.33 0.13 0.443 KM08176290 KBD08010 H803192 29-Dec-08 0.11 0.03 0.620 KM08167142 KBD08014 H802182 12-Mar-08 1.41 6.17 0.628 KM08167143 KBD08016 H802433 12-Mar-08 0.80 0.01 0.975
Precision for the dataset, excluding “Flyers” is 17.0%. Removing results <0.1 ppm Au, precision improves to 14.0. Further improvement is seen through progressive cutting at 0.25 ppm (12.6%) and =>0.5 ppm (11.8%). Little difference is found removing results =>5 ppm Au suggesting relative homogeneity within the Kraft envelope.

XTRA-GOLD RESOURCES CORP. KIBI PROJECT NATIONAL INSTRUMENT 43-101 TECHNICAL REPORT 254
SEMS EXPLORATION SERVICES LTD. JULY 12, 2010
Correlation of the total dataset, with 213 pairs has a coefficient of 0.980 (Fig. 44). Bias is < 2 percent. Removing four weak high variance pairs, there is close agreement between regression and diagonal lines; bias is –1 percent (Fig. 45). AMPD = 100 / 213 x 18.28 AMPD = 8.6% The AMPD of 213 check repeat pairs in the range 0.01-9.30ppm Au is 8.6 The AMPD x 1.98 is the precision of the system. Precision: Total dataset for check repeat analyses: 17.0% (95% confidence level: Range 0.01-9.30ppm Au) Precision for other ranges is:
Range ppm n Sum P =>0.1-9.30 170 11.99 14.0
=>0.25-9.30 128 8.17 12.6 = <0.25 =<5 117 7.42 12.6 =>0.5-9.30 98 5.86 11.8
P = Precision n = Number in dataset The highest 10 AMD values =>0.25 ppm Au are:
JobNo HoleID SampleID Date Au1 AuR AMD
KM08167140 KBD08012 H801664 12-Mar-08 1.02 1.37 0.149 KM08167142 KBD08015 H802224 12-Mar-08 6.93 5.11 0.151 KM08157365 KBD08005 H800194 18-Nov-08 1.32 1.80 0.154 KM08157367 KBD08004 H800452 18-Nov-08 8.87 6.42 0.160 KM08157367 KBD08005 H800505 18-Nov-08 0.45 0.32 0.174 KM08176279 KBD08010 H803125 29-Dec-08 6.18 8.87 0.179 KM08176279 KBD08009 H802946 29-Dec-08 0.60 0.40 0.198 KM08167142 KBD08014 H802101 12-Mar-08 0.64 0.97 0.206 KM08167144 KBD08016 H802532 12-Mar-08 0.30 0.47 0.224 KM08167144 KBD08016 H802520 12-Mar-08 0.31 0.15 0.354

XTRA-GOLD RESOURCES CORP. KIBI PROJECT NATIONAL INSTRUMENT 43-101 TECHNICAL REPORT 255
SEMS EXPLORATION SERVICES LTD. JULY 12, 2010
6.3. RC Chips
Eight “Flyers” are identified (App. 9):
JobNo HoleNo SampleID Date Au1 AuR AMD
KM09104239 KBRC09068 G489923 10-Jul-09 1.94 0.78 0.423 KM09088045 KBRC09043 G487200 9-Sep-09 5.82 8.74 0.201 KM09094808 KBRC09049 G487683 20-Sep-09 7.53 5.01 0.201 KM09104239 KBRC09068 G489933 10-Jul-09 2.17 1.43 0.206 KM09088045 KBRC09042 G487116 9-Sep-09 8.49 13.50 0.228 KM09103354 KBRC09062 G489291 30-Sep-09 2.20 3.50 0.228 KM09103353 KBRC09062 G489184 30-Sep-09 2.05 1.27 0.235 KM09070671 KBRC09020 H803624 22-Jul-09 5.76 3.52 0.241 KM09103351 KBRC09057 G488612 30-Sep-09 2.03 3.35 0.245 KM09070671 KBRC09019 H803498 22-Jul-09 1.03 1.74 0.259 KM09103353 KBRC09060 G489015 30-Sep-09 3.99 2.26 0.277
Precision for the dataset, excluding “Flyers” is 15.6%. Removing results <0.1 ppm Au, precision improves to 12.3. Further improvement is seen through progressive cutting at 0.25 ppm (10.7%) and =>0.5 ppm (11.1%). There is little improvement cutting results =>5 ppm Au suggesting relative homogeneity within the Kraft envelope. Correlation of the total dataset excluding “Flyers”, with 204 pairs has a coefficient of 0.979 (Fig. 46). Bias is - 3 percent. Removing five weak high variance pairs, regression and diagonal lines are near-coincident; there is no bias (Fig. 47). AMPD = 100 / 204 x 16.17 AMPD = 7.9% The AMPD of 204 check pairs in the range 0.01-9.32ppm Au is 7.9 The AMPD x 1.98 is the precision of the system. Precision: Total dataset check analyses: 15.6% ( 95% confidence level (Range 0.01-9.32ppm Au) Precision for other ranges is:
Range ppm n Sum P =>0.1-9.32 174 10.85 12.3
=>0.25-9.32 147 7.97 10.7 = <0.25 =<5 137 7.26 10.5 =>0.5-9.32 109 6.13 11.1
P = Precision n = Number in dataset
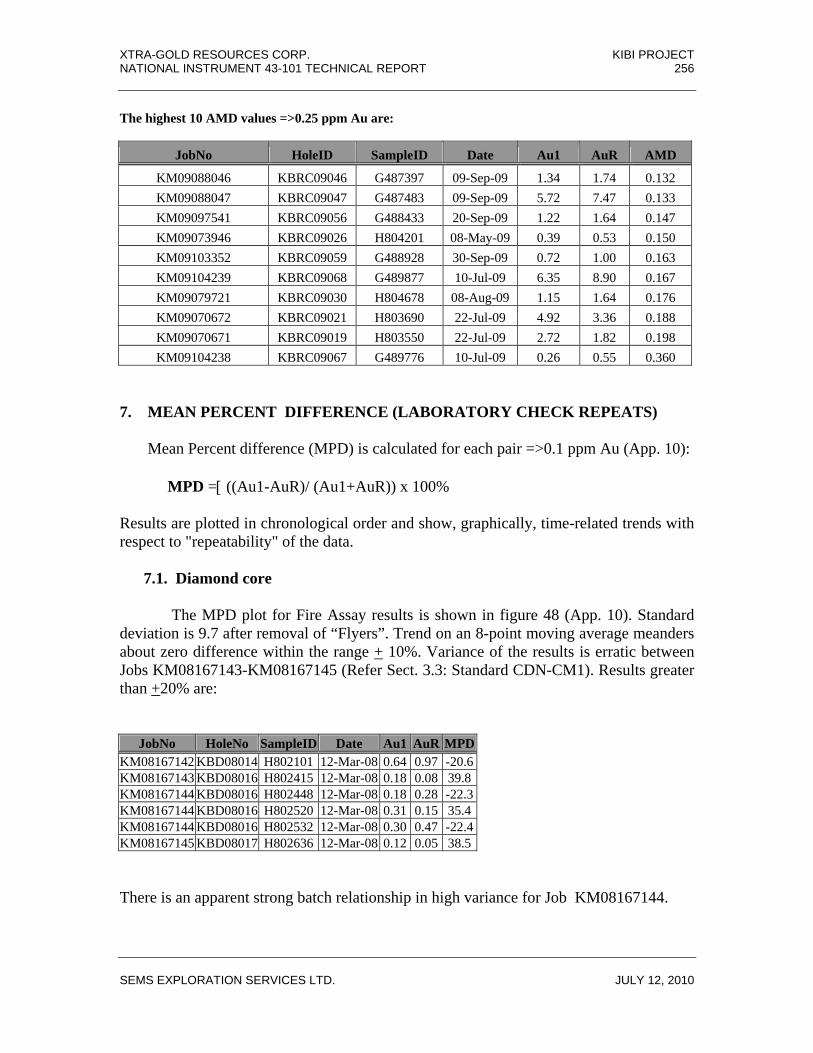
XTRA-GOLD RESOURCES CORP. KIBI PROJECT NATIONAL INSTRUMENT 43-101 TECHNICAL REPORT 256
SEMS EXPLORATION SERVICES LTD. JULY 12, 2010
The highest 10 AMD values =>0.25 ppm Au are:
JobNo HoleID SampleID Date Au1 AuR AMD
KM09088046 KBRC09046 G487397 09-Sep-09 1.34 1.74 0.132 KM09088047 KBRC09047 G487483 09-Sep-09 5.72 7.47 0.133 KM09097541 KBRC09056 G488433 20-Sep-09 1.22 1.64 0.147 KM09073946 KBRC09026 H804201 08-May-09 0.39 0.53 0.150 KM09103352 KBRC09059 G488928 30-Sep-09 0.72 1.00 0.163 KM09104239 KBRC09068 G489877 10-Jul-09 6.35 8.90 0.167 KM09079721 KBRC09030 H804678 08-Aug-09 1.15 1.64 0.176 KM09070672 KBRC09021 H803690 22-Jul-09 4.92 3.36 0.188 KM09070671 KBRC09019 H803550 22-Jul-09 2.72 1.82 0.198 KM09104238 KBRC09067 G489776 10-Jul-09 0.26 0.55 0.360
7. MEAN PERCENT DIFFERENCE (LABORATORY CHECK REPEATS) Mean Percent difference (MPD) is calculated for each pair =>0.1 ppm Au (App. 10):
MPD =[ ((Au1-AuR)/ (Au1+AuR)) x 100%
Results are plotted in chronological order and show, graphically, time-related trends with respect to "repeatability" of the data. 7.1. Diamond core The MPD plot for Fire Assay results is shown in figure 48 (App. 10). Standard deviation is 9.7 after removal of “Flyers”. Trend on an 8-point moving average meanders about zero difference within the range + 10%. Variance of the results is erratic between Jobs KM08167143-KM08167145 (Refer Sect. 3.3: Standard CDN-CM1). Results greater than +20% are:
JobNo HoleNo SampleID Date Au1 AuR MPDKM08167142 KBD08014 H802101 12-Mar-08 0.64 0.97 -20.6KM08167143 KBD08016 H802415 12-Mar-08 0.18 0.08 39.8KM08167144 KBD08016 H802448 12-Mar-08 0.18 0.28 -22.3KM08167144 KBD08016 H802520 12-Mar-08 0.31 0.15 35.4KM08167144 KBD08016 H802532 12-Mar-08 0.30 0.47 -22.4KM08167145 KBD08017 H802636 12-Mar-08 0.12 0.05 38.5 There is an apparent strong batch relationship in high variance for Job KM08167144.
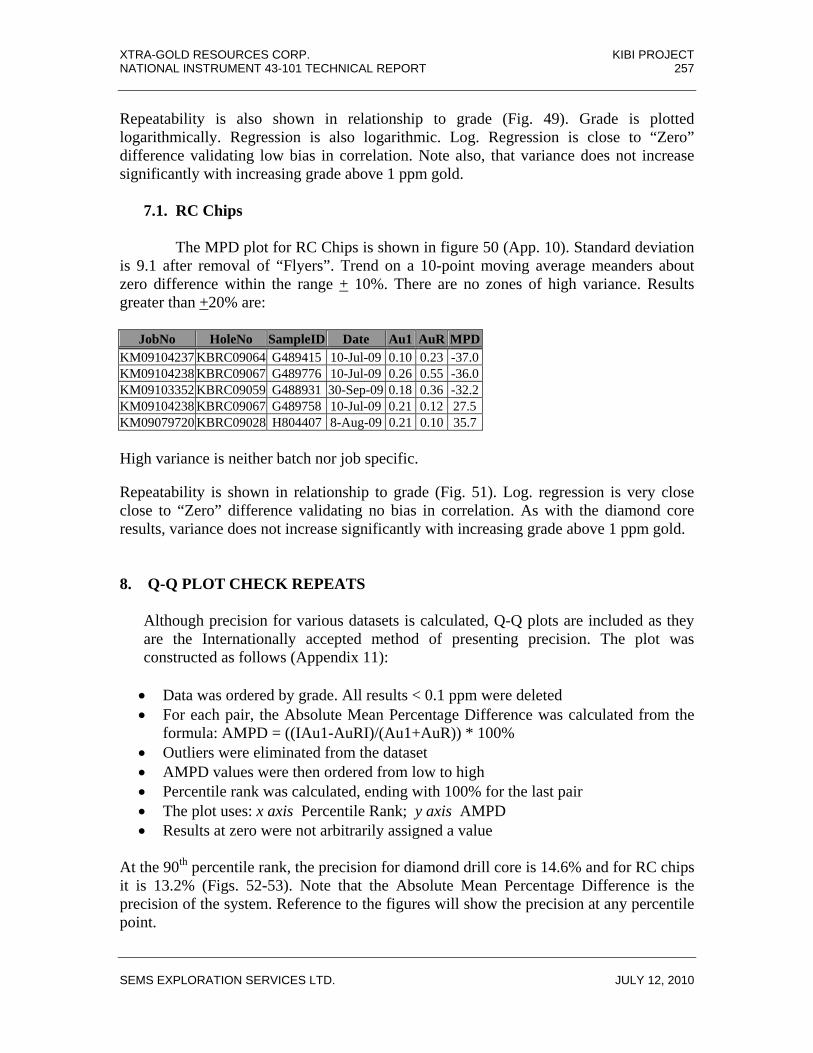
XTRA-GOLD RESOURCES CORP. KIBI PROJECT NATIONAL INSTRUMENT 43-101 TECHNICAL REPORT 257
SEMS EXPLORATION SERVICES LTD. JULY 12, 2010
Repeatability is also shown in relationship to grade (Fig. 49). Grade is plotted logarithmically. Regression is also logarithmic. Log. Regression is close to “Zero” difference validating low bias in correlation. Note also, that variance does not increase significantly with increasing grade above 1 ppm gold. 7.1. RC Chips The MPD plot for RC Chips is shown in figure 50 (App. 10). Standard deviation is 9.1 after removal of “Flyers”. Trend on a 10-point moving average meanders about zero difference within the range + 10%. There are no zones of high variance. Results greater than +20% are:
JobNo HoleNo SampleID Date Au1 AuR MPDKM09104237 KBRC09064 G489415 10-Jul-09 0.10 0.23 -37.0KM09104238 KBRC09067 G489776 10-Jul-09 0.26 0.55 -36.0KM09103352 KBRC09059 G488931 30-Sep-09 0.18 0.36 -32.2KM09104238 KBRC09067 G489758 10-Jul-09 0.21 0.12 27.5KM09079720 KBRC09028 H804407 8-Aug-09 0.21 0.10 35.7 High variance is neither batch nor job specific. Repeatability is shown in relationship to grade (Fig. 51). Log. regression is very close close to “Zero” difference validating no bias in correlation. As with the diamond core results, variance does not increase significantly with increasing grade above 1 ppm gold. 8. Q-Q PLOT CHECK REPEATS
Although precision for various datasets is calculated, Q-Q plots are included as they are the Internationally accepted method of presenting precision. The plot was constructed as follows (Appendix 11): • Data was ordered by grade. All results < 0.1 ppm were deleted • For each pair, the Absolute Mean Percentage Difference was calculated from the
formula: AMPD = ((IAu1-AuRI)/(Au1+AuR)) * 100% • Outliers were eliminated from the dataset • AMPD values were then ordered from low to high • Percentile rank was calculated, ending with 100% for the last pair • The plot uses: x axis Percentile Rank; y axis AMPD • Results at zero were not arbitrarily assigned a value
At the 90th percentile rank, the precision for diamond drill core is 14.6% and for RC chips it is 13.2% (Figs. 52-53). Note that the Absolute Mean Percentage Difference is the precision of the system. Reference to the figures will show the precision at any percentile point.
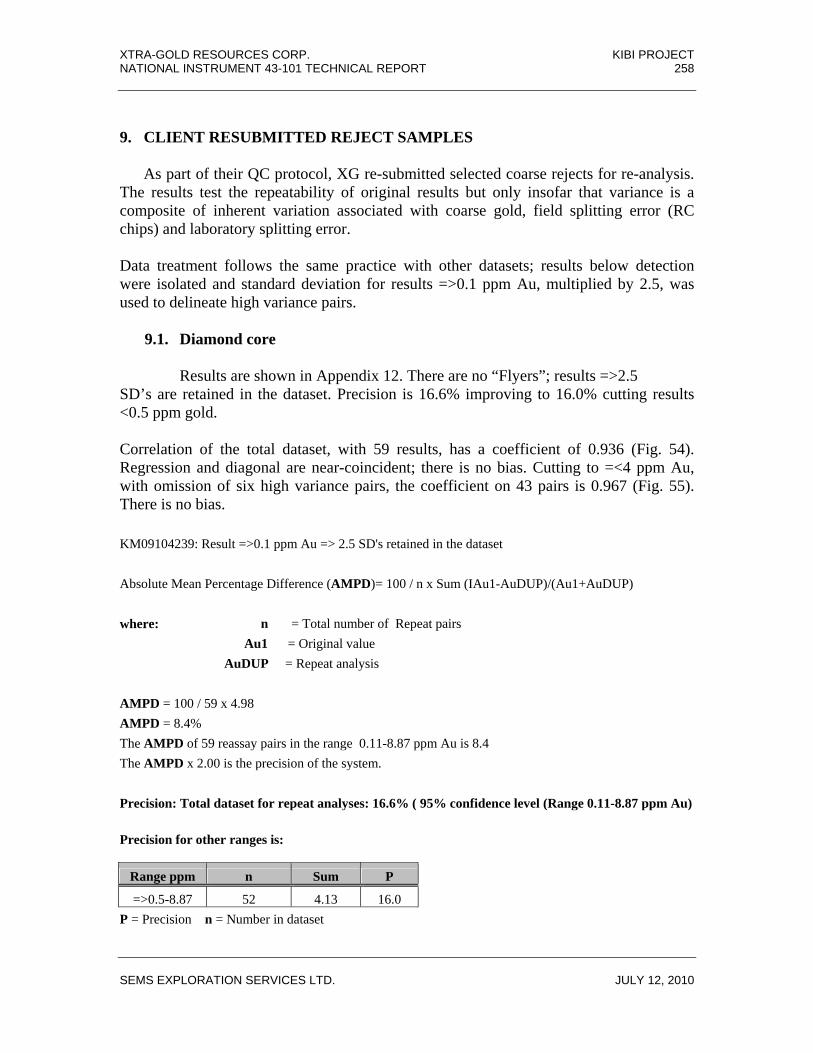
XTRA-GOLD RESOURCES CORP. KIBI PROJECT NATIONAL INSTRUMENT 43-101 TECHNICAL REPORT 258
SEMS EXPLORATION SERVICES LTD. JULY 12, 2010
9. CLIENT RESUBMITTED REJECT SAMPLES
As part of their QC protocol, XG re-submitted selected coarse rejects for re-analysis. The results test the repeatability of original results but only insofar that variance is a composite of inherent variation associated with coarse gold, field splitting error (RC chips) and laboratory splitting error.
Data treatment follows the same practice with other datasets; results below detection were isolated and standard deviation for results =>0.1 ppm Au, multiplied by 2.5, was used to delineate high variance pairs.
9.1. Diamond core
Results are shown in Appendix 12. There are no “Flyers”; results =>2.5
SD’s are retained in the dataset. Precision is 16.6% improving to 16.0% cutting results <0.5 ppm gold. Correlation of the total dataset, with 59 results, has a coefficient of 0.936 (Fig. 54). Regression and diagonal are near-coincident; there is no bias. Cutting to =<4 ppm Au, with omission of six high variance pairs, the coefficient on 43 pairs is 0.967 (Fig. 55). There is no bias. KM09104239: Result =>0.1 ppm Au => 2.5 SD's retained in the dataset Absolute Mean Percentage Difference (AMPD)= 100 / n x Sum (IAu1-AuDUP)/(Au1+AuDUP) where: n = Total number of Repeat pairs Au1 = Original value AuDUP = Repeat analysis AMPD = 100 / 59 x 4.98 AMPD = 8.4% The AMPD of 59 reassay pairs in the range 0.11-8.87 ppm Au is 8.4 The AMPD x 2.00 is the precision of the system. Precision: Total dataset for repeat analyses: 16.6% ( 95% confidence level (Range 0.11-8.87 ppm Au) Precision for other ranges is:
Range ppm n Sum P
=>0.5-8.87 52 4.13 16.0 P = Precision n = Number in dataset
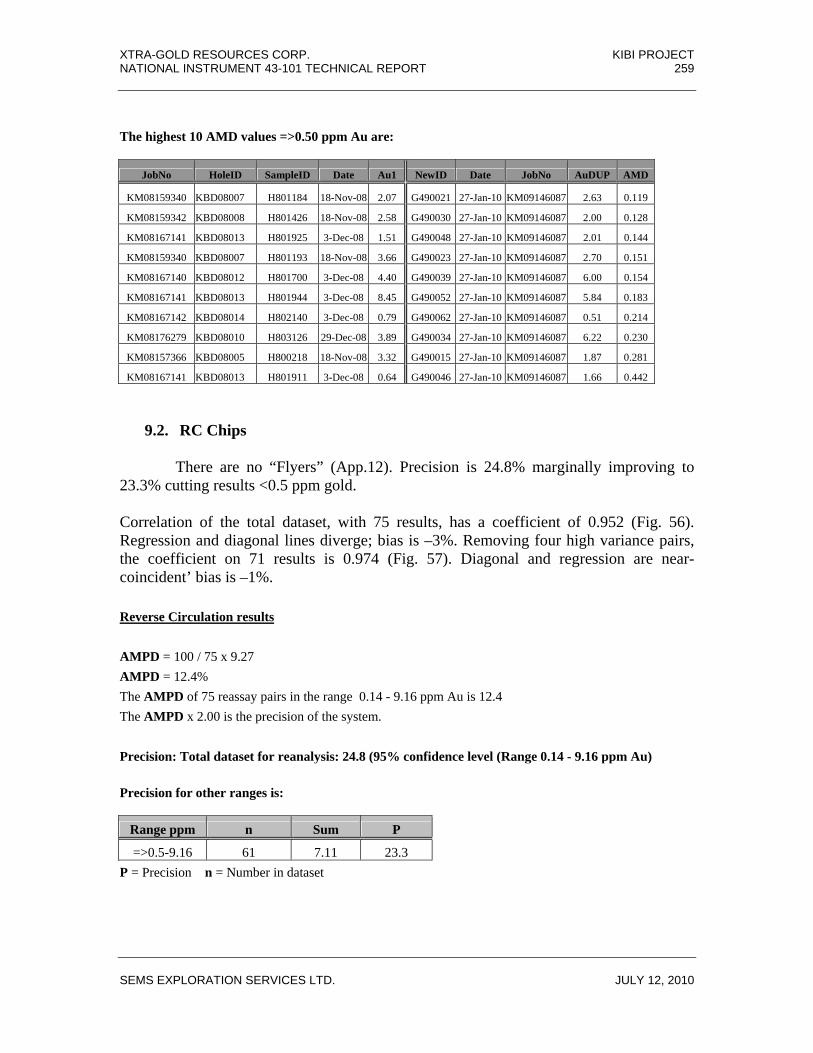
XTRA-GOLD RESOURCES CORP. KIBI PROJECT NATIONAL INSTRUMENT 43-101 TECHNICAL REPORT 259
SEMS EXPLORATION SERVICES LTD. JULY 12, 2010
The highest 10 AMD values =>0.50 ppm Au are:
JobNo HoleID SampleID Date Au1 NewID Date JobNo AuDUP AMD
KM08159340 KBD08007 H801184 18-Nov-08 2.07 G490021 27-Jan-10 KM09146087 2.63 0.119
KM08159342 KBD08008 H801426 18-Nov-08 2.58 G490030 27-Jan-10 KM09146087 2.00 0.128
KM08167141 KBD08013 H801925 3-Dec-08 1.51 G490048 27-Jan-10 KM09146087 2.01 0.144
KM08159340 KBD08007 H801193 18-Nov-08 3.66 G490023 27-Jan-10 KM09146087 2.70 0.151
KM08167140 KBD08012 H801700 3-Dec-08 4.40 G490039 27-Jan-10 KM09146087 6.00 0.154
KM08167141 KBD08013 H801944 3-Dec-08 8.45 G490052 27-Jan-10 KM09146087 5.84 0.183
KM08167142 KBD08014 H802140 3-Dec-08 0.79 G490062 27-Jan-10 KM09146087 0.51 0.214
KM08176279 KBD08010 H803126 29-Dec-08 3.89 G490034 27-Jan-10 KM09146087 6.22 0.230
KM08157366 KBD08005 H800218 18-Nov-08 3.32 G490015 27-Jan-10 KM09146087 1.87 0.281
KM08167141 KBD08013 H801911 3-Dec-08 0.64 G490046 27-Jan-10 KM09146087 1.66 0.442
9.2. RC Chips
There are no “Flyers” (App.12). Precision is 24.8% marginally improving to
23.3% cutting results <0.5 ppm gold. Correlation of the total dataset, with 75 results, has a coefficient of 0.952 (Fig. 56). Regression and diagonal lines diverge; bias is –3%. Removing four high variance pairs, the coefficient on 71 results is 0.974 (Fig. 57). Diagonal and regression are near-coincident’ bias is –1%. Reverse Circulation results AMPD = 100 / 75 x 9.27 AMPD = 12.4% The AMPD of 75 reassay pairs in the range 0.14 - 9.16 ppm Au is 12.4 The AMPD x 2.00 is the precision of the system. Precision: Total dataset for reanalysis: 24.8 (95% confidence level (Range 0.14 - 9.16 ppm Au) Precision for other ranges is:
Range ppm n Sum P
=>0.5-9.16 61 7.11 23.3 P = Precision n = Number in dataset

XTRA-GOLD RESOURCES CORP. KIBI PROJECT NATIONAL INSTRUMENT 43-101 TECHNICAL REPORT 260
SEMS EXPLORATION SERVICES LTD. JULY 12, 2010
The highest 10 AMD values =>0.5 ppm Au are:
JobNo HoleID SampleID Date Au1 NewID Date JobNo AuDUP AMD
KM09088047 KBRC09047 G487482 9-Sep-09 0.73 G490099 27-Jan-10 KM09146087 1.13 0.214
KM09104239 KBRC09068 G489888 7-Oct-09 1.33 G490158 27-Jan-10 KM09146087 0.85 0.217
KM09097540 KBRC09055 G488299 20-Sep-09 1.25 G490109 27-Jan-10 KM09146087 2.07 0.249
KM09103353 KBRC09062 G489185 30-Sep-09 1.82 G490150 27-Jan-10 KM09146087 1.09 0.250
KM09088045 KBRC09042 G487104 9-Sep-09 1.01 G490075 27-Jan-10 KM09146087 0.58 0.269
KM09104239 KBRC09068 G489904 7-Oct-09 2.06 G490162 27-Jan-10 KM09146087 1.18 0.274
KM09097540 KBRC09055 G488274 20-Sep-09 2.77 G490105 27-Jan-10 KM09146087 1.56 0.279
KM09088046 KBRC09045 G487329 9-Sep-09 0.61 G490090 27-Jan-10 KM09146087 1.39 0.388
KM09103353 KBRC09060 G489015 30-Sep-09 3.99 G490133 27-Jan-10 KM09146087 1.68 0.407
KM09103353 KBRC09060 G489042 30-Sep-09 1.49 G490142 27-Jan-10 KM09146087 0.17 0.793
9.3. Conclusions
Although the lack of bias is very good for both drill core and RC chips, a marked difference exists for precision:
Dataset Precision (Total Data) Precision (=>0.5 ppm Au) Diamond core 16.6 16.0 RC chips 24.8 23.2
The disparity is not related to difference in grade between the two datasets; both accommodate grade up to 9 ppm Au. There is no bias imposed through a greater number of high-grade results appearing in the RC dataset. Visually, the scatter in the range 1-3 ppm Au is less for the diamond core compared to RC chips. This will impact on precision. Diamond core was crushed prior to splitting 250g for analysis. In contrast, 1kg was split from RC samples and pulverised. Precision for RC chips should be better than for diamond core. This assumes the pulverised RC sample was homogenized before taking a sub-sample for Fire Assay. Laboratory protocol requires matrolling of the sample prior to “Scooping” by Kraft envelope to obtain a sub-sample for Fire Assay. However, matrolling does not homogenize a sample. It simply moves “Clouds” of different composition-grade to different positions in the pulp pile. The correct procedure is to fractional shovel the sample into the Kraft envelope, taking at least 30 “shovels” from the total material (Gy,1979). It is possible that some precision is lost by “Scooping”.
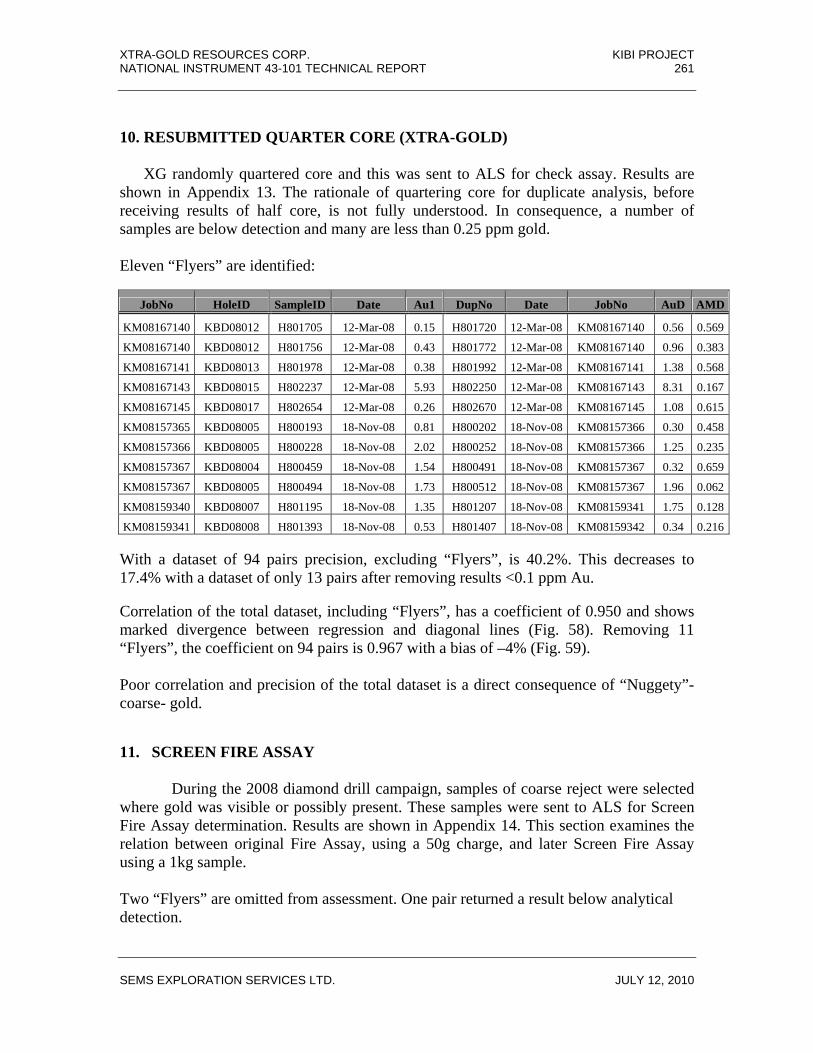
XTRA-GOLD RESOURCES CORP. KIBI PROJECT NATIONAL INSTRUMENT 43-101 TECHNICAL REPORT 261
SEMS EXPLORATION SERVICES LTD. JULY 12, 2010
10. RESUBMITTED QUARTER CORE (XTRA-GOLD)
XG randomly quartered core and this was sent to ALS for check assay. Results are shown in Appendix 13. The rationale of quartering core for duplicate analysis, before receiving results of half core, is not fully understood. In consequence, a number of samples are below detection and many are less than 0.25 ppm gold.
Eleven “Flyers” are identified:
JobNo HoleID SampleID Date Au1 DupNo Date JobNo AuD AMD
KM08167140 KBD08012 H801705 12-Mar-08 0.15 H801720 12-Mar-08 KM08167140 0.56 0.569
KM08167140 KBD08012 H801756 12-Mar-08 0.43 H801772 12-Mar-08 KM08167140 0.96 0.383
KM08167141 KBD08013 H801978 12-Mar-08 0.38 H801992 12-Mar-08 KM08167141 1.38 0.568
KM08167143 KBD08015 H802237 12-Mar-08 5.93 H802250 12-Mar-08 KM08167143 8.31 0.167
KM08167145 KBD08017 H802654 12-Mar-08 0.26 H802670 12-Mar-08 KM08167145 1.08 0.615
KM08157365 KBD08005 H800193 18-Nov-08 0.81 H800202 18-Nov-08 KM08157366 0.30 0.458
KM08157366 KBD08005 H800228 18-Nov-08 2.02 H800252 18-Nov-08 KM08157366 1.25 0.235
KM08157367 KBD08004 H800459 18-Nov-08 1.54 H800491 18-Nov-08 KM08157367 0.32 0.659
KM08157367 KBD08005 H800494 18-Nov-08 1.73 H800512 18-Nov-08 KM08157367 1.96 0.062
KM08159340 KBD08007 H801195 18-Nov-08 1.35 H801207 18-Nov-08 KM08159341 1.75 0.128
KM08159341 KBD08008 H801393 18-Nov-08 0.53 H801407 18-Nov-08 KM08159342 0.34 0.216
With a dataset of 94 pairs precision, excluding “Flyers”, is 40.2%. This decreases to 17.4% with a dataset of only 13 pairs after removing results <0.1 ppm Au.
Correlation of the total dataset, including “Flyers”, has a coefficient of 0.950 and shows marked divergence between regression and diagonal lines (Fig. 58). Removing 11 “Flyers”, the coefficient on 94 pairs is 0.967 with a bias of –4% (Fig. 59).
Poor correlation and precision of the total dataset is a direct consequence of “Nuggety”- coarse- gold.
11. SCREEN FIRE ASSAY During the 2008 diamond drill campaign, samples of coarse reject were selected where gold was visible or possibly present. These samples were sent to ALS for Screen Fire Assay determination. Results are shown in Appendix 14. This section examines the relation between original Fire Assay, using a 50g charge, and later Screen Fire Assay using a 1kg sample. Two “Flyers” are omitted from assessment. One pair returned a result below analytical detection.

XTRA-GOLD RESOURCES CORP. KIBI PROJECT NATIONAL INSTRUMENT 43-101 TECHNICAL REPORT 262
SEMS EXPLORATION SERVICES LTD. JULY 12, 2010
“Flyers” omitted:
JobNo Hole ID SampleID Au1 SampleIDSFA SpleID JobNo AuSFA AMD Comment
KM08159342 KBD08008 H801425 1.93 H803405 H801425 KM09000908 1.03 0.304
KM08157367 KBD08004 H800458 0.19 H803388 H800458 KM09000908 0.38 0.333 [email protected]? Precision of the total dataset, excluding “Flyers”, is 18.6% improving to 17.4% cutting results < 0.5 ppm gold. Cutting in the range =>0.5 <5 ppm Au saw a deterioration in precision to 19.6%. Correlation of the total dataset, including “Flyers”, is shown in Figure 60. Correlation coefficient is 0.974 with divergence between regression and diagonal lines, reflecting a bias of –6%. Cutting results to <5ppm Au, the coefficient on 35 pairs is 0.944 with near-coincidence between regression and diagonal lines (Fig. 61). Bias is less than 1 percent (The data, when re-plotted cutting at 13 ppm Au, displayed a positive bias of 5%. This figure is not shown). KM08167140: Result =>0.1 ppm Au => 2.5 standard deviations retained in the dataset
Absolute Mean Percentage Difference (AMPD)= 100 / n x Sum (IAu1-AuSFA)/(Au1+AuSFA)
where: n = Total number of FA and SFA pairs
Au1 = Original value (50g Fire Assay)
AuSFA = Screen Fie Assay result (1kg)
AMPD = 100 / 39 x 3.68 AMPD = 9.4% The AMPD of 39 Screen Fire Assay vs 50g Fire Assay pairs in the range 0.01-13.60 ppm Au is 9.4 The AMPD x 2.04 is the precision of the system. Precision of the total dataset for check repeat analyses: 18.6% at the 95% confidence level (Range 0.01-13.60 ppm Au)
Precision for other ranges is:
Range ppm n Sum P =>0.1-13.6 37 3.37 18.6 =>0.5-13.6 30 2.56 17.4 =>0.5 =<5 24 2.28 19.6
P = Precision n = Number in dataset

XTRA-GOLD RESOURCES CORP. KIBI PROJECT NATIONAL INSTRUMENT 43-101 TECHNICAL REPORT 263
SEMS EXPLORATION SERVICES LTD. JULY 12, 2010
The highest 10 AMD values =>0.50 ppm Au are:
JobNo Hole ID SampleID Au1 SampleIDSFA SpleID JobNo AuSFA AMD
KM08167140 KBD08012 H801699 1.59 H803414 H801699 KM09000908 1.94 0.099
KM08159342 KBD08008 H801427 4.30 H803407 H801427 KM09000908 5.39 0.112
KM08157367 KBD08004 H800459 1.54 H803389 H800459 KM09000908 1.22 0.114
KM08167140 KBD08012 H801708 13.60 H803417 H801708 KM09000908 10.75 0.117
KM08167140 KBD08012 H801698 3.10 H803412 H801698 KM09000908 4.01 0.128
KM08159342 KBD08008 H801426 2.58 H803406 H801426 KM09000908 1.96 0.137
KM08167141 KBD08013 H801974 3.19 H803422 H801974 KM09000908 4.22 0.139
KM08159342 KBD08008 H801429 0.55 H803408 H801429 KM09000908 0.79 0.180
KM08159342 KBD08008 H801421 1.31 H803402 H801421 KM09000908 2.01 0.213
KM08167142 KBD08015 H802225 0.93 H803433 H802225 KM09000908 0.53 0.275 12. DUPLICATE ANALYSIS OF COARSE REJECTS (DIAMOND CORE) To determine splitting error in the laboratory, XG were requested to send 32 drill core reject samples to SEMS. Grade range was 0.5-6 ppm gold. Rejects arrived in three sacks with security seals numbered 0017681, -82 and –83. These rejects were dried by Intertek, Tarkwa, weighed and passed through a 2mm screen. Results are shown in Table 6. Table 6 Sizing analysis: Coarse rejects
Job Number Sample ID Weight dry (Kg)Weight passing -
2mm (Kg) Weight +2mm
(Kg) % Passing 2mm
Screen KBDD08003 H800089 0.43 0.41 0.02 95.3 KBDD08012 H801664 2.66 1.99 0.6 74.8 KBDD08013 H801926 1.98 1.04 0.99 52.5 KBDD08014 H802142 1.65 1.13 0.52 68.5 KBDD08014 H802153 1.92 1.3 0.62 67.7 KBDD08015 H802250 2.12 1.49 0.63 70.3 KBDD08017 H802616 0.51 0.25 0.26 49.0 KBDD08009 H802933 2.5 2.24 0.26 89.6 KBDD08010 H803125 2.3 1.38 0.92 60.0 KBDD08010 H803141 2.34 1.25 1.09 53.4
Average (Excluding H800089) 65.1% Note: KBDD08003 / H800089 was a coarse reject, previously resubmitted as a duplicate by XG. The reason for the fine grind is not known? After drying, the samples were replaced in their original bags. A separate set of bags was prepared. Numbers for each of the original samples was changed and written on the new bag, sample by sample. The old and new samples ID’s were written in a sample book and a new sample tag was placed in each bag. This work was carried out by the Writer.

XTRA-GOLD RESOURCES CORP. KIBI PROJECT NATIONAL INSTRUMENT 43-101 TECHNICAL REPORT 264
SEMS EXPLORATION SERVICES LTD. JULY 12, 2010
The samples were then taken to ALS, Kumasi. The objective was to replicate the procedure adopted in 2008 and assay duplicate splits of the samples to gain a better understanding of splitting error. The laboratory was instructed to homogenize the sample and then split off approximately 250 grammes. Taking the entire remnant sample, a second split was carried out to give the 250g duplicates. Samples were homogenized by placing the original in a larger sack and mixing by shaking within the bag. The entire sample was then placed in a splitter tray and split to 250 grammes (All splitting was monitored by the Writer). Samples were introduced into the centre of the two-stage splitter, taking alternately right and left pans as the sample to be analysed. All reject was collected, returned to its original bag and taken to Intertek, Tarkwa, for Screen Fire Assay determination. Correlation of the dataset shows marked divergence between the regression and diagonal lines (Fig. 62). There is a grouping of high results, >6 ppm AuD, which distorts the regression (Fig. 62: Area A). Although the regression is Au1 against AuD, the grouping reflects the old jobs KM08167140-KM08167143 and these results are in column “AuOR” (The Reader is referred to Sect. 3.3.:Stds CDN-CM1 and CDN-GS-3D). The new results are in no way influenced by the old results. The explanation of the grouping is not entirely clear but could represent bias during sampling? Results of the duplicate analyses are shown in Appendix 15. Precision of the new results (Au1 and AuD) is 30.2%. Precision of Au1 against the historical result (AuOR) is 36.7%. Absolute Mean Percentage Difference (AMPD)= 100 / n x Sum (IAu1-AuD)/(Au1+AuD)
where: n = Total number of Duplicate pairs
Au1 = Original value
AuD = Duplicate value
AuOR = Historical result
Laboratory duplicates (Au1 vs AuD) AMPD = 100 / 32 x 4.72 AMPD = 14.8% The AMPD of 32 duplicate pairs in the range 0.05-11.9 ppm Au is 14.8 The AMPD x 2.04 is the precision of the system. Precision: Total dataset duplicate Au1vsAuD: 30.2% (95% confid. level: Range 0.05-11.9 ppm Au)
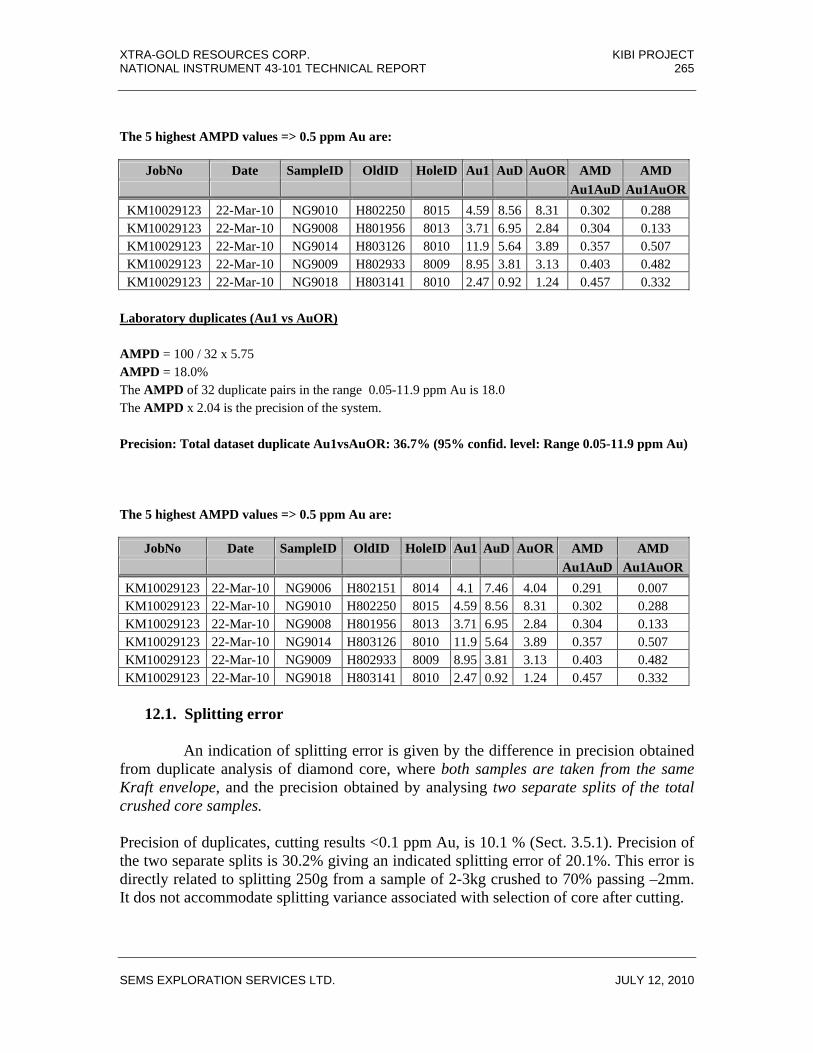
XTRA-GOLD RESOURCES CORP. KIBI PROJECT NATIONAL INSTRUMENT 43-101 TECHNICAL REPORT 265
SEMS EXPLORATION SERVICES LTD. JULY 12, 2010
The 5 highest AMPD values => 0.5 ppm Au are:
JobNo Date SampleID OldID HoleID Au1 AuD AuOR AMD AMD Au1AuD Au1AuOR
KM10029123 22-Mar-10 NG9010 H802250 8015 4.59 8.56 8.31 0.302 0.288 KM10029123 22-Mar-10 NG9008 H801956 8013 3.71 6.95 2.84 0.304 0.133 KM10029123 22-Mar-10 NG9014 H803126 8010 11.9 5.64 3.89 0.357 0.507 KM10029123 22-Mar-10 NG9009 H802933 8009 8.95 3.81 3.13 0.403 0.482 KM10029123 22-Mar-10 NG9018 H803141 8010 2.47 0.92 1.24 0.457 0.332
Laboratory duplicates (Au1 vs AuOR) AMPD = 100 / 32 x 5.75 AMPD = 18.0% The AMPD of 32 duplicate pairs in the range 0.05-11.9 ppm Au is 18.0 The AMPD x 2.04 is the precision of the system. Precision: Total dataset duplicate Au1vsAuOR: 36.7% (95% confid. level: Range 0.05-11.9 ppm Au) The 5 highest AMPD values => 0.5 ppm Au are:
JobNo Date SampleID OldID HoleID Au1 AuD AuOR AMD AMD Au1AuD Au1AuOR
KM10029123 22-Mar-10 NG9006 H802151 8014 4.1 7.46 4.04 0.291 0.007 KM10029123 22-Mar-10 NG9010 H802250 8015 4.59 8.56 8.31 0.302 0.288 KM10029123 22-Mar-10 NG9008 H801956 8013 3.71 6.95 2.84 0.304 0.133 KM10029123 22-Mar-10 NG9014 H803126 8010 11.9 5.64 3.89 0.357 0.507 KM10029123 22-Mar-10 NG9009 H802933 8009 8.95 3.81 3.13 0.403 0.482 KM10029123 22-Mar-10 NG9018 H803141 8010 2.47 0.92 1.24 0.457 0.332
12.1. Splitting error An indication of splitting error is given by the difference in precision obtained from duplicate analysis of diamond core, where both samples are taken from the same Kraft envelope, and the precision obtained by analysing two separate splits of the total crushed core samples. Precision of duplicates, cutting results <0.1 ppm Au, is 10.1 % (Sect. 3.5.1). Precision of the two separate splits is 30.2% giving an indicated splitting error of 20.1%. This error is directly related to splitting 250g from a sample of 2-3kg crushed to 70% passing –2mm. It dos not accommodate splitting variance associated with selection of core after cutting.

XTRA-GOLD RESOURCES CORP. KIBI PROJECT NATIONAL INSTRUMENT 43-101 TECHNICAL REPORT 266
SEMS EXPLORATION SERVICES LTD. JULY 12, 2010
13. GRAVIMETRIC REPEAT DETERMINATIONS Gravimetric determinations were automatically carried out for results => 10 ppm
Au. Results are shown in Figure 6. Table 6. Repeat determinations: Gravimetric analyses
JobNo HoleID SampleID Date Au1 LDUP Sample_ID Date Dup LDUP Batch AuD
KM08176279 KBD08010 H803135 29-Dec-08 9.58 H803135 29-Dec-08 KM08176279 9.40 KM09104239 KBRC09068 G489919 10-Jul-09 10.40 G489919 10-Jul-09 KM09104239 10.40KM08167140 KBD08012 H801708 03-Dec-08 13.60 H801708 03-Dec-08 KM08167140 13.85KM08167143 KBD08015 H802260 03-Dec-08 16.40 H802260 03-Dec-08 KM08167143 16.20KM09070671 KBRC09019 H803484 22-Jul-09 25.10 H803484 22-Jul-09 KM09070671 26.00KM08157369 KBD08006 H800952 18-Nov-08 31.30 H800952 18-Nov-08 KM08157369 34.30KM09088041 KBRC09039 G486737 20-Aug-09 39.80 G486737 20-Aug-09 KM09088041 39.70 The dataset is too small to afford statistical assessment. Correlation of the total data is sown in Figure 61A. There is slight distortion from one high variance pair. On removal of this pair, there is close agreement between regression and diagonal lines (Fig. 61B). 14. RE-ANALYSIS OF QUARTERED CORE (SEMS)
As part of the validation procedure required by 43-101, SEMS staff visited the XG and selected core for quartering. Quartering was supervised by SEMS staff and samples were sent to Intertek, Tarkwa, for Screen Fire Assay analysis. At Intertek, sample preparation protocols were followed as shown in Figure 1. Prior to the start of preparation, the core was washed to remove any extraneous dirt. Results are shown in Appendix 15.

XTRA-GOLD RESOURCES CORP. KIBI PROJECT NATIONAL INSTRUMENT 43-101 TECHNICAL REPORT 267
SEMS EXPLORATION SERVICES LTD. JULY 12, 2010
Appendix 15
Resubmitted Diamond Core Coarse Rejects: SEMS

XTRA-GOLD RESOURCES CORP. KIBI PROJECT NATIONAL INSTRUMENT 43-101 TECHNICAL REPORT 268
SEMS EXPLORATION SERVICES LTD. JULY 12, 2010
15. LABORATORY AUDIT After prior notification, ALS, Kumasi, were visited on Monday and Tuesday,15-16th March. A total of eight hours was spent at the laboratory. Discussions were held with the following personnel, in addition to informal discussions with laboratory staff:-:

XTRA-GOLD RESOURCES CORP. KIBI PROJECT NATIONAL INSTRUMENT 43-101 TECHNICAL REPORT 269
SEMS EXPLORATION SERVICES LTD. JULY 12, 2010
Francis Donkor-Baah (laboratory Manager) Aikins Brobbey (Chief Chemist/ Assistant Manager Augustus Ackon (AAS Reporting Chemist) Samuel Kwabzo (Manager, Sample Preparation) The report is summarised in Appendix 17. The majority of observations made will not be reiterated. Serve only to mention the salient facts. The Writer firmly believes that should an audit identify possible areas of improvement in the laboratory, such areas should be reported to the Laboratory Manager with recommendations for improvement. To this end, the report was sent to Mr Donkor-Baah prior to release. His reply stated that the report was, “ A fair assessment of he state of the laboratory”. The laboratory is well managed with an efficient team. Total staff is subject to sample volume and is currently 50. It is well lit, clean and essentially dust free due to an efficient extraction system. Dust control is facilitated by open doors to the front and rear, allowing throughput of air. Pulp samples are well organized with easy access. Pulp boxes have LIMS labels identifying client and numbers. Rejects are similarly marked. The protocol of using predetermined calibration standards combined with the internal standards made from 99.999 fine gold is good. There are three areas that require action:
1. Sub-sampling of pulp from the pulverising stage should use the technique of fractional shoveling. Matrolling of the sample was not observed. The pulverised sample is poured directly from the bowl into a metal dish. The current procedure of “scooping” pulp into envelopes from the dish may not enhance repeatability, especially where samples are associated with coarse gold
2. Remnant pulp adheres to the bowl and this is not brushed into the receiving pan. It is lost after sampling when the bowl is cleaned with a brush and compressed air. This could lead to potential dust problems
3. More than 80% of samples show boil-overs after firing. This is a concern but is recognized by the laboratory. Ordinarily, protocol demands that a boil-over is reassayed (Boil-over may result in loss of sample material thus loss of gold leading to erroneously low results. This is not necessarily indicated by negative bias of internal standards as the reaction during firing of a standard differs from that of a field sample, especially if the field sample is sulphidic). The laboratory is currently attempting to solve the situation by using a 30g Fire Assay for all work. This requires client consent but will reduce the sample-flux volume considerably, thus minimizing boil-overs.
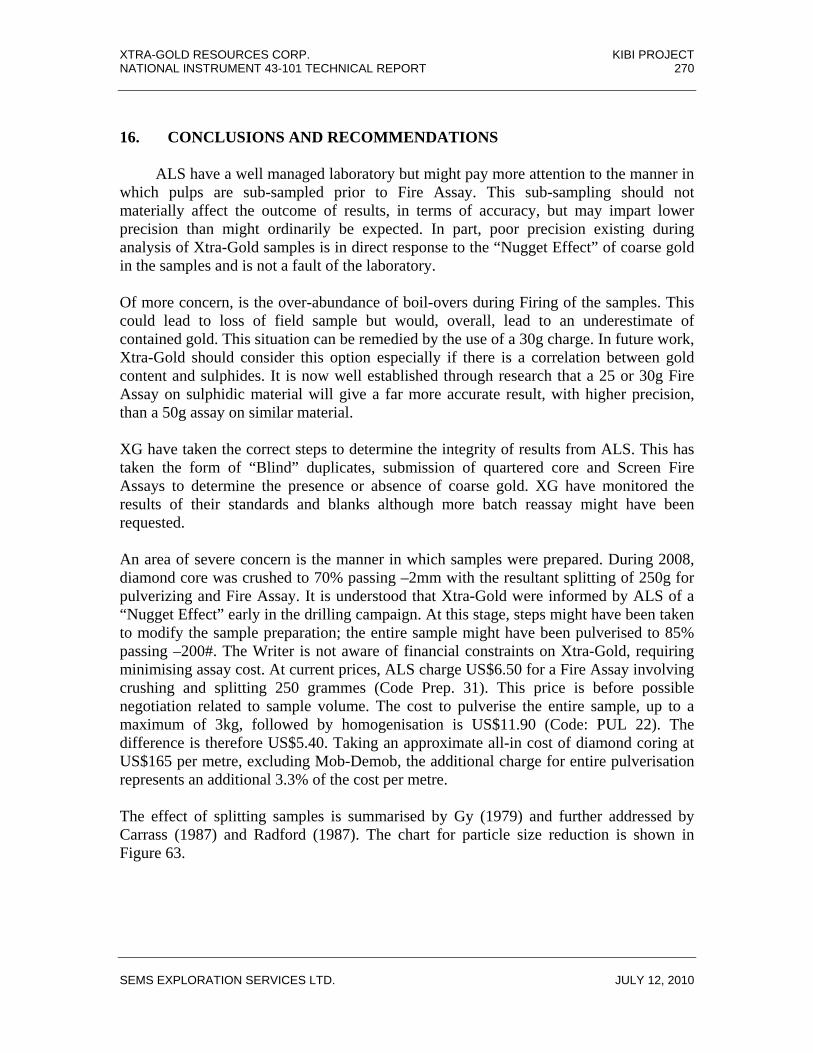
XTRA-GOLD RESOURCES CORP. KIBI PROJECT NATIONAL INSTRUMENT 43-101 TECHNICAL REPORT 270
SEMS EXPLORATION SERVICES LTD. JULY 12, 2010
16. CONCLUSIONS AND RECOMMENDATIONS ALS have a well managed laboratory but might pay more attention to the manner in which pulps are sub-sampled prior to Fire Assay. This sub-sampling should not materially affect the outcome of results, in terms of accuracy, but may impart lower precision than might ordinarily be expected. In part, poor precision existing during analysis of Xtra-Gold samples is in direct response to the “Nugget Effect” of coarse gold in the samples and is not a fault of the laboratory. Of more concern, is the over-abundance of boil-overs during Firing of the samples. This could lead to loss of field sample but would, overall, lead to an underestimate of contained gold. This situation can be remedied by the use of a 30g charge. In future work, Xtra-Gold should consider this option especially if there is a correlation between gold content and sulphides. It is now well established through research that a 25 or 30g Fire Assay on sulphidic material will give a far more accurate result, with higher precision, than a 50g assay on similar material. XG have taken the correct steps to determine the integrity of results from ALS. This has taken the form of “Blind” duplicates, submission of quartered core and Screen Fire Assays to determine the presence or absence of coarse gold. XG have monitored the results of their standards and blanks although more batch reassay might have been requested. An area of severe concern is the manner in which samples were prepared. During 2008, diamond core was crushed to 70% passing –2mm with the resultant splitting of 250g for pulverizing and Fire Assay. It is understood that Xtra-Gold were informed by ALS of a “Nugget Effect” early in the drilling campaign. At this stage, steps might have been taken to modify the sample preparation; the entire sample might have been pulverised to 85% passing –200#. The Writer is not aware of financial constraints on Xtra-Gold, requiring minimising assay cost. At current prices, ALS charge US$6.50 for a Fire Assay involving crushing and splitting 250 grammes (Code Prep. 31). This price is before possible negotiation related to sample volume. The cost to pulverise the entire sample, up to a maximum of 3kg, followed by homogenisation is US$11.90 (Code: PUL 22). The difference is therefore US$5.40. Taking an approximate all-in cost of diamond coring at US$165 per metre, excluding Mob-Demob, the additional charge for entire pulverisation represents an additional 3.3% of the cost per metre. The effect of splitting samples is summarised by Gy (1979) and further addressed by Carrass (1987) and Radford (1987). The chart for particle size reduction is shown in Figure 63.

XTRA-GOLD RESOURCES CORP. KIBI PROJECT NATIONAL INSTRUMENT 43-101 TECHNICAL REPORT 271
SEMS EXPLORATION SERVICES LTD. JULY 12, 2010
Taking a sample of 3kg and splitting 250g requires a particle size of approximately 0.12mm prior to splitting in order to keep the potential splitting error below 5 percent. Taking 3kg, crushing to 2mm, and taking a 250g split invokes a splitting error of over 100%. This is good reason to pulverise the entire core sample. The problem is not solved with RC drilling. A 25kg sample split to 3kg without sample diminution involves an error of 75%. This is more reason to take field splits to determine splitting error. The field split is not derived from the final two pans (2 x 3kg) at the end of splitting. After taking one split, all reject should be recombined followed by repeat splitting to give a second 3kg duplicate. Finally, the Writer cannot comment on field procedure associated with selection of core for analysis. In the majority of field situations, the geologist logging the core will mark the core and bag the sample for analysis after cutting. This may be acceptable provided the side selected for bagging is alternate right and left or decided by the toss of a coin. The alternative is unavoidable; the best “bit” goes in the bag. During the 2008-2009 drilling campaign, Xtra-Gold were mindful of quality control issues and displayed a professional approach to minimising possible errors. Greater concern might have been directed towards sample preparation but this should not undermine the validity of the project. References Carrass, S., 1987. Gold Sampling- The Importance of Getting it Right in Meaningful Sampling in Gold Exploration. Austral. Inst. of Geosc., Bull. 7, p 1-26 Gy, P.M., 1979. Sampling of Particulate Material: Theory and Practice. Elsevier,
Amsterdam. Pp 431. Radford, N.W., 1987. Assessment of Error in Sampling in Meaningful Sampling in Gold Exploration. Austral. Inst. of Geosc., Bull. 7, p 153-160

XTRA-GOLD RESOURCES CORP. KIBI PROJECT NATIONAL INSTRUMENT 43-101 TECHNICAL REPORT 272
SEMS EXPLORATION SERVICES LTD. JULY 12, 2010
CERTIFICATE The Writer of this report on Quality Control, associated with the drilling activities of Xtra-Gold in 2008 and 2009, is John N M Coates. I, John N M Coates, do certify that:
1. I am a graduate in Geology from Leicester University, U.K., graduating with a B.Sc. (Hons) in 1972 followed by an M.Sc. and D.I.C. in Mineral Exploration from Imperial College, London, in 1978
2. With 38 years experience, I have worked on various mineral environments in many countries
3. From June 1972 until December 2009, I worked for Transworld-Interek laboratory, Tarkwa, where I was responsible for quality control. This entailed day-to-day monitoring of activities and preparation of monthly QC reports to clients
4. I am currently employed by SEMS-Exploration in the capacity of Consultant and Exploration Manager, West Africa
5. The cost of preparing this report was borne by SEMS-Exploration 6. I have no material interest in Xtra-Gold and have not worked for this company in
the past 7. I do not stand to gain anything, in favour or in kind, from the outcome of this
report should Xtra-Gold gain listing on the stock exchange 8. This report is specific to quality control. As I did not work for Xtra-Gold in the
field, I cannot vouch for quality assurance 9. I consent to this report being used by Xtra-Gold
John N M Coates Tarkwa 22nd March, 2010