kidney diseases - volume one - chapter 06
TRANSCRIPT
8/14/2019 Kidney Diseases - VOLUME ONE - Chapter 06
http://slidepdf.com/reader/full/kidney-diseases-volume-one-chapter-06 1/28
6
Disorders ofAcid-Base Balance
Maintenance of acid-base homeostasis is a vital function of the
living organism. Deviations of systemic acidity in either
direction can impose adverse consequences and when severe
can threaten life itself. Acid-base disorders frequently are encountered
in the outpatient and especially in the inpatient setting. Effective man-
agement of acid-base disturbances, commonly a challenging task, rests
with accurate diagnosis, sound understanding of the underlying
pathophysiology and impact on organ function, and familiarity with
treatment and attendant complications [1].
Clinical acid-base disorders are conventionally defined from the
vantage point of their impact on the carb onic acid-bicarbonate buffer
system. This app roach is justified by the abundance of this buffer pairin body fluids; its physiologic preeminence; and the validity of the iso-
hydric principle in the living organism, which specifies that all the
other buffer systems are in equilibrium with the carbonic acid-bicar-
bonate buffer pair. Thus, as indicated by the Henderson equation,
[H +] = 24 PaCO 2 /[HCO-3] (the equilibrium relationship of the car-
bonic acid-bicarbonate system), the hydrogen ion concentration of
blood ([H +], expressed in nEq/L) at any moment is a function of the
prevailing ratio of the arterial carbon dioxide tension (PaCO 2,
expressed in mm Hg) and the plasma bicarbonate concentration
([HCO-3], expressed in mEq/L). As a corollary, changes in systemic
acidity can occur only through changes in the values of its two deter-
minants, PaCO 2 and the plasma bicarbonate concentration. Those
acid-base disorders initiated by a change in PaCO 2 are referred to as
respiratory disorders; those initiated by a change in plasma bicarbon -ate concentration are known as metabolic disorders. There are four
cardinal acid-base disturbances: respirator y acidosis, respiratory alka-
losis, metabolic acidosis, and metabolic alkalosis. Each can be
encountered alone, as a simple disorder, or can be a part of a mixed-
disorder, defined as the simultaneous pr esence of two or m ore simple
Horacio J. Adrogué Nicolaos E. Madias
C H A P T E R
8/14/2019 Kidney Diseases - VOLUME ONE - Chapter 06
http://slidepdf.com/reader/full/kidney-diseases-volume-one-chapter-06 2/28
6.2 Disorders of Water, Electrolytes, and Acid-Base
acid-base disturbances. Mixed acid-base disorders are frequent-
ly observed in hospitalized pat ients, especially in the critically ill.
The clinical aspects of the four cardinal acid-base
disorders are depicted. For each disorder the following are
illustrated: the underlying pathophysiology, secondary
adjustments in a cid-base equilibrium in response to the initi-
ating disturbance, clinical manifestations, causes, and thera-
peutic principles.
Respiratory Acidosis
6.8 6.9
Steady-state relationships in respiratory acidosis:
average increase per mm Hg rise in PaCO2
[HCO – 3] mEq/L [H+] nEq/L
7.0 7.1 7.2 7.3 7.4 7.5 7.6 7.7
150125 100
PaCO2mm Hg
120 100 90 80 70
40
30
20
10
80 70 60 50 40 30 20
Arterial blood pH
Arterial blood [H+],nEq/L
10
20
30
40
A r t e r i a l p l a s m a [ H C O
– 3 ] , m E q / L
50
60 50
0.75
0.3
0.1
0.3
Acute adaptation
Chronic adaptation
Normal
C h r o n i c r e s p
i r a t o r y
a c i d o s i s
Ac ut e r es p i r at o r y ac i d o s i s
FIGURE 6-1
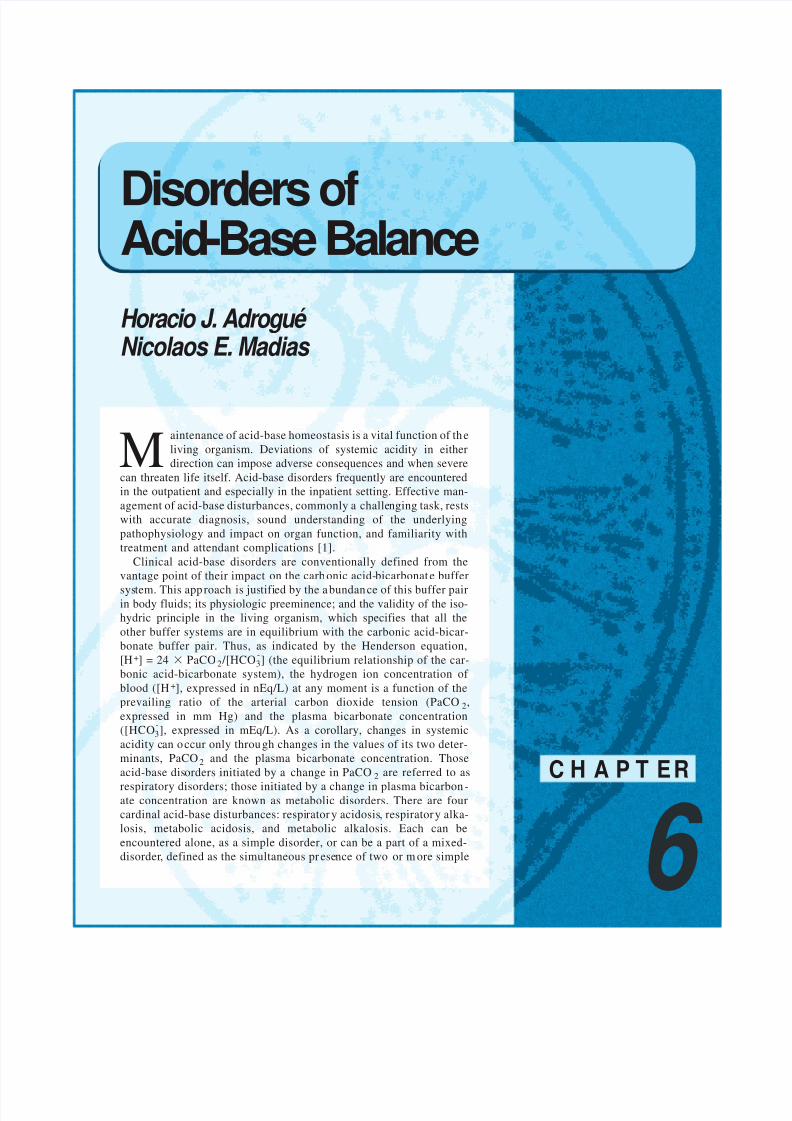
Quantitative aspects of adaptation to respiratory acidosis.Respiratory acidosis, or primary hypercapnia, is the acid-base dis-turbance initiated by an increase in arterial carbon dioxide tension(PaCO2) and entails acidification of bo dy fluids. Hypercapnia elic-its adaptive increments in plasma bicarbonate concentration thatshould be viewed as an integral part of respiratory acidosis. Animmediate increment in plasma bicarbonate occurs in response tohypercapnia. This acute adaptation is complete within 5 to 10 min-utes from the onset of hypercapnia and originates exclusively from
acidic titration of the nonbicarbonate buffers of the body (hemo-globin, intracellular proteins and phosphates, and to a lesser extentplasma proteins). When hypercapnia is sustained, renal adjust-ments markedly amplify the secondary increase in plasma bicar-bonate, further ameliorating the resulting acidemia. This chronicadaptation requires 3 to 5 days for completion and reflects genera-tion of new bicarbonate by the kidneys as a result of upregulationof renal acidification [2]. Average increases in p lasma bicarbon ateand hydrogen ion concentrations per mm Hg increase in PaCO2after completion of the acute or chronic adaptation to respiratoryacidosis are shown. Empiric observations on these adaptationshave been used for construction of 95% confidence intervals forgraded degrees of acute or chronic respiratory a cidosis representedby the areas in color in the acid-base template. The black ellipsenear the center of the figure indicates the normal range for the
acid-base parameters [3]. Note that for the same level of PaCO2,the degree of acidemia is considerably lower in chronic respirator yacidosis than it is in acute respiratory acidosis. Assuming a steadystate is present, values falling within the areas in color are consis-tent with but not diagnostic of the corresponding simple disorders.Acid-base values falling outside the ar eas in color d enote th e pres-ence of a mixed a cid-base disturba nce [4].
8/14/2019 Kidney Diseases - VOLUME ONE - Chapter 06
http://slidepdf.com/reader/full/kidney-diseases-volume-one-chapter-06 3/28
6.3Disorders of Acid-Base Balance
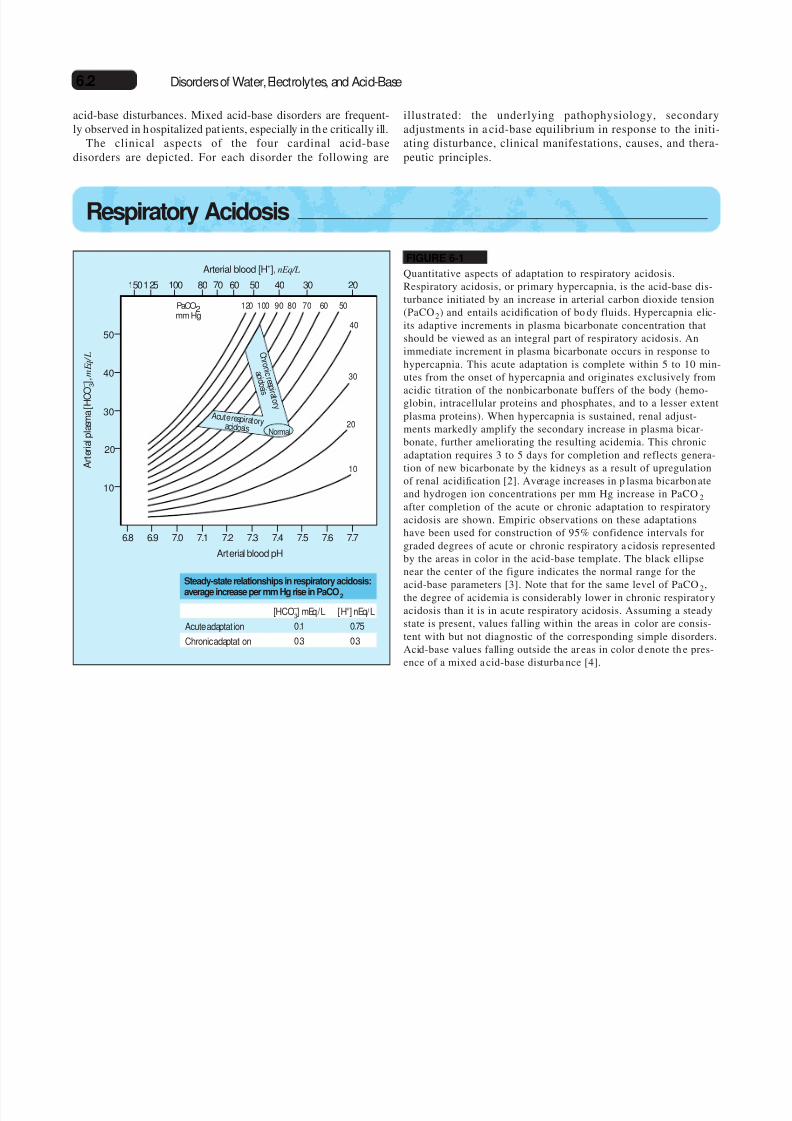
acid production, leading to generation of new bicarbonate ions(HCO
-3) for the body fluids. Conservation of these new bicarbonate
ions is ensured by the gradual augmentation in the rate of renal bicar-bonat e reabsorption, itself a reflection o f the hypercapnia-inducedincrease in the hydrogen ion secretory rate. A new steady stateemerges when two things occur: the augmented filtered load of bicar-
bonate is precisely balanced by the accelerated rate of bicarbonatereabsorption and net acid excretion returns to the level required tooffset daily endogenous acid production. The transient increase innet acid excretion is accompanied by a transient increase in chlorideexcretion. Thus, the resultant ammonium chloride (NH4Cl) loss gen-erates the hypochloremic hyperbicarbonatemia characteristic of chronic respiratory acidosis. Hypochloremia is sustained by thepersistently depressed chloride reabsorption rate. The specific cellularmechanisms mediating the renal acidification response to chronichypercapnia are under active investigation. Available evidence sup-ports a parallel increase in the rates of the luminal sodium ion–hydrogen ion (Na+-H+) exchanger and the basolateral Na+-3HCO
-3
cotransporter in the proximal tubule. However, the nature of theseadaptations remains unknown [5]. The quantity of the H+-adenosinetriphosphatase (ATPase) pumps does not change in either cortex ormedulla. H owever, hypercapnia induces exocytotic insertion of H+-ATPase–containing subap ical vesicles to the luminal membrane of proximal tubule cells as well as type A intercalated cells of the corticaland medullary collecting ducts. New H+-ATPase pumps thereby arerecruited to the luminal membrane for augmented acidification [6,7].Furthermore, chronic hypercapnia increases the steady-state abun-dance of mRNA coding for the basolateral Cl—HCO
-3 exchanger
(band 3 protein) of type A intercalated cells in rat renal cortex andmedulla, likely indicating increased band 3 protein levels and there-fore augmented basolateral anion exchanger activity [8].
Eucapnia Stable Hypercapnia
0 1 2 3 4 5Days
N e t a c i d e x c r e t i o n
C h l o r i d e e x c r e t i o n
B i c a r b o n a t e r e a b s o r p t i o n
FIGURE 6-2
Renal acidification response to chronic hypercapnia. Sustained hyper-capnia entails a persistent increase in the secretory rate of the renaltubule for hydrogen ions (H+) and a persistent decrease in the reab-sorption rate of chloride ions (Cl-). Consequently, net acid excretion(largely in the form of ammonium) tr ansiently exceeds endogenous
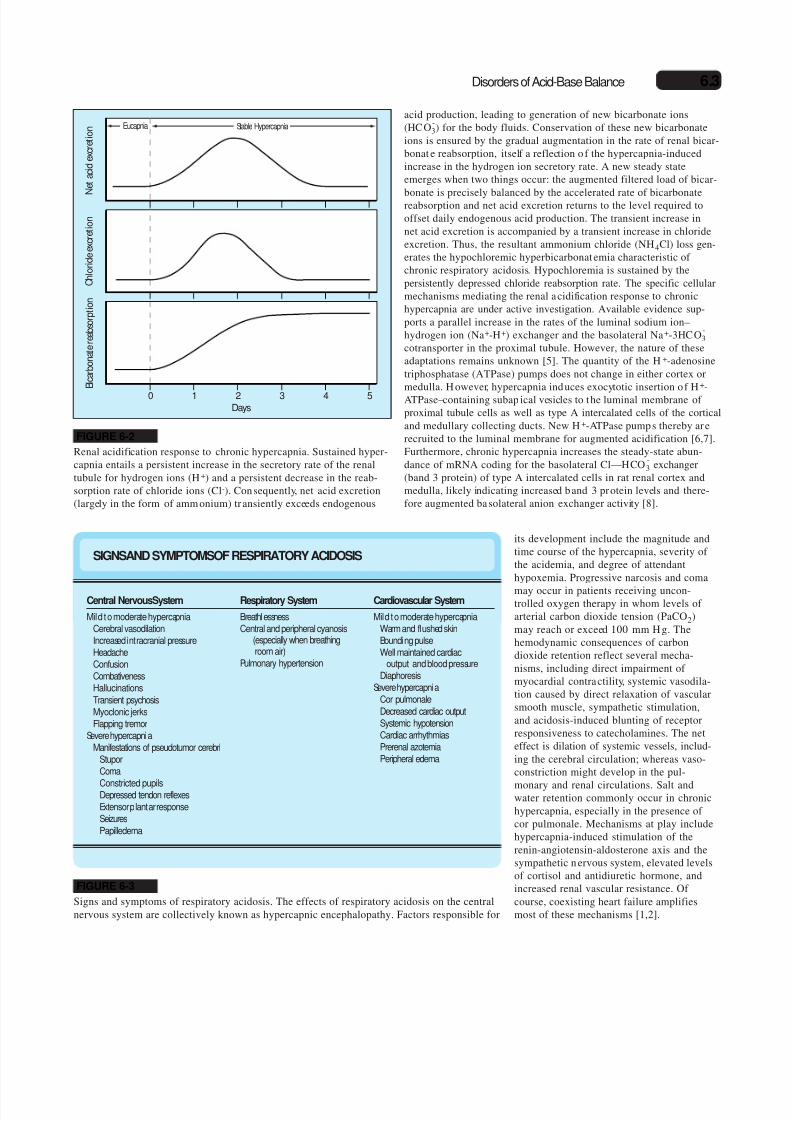
FIGURE 6-3
Signs and symptoms of respiratory acidosis. The effects of respiratory acidosis on the central
nervous system are collectively known as hypercapnic encephalopathy. Factors responsible for
SIGNSAND SYMPTOMSOF RESPIRATORY ACIDOSIS
Central NervousSystem
Mild to moderate hypercapnia
Cerebral vasodilation
Increased intracranial pressure
Headache
Confusion
Combativeness
Hallucinations
Transient psychosis
Myoclonic jerks
Flapping tremor
Severe hypercapnia
Manifestations of pseudotumor cerebri
Stupor
Coma
Constricted pupilsDepressed tendon reflexes
Extensor plantar response
Seizures
Papilledema
Respiratory System
Breathlessness
Central and peripheral cyanosis(especially when breathingroom air)
Pulmonary hypertension
Cardiovascular System
Mild to moderate hypercapnia
Warm and flushed skin
Bounding pulse
Well maintained cardiacoutput and blood pressure
Diaphoresis
Severe hypercapnia
Cor pulmonale
Decreased cardiac output
Systemic hypotension
Cardiac arrhythmias
Prerenal azotemia
Peripheral edema
its development include the magnitude and
time course of the hypercapnia, severity of
the acidemia, and degree of attendant
hypoxemia. Progressive narcosis and coma
may occur in patients receiving uncon-trolled oxygen therapy in whom levels of
arterial carbon dioxide tension (PaCO2)
may reach or exceed 100 mm H g. The
hemodynamic consequences of carbon
dioxide retention reflect several mecha-
nisms, including direct impairment of
myocardial contractility, systemic vasodila-
tion caused by direct relaxation of vascular
smooth muscle, sympathetic stimulation,
and acidosis-induced blunting of receptor
responsiveness to catecholamines. The net
effect is dilation of systemic vessels, includ-
ing the cerebral circulation; whereas vaso-
constriction might develop in the pul-
monary and renal circulations. Salt andwater retention commonly occur in chronic
hypercapnia, especially in the presence of
cor pulmonale. Mechanisms at play include
hypercapnia-induced stimulation of the
renin-angiotensin-aldosterone axis and the
sympathetic n ervous system, elevated levels
of cortisol and antidiuretic hormone, and
increased renal vascular resistance. Of
course, coexisting heart failure amplifies
most of these mechanisms [1,2].

8/14/2019 Kidney Diseases - VOLUME ONE - Chapter 06
http://slidepdf.com/reader/full/kidney-diseases-volume-one-chapter-06 4/28
6.4 Disorders of Water, Electrolytes, and Acid-Base
CerebrumVoluntary control
Brain stemAutomatic control
Spinal cord
Phrenic andintercostal nerves
Musclesof respiration
Controller
Effectors
Pump
Ventilatory requirement(CO
2production, O
2consumption)
Airway resistance
Lung elastic recoil
Chest wall elastic recoil
Diaphragm
Abdominal
cavity
Load
∆V∆V
Pabd
Ppl
FIGURE 6-4
Main components of the ventilatory system. The ventilatory system is responsible for maintaining
the arterial carbon dioxide tension (PaCO2) within normal limits by adjusting minute ventilation
(V•) to match the rate of carbon dioxide production. The main elements of ventilation are the res-
piratory pump, which generates a pressure gradient responsible for air flow, and the loads that
oppose such action. The machinery of the respiratory pump includes the cerebrum, brain stem,
spinal cord, phrenic and intercostal nerves, and the muscles of respiration. Inspiratory muscle con-
traction lowers pleural pressure (Ppl) thereby inflating the lungs (V). The diaphragm, the most
important inspiratory muscle, moves downward as a piston at the floor of the thorax, raising
abdominal pressure (Pabd). The inspiratory decrease in Ppl by the respiratory pump must be suffi-
cient to counterbalance the opposing effect of the combined loads, including the airway flow resis-
tance, and the elastic recoil of the lungs and chest wall. The ventilatory requirement influences the
load by altering the frequency and depth of the ventilatory cycle. The strength of the respiratory
pump is evaluated by the pressure generated (P = Ppl - Pabd).

8/14/2019 Kidney Diseases - VOLUME ONE - Chapter 06
http://slidepdf.com/reader/full/kidney-diseases-volume-one-chapter-06 5/28
6.5Disorders of Acid-Base Balance
DETERMINANTSAND CAUSESOF CARBON DIOXIDE RETENTION
Depressed Central DriveAcute
General anesthesia
Sedative overdose
Head trauma
Cerebrovascular accident
Central sleep apnea
Cerebral edema
Brain tumor
Encephalitis
Brainstem lesion
Chronic
Sedative overdose
Methadone or heroin addiction
Sleep disordered breathing
Brain tumor
Bulbar poliomyelit is
Hypothyroidism
Increased Ventilatory DemandHigh carbohydrate diet
Sorbent-regenerative hemodialysis
Pulmonary thromboembolism
Fat, air pulmonary embolism
Sepsis
Hypovolemia
Augmented Airway Flow Resistance
Acute
Upper airway obstruction
Coma-induced hypopharyngeal obstruction
Aspiration of foreign body or vomitus
Laryngospasm
Angioedema
Obstruct ive sleep apnea
Inadequate laryngeal intubation
Laryngeal obstruction after intubation
Lower airway obstruction
Generalized bronchospasm
Airway edema and secretions
Severe episode of spasmodic asthma
Bronchiolit is of infants and adults
Chronic
Upper airway obstruction
Tonsillar and peritonsillar hypertrophy
Paralysis of vocal cords
Tumor of the cords or larynx
Airway stenosis after prolonged intubation
Thymoma, aortic aneurysm
Lower airway obstructionAirway scarring
Chronic obstructive lung disease eg, bronchitis,bronchiolitis, bronchiectasis, emphysema
Lung StiffnessAcute
Severe bilateral pneumoniaor bronchopneumonia
Acute respiratorydistress syndrome
Severe pulmonary edema
Atelectasis
Chronic
Severe chronic pneumonit is
Diffuse infiltrative diseaseeg,alveolar proteinosis
Interstitial fibrosis
Chest Wall Stiffness
Acute
Rib fractures with flail chestPneumothorax
Hemothorax
Abdominal distention
Ascites
Peritoneal dialysis
Chronic
Kyphoscoliosis, spinal arthritis
Obesity
Fibrothorax
Hydrothorax
Chest wall tumor
Abnormal Neuromuscular TransmissionAcute
High spinal cord injury
Guillain-Barrésyndrome
Status epilepticus
Botulism
Tetanus
Crisis in myasthenia gravis
Hypokalemic myopathy
Familial periodic paralysis
Drugs or toxic agentseg, curare,succinylcholine, aminoglycosides,organophosphorus
Chronic
Poliomyelitis
Mult iple sclerosisMuscular dystrophy
Amyotrophic lateral sclerosis
Diaphragmatic paralysis
Myopathic diseaseeg, polymyosit is
Muscle Dysfunction
Acute
Fatigue
Hyperkalemia
Hypokalemia
Hypoperfusion state
Hypoxemia
Malnutrition
Chronic
Myopathic diseaseeg, polymyosit is
FIGURE 6-5
Determinants and causes of carbon d ioxide retention. W hen the res-piratory pump is unable to balance the opposing load, respiratoryacidosis develops. Decreases in respiratory pump strength, increasesin load, or a combination of the two, can result in carbon dioxideretention. Respiratory pump failure can occur because of depressedcentral dr ive, abno rmal neuromu scular tr ansmission, or respiratory
muscle dysfunction. A higher load can be caused by increased venti-latory demand, augmented airway flow resistance, and stiffness of the lungs or chest wall. In most cases, causes of the various determi-nants of carbon dioxide retention, and thus respiratory acidosis, arecategorized into acute and chron ic subgroups, taking into consider-ation their usual mode of onset and duration [2].
Respiratory Pump Load
8/14/2019 Kidney Diseases - VOLUME ONE - Chapter 06
http://slidepdf.com/reader/full/kidney-diseases-volume-one-chapter-06 6/28
6.6 Disorders of Water, Electrolytes, and Acid-Base
Remove dentures, foreign bodies, or food part icles; Heimlich maneuver(subdiaphragmatic abdominal thrust); tracheal intubation; tracheotomy
• Administer O2via nasal mask or prongs to maintain
PaO2> 60 mm Hg.
• Correct reversible causes of pulmonary dysfunctionwith antibiotics, bronchodilators, andcorticosteroids as needed.
• Monitor patient with arterial blood gases initially atintervals of 20 to 30 minutes and less frequentlythereafter.
• If PaO2does not increase to > 60 mm Hg or PaCO
2rises to > 60 mm Hg proceed to steps described inthe box below.
• Consider intubation and init iation of mechanical
ventilation.• If blood pH is below 7.10 during mechanicalventilation, consider administration of sodiumbicarbonate, to maintain blood pH between 7.10and 7.20, while monitoring arterial blood gases closely.
• Correct reversible causes of pulmonary dysfunctionas in box above.
Airway patencysecured?
Oxygen-rich mixturedelivered
Mental status andblood gases evaluated
Yes
No
Obtunded, blood pH < 7.10,or PaCO
2> 60 mm Hg
Alert, blood pH > 7.10,or PaCO
2<60 mm Hg
A i r w a y
p a t e n
t
FIGURE 6-7
Acute respiratory acidosis management.Securing airway patency and delivering anoxygen-rich mixture are critical initial stepsin management. Subsequent measures mustbe directed at identifying and correcting theunderlying cause, whenever possible [1,9].PaCO 2—arterial carbon dioxide tension.
Spontaneous
breathingMechanical ventilation
Low-Cl –
diet
Cl – - rich diet
Cl – - rich diet
0 2 4 6 8
Days
7.20
7.30
7.40
7.50 30
40
50
7.60
p H
20
30
40
[ H +
] , nE q / L
[ H C O – 3 ] , m E q / L
60
40
60
80
P a C O
2 , m
m H g
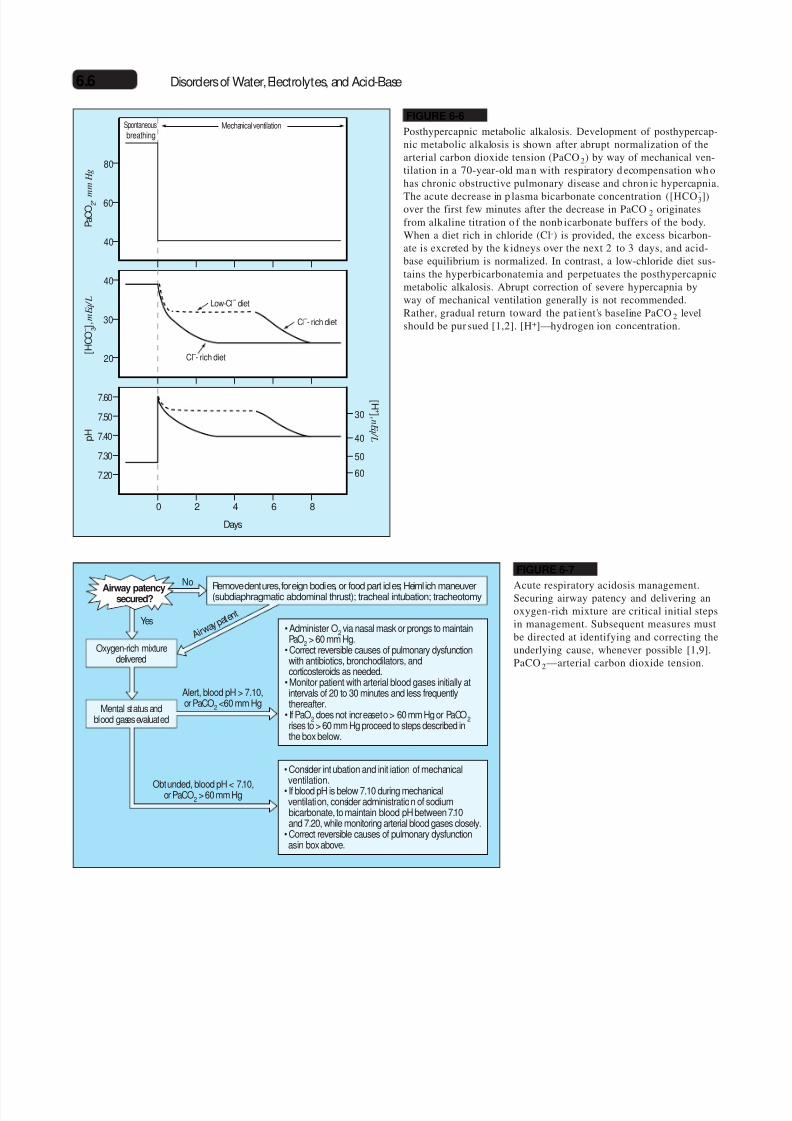
FIGURE 6-6
Posthypercapnic metabolic alkalosis. Development of posthypercap-nic metabolic alkalosis is shown after abrupt normalization of thearterial carbon dioxide tension (PaCO2) by way of mechanical ven-tilation in a 70-year-old ma n with respiratory d ecompensation wh ohas chronic obstructive pulmonary disease and chron ic hypercapnia.
The acute decrease in p lasma bicarbonate concentration ([HCO-3])
over the first few minutes after the decrease in PaCO2 originatesfrom alkaline titration o f the nonb icarbonate buffers of the body.When a diet rich in chloride (Cl-) is provided, the excess bicarbon-ate is excreted by the k idneys over the next 2 to 3 days, and acid-base equilibrium is normalized. In contrast, a low-chloride diet sus-tains the hyperbicarbonatemia and perpetuates the posthypercapnicmetabolic alkalosis. Abrupt correction of severe hypercapnia byway of mechanical ventilation generally is not recommended.Rather, gradual return toward the pat ient’s baseline PaCO2 levelshould be pur sued [1,2]. [H+]—hydrogen ion concentration.
8/14/2019 Kidney Diseases - VOLUME ONE - Chapter 06
http://slidepdf.com/reader/full/kidney-diseases-volume-one-chapter-06 7/28
6.7Disorders of Acid-Base Balance
Observation, rout ine care.
P a O 2 < 5 5 m m
H g
P a O 2
≥ 5
5 m m
H g , p a t i e n t s t a b l e
C O 2 r e t e n t i o n w o r s e n s
H e m o d y n a m i c i n s t a b i l i t y
M e n t a l s t a t u s d e t e r i o r a t e s
•Continue same measures.
•Administer O2 via nasal cannula or Venti mask•Correct reversible causes of pulmonarydysfuntion with antibiotics, bronchodilators,and corticosteroids as needed.
Severehypercapnic
encephalopathyor hemodynamic
instability
Yes
No
No
YesPaO
2> 60 mm Hg
on room air
•Consider use of noninvasive nasal mask ventilation(NMV) or intubation and standard ventilator support.
• Consider intubation and use ofstandard ventilator support.
• Correct reversible causes ofpulmonary dysfunction with
antibiotics, bronchodilators,and corticosteroids as needed.
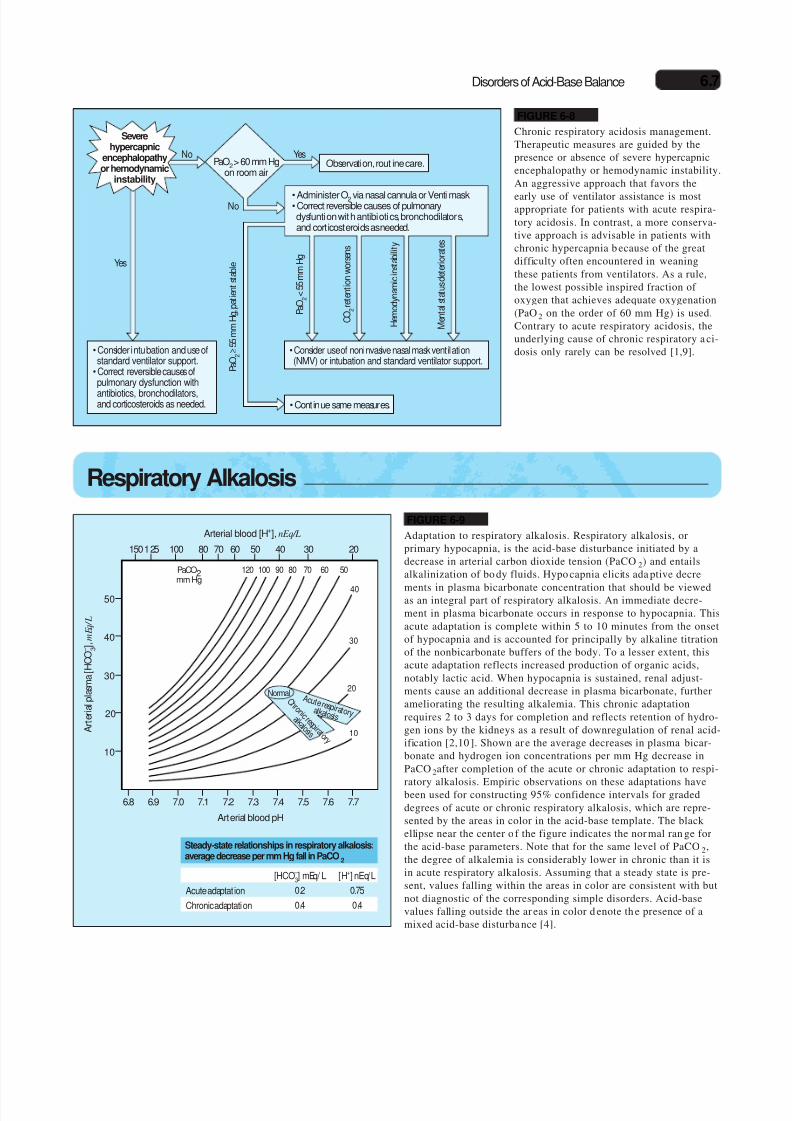
FIGURE 6-8
Chronic respiratory acidosis management.Therapeutic measures are guided by thepresence or absence of severe hypercapnicencephalopathy or hemodynamic instability.An aggressive approach that favors the
early use of ventilator assistance is mostappropriate for patients with acute respira-tory acidosis. In contrast, a more conserva-tive approach is advisable in patients withchronic hypercapnia b ecause of the greatdifficulty often encountered in weaningthese patients from ventilators. As a rule,the lowest possible inspired fraction of oxygen that achieves adequate oxygenation(PaO 2 on the order of 60 mm Hg) is used.Contrary to acute respiratory acidosis, theunderlying cause of chronic respiratory a ci-dosis only rarely can be resolved [1,9].
Respiratory Alkalosis
6.8 6.9
Steady-state relationships in respiratory alkalosis:average decrease per mm Hg fall in PaCO
2
[HCO – 3] mEq/ L [H+] nEq/L
7.0 7.1 7.2 7.3 7.4 7.5 7.6 7.7
150125 100
PaCO2mm Hg
120 100 90 80 70
40
30
20
10
80 70 60 50 40 30 20
Arterial blood pH
Arterial blood [H+],nEq/L
10
20
30
40
A r t e r i a l p l a s m a [ H C O – 3 ] , m E q / L
50
60 50
0.75
0.4
0.2
0.4
Acute adaptation
Chronic adaptation
NormalAc u t e r e s p i r a t o r y a l k a l o s i s
C h r o n i c r e s p i r a t o r y
a l k a l o s i s
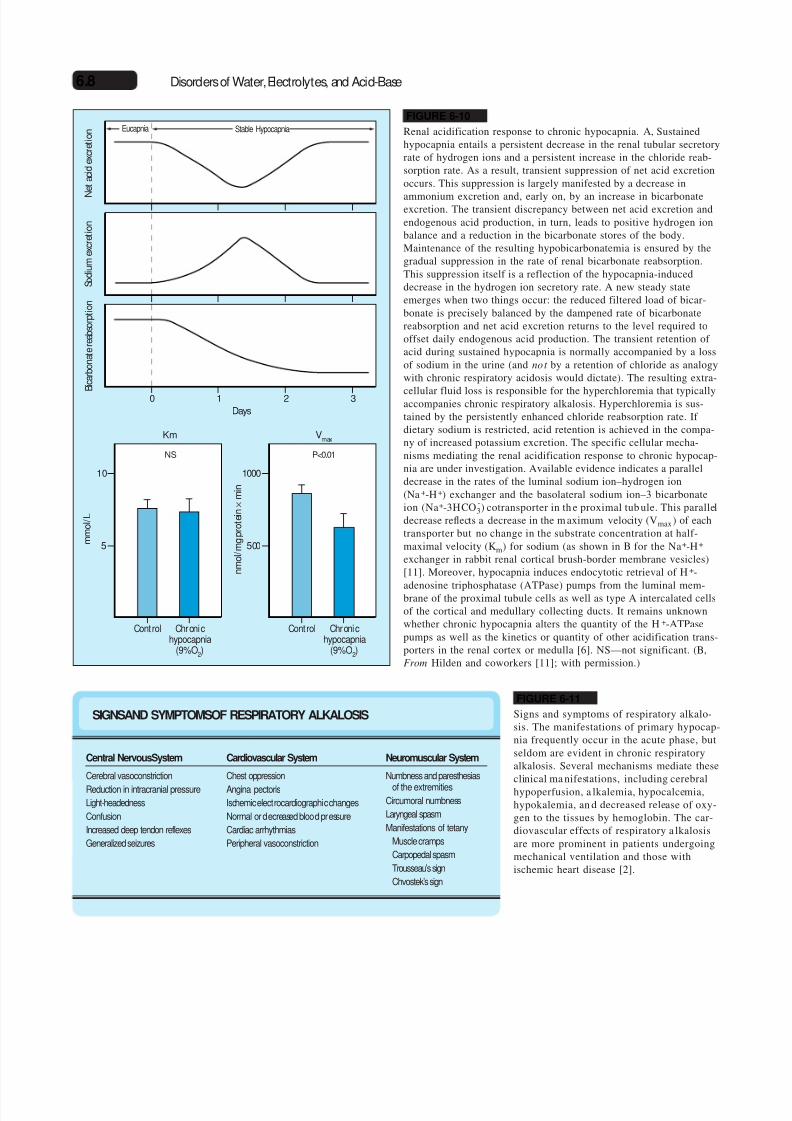
FIGURE 6-9
Adaptation to respiratory alkalosis. Respiratory alkalosis, orprimary hypocapnia, is the acid-base disturbance initiated by adecrease in arterial carbon dioxide tension (PaCO2) and entailsalkalinization of bo dy fluids. Hypo capnia elicits ada ptive decre-
ments in plasma bicarbonate concentration that should be viewedas an integral part of respiratory alkalosis. An immediate decre-ment in plasma bicarbonate occurs in response to hypocapnia. Thisacute adaptation is complete within 5 to 10 minutes from the onsetof hypocapnia and is accounted for principally by alkaline titrationof the nonbicarbonate buffers of the body. To a lesser extent, thisacute adaptation reflects increased production of organic acids,notably lactic acid. When hypocapnia is sustained, renal adjust-ments cause an additional decrease in plasma bicarbonate, furtherameliorating the resulting alkalemia. This chronic adaptationrequires 2 to 3 days for completion and reflects retention of hydro-gen ions by the kidneys as a result of downregulation of renal acid-ification [2,10 ]. Shown ar e the average decreases in plasma bicar-bonate and hydrogen ion concentrations per mm Hg decrease inPaCO 2after completion of the acute or chronic adaptation to respi-
ratory alkalosis. Empiric observations on these adaptations havebeen used for constructing 95% confidence intervals for gradeddegrees of acute or chronic respiratory alkalosis, which are repre-sented by the areas in color in the acid-base template. The blackellipse near the center o f the figure indicates the nor mal ran ge forthe acid-base parameters. Note that for the same level of PaCO2,the degree of alkalemia is considerably lower in chronic than it isin acute respiratory alkalosis. Assuming that a steady state is pre-sent, values falling within the areas in color are consistent with butnot diagnostic of the corresponding simple disorders. Acid-basevalues falling outside the ar eas in color d enote th e presence of amixed acid-base disturba nce [4].
8/14/2019 Kidney Diseases - VOLUME ONE - Chapter 06
http://slidepdf.com/reader/full/kidney-diseases-volume-one-chapter-06 8/28
6.8 Disorders of Water, Electrolytes, and Acid-Base
Eucapnia Stable Hypocapnia
0 1 2 3
Days
N
e t a c i d e x c r e t i o n
S o d i u m e
x c r e t i o n
B i c a r b o n a t e r e a b s o r p t i o n
m m o l / L
10
NS
Km
5
Control Chronichypocapnia
(9%O2)
n m o l / m g p r o t e i n × m
i n
1000
P<0.01
Vmax
500
Control Chronichypocapnia
(9%O2)
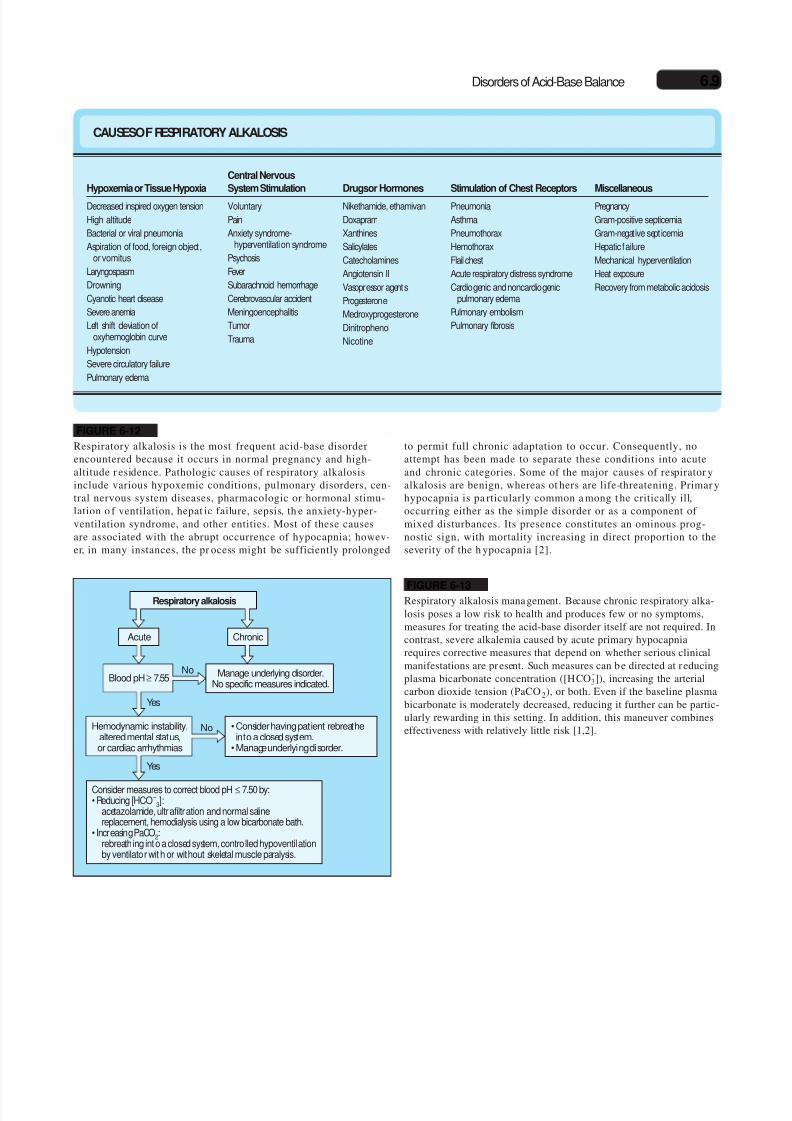
FIGURE 6-10
Renal acidification response to chronic hypocapnia. A, Sustainedhypocapnia entails a persistent decrease in the renal tubular secretoryrate of hydrogen ions and a persistent increase in the chloride reab-sorption rate. As a result, transient suppression of net acid excretionoccurs. This suppression is largely manifested by a decrease in
ammonium excretion and, early on, by an increase in bicarbonateexcretion. The transient discrepancy between net acid excretion andendogenous acid production, in turn, leads to positive hydrogen ionbalance and a reduction in the bicarbonate stores of the body.Maintenance of the resulting hypobicarbonatemia is ensured by thegradual suppression in the rate of renal bicarbonate reabsorption.This suppression itself is a reflection of the hypocapnia-induceddecrease in the hydrogen ion secretory rate. A new steady stateemerges when two things occur: the reduced filtered load of bicar-bonate is precisely balanced by the dampened rate of bicarbonatereabsorption and net acid excretion returns to the level required tooffset daily endogenous acid production. The transient retention of acid during sustained hypocapnia is normally accompanied by a lossof sodium in the urine (and not by a retention of chloride as analogywith chronic respiratory acidosis would dictate). The resulting extra-
cellular fluid loss is responsible for the hyperchloremia that typicallyaccompanies chronic respiratory alkalosis. Hyperchloremia is sus-tained by the persistently enhanced chloride reabsorption rate. If dietary sodium is restricted, acid retention is achieved in the compa-ny of increased potassium excretion. The specific cellular mecha-nisms mediating the renal acidification response to chronic hypocap-nia are under investigation. Available evidence indicates a paralleldecrease in the rates of the luminal sodium ion–hydrogen ion(Na +-H+) exchanger and the basolateral sodium ion–3 bicarbonateion (Na+-3HCO
-3) cotransporter in th e proximal tub ule. This parallel
decrease reflects a decrease in the m aximum velocity (Vmax) of eachtransporter but no change in the substrate concentration at half-maximal velocity (Km) for sodium (as shown in B for the Na+-H+
exchanger in rabbit renal cortical brush-border membrane vesicles)[11]. Moreover, hypocapnia induces endocytotic retrieval of H+-
adenosine triphosphatase (ATPase) pumps from the luminal mem-brane of the proximal tubule cells as well as type A intercalated cellsof the cortical and medullary collecting ducts. It remains unknownwhether chronic hypocapnia alters the quantity of the H+-ATPasepumps as well as the kinetics or quantity of other acidification trans-porters in the renal cortex or medulla [6]. NS—not significant. (B,From Hilden and coworkers [11]; with permission.)
SIGNSAND SYMPTOMSOF RESPIRATORY ALKALOSIS
Central NervousSystem
Cerebral vasoconstriction
Reduction in intracranial pressure
Light-headedness
Confusion
Increased deep tendon reflexes
Generalized seizures
Cardiovascular System
Chest oppression
Angina pectoris
Ischemic electrocardiographic changes
Normal or decreased blood pressure
Cardiac arrhythmias
Peripheral vasoconstriction
Neuromuscular System
Numbness and paresthesias
of the extremitiesCircumoral numbness
Laryngeal spasm
Manifestations of tetany
Muscle cramps
Carpopedal spasm
Trousseau’s sign
Chvostek’s sign
FIGURE 6-11
Signs and symptoms of respiratory alkalo-sis. The manifestations of primary hypocap-nia frequently occur in the acute phase, butseldom are evident in chronic respiratoryalkalosis. Several mechanisms mediate theseclinical ma nifestations, including cerebralhypoperfusion, a lkalemia, hypocalcemia,hypokalemia, an d decreased release of oxy-gen to the tissues by hemoglobin. The car-diovascular effects of respiratory a lkalosisare more prominent in patients undergoingmechanical ventilation and those withischemic heart disease [2].
8/14/2019 Kidney Diseases - VOLUME ONE - Chapter 06
http://slidepdf.com/reader/full/kidney-diseases-volume-one-chapter-06 9/28
6.9Disorders of Acid-Base Balance
CAUSESOF RESPIRATORY ALKALOSIS
Hypoxemia or Tissue Hypoxia
Decreased inspired oxygen tension
High altitude
Bacterial or viral pneumonia
Aspiration of food, foreign object,or vomitus
Laryngospasm
Drowning
Cyanotic heart disease
Severe anemia
Left shift deviation ofoxyhemoglobin curve
Hypotension
Severe circulatory failure
Pulmonary edema
Central Nervous
System Stimulation
Voluntary
Pain
Anxiety syndrome-hyperventilation syndrome
Psychosis
Fever
Subarachnoid hemorrhage
Cerebrovascular accident
Meningoencephalitis
Tumor
Trauma
Drugsor Hormones
Nikethamide, ethamivan
Doxapram
Xanthines
Salicylates
Catecholamines
Angiotensin II
Vasopressor agents
Progesterone
Medroxyprogesterone
Dinitrophenol
Nicotine
Stimulation of Chest Receptors
Pneumonia
Asthma
Pneumothorax
Hemothorax
Flail chest
Acute respiratory distress syndrome
Cardiogenic and noncardiogenicpulmonary edema
Pulmonary embolism
Pulmonary fibrosis
Miscellaneous
Pregnancy
Gram-positive septicemia
Gram-negative septicemia
Hepatic failure
Mechanical hyperventilation
Heat exposure
Recovery from metabolic acidosis
FIGURE 6-12
Respiratory alkalosis is the most frequent acid-base disorderencountered because it occurs in normal pregnancy and high-altitude r esidence. Pathologic causes of respiratory alkalosisinclude various hypoxemic conditions, pulmonary disorders, cen-tral nervous system diseases, pharmacologic or hormonal stimu-lation o f ventilation, hepat ic failure, sepsis, th e anxiety-hyper-ventilation syndrome, and other entities. Most of these causesare associated with the abrupt occurrence of hypocapnia; howev-er, in many instances, the pr ocess might be sufficiently prolonged
to permit full chronic adaptation to occur. Consequently, noattempt has been made to separate these conditions into acuteand chronic categories. Some of the major causes of respirator yalkalosis are benign, whereas ot hers are life-threatening. Primar yhypocapnia is pa rticularly common a mong t he critically ill,occurring either as the simple disorder or as a component of mixed disturbances. Its presence constitutes an ominous prog-nostic sign, with mortality increasing in direct proportion to theseverity of the h ypocapnia [2].
Hemodynamic instability,altered mental status,or cardiac arrhythmias
Consider measures to correct blood pH ≤ 7.50 by:• Reducing [HCO –
3]:acetazolamide, ultrafiltration and normal salinereplacement, hemodialysis using a low bicarbonate bath.
• Increasing PaCO2:
rebreathing into a closed system, controlled hypoventilationby ventilator wit h or without skeletal muscle paralysis.
•Consider having patient rebreatheinto a closed system.
•Manage underlying disorder.
Respiratory alkalosis
Acute
No
No
Yes
Yes
Blood pH≥ 7.55Manage underlying disorder.
No specific measures indicated.
Chronic
FIGURE 6-13Respiratory alkalosis management. Because chronic respiratory alka-losis poses a low risk to health and produces few or no symptoms,measures for treating the acid-base disorder itself are not required. Incontrast, severe alkalemia caused by acute primary hypocapniarequires corrective measures that depend on whether serious clinicalmanifestations are present. Such measures can be directed at r educingplasma bicarbonate concentration ([HCO
-3]), increasing the arterial
carbon dioxide tension (PaCO2), or both. Even if the baseline plasmabicarbonate is moderately decreased, reducing it further can be partic-ularly rewarding in this setting. In addition, this maneuver combineseffectiveness with relatively little risk [1,2].

8/14/2019 Kidney Diseases - VOLUME ONE - Chapter 06
http://slidepdf.com/reader/full/kidney-diseases-volume-one-chapter-06 10/28
6.10 Disorders of Water, Electrolytes, and Acid-Base
Lungs
Normal
Circulatory Failure
Cardiac Arrest
Arterial
compartment
Venous
compartment
Peripheral t issues
7.38462640
pHPCO
2
[HCO3]
PO2
pHPCO
2
[HCO3]
PO2
pHPCO
2
[HCO3]
PO2
7.29602830
7.00751817
pHPCO
2
[HCO3]
PO2
FiO2
pHPCO
2
[HCO3]
PO2
FiO2
pHPCO
2
[HCO3]
PO2
FiO2
7.40402495
0.21
7.42352280
0.35
7.372715
1161.00
LV RV
LV RV
LV RV
–
–
– –
–
–
FIGURE 6-14
Pseudor espiratory alkalosis. This entitydevelops in patients with profound depres-sion of cardiac function and pulmonaryperfusion but relative preservation of alveo-lar ventilation. Patients include those with
advanced circulatory failure and thoseundergoing cardiopulmonary resuscitation.The severely reduced pulmonary blood flowlimits the amount of carbon dioxide deliv-ered to the lungs for excretion, therebyincreasing the venous carbon dioxide ten-sion (PCO2). In contrast, the increased ven-tilation-to-perfusion ratio causes a largerthan normal removal of carbon dioxide perunit of blood traversing the pulmonary cir-culation, thereby giving rise to arterialhypocapnia [12,13]. Note a progressivewidening of t he art eriovenous difference inpH and PCO2 in the two settings of cardiacdysfunction. The hypobicarbonatemia in
the setting of cardiac arrest represents acomplicating element of lactic acidosis.Despite the presence of arterial hypocapnia,pseudorespiratory a lkalosis represents aspecial case of respiratory acidosis, asabsolute carbon dioxide excretion isdecreased and body carbon dioxide balanceis positive. Furthermore, the extreme oxy-gen deprivation p revailing in th e tissuesmight be completely disguised b y the rea-sonably pr eserved art erial oxygen values.Appropriate monitoring of acid-base com-position and oxygenation in patients withadvanced cardiac dysfunction requiresmixed (or central) venous blood sampling
in addition to arterial blood sampling.Management of pseudorespiratory alkalosismust be directed at optimizing systemichemodynamics [1,13].

8/14/2019 Kidney Diseases - VOLUME ONE - Chapter 06
http://slidepdf.com/reader/full/kidney-diseases-volume-one-chapter-06 11/28
6.11Disorders of Acid-Base Balance
Metabolic Acidosis
6.8 6.9 7.0 7.1 7.2 7.3 7.4 7.5 7.6 7.7
150125 100
PaCO2mm Hg
120 100 90 80 70
40
30
20
10
80 70 60 50 40 30 20
Arterial blood pH
Arterial blood [H+],nEq/L
10
20
30
40
A r t e r i a l p l a s m a [ H C O – 3 ] , m E q / L
50
60 50
Normal
M e t a b
o l i c
a c i d o
s i s
FIGURE 6-15
Ninety-five percent confidence intervals for metabolic acidosis.Metabolic acidosis is the acid-base disturbance initiated by adecrease in plasma bicarbonate concentration ([HCO
-3]). The resul-
tant acidemia stimulates alveolar ventilation and leads to the sec-ondar y hypocapnia characteristic of the disorder. Extensive obser-vations in humans encompassing a wide range of stable metabolicacidosis indicate a roughly linear relationship b etween the steady-state decrease in plasma bicarbonate concentration and the associ-ated decrement in arterial carbon dioxide tension (PaCO2). Theslope of the steady state PaCO 2 versus [HCO
-3] relationship has
been estimated as approximately 1.2 mm Hg per mEq/L decreasein plasma bicarbonate concentration. Such empiric observationshave been used for construction of 95% confidence intervals forgraded degrees of metabolic acidosis, represented by t he area incolor in the acid-base template. The black ellipse near the center of
the figure indicates the normal range for the acid-base parameters[3]. Assuming a steady state is present, values falling within thearea in color are consistent with but not diagnostic of simple meta-bolic acidosis. Acid-base values falling outside the area in colordenote th e presence of a mixed acid-base disturban ce [4]. [H+]—hydrogen ion concentration.
SIGNSAND SYMPTOMSOF METABOLIC ACIDOSIS
Respiratory
System
Hyperventilation
Respiratory distressand dyspnea
Decreased strengthof respiratorymuscles andpromotion ofmuscle fatigue
Cardiovascular System
Impairment of cardiaccontractility, arteriolardilation, venoconstriction,and centralization ofblood volume
Reductions in cardiacoutput, arterial bloodpressure, and hepaticand renal blood flow
Sensitization to reentrantarrhythmias and reductionin threshold for ventricularfibrillation
Increased sympatheticdischarge but attenuation of
cardiovascular responsivenessto catecholamines
Metabolism
Increasedmetabolic demands
Insulin resistance
Inhibition ofanaerobic glycolysis
Reduction in adenosinetriphosphate synthesis
Hyperkalemia
Increasedprotein degradation
Central
NervousSystem
Impaired metabolism
Inhibition of cellvolume regulation
Progressive obtundation
Coma
Skeleton
Osteomalacia
Fractures
FIGURE 6-16
Signs and symptoms of metabolic acidosis.Among the various clinical manifestations,particularly pernicious are the effects of severe acidemia (blood pH < 7.20) on the car-
diovascular system. Reductions in cardiacoutput, arterial blood pressure, and hepaticand renal blood flow can occur and life-threatening arrhythmias can develop. Chronicacidemia, as it occurs in untreated renal tubu-lar acidosis and uremic acidosis, can causecalcium dissolution from the bone mineraland consequent skeletal abn ormalities.

8/14/2019 Kidney Diseases - VOLUME ONE - Chapter 06
http://slidepdf.com/reader/full/kidney-diseases-volume-one-chapter-06 12/28
6.12 Disorders of Water, Electrolytes, and Acid-Base
Coricycle
Glucose
H++ Lactate
Lactic acidosis
Anaerobic glycolysis
Gluconeogenesis
Kidney cortexLiverRBCSkinBrainMuscle
Overproduction Underutilization
Lactic acidosis
FIGURE 6-18
Lactate-producing and lactate-consuming tissues under basal condi-tions and pathogenesis of lactic acidosis. Although all tissues pro-
Normal
Na+
140Cl –
106
24
A – 10
Normal anion gap(hyperchloremic)
CausesRenal acidification defects
Proximal renal tubular acidosisClassic distal tubular acidosisHyperkalemic distal tubular acidosisEarly renal failure
Gastrointestinal loss of bicarbonateDiarrheaSmall bowel lossesUreteral diversionsAnion exchange resins
Ingestion of CaCl2Acid infusionHClArginine HClLysine HCl
CausesEndogenous acid load
KetoacidosisDiabetes mellitusAlcoholismStarvation
UremiaLactic acidosis
Exogenous toxinsOsmolar gap present
Methanol
Ethylene glycolOsmolar gap absentSalicylatesParaldehyde
Na+
140Cl –
126
HCO3 – 4HCO
3 –
A – 10
Metabolic acidosisHigh anion gap
(normochloremic)
Na+
140Cl –
106
HCO3 – 4
A – 30
FIGURE 6-17
Causes of metabolic acidosis tabulated according to the prevailingpattern of plasma electrolyte composition. Assessment of the plas-ma unmeasured anion concentration (anion gap) is a very usefulfirst step in ap proaching t he differential diagnosis of unexplainedmetabolic acidosis. The plasma anion gap is calculated as the dif-
ference between the sodium concentration and the sum of chlorideand bicarbonate concentrations. Under normal circumstances, theplasma anion gap is primarily composed of the net negativecharges of plasma proteins, predominantly albumin, with a smallercontribution from many other organic and inorganic anions. Thenormal value of the plasma anion gap is 12 ± 4 (mean ± 2 SD)mEq/L, where SD is the standard deviation. However, recent intro-duction of ion-specific electrodes ha s shifted the no rmal a nion gapto the range of about 6 ± 3 mEq/L. In one pattern of metabolic aci-dosis, the decrease in bicarbonate concentration is offset by anincrease in the concentration of chloride, with the plasma aniongap remaining normal. In the other pattern, the decrease in bicar-bonate is balanced by an increase in the concentration of unmea-sured anions (ie, anions not measured routinely), with the plasmachloride concentration remaining normal.
duce lactate during the course of glycolysis, those listed contributesubstantial quantities of lactate to the extracellular fluid under nor-mal aerobic conditions. In turn, lactate is extracted by the liver andto a lesser degree by the renal cortex and primarily is reconverted toglucose by way of gluconeogenesis (a smaller portion of lactate isoxidized to carbon dioxide and water). This cyclical relationship
between glucose and lactate is known as the Cori cycle. The basalturnover rate of lactate in humans is enormous, on the order of 15to 25 mEq/kg/d. Precise equivalence between lactate production andits use ensures the stability of plasma lactate concentration, normallyranging from 1 to 2 mEq/L. Hydrogen ions (H+) released during lac-tate generation are quantitatively consumed during the use of lactatesuch that acid-base balance remains undisturbed. Accumulation of lactate in the circulation, and consequent lactic acidosis, is generatedwhenever the rate of production of lactate is higher than the rate of utilization. The pathogenesis of this imbalance reflects overproduc-tion of lactate, underutilization, or both. Most cases of persistent lac-tic acidosis actually involve both overproduction and underutiliza-tion of lactate. During hypoxia, almost all tissues can release lactateinto the circulation; indeed, even the liver can be converted from thepremier consumer of lactate to a net producer [1,14].
8/14/2019 Kidney Diseases - VOLUME ONE - Chapter 06
http://slidepdf.com/reader/full/kidney-diseases-volume-one-chapter-06 13/28
6.13Disorders of Acid-Base Balance
Glucose
Cytosol
Mitochondria
Acetyl-CoA
OxaloacetateNADH
P D H
Mitochondrial membrane
Pyruvate
Gluconeogenesis
PFK
LDH Lactate
NAD+
NADH
+
+
–
– –
low ATPADP
low ATPADP
NADH
TCAcycle
highNAD+
NAD+ P CNADHhighNAD+
G l y c o l y s i s
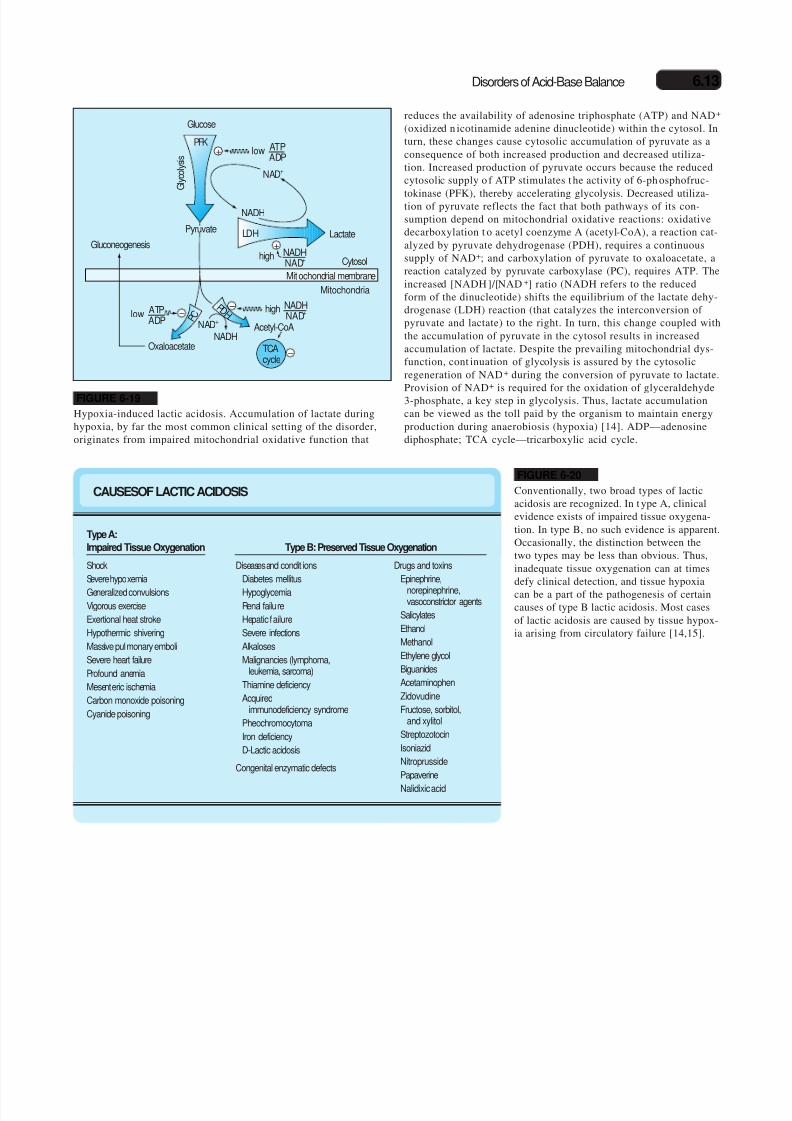
FIGURE 6-19
Hypoxia-induced lactic acidosis. Accumulation of lactate duringhypoxia, by far the most common clinical setting of the disorder,originates from impaired mitochondrial oxidative function that
reduces the availability of adenosine triphosphate (ATP) and NAD+
(oxidized n icotinamide adenine dinucleotide) within th e cytosol. Inturn, these changes cause cytosolic accumulation of pyruvate as aconsequence of both increased production and decreased utiliza-tion. Increased production of pyruvate occurs because the reducedcytosolic supply o f ATP stimulates t he activity of 6-ph osphofruc-
tokinase (PFK), thereby accelerating glycolysis. Decreased utiliza-tion of pyruvate reflects the fact that both pathways of its con-sumption depend on mitochondrial oxidative reactions: oxidativedecarboxylation t o acetyl coenzyme A (acetyl-CoA), a reaction cat-alyzed by pyruvate dehydrogenase (PDH), requires a continuoussupply of NAD+; and carboxylation of pyruvate to oxaloacetate, areaction catalyzed by pyruvate carboxylase (PC), requires ATP. Theincreased [NADH ]/[NAD+] ratio (NADH refers to the reducedform of the dinucleotide) shifts the equilibrium of the lactate dehy-drogenase (LDH) reaction (that catalyzes the interconversion of pyruvate and lactate) to the right. In turn, this change coupled withthe accumulation of pyruvate in the cytosol results in increasedaccumulation of lactate. Despite the prevailing mitochondrial dys-function, cont inuation of glycolysis is assured by t he cytosolicregeneration of NAD+ during the conversion of pyruvate to lactate.
Provision of NAD+
is required for the oxidation of glyceraldehyde3-phosphate, a key step in glycolysis. Thus, lactate accumulationcan be viewed as the toll paid by the organism to maintain energyproduction during anaerobiosis (hypoxia) [14]. ADP—adenosinediphosphate; TCA cycle—tricarboxylic acid cycle.
CAUSESOF LACTIC ACIDOSIS
Type A:
Impaired Tissue Oxygenation
Shock
Severe hypoxemia
Generalized convulsions
Vigorous exercise
Exertional heat stroke
Hypothermic shivering
Massive pulmonary emboli
Severe heart failure
Profound anemia
Mesenteric ischemia
Carbon monoxide poisoning
Cyanide poisoning
Diseases and condit ions
Diabetes mellitus
Hypoglycemia
Renal failure
Hepatic failure
Severe infections
Alkaloses
Malignancies (lymphoma,leukemia, sarcoma)
Thiamine deficiency
Acquiredimmunodeficiency syndrome
Pheochromocytoma
Iron deficiency
D-Lactic acidosis
Congenital enzymatic defects
Drugs and toxins
Epinephrine,
norepinephrine,vasoconstrictor agents
Salicylates
Ethanol
Methanol
Ethylene glycol
Biguanides
Acetaminophen
Zidovudine
Fructose, sorbitol,and xylitol
Streptozotocin
Isoniazid
Nitroprusside
Papaverine
Nalidixic acid
Type B: Preserved Tissue Oxygenation
FIGURE 6-20
Conventionally, two broad types of lacticacidosis are recognized. In t ype A, clinicalevidence exists of impaired tissue oxygena-tion. In type B, no such evidence is apparent.Occasionally, the distinction between thetwo types may be less than obvious. Thus,inadequate tissue oxygenation can at timesdefy clinical detection, and tissue hypoxiacan be a part of the pathogenesis of certaincauses of type B lactic acidosis. Most casesof lactic acidosis are caused by tissue hypox-ia arising from circulatory failure [14,15].
8/14/2019 Kidney Diseases - VOLUME ONE - Chapter 06
http://slidepdf.com/reader/full/kidney-diseases-volume-one-chapter-06 14/28
6.14 Disorders of Water, Electrolytes, and Acid-Base
Diabetic ketoacidosis and nonketotic hyperglycemia
Insulindeficiency
Increased hepaticglucose production
Increased hepatic
ketogenesis
Increased lipolysisin adipocytes
Ketonemia(metabolic acidosis)
Hyperglycemia(hyperosmolality)
Decreased glucoseutilization in skeletal
muscle
Counterregulation
Decreased ketone uptake
Decreased glucose excretion
Decreased glucose uptake
Cortisol
Epinephrine
Glucagon
Growth hormoneNorepinephrine
Increased ketogenesis
A
B
Increased gluconeogenesis
Increased glycogenolysisDecreased glucose uptake
Increased prot ein breakdown
Decreased amino acid uptake
TriglyceridesIncreasedlipolysis
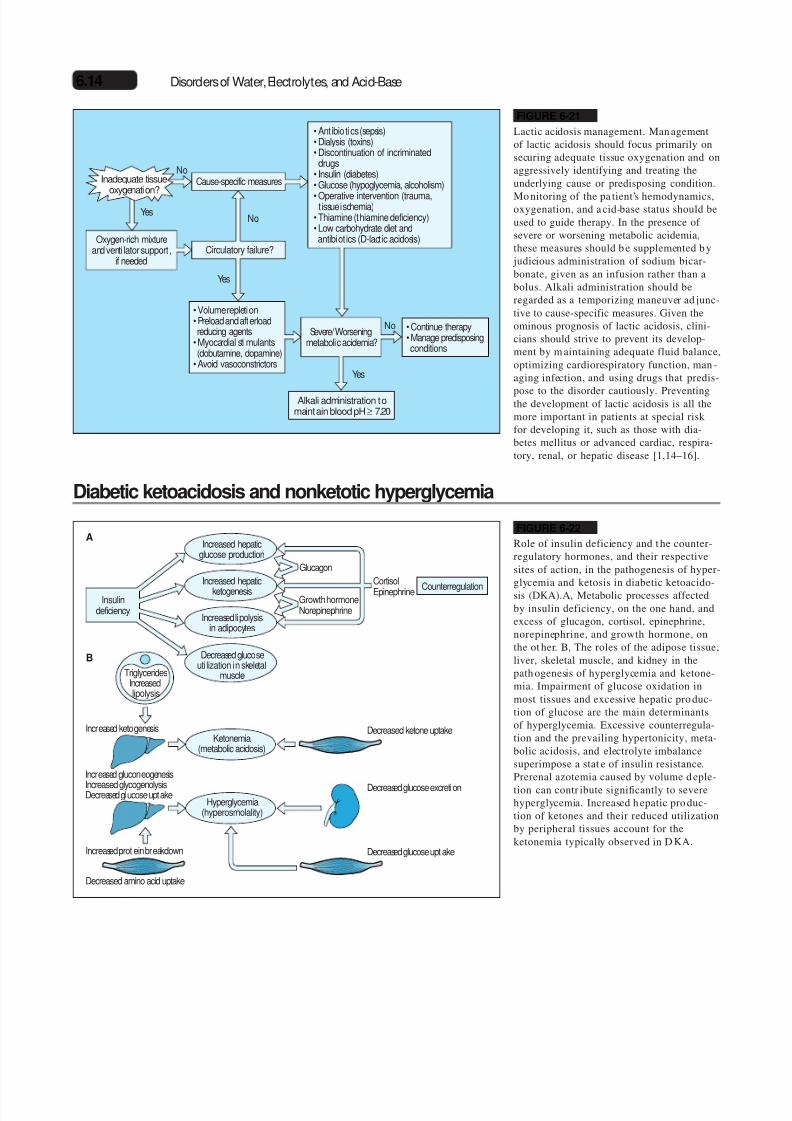
FIGURE 6-22
Role of insulin deficiency and t he counter-regulatory hormones, and their respectivesites of action, in the pathogenesis of hyper-glycemia and ketosis in diabetic ketoacido-sis (DKA).A, Metabolic processes affectedby insulin deficiency, on the one hand, andexcess of glucagon, cortisol, epinephrine,norepinephrine, and growth hormone, onthe ot her. B, The roles of the adipose tissue,liver, skeletal muscle, and kidney in thepath ogenesis of hyperglycemia and ketone-mia. Impairment of glucose oxidation inmost tissues and excessive hepatic pro duc-tion of glucose are the main determinantsof hyperglycemia. Excessive counterregula-tion and the prevailing hypertonicity, meta-bolic acidosis, and electrolyte imbalancesuperimpose a stat e of insulin resistance.Prerenal azotemia caused by volume d eple-
tion can contr ibute significantly to severehyperglycemia. Increased h epatic pro duc-tion of ketones and their reduced utilizationby peripheral tissues account for theketonemia typically observed in D KA.
Alkali administration tomaintain blood pH≥ 7.20
•Volume repletion•Preload and afterloadreducing agents
•Myocardial stimulants (dobutamine, dopamine)•Avoid vasoconstrictors
•Continue therapy•Manage predisposingconditions
Inadequate tissueoxygenation?
Oxygen-rich mixtureand venti lator support,
if needed
Severe/Worseningmetabolic acidemia?
Cause-specific measures
Circulatory failure?
Yes
Yes
Yes
No
No
No
• Antibiotics (sepsis)• Dialysis (toxins)• Discontinuation of incriminateddrugs
• Insulin (diabetes)• Glucose (hypoglycemia, alcoholism)
• Operative intervention (trauma,tissue ischemia)
• Thiamine (thiamine deficiency)• Low carbohydrate diet andantibiotics (D-lactic acidosis)
FIGURE 6-21
Lactic acidosis management. Man agementof lactic acidosis should focus primarily onsecuring adequate tissue oxygenation and onaggressively identifying and treating theunderlying cause or predisposing condition.
Mo nitoring of the pa tient’s hemodynamics,oxygenation, and a cid-base status should beused to guide therapy. In the presence of severe or worsening metabolic acidemia,these measures should b e supplemented b y judicious administration of sodium bicar-bonate, given as an infusion rather than abolus. Alkali administration should beregarded as a temporizing maneuver ad junc-tive to cause-specific measures. Given theominous prognosis of lactic acidosis, clini-cians should strive to prevent its develop-ment by m aintaining adequate fluid balance,optimizing cardiorespiratory function, man -aging infection, and using drugs that predis-
pose to the disorder cautiously. Preventingthe development of lactic acidosis is all themore important in patients at special riskfor developing it, such as those with dia-betes mellitus or advanced cardiac, respira-tory, renal, or hepatic disease [1,14–16].

8/14/2019 Kidney Diseases - VOLUME ONE - Chapter 06
http://slidepdf.com/reader/full/kidney-diseases-volume-one-chapter-06 15/28
6.15Disorders of Acid-Base Balance
Pure DKA
profound ketosis
Mixed formsDKA + NKH
Pure NKH
profound hyperglycemia
Insulin deficiency/resistance
Excessive counterregulation
Incidence
Mortality
Onset
Age of patient
Type I diabetes
Type II diabetes
First indication of diabetes
Volume depletion
Renal failure (most com-
monly of prerenal nature)
Severe neurologic
abnormalities
Subsequent therapy with
insulin
Glucose
Ketone bodies
Effective osmolality
pH
[HCO – 3]
[Na+]
[K+]
Feature
Severe
Mild
Mild
Severe
5 – 10 times higher
5 – 10%
Rapid (<2 days)
Usually < 40 years
Common
Rare
Often
Mild/moderate
Mild, inconstant
Rare
Always
< 800 mg/dL
≥ 2 + in 1:1 dilution
< 340 mOsm/kg
Decreased
Decreased
Normal or low
Variable
Pure DKA
5 – 10 times lower
10 – 60%
Slow (> 5 days)
Usually > 40 years
Rare
Common
Often
Severe
Always present
Frequent
(coma in 25 – 50%)
Not always
> 800 mg/dL
< 2+ in 1:1 dilut ion
> 340 mOsm/kg
Normal
Normal
Normal or high
Variable
Pure NKHMixed forms
FIGURE 6-23
Clinical features of d iabetic ketoacidosis (DKA) and n onketot ichyperglycemia (NKH). DKA and NKH are the most importantacute metabolic complications of patients with uncontrolled dia-betes mellitus. Th ese disorders share t he same overall path ogene-sis that includes insulin deficiency and resistance and excessive
counterregulation; how ever, the importa nce of each of theseendocrine abno rmalities differs significantly in DKA and NKH .As depicted here, pure NKH is characterized by profound hyper-glycemia, the result of mild insulin deficiency and severe coun-terregulation (eg, high glucagon levels). In contr ast, pu re DKA ischaracterized by p rofound ketosis that largely is due to severeinsulin deficiency, with counterregulation being generally of less-er importance. These pure forms define a continuum thatincludes mixed forms incorpor ating clinical and biochemical fea-tures of both DKA and NKH. Dyspnea and Kussmaul’s respira-tion r esult from the m etabolic acidosis of DKA, which is general-ly absent in NKH. Sodium and water deficits and secondaryrenal dysfunction are more severe in NKH than in DKA. Thesedeficits also play a pathogenetic role in the profound hypertonic-ity characteristic of NKH . Th e severe hyperglycemia o f NKH ,
often coupled w ith hyperna tremia, increases serum osmolality,thereby causing the characteristic functional ab norm alities of thecentral nervous system. Depression of t he sensorium, somno -lence, obtundation, and coma, are prominent manifestations of NKH. The degree of obtundation correlates with the severity of serum hyperton icity [17].
MANAGEMENT OF DIABETIC KETOACIDOSISAND NONKETOTIC HYPERGLYCEMIA
Insulin
1. Give initial IV bolus of 0.2 U/kg actual body weight.
2. Add 100 U of regular insulin to 1 L of normal saline (0.1U/mL), and follow with continuous IV drip of 0.1 U/kgactual body weight per h until correction of ketosis.
3. Give double rate of infusion if the blood glucose leveldoes not decrease in a 2-h interval (expected decreaseis 40 – 80 mg/dL/h or 10%of the init ial value.)
4. Give SQ dose (10 – 30 U) of regular insulin when ketosisis corrected and the blood glucose level decreases to300 mg/dL, and continue with SQ insulin injection
every 4 h on a sliding scale (ie,5 U if below 150, 10 U if150 – 200, 15 U if 200 – 250, and 20 U if 250 – 300 mg/dL).
Fluid Administration
Shock absent: Normal saline (0.9%NaCl)at 7 mL/kg/h for 4 h, and half thisrate thereafter
Shock present: Normal saline and plasmaexpanders (ie,albumin, low molecularweight dextran) at maximal possible rate
Start a glucose-containing solut ion(eg, 5%dextrose in water) when bloodglucose level decreases to 250 mg/dL.
Potassium repletion
Potassium chloride should beadded to the third liter of IVinfusion and subsequentlyif urinary output is at least30 – 60 mL/h and plasma [K+]< 5 mEq/L.
Add K+ to the initial 2 L of IVfluids if initial plasma [K+]< 4 mEq/L and adequatediuresis is secured.
Alkali
Half-normal saline (0.45%NaCl) plus1 – 2 ampules (44-88 mEq) NaHCO3per liter when blood pH < 7.0 ortotal CO2 < 5 mmol/ L; in hyper-chloremic acidosis, add NaHCO3when pH < 7.20; discontinueNaHCO3 in IV infusion when totalCO2>8 – 10 mmol/L.
CO2 —carbon dioxide; IV —intravenous; K+ —potassium ion; NaCl —sodium chloride; NaHCO3 —sodium bicarbonate; SQ —subcutaneous.
FIGURE 6-24
Diabetic ketoacidosis (DKA) and nonketot ic hyperglycemia (NKH)management. Administration of insulin is the cornerstone of manage-ment for both DKA and NKH. Replacement of the prevailing water,sodium, and potassium deficits is also required. Alkali are adminis-tered only under certain circumstances in DKA and virtually never in
NKH, in which ketoacidosis is generally absent. Because the fluiddeficit is generally severe in patients with NKH, many of whom havepreexisting heart disease and are relatively old, safe fluid replacementmay require monitoring of central venous pressure, pulmonary capil-lary wedge pressure, or both [1,17,18].
8/14/2019 Kidney Diseases - VOLUME ONE - Chapter 06
http://slidepdf.com/reader/full/kidney-diseases-volume-one-chapter-06 16/28
6.16 Disorders of Water, Electrolytes, and Acid-Base
FEATURESOF THE RENAL TUBULAR ACIDOSIS(RTA) SYNDROMES
Feature
Plasma bicarbonateion concentration
Plasma chlorideion concentration
Plasma potassiumion concentration
Plasma anion gap
Glomerular filtration rate
Urine pH during acidosis
Urine pH after acid loading
U-B PCO2 in alkaline urine
Fractional excretion of
HCO-3 at normal [HCO-3]p
TmHCO-3
Nephrolithiasis
Nephrocalcinosis
Osteomalacia
Fanconi’s syndrome*
Alkali therapy
Proximal RTA
14 – 18 mEq/L
Increased
Mildly decreased
Normal
Normal orslightly decreased
≤5.5
≤5.5
Normal
>15%
Decreased
Absent
Absent
Present
Usually present
High dose
Classic Distal RTA
Variable, may be< 10 mEq/L
Increased
Mildly toseverely decreased
Normal
Normal orslightly decreased
>6.0
>6.0
Decreased
<5%
Normal
Present
Present
Present
Absent
Low dose
Hyperkalemic Distal RTA
15 – 20 mEq/L
Increased
Mildly to severely increased
Normal
Normal tomoderately decreased
≤5.5
≤5.5
Decreased
<5%
Normal
Absent
Absent
Absent
Absent
Low dose
TmHCO-3 —maximum reabsorption of bicarbonate; U-B PCO2 —difference between partial pressure of carbon
dioxide values in urine and arterial blood.
*This syndrome signifies generalized proximal tubule dysfunction and is characterized by impaired reabsorption ofglucose, amino acids, phosphate, and urate.
FIGURE 6-25
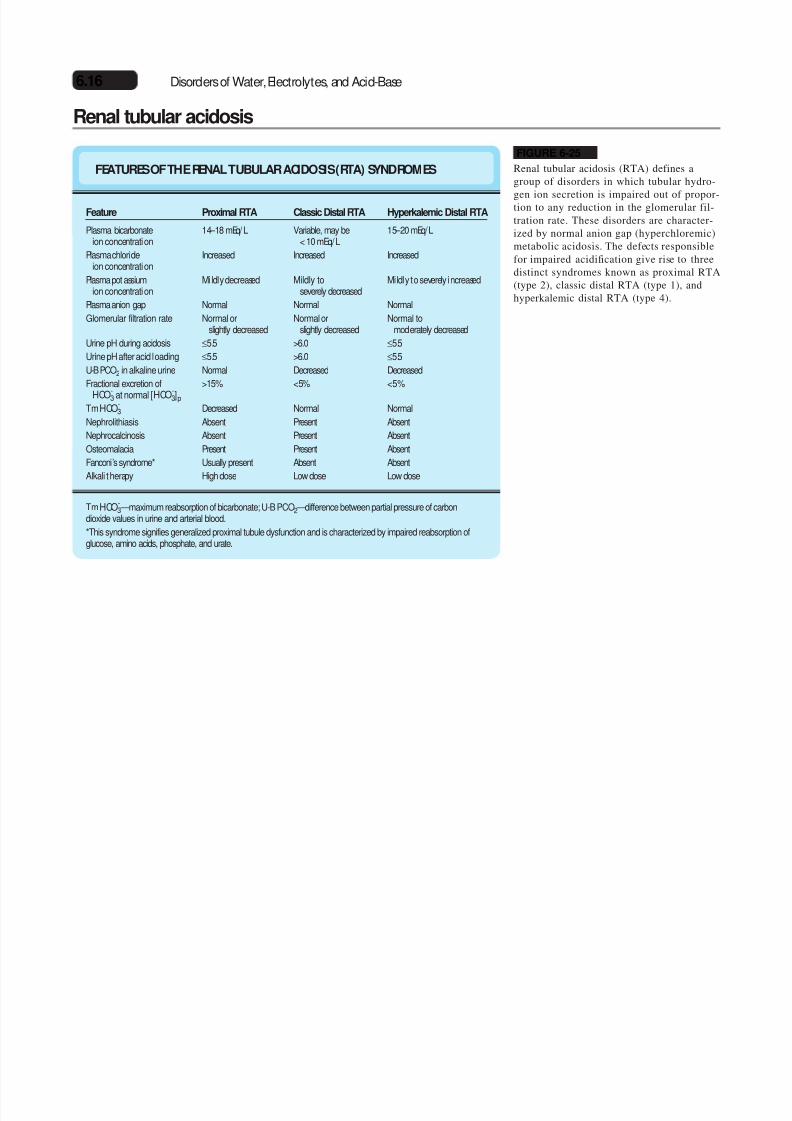
Renal tubular acidosis (RTA) defines agroup of disorders in which tubular hydro-
gen ion secretion is impaired out of propor-tion to any reduction in the glomerular fil-tration rate. These disorders are character-ized by normal anion gap (hyperchloremic)metabolic acidosis. The defects responsiblefor impaired acidification give rise to threedistinct syndromes known as proximal RTA(type 2), classic distal RTA (type 1), andhyperkalemic distal RTA (type 4).
Renal tubular acidosis

8/14/2019 Kidney Diseases - VOLUME ONE - Chapter 06
http://slidepdf.com/reader/full/kidney-diseases-volume-one-chapter-06 17/28
6.17Disorders of Acid-Base Balance
B. CAUSESOF PROXIMAL RENALTUBULAR ACIDOSIS
Selective defect (isolated bicarbonate wasting)
Primary (no obvious associated disease)
Genetically transmitted
Transient (infants)
Due to altered carbonic anhydrase activity
Acetazolamide
Sulfanilamide
Mafenide acetate
Genetically transmitted
Idiopathic
Osteopetrosis with carbonicanhydrase II deficiency
York-Yendt syndrome
Generalized defect (associated with multipledysfunctions of the proximal tubule)
Primary (no obvious associated disease)Sporadic
Genetically transmitted
Genetically t ransmit ted systemic disease
Tyrosinemia
Wilson’s disease
Lowe syndrome
Hereditary f ructose intolerance (duringadministration of f ructose)
Cystinosis
Pyruvate carboxylate deficiency
Metachromatic leukodystrophy
Methylmalonic acidemia
Conditions associated with chronic hypocalcemiaand secondary hyperparathyroidism
Vitamin D deficiency or resistance
Vitamin D dependence
Dysproteinemic states
Multiple myeloma
Monoclonal gammopathy
Drug- or toxin-induced
Outdated tetracycline
3-Methylchromone
Streptozotocin
Lead
Mercury
Arginine
Valproic acid
Gentamicin
Ifosfamide
Tubulointerstitial diseases
Renal transplantation
Sjögren’s syndrome
Medullary cystic disease
Other renal diseases
Nephrotic syndrome
Amyloidosis
Miscellaneous
Paroxysmalnocturnal hemoglobinuria
Hyperparathyroidism
Proximal tubule cellLumen Blood
3Na+Na+ Na+
Na+
HCO3
– + H+
H2O
CO2 + OH – HCO
3 –
H2CO
3
CO2
H+
2K+
GlucoseAmino acidsPhosphate
A
Indicates possible cellular mechanisms responsiblefor Type 2 proximal RTA
1Na+
3HCO3
–
CA
CA
FIGURE 6-26
A and B, Potential defects and causes of proximal renal tubularacidosis (RTA) (type 2). Excluding the case of carbonic anhydraseinhibitors, the nature of the acidification defect responsible forbicarbonate (HC O3) wastage remains unknown. It might representdefects in the luminal sodium ion– hydrogen ion (Na+-H+)exchanger, basolateral Na+-3HCO
-3 cotransporter, or carbonic
anhydrase activity. Most patients with proximal RTA have addi-tional d efects in pr oximal t ubule function (Fanconi’s syndrome);this generalized pr oximal t ubule dysfunction m ight reflect a d efectin the basolateral Na+-K+ adenosine triphosphatase. K+—potassiumion; CA—carbonic anhydrase. Causes of proxima l renal tubu laracidosis (RTA) (type 2). An idiopat hic form an d cystinosis are themost common causes of proximal RTA in children. In adults, mul-tiple myeloma and carbonic anhydrase inhibitors (eg, acetazo-lamide) are the major causes. Ifosfamide is an increasingly
common cause of the disorder in both age groups.

8/14/2019 Kidney Diseases - VOLUME ONE - Chapter 06
http://slidepdf.com/reader/full/kidney-diseases-volume-one-chapter-06 18/28
6.18 Disorders of Water, Electrolytes, and Acid-Base
B. CAUSESOF CLASSIC DISTAL RENALTUBULAR ACIDOSIS
Primary (no obvious associated disease)
Sporadic
Genetically transmitted
Autoimmune disorders
Hypergammaglobulinemia
Hyperglobulinemic purpura
Cryoglobulinemia
Familial
Sjögren’s syndrome
Thyroiditis
Pulmonary fibrosis
Chronic active hepatit is
Primary bil iary cirrhosis
Systemic lupus erythematosus
Vasculitis
Genetically t ransmit ted systemic disease
Ehlers-Danlos syndrome
Hereditary elliptocytosis
Sickle cell anemia
Marfan syndrome
Carbonic anhydrase I deficiencyor alteration
Osteopetrosis with carbonicanhydrase II deficiency
Medullary cystic disease
Neuroaxonal dystrophy
Disorders associated
with nephrocalcinosis
Primary or familial hyperparathyroidism
Vitamin D intoxication
Milk-alkali syndrome
Hyperthyroidism
Idiopathic hypercalciuria
Genetically transmitted
Sporadic
Hereditary fructose intolerance(after chronic fructose ingestion)
Medullary sponge kidney
Fabry’s disease
Wilson’s disease
Drug- or toxin-induced
Amphotericin BToluene
Analgesics
Lithium
Cyclamate
Balkan nephropathy
Tubulointerstitial diseases
Chronic pyelonephritis
Obstructive uropathy
Renal transplantation
Leprosy
Hyperoxaluria
FIGURE 6-27
A and B, Potential defects and causes of classic distal renal tubularacidosis (RTA) (type 1). Potential cellular defects underlying classicdistal RTA include a faulty luminal hydrogen ion–adenosine triphos-phatase (H+ pump failure or secretory defect), an abnormality in thebasolateral bicarbonate ion–chloride ion exchanger, inadequacy of carbonic anhydrase activity, or an increase in the luminal membranepermeability for hydrogen ions (backleak of protons or permeabilitydefect). Most of the causes of classic distal RTA likely reflect a secre-tory defect, whereas amphotericin B is the only established cause of apermeability defect. The hereditary form is the most common causeof this disorder in children. Major causes in adults include autoim-mune disorders (eg, Sjögren’s syndrome) and hypercalciuria [19].CA—carbonic anhydrase.
α Intercalated cell (CCT & MCT)Lumen Blood
HCO3
– CO2
Cl –
Cl –
H+
Cl –
OH –
K+
H+ H2 O
Indicates possible cellular mechanisms responsiblefor Type 1 distal RTA
CA
A
8/14/2019 Kidney Diseases - VOLUME ONE - Chapter 06
http://slidepdf.com/reader/full/kidney-diseases-volume-one-chapter-06 19/28
6.19Disorders of Acid-Base Balance
Principal cell
Aldosterone
receptor
Aldosterone
receptor
α Intercalated cell
Lumen
Potentialdifference
Blood
HCO3
– CO2
Cl –
Cl –
Cl –
2K+
3Na+
Na+
K+
Cl –
OH –
K+
H+
H+
H2 O
Indicates possible cellular mechanisms in aldosterone deficiencyIndicates defects related to aldosterone resistance
CA
–
A
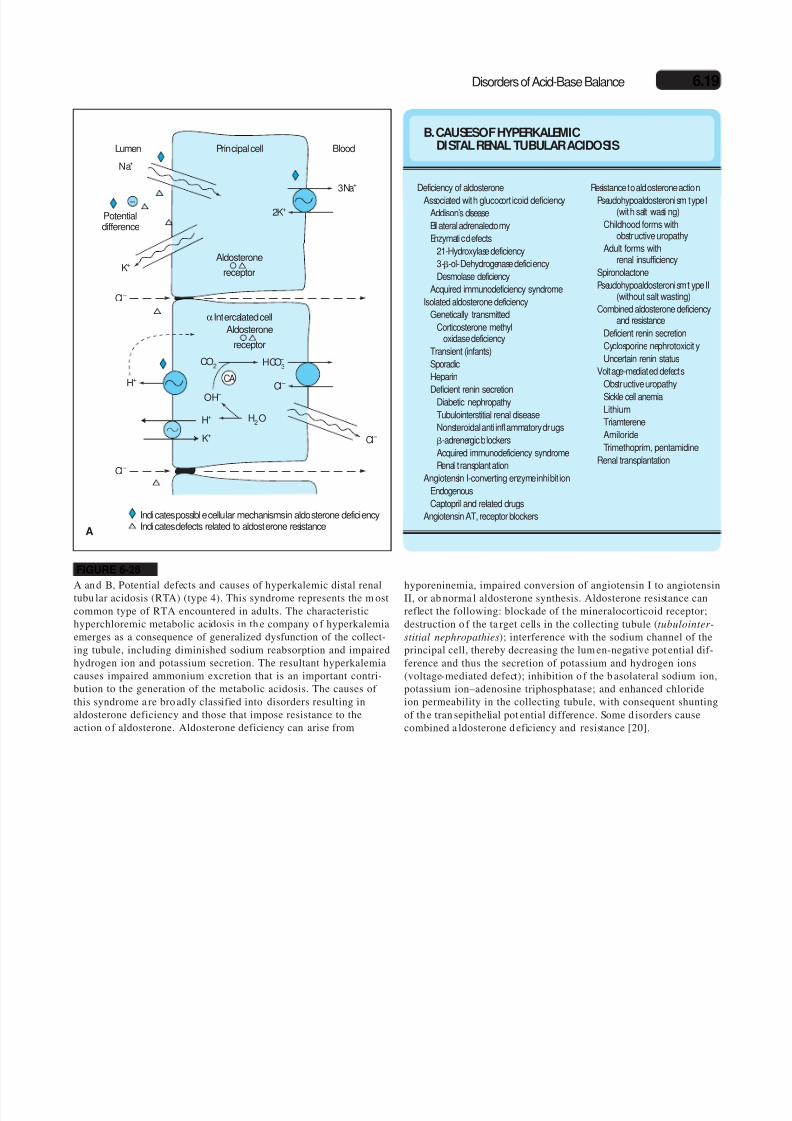
FIGURE 6-28
A
andB
, Potential defects and causes of hyperkalemic distal renaltubu lar acidosis (RTA) (type 4). This syndrome represents the m ostcommon type of RTA encountered in adults. The characteristichyperchloremic metabolic acidosis in th e company o f hyperkalemiaemerges as a consequence of generalized dysfunction of the collect-ing tubule, including diminished sodium reabsorption and impairedhydrogen ion and potassium secretion. The resultant hyperkalemiacauses impaired ammonium excretion that is an important contri-bution to the generation of the metabolic acidosis. The causes of this syndrome a re bro adly classified into disorders resulting inaldosterone deficiency and those that impose resistance to theaction o f aldosterone. Aldosterone deficiency can arise from
hyporeninemia, impaired conversion of angiotensin I to angiotensinII, or ab norma l aldosterone synthesis. Aldosterone resistance canreflect the following: blockade of t he mineralocorticoid receptor;destruction o f the ta rget cells in the collecting tubule (tubulointer-
stitial nephropathies); interference with the sodium channel of theprincipal cell, thereby decreasing the lum en-negative pot ential dif-ference and thus the secretion of potassium and hydrogen ions(voltage-mediated defect); inhibition o f the b asolateral sodium ion,potassium ion–adenosine triphosphatase; and enhanced chlorideion permeability in the collecting tubule, with consequent shuntingof th e tran sepithelial pot ential difference. Some d isorders causecombined a ldosterone d eficiency and resistance [20].
B. CAUSESOF HYPERKALEMICDISTAL RENAL TUBULAR ACIDOSIS
Deficiency of aldosterone
Associated with glucocort icoid deficiency
Addison’s disease
Bilateral adrenalectomy
Enzymatic defects
21-Hydroxylase deficiency
3--ol-Dehydrogenase deficiency
Desmolase deficiency
Acquired immunodeficiency syndrome
Isolated aldosterone deficiency
Genetically transmitted
Corticosterone methyloxidase deficiency
Transient (infants)
Sporadic
Heparin
Deficient renin secretionDiabetic nephropathy
Tubulointerstitial renal disease
Nonsteroidal antiinflammatory drugs
-adrenergic blockers
Acquired immunodeficiency syndrome
Renal transplantation
Angiotensin I-converting enzyme inhibition
Endogenous
Captopril and related drugs
Angiotensin AT, receptor blockers
Resistance to aldosterone action
Pseudohypoaldosteronism type I(with salt wasting)
Childhood forms withobstructive uropathy
Adult forms withrenal insufficiency
Spironolactone
Pseudohypoaldosteronism t ype II(without salt wasting)
Combined aldosterone deficiencyand resistance
Deficient renin secretion
Cyclosporine nephrotoxicit y
Uncertain renin status
Voltage-mediated defects
Obstructive uropathy
Sickle cell anemia
Lithium
Triamterene
Amiloride
Trimethoprim, pentamidine
Renal transplantation

8/14/2019 Kidney Diseases - VOLUME ONE - Chapter 06
http://slidepdf.com/reader/full/kidney-diseases-volume-one-chapter-06 20/28
6.20 Disorders of Water, Electrolytes, and Acid-Base
Management of acute metabolic acidosis
Cause-specific measures
Benefits
•Prevents or reverses acidemia-related hemodynamic compromise.
•Reinstates cardiovascularresponsiveness to catecholamines.
• "Buys time," thus allowing cause-specif ic measures and endogenousreparatory processes to take effect.
•Provides a measure of safety againstadditional acidifying stresses.
Risks
•Hypernatremia/ hyperosmolality
•Volume overload• "Overshoot" alkalosis•Hypokalemia•Decreased plasma ionizedcalcium concentration
•Stimulation of organicacid production
•Hypercapnia
Alkali therapy for severe
acidemia (blood pH< 7.20)
FIGURE 6-29
Treatment of acute metab olic acidosis. Wh enever po ssible, cause-specific measures should be at the center of treatment of metabolicacidosis. In the presence of severe acidemia, such measures shouldbe supplemented by judicious administration of sodium bicarbon-ate. The goal of alkali therapy is to return the blood pH to a safer
level of about 7.20. Anticipated benefits and potential risks of alkali therapy are depicted here [1].
Metabolic Alkalosis
6.8 6.9 7.0 7.1 7.2 7.3 7.4 7.5 7.6 7.7
150125 100
PaCO2mm Hg
120 100 90 80 70
40
30
20
10
80 70 60 50 40 30 20
Arterial blood pH
Arterial blood [H+],nEq/L
10
20
30
40
A r t e r i a l p l a s m a [ H C O
– 3 ] , m E q / L
50
Normal
60 50
FIGURE 6-30
Ninety-five percent confidence intervals for metabolic alkalosis.Metab olic alkalosis is the acid-base disturbance initiated by anincrease in plasma bicarbonate concentration ([H CO
-3]). The
resultant alkalemia dampens alveolar ventilation and leads to thesecondar y hypercapnia characteristic of th e disorder. Availableobservations in humans suggest a roughly linear relationshipbetween the steady-state increase in bicarbona te concentrationand the associated increment in the arterial carbon dioxide ten-sion (PaCO
2
). Although data are limited, the slope of the steady-state PaCO 2 versus [HCO -
3] relationship has been estimated asabout a 0.7 mm Hg per mEq/L increase in plasma bicarbonateconcentration. T he value of this slope is virtua lly identical tothat in dogs that has been derived from rigorously controlledobservations [21]. Empiric observations in hum ans have beenused for construction of 95% confidence intervals for gradeddegrees of metab olic alkalosis represented by t he area in color inthe acid-base template. The black ellipse near the center of thefigure indicates the norm al range for t he acid-base parameters[3]. Assuming a steady state is pr esent, values falling within t hearea in color are consistent with but not diagnostic of simplemetabolic alkalosis. Acid-base values falling outside the area incolor denote t he presence of a mixed acid-base disturbance [4].[H +]—hydrogen ion concentration.

8/14/2019 Kidney Diseases - VOLUME ONE - Chapter 06
http://slidepdf.com/reader/full/kidney-diseases-volume-one-chapter-06 21/28
6.21Disorders of Acid-Base Balance
Excess alkaliAlkali gain
Enteral
Parenteral
Milk alkali syndromeCalcium supplements
Absorbable alkali
Nonabsorbable alkali plus K+ exchange resins
Gastric
Renal
Reduced GFR
Increasedrenal acidification
Intestinal
VomitingSuction
Cl – responsive defect
Cl – resistant defect
Villous adenomaCongenital chloridorrhea
Chloruretic diureticsInherited transport defects
Ringer's solution
Bicarbonate
Blood products
Mineralocort icoid excess
Posthypercapnia
Dialysis
Nutrition
H+ shiftK+ depletion
H+ loss
Source?
Mode of perpetuation?
FIGURE 6-31
Pathogenesis of metabo lic alkalosis. Twocrucial questions must be answered whenevaluating the pat hogenesis of a case of metabolic alkalosis. 1) What is the sourceof the excess alkali? Answering this ques-
tion addresses the primary event responsiblefor generating the hyperbicarbonatemia. 2)What factors perpetuate the hyperbicarbon-atemia? Answering this question a ddressesthe pathophysiologic events that maintain
the metab olic alkalosis.
Baseline Vomiting Maintenance CorrectionLow NaCl and KCl intake High NaCl and KCl intake
– 400
– 200
0
– 2 0 2 4 6 8 10 12 14 16 18
Days
– 400
– 200
0
– 100
0
[ C l –
] ,
m E q / L
C u m u l a t i v e b a l a n
c e , m E q
95
100
105
K +
N a
+
C l –
[ H C O
3 – ] ,
m E q / L
25
30
35
40
45
FIGURE 6-32
Changes in plasma anionic pattern and body electrolyte balanceduring development, maintenance, and correction of metabolicalkalosis induced by vomiting. Loss of hydrochloric acid from thestomach as a result of vomiting (or gastric drainage) generates thehypochloremic hyperbicarbonat emia characteristic of this d isorder.During the generation phase, renal sodium and potassium excre-
tion increases, yielding the deficits depicted here. Renal potassiumlosses continue in the early days of the maintenance phase.Subsequently, and as long as the low-chloride diet is continued, anew steady state is achieved in which plasma bicarbonate concen-tration ([HCO
-3]) stabilizes at an elevated level, and renal excretion
of electrolytes matches intake. Addition of sodium chloride (NaCl)and potassium chloride (KCl) in the correction phase repairs theelectrolyte deficits incurred and normalizes the plasma bicarbonateand chloride concentration ([Cl-]) levels [22,23].
8/14/2019 Kidney Diseases - VOLUME ONE - Chapter 06
http://slidepdf.com/reader/full/kidney-diseases-volume-one-chapter-06 22/28
6.22 Disorders of Water, Electrolytes, and Acid-Base
Baseline Vomiting Maintenance CorrectionLow NaCl and KCl intake High NaCl and KCl intake
0
25
50
75
– 2 0 2 4 6 8 10 12 14 16 18
Days
– 50
– 25
0
25
50
75
100
U r i n e H C O – 3 e x c r e t i o n ,
m E q / d
U r i n e n e t a c i d e x c r e t i o n ,
m E q / d
5.0
6.0
7.0
8.0
U r i n e p H
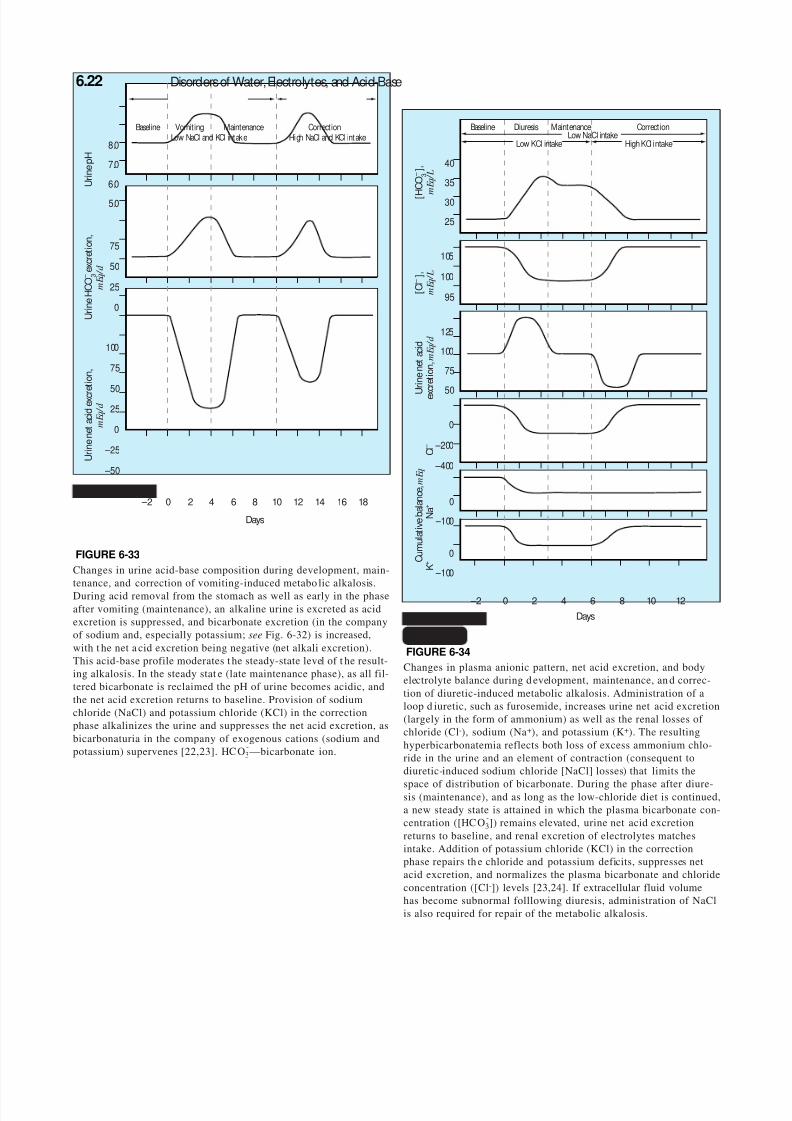
FIGURE 6-33
Changes in urine acid-base composition during development, main-tenance, and correction of vomiting-induced metabo lic alkalosis.During acid removal from the stomach as well as early in the phaseafter vomiting (maintenance), an alkaline urine is excreted as acidexcretion is suppressed, and bicarbonate excretion (in the companyof sodium and, especially potassium; see Fig. 6-32) is increased,with t he net a cid excretion being negative (net alkali excretion).This acid-base profile moderates t he steady-state level of t he result-ing alkalosis. In the steady stat e (late maintenance phase), as all fil-tered bicarbonate is reclaimed the pH of urine becomes acidic, andthe net acid excretion returns to baseline. Provision of sodiumchloride (NaCl) and potassium chloride (KCl) in the correctionphase alkalinizes the urine and suppresses the net acid excretion, asbicarbonaturia in the company of exogenous cations (sodium andpotassium) supervenes [22,23]. HCO
-3—bicarbonate ion.
Baseline Diuresis Maintenance Correction
Low KCl intakeLow NaCl intake
High KCl intake
– 400
– 200
0
– 2 0 2 4 6 8 10 12
Days
– 100
0
– 100
0
[ C l –
] ,
m E q / L
C u m u l a t i v e b a l a n c e , m E q
95
100
105
K +
N a
+
C l –
[ H C O
3 – ] ,
m E q / L
25
30
35
40
U
r i n e n e t a c i d
e x c r e t i o n , m E q / d
50
75
100
125
FIGURE 6-34
Changes in plasma anionic pattern, net acid excretion, and bodyelectrolyte balance during d evelopment, maintenance, an d correc-tion of diuretic-induced metabolic alkalosis. Administration of aloop d iuretic, such as furosemide, increases urine net acid excretion(largely in the form of ammonium) as well as the renal losses of chloride (Cl-), sodium (Na+), and potassium (K+). The resultinghyperbicarbonatemia reflects both loss of excess ammonium chlo-ride in the urine and an element of contraction (consequent todiuretic-induced sodium chloride [NaCl] losses) that limits the
space of distribution of bicarbonate. During the phase after diure-sis (maintenance), and as long as the low-chloride diet is continued,a new steady state is attained in which the plasma bicarbonate con-centration ([HCO
-3]) remains elevated, urine net acid excretion
returns to baseline, and renal excretion of electrolytes matchesintake. Addition of potassium chloride (KCl) in the correctionphase repairs th e chloride and potassium deficits, suppresses netacid excretion, and normalizes the plasma bicarbonate and chlorideconcentration ([Cl-]) levels [23,24]. If extracellular fluid volumehas become subnormal folllowing diuresis, administration of NaClis also required for repair of the metabolic alkalosis.

8/14/2019 Kidney Diseases - VOLUME ONE - Chapter 06
http://slidepdf.com/reader/full/kidney-diseases-volume-one-chapter-06 23/28
6.23Disorders of Acid-Base Balance
↑H+ secretion
HCO3 – secretion
↓GFR ↑HCO3reabsorption –
↑HCO3 – reabsorption
Net acid excretion maintained at control
Basic mechanisms
Maintenance of Cl –-responsive metabolic alkalosis
↑H+ secretion coupled to K+ reabsorption
↑Na+ reabsorpt ion and consequent ↑H+ and K+ secretion
Cl – depletionMediating factors
K+
K+
K+
ECFvolume depletion K+ depletion Hypercapnia
↑NH4+ synthesis and
luminal entry
↑NH4+ entry in medulla and secretion
in medullary collecting duct
H+ K+
K+
NH4+
NH4
+,K
+
NH4+
NH3
H2O
NH
3
NH4+
NH3
NH3
α-cell
P-cell
HCO3
HCO – 3
3 H C O – 3
H C O – 3
HCO3
Cl
Cl –
Cl –
2Cl –
Cl –
C l –
C l –
Cl
H+
H+
K+
Na+
Na+Na+
N a
+
N a
+
H + , N H + 4
N a
+
Na
K+H+
ß-cell
Cl
↓GFR
FIGURE 6-35
Ma intenance of chloride-responsive metabolic alkalosis.Increased renal bicarbonate reabsorption frequently coupledwith a reduced glomerular filtration rate are the basic mecha-nisms that maintain chloride-responsive metabolic alkalosis.These mechanisms have been ascribed to three mediating fac-tors: chloride depletion itself, extracellular fluid (ECF) volumedepletion, and potassium depletion. Assigning particular roles to
each of these factors is a vexing task. Notwithstanding, heredepicted is our current understanding of the participation of each of these factors in the nephronal processes that maintainchloride-responsive metabolic alkalosis [22–24]. In addition tothese factors, the secondary hypercapnia of metabolic alkalosiscontributes importantly to the maintenance of the prevailinghyperbicarbonatemia [25].
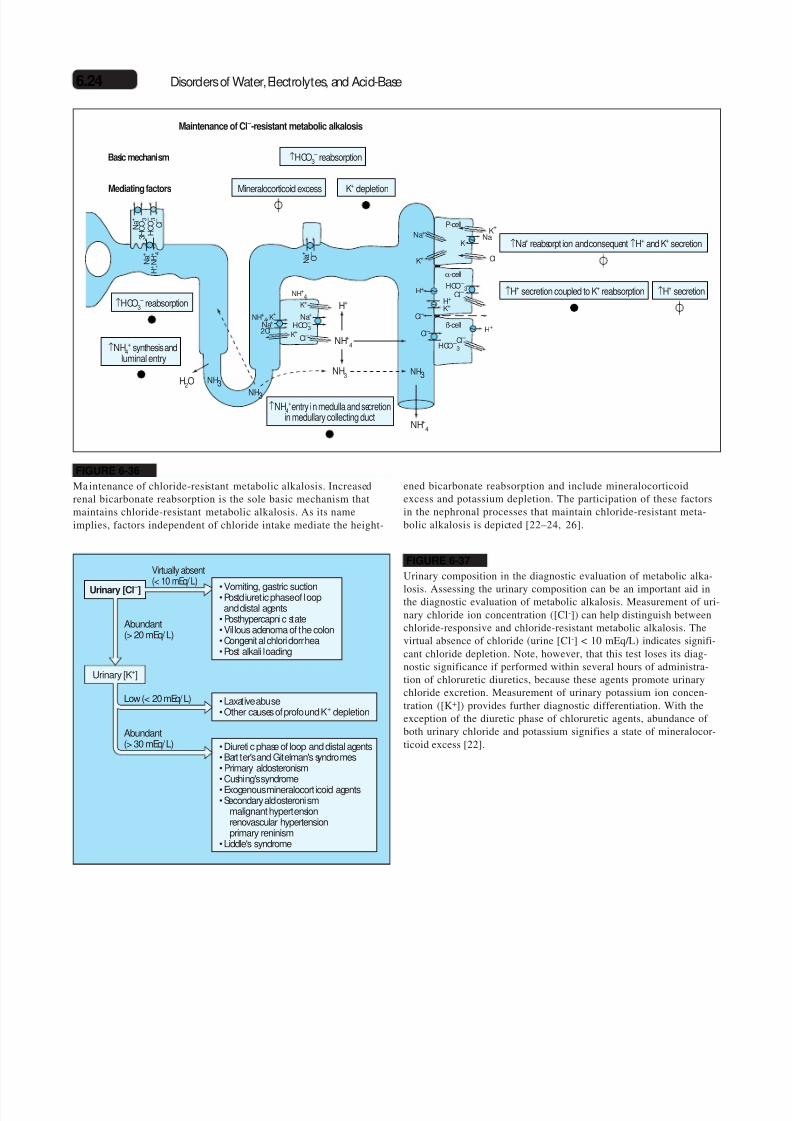
8/14/2019 Kidney Diseases - VOLUME ONE - Chapter 06
http://slidepdf.com/reader/full/kidney-diseases-volume-one-chapter-06 24/28
6.24 Disorders of Water, Electrolytes, and Acid-Base
↑H+ secretion
↑HCO3 – reabsorption
↑HCO3 – reabsorption
Basic mechanism
Maintenance of Cl –-resistant metabolic alkalosis
↑H+ secretion coupled to K+ reabsorption
↑Na+ reabsorpt ion and consequent ↑H+ and K+ secretion
Mineralocorticoid excessMediating factors K+ depletion
↑NH4+ synthesis and
luminal entry
↑NH4+entry in medulla and secretion
in medullary collecting duct
H+ K+
K+
NH+4
NH+4
NH+4
NH+4, K
+
NH3
H2O
NH3
NH3
NH3
α-cell
P-cell
HCO – 3
HCO – 3
3 H C O – 3
H C O – 3
HCO – 3
Cl –
Cl –
Cl –
Cl – 2Cl –
Cl –
C l –
C l –
Cl
H+
H+
K+
Na+
Na+Na+
N a
+
N a
+
H + , N H + 4
N a
+
NaK
K+
K+H+
ß-cell
FIGURE 6-36
Ma intenance of chloride-resistant metabolic alkalosis. Increasedrenal bicarbonate reabsorption is the sole basic mechanism thatmaintains chloride-resistant metabolic alkalosis. As its nameimplies, factors independent of chloride intake mediate the height-
ened bicarbonate reabsorption and include mineralocorticoidexcess and potassium depletion. The participation of these factorsin the nephronal processes that maintain chloride-resistant meta-bolic alkalosis is depicted [22–24, 26].
Urinary [Cl –]
Urinary [K+]
Abundant(> 20 mEq/L)
Virtually absent(< 10 mEq/L)
Low (< 20 mEq/L) •Laxative abuse•Other causes of profound K+ depletion
Abundant(> 30 mEq/L) •Diuretic phase of loop and distal agents
•Bart ter's and Gitelman's syndromes•Primary aldosteronism•Cushing's syndrome•Exogenous mineralocort icoid agents•Secondary aldosteronism
malignant hypertensionrenovascular hypertensionprimary reninism
•Liddle's syndrome
•Vomiting, gastric suction•Postdiuretic phase of loopand distal agents
•Posthypercapnic state•Villous adenoma of the colon•Congenital chloridorrhea•Post alkali loading
FIGURE 6-37
Urinary composition in the diagnostic evaluation of metabolic alka-
losis. Assessing the urinary composition can be an important aid inthe diagnostic evaluation of metabolic alkalosis. Measurement of uri-nary chloride ion concentration ([Cl-]) can help distinguish betweenchloride-responsive and chloride-resistant metabolic alkalosis. Thevirtual absence of chloride (urine [Cl-] < 10 mEq/L) indicates signifi-cant chloride depletion. Note, however, that this test loses its diag-nostic significance if performed within several hours of administra-tion of chloruretic diuretics, because these agents promote urinarychloride excretion. Measurement of urinary potassium ion concen-tration ([K+]) provides further diagnostic differentiation. With theexception of the diuretic phase of chloruretic agents, abundance of both urinary chloride and potassium signifies a state of mineralocor-ticoid excess [22].
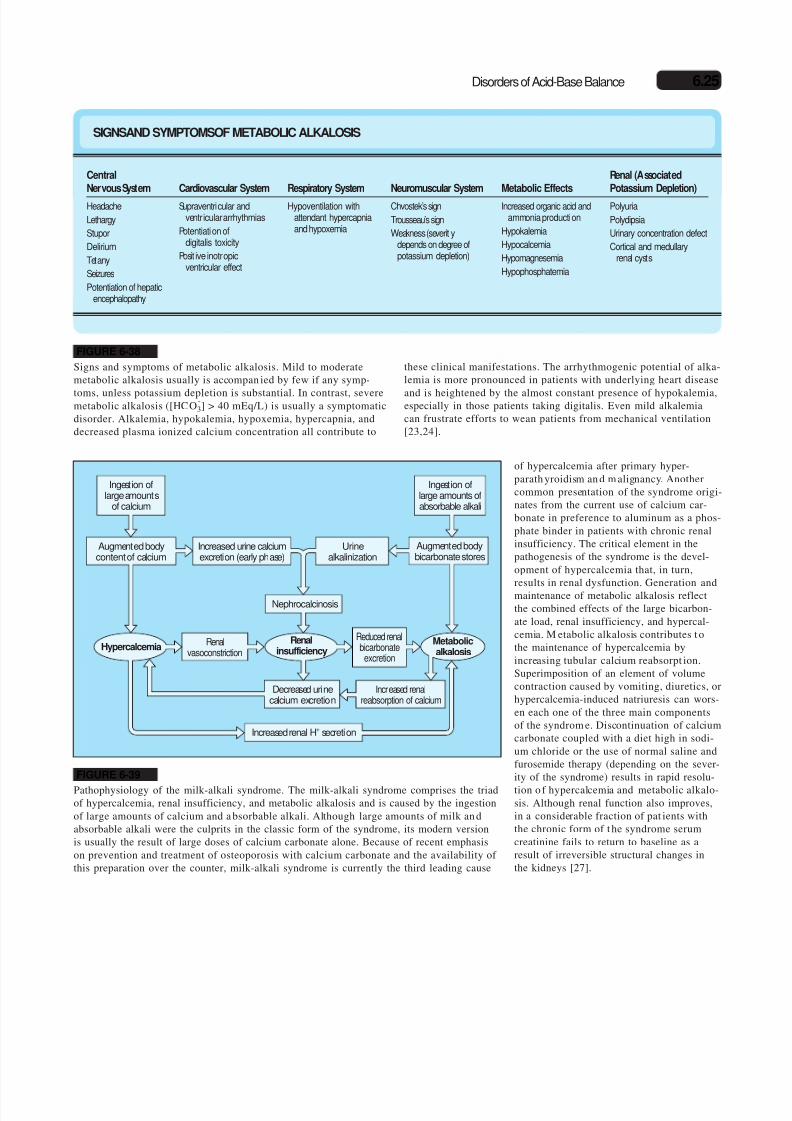
8/14/2019 Kidney Diseases - VOLUME ONE - Chapter 06
http://slidepdf.com/reader/full/kidney-diseases-volume-one-chapter-06 25/28
6.25Disorders of Acid-Base Balance
SIGNSAND SYMPTOMSOF METABOLIC ALKALOSIS
Central
Nervous System
Headache
Lethargy
Stupor
Delirium
Tetany
Seizures
Potentiation of hepaticencephalopathy
Cardiovascular System
Supraventricular andventricular arrhythmias
Potentiation ofdigitalis toxicity
Posit ive inotropicventricular effect
Respiratory System
Hypoventilation withattendant hypercapniaand hypoxemia
Neuromuscular System
Chvostek’s sign
Trousseau’s sign
Weakness (severit ydepends on degree ofpotassium depletion)
Metabolic Effects
Increased organic acid andammonia production
Hypokalemia
Hypocalcemia
Hypomagnesemia
Hypophosphatemia
Renal (Associated
Potassium Depletion)
Polyuria
Polydipsia
Urinary concentration defect
Cortical and medullaryrenal cysts
FIGURE 6-38
Signs and symptoms of metabolic alkalosis. Mild to moderatemetabolic alkalosis usually is accompan ied by few if any symp-
toms, unless potassium depletion is substantial. In contrast, severemetabolic alkalosis ([HCO
-3] > 40 mEq/L) is usually a symptomatic
disorder. Alkalemia, hypokalemia, hypoxemia, hypercapnia, anddecreased plasma ionized calcium concentration all contribute to
these clinical manifestations. The arrhythmogenic potential of alka-lemia is more pronounced in patients with underlying heart disease
and is heightened by the almost constant presence of hypokalemia,especially in those patients taking digitalis. Even mild alkalemiacan frustrate efforts to wean patients from mechanical ventilation[23,24].
Ingestion oflarge amounts
of calcium
Augmented bodycontent of calcium
Increased urine calciumexcretion (early phase)
Urinealkalinization
Ingestion oflarge amounts ofabsorbable alkali
Augmented bodybicarbonate stores
Increased renal H+ secretion
Nephrocalcinosis
Decreased urinecalcium excretion
Increased renalreabsorption of calcium
Renalvasoconstriction
Reduced renalbicarbonateexcretion
Renalinsufficiency
Metabolicalkalosis
Hypercalcemia
FIGURE 6-39
Pathophysiology of the milk-alkali syndrome. The milk-alkali syndrome comprises the triadof hypercalcemia, renal insufficiency, and metabolic alkalosis and is caused by the ingestionof large amounts of calcium and a bsorbable alkali. Although large amounts of milk an dabsorbable alkali were the culprits in the classic form of the syndrome, its modern versionis usually the result of large doses of calcium carbonate alone. Because of recent emphasison prevention and treatment of osteoporosis with calcium carbonate and the availability of this preparation over the counter, milk-alkali syndrome is currently the third leading cause
of hypercalcemia after primary hyper-parath yroidism an d m alignancy. Anothercommon presentation of the syndrome origi-nates from the current use of calcium car-bonate in preference to aluminum as a phos-phate binder in patients with chronic renalinsufficiency. The critical element in thepathogenesis of the syndrome is the devel-opment of hypercalcemia that, in turn,results in renal dysfunction. Generation andmaintenance of metabolic alkalosis reflectthe combined effects of the large bicarbon-ate load, renal insufficiency, and hypercal-cemia. M etabolic alkalosis contributes t othe maintenance of hypercalcemia byincreasing tubular calcium reabsorpt ion.Superimposition of an element of volumecontraction caused by vomiting, diuretics, orhypercalcemia-induced natriuresis can wors-en each one of the three main componentsof the syndrom e. Discontinuation of calciumcarbonate coupled with a diet high in sodi-um chloride or the use of normal saline andfurosemide therapy (depending on the sever-ity of the syndrome) results in rapid resolu-tion o f hypercalcemia and metabolic alkalo-sis. Although renal function also improves,in a considerable fraction of pat ients withthe chronic form of t he syndrome serumcreatinine fails to return to baseline as aresult of irreversible structural changes inthe kidneys [27].

8/14/2019 Kidney Diseases - VOLUME ONE - Chapter 06
http://slidepdf.com/reader/full/kidney-diseases-volume-one-chapter-06 26/28
6.26 Disorders of Water, Electrolytes, and Acid-Base
Clinical syndrome
Bartter's syndrome
Type 1 NKCC2 15q15-q21
Gitelman's syndrome
TSC 16q13
TAL
Type 2 ROMK 11q24
TALCCD
DCT
Affected gene Affected chromosome Localization of tubular defect
3HCO3
–
2K+
Na+
Thick ascending limb (TAL) Distal convoluted tuble (DCT)
Cl –
Loop diuretics Thiazides
K+,NH+4
H+
Ca2+
Ca2+Ca2+
Mg2+
K+
Cell CellPeritubular
spaceTubular lumen
Peritubular space
Tubular lumen
ATPase3Na+
2K+
K+
K+Na+
Cl –
Cl –
Cl
–
ATPase3Na+
3Na+
Cortical collecting duct (CCD)
CellPeritubular
spaceTubular lumen
2K+
Cl –
ATPase3Na+
Na+
K+
K+
Na+
FIGURE 6-40
Clinical features and molecular basis of tubular defects of Bartter’s and Gitelman’s syn-dromes. Th ese rare disorders are characterized by chloride-resistant m etabolic alkalosis,renal potassium wasting and hypokalemia, hyperreninemia and hyperplasia of the jux-taglomerular apparatus, hyperaldosteronism, and normotension. Regarding differentiat-ing features, Bartter’s syndrome presents early in life, frequently in association withgrowth and mental retardation. In this syndrome, urinary concentrating ability is usual-ly decreased, polyuria and polydipsia are present, the serum magnesium level is normal,
and hypercalciuria and nephrocalcinosisare present. In contrast, Gitelman’s syn-drom e is a milder d isease presenting laterin life. Patients often are a symptomat ic,or they might have intermittent musclespasms, cramps, or tetany. Urinary con-
centrating ability is maintained; hypocal-ciuria, renal magnesium wasting, andhypomagnesemia are almost constant fea-tures. On the basis of certain of these clin-ical features, it had been hypoth esizedthat the primary tubular defects inBartter’s and Gitelman’s syndromes reflectimpairment in sodium reabsorption in thethick ascending limb (TAL) of th e loop of Henle an d t he distal t ubule, respectively.This hypothesis has been validated byrecent genetic studies [28-31]. As illustrat-ed here, Bartter’s syndrome n ow has beenshown to b e caused by loss-of-functionmutations in the loop diuretic–sensitivesodium-potassium-2chloride cotransporter(NKCC2) of the TAL (type 1 Bartter’ssyndrome) [28] or the apical potassiumchannel RO MK o f the TAL (where it recy-cles reabsorbed potassium into the lumenfor continued operation of the NKCC2cotransporter) and the cortical collectingduct (where it m ediates secretion of pot as-sium by the principal cell) (type 2Bartter’s syndrome) [29,30]. On the otherhand , Gitelman’s syndrome is caused bymuta tions in t he thiazide-sensitive Na-Clcotransporter (TSC) of the distal tubule[31]. Note that the distal tubule is themajor site of active calcium reabsorp tion.Stimulation of calcium reabsorption atthis site is responsible for the hypocalci-uric effect of thiazide diuretics.

8/14/2019 Kidney Diseases - VOLUME ONE - Chapter 06
http://slidepdf.com/reader/full/kidney-diseases-volume-one-chapter-06 27/28

8/14/2019 Kidney Diseases - VOLUME ONE - Chapter 06
http://slidepdf.com/reader/full/kidney-diseases-volume-one-chapter-06 28/28
6.28 Disorders of Water, Electrolytes, and Acid-Base
23. Sabatini S, Kurtzman N A: Metabolic alkalosis: biochemical mecha-nisms, pathophysiology, and treatment. In Therapy of Renal D iseases
and Related Disorders Edited by Suki WN, Massry SG. Boston:Kluwer Academic Publishers; 1997:189–210.
24. Galla JH, Luke RG: Metabolic alkalosis. In Textbook of N ephrology.Edited by Ma ssry SG, Glassock RJ. Baltimor e: Williams & Wilkins;1995:469–477.
25. Mad ias NE, Adrogué HJ, Cohen JJ: Maladap tive renal response tosecondary hypercapnia in chronic metabolic alkalosis. Am J Physiol
1980, 238:F283–289.
26. Harrington JT, Hulter HN , Cohen JJ, Madias NE: Mineralocorticoid-stimulated renal acidification in the dog: the critical role of dietarysodium. Kidney Int 1986, 30:43–48.
27. Beall DP, Scofield RH : Milk-alkali syndrome associated with calciumcarbonate consumption. Medicine 1995, 74:89–96.
28. Simon DB, Karet FE, Hamdan JM, et al.: Bartter’s syndrome,hypokalaemic alkalosis with hypercalciuria, is caused by mutations inthe Na-K-2Cl cotransporter NKCC2. Nat G enet 1996, 13:183–188.
29. Simon DB, Karet FE, Rodriguez-Soriano J, et al.: Genetic heterogene-ity of Bartter’s syndrome revealed by mutations in the K+ channel,ROMK. Nat G enet 1996, 14:152–156.
30. International Collaborative Study Group for Bartter-like Syndromes.Mutations in the gene encoding the inwardly-rectifying renal potassi-um channel, ROMK, cause the antenatal variant of Bartter syndrome:evidence for genetic h eterogeneity. Hum M ol Genet 1997, 6:17–26.
31. Simon DB, Nelson-Williams C, et al.: Gitelman’s variant of Bartter’ssyndrome, inherited hypok alaemic alkalosis, is caused by mutat ionsin th e thiazide-sensitive Na -Cl cotranspo rter. Nat G enet 1996,12:24–30.