kill spill integrated biotechnological solutions for...
TRANSCRIPT

This project is supported by the European Union under the Food, Agriculture and Fisheries and Biotechnology theme of the 7th Framework Programme for Research and Technological Development under GA no. 312139
Kill●Spill Integrated Biotechnological Solutions for Combating Marine Oil Spills
Deliverable D4.2 Report on the characterization of high-pressure adapted bacterial communities

ii
Work package WP4 Microbial and additive formulations for enhanced bioremediation
Deliverable no D4.2
Deliverable title Report on the characterization of high-pressure adapted bacterial communities, fungal communities and biodegradation activity of airborne strains in a microdroplet reactor
Due date: 2014-12-31 (Month 24)
Actual submission date:
Start date of project: 2013-01-01
Deliverable Lead Beneficiary (Organisation name)
UGENT
Participant(s) (Partner short names) UGENT; UMIL
Author(s) in alphabetic order: Boon, Nico; Borin, Sara; Daffonchio, Daniele; Mapelli, Francesca; Scoma, Alberto;
Contact for queries: Nico Boon
Laboratory of Microbial Ecology and Technology (LabMET), University of Gent, Coupure Links 653, 9000, Gent, Belgium
T +32 (0)9 264 59 76
Dissemination Level: (PUblic, Restricted to other Programmes Participants, REstricted to a group specified by the consortium, COnfidential only for members of the consortium)
PU
Deliverable Status: Final version (2015-06-12)
V4_amended version by AS (2015-06-11)
V3_review by PC (2015-05-19)
V2_full draft by AS (2015-03-04)
V1_first preliminary draft by AS (2014-12-31)
Comment: Due to non-performance of partner IMST their part to the deliverable related to 'activity of airborne strains in a microdroplet reactor' is not included in this document. The partner has been declared a defaulting party and is being terminated.

iii

Grant Agreement no. 312939 Deliverable D4.2 Report on the characterization of high-pressure adapted bacterial communities
iv
Table of Content
1 About this deliverable ...................................................................................................................... 1
2 Effects of High Hydrostatic Pressure on microbial growth using alkanes as the sole carbon source ............................................................................................................................................... 1
2.1 Piezosensitive oil degrading bacteria ...................................................................................... 1
2.1.1 Materials and Methods ................................................................................................... 1
2.1.2 Results ............................................................................................................................. 3
2.1.3 Transcriptomic response in Alcanivorax strains .............................................................. 5
2.1.4 Conclusion and Perspective............................................................................................. 6
2.2 Collection and characterization of deep-sea samples from the Atlantic Ocean ..................... 6
2.2.1 Preliminary considerations .............................................................................................. 6
2.2.2 Results ............................................................................................................................. 7
2.2.3 Conclusions .................................................................................................................... 10
2.3 Piezophilic eicosane (C20) degrading bacteria from deep-sea ............................................. 11
2.3.1 Introduction ................................................................................................................... 11
2.3.2 Materials and Methods ................................................................................................. 12
2.3.3 Results ........................................................................................................................... 12
2.3.4 Conclusions and perspectives ....................................................................................... 16
3 References ......................................................................................................................................17
List of Figures
Figure 1 (Left) Cell growth under different hydrostatic pressure in the selected isolates and (right) percentage of intact cells over total cells according to the same increasing pressure conditions. Bars indicate 95% confidence intervals. ........................................... 3
Figure 2 (Left) Changes of the pH value at the end of the growth in the selected isolates according to the hydrostatic pressure; red keys indicate negative controls; bars indicate 95% confidence intervals. (Right) Availability of dodecane in the water phase according to different isolates and hydrostatic pressure. Values indicate the range of concentrations detected. .................................................................................................... 4
Figure 3 (Left) Cell number (as shown in Figure 1, left) and (right) Optical Density in the selected isolates after of 4 days of growth according to the hydrostatic pressure; bars indicate 95% confidence intervals. ..................................................................................... 4
Figure 4 (Left) O2 respiration and (right) CO2 production in the selected isolates after of 4 days of growth according to the hydrostatic pressure; bars indicate 95% confidence intervals. Red keys indicate negative controls. .................................................................. 5
Figure 5 (Left) PO43- and (right) SO4
2- consumption in A. dieselolei and A. borkumensis at increasing HP pressures (1, 50 and 100 bars). .................................................................... 6

Grant Agreement no. 312939 Deliverable D4.2 Report on the characterization of high-pressure adapted bacterial communities
v
Figure 6 Sampling area and collection sites during the Belgica Campaign between 2nd and 10th of June, 2014. ...................................................................................................................... 7
Figure 7 Analysis of the microbial community sampled at deep sea using Illumina-based sequencing (metagenome analysis conducted using RAST). ............................................ 11
Figure 8 Cell number using a 1.5 µm filter (left) or a 25 µm filter (right) during the enrichment with C20 in different conditions of pressure and O2 availability. ..................................... 13
Figure 9 Average of phosphates (left) and sulphates (right) concentration at the end of each of the 9 incubations in different culture conditions. ............................................................ 13
Figure 10 Dissolved O2 concentration (left) and pH value (right) at the end of each 10-day incubation during the enrichment, according to different culture conditions. Keys reported in the graph ....................................................................................................... 14
Figure 11 Optical Density at 610 nm (left) and a detail of the same analysis during the last 60 days of incubation (right) according to different culture conditions. Keys reported in the graph ........................................................................................................................... 14
Figure 12 Hydrophobicity test (with respect to hexadecane, C16) after 30, 60 and 90 days of incubation ......................................................................................................................... 15
Figure 13 DGGE of the C20-degrading marine communities between 10 and 90 days of incubation in all culture conditions. Keys: Boxes: Red, piezosensitive bacteria; Green, piezotolerant bacteria; Blue, piezophilic bacteria. ........................................................... 16
List of Tables
Table 1 Main features of all the samples collected in the Atlantic Ocean (Western Iberian Margin)................................................................................................................................ 8

Grant Agreement no. 312939 Deliverable D4.2 Report on the characterization of high-pressure adapted bacterial communities
1
1 About this deliverable
Within WP4, the Laboratory of Microbial Ecology and Technology (LabMET) of the University of Gent had the task of investigating the impact of Hydrostatic Pressure (HP) on marine bacterial communities capable of using alkanes as the sole carbon source. While several studies focused on the fate of oil and on the microbial community shifts in response to oil spills at high water depth (Hazen et al., 2010; Lu et al., 2012; Mason et al., 2012; Joye et al., 2014) very few gave some insights on the physiological changes imposed by HP on hydrocarbon degradation. In particular, investigations using high-pressure reactors to simulate what happens when the oil eventually sinks towards the seafloor have been very scarce (Schwarz et al., 1974 and 1975; Grossi et al., 2010; Schedler et al., 2014). Kill•Spill aimed at addressing this lack of information through the activity of LabMET within WP4. In particular, this has been done as follows:
1) Use of known oil-degraders (supplied by another partner, namely, the University of Milano, UMIL, partner 10) under high HP (1, 50 and 100 bars) (Chapter 2.1)
2) Collection and characterization of deep-sea samples collected in the Atlantic Ocean (Chapter 2.2)
3) Microbial communities enrichment in long-chain (i.e., eicosane) hydrocarbon degraders from deep-sea under high HP (1, 100 and 200 bars) (Chapter 2.3)
2 Effects of High Hydrostatic Pressure on microbial growth using alkanes as the sole carbon source
2.1 Piezosensitive oil degrading bacteria
Some of the most re-known oil-degraders in the literature belong to the Alcanivorax and Marinobacter genera. Both these genera appear to be responsible for the oxidation of hydrocarbon compounds in surface waters but also at deep sea (Liu and Shao, 2005; Grossi et al., 2010; Bertrand et al., 2013; Lai et al., 2013). However, there is no report on their capability to degrade hydrocarbons at a pressure higher than the atmospheric one (i.e., 1 bar). In the present Chapter, 3 new isolates provided by the University of Milano, and 1 control strain were subjected to high HP using the aliphatic alkane dodecane (C12) as the sole carbon source.
2.1.1 Materials and Methods
Strains and culture conditions
In the present study, 4 different isolates were grown axenically at 1, 50 and 100 bars. The strains were: Marinobacter hydrocarbonoclasticus (AN_U5) (isolated from polluted sediment of the Ancona harbour); Alcanivorax jadensis 339 and Alcanivorax dieselolei 293 (isolated from surface waters respectively from the Gibraltar strict and the Levantine basin); the well-characterized Alcanivorax borkumensis SK2, one of the most studied hydrocarbon degraders in the literature, was used as a control strain (kindly provided by a Kill•Spill partner, namely Prof. Fernando Rojo, CSIC, partner 7). Cultures were provided with 1% dodecane (C12) and incubated in independent plastic syringes using a marine medium (ONR7a) for 4 days, with no mixing, at 20°C. Experiments were followed according to some typical biochemical parameters (i.e., cell number; ions concentration; dodecane solubility in water; pH value; optical density; O2 respiration; CO2 production; etc.).
Biogas analysis

Grant Agreement no. 312939 Deliverable D4.2 Report on the characterization of high-pressure adapted bacterial communities
2
Oxygen, Nitrogen and Carbon Dioxide were measured in the head-space of the reactors. In fact, plastic syringes were equipped with 3-way valves that allow direct injection into the gas chromatograph (GC). The latter was a Compact GC (Global Analyser Solutions, Breda, The Netherlands) equipped with a Molsieve 5A pre-column and Porabond column (CH4, O2, H2 and N2) and a Rt-Q-bond pre-column and column (CO2, N2O and H2S). Concentrations of gases were determined by means of a thermal conductivity detector (TCD). In order to exclude any effect on the biogas composition in the head-space due to pressure, independent negative controls (i.e., reactors supplied with sterile medium and not inoculated) were prepared in any incubation. Further, reactors undergoing hydrostatic pressure were put at atmospheric pressure 30 to 60 min before being analyzed.
Cell count
Two fluorescent dyes, SYBR® Green I and Propidium Iodide (PI), were used in combination as a viability indicator that differentiates between cells with intact and damaged cytoplasmic membranes (De Roy et al., 2012; Van Nevel et al., 2013). The staining solution was prepared as follows: PI (20 mM in dimethyl sulfoxide (DMSO), from the LIVE/DEAD BacLight Kit, Invitrogen) was diluted 50 times and SYBR® Green I (10,000 times concentrate in DMSO, Invitrogen) was diluted 100 times in 0.22 μm-filtered-DMSO. Water samples were stained with 10 μL/mL staining solution and 10 μL/mL EDTA (pH 8, 500 mM) for outer membrane permeabilization. Before staining, all 1 mL samples were kept at room temperature for 30 min to minimize the effect of staining temperature. Prior to flow cytometric analysis, the stained samples were incubated for 15–20 min in the dark at room temperature.
Flow cytometry was performed using a CyAn™ ADP LX flow cytometer (Dakocytomation, Heverlee, Belgium) equipped with a 50-mW Sapphire solid-state diode laser (488 nm). The stability and performance of the flow cytometer was checked and controlled prior to the experiment by the use of Cyto-Cal Alignment Beads and Cyto-Cal multifluor Fluorescent Intensity Calibrator (Distrilab, Leusden, The Netherlands). Green and red fluorescence were collected with photomultiplier tubes using 530/40 and 613/20 bandpass filters respectively. Forward (FS) and side light scatter (SS) were collected with a 488/10 bandpass filter. Milli-Q water was used as the sheath fluid. All samples were collected as logarithmic signals and were triggered on the green fluorescence channel. For each sample run, data for 20,000 events were collected.
Alkanes analysis
Alkanes were directly extracted from liquid cultures using hexane (99%, Sigma Aldrich) in a ratio 1:1 (v:v). Due to the fact that reactors were represented by plastic syringes, and that alkanes solubility in water is extremely scarce, a relevant part of the supplied alkanes was adsorbed by the plastic itself. Hence, alkanes measurements in the present report refer to a water-soluble fraction of the initially provided alkanes, which is still present at the end of the incubation period. This fraction is equal to the initially supplied amount, to which it must be subtracted: 1, what adsorbed on the plastic; 2, what has been degraded by the cells. Therefore, these analyses represent an indication of culture activity during the course of the incubation, rather than an evaluation of the degradation rate.
Samples were vigorously shaken for 1 min then left to rest for 15 min. The upper layer of such a sample was withdrawn and injected in a GC equipped with a flame ionized detector (FID) equipped with a capillary column HP-5 (Agilent Technologies) (30 m; 0,25 mm). Injection volume was 1µL; injector temperature (splitless) was 270°C; FID detector temperature, 320°C; carrier gas, nitrogen; oven temperature, 60°C.
Statistical analysis
Grant Agreement no. 312939 Deliverable D4.2 Report on the characterization of high-pressure adapted bacterial communities
3
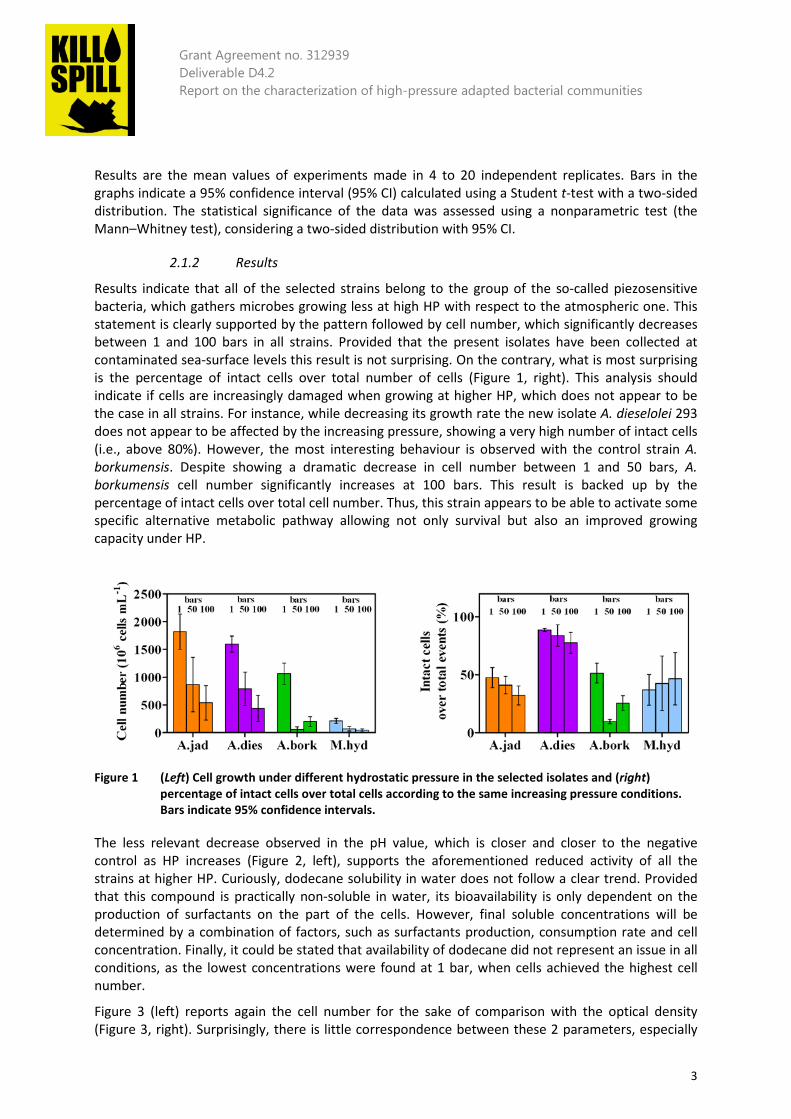
Results are the mean values of experiments made in 4 to 20 independent replicates. Bars in the graphs indicate a 95% confidence interval (95% CI) calculated using a Student t-test with a two-sided distribution. The statistical significance of the data was assessed using a nonparametric test (the Mann–Whitney test), considering a two-sided distribution with 95% CI.
2.1.2 Results
Results indicate that all of the selected strains belong to the group of the so-called piezosensitive bacteria, which gathers microbes growing less at high HP with respect to the atmospheric one. This statement is clearly supported by the pattern followed by cell number, which significantly decreases between 1 and 100 bars in all strains. Provided that the present isolates have been collected at contaminated sea-surface levels this result is not surprising. On the contrary, what is most surprising is the percentage of intact cells over total number of cells (Figure 1, right). This analysis should indicate if cells are increasingly damaged when growing at higher HP, which does not appear to be the case in all strains. For instance, while decreasing its growth rate the new isolate A. dieselolei 293 does not appear to be affected by the increasing pressure, showing a very high number of intact cells (i.e., above 80%). However, the most interesting behaviour is observed with the control strain A. borkumensis. Despite showing a dramatic decrease in cell number between 1 and 50 bars, A. borkumensis cell number significantly increases at 100 bars. This result is backed up by the percentage of intact cells over total cell number. Thus, this strain appears to be able to activate some specific alternative metabolic pathway allowing not only survival but also an improved growing capacity under HP.
Figure 1 (Left) Cell growth under different hydrostatic pressure in the selected isolates and (right)
percentage of intact cells over total cells according to the same increasing pressure conditions. Bars indicate 95% confidence intervals.
The less relevant decrease observed in the pH value, which is closer and closer to the negative control as HP increases (Figure 2, left), supports the aforementioned reduced activity of all the strains at higher HP. Curiously, dodecane solubility in water does not follow a clear trend. Provided that this compound is practically non-soluble in water, its bioavailability is only dependent on the production of surfactants on the part of the cells. However, final soluble concentrations will be determined by a combination of factors, such as surfactants production, consumption rate and cell concentration. Finally, it could be stated that availability of dodecane did not represent an issue in all conditions, as the lowest concentrations were found at 1 bar, when cells achieved the highest cell number.
Figure 3 (left) reports again the cell number for the sake of comparison with the optical density (Figure 3, right). Surprisingly, there is little correspondence between these 2 parameters, especially

Grant Agreement no. 312939 Deliverable D4.2 Report on the characterization of high-pressure adapted bacterial communities
4
in the control strain A. borkumensis. This is most likely due to the high production of surfactants of this strain (Yakimov et al., 1998), which increases medium turbidity while not contributing to the increase in cell number (the latter analysis is carried out by means of flow cytometry using cyber green staining).
Figure 2 (Left) Changes of the pH value at the end of the growth in the selected isolates according to the
hydrostatic pressure; red keys indicate negative controls; bars indicate 95% confidence intervals. (Right) Availability of dodecane in the water phase according to different isolates and hydrostatic pressure. Values indicate the range of concentrations detected.
Figure 3 (Left) Cell number (as shown in Figure 1, left) and (right) Optical Density in the selected isolates
after of 4 days of growth according to the hydrostatic pressure; bars indicate 95% confidence intervals.
As concerns O2 respiration (Figure 4, left), it decreases upon increasing HP in all strains. However, when considering respiration rates per cell number (data not shown), rates increase in A. borkumensis and M. hydrocarbonoclasticus between 1 and 100 bars (between 13 and 24 nmoles O2 10-6 cells in Alcanivorax and between 67 and 104 nmoles O2 10-6 cells in Marinobacter, respectively). The same could not be said about production of CO2, which is here an indirect measurement of dodecane consumption, provided that C12 was in fact the only carbon source supplied. The general decrease observed in all incubation vessels (Figure 4, right) is similar to what observed when such rates are plotted against the cell number. Again, the only exception was Marinobacter were the CO2 production per cell was constant between 1 and 100 bars (data not shown). In general, M. hydrocarbonoclasticus showed a very different trend with respect to all Alcanivorax species tested in the present work. This may be also due to the fact that this strain was isolated from marine sediment

Grant Agreement no. 312939 Deliverable D4.2 Report on the characterization of high-pressure adapted bacterial communities
5
rather than surface waters. However, its applicability in the present conditions is pretty low, provided that its growth rate was the lowest (Figure 1, left).
Figure 4 (Left) O2 respiration and (right) CO2 production in the selected isolates after of 4 days of growth
according to the hydrostatic pressure; bars indicate 95% confidence intervals. Red keys indicate negative controls.
2.1.3 Transcriptomic response in Alcanivorax strains
Preliminary results concerning the transcriptomic responses in A. borkumensis and A. dieselolei at 1 and 100 bars are discussed here. These two strains show a different strategy in response to HP: while in the first cell concentration and cell integrity go up again at 100 bars (Figure 1), in A. dieselolei cell damage is very little despite HP increases. This trend is also observed in gene expression: the number of up-regulated genes in A. borkumensis is about 26% of the overall number of genes, while in A. dieselolei it concerns only the 7%. Further, in A. borkumensis numerous different pathways are up-regulated, while in A. dieselolei up-regulated genes show little variability, being all related to ribosomal proteins, elongation factors, ATP synthase subunits and Fe-S proteins (with a factor up to 4.5 in a log2 scale). As such genes are clearly overexpressed also in A. borkumensis as a response to HP (with a factor up to 5 in a log2 scale), it could be stated that in piezosensitive bacteria supplied with hydrocarbons this represents a typical response. Concerning the increased expression of ATP and Fe-S proteins we could indeed confirm that PO4
3- and SO42- consumption per cell increases in A.
dieselolei in a linear way (Figure 5), following the increase in HP. In A. borkumensis this trend is less clear, at least for PO4
3- consumption. Other possible explanations for such increased consumption rates in these ions (e.g., polyphosphates bodies accumulation) cannot be ruled out. However, due to the extremely low biomass amounts gained under high pressure, these analyses are particularly hard to attain in a practical way.

Grant Agreement no. 312939 Deliverable D4.2 Report on the characterization of high-pressure adapted bacterial communities
6
Figure 5 (Left) PO4
3- and (right) SO42- consumption in A. dieselolei and A. borkumensis at increasing HP
pressures (1, 50 and 100 bars).
It must be stressed that consumption of SO42- increases despite O2 was available (Figure 4), meaning
that its use was not due to the fact that cells underwent anaerobiosis. In A. borkumensis a number of pathway is activated by pressure: in particular, all genes associated with the TCA cycle are up-regulated, as well as those involved in L-leucine biosynthesis and the fatty acid metabolism. All the genes associated with the production of the osmolite ectoine are up-regulated in A. borkumensis, thus indicating that production of this compound intracellularly may help protecting cells from the mechanical stress induced by HP. Interestingly enough, this response is completely absent in A. dieselolei, which must possess another strategy to show such a low cell damage at increased HP (Figure 1). Further, expression of genes related to many type II and type IV secretion pathways proteins and pili formation proteins are up-regulated under pressure in A. borkumensis, as also those related to nitrogen uptake and assimilation, the alkane-1-monooxygenase and several cytochromes P450 and those involved in cell division. As a whole, in A. borkumensis the main pathways stimulating and supporting cell growth are up-regulated, being the mechanical stress due to HP counter-balanced by the expression of an osmolite. On the other hand, A. dieselolei is more recalcitrant to adaptation: despite showing a high resistance to HP, its response is more passive.
2.1.4 Conclusion and Perspective
A. dieselolei 293 and A. borkumensis SK2 showed interesting capabilities at increasing HP, namely, a high resistance to cell damage and an improved growth rate, respectively. Preliminary transcriptomic data show that in A. borkumensis an active reaction to HP occurs, which opens up the main metabolic pathways for growth, while in A. dieselolei HP is counter-balanced in a passive way, being the reason for its low cell damage at high HP still unclear. It may be hypothesised that in this strain the lack of cell damage may actually prevent the induction of an active response to the stressing HP.
2.2 Collection and characterization of deep-sea samples from the Atlantic Ocean
2.2.1 Preliminary considerations
Oil degradation at HP is a very harsh condition to cope with for bacteria. Because of the nature of alkanes, cells do not have physical access to the carbon source, a condition that reasonably reduces both bacterial growth and alkanes consumption rates. Nevertheless, aside anthropogenic activities, these compounds are normally present in the environment as a result of natural activities (e.g., in marine oil seeps) (Head et al., 2006). Thus, degradation pathways for oil are widespread among microbes, contrary to what could be stated for HP resistance. Following the preliminary results described in Chapter 2.1, HP was in fact shown to be by far the most stressing condition for bacterial

Grant Agreement no. 312939 Deliverable D4.2 Report on the characterization of high-pressure adapted bacterial communities
7
growth even in marine microbes. Thus, collection of fresh deep-sea samples was considered as a fundamental step to improve LabMET capability of investigating bioprocesses at high HP.
In June 2014, LabMET attended a 10-day sampling campaign in the Atlantic Ocean, on board of the Belgian Research Vessel Belgica. The area of interest for the sampling campaign was the Western Iberian Margin (Figure 6). This site has not been interested by any oil-spill recently, which is ideal for the purpose of the sampling campaign. In fact, microbial community shifts following an oil-spill are inevitable and rather strong phenomena (see reference in Chapter 1). Thus, collection of samples at high HP contaminated by an oil-spill would result in a strong reduction of the biodiversity of that microbial population, thereby also limiting all the potential metabolic pathways of the community itself. As the main target of LabMET within WP4 is to understand how such pathways are triggered and how a microbial population at deep-sea is affected when alkanes are the main carbon source, a uncontaminated environmental sample was ideal. Second but not less relevant point is that such an approach allowed testing one alkane of interest at a time, thereby facilitating physiological studies and cause-effect responses related to the biodegradation of that compound.
Figure 6 Sampling area and collection sites during the Belgica Campaign between 2nd and 10th of June,
2014. In particular, samples of interest for Kill•Spill are highlighted in yellow and are called Deep-Stations, where water deepness was 1 km, equivalent to 100 bars.
2.2.2 Results
At the end of the campaign, about 30 samples were collected from this area. Sampling sites were both the upper aerobic layer and the anaerobic sub-seafloor. Sediment samples were collected at both 300 and 1000 m water depth (equivalent to 30 to 100 bars HP, respectively). A general characterization of all samples was conducted in order to get some basic information on what characterizes deep-sea samples at 1 km, in terms of microbial community and biochemical features (such as pH, ions concentrations [Cl-, NO2
-, NO3-, PO4
3-, SO42-], cell number [using filters at 1.5 and 25
µm]).

Grant Agreement no. 312939 Deliverable D4.2 Report on the characterization of high-pressure adapted bacterial communities
8
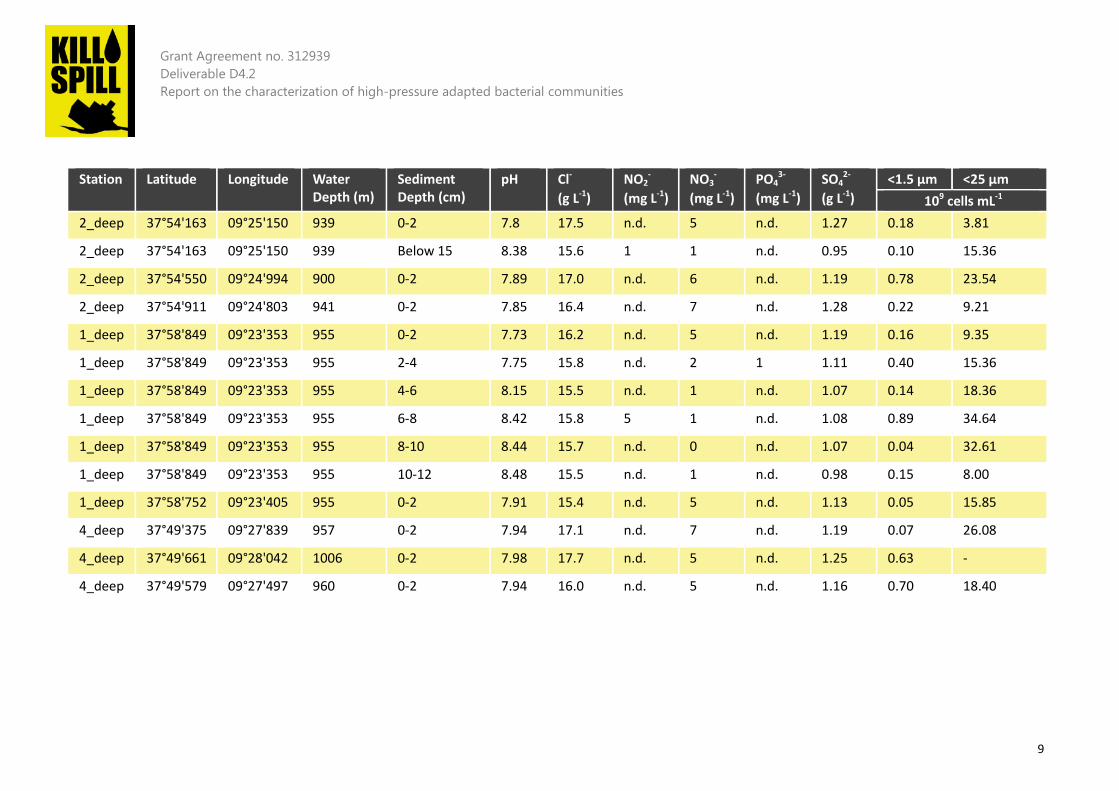
Table 1 Main features of all the samples collected in the Atlantic Ocean (Western Iberian Margin)
Station Latitude Longitude Water Depth (m)
Sediment Depth (cm)
pH Cl- (g L-1)
NO2-
(mg L-1) NO3
- (mg L-1)
PO43-
(mg L-1) SO4
2- (g L-1)
<1.5 µm <25 µm 109 cells mL-1
6(2) 37°55'455 09°06'934 294 10-17 8.87 14.4 7 1 n.d. 0.62 0.65 4.65
6(2) 37°55'530 09°07'031 296 10-17 8.88 15.0 n.d. 2 n.d. 0.67 0.14 8.02
7(2) 37°47'881 09°05'360 293 0-3 8.22 14.1 7 1 n.d. 0.56 1.02 1.17
7(2) 37°47'448 09°05'430 295 0-5 8.49 14.7 7 1 n.d. 0.58 0.12 0.91
7(2) 37°47'494 09°05'442 295 10-15 8.91 13.7 n.d. 1 n.d. 0.52 0.07 2.19
7(2) 37°47'494 09°05'442 295 5-10 8.82 15.3 8 1 n.d. 0.64 0.05 1.73
7(1) 37°48'488 09°05'447 299 10-15 8.94 12.7 4 1 n.d. 0.60 0.13 9.77
6(2) 37°55'590 09°06'997 300 5-10 8.98 14.8 4 1 n.d. 0.64 0.03 5.26
6(3) 37°56'498 09°07'486 323 Below 15 8.83 12.0 5 1 n.d. 0.48 0.09 3.86
6(3) 37°56'670 09°07'486 325 Below 15 8.91 14.4 7 1 n.d. 0.61 0.06 3.77
4(3) 37°47'997 09°06'911 330 Below 15 8.84 14.8 n.d. 0 n.d. 0.69 0.04 10.66
4(2) 37°49'364 09°06'897 330 Below 15 8.8 16.1 5 1 n.d. 0.83 0.24 2.51
3_deep 37°51'450 09°27'752 996 Below 15 8.57 16.6 n.d. 1 n.d. 1.07 0.03 40.38
3_deep 37°51'450 09°27'752 996 0-2 7.82 15.9 10 6 n.d. 1.09 0.02 32.27
3_deep 37°51'595 09°27'324 950 0-2 7.83 19.7 n.d. 8 n.d. 1.40 0.23 13.09
3_deep 37°51'595 09°27'324 950 Below 15 8.56 16.5 n.d. 1 n.d. 1.06 0.33 15.09
Grant Agreement no. 312939 Deliverable D4.2 Report on the characterization of high-pressure adapted bacterial communities
9
Station Latitude Longitude Water Depth (m)
Sediment Depth (cm)
pH Cl- (g L-1)
NO2-
(mg L-1) NO3
- (mg L-1)
PO43-
(mg L-1) SO4
2- (g L-1)
<1.5 µm <25 µm 109 cells mL-1
2_deep 37°54'163 09°25'150 939 0-2 7.8 17.5 n.d. 5 n.d. 1.27 0.18 3.81
2_deep 37°54'163 09°25'150 939 Below 15 8.38 15.6 1 1 n.d. 0.95 0.10 15.36
2_deep 37°54'550 09°24'994 900 0-2 7.89 17.0 n.d. 6 n.d. 1.19 0.78 23.54
2_deep 37°54'911 09°24'803 941 0-2 7.85 16.4 n.d. 7 n.d. 1.28 0.22 9.21
1_deep 37°58'849 09°23'353 955 0-2 7.73 16.2 n.d. 5 n.d. 1.19 0.16 9.35
1_deep 37°58'849 09°23'353 955 2-4 7.75 15.8 n.d. 2 1 1.11 0.40 15.36
1_deep 37°58'849 09°23'353 955 4-6 8.15 15.5 n.d. 1 n.d. 1.07 0.14 18.36
1_deep 37°58'849 09°23'353 955 6-8 8.42 15.8 5 1 n.d. 1.08 0.89 34.64
1_deep 37°58'849 09°23'353 955 8-10 8.44 15.7 n.d. 0 n.d. 1.07 0.04 32.61
1_deep 37°58'849 09°23'353 955 10-12 8.48 15.5 n.d. 1 n.d. 0.98 0.15 8.00
1_deep 37°58'752 09°23'405 955 0-2 7.91 15.4 n.d. 5 n.d. 1.13 0.05 15.85
4_deep 37°49'375 09°27'839 957 0-2 7.94 17.1 n.d. 7 n.d. 1.19 0.07 26.08
4_deep 37°49'661 09°28'042 1006 0-2 7.98 17.7 n.d. 5 n.d. 1.25 0.63 -
4_deep 37°49'579 09°27'497 960 0-2 7.94 16.0 n.d. 5 n.d. 1.16 0.70 18.40

Grant Agreement no. 312939 Deliverable D4.2 Report on the characterization of high-pressure adapted bacterial communities
10
The main target for Kill•Spill in order to test hydrocarbons degradation at deep-sea were aerobic samples collected at 1000 m water depth. The presence of molecular O2 at the upper layer provides the best electron acceptor to observe fast bacterial growth and high alkanes consumption rates. Some general considerations on the collected samples could be done:
1. All samples are characterized by a high number of cells (between 106 and 109 cells mL-1) that are smaller than 1.5 µm;
2. Cell number (when using a 25 µm filter) was significantly higher at 1000 m rather than at 300 m;
3. Aerobic samples from the upper layer showed a lower pH than anaerobic samples from sub-seafloor;
4. Samples from 1000 m had a lower pH than samples at 300 m; 5. The amounts of sulphates at 300 m was lower than that at 1000 m; 6. The amount of sulphates in anaerobic samples was lower than that in aerobic samples.
Some of these considerations (such as point 3 and 6) are rather obvious. However, it was surprising to note that the number of cells (using a filter of 25 µm) was much higher at 1 km than at 300 m, and up to 40 *109 cells mL-1. This is an incredibly high number of cells, which can be hardly achieved with standard reactors and/or processes in a laboratory. A thorough characterization using Illumina-based gene sequencing was conducted (Figure 7).
On average, each sample had a number of OTU between 800 and 1000, which confirms the wide biodiversity of all samples. Up to about 1000 OTU could not be identified, meaning that they belong to strains that are unknown to date. In particular, the most represented OTU in the aerobic deep-sea samples of interest for alkanes degradation within Kill•Spill were:
1. Archea: Thaumarchaeota; 2. Bacteria: Acidobacteria, Bacteroidetes, Chloroflexi, Gemmatimonadetes, NC10, Nitrospirae,
Planctomycetes, Proteobacteria.
2.2.3 Conclusions
Samples collected at deep-sea showed an incredibly high biodiversity and cell number. Both these features are relevant to test how microbial community will behave when alkanes will be selected as the sole carbon source. These samples will be used in the coming experiments (as described in Chapter 2.3).

Grant Agreement no. 312939 Deliverable D4.2 Report on the characterization of high-pressure adapted bacterial communities
11
Figure 7 Analysis of the microbial community sampled at deep sea using Illumina-based sequencing
(metagenome analysis conducted using RAST).
2.3 Piezophilic eicosane (C20) degrading bacteria from deep-sea
2.3.1 Introduction
Piezophilic bacteria are a group of bacteria showing higher growth rate under high HP respect to that at atmospheric pressure (1 bar). Some of these include Colwellia (an obligate piezophile), Pyrococcus (hyperthermophile), Shewanella, Photobacterium, Psycromonas (psycrophile), Dehalococcoidetes and Moritella (Zeng et al., 2009; Kato, 2011; Kaster et al., 2014). In the present study, samples collected at deep-sea and described in Chapter 2.2 were subjected to different culture conditions (aerobiosis and anaerobiosis; different HPs) in order to identify how microbial community changes as a response to pressure when alkanes are used as the sole carbon source. In particular, eicosane (C20) was used as target alkane. The rationale was to use a solid compound (at ambient temperature and pressure) as it has higher chances to eventually drop to the seafloor after a spill with respect to

Grant Agreement no. 312939 Deliverable D4.2 Report on the characterization of high-pressure adapted bacterial communities
12
lighter compounds. Further, this choice was motivated by the fact that there are plenty of studies investigating light hydrocarbons and their catabolism, while little is known about biodegradation of long-chain hydrocarbons like C20 (Rojo, 2009).
2.3.2 Materials and Methods
One sample collected at a water depth of 1 km (equal to 100 bars) from the upper aerobic layer of the seafloor was incubated under different conditions of pressure and O2 availability and spiked with a long-chain aliphatic alkane (eicosane, C20). Pressure was set to 1, 100 and 200 bars using pressure vessels of 200 mL. O2 was delivered using a high-pressure air line up to 20 bars, and HP was used to top up the pressure to 100 or 200 bars. Since O2 could not be provided to 1-bar-reactors in the same manner, another reactor (made of a 1-L glass bottle) was set-up, with a liquid-gas ratio of 200:800 mL. Hence, the setup allowed to test 4 different conditions: 3 aerobic (1, 100 and 200 bars) and 1 anaerobic (1 bar). Control reactors at 1 bar (aerobic) with either A) C20 and no sediment or B) sediment and no C20 were adopted. Incubation time was set to 10 days, after which 10% of the culture was moved to another reactor with the same initial conditions, in order to repeat the incubation cycle. Up to 9 cycles in a row were conducted, equivalent to 90 days of enrichment. At the end of any incubation, typical biochemical parameters were followed, such as: pH value, dissolved O2 concentration, phosphates and sulphates concentration, optical density, cell number.
2.3.3 Results
The use of C20 as the sole carbon source was successful in all culture conditions. All reactors showed an initial increase in cell number using 25 µm filters, while information using filters at 1.5 µm was less clear. The fact that the cell number may decrease during the enrichment may reveal the loss of a specific bacterium or group of bacteria that are not dividing as fast as the others, but are bringing some functional activity for the whole consortium. On the other hand, unstable values observed using 1.5 µm filters are due to the fact that cells cluster in groups (data not shown), which are only observed at the microscope when 25 µm filters are used. Thus, the key message of this analysis is actually to observe that cells in the range of 106 cells mL-1 are as present in the environmental sample as in the enriched community, and that a general growing trend is observed when using a larger filter (Figure 8, right). Further, Fig. 8 also shows which microbial populations are the most active. As expected, those at 1 and 100 bars under aerobic conditions are the ones with the highest cell number (Figure 8, right). This may be due to the fact that: 1, the sampling device adopted at deep-sea was not able to maintain the pressure while being brought back on-board, meaning that hyperpiezophilic bacteria unable to cope with low pressures may have been affected during sampling; 2, as 100 bars is the native pressure of the sample, this was clearly an ideal condition for the cells with respect to 200 bars. Most interestingly, a general trend towards a higher consumption of phosphates is observed when pressure increases under aerobiosis, being statistically significant only between 1 and 200 bars. This information needs to be confirmed by molecular techniques revealing what pathway is actually triggered by pressure in these conditions. As concerns sulphates (Figure 9, right), results indicate that indeed the anaerobic reactor was the only one in which sulphates were significantly consumed, while all the other conditions did not differ from both negative controls.

Grant Agreement no. 312939 Deliverable D4.2 Report on the characterization of high-pressure adapted bacterial communities
13
Figure 8 Cell number using a 1.5 µm filter (left) or a 25 µm filter (right) during the enrichment with C20 in different conditions of pressure and O2 availability. Note that cells in the left panel are on a scale 103 higher than the right one. Keys reported in the graph
Figure 9 Average of phosphates (left) and sulphates (right) concentration at the end of each of the 9
incubations in different culture conditions. Bars indicate 95% CI. Significance of the data (in boxes) was assessed through a Mann-Whitney test.

Grant Agreement no. 312939 Deliverable D4.2 Report on the characterization of high-pressure adapted bacterial communities
14
Dissolved O2 concentration (Figure 10, left) indicate that in all reactors respiration was highly active, being the 1-L glass bottle at 1 bar the only condition where an excess of oxygen was observed. When compared to sulphates consumption, these results suggest that all aerobic reactors may have experienced hypoxic conditions. The trend observed in the pH value confirms that a high biological activity (and- indirectly- C20 degradation) was achieved in all reactors. The most active was the one at 1 bar under aerobic conditions, in support of its high cell number. However, cultures at 100 and 200 bars also had a lower value than controls (about 6.0-6.2 vs. 7.5, respectively).
Figure 10 Dissolved O2 concentration (left) and pH value (right) at the end of each 10-day incubation during the enrichment, according to different culture conditions. Keys reported in the graph
Optical density at 610 nm was assessed to back up flow cytometry analysis (Figure 11, left). The initial decreasing trend in all samples is due to the removal, one incubation after the other, of the marine sediment itself. It could be stated that after 30 days (equal to serial 3 incubations, thus a dilution factor of 103) the impact of the sediment was negligible (Figure 11, right). Eventually, the OD at 200 bars was the highest, while all other conditions had a comparable value. This is also due to the colour of the pellet itself, which is orange, grey and finally black between 1, 100 and 200 bars, respectively.
Figure 11 Optical Density at 610 nm (left) and a detail of the same analysis during the last 60 days of
incubation (right) according to different culture conditions. Keys reported in the graph
Availability of the carbon source was assessed through chromatographic analysis. However, C20 could only be detected in the water phase at 200 bars (data not shown). Despite this, the hydrophobicity test conducted during the course of the enrichment (Figure 12) did not show a particular trend, except for cultures at 1 bar under aerobiosis, which had the lowest hydrophobicity value. In this test, cells are pelleted, resuspended in a saline buffer and incubated with C16 (hexadecane). Optical density (OD) is measured before and after incubation with C16, in order to detect possible variations. In case the OD decreases, cells have moved upwards towards the oil

Grant Agreement no. 312939 Deliverable D4.2 Report on the characterization of high-pressure adapted bacterial communities
15
floating in the upper part of the cuvette. On the contrary, an increased OD will be the result of lyophobic cells moving downwards, far from C16. This test is normally carried out to evaluate the affinity of the cells towards a water immiscible carbon source (e.g., oil), meaning that a physical separation with respect to the carbon source would clearly limit growth and bioremediation rates. However, the present results are surprising and, given the rest of the analyses conducted in this study, they may suggest that the significance of this test for alkanes biodegradation experiments could be less significant than what expected.
Figure 12 Hydrophobicity test (with respect to hexadecane, C16) after 30, 60 and 90 days of incubation
Finally, a DGGE was run to check whether an actual enrichment was taking place. Results were very promising, as several bands were enriched during the course of 90 days of incubation (Figure 13). In particular, the different culture conditions applied enabled to physically separate some strains growing only at 100 and 200 bars (blue boxes, piezophiles) from those observed only at 1 bar (red boxes, piezosensitives). Some piezotolerant bacteria (green boxes) can be noted as well, indicating those strains able to grow well at both atmospheric and high HP.

Grant Agreement no. 312939 Deliverable D4.2 Report on the characterization of high-pressure adapted bacterial communities
16
Figure 13 DGGE of the C20-degrading marine communities between 10 and 90 days of incubation in all
culture conditions. Keys: Boxes: Red, piezosensitive bacteria; Green, piezotolerant bacteria; Blue, piezophilic bacteria.
2.3.4 Conclusions and perspectives
In all conditions, C20 was actively degraded. Bacterial communities actually shifted according to their culture conditions (O2 availability and pressure). Mostly, our setup was successful in physically separating piezosensitive from piezophilic communities. A number of steps are now foreseen to get some more insights on high HP resistant hydrocarbon degraders, as:
1) identification through gene sequencing of the different bacterial communities enriched in each condition;
2) isolation of the most interesting species and thorough characterization of their features; 3) analysis of the metaproteome of each microbial community.

Grant Agreement no. 312939 Deliverable D4.2 Report on the characterization of high-pressure adapted bacterial communities
17
3 References
Bertrand, Erin M., et al. "Identity and mechanisms of alkane-oxidizing metalloenzymes from deep-sea hydrothermal vents." Frontiers in microbiology 4 (2013).
De Roy, K., L. Clement, O. Thas, Y. Wang and N. Boon (2012). "Flow cytometry for fast microbial community fingerprinting." Water Research 46(3): 907-919.
Grossi, Vincent, et al. "Hydrostatic pressure affects membrane and storage lipid compositions of the piezotolerant hydrocarbon-degrading Marinobacter hydrocarbonoclasticus strain# 5." Environmental microbiology 12.7 (2010): 2020-2033.
Hazen, Terry C., et al. "Deep-sea oil plume enriches indigenous oil-degrading bacteria." Science 330.6001 (2010): 204-208.
Head, Ian M., D. Martin Jones, and Wilfred FM Röling. "Marine microorganisms make a meal of oil." Nature Reviews Microbiology 4.3 (2006): 173-182.
Joye, Samantha B., Andreas P. Teske, and Joel E. Kostka. "Microbial dynamics following the Macondo oil well blowout across Gulf of Mexico environments." BioScience 64.9 (2014): 766-777.
Kaster, A, K Mayer-Blackwell, B Pasarelli, and AM Spormann. 2014. Single Cell Genomic Study of Dehalococcoidetes species from deep-sea sediments of the Peruvian Margin. The ISME Journal 1: 1-12.
Kato, C. 2011. Distribution of Piezophiles. In: Horikoshi, K (ed.). Extremophiles Handbook. New York: Springer.
Lai, Qiliang, et al. "Alcanivorax marinus sp. nov., isolated from deep sea water of Indian Ocean." International journal of systematic and evolutionary microbiology (2013): ijs-0.
Liu, Chenli, and Zongze Shao. "Alcanivorax dieselolei sp. nov., a novel alkane-degrading bacterium isolated from sea water and deep-sea sediment." International Journal of Systematic and Evolutionary Microbiology 55.3 (2005): 1181-1186.
Lu, Zhenmei, et al. "Microbial gene functions enriched in the Deepwater Horizon deep-sea oil plume." The ISME journal 6.2 (2011): 451-460.
Mason, Olivia U., et al. "Metagenome, metatranscriptome and single-cell sequencing reveal microbial response to Deepwater Horizon oil spill." The ISME journal 6.9 (2012): 1715-1727.
Rojo, Fernando. "Degradation of alkanes by bacteria." Environmental microbiology 11.10 (2009): 2477-2490.
Schedler, Martina, et al. "Effect of high pressure on hydrocarbon-degrading bacteria." AMB Express 4.1 (2014): 77.
Schwarz, J. R., J. D. Walker, and R. R. Colwell. "Deep-sea bacteria: growth and utilization of hydrocarbons at ambient and in situ pressure." Applied microbiology 28.6 (1974): 982-986.
Schwarz, J. R., J. D. Walker, and R. R. Colwell. "Deep-sea bacteria: growth and utilization of n-hexadecane at in situ temperature and pressure." Canadian journal of microbiology 21.5 (1975): 682-687.
Van Nevel, S., S. Koetzsch, H.-U. Weilenmann, N. Boon and F. Hammes (2013). "Routine bacterial analysis with automated flow cytometry." Journal of Microbiological Methods 94(2): 73-76.
Yakimov, Michail M., et al. "Alcanivorax borkumensis gen. nov., sp. nov., a new, hydrocarbon-degrading and surfactant-producing marine bacterium." International journal of systematic bacteriology 48.2 (1998): 339-348.
Zeng, X, J Birrien, Y Foquet, G Cherkashov, M Jebbar, J Querellou, P Oger, M Cambon-Bonavita, X Xiao, and D Prieur. 2009. Pyrococcus CH1, an Obligate Piezophilic Hyperthermophile: Extending the Upper Pressure-Temperature Limits for Life. The ISME Journal 3: 873-876.