kim heng offshore & marine holdings limited€¦ · kim heng offshore & marine holdings...
TRANSCRIPT

Kim Heng Offshore & Marine Holdings Limited
Date: 2 November 2017
Non Rated
KHOM SP
Price: S$0.104 (as at 1st November 2017)
Market capitalisation S$73.8 million
Current price S$0.104
Shares outstanding 710,000,000
Free Float 24.1%
Major shareholders Tan Keng Siong 42.69%
Credence Partners Pte Ltd* 17.61%
Recommendation of
other brokers
N/A
Key Historical Financials
Year ended December (S$’000) FY2012 FY2013 FY2014 FY2015 FY2016
Revenue 86,728 84,813 77,978 51,757 31,364
% Growth N/A (2.2%) (8.1%) (33.6%) (39.4%)
Gross profit 31,177 36,454 26,964 13,550 8,403
Gross profit margin 42.9% 43.0% 34.6% 26.2% 26.8%
Profit/(loss) before tax 21,102 20,346 5,814 (4,722) (17,814)
Profit/(loss) before tax margin 24.3% 24.0% 7.5% (9.1%) (56.8%)
Profit/(loss) attributable to owners 17,285 17,093 5,617 (4,934) (17,828)
EPS/(LPS) (Singapore cents) 3.1 3.1 0.8 (0.7) (2.5)
P/E (x) 4.3 4.3 13.1 N/A N/A
P/B (x) 1.7 1.3 0.8 0.8 0.8
Net Debt/Equity 40.6% 8.1% Net cash Net cash 5.4%1
Source: Company data, Bloomberg, SAC Advisors
Integrated O&M Value Chain Services
Provider
A leading offshore & marine value chain services
provider. Kim Heng Offshore & Marine Holdings Limited
and together with its subsidiaries, (“Kim Heng”,
“Company” or the “Group”) is an established integrated
offshore and marine value chain services provider. The
Group offers a one-stop comprehensive range of
products and services that caters to different stages of
offshore oil and gas projects from oil exploration to field
development and oil production.
Strong balance sheet strength with ample dry
powder for acquisitions. The Company’s prudent
management of their balance sheet have seen them
maintain a net debt to equity of 21.3% in their latest
financial quarter 2QFY18. The Company also has about
S$7 million in IPO proceeds that have not been utilised.
The Group has also secured a long-term 5-year vessel
loan of S$5 million which they secured from United
Overseas Bank (“UOB”) and will be available to be drawn
down in 3QFY18. These moves ensure that the Group
remains in a favourable position to take advantage of
good opportunities that come their way.
Established brand name and management team. The
Group has a track record of over 40 years and an
experienced management team. This was demonstrated
by the strategic decision undertaken by management in
2014 to prudently manage their cash resources when
they anticipated that the market would correct as it was
flushed with an oversupply of assets. Management had
taken the active decision to avoid over-leveraging their
balance sheet despite many of their peers taking on
additional debt to invest.
Key risks: (i) Dependent on the state of the offshore oil
& gas (“O&G”) industry.Analyst
Terence Chua +65 6221 5590
Share price 1M 3M 6M 1Y
Kim Heng 48.6% 30.0% 30.0% 48.6%
Catalist Index (2.4)% (7.6)% 10.1% 8.7%
S$
^EPS is computed based on the profit from continuing operations attributable to owners of the company divided by total shares outstanding
0.05
0.07
0.09
0.11
Oct 2016 Jan 2017 Apr 2017 Jul 2017 Oct 2017
*Credence Capital Fund II (Cayman) Limited is a private equity investment fund
managed by Credence Partners Pte. Ltd. on a discretionary basis in accordance with
the operating and investment conditions and other terms of the management
agreement under which Credence Partners Pte. Ltd. is appointed. The shareholders
of Credence Partners Pte. Ltd. are Mr Tan Chow Boon, Mr Koh Boon Hwee and Mr
Seow Kiat Wang who each have a shareholding of 33.33%. Mr Tan Chow Boon, Mr
Koh Boon Hwee, Mr Seow Kiat Wang and Credence Partners Pte. Ltd. are deemed
to be interested in all the shares held by Credence Capital Fund II (Cayman) Limited.

Kim Heng Offshore & Marine Holdings Limited
2
Business Overview:
Kim Heng is an established
integrated offshore and marine
value chain services provider.
Strategically based in Singapore,
the Group offers a one-stop
comprehensive range of products
and services that caters to
different stages of offshore oil
and gas projects from oil
exploration to field development
and oil production. Kim Heng has
built its brand over the years and
has established relationships with
world renowned customers from
over 25 countries in the regions
of Southeast Asia, USA, Latin
America, Australasia, Middle East
and Europe.
Investment Highlights
A leading offshore & marine value chain services provider. Kim
Heng is an established integrated offshore and marine value chain
services provider. The Group offers a one-stop comprehensive range
of products and services that caters to different stages of offshore oil
and gas projects from oil exploration to field development and oil
production.
The Group’s operations are primarily located in Singapore, with two
shipyards strategically located at 9 Pandan Crescent and 48 Penjuru
Road. The shipyards, with a combined waterfront of 205 metres,
enable Kim Heng to carry out a multitude of services, including
offshore rig repair, maintenance and refurbishment, fabrication, vessel
newbuilding as well as painting and blasting works. As a one stop
solutions provider, the group has a fleet of quality cranes which
consists of crawler cranes, lorry cranes and mobile cranes for both
sale and rent. It also provides other services such as maintenance,
trading and sale of heavy equipment.
The Company also recently moved into their headquarters to their new
4-storey office/warehouse building at 48 Penjuru Road to take
advantage of the extended waterfront lease. Their yards combined
waterfront of 205 metres at 9 Pandan Crescent and 48 Penjuru Road
enable them to carry out afloat repairs, fabrication newbuild, painting
and blasting works.
Strong balance sheet strength with ample dry powder for
acquisitions. The Company’s prudent management of their balance
sheet have seen them maintain a net debt to equity of 21.3% in their
latest financial quarter 2QFY18. The Company also has about S$7
million in IPO proceeds that have not been utilised. The Group has
also secured a long-term 5-year vessel loan of S$5 million which they
secured from UOB and will be available to be drawn down in 3QFY18.
These moves ensure that the Group remains in a favourable position
to take advantage of good opportunities that come their way. We saw
this when they acquired three 130-ton bollard vessels in August this
year at a steep discount in a bank sale.
Established brand name and management team. The Group has a
track record of over 40 years and an experienced management team.
This was demonstrated by the strategic decision undertaken by
management in 2014 to prudently manage their cash resources when
they anticipated that the market would correct as it was flushed with an
oversupply of assets. Management had taken the active decision to
avoid over-leveraging their balance sheet despite many of their peers
taking on additional debt to invest. The Group is now exploring
strategic growth plans and acquisitions that will help complement their
existing business offerings.
Revenue Geographical Breakdown (FY2016)
Singapore USA Australia Others
57.8%
16.0%
6.9%
19.3%
Source: Company data, SAC Advisors

Kim Heng Offshore & Marine Holdings Limited
3
Company Background
▪ With over 40 years of experience, Kim Heng Offshore & Marine
Holdings Limited is an established integrated offshore and marine value
chain services provider. Strategically located in Singapore, the Group
offers a one-stop comprehensive range of products and services that
caters to different stages of offshore oil and gas projects from oil
exploration to field development and oil production.
▪ The Group’s operations are primarily located in Singapore, with two
shipyards strategically located at 9 Padan Crescent and 48 Penjuru
Road. The shipyards, with a combined waterfront of 205 metres, enable
Kim Heng to carry out a multitude of services, including offshore rig
repair, maintenance and refurbishment, fabrication, vessel newbuilding
as well as painting and blasting works.
▪ Kim Heng has built its brand over the years and has established
relationships with world renowned customers from over 25 countries in
the regions of Southeast Asia, USA, Latin America, Australasia, Middle
East and Europe.
▪ Their core business can be categorised into three business segments:
(a) Offshore Rig services;
(b) Supply Chain management; and
(c) Heavy Equipment Sale and Rental.
Business segments
Revenue Breakdown (FY2016)
Marine offshore support services incomeChartering and towage incomeFreight services incomeEquipment rental incomeSale of goodsVessels newbuild
34.4%
Source: Company data, SAC Advisors
26.4%
1.5%
*Freight services income did not contribute
any revenue in FY16, this segment
contributed 0.1% to total revenue in FY15.
Offshore Rig Services Supply Chain management Heavy Equipment Sale & Rental
Construction and fabrication
works of sections or
components of drilling rigs
and drillships.
Installation of offshore
production modules and
systems.
Afloat repairs, maintenance
and refurbishment of
offshore rigs platforms &
vessels.
Provision of logistics,
general shipping and crew
management.
Provision of offshore supply
vessels and heavy-lift
equipment.
Leasing, sale, maintenance,
import and export of heavy
equipment.
Wide range of equipment
and machineries including
crawler, lorry and mobile
cranes.
22.4%
15.2%

Kim Heng Offshore & Marine Holdings Limited
Corporate Structure
History
Kim Heng was first founded by Mr Tan Eng Hai in 1968 and was
incorporated on 29 April 2013 in Singapore under the Companies Act as a
private company limited by shares, under the name “Namilton Pte. Ltd.”
Pursuant to the Restructuring Exercise, which was completed on 22 May
2013, the Company became an investment holding company. On 27
December 2013, the name was changed to “Kim Heng Offshore & Marine
Holdings Limited” in connection with the conversion of the Company to a
public company limited by shares.
Subsidiaries
The principal activities of the subsidiaries are as follows:
a) Kim Heng Offshore & Marine Pte Ltd (formerly known as Kim Heng
Holdings Pte Ltd): Investment holding
b) Alpine Progress Shipping Pte Ltd: Vessel chartering and provision of port
operating services
c) Kim Heng Marine & Oilfield Pte Ltd: Chartering, freight, servicing and
repair of vessels, provision of services of marine engineers, consultants,
sub-contractors and labour supply
4
Source: Company data, SAC Advisors
Kim Heng
Offshore &
Marine Holdings
Limited
Kim Heng
Offshore &
Marine Pte Ltd
Kim Heng
Marine &
Oilfield Pte Ltd
Kim Heng
Tubulars Pte
Ltd
Kim Heng
Shipbuilding &
Engineering Pte
Ltd
KH Mazu
Offshore &
Marine Sdn.
Bhd.
Alpine Progress
Shipping Pte
Ltd
Kim Heng
Maritime Pte Ltd
Kim Heng
Heavy
Equipment Pte
Ltd

Kim Heng Offshore & Marine Holdings Limited
5
Corporate Structure
d) Kim Heng Heavy Equipment Pte Ltd: Lease, sale, repair and
maintenance and after sale services of cranes and industrial
equipments
e) Kim Heng Tubulars Pte Ltd: Trading in drill pipes and related drilling
materials, provision of services and rental of marine equipment
f) Kim Heng Maritime Pte Ltd: Vessel chartering and provision of port
operation services
f) Kim Heng Shipbuilding & Engineering Pte. Ltd.: Offshore engineering,
shipbuilding and fabrication services
g) KH Mazu Offshore & Marine Sdn Bhd: Repairing and/or docking of
ships and other kinds of vessels, supply chain and crew management,
heavylift equipment, rental and investment holding
Corporate Developments
In 2006, amidst rising demand from the shipbuilding industry, Kim Heng
Shipbuilding & Engineering Pte Ltd was incorporated to undertake
shipbuilding projects. They also increased rig fabrication activities by
fabricating blocks for the construction of semisubmersible rigs, jack-up rigs
and drilling rigs for Keppel FELS.
In 2008, they completed their first retrofitting of a pipelaying barge, Jascon
25.
In early 2009, they completed and delivered their first accommodation and
pipelay barge, the Aussie 1. It is capable of supporting offshore activities for
oil & gas exploration and was the first accommodation and pipelay barge
built by the Group to be registered and flagged in Australia.
In early 2010, they completed and delivered their second accommodation
and pipelay barge, the McDermott LB32 to Hydro Marine Services, Inc. (a
subsidiary of McDermott International, Inc).
In May 2013, they completed a re-activation and refurbishment project on a
jack-up rig, Randolph Yost, for Shelf Drilling Holdings Ltd. This project was
significant as the Randolph Yost was the first jack-up rig to be brought into
their shipyard.
In 2014, they were listed on the Catalist Board of the Singapore Exchange
Securities Trading Limited.
In 2015, Kim Heng Heavy Equipment Pte Ltd was incorporated to extend
into sale, rental, leasing, repair and maintenance of industrial machinery
and equipment. Also, KH Mazu Offshore & Marine Sdn. Bhd. was
incorporated to undertake repair and docking of vessels, supply chain and
crew management and heavy-lift equipment rental.

Kim Heng Offshore & Marine Holdings Limited
6
Industry Overview
Oil prices weakness has continued to weigh on the oil & gas players, on the
back of lower demand for services and equipment by oil majors. For this
reason, the road to recovery depends on the origin of cash flows into the oil
& gas value chain – which is, the oil prices and oil majors’ capex. Higher
cash flows from upstream players will then render higher revenue for
downstream players like Kim Heng.
Gradual recovery in global oil prices
Global oil prices are likely to continue to emerge from its upheaval, boosted
by strong commitments to oil production cuts, and gradual improvements in
the supply-demand dynamics.
Per International Energy Agency (“IEA”), total stocks for the whole of 2017
will fall by 0.3 mb/d assuming a constant OPEC crude oil production of 32.7
mb/d. Coupled with encouraging demand side fundamentals, this should
result in a higher oil price at the end of 2017. For 2018, stocks for each
quarter will be roughly balanced, aside from a build of up to 0.8 mb/d in the
first quarter - assuming unchanged OPEC production, and normal weather
conditions. This overhang will hold prices generally stable, before
investment slump and strong demand from developing countries push the
market into supply deficit after 2020.
In all, the oil prices should remain largely constant in 2018, owing to slow
inventory drawdown from the overhang. Thereafter, the inventory drawdown
trend should gather speed as deferred upstream projects since 2015 leads
to a tighter oil market. As such, higher prices should be expected after
2020.
Rising E&P offshore capex
For oil majors, a rebound in capex budgets is not likely in the near term,
until market rebalancing pushes oil prices well above today’s level, inciting
increases for offshore deepwater projects. While the recent stabilisation of
oil prices in the US$50/bbl range, with the rediscovery of coping with
US$50/bbl crude, has brought much needed visibility for oil majors to revisit
deferred exploration and production (E&P) projects, oil prices are still at
beyond 50% discount from its peak. For this reason, strong fiscal discipline
remains a high priority when sanctioning projects in 2018. Not to mention,
despite the increasing volume of enquiry for offshore drilling campaigns in
the Asia Pacific, these are for campaigns from 2018 through to 2020.
Source: IEA
Demand/Supply Balance until
4Q18
Source: IHS Markit, The Business
Times
E&P Offshore Capex Utilisation
of Select Rigs/Vessel Classes
Worldwide

Kim Heng Offshore & Marine Holdings Limited
7
Industry Overview
Improving rigs/vessel utilisation and day rates
That being said, the increase in drilling activity would accelerate demand for
offshore services players’ products and services in the longer term. The
rig/vessel utilisation rate, which measures the number of active rigs/vessel
as a percentage of the total number of rigs/vessel, serves as a leading
indicator of demand and activity in the offshore services sector. A high
utilization rate indicates narrowing supply-demand gap and leads to
correspondingly higher day rate – the daily amount a drilling contractor
receives from an oil company for functioning a drilling rig, or vice versa.
Meanwhile, offshore services players are likely to face ongoing rig/vessel
utilisation rate and day rate pressures. What is imperilling recovery is the
current excess capacity problem, which weighs on day rate when bidding
for work. Nevertheless, a look at the capex trends will reveal that a potential
recovery in the rig/vessel utilization rate, and subsequently day rate would
only be in the longer term at best. Furthermore, per market intelligence
group IHS Markit, any recovery in rig/vessel utilization rate and day rate
would be range-bound instead of an immediate rebound to pre-crash levels.
Competitive landscape
Poor market conditions associated with low oil prices have intensified
competition for work amongst existing offshore services players in
Singapore. Making matters worse is the growing global competition for
FPSO (floating production, storage and offloading vessel) conversion and
modification and jack-up rig building contracts, especially from China, which
has pushed day rate downwards. The depressed day rate means that the
offshore services major players’ (e.g. Keppel Corp, Sembcorp Marine,
Vallianz Holdings) market position in Singapore are unlikely to be
jeopardized by new entrants; also, they are likely to be bettered positioned
to ride out the crisis over the smaller players, due to their stronger financial
resources and economies of scale.
Not to mention, the market is typified by strong buyer (E&P companies)
power given the depressed oil prices and resulting smaller number of
potential buyer with less willingness to pay high prices for the offshore
services. Consequently, offshore service players have to compete via their
expertise and service quality for projects.
Source: IHS Markit, The Business
Times
Global Day Rate Term
Order Book for FSPO and Jack-
up Rig
Source: IHS Markit, The Business
Times

Kim Heng Offshore & Marine Holdings Limited
8
Industry Overview
Importance of financial strength
As mentioned earlier, the competitive day rate means that many offshore
services players are operating below breakeven levels. Coupled with the
high debt levels faced in this capital-intensive industry, several distressed
offshore services players (e.g. Swiber Holdings and Ezra Holdings) have
already entered into the stage of debt restructuring/bankruptcies. As such,
the financial strength of the offshore services players is of particular
importance in this anaemic operating environment.
We arrived at this conclusion when we compare Kim Heng to the rest of
their peers, and see their cash management and leverage as being more
superior vis-à-vis that of their peers.
Market Cap
(SGD m)
Cash Flow from Operation
(SGD m)Net Debt/Equity (%) P/B Ratio (x)
FY15 FY16 FY15 FY16 FY15 FY16
Keppel Corp Ltd 13,523.8 (435.0) 733.7 51.5 54.3 1.06 0.90
Sembcorp Marine
Ltd3,866.0 (989.1) 568.5 103.3 112.7 1.46 1.13
Nordic Group Ltd 214.3 8.4 12.4 (5.7) (6.4) 1.26 1.47
Mermaid Maritime
PCL193.6 28.3 77.5 15.6 (0.06) 0.46 0.43
KrisEnergy Ltd 154.5 4.5 (27.1) 55.6 143.8 0.35 0.74
Dyna-Mac Holdings
Ltd131.0 52.6 28.9 (0.7) (20.6) 0.85 1.02
Pacific Radiance Ltd 74.9 27.5 (60.8) 85.6 160.5 0.38 0.24
Vallianz Holdings Ltd 62.7 (26.2) (37.6) 126.0 72.8 0.51 0.55
Falcon Energy
Group Ltd55.7 64.4 148.3 79.1 51.9 0.59 0.36
AusGroup Ltd 48.2 (13.7) 1.7 63.8 N/A 0.59 N/A
SBI Offshore Ltd 20.5 0.01 (2.7) (67.8) (76.6) 1.29 0.76
Loyz Energy Ltd 18.5 7.3 (0.8) 51.4 119.1 1.51 0.68
IEV Holdings Ltd 15.7 6.1 4.4 (10.3) (13.2) 0.38 0.60
Magnus Energy
Group Ltd11.3 2.4 (3.4) (28.9) (13.7) 0.21 0.23
NauticAWT Ltd 11.3 (5.6) 2.3 34.8 67.7 4.52 N/A
KTL Global Ltd 10.1 (2.0) 14.1 74.5 108.4 0.88 0.39
Average 1,150.8 N/A N/A 90.5 60.9 1.02 0.63
Kim Heng 62.5 2.1 2.0 (10.0) 5.4 0.82 0.81
Source: Bloomberg, SAC Advisors

Kim Heng Offshore & Marine Holdings Limited
9
Financial Summary
Revenue model
▪ Their activities can be broadly categorised into two business segments:
(a) Offshore Rig Services and Supply Chain Management: The services
recognized by them under the Offshore Rig Services and Supply Chain
Management segment comprise mainly EPC projects for the offshore
O&G sector and the provision of vessels and related logistics services.
Their Offshore Rig services typically include the construction and
fabrication of sections of drilling rigs (such as jack-up rigs, tender rigs,
semi-submersibles and drillships), installation of offshore production
modules and systems, as well as offshore platform and vessel re-
activation and maintenance projects. They also provide Offshore Supply
Chain Management services to the offshore and marine industry, which
includes, inter alia, rig towage, chartering of our fleet for marine
installation and transportation purposes, inventory management,
warehousing, supply of offshore consumables and expedited delivery
services.
In relation to their offshore rig and EPC support services, they provide a
range of bundled engineering, procurement, construction, and related
support services to offshore EPCIC players and drilling contractors.
Revenue derived from such services are generally dependent upon the
scale and complexity of the project or service performed and is
recognised in accordance with the agreed stage of completion, which is
assessed by reference to a survey of work performed and agreement
with customers. Billings are generally made in accordance with agreed
milestones. The duration of such projects may range from between a
few weeks to a few months.
In relation to their general shipping and crew management services,
they handle the inward and outward clearance of rigs and vessels and
provide general crew management services, such as immigration
clearance and travel management. Revenue is recognised upon
rendering of services and billings are made upon the completion of the
provision of services.
This segment accounted for 98.5% of total FY16 revenue.
81.9 83.9
69.3
44.4
30.9
0.0
10.0
20.0
30.0
40.0
50.0
60.0
70.0
80.0
90.0
FY12 FY13 FY14 FY15 FY16
Offshore Rig Services and Supply Chain
ManagementS$’mn
Source: Company data, SAC Advisors
Source: Company data
Offshore Rig Services
Supply Chain Management
Source: Company data
Revenue Breakdown FY12 FY13 FY14 FY15 FY16
Offshore Rig Services 94.4% 98.9% 88.9% 85.9% 98.5%
Vessel Sales and
Newbuild
5.6% 1.1% 11.1% 14.1% 1.5%
Total 100.0% 100.0% 100.0% 100.0% 100.0%
Source: Company data, SAC Advisors
Kim Heng Offshore & Marine Holdings Limited
10
Financial Summary
Revenue model
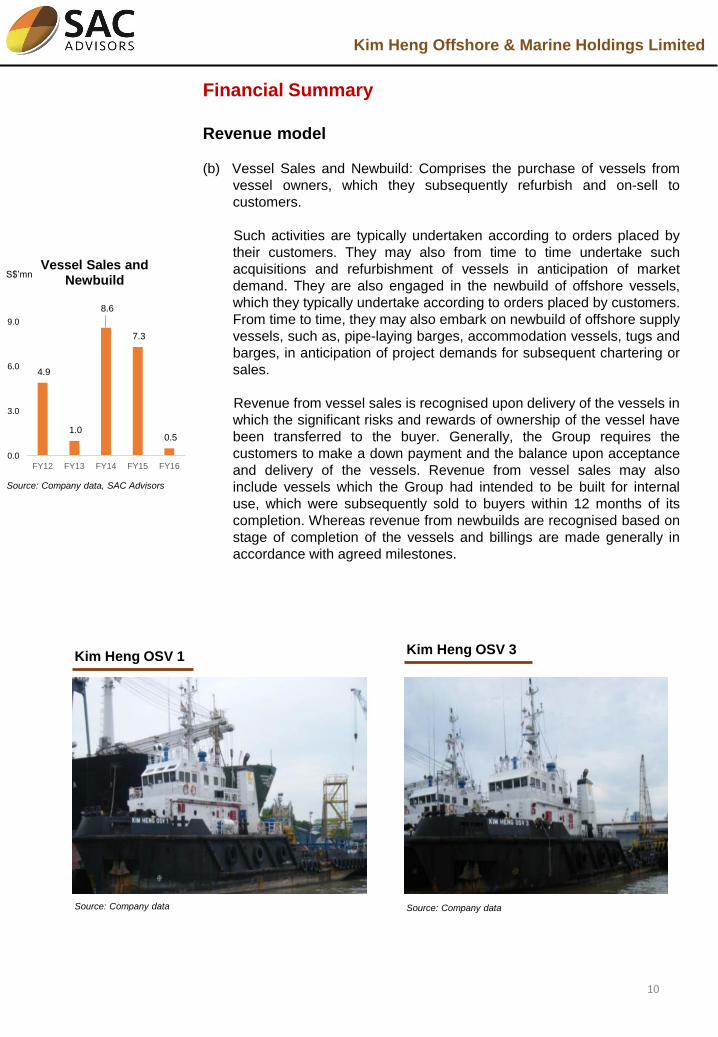
(b) Vessel Sales and Newbuild: Comprises the purchase of vessels from
vessel owners, which they subsequently refurbish and on-sell to
customers.
Such activities are typically undertaken according to orders placed by
their customers. They may also from time to time undertake such
acquisitions and refurbishment of vessels in anticipation of market
demand. They are also engaged in the newbuild of offshore vessels,
which they typically undertake according to orders placed by customers.
From time to time, they may also embark on newbuild of offshore supply
vessels, such as, pipe-laying barges, accommodation vessels, tugs and
barges, in anticipation of project demands for subsequent chartering or
sales.
Revenue from vessel sales is recognised upon delivery of the vessels in
which the significant risks and rewards of ownership of the vessel have
been transferred to the buyer. Generally, the Group requires the
customers to make a down payment and the balance upon acceptance
and delivery of the vessels. Revenue from vessel sales may also
include vessels which the Group had intended to be built for internal
use, which were subsequently sold to buyers within 12 months of its
completion. Whereas revenue from newbuilds are recognised based on
stage of completion of the vessels and billings are made generally in
accordance with agreed milestones.
4.9
1.0
8.6
7.3
0.5
0.0
3.0
6.0
9.0
FY12 FY13 FY14 FY15 FY16
Vessel Sales and Newbuild
S$’mn
Source: Company data, SAC Advisors
Source: Company data
Kim Heng OSV 1Kim Heng OSV 3
Source: Company data

Kim Heng Offshore & Marine Holdings Limited
11
Financial Summary
Sound balance sheet and cash flow
Based on their latest HY17 results, they have a debt to equity and net debt to
equity ratio of 30.9% and 21.3% respectively. And while operating cash flow
has been declining in recent years due to the collapse in oil prices, operating
cash flow has remained positive in FY16.
Superior cash management profile
In our view, Kim Heng’s working capital management is critical in positioning
them to weather the current downcycle. This is because the Group has
consistently managed a negative cash conversion cycle over the last five
years, which is essentially an interest-free way to finance their operations by
borrowing from their suppliers.
Despite reporting a larger net loss of S$17.8 million (included a non-cash
impairment of S$8.3 million due to the decrease in carrying value of some
assets), compared to the loss of S$4.9 million in FY2015, the Group has
explored ways to improve cost efficiencies on the operating level and we
have noticed that the Company has made some headway in this area with
SG&A (selling, general and administrative) expenses falling 11.6% on a
year-on-year basis.
The Group has recently secured a S$5 million five-year vessel loan from
UOB and will be available for drawing down for working capital purposes
from the third quarter of 2017.
(37)
(14)
(62)
(33)
(86)
-100
-70
-40
-10FY12 FY13 FY14 FY15 FY16
Cash conversion cycledaysS$ ‘000
Source: Company data, SAC AdvisorsSource: Company data, SAC Advisors
Declined in line
with the oil price
decline but have
remained positive
Favourable cash
conversion cycle
owing to long credit
terms
21,935
20,19920,749
2,135 2,006
0
3,000
6,000
9,000
12,000
15,000
18,000
21,000
24,000
FY12 FY13 FY14 FY15 FY16
Operating cash flow

Kim Heng Offshore & Marine Holdings Limited
12
List of Vessels
Barge Name Power
(BHP)*
Dimension
(metres)
DWT (MT)** Year built Class
OSV List
KIM HENG OSV 1 2,450 45.7 x 10.0
x 3.7
- 1985 ABS
KIM HENG OSV 2 2,450 45,7 x 10.4
x 4.35
- 1985 ABS
KIM HENG OSV 3 2,450 45.7 x 10.4
x 4.35
- 1985 ABS
Tug List
KIM HENG 3203 3,200 32.0 x 9.76
x 4.3
- 2009 B.V
KIM HENG 2801 2,800 39.0 x 9.0 x
5.5
- 1982 ABS
MAY 101 2,000 28.8 x 8.4 x
4.0
- 2002 B.V
KIM HENG 1630 1,630 26.0 x 8.0 x
3.0
- 2013 N.K
KIM HENG 1300 1,300 23.5 x 7.32
x 3.2
- 2012 N.K
KIM HENG 1301 1,300 23.9 x 7.3 x
3.5
- 2014 N.K
KIM HENG 1302 1,300 23.5 x7.31 x
3.2
- 2012 N.K
KIM HENG 1230 1,230 23.9 x 7.3 x
3.5
- 2011 B.V
PENGUIN SWIFT 1,200 23.5 x 7.32
x 3.1
- 2008 G.L
KIM HENG 21 700 17.15 x 4.88
x 2.2
- 1978 I S CLASS
BRIDGEWATER 670 30.48 x 7.32
x 3.2
- 1973 G.L
MARCOM SUPPORT 240 12.73 x 4.42
x 2.47
- 1977 IS CLASS
Barge List***
KIM HENG 330 - - TBA 2014 ABS
QUEEN 101 - - 7,700 2002 Non-CI
KIM HENG 302 - - TBA 2014 ABS
KIM HENG 288 - - 5,800 2012 BV
KIM HENG 55 - - 5,400 2008 G.L
KIM HENG 252 - - 5,400 2014 ABS
KIM HENG 253 - - 5,400 2014 ABS
*BHP: Brake Horse Power
**Deadweight ton
***Selected Barges only, list not exhaustive

Kim Heng Offshore & Marine Holdings Limited
13
Vessel Utilisation Rate
Kim Heng does not track the use of their vessels which are used to support
their internal operations, they are therefore not able to determine the
utilisation rates of their vessels comprehensively and any attempt to
calculate the utilisation rates for our vessels may not be reflective of the
actual usage of their vessels.
The table above sets out the utilisation of their vessels that are chartered out
to third parties, and excludes those used for internal operations.
Types of Projects Carried Out
As an integrated offshore and marine value chain services provider, the
Group engages in a wide range of offshore services projects. We have listed
a few of their projects below.
Source: Company data, SAC Advisors
45.6%
35.0% 35.9%38.6%
0%
20%
40%
60%
80%
FY10 FY11 FY12 1H13
Vessel utilisation rate
Higher in FY10 as they had entered
into a vessel charter contract with
Gammon, who was the main
contractor for the erection of the
Sentosa Boardwalk. The project was
completed during the FY.
Type of Project Scope of work
Jack-up Rig (2013) Rig refurbishment services, modular fabrication and
installation of various drilling equipment such as a chain
hoist, rig floor tuggers, and a casing stabbing board.
Semi-submersible Rig
(2013)
Fabrication works, removal and installation of thrusters.
Provision of crew management, cargo clearance, loading
services, and procurement of equipment and consumables
for the rig.
Tender Rig (2013) Afloat repairs, tank cleaning, heavy lifting of drilling
equipment and storage and removal and transportation of
cementing equipment.
Drillships (2012) Maintenance, inspection of risers and auxiliary lines,
removal, refurbishment and installation of six azimuth
thrusters at anchorage, and heavy lifting of lower marine
riser package and blowout preventer stack assembly.
Pipelay Barge
McDermott LB32 (2010)
Construction of a 111 metre pipe laying and
accommodation barge, which has the capacity to
accommodate 292 men.
Source: Company data, SAC Advisors

Kim Heng Offshore & Marine Holdings Limited
14
Management
Mr. Thomas Tan is the Executive Chairman and CEO of the Company. He
currently serves as a director for all the companies within the Group. He
joined the Group in 1978 as an apprentice and was involved in the
operations department of the Group in the chartering of vessels, engaging in
loading of steel structures, fabrication/installation of modules as well as in
the ship supplies and chandelling business. He rose through the ranks over
the years to head the marketing and operations department. From 1998 until
present, he has been responsible for overall operations, sales and marketing
activities, customer service, securing new projects and negotiating contracts
for the Group.
Ms. Yeo Seh Hong is the Executive Director and COO of the Company, and
was appointed to the Board on 26 December 2013. Prior to joining the
Group, she was previously an inspection secretary with AMF Tuboscope Inc.
from 1978 to 1985 where she was in charge of the preparation of customer’s
inspection reports and co-ordinating with the inspection manager on daily job
assignments and assisting in sales enquiries. She is currently responsible for
overall operations, sales and marketing of products and services, developing
and reviewing product specifications to meet market demand, preparing for
submissions of major tenders and commercial proposals for various scopes
of services and overseeing the Group’s activities to ensure continued
compliance with safety requirements and ISO standards.
Mr. Tan Keng Hoe Melvin is the Commercial and Operations Director of the
Group and is responsible for overseeing the business and commercial
aspects of the Group. His first stint with the Group was from 1987 to 1997
where he last held the position of Manager of the Marine division. He
proceeded to take on various logistical roles in leading companies in the Oil
& Gas industry before rejoining the Group in May 2010. He holds a diploma
in Business Management from the University of Bradford.

Kim Heng Offshore & Marine Holdings Limited
15
Future Plans and Growth Strategy
Taking advantage of distressed investment opportunities
Kim Heng’s prudent management of their balance sheet allowed them to
avoid the use of excessive leverage before the oil price crisis and preserved
their cash for this downturn. We think this allows them to take advantage of
distressed investment opportunities that come their way as was the case
when they acquired three vessels at a steep discount at a bank auction two
months ago.
The Group had invested in the three vessels in a bank sale of the pledged
assets of the distressed Swiber Holdings for US$9.6 million. According to
management, the Group stands to recoup their investments if each of the
three anchor handling tug supply vessels it acquired at a bank auction were
put out to work for 270 days. According to management, one of the three
vessels have already been mobilised for salvage work in the region, and
there have been enquiries made on the other two vessels.
Moving forward, we expect that management will continue to take advantage
of distressed investment opportunities that come their way. We expect that
these will be investments that can improve their overall margins and broaden
their service offerings. We also expect cost rationalisation to continue as the
Group positions itself for the protracted O&M downturn.
Key Risks
Dependent on the state of the offshore O&G industry
A significant portion of their customers are operating in the global offshore
O&G industry. Accordingly, their business and financial performance are
dependent on the level of activity and capital expenditure in, the offshore
exploration, development and production of oil and natural gas. Such
activities and level of capital expenditure are significantly affected by
fluctuations in oil and natural gas prices, as well as expectations of changes
in these prices in the future.

Kim Heng Offshore & Marine Holdings Limited
16
Dividend Policy
Whilst the Company does not have any fixed dividend policy, they have
maintained their dividend distribution of 0.3 and 0.1 Singapore cents for
FY15 and FY16, representing a dividend yield of 3.4% and 1.1% respectively
despite suffering a loss for both years due to the downturn.
Recent corporate developments
Purchased three 130-ton Bollard Vessels at US$9.6 million
Kim Heng is positioning itself for the upturn by capitalising on the attractive
valuations of three 130-ton Bollard Pull Anchor Handling Tug/Supply
(“AHTS”) Vessels for a total consideration of US$9.6 million. The ABS Class
130 ton Bollard Pull Vessels, each measuring 70.0 metres by 16.8 metres by
7.5 metres with a gross weight of approximately 812 tons, are targeted to be
used to perform tow services for the clients’ jack-up rigs and salvage
operations. The Group also aims to deploy the vessels for long term charters
as and when opportunities arise. The maintenance and upkeep of the
vessels will be kept at a minimum as they can be held at the Group’s own
yard.
Previously valued at approximately US$33.0 million per vessel, the downturn
of the oil and gas industry has enabled the Group to acquire these assets at
extremely low valuations. As part of the Group’s effort to prepare for the
eventual expected industry upturn, it is pursuing strategic transactions that
complement its existing business.

Kim Heng Offshore & Marine Holdings Limited
Fiscal Year Ended
FY12 FY13 FY14 FY15 FY16
Revenue 86,728 84,813 77,978 51,757 31,364
Less: Cost of sales (49,551) (48,359) (51,014) (38,207) (22,961)
Gross Profit 37,177 36,454 26,964 13,550 8,403
Other income 2,232 842 2,448 3,060 766
Distribution expenses (1,579) (1,601) (1,985) (1,950) (1,056)
Administrative expenses (13,128) (16,258) (16,617) (14,647) (13,622)
Other expenses (2,149) 1,631 (4,574) (4,225) (11,448)
Results from operating
activities 22,553 21,068 6,236 (4,212) (16,957)
Finance costs (1,451) (722) (422) (510) (857)
Tax expense (3,817) (3,253) (197) (212) (14)
Profit/(Loss) for the
year 17,285 17,093 5,617 (4,934) (17,828)
Profit/(Loss)
attributable to owners
of company 17,285 17,093 5,617 (4,934) (17,828)
Earnings/(Loss) per
share:
-Basic (SG cents) 3.1 3.1 0.8 (0.7) (2.5)
-Diluted (SG cents) 3.1 3.1 0.8 (0.7) (2.5)
Income Statement (S$’000)
17
Fiscal Year Ended
FY12 FY13 FY14 FY15 FY16
Profit/(Loss) before
tax 21,102 20,346 5,814 (4,722) (17,814)
Depreciation &
amortisation 5,050 4,427 4,031 4,457 5,013
Change in working
capital (2,018) (4,808) 15,156 3,641 6,130
Others (2,109) 234 (4,252) (1,241) 8,677
Net Cash from/ (used
in) operations 21,935 20,199 20,749 2,135 2,066
Purchase of PPE (2,771) (3,111) (7,720) (14,051) (5,228)
Others 6,887 7,070 4,601 4,454 762
Net Cash from/(used
in)/ from investing 4,116 3,959 (3,119) (9,597) (4,466)
Net increase in equity - - 38,445 - -
Net increase in debt (6,297) (7,701) (3,557) (3,025) (3,779)
Others (20,176) (11,877) (6,131) (6,421) (9,497)
Net Cash from/(used
in) financing (26,473) (19,578) 28,757 (9,446) (13,276)
Cash Flow Statement (S$’000)
Fiscal Year Ended
FY12 FY13 FY14 FY15 FY16
As at 31 Dec
Property, plant and
equipment 60,604 57,779 63,206 84,004 108,385
Club memberships 44 44 89 46 46
Total non-current
assets 60,648 57,823 63,295 84,050 108,431
Inventories 1,443 691 2,232 779 630
Trade and other
receivables 23,585 28,187 14,625 15,509 7,830
Cash and cash
equivalents 1,114 3,504 49,894 32,804 20,089
Other assets 0 1,792 0 0 0
Total current assets 26,142 34,174 66,751 49,092 28,549
Total assets 86,790 91,997 130,046 133,142 136,980
Share capital 3,370 36,133 74,409 74,409 74,409
Reserves (235) (32,949) (32,740) (32,945) (11,004)
Accumulated profits 40,226 54,316 56,383 47,899 27,941
Equity attributable to
owners of the
Company 43,361 57,500 98,052 89,813 91,346
Loans and borrowings 6,126 3,991 4,730 16,239 17,553
Deferred tax liabilities 5,872 5,872 5,843 5,889 10,286
Non-current liabilities 11,998 9,893 10,573 22,128 27,839
Loans and borrowings 12,605 4,192 3,397 7,615 7,474
Trade and other
payables 18,062 17,149 17,814 13,284 10,279
Other current liabilities 764 3,293 210 302 42
Current liabilities 31,431 24,634 21,421 21,201 17,795
Total liabilities 43,429 34,497 31,994 43,329 45,634
Total equity and
liabilities 86,790 91,997 130,046 133,142 136,980
Balance Sheet (S$’000)Ratios
Fiscal Year Ended
FY12 FY13 FY14 FY15 FY16
Profitability (%)
Gross profit margin 42.9% 43.0% 34.6% 26.2% 26.8%
Profit/(loss) before tax
margin 24.3% 24.0% 7.5% (9.1%) (56.8%)
Profit/(loss) after tax
margin 19.9% 20.2% 7.2% (9.5%) (56.8%)
Liquidity (x)
Current ratio 0.8 1.4 3.1 2.3 1.6
Quick ratio 0.8 1.4 3.0 2.3 1.6
Interest coverage ratio 15.5 29.2 14.8 N/A N/A
Net Debt to Equity 40.6% 8.1% Net cash Net cash 5.4%
Valuation (x)
P/S 0.9 0.9 0.9 1.4 2.4
P/E 4.3 4.3 13.1 N/A N/A
Core P/E at target price N/A N/A N/A N/A N/A
P/B 1.4 1.1 0.6 0.7 0.7
P/NTA N/A N/A N/A N/A N/A
Cash Conversion
Cycle
Net trade receivable
days 85 111 50 86 68
Inventory days 11 5 16 7 10
Trade payable days 133 129 127 127 163
CCC days (37) (14) (62) (33) (86)
Returns
Return on equity N/A 33.9% 7.2% N/A N/A
Return on capital
employed N/A 20.8% 3.1% N/A N/A
Dividend payout ratio N/A 27.8% 63.2% N/A N/A
n.m.: not meaningful
Kim Heng Offshore & Marine Holdings Limited
18
DISCLAIMERS AND DISCLOSURES
This report has been prepared and distributed by SAC Advisors Private Limited (“SAC Advisors”)
which is a holder of a capital markets services licence and an exempt financial adviser in Singapore.
SAC Advisors is a wholly-owned subsidiary of SAC Capital Private Limited (“SAC Capital”) which is
also a capital markets services licensee.
This report has been prepared for the purpose of general circulation. In the preparation of this report,
we have not had regard to the specific investment objectives, financial situation, tax position or unique
needs and constraints of any individual person or any specific group of persons. Any prospective
purchaser should make his own investigation of the securities and all information provided. Advice
should be sought from a financial adviser regarding suitability, taking into account the specific
investment objectives, financial situation or particular needs of the person in receipt of the
recommendation, before a commitment to purchase is entered into.
This report does not constitute or form part of any offer or solicitation of any offer to buy or sell any
securities.
This report is confidential and is meant only for the consumption of targeted persons. The information
in this report shall not be copied or reproduced in part or in whole, and save for the recipient of this
report, shall not be disclosed to any other person without the prior written consent of SAC Advisors.
The distribution of this report outside the jurisdiction of Singapore is also strictly prohibited.
While SAC Advisors has exercised reasonable care to ensure that the facts stated herein are accurate,
SAC Advisors makes no representation as to the accuracy or completeness of such information and
SAC Advisors accepts no liability whatsoever for any loss or damage arising from the use of or reliance
of the information herein.
SAC Advisors, SAC Capital and their associates, directors, and/or employees may have positions in
the securities covered in the report and may also perform or seek to perform other corporate finance
related services for the company whose securities are covered in the report. SAC Advisors and its
related companies may from time to time perform advisory services, or solicit such advisory service
from the entity mentioned in this report (“Other Services”). However, the research professionals
involved in the preparation of this report have not and will not participate in the solicitation of such
business. This report is therefore classified as a non-independent report.
As of the date of this report, SAC Advisors and its associates, including SAC Capital, do not have
proprietary positions in Kim Heng Offshore & Marine Holdings Limited, except for:
As of the date of this report, SAC Advisors and its associates, including SAC Capital, do not have any
business relations with Kim Heng Offshore & Marine Holdings within the past 12 months, except for:
Party Quantum of position
Nil Nil
Company Nature of business relation Date of business relation
Kim Heng Offshore & Marine
Holdings Limited
Continuing Sponsor Ongoing

Kim Heng Offshore & Marine Holdings Limited
19
As of the date of this report, none of the analysts who covered the securities in this report have any
proprietary position or material interest in the subject companies covered here in, except for:
ANALYST CERTIFICATION/REGULATION AC
As noted above, research analyst(s) of SAC Advisors who produced this report hereby certify that
(i) The views expressed in this report accurately reflect his/her personal views about the subject
corporation(s);
(ii) The report was produced independently by him/her;
(iii) He/she does not on behalf of SAC Advisors or SAC Capital or any other person carry out Other
Services involving any of the subject corporation(s) or securities referred to in this report; and
(iv) He/she has not received and will not receive any compensation directly or indirectly related to the
recommendations or views expressed in this report or to any sales, trading, dealing or corporate finance
advisory services or transaction in respect of the securities in this report. He/she has not and will not
receive any compensation directly or indirectly linked to the performance of the securities of the subject
corporation(s) from the time of the publication of this report either.
Analyst name Quantum of position
Nil Nil