kingussiesocialsubjects.weebly.comkingussiesocialsubjects.weebly.com/uploads/3/8/7/0/... · web...
TRANSCRIPT

Voting Behaviour and the Outcome of Elections
Discussed in this topic:
Theories of short and long-term influences on voting behaviour.
Long-term factors affecting voting behaviour: social class; gender; age; ethnicity, and geography.
Short-term factors affecting voting behaviour: state of the economy; image of party leaders; policies; performance of the pervious government and the media.
Analysis of the impact of each factor on voting behaviour.
An evaluation of the importance of each factor affecting voting behaviour in relation to other factors.
Page | 1

What do we mean by voting behaviour? Looking at the way that people choose to vote is referred to as the study of voting behaviour. It is a complex issue. The party or individual that somebody chooses to vote for can be influenced by many different factors and often by a complex combination of factors. Political scientists have developed theories to explain why people vote the way they do and these can be divided into short and long-term
factors. Long-term factors: Sociological theories of voting behaviour suggest that people vote a certain way based on the social groups that they belong to. People identify strongly with these social groups and select parties that reflect similar values. For example, many people vote according to their age, gender, ethnic group or social class. People may also have strong regional or geographical
identities which influences how they vote. Party identification also influences voting behaviour and this is linked to social class. Traditionally particular classes in society have identified with particular political parties which dictates how some people vote. Short-term factors: Rational choice theory is often used to explain voting patterns that do not fit into the sociological theories described above. Rational choice theory suggests that people weigh-up the evidence and choose the option that will most benefit them individually. Voters can be influenced by party image, policies, economic concerns and even the media on a short-term basis. These are often described as ‘floating’ voters or issue voters. Long-term factors were considered to be the biggest influence on voting behaviour between 1945 and 1979. During this time voters strongly identified with political parties, class divisions ran deep and there was two-party dominance in government. However, since then short-term influences have played a much stronger role in dictating voter behaviour. There has been a huge decline in party membership and a shift in social structure driven by a changing economy.
Why voting behaviour is important: It is important to understand that there are different factors that affect voting behaviour, that there are different types of factors and that it is very difficult to predict how somebody will vote. Theorists and political parties carry out extensive research into voting behaviour. These studies reveal what influences voters, how voting and voting systems combined shape the outcome of elections and, how to target voters effectively to gain seats and shape policies.
Page | 2

Long-term Factor: Social ClassWhen we want to study society we need to be able to break it down into groups to help us. We need to do this so that we can learn about the way that people in these groups behave and then make conclusions about their behaviour. This information can be used to develop political policies that might be aimed at certain groups in society, to understand and tackle complex issues and, to learn what is important to voters who belong to these different groups. There are various ways of putting people into
categories or groups for example, based on gender, earnings or religion. One important way of categorising people is by social class. Broadly speaking class is defined as a group of people with similar social, economic and educational status. A lot of definitions of class are also hierarchical which means that there is a top and a bottom. Beyond that class is difficult to define or to measure and there is much debate. However, class definitely does exist and is an extremely important influence on voting behaviour. Traditional model: The traditional way of defining social class in the UK is upper, middle and lower class. Until the 1970s this was the most common way of defining different social groups. The upper classes are rich, well-born or both. The middle classes are generally made up of professionals, small business owners and middle-managers. The middle class is usually defined as a large section of society ‘in between’ the other classes and can often be referred to as ‘white-collar’ workers. The lower classes are made up of low paid manual workers with little security and are often referred to as ‘blue collar’ workers. This three-tier model of social class was one of the most important influences on voting behaviour prior to the 1970s. The vast majority of voters identified with one of the two major parties; Labour or the Conservatives. In the past Labour stood for the redistribution of wealth in society and the intervention of government to make people’s lives better. The Conservatives stood for less government intervention, decisions to be made by individuals and businesses and, that this improves people’s lives. The working classes traditionally voted Labour and the upper/ middle classes traditionally voted Conservative. In 1951 97% of the electorate voted for one of the two main parties.
However, this traditional model of social class can no longer explain voting behaviour. It is estimated that only around 39% of the population can be effectively categorised using this model. In addition, currently only around 1% of the UK electorate is a member of a political party and groups like the RSPB and the Caravan Club have more members than all of the political parties combined. Clearly traditional ideas of class and party alignment have declined. In order to understand
Page | 3

how class still affects voting behaviour we need to explore how society has changed and thus, the categorisation of social class.
Current models: The Registrar General’s Model for Social Class (RGSC) was the main model used until the 1980s and uses occupation to measure class. There are six categories of employment in a hierarchical order and it has long been used to categorise voting behaviour.
Category ProfessionA Professional occupations (lawyer, doctor)B Managerial and technical occupations (Civil engineer,
software design)C1 Non-manual skilled occupations (teaching, nursing)C2 Manual skilled occupations (electrician, mechanic)D Partly skilled occupations (apprentice, panel beater,
labourer)E Unskilled occupations (retail, call centre, carer)
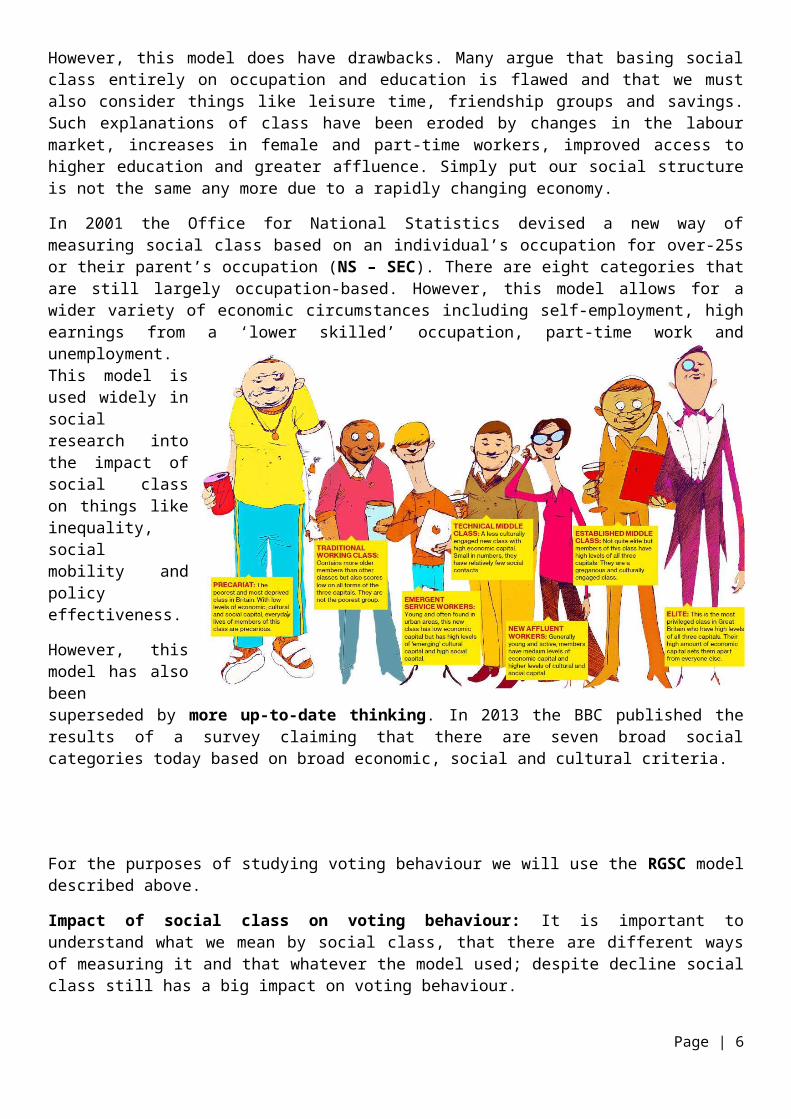
However, this model does have drawbacks. Many argue that basing social class entirely on occupation and education is flawed and that we must also consider things like leisure time, friendship groups and savings. Such explanations of class have been eroded by changes in the labour market, increases in female and part-time workers, improved access to higher education and greater affluence. Simply put our social
structure is not the same any more due to a rapidly changing economy. In 2001 the Office for National Statistics devised a new way of measuring social class based on an individual’s occupation for over-25s or their parent’s occupation (NS – SEC). There are eight categories that are still largely occupation-based. However, this model allows for a wider variety of economic circumstances including self-employment, high earnings from a ‘lower skilled’ occupation, part-time work and unemployment. This model is used widely in social research into the impact of social class on things like inequality, social mobility and policy effectiveness. However, this model has also been superseded by more up-to-date thinking. In 2013 the BBC published the results of a survey claiming that there are seven broad social categories today based on broad economic, social and cultural criteria.
Page | 4

For the purposes of studying voting behaviour we will use the RGSC model described above. Impact of social class on voting behaviour: It is important to understand what we mean by social class, that there are different ways of measuring it and that whatever the model used; despite decline social class still has a big impact on voting behaviour.
The figures below show that the margins gained in each social class are narrower than they used to be compared to the 1974 General Election. While the majority of a given class were loyal to a party in the past voters do not behave quite so predictably today. In 1961 44% of voters said they were ‘very strong’ supporters of one of the two main parties and by 2006 this had dropped to only 13%. This indicates that social class
is less important in determining voting behaviour than it used to be. There are more ‘floating voters’ who now switch their votes between different parties and candidates have to work hard to gain these votes. In the 1974 General Election only 26% of the skilled working-class (C2) voted Conservative and by 1987 this had increased to 40%. The Conservative Party had cleverly tapped into the aspirations of the lower classes through policies like the sale of council houses and lower taxes. Such aspiring lower-class voters were later dubbed ‘Mondeo man’. New Labour under Blair’s leadership similarly tapped into the middle classes with policies like low taxation, increased NHS spending and the national minimum wage. In the1974 General Election Labour gained only 19% of A/B voters while in 1997 this had increased to 34%.However, the figures also show that social class is still important to some extent. In the 2010 General Election Labour still took the largest share of the unskilled workers vote (DE) while the Conservatives still took the largest share of the professional and managerial vote (AB).Voting by social class, 2010 General Election
Conservatives Labour Liberal Democrats
OverallShare of the Vote (%) 36.1 (+3.8) 29 (-6.2) 23 (+1)
Seats 307 (+97) 258 (-91) 57 (-5)By social class (share of the
vote %)A B 39 (+2) 27 (-2) 29 (0)C1 39 (+2) 28 (-4) 24 (+1)C2 37 (+6) 29 (-11) 22 (0)
D E 31 (+6) 40 (-8) 17 (-1)
Page | 5
Voting by social class, 1974 General Election
A B C1 C2 D EConservatives 56 26 22
Labour 19 49 57
It is obvious that social class still has an impact on voting behaviour and it is important to understand why. Due to increased access to higher education, better social mobility and a changing economy the ‘middle class’ in Britain has grown hugely. A 2011 survey conducted by Britain Thinks suggests that seven in ten people now class themselves as ‘middle class’ compared to only a quarter of people a generation ago. Political parties know that gaining the support of this large middle ground is the key to electoral success and that winning votes is not enough under FPTP; they need to win seats. Winning seats means targeting these middle groups in society who tend to live together in similar types of areas. We know that many people vote for the party who will benefit them the most and this situation gives rise to ‘safe’ seats.
Safe Seat: Richmond, Yorkshire Safe Seat: Glasgow North East
Voters tend to support the party that represents their economic interests and similar social classes of voters tend to be concentrated in particular areas. Financially better-off voters often support a party that promises to protect things like savings, pensions and lower taxes. Traditionally this has been the Conservative Party. In contrast economically poorer voters often support a party that promises to do things like increase welfare, create jobs and tackle crime. Traditionally this has been the Labour Party. However, other parties are beginning to make gains in ‘traditional’ Labour or Conservative areas. In 2011 the SNP won many ‘safe’ Labour seats in the Scottish Parliament election by having similar left-wing policies to Labour. They made particular gains in Glasgow that has some of the poorest constituencies in Europe.
Page | 6

This shows that while ‘traditional’ party alignment might seem on the decline a lot of voters still identify with parties that reflect their circumstances and social class. Furthermore, in 2010 Professor Dorling of Sheffield University published extensive research showing that the gap between rich and poor is actually widening in the UK which means that social class cannot be ignored. Despite significant decline, there is still clearly a strong link between social class and voting behaviour.
Long-term Factor: GenderApart from social class there are other factors that affect voting behaviour. Women traditionally have a stronger attachment to the Conservatives than men. Up until 1997 women tended to vote Conservative; in particular middle and upper-class women. In fact research suggests that Labour would have won every post-war election until 1979 if it wasn’t for the female vote. After Blair’s re-invention of Labour in 1997 the female vote was
successfully targeted and since then female voters have become a political battleground for parties. In recent elections younger women have tended to vote Liberal Democrat more than younger men and Labour continue to make gains. Clearly gender has a big impact on voting behaviour even though the party support might change. It is middle-class women who are sought after by parties and some argue that the reason this middle group changes support is due to changing lifestyles. The ‘school gate mum’ has a career, a demanding lifestyle and disposable income. In the 2010 election all parties went out of their way to court this social group. The website mumsnet became a focus for communicating with these voters and all three leaders of the major parties carried out web-chats during the campaign. Modern women may combine what they want from a party around both work and family life. Parties have started to address more seriously issues like the cost of childcare and the availability of nursery places so that women can continue to work. Policies regarding the public sector are also important to women as 90% of the public sector workforce is female. The figures below show that despite changing attitudes the Conservatives continue to gain most of the female vote for all social groups apart from the poorest section of the electorate. % of female vote by party and social class, 2010 General Election
Women by Class Con Labour LibDemA B 34 29 21C1 39 28 25C2 41 25 25D E 29 45 19
Page | 7

However, this could easily change. In 1997 Labour gained a large proportion of the female vote because many women liked their new leader; Tony Blair. Research shows that women identify with party leaders more strongly than men and the dominance of the leader debates in the 2010 election may have helped the Conservatives. Policies are also an important factor in attracting the middle-class female vote. A YouGov poll in 2011
suggested that twice as many voters thought that ‘Labour bests understands women’ compared to the Conservatives. Gender is clearly an important factor in voting behaviour and now that the female vote is more flexible than in the past we may see a significant shift in the next election.
Long-term Factor: Age Age also has an impact on voting behaviour. In the four elections prior to 2010 Labour outperformed the Conservatives among young and middle-aged voters. In contrast the two older age groups have consistently favoured the Conservatives. The two middle age groups of 35-44 and 45-54 have been more open to different parties and many of these voters belong to the middle-classes. They are important to win over for electoral success and in 2010 the Conservatives won over these two age groups by small margins. While Labour was in
power between 1997 and 2010 they consistently held onto the support of this group. Policies regarding the economy, education and childcare are likely to sway voters in these age groups. For example, the Conservatives lowered interest rates which reduced the cost of mortgages for the vast majority of families. % share of the vote by age for selected General Elections
1987 1992 1997 2001 2005 201018-24
Conservatives 37 35 27 27 28 30Labour 35 38 49 41 38 3125-34
Conservatives 39 40 28 24 25 35Labour 33 37 49 51 38 3035-44
Conservatives 45 40 28 28 27 34Labour 28 36 48 45 41 31
Page | 8

45-54Conservatives 45 47 31 32 31 34
Labour 31 31 41 41 35 2855-64
Conservatives 45 44 36 39 39 38Labour 31 35 39 37 21 28
65+Conservatives 46 48 36 40 41 44
Labour 32 34 31 39 35 31
Younger voters often support parties that propose social change. David Cameron tried to give the Conservative Party a ‘young’ image in 2010 which won over some of the young vote back to the Conservatives. In 2010 the Liberal Democrats also won a large share of the youth vote which might be partly explained by their opposition to the raising of university tuition fees. When Labour came back to power in 1997 they won a huge 49% of young voters. Blair offered a youthful image and their policies promised change after eighteen years of Conservative rule. However, around 54% of young people are not even registered to vote and only 44% of 18-24 year olds voted in 2010 and, this apathy reduces the importance of this group.
Parties are starting to court the older vote in particular which is a growing portion of society that is living longer. In fact over-55s make up more than half of voters in 30 constituencies. Over 55s have around 75% voter turnout compared to 55% for the 25-34 age group. Older voters tend to favour the Conservative Party and are far less likely to change their support. Statistics show that 59% of voters over the age of 65 are sure about how they will vote compared to only
42% of 45 year olds. The 2014 Budget was dubbed the ‘grey’ budget because the Conservatives were clearly trying to win over older voters for the 2015 election. They removed restrictions on pension funds so that pensioners are free to withdraw their pension pot to invest and spend. Osborne declared "The message from this budget is: you've earned it; you have saved it; and this government is on your side". Clearly older voters have a significant impact on elections and people certainly vote differently at different stages in their life.
Page | 9

Long-term Factor: Ethnicity Another factor affecting voting behaviour is ethnicity. In the UK 87% of people class themselves as White, 6.9% as Asian or Asian British, 3% as Black or Black British and 2% as mixed ethnicity. Ethnic minority groups have distinct voting patterns and are far more likely to vote Labour than the White majority. In fact in 2010 the Conservatives only won 16% of the ethnic minority vote. In the 2010 election it was estimated that there
were 168 seats where ethnic minorities had more voting influence than White voters. The survey also found that these constituencies are not confined to urban areas in the south-east but are throughout a range of rural and urban areas spread across the country. Holloway Lester who led the survey stated that “the black and ethnic minority vote is as important as the grey vote and that political parties ignore it at their peril”. Many of these constituencies are in the London area which has become increasingly diverse. Harrow West was regarded as a Conservative safe seat until 1997 when it was won by Labour. It has been a Labour safe seat since then largely thanks to a growing Asian population. The 2010 General Election saw an increase in minority MPs from 14 to 27, leaving the Liberal Democrats as the only major party with no MPs from an ethnic minority background. Minorities are growing in the UK and are set to make up 20% of the electorate by 2051. Clearly minority votes are becoming increasingly important in elections.
Many Asian communities in particular have quite conservative values of strong family, tough on crime and high small-business ownership. In theory these should be Conservative voters but they are not. The Conservative Party has an image problem in that many regard the party as anti-immigration and anti-minority. A 2011 survey of 10, 000 minority opinions on the Conservative Party found that there was a widely held belief that the party was against minorities, particularly
amongst Black British people. The Conservatives have become synonymous with the London Riots, illegal immigration crack-downs, harsh stop-and-search policies and ‘racist’ stances on immigration in general. Conversely Labour is credited with introducing equality and anti-discrimination legislation while it was in power and is seen to be much more supportive of minority communities. Analysis of the 2010 General Election found that two in three ethnic minority voters supported Labour. However, there is also evidence to suggest that ethnic minority voters may not have as much impact on the outcome of elections as they might. In 2010 ethnic minority voters were three times less likely to be registered to vote than White voters. Around 7% of Whites were not registered in 2010 compared to17% of
Asian Britons and 20% of Black Britons. Black Africans in particular have the highest non-registration at a huge 28%. Many ethnic minorities, Black voters in particular, feel neglected by the political system and ill-represented. Only 29% of ethnic minority voters were canvassed in the 2010 election compared to 54% of White
Page | 10

voters. While ethnicity clearly plays a big part in voting behaviour the importance of ethnic minority voters to the outcome of elections remains a topic of debate.
Long-term Factor: Geography The final major long-term impact on voting behaviour is geography. It makes a huge difference on how people vote depending on where they live. Broadly there is a north-south divide in party support. Labour has much stronger support in Scotland, Northern England and Wales whereas the Conservatives do better in southern England. It also makes a difference whether you live in an inner-city, suburban or rural area. Labour gain more support from inner-city areas while the Conservatives do better in rural areas. In addition geographical explanations of voting behaviour can also be linked to class. Many of Labour’s strongholds are in inner parts of northern cities like Glasgow, Manchester, Sheffield and Liverpool all of which are listed in Labour’s top 20 safest seats. Glasgow North East is a Labour seat and one of the most deprived constituencies in the UK. Liverpool Walton is Labour’s safest seat and suffers high levels of unemployment and deprivation. Most Conservative strongholds are in affluent rural and inner-city areas in the south-east; areas like London, Buckingham, Hampshire and Surrey. The Conservatives’ safest seat is Richmond in Yorkshire; a rural and affluent constituency that they have held continuously since 1910. Kensington in London is a typical Conservative safe seat and the average house price is around £1.5 million.
The constituent parts of the UK also have distinct political differences. The Scottish, Welsh and Northern-English electorates tend to be more left-leaning than other parts of the UK. These areas were more heavily industrialised and trade unionism was much stronger. The Labour Party can trace its roots back to the trade union movement and many voters in these areas still display quite socialist left-wing political beliefs. For many, the Labour Party represents the closest match to these beliefs in UK General Elections. In the 2010 General Election the Conservatives gained 39.6% of the vote in England compared to only 16% in Scotland. In 2010 the Conservative Party had only one MP in Scotland and Labour actually increased their share of the vote by 3% winning affluent areas in Scotland like East
Page | 11

Renfrewshire. Labour also still gained most support in the three major northern England areas and Wales. However, support for Labour declined in the last election in all of their traditional geographical strongholds apart from Scotland. They lost a massive 9% share of the vote in The North-West which holds some of their safest seats in Liverpool and Manchester. Conversely, the Conservatives made gains in every part of the UK. This shows that geography alone cannot explain voting behaviour and that other things like class, gender, performance of previous governments and issues are also important. % share of the vote by selected regions, 2010 General Election
Conservative Labour LibDemThe North 24 (+4) 44 (-9) 24 (+0)
Yorkshire and Humber 33 (+4) 35 (-9) 23 (+2)The North-West 32 (+3) 40 (-6) 22 (+0)
London 35 (+3) 37 (-2) 22 (+0)The South-East 50 (+5) 16 (-8) 26 (+1)The South-West 43 (+4) 15 (-7) 35 (+2)
Wales 26 (+5) 36 (-7) 20 (+2)Scotland 18 (+1) 42 (+3) 19 (-4)
Short-term FactorsAs well as long-term influences on voting behaviour there are also many short-term things that influence the way that people vote. The large middle class in the UK is full of floating voters who are prepared to change their party support depending on their circumstances, issues that are important to them, image of party leaders, performance of previous governments and policies. Any one or combination of these things might change voting behaviour. Short-term factors are also linked to long-term factors. Issues and policies: Many voters are swayed by their circumstances, issues that are important to them and policies of parties. During elections all parties outline their vision of the future and how they are going to improve the lives of people in the UK. Up until 1992 the Conservatives were generally regarded as the party most capable of providing strong and effective government. However, after a period of turmoil over the EU and the value of the pound this changed. New Labour swept to victory in 1997 promising a
different form of Labour rule and a move away from the ‘selfish’ Thatcher era. Labour successfully maintained three terms in government with relative popularity however, after the Iraq invasion and a financial crash this came to an end. The banking crisis in 2008 was the issue that dominated the
Page | 12

2010 election. An Ipsos-MORI poll showed that it was the most important issue for voters with 32% agreeing with this. It was obvious that they prosperity years were over and that economic decline was to be the norm. Unemployment had risen to 1.5 million which was the highest level since 1994 and clearly voters were worried about this. The Conservatives argued that another five years of Labour under Gordon Brown would see Britain economically devastated and that their ‘austerity’ plan was the best policy. The Conservatives promised to make £6 billion in cuts in the first year and to carry out an emergency budget. Labour highlighted the inexperience of Cameron and Osborne to deal with the serious economic issues and their ‘millionaire’ backgrounds. Labour promised no major cuts in the first year and the sale of nationalised banks like RBS. Prior to the election only 29% of voters thought that the Conservatives had the best economic policies compared to 26% for Labour policies. Clearly no party had the advantage on the issue of the economy and the result reflected this mood returning a minority Conservative victory. Other issues that traditionally concern voters are education, healthcare and immigration. In the 2010 election Labour was seen to have the best policies on healthcare while the Conservatives came out top on immigration. People’s circumstances, issues and policies have a huge short-term impact on voting behaviour. Performance in Government: Voters also take into account how parties have performed in government and this can affect voting behaviour. Prior to the 2010 election Labour was in power for fourteen years. In 2001 Labour was elected for a second term in office and thanks to a strong economy they maintained their large majority. However, when they were first elected in 1997 they gained 13.5 million voters and by 2010 this had dropped to 8.6 million; in fourteen years Labour lost
nearly 5 million voters. Voters began to feel dissatisfied with Labour’s handling of things like the banking crisis, rising unemployment and the Iraq invasion. Labour was also seen as a divided party with little support for its leader. Clearly 2010 was time for a change. Previously the Conservatives had been in power for 18 years between 1979 and 1997. Thatcher style individualism was popular, their economic policies had support and they provided strong government.
However, eventual mishandling of the economy, splits in the party and sleaze scandals contributed to their 1997 loss; Labour won the biggest majority of any party since 1935. Similarly, 1997 was obviously time for a change of government. The SNP had an outstanding victory in the 2011 Scottish Parliament election and the Liberal Democrats suffered particularly badly in the polling booth. There had been a Lab/LibDem coalition for the previous two governments but the Liberal Democrats were tarnished by the Westminster coalition’s poor image in Scotland. The UK Government had a number of deeply unpopular policies including budget cuts and proposals for a new ‘bedroom tax’ which lost support in Scotland. The Liberal Democrats went from having sixteen MSPs to only five. Conversely during elections The Opposition have no recent record in power, get far less media attention and can be more flexible on policies. Clearly the performance of a party in government can influence voting behaviour to a large extent. Party Leaders: Voters are also swayed by the image, leadership style and reputation of party leaders. This has actually become increasingly important in the outcome of
elections which has led many to comment that the UK is moving more
Page | 13

towards a US Presidential style of election. Party leaders gain increasing media attention and represent the ethos of their party. In 2010 Gordon Brown as Labour leader suffered from a very poor public image. A 2010 Ipsos-MORI poll showed that Brown came out top of the three leaders on experience and understanding of world issues. However, despite these advantages he was seen to have no personality and a dominating leadership style. To compound the issue Brown made a gaffe on live TV that sealed Labour’s fate. After meeting a former Labour voter, Gillian Duffy, he called her “a bigot” while his microphone was still on. The media had a field day. There is no doubt that Brown’s poor public image played a large part in Labour’s 2010 election defeat. The 2010 campaign also focused on the three main party leaders more than any other election in the past. There was a series of televised debates between the three main leaders where the Liberal Democrat leader, Nick Clegg, was a clear favourite. Liberal Democrat ratings shot up as a result. In the 2011 Scottish Parliament election SNP leader Alex Salmond was far more popular and had a much better public image than Labour leader Ian Grey. After a very public incident where he literally ran away from anti-cuts protesters his approval rating dropped even further and the SNP achieved a decisive victory. Clearly party leaders have an impact on voting behaviour.
Short-term Factor: The MediaThe media has a huge impact on the outcome of elections and is a major short-term factor when looking at voting behaviour. There is a distinction between old and new media. Old media includes TV, newspapers and radio while new media covers social networking sites and the internet. Some predicted that the 2010 election would see the rise of new media however; the evidence suggests that old media continued to exert the most influence on voting behaviour. Television: During elections the BBC airs Party Political Broadcasts (PPBs) for each party. The BBC should remain neutral and be non-partisan and, there are rules surrounding PPBs. They are usually broadcast around dinner time to gain the largest audience. For many this is an important way of getting information about the parties during election time. A 2011 YouGov poll showed that around 64% of adults regard TV as the most trustworthy source of information. However, PPBs are not without controversy. In 2009 the BBC had to tighten up the rules after complaints about the amount of time the BNP were allocated. The rules changed again in 2012 in order to make PPBs fairer to smaller parties and those not part of the government. It is hard to assess how important PPBs are in the modern era of the internet and how much impact they really have on voters as the system is stacked in favour of the
ruling party. In 2010 live debates between the three main party leaders were broadcast for the first time. The first debate attracted 9.9 million viewers. These debates clearly had an impact on voting
Page | 14

behaviour as the Liberal Democrat leader, Nick Clegg, came out ahead. Opinion polls at the time suggested that the popularity of the Liberal Democrats soared and placed them ahead of the other two parties for the first time in 100 years. A 2012 Reuters survey also found that the debates attracted and mobilised young voters. More than a half of those surveyed between the ages of 18-24 said they were more interested in the election as a result of the debates compared to only a quarter of those aged 55 and over. Nearly 74% of young voters surveyed said that the debates had helped them to make up their mind on how to vote. However, an estimated share of 31% of the vote for the Liberal Democrats post-debate declined to 23% just three weeks later casting doubt on the real influence of the TV debates during the election. Debates like this have also been criticised because they are heavily rehearsed and rely too much on personality. In the 2011 Scottish Parliament election the SNP won an astounding victory returning a majority government for the first time under AMS in Scotland. Many factors contributed towards election victory for the SNP and television no doubt played a part. Alex Salmond appeared on BBC Question Time in the run up to the election and made comments about the NHS and release of the Lockerbie bomber that received enthusiastic applause. This TV appearance clearly helped to win support and cement Salmond’s appearance as a strong and capable leader. Interestingly no other party leader was present on the show which may also have contributed to a poorer result for their parties. Television clearly has an impact on voting behaviour although it may not always be easy to measure. In addition, the parties themselves have to capitalise on positive media attention and opportunities to gain the support of voters. Leaders also play a part with some being more ‘media friendly’ than others.
Newspapers: Traditionally newspapers have been the main form of media associated with election campaigns. Most newspapers support a party during elections and political parties court that support believing it to be the key to electoral success. However, there is a lot of debate around how much influence newspapers really have on voting behaviour. Prior to the 1997 election the British press was largely Conservative. Blair had meetings with major newspaper and media owner Rupert Murdoch and, persuaded him to switch support to Labour. At the time News International owned four major news titles representing around 42% of the news
market including The Sun which is the most read newspaper in the UK. Tabloids like The Sun and former title News of the World tend to indulge in more biased and negative reporting than other papers which can sway voters. Research has also shown that The Sun is read by more ‘floating voters’ than other papers and gaining support in this group can often be the key to electoral success. Labour won a landslide victory achieving the biggest majority of a government since 1935. The Sun had supported the Conservatives in the 1992 General Election and post-election famously declared “It was the Sun wot won it”. The Conservative victory came as quite a surprise after divisions in the
Page | 15

party and three previous terms in office. In the 2010 General election The Sun switched back to the Conservatives who subsequently won the election and declared “Labour’s lost it”. Furthermore, the tabloids ridiculed Gordon Brown during the election and Labour suffered a defeat. In the 2011 Scottish Parliament election most major newspapers in Scotland supported the SNP; a ground-breaking election that returned a majority government for the first time in Scotland. Labour leader Ian Grey was also lampooned in the press after he was filmed running away from anti-cuts protestors. The press had a field day and polls showed a subsequent decline in support. Clearly politicians and newspapers alike believe that the press has an impact on voting behaviour and, there is some evidence to show that it does.
However, trust in the media and press has declined in recent years which have reduced their impact on voting behaviour. A 2011 YouGov poll showed that only 38% of adults trust what they read in newspapers. Events like the phone-hacking scandal and closure of News of the World had eroded trust in the press. Politicians were also implicated after Cameron’s Communications Advisor, Andy Coulson, resigned when it became clear he had been involved in the phone-hacking scandal as former editor of News of the World. Cameron and other senior members of the Conservative Party were also found to have ‘close’ relationships with top media people in the 2011 Leveson Inquiry into phone-hacking. In 2011 an IPSOS-Mori survey showed that only 14% of people in the UK trusted politicians to tell the truth. A decline in trust of the
press and politicians casts doubt over how much influence newspapers have on voting behaviour. The UK press has been more Conservative in support over the years. Papers like the Mail, the Daily Express and the Telegraph have backed the Conservatives in almost every election since 1945. Despite this Labour have managed to win nine out of seventeen elections since 1945. This shows that the press does not always reflect actual voting behaviour. In the 2007 Scottish Parliament election The Scottish Sun and The Daily Record supported Labour and were hostile to the SNP; yet the SNP won the election. Clearly the press does not dictate the outcome of elections. Some analysts argue that papers like The Sun are always seen to back the winner of an election because they wait to see which party is more likely to win. In 1997 when they switched to Labour it was obvious that the Conservatives were on a downward spiral and that Blair signalled an exciting new direction for Labour. In 2010 by the time The Sun had endorsed Cameron Sun readers had already swung to the Conservatives by 12.5%. Labour admitted that they had lost the 2010 election as far back as 2007 due to poor performance in government and divisions in the party. However, the 2010 election was won by such small margins that ‘floating voters’ were key so perhaps The Sun did win it. This is a chicken and egg scenario; which came first? It is obvious that there is a relationship between the press and the outcome of elections yet, it is very difficult to assess the level and direction of influence. It is also up to
parties and leaders themselves to make the most of the media as elections can be lost as well as won. New Media: Many predicted that new media would play a huge part in the 2010 General Election and the 2011 Scottish Parliament election and, to some extent it did. There is no
Page | 16

denying that voters access media in new ways, that there is more information available than ever before and that everyone’s opinion counts. But just how much influence do new forms of media have on voting behaviour? In 2010 all the major parties had websites using interactive features like YouTube, Twitter and Facebook. In the USA Obama successfully harnessed new media to achieve a second term in office and British parties took it very seriously. In the 2011 Scottish Parliament election the SNP utilised new media to good effect. They had Twitter feeds and Facebook links to their website which people used to get instant up-dates on developments and news. They also used the Activate voter database to link with social media, pinpoint voters and use apps to feed voters’ opinions into the database. This was used in both the 2007 and 2011 Scottish Parliament elections to great success. While the TV debates attracted millions of viewers and some party support new media also played a part. First time voters in particular watched the debates and Tweeted or posted comments at the same time. One Twitter feed dedicated to the election had 154,342
tweets relating to various terms around the third leaders' debate, coming at 26.77 tweets a second and spread among 33,095 people. A BBC commentator suggested that Twitter has the ability to counteract mainstream media views because tweets are broadcast instantly and from many viewpoints which may influence some voters.
Echo Research suggested that almost half of voters had been on the internet to look for information about the parties prior to the 2010 election and that 42% of 18-24 year olds preferred online media to any other source of information. Liberal Democrat supporters have been particularly engaged with social media more than supporters of any other party. Facebook’s democracy
page led to 14, 000 extra voter registration forms being downloaded and 9, 000 a day from the Electoral Commission’s online About My Vote campaign. All major newspapers and TV channels had blogs and commentary that was updated several times a day and actually used social media themselves to gauge public opinion. Guardian blogger, Andrew Sparrow, said that he wrote around 14, 000 words a day of political analysis and hadn’t interviewed a single person; he had used polls, Facebook and tweets to gauge opinion. Providing information, engaging potential voters and increasing voter turnout will no doubt have an impact on the outcome of elections more and more. However, the impact of new media on voting behaviour is incredibly hard to assess for a number of reasons. Tweets and Facebook comments are all very well but we don’t know who these people are, where they are or whether they actually voted. It is all too easy on social media to filter out the opinions of people that you don’t agree with and make stand-alone comments which means that meaningful debate rarely
Page | 17

happens. People are posting opinions already held rather than engaging in conversation and the parties can’t follow this up with campaigning as they are anonymous to an extent.
Social media also tends to be used by a certain demographic of people; young and liberal-minded. Rory Cellan-Jones, the BBC's technology and industrial correspondent, who has been its "digital election correspondent" during the campaign, says: "We maybe get a distorted view [via social media and especially Twitter] because people who engage with it are in general liberal-minded people." In addition,
young people are far less likely to vote with only 44% of 18-24 year olds turning out in 2010. Older voters are far less likely to be swayed in their support for a party, use traditional media more and have the highest voter turnout. Lastly social media as with all things needs to be used well to work. Around 79% of voters in 2010 could not recall any online electioneering, not even an e-mail, despite the fact that they may have used the internet to find out information. Brown’s ‘bigotgate’ scandal spread like wildfire thanks to social networking sites and arguably signaled the end of a disastrous campaign. In his recent bid to be elected as Mayor of London Boris Johnson was caught admitting that his bus improvement policy would cost £100 million and not the £8 million he claimed. He still won but his lead was dented by the gaffe. Clearly new media is useful, increasingly important and influential in election campaigns. However, it is also easy to overstate the impact that social media might have on voting behaviour. It is too difficult to measure and too age-specific to be able to assess accurately the real impact of new media on the outcome of elections. New media as an influence is also heavily intertwined with other factors like the image of party leaders, age and issues at the time.
Page | 18