kindlin-3–mediated integrin adhesion is dispensable for
TRANSCRIPT

Article
The Rockefeller University Press $30.00J. Exp. Med. 2015 Vol. 212 No. 9 1415–1432www.jem.org/cgi/doi/10.1084/jem.20150269
1415
The entire hematopoietic system is derived from, and maintained by, a small number of hemato-poietic stem cells (HSCs) that reside in the BM. HSCs are characterized by their low cycling rate and their ability to self-renew throughout the life span of an organism. After hematopoietic injury (e.g., bleeding), quiescent HSCs become activated, replenish the pool of hematopoietic effector cells, and return to the quiescent state (Trumpp et al., 2010). To maintain HSCs through-out the life of an animal, the oscillation of HSCs between quiescence, activation, self-renewal, and differentiation is precisely regulated in a specific microenvironment referred to as the stem cell niche (Morrison and Scadden, 2014). The oscillation of HSCs is regulated through interactions with niche cells (Kiel and Morrison, 2008), extracellular matrix (ECM) proteins (van der Loo et al., 1998), the action of cytokines, chemokines, and growth factors that are re-leased by niche cells (Rizo et al., 2006), and calcium gradients established by osteoclasts dur-ing bone remodeling (Adams et al., 2006). Thus,
an impairment of the HSC–niche interplay can result in loss of quiescence, uncontrolled activa-tion, and finally exhaustion of HSCs.
The interactions of HSCs with niche cells and ECM are mediated by adhesion molecules such as integrins (Wilson and Trumpp, 2006). Integrins are expressed on all cells including tissue stem cells, where they mediate binding to ECM and counter receptors (Hynes, 2002). The composition of niche cells and ECM com-ponents is unique in each organ, and hence tis-sue stem cells express specific integrin profiles to interact with their niche microenvironment. The integrin profile of HSCs includes multiple members of the 1 class (21, 41, 51, 61, and 91), L2 from the 2 class, and v3 from the v class (Grassinger et al., 2009).
CORRESPONDENCE Reinhard Fässler: [email protected]
Abbreviations used: 5-FU, 5-fluorouracil; CFU-C, CFU-culture; ECM, extracellular matrix; FL, fetal liver; HPC, hematopoietic progenitor cell; HSC, hematopoietic stem cell; HSPC, hematopoietic stem and progenitor cell; LAD-III, leuko-cyte adhesion deficiency type III; LRC, label-retaining cell; LSK+, lineageSca-1c-kit+; LSK, lineageSca-1+c-kit+; LTC-IC, long-term culture-initiating cell; MNC, mono-nuclear cell; PB, peripheral blood; Spl, spleen; WBM, whole BM.
Kindlin-3–mediated integrin adhesion is dispensable for quiescent but essential for activated hematopoietic stem cells
Raphael Ruppert,1 Markus Moser,1 Markus Sperandio,2 Emanuel Rognoni,1 Martin Orban,3 Wen-Hsin Liu,1 Ansgar S. Schulz,4 Robert A.J. Oostendorp,5 Steffen Massberg,3 and Reinhard Fässler1
1Department of Molecular Medicine, Max Planck Institute of Biochemistry, 82152 Martinsried, Germany2Walter Brendel Center of Experimental Medicine, Ludwig Maximilian University, 80539 Munich, Germany3Medical Clinic and Policlinic I, Klinikum der Universität, 80336 Munich, Germany4Department of Pediatrics and Adolescent Medicine, University Medical Center Ulm, 89081 Ulm, Germany5Third Department of Internal Medicine, Klinikum rechts der Isar, Technische Universität, 80337 Munich, Germany
Hematopoietic stem cells (HSCs) generate highly dividing hematopoietic progenitor cells (HPCs), which produce all blood cell lineages. HSCs are usually quiescent, retained by integrins in specific niches, and become activated when the pools of HPCs decrease. We report that Kindlin-3–mediated integrin activation controls homing of HSCs to the bone marrow (BM) and the retention of activated HSCs and HPCs but not of quiescent HSCs in their BM niches. Consequently, Kindlin-3–deficient HSCs enter quiescence and remain in the BM when cotransplanted with wild-type hematopoietic stem and progenitor cells (HSPCs), whereas they are hyperactivated and lost in the circulation when wild-type HSPCs are absent, leading to their exhaustion and reduced survival of recipients. The accumulation of HSPCs in the circulation of leukocyte adhesion deficiency type III patients, who lack Kindlin-3, underlines the conserved functions of Kindlin-3 in man and the importance of our findings for human disease.
© 2015 Ruppert et al. This article is distributed under the terms of an Attribution– Noncommercial–Share Alike–No Mirror Sites license for the first six months after the publication date (see http://www.rupress.org/terms). After six months it is available under a Creative Commons License (Attribution–Noncommercial–Share Alike 3.0 Unported license, as described at http://creativecommons.org/ licenses/by-nc-sa/3.0/).
The
Journ
al o
f Exp
erim
enta
l M
edic
ine
on October 8, 2015
jem.rupress.org
Dow
nloaded from
Published August 17, 2015
http://jem.rupress.org/content/suppl/2015/08/17/jem.20150269.DC1.html Supplemental Material can be found at:

1416 Kindlin-3 is essential for activated HSCs and HPCs | Ruppert et al.
Figure 1. Survival of K3/ chimeras and distribution of K3/ HSPCs. (A) Kaplan-Meier survival curve of first generation K3+/+ and K3/ FL chi-meras. ***, P < 0.0001 by log-rank test. n = 41–47 per genotype; 15 independent experiments. (B) Representative FACS plots showing FL MNCs gated for lin cells (left), expression of AA4.1 and Mac-1 on lin cells (middle), and c-kit and Sca-1 expression on linAA4.1+Mac-1med cells (right). Shown are the percentages of events within the gate ± SD. n = 8–9 per genotype. (C) Total number of FL MNCs from E14.5 embryos. n = 22–23 per genotype; four inde-pendent experiments. (D) Quantification of overall frequencies (percentage of live leukocytes) of LSK cells in E14.5 FLs. Error bars represent mean percent-age ± SD. n = 8–9 per genotype. (C and D) ***, P < 0.0001 by unpaired t test. (E) Total number of LSK cells in E14.5 FLs. ns, P = 0.3527 by unpaired t test. n = 8–9 per genotype. (F) Frequency of CFU-Cs in E14.5 FLs. Error bars represent mean frequency ± SD. **, P = 0.0021 by Mann-Whitney test. n = 10 per genotype; three independent experiments. (G) LTC-IC assay performed with FL MNCs by limiting dilutions. Percentage of wells without CFUs is plotted against the MNC number. The frequency of LTC-ICs is shown. P < 0.0001 by Pearson’s 2 test. n = 4 per genotype; two independent experiments. (H) Total number of CFU-Cs in E14.5 FLs. ***, P = 0.0002 by unpaired t test. (I) Total number of LTC-ICs per FL of E14.5 embryos. ns, P > 0.05 by Mann-Whitney test. (H and I) n = 22–23 per genotype; four independent experiments. (J) Total number of MNCs from BM and whole Spl. Data are mean cell counts ± SD.
on October 8, 2015
jem.rupress.org
Dow
nloaded from
Published August 17, 2015
JEM Vol. 212, No. 9
Article
1417
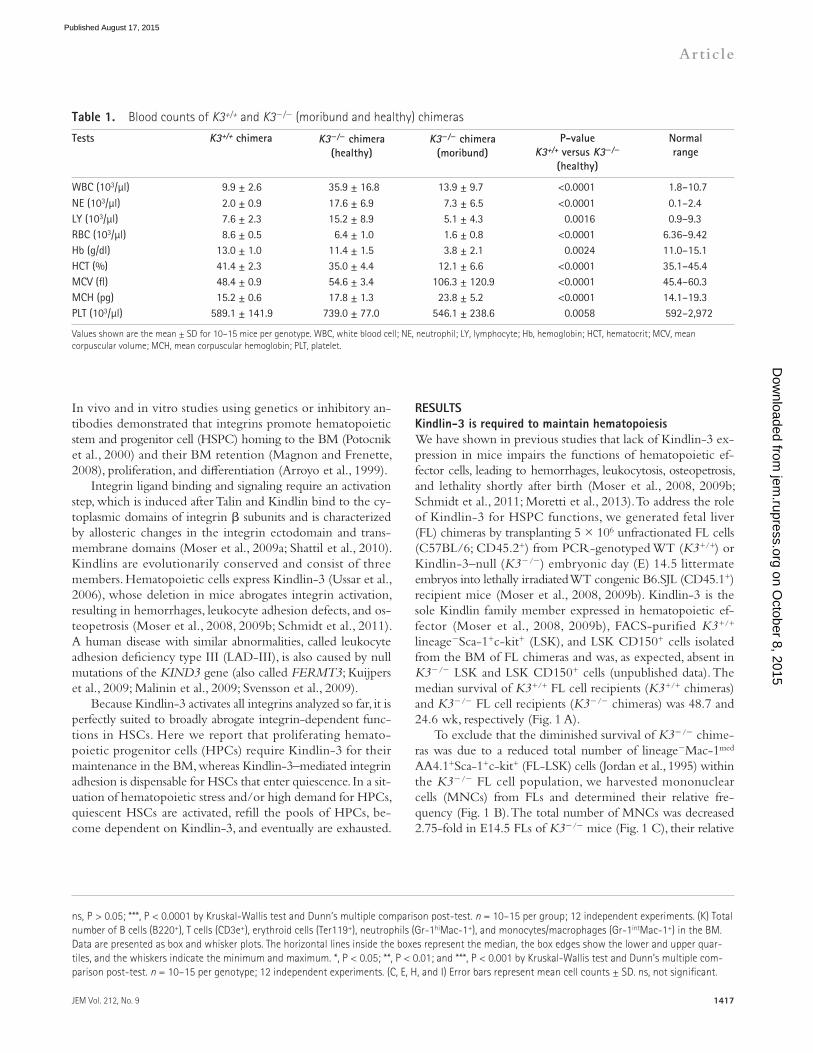
RESULTSKindlin-3 is required to maintain hematopoiesisWe have shown in previous studies that lack of Kindlin-3 ex-pression in mice impairs the functions of hematopoietic ef-fector cells, leading to hemorrhages, leukocytosis, osteopetrosis, and lethality shortly after birth (Moser et al., 2008, 2009b; Schmidt et al., 2011; Moretti et al., 2013). To address the role of Kindlin-3 for HSPC functions, we generated fetal liver (FL) chimeras by transplanting 5 × 10⁶ unfractionated FL cells (C57BL/6; CD45.2+) from PCR-genotyped WT (K3+/+) or Kindlin-3–null (K3/) embryonic day (E) 14.5 littermate embryos into lethally irradiated WT congenic B6.SJL (CD45.1+) recipient mice (Moser et al., 2008, 2009b). Kindlin-3 is the sole Kindlin family member expressed in hematopoietic ef-fector (Moser et al., 2008, 2009b), FACS-purified K3+/+ lineageSca-1+c-kit+ (LSK), and LSK CD150+ cells isolated from the BM of FL chimeras and was, as expected, absent in K3/ LSK and LSK CD150+ cells (unpublished data). The median survival of K3+/+ FL cell recipients (K3+/+ chimeras) and K3/ FL cell recipients (K3/ chimeras) was 48.7 and 24.6 wk, respectively (Fig. 1 A).
To exclude that the diminished survival of K3/ chime-ras was due to a reduced total number of lineageMac-1med AA4.1+Sca-1+c-kit+ (FL-LSK) cells (Jordan et al., 1995) within the K3/ FL cell population, we harvested mononuclear cells (MNCs) from FLs and determined their relative fre-quency (Fig. 1 B). The total number of MNCs was decreased 2.75-fold in E14.5 FLs of K3/ mice (Fig. 1 C), their relative
In vivo and in vitro studies using genetics or inhibitory an-tibodies demonstrated that integrins promote hematopoietic stem and progenitor cell (HSPC) homing to the BM (Potocnik et al., 2000) and their BM retention (Magnon and Frenette, 2008), proliferation, and differentiation (Arroyo et al., 1999).
Integrin ligand binding and signaling require an activation step, which is induced after Talin and Kindlin bind to the cy-toplasmic domains of integrin subunits and is characterized by allosteric changes in the integrin ectodomain and trans-membrane domains (Moser et al., 2009a; Shattil et al., 2010). Kindlins are evolutionarily conserved and consist of three members. Hematopoietic cells express Kindlin-3 (Ussar et al., 2006), whose deletion in mice abrogates integrin activation, resulting in hemorrhages, leukocyte adhesion defects, and os-teopetrosis (Moser et al., 2008, 2009b; Schmidt et al., 2011). A human disease with similar abnormalities, called leukocyte adhesion deficiency type III (LAD-III), is also caused by null mutations of the KIND3 gene (also called FERMT3; Kuijpers et al., 2009; Malinin et al., 2009; Svensson et al., 2009).
Because Kindlin-3 activates all integrins analyzed so far, it is perfectly suited to broadly abrogate integrin-dependent func-tions in HSCs. Here we report that proliferating hemato-poietic progenitor cells (HPCs) require Kindlin-3 for their maintenance in the BM, whereas Kindlin-3–mediated integrin adhesion is dispensable for HSCs that enter quiescence. In a sit-uation of hematopoietic stress and/or high demand for HPCs, quiescent HSCs are activated, refill the pools of HPCs, be-come dependent on Kindlin-3, and eventually are exhausted.
ns, P > 0.05; ***, P < 0.0001 by Kruskal-Wallis test and Dunn’s multiple comparison post-test. n = 10–15 per group; 12 independent experiments. (K) Total number of B cells (B220+), T cells (CD3e+), erythroid cells (Ter119+), neutrophils (Gr-1hiMac-1+), and monocytes/macrophages (Gr-1intMac-1+) in the BM. Data are presented as box and whisker plots. The horizontal lines inside the boxes represent the median, the box edges show the lower and upper quar-tiles, and the whiskers indicate the minimum and maximum. *, P < 0.05; **, P < 0.01; and ***, P < 0.001 by Kruskal-Wallis test and Dunn’s multiple com-parison post-test. n = 10–15 per genotype; 12 independent experiments. (C, E, H, and I) Error bars represent mean cell counts ± SD. ns, not significant.
Table 1. Blood counts of K3+/+ and K3/ (moribund and healthy) chimeras
Tests K3+/+ chimera K3/ chimera (healthy)
K3/ chimera (moribund)
P-value K3+/+ versus K3/
(healthy)
Normal range
WBC (103/µl) 9.9 ± 2.6 35.9 ± 16.8 13.9 ± 9.7 <0.0001 1.8–10.7NE (103/µl) 2.0 ± 0.9 17.6 ± 6.9 7.3 ± 6.5 <0.0001 0.1–2.4LY (103/µl) 7.6 ± 2.3 15.2 ± 8.9 5.1 ± 4.3 0.0016 0.9–9.3RBC (103/µl) 8.6 ± 0.5 6.4 ± 1.0 1.6 ± 0.8 <0.0001 6.36–9.42Hb (g/dl) 13.0 ± 1.0 11.4 ± 1.5 3.8 ± 2.1 0.0024 11.0–15.1HCT (%) 41.4 ± 2.3 35.0 ± 4.4 12.1 ± 6.6 <0.0001 35.1–45.4MCV (fl) 48.4 ± 0.9 54.6 ± 3.4 106.3 ± 120.9 <0.0001 45.4–60.3MCH (pg) 15.2 ± 0.6 17.8 ± 1.3 23.8 ± 5.2 <0.0001 14.1–19.3PLT (103/µl) 589.1 ± 141.9 739.0 ± 77.0 546.1 ± 238.6 0.0058 592–2,972
Values shown are the mean ± SD for 10–15 mice per genotype. WBC, white blood cell; NE, neutrophil; LY, lymphocyte; Hb, hemoglobin; HCT, hematocrit; MCV, mean corpuscular volume; MCH, mean corpuscular hemoglobin; PLT, platelet.
on October 8, 2015
jem.rupress.org
Dow
nloaded from
Published August 17, 2015

1418 Kindlin-3 is essential for activated HSCs and HPCs | Ruppert et al.
Figure 2. BM homing of K3/ LSK cells. (A) Short-term homing assay with labeled BM LSK cells; mean percentages ± SD. **, P = 0.0046 by unpaired t test. n = 5–6 per genotype; 10 independent experiments. (B) Quantification of extravasated cells per 105 injected LSK cells in BM by intravital two-photon microscopy 18 h after transplantation, given as mean value ± SD. *, P = 0.0159 by Mann-Whitney test. n = 4–5 per genotype; nine independent
on October 8, 2015
jem.rupress.org
Dow
nloaded from
Published August 17, 2015

JEM Vol. 212, No. 9
Article
1419
Kindlin-3 is required for BM homing of LSK cellsHoming of HSPCs to the BM requires 1 integrins (Potocnik et al., 2000; Magnon and Frenette, 2008) whose affinity for ligands is controlled by Kindlin-3 (Moser et al., 2009a). To assess short-term homing, we FACS-isolated LSK cells from the BM of K3+/+ and K3/ chimeras and fluorescently labeled and injected them into lethally irradiated WT recipi-ent mice. We found that K3/ LSK cells homed approxi-mately five times less efficiently to the BM than K3+/+ LSK cells 18 h after transplantation (Fig. 2 A). These findings were confirmed by intravital two-photon microscopy imaging of the central sinus and the surrounding BM cavity of the mouse calvaria 6 and 18 h after transplantation (Fig. 2, B–F). Closer analysis revealed a significant reduction of K3/ LSK cells firmly adhering to the vessel surface (defined as adhesion to the same spot for at least 60 s; Fig. 2 D). Although K3+/+ LSK cells remained at the same spot for up to 30 min, most K3/ LSK cells remained at the same spot for just a few seconds (Fig. 2, E and F; and Video 1, Video 2, and Video 3).
The similar integrin expression profile of K3+/+ and K3/ LSK cells (Fig. 2 G) indicated that integrin function, rather than integrin levels, was affected by the loss of Kindlin-3. To test this hypothesis, we analyzed integrin-dependent ad-hesion of LSK cells in an ex vivo microflow chamber assay (Frommhold et al., 2008). Consistent with previous findings (Mazo et al., 2011), the numbers of adherent K3+/+ LSK cells from the BM of K3+/+ chimeras (Fig. 2 H) or K3+/+ FL (Fig. 2 I) were highest on surfaces coated with recombinant mouse (rm) VCAM-1, rmE-selectin, and rmCXCL12 and were blocked with antibodies against 4 integrin. In sharp contrast, K3/ LSK cells from BM of K3/ chimeras (Fig. 2 H) or K3/ FL (Fig. 2 I) adhered poorly to rmVCAM-1, rmE-selectin, and rmCXCL12 or rmE-selectin with or without rmVCAM-1. Importantly though, the low level adhesion of K3/ LSK cells was still sufficient to enable residual homing to the BM compartment (Fig. 2, A–C). The inability of K3+/+ and K3/ LSK cells from the FL and BM to adhere to immobilized ICAM-1 under flow (unpublished data) suggests that 41 in-tegrin is the predominant adhesion receptor that requires Kindlin-3 to arrest LSK cells under flow conditions.
FL-LSK cell number was significantly elevated (Fig. 1, B and D), and the absolute FL-LSK cell number was similar in K3+/+ and K3/ mice (Fig. 1 E). Assessment of committed HPCs with the CFU-culture (CFU-C) assay and more im-mature, long-term culture-initiating cells (LTC-ICs) revealed that the frequencies of CFU-Cs as well as LTC-ICs were in-creased in MNCs of K3/ FLs (Fig. 1, F and G). Interest-ingly, whereas the absolute numbers of CFU-Cs per FL were decreased (Fig. 1 H), the absolute numbers of LTC-ICs per FL were normal (Fig. 1 I). Immunostaining with antibodies against CD31, EpCAM, CD45.2, Mac-1, Gr-1, and B220 re-vealed a normal vasculature and distribution of hematopoi-etic effector cells in K3/ FLs (unpublished data). These data exclude reduced numbers of FL-LSK cells, CFU-Cs, and LTC-ICs in K3/ FLs as a cause for the decreased survival of K3/ chimeras.
Next, we tested whether the diminished survival of K3/ chimeras was caused by impaired lineage cell differentiation and expansion. To this end, we quantified different hema-topoietic lineages in BM, spleen (Spl), and peripheral blood (PB) of moribund and healthy chimeras 3–4 mo after trans-plantation. Moribund K3/ chimeras displayed a pronounced pancytopenia in the BM, affecting B, T, and erythroid cells, neutrophils, and monocytes/macrophages, and in PB and Spl, affecting B, T, and erythroid cells, which was never observed in K3+/+ chimeras (Fig. 1, J and K; Table 1; and unpublished data). Healthy K3/ chimeras had normal numbers of MNCs in BM and Spl and increased numbers in PB. Although the lymphoid, erythroid, and myeloid cell numbers were differen-tially affected in these compartments (Fig. 1, J and K; Table 1; and unpublished data), they were still present in sufficient numbers to exclude a severely reduced effector cell expansion as a cause for the increased lethality of K3/ chimeras. Histol-ogy and immunohistochemistry of bone sections also excluded osteopetrosis, altered collagen and fibronectin distributions, or an aberrant vasculature in K3/ chimeras as an underly-ing cause for their lethality (unpublished data). To avoid sec-ondary abnormalities because of imminent death, all further experiments were performed with “healthy” K3/ chimeras that had a normal physical appearance and no anemia.
experiments. (C) Representative images illustrating transmigration of LSK cells up to 6 h after injection in Col2.3-GFP recipients. White (CMTMR), LSK cells; green (GFP), osteoblasts; blue (second harmonic signal), bone; and red (Q-Tracker 695 nm), blood. Arrowheads indicate LSK cells transmigrating across endothelium (white dashed lines); left panels, before transmigration; right panels, after transmigration. (D) LSK cells visualized in BM microvessels for up to 6 h after injection. Mean ± SD. ***, P = 0.0006 by unpaired t test. n = 5 per genotype; 10 independent experiments. (E) Firm adherent cells shown in D grouped according to their residence time on the BM endothelium and shown as frequencies ± SEM of the absolute number of visualized cells. ***, P < 0.0001 for <1 min; **, P = 0.0037 for >1 min; ***, P = 0.0008 for >10 min, by Fisher’s test. (F) Representative images of adherent LSK cells at the indicated time after transfer. Red (CMTMR), LSK cells; blue (second harmonic signal), bone; and green (FITC dextran), blood. Arrows, arrowheads, and asterisk indi-cate different single LSK cells, and the white dashed lines outline the endothelium. (G) Surface expression of integrins on LSK cells isolated from BM (top) or FL cells (bottom) is presented as histograms of the mean fluorescence intensity for the indicated anti-integrin mAb on K3+/+ (blue lines) or K3/ cells (red lines). Isotype controls are indicated as shaded histograms. n = 3–4 per group; three to four independent experiments. (H and I) Adhesion analysis of sorted K3+/+, with or without preincubation with an anti–4 integrin–blocking mAb, and K3/ BM (H) or E14.5 FL LSK (I) cells under shear in microflow chambers precoated with rmE-selectin alone (E), rmE-selectin and VCAM-1, or rmE-selectin, CXCL12, and VCAM-1. Error bars represent the mean percent-age of adherent cells to total LSK cells ± SEM. ns, P > 0.05; *, P < 0.05; **, P < 0.01 by Kruskal-Wallis test and Dunn’s multiple comparison post-test. n ≥ 4 per group; 10 independent experiments. ns, not significant. Bars, 50 µm.
on October 8, 2015
jem.rupress.org
Dow
nloaded from
Published August 17, 2015

1420 Kindlin-3 is essential for activated HSCs and HPCs | Ruppert et al.
HSCs are present in the BM of K3/ chimerasOur findings indicate that K3/ LSK cells home into the BM, although less efficiently than K3+/+ cells. To test whether HSPCs were also present in the BM of K3/ chimeras at later time points after transplantation, we performed CFU-C and LTC-IC assays with donor-derived BM cells 4 mo after trans-plantation and found similar numbers of CFU-Cs and a simi-lar frequency of LTC-ICs in the K3+/+ and K3/ BM (Fig. 3, A and B). To confirm this finding, we phenotypically identified and quantified HSPCs with FACS using antibodies against CD34, CD150, and CD48 (Kiel et al., 2005; Morita et al., 2010). In all K3/ chimeras analyzed, the total number of K3/ LSK cells in the BM was normal, whereas LSK sub-populations were markedly altered (Fig. 3, C and D). The LSK CD150+CD48 population containing the CD34 (highly enriched for quiescent HSCs) and CD34+ (less quiescent HSCs) subpopulations (Wilson et al., 2008) was significantly reduced, whereas the LSK CD150+CD48+ and LSK CD150 CD48+ populations, containing HPCs, were increased (Fig. 3, C and D), which indicates a shift from quiescent HSCs to pro-liferating HPCs in the BM of K3/ chimeras.
To determine whether populations highly enriched in HSCs change over time in the BM, we analyzed the chimeras 1, 2, 4, and 9–13 mo after FL-MNC transplantation. Although the transplanted K3/ FL cells contained twice as many HSPCs (Fig. 1, B–I), 1 mo after FL cell transplantation the percentage of LSK CD150+CD48 cells was lower and the percentage of LSK CD150+CD48+ cells higher in the K3/ than in the K3+/+ LSK population (Fig. 3 E), whereas the total numbers of LSK CD150+CD48CD34 and LSK CD150+CD48 cells were similar (Fig. 3, F and G). Furthermore, the LSK CD150+CD48CD34 and LSK CD150+CD48
Figure 3. Kindlin-3–deficient HSCs home to the BM. (A) Frequency of CFU-Cs in sorted CD45.2+ BM cells from chimeras 4 mo after trans-plantation. Mean cell counts ± SD. P = 0.8857 by Mann-Whitney test. n = 4 per genotype; three independent experiments. (B) LTC-IC assay performed with donor-derived BM-MNCs from chimeras 4 mo after
transplantation. The percentage of wells without CFUs is plotted against the MNC number. The frequency of LTC-ICs is shown. P = 0.0965 by Pearson’s 2 test. n = 4 per genotype; three independent experiments. (C) Represen-tative FACS plots of BM HSPCs 1–13 mo after transplantation analyzed with signaling lymphocytic activation molecule (SLAM) markers. The left panels show c-kit and Sca-1 expression on lin cells. Numbers refer to the percentages of live leukocytes ± SD. n = 24–27 per genotype; 10 in-dependent experiments. (D) Quantification of C. LSK (P > 0.05 by unpaired t test); LSK CD150CD48+ (*, P = 0.0121 by unpaired t test); LSK CD150+CD48+ (***, P < 0.0001 by unpaired t test); LSK CD150+CD48 (***, P < 0.0001 by Mann-Whitney test); LSK CD150+CD48CD34+ (***, P = 0.0003 by unpaired t test); and LSK CD150+CD48CD34 cells (***, P < 0.0001 by Mann-Whitney test). Mean cell numbers ± SD are given. (E) Representative FACS plots of BM LSK cells at the indicated time after transplantation gated for CD150 against CD48. Numbers represent mean percentage ± SD of events within the LSK population. n = 3–11 per geno-type and time point; three independent experiments. (F and G) Quantifica-tion at the indicated time after transplantation of BM LSK CD150+CD48 (1 mo: P = 0.4278; 4 mo and 9–13 mo: ***, P < 0.0001 by unpaired t test; F) and LSK CD150+CD48CD34 cells (1 mo: P = 0.4642 by Mann-Whitney test; 4 mo: ***, P = 0.0005 by unpaired t test; 9–13 mo: **, P = 0.002 by unpaired t test; G). Cells are shown as mean percentage ± SD. n = 6–10 per genotype; four independent experiments. ns, not significant.
on October 8, 2015
jem.rupress.org
Dow
nloaded from
Published August 17, 2015

JEM Vol. 212, No. 9
Article
1421
chimeras (Fig. 4 I). Furthermore, transplantation of PB MNCs together with rescue Spl cells into lethally irradiated recipi-ents demonstrated that K3+/+ PB MNCs hardly contributed to total leukocytes and myeloid and lymphoid (i.e., B and T cells) lineages, whereas PB MNCs from K3/ chimeras readily contributed to a multilineage hematopoietic chime-rism in recipient mice up to 16 wk after transplantation, in-dicating that the PB of K3/ chimeras contains increased numbers of circulating HSPCs (Fig. 4 J). The absence of K3/ T cells in the recipients is due to an extravasation de-fect of pre–T cells into the thymus (unpublished data).
To confirm the BM retention defect, we also induced mo-bilization of HSPCs with G-CSF (Fig. 4 K). G-CSF treatment increased LSK cells in the PB of K3+/+ chimeras to the same extent as in PBS-treated K3/ chimeras, whereas LSK num-bers rose even further in the PB of K3/ chimeras (Fig. 4 K). The increase of LSK cells was less pronounced in K3/ (nine-fold) than in K3+/+ chimeras (70-fold), which is because of the inherent release of K3/ LSK cells before the treatment.
Altogether, these data demonstrate that K3/ HSPCs are inefficiently retained in the BM and that the retention defect triggers an enhanced cycling of HSCs in K3/ chimeras, which is probably further aggravated via HSCs activating feedback signals triggered by the K3/ effector cell defects (such as anemia, leukocytosis, etc.; Moser et al., 2008, 2009b; Trumpp et al., 2010).
Accelerated loss of HSCs in K3/ chimerasQuiescent HSCs mediate multilineage long-term reconstitu-tion (Wilson et al., 2008; Trumpp et al., 2010). Because HSCs in the K3/ chimeras were activated, we hypothesized that multilineage long-term reconstitution, and thus survival of recipient mice exposed to an extreme hematopoietic stress such as serial BM transplantations or weekly 5-FU adminis-tration, is severely impaired without Kindlin-3. Although the first generation K3/ chimeras suffered from increased le-thality (Fig. 1 A), 50% of them maintained a multilineage long-term reconstitution for >5 mo. We isolated 5 × 10⁶ whole BM (WBM) cells from these mice and transferred them intra-venously into lethally irradiated secondary WT congenic B6.SJL recipients. Although all 42 recipients transplanted with K3+/+ WBM cells were radio-protected for >10 wk, only 4 out of the 55 recipients of K3/ WBM cells were able to survive for 10 wk. We next transferred 5 × 10⁶ WBM cells from nine K3+/+ and each of the four surviving K3/ second genera-tion donors to five tertiary recipients and observed that within 10 wk after transplantation, 41 out of the 45 recipients of K3+/+ WBM cells were protected against lethal irradiation, whereas all 20 recipients of K3/ WBM cells succumbed. As expected, K3+/+ WBM cells enabled long-term engraft-ment even in quaternary (Fig. 5 A) and quinary recipients (unpublished data).
To ensure that the severe reconstitution defect of K3/ WBM cells did not result from a reduced number of HSPCs in transplanted WBM cells but rather from HSPC dysfunc-tions, we transplanted 103 FACS-sorted LSK CD150+ cells
cell numbers increased over time in the K3+/+ BM and re-mained low in the K3/ BM (Fig. 3, F and G). These results indicate that HSCs are present in the BM of K3/ chimeras but fail to expand with time.
Kindlin-3 is required to retain proliferating HSPCs in the BMThe diminished HSC-enriched populations in the K3/ BM could result from increased cell death, increased prolifera-tion, enhanced differentiation into multipotent progenitors, and/or impaired BM retention, which would lead, in all cases, to their premature loss. The similar Annexin V/7AAD levels on different K3+/+ and K3/ HSPC populations isolated from the BM of K3+/+ and K3/ chimeras excluded an in-creased cell death as a cause for a premature loss of K3/ HSCs (unpublished data). To test whether HSCs are hyperac-tive, we first determined the sensitivity of K3+/+ and K3/ chimeras to the cytostatic drug 5-fluorouracil (5-FU), which eliminates cycling, but not quiescent, HSCs (Essers et al., 2009). In response to 5-FU treatment, 2 out of 22 K3+/+ chi-meras and all K3/ chimeras died, suggesting that HSCs are actively cycling in K3/ chimeras and quiescent HSCs are absent or exist in very low numbers. Pretreatment with polyI:C, which drives HSCs into the cell cycle (Essers et al., 2009) by inducing expression of type I interferons (IFN- and IFN-), also sensitized K3+/+ chimeras to 5-FU (Fig. 4, A and B).
The increased proliferative activity of K3/ HSPCs was confirmed by a BrdU assay with a 12–14-h uptake phase. The assay revealed that 3–4 mo after BM transplantation, the percentages of BrdU+ LSK (HPCs), LSK CD150+CD48, and LSK CD150+CD34 (HSCs) cells were increased in the K3/ BM, whereas the percentage of highly proliferative BrdU+ lineageSca-1c-kit+(LSK+) cells was similar in the BM of K3+/+ and K3/ chimeras (Fig. 4 C). Consistently, Ki67 measurements in LSK cells revealed a small but signifi-cant increase of Ki67+ LSK cells in the K3/ BM (Fig. 4 D), and quantification of mRNA levels of the cyclin-dependent kinase inhibitors p21, p27, and p57 in LSK CD150+ cells re-vealed significantly decreased levels of p57, known to main-tain quiescence and stemness of HSCs (Fig. 4 E; Matsumoto et al., 2011; Zou et al., 2011).
Finally, label-retaining cell (LRC) assays (Wilson et al., 2008) further corroborated a reduced number of slowly dividing HSCs in the K3/ BM. Administration of BrdU for 16 d labeled all HSPC populations in K3+/+ and K3/ BM (unpublished data). After a BrdU-free chase of 45 d, the percentage of BrdU LRCs in the LSK, LSK CD150CD48+, LSK CD150+CD48+, LSK CD150+CD48, and LSK CD150+CD34 cells was sig-nificantly diminished in the K3/ BM (Fig. 4 F).
Despite the high proliferative activity of K3/ HSPCs, the numbers of MNCs (Fig. 1 J) or LSK cells (Fig. 3 D) were not increased in the BM of healthy K3/ chimeras, sug-gesting that in addition to their proliferation defect, K3/ HSPCs are not retained in the BM. In line with a retention defect, we observed increased frequencies and total numbers of LSK+ in PB and LSK cells in Spl and PB (Fig. 4, G and H) and increased frequencies of CFU-Cs in Spl and PB of K3/
on October 8, 2015
jem.rupress.org
Dow
nloaded from
Published August 17, 2015

1422 Kindlin-3 is essential for activated HSCs and HPCs | Ruppert et al.
Figure 4. K3/ HSCs remain hyperactive and accumulate in the PB. (A and B) PolyI:C and 5-FU double treatment of K3+/+ and K3/ chimeras. (A) Dia-gram showing drug combinations and timing. (B) Kaplan-Meier survival curves. ***, P < 0.0001 by log-rank test. n = 16–22 per treatment group; five inde-pendent experiments. (C) In vivo BrdU uptake assay shown as mean percentage ± SD of BrdU+ cells. BrdU levels were measured 12–14 h after injection in
on October 8, 2015
jem.rupress.org
Dow
nloaded from
Published August 17, 2015
JEM Vol. 212, No. 9
Article
1423
Altogether, our findings point to a continuous loss of proliferating K3/ HSPCs into the circulation. This loss oc-curs independent of homing and niche lodgment and is asso-ciated with the activation and exhaustion of K3/ HSCs.
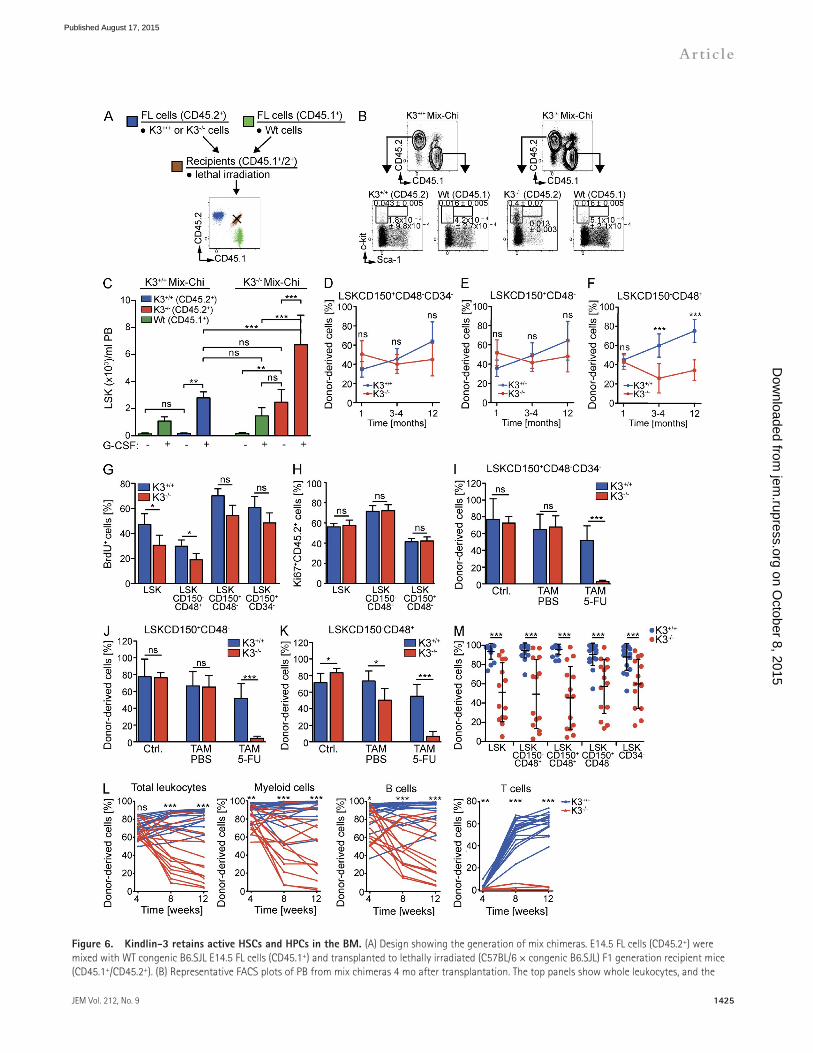
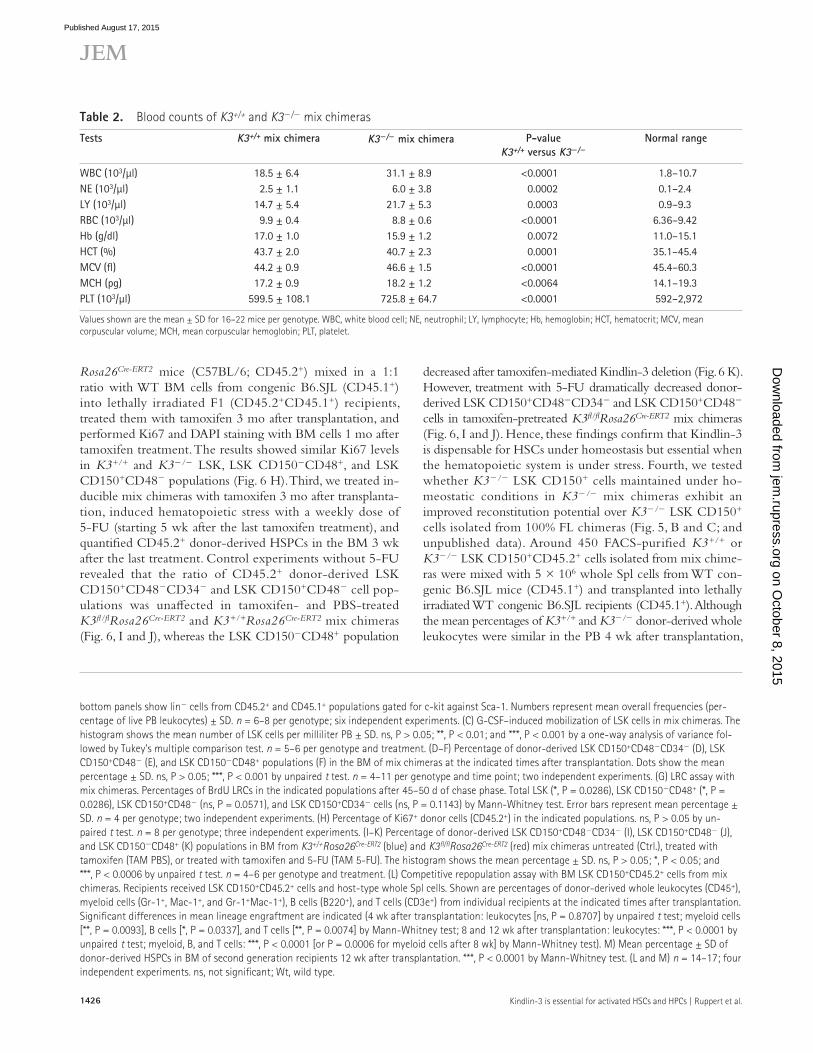
Kindlin-3 is required to maintain active HSCs and HPCsHematopoietic injury (i.e., blood loss) activates quiescent HSCs (termed feedback activation) until the hematopoietic system regains homeostasis (Trumpp et al., 2010). K3/ chi-meras suffer from anemia and dysfunctional effector cells (Moser et al., 2008, 2009b), which can induce the activation of K3/ HSCs. To test whether the defects observed in K3/ HSCs are independent of dysfunctional effector cells, we generated mixed chimeric mice (mix chimeras) with FL cells from E14.5 K3+/+ or K3/ embryos (C57BL/6; CD45.2+) mixed with competitor FL cells from E14.5 WT congenic B6.SJL (CD45.1+) embryos and transplanted both together into lethally irradiated F1 recipients (CD45.2+ CD45.1+; Fig. 6 A) in a 1:1 ratio for K3+/+ and 1:1 or 20:1 for K3/ mix chimeras, respectively. Although this approach efficiently prevented anemia development in K3/ mix chimeras (Table 2), the K3/ (CD45.2+) LSK+ and LSK cell numbers were still significantly elevated in the PB when compared with WT LSK+ and LSK competitor cells (CD45.1+; Fig. 6 B). G-CSF treatment induced a further increase of K3/ LSK+ and LSK cells, although less pronounced than in WT competitor cells because of their high basal mobiliza-tion (Fig. 6 C). Characterization of the donor-derived HSPC populations in the BM revealed that the LSK CD150+ CD48CD34 or LSK CD150+CD48 cell numbers were similar between K3+/+ and K3/ mix chimeras and remained stable during the entire observation period of 12 mo after transplantation (Fig. 6, D and E), whereas the mean percent-ages of donor-derived LSK CD150CD48+ cells increased in K3+/+ and decreased in K3/ mix chimeras (Fig. 6 F). These findings indicate that in the presence of WT competitor cells,
from the BM of K3+/+ and K3/ primary donor FL chime-ras (CD45.2+) supplemented with 5 × 10⁶ whole Spl cells from WT congenic B6.SJL mice (CD45.1+) into lethally ir-radiated WT congenic B6.SJL recipients (CD45.1+). The experiments revealed that K3+/+ LSK CD150+ donor cells induced a high percentage of donor-derived myeloid, B, and T cells in the PB 5 wk after transplantation, which further increased at 11 wk. In contrast, recipients of K3/ LSK CD150+ donor cells showed a significantly lower multilin-eage reconstitution in the PB 5 wk after transplantation that further declined after 11 wk (Fig. 5 B). Almost all differenti-ated cell lineages in the BM and Spl of K3+/+ LSK CD150+ cell recipients were donor derived, whereas <5% were donor derived in recipients of K3/ LSK CD150+ cells (unpub-lished data). Furthermore, almost all cells in the different HSPC populations within the BM were donor derived in K3+/+ LSK CD150+ cell recipients, whereas the percentage of donor-derived HSPCs in most K3/ LSK CD150+ cell recipients was reduced to 10% (Fig. 5 C).
To exclude that differences in transplanted LSK CD150+ cell counts, defective homing, and/or impaired lodgment into the BM niche of K3/ HSPCs led to their loss over time, we disrupted the Kind3 allele in all hematopoietic cells 2–3 mo after the transplantation of BM cells from C57BL/6 (CD45.2+) mice carrying floxed Kind3 alleles and a Rosa26Cre-ERT2 transgene into WT congenic B6.SJL recipients (CD45.1+; K3fl/flRosa26Cre-ERT2 chimera). Tamoxifen-treated K3fl/flRosa26Cre-ERT2 chimeras developed pancytopenia with increased lethality (Fig. 5 D and unpublished data) comparable to K3/ FL chimeras (Fig. 1). Furthermore, weekly 5-FU treat-ment starting 5 wk after tamoxifen administration caused a 90% lethality of K3fl/flRosa26Cre-ERT2 chimeras within 20 d, whereas almost all control K3+/+Rosa26Cre-ERT2 chimeras sur-vived (Fig. 5 E). These findings indicate that the impaired stress response of K3/ HSCs operates independent of homing and niche lodgment of transplanted HSCs.
LSK+ (LK; P = 0.4078 by unpaired t test), LSK (***, P = 0.0009 by unpaired t test), LSK CD150+CD48 (**, P = 0.0014 by Mann-Whitney test), and LSK CD150+CD34 cells (***, P = 0.0004 by Mann-Whitney test). n = 6–14 per genotype; six independent experiments. (D) Percentage of Ki67+ BM LSK cells indicated as mean values ± SD. **, P = 0.0022 by paired t test. n = 18 per genotype; 12 independent experiments. (E) Relative expression of p21, p27, and p57 mRNA in sorted CD150+ LSK cells analyzed by quantitative PCR (mean ± SD). ***, P = 0.0007 by unpaired t test. n = 6–7 per genotype; six independent experiments. (F) Mean percentage ± SD of BrdU LRCs in the indicated populations after 45 d of chase phase: total LSK cells (***, P < 0.0001 by unpaired t test), LSK CD150CD48+ (***, P < 0.0001), LSK CD150+CD48+ (***, P = 0.0006), LSK CD150+CD48 (**, P = 0.0014), and LSK CD150+CD34 (*, P = 0.0350) by Mann-Whitney test. n = 7–8 per genotype; three independent experiments. (G) Representative FACS plots showing the expression of c-kit and Sca-1 on lin cells from Spl and PB. The frequencies of LSK+ (orange boxes) and LSK cells (green boxes) are shown (percentages of live leukocytes ± SD). n = 24–26 per genotype; 10 independent experi-ments. (H) Quantification of LSK+ (LK) and LSK cells in Spl. (ns, P > 0.05; **, P = 0.0031) and PB (***, P < 0.0001). Statistics by Mann-Whitney test. Error bars represent mean cell counts ± SD. n = 25–26 per genotype; 10 independent experiments. (I) Frequency of CFU-Cs shown as mean cell counts ± SD in CD45.2+ cells from Spl (*, P = 0.0286) and PB (*, P = 0.0294). Statistics by Mann-Whitney test. n = 4 per genotype; three independent experiments. (J) Multilineage engraftment potential of PB cells isolated from chimeras. Shown are percentages of donor-derived whole leukocytes (CD45+), myeloid cells (Gr-1+, Mac-1+, and Gr-1+Mac-1+), B cells (B220+), and T cells (CD3e+) from PB at the indicated times after transplantation. Data are plotted for individual recipients. n = 5 for K3+/+ (blue lines) and n = 19 for K3/ (red lines); three independent experiments. Differences in mean lineage engraftment 16 wk after transplantation are indicated (leukocytes: *, P = 0.0157; myeloid cells: **, P = 0.0085; B cells: **, P = 0.0028; and T cells: ***, P = 0.0008). Statistics by Mann-Whitney test. (K) Mobilization of LSK cells in chimeras shown as LSK cells per milliliter of blood after G-CSF or PBS treatment. Significance at day 6 is indicated (K3+/+ vs. K3/ with G-CSF: ***, P < 0.0001; K3+/+ vs. K3/ with PBS: **, P = 0.0049 by unpaired t test). n = 3–5 per genotype; four independent experiments. ns, not significant.
on October 8, 2015
jem.rupress.org
Dow
nloaded from
Published August 17, 2015

1424 Kindlin-3 is essential for activated HSCs and HPCs | Ruppert et al.
(unpublished data), followed by a chase period of 45–50 d, decreased the percentages of BrdU LRCs in the LSK and LSK CD150CD48+ populations significantly more in K3/ than in K3+/+ mix chimeras (Fig. 6 G). In line with a nor-mal activity of K3/ HSCs, the percentages of BrdU LRCs in the LSK CD150+CD48 and LSK CD150+CD34 pop-ulations were not significantly changed in K3/ mix chimeras (Fig. 6 G). Second, we generated inducible mix chimeras by transplanting BM cells from K3fl/flRosa26Cre-ERT2 or K3+/+
the maintenance of HSCs (LSK CD150+CD48 or LSK CD150+CD48CD34 cells) in the BM can be sustained in a Kindlin-3–independent manner, whereas progenitor cells (LSK CD150CD48+ cells) are maintained in the BM in a Kindlin-3–dependent manner.
To corroborate the Kindlin-3 independence of HSCs under homeostatic conditions, we performed four experi-ments. First, an LRC assay revealed that a BrdU pulse of 18 d, which labeled HSPCs in K3+/+ or K3/ mix chimeras
Figure 5. Accelerated loss of K3/ HSCs under hematopoietic stress. (A) Kaplan-Meier survival curves after serial BM transplantations. ***, P < 0.0001 by log-rank test. n = 42–55 recipients per genotype; nine independent experiments. (B) Second generation recipients transplanted with BM LSK CD150+ cells and host-type whole Spl cells. Mean percentages ± SD of donor-derived whole leukocytes (CD45+), myeloid cells (Gr-1+, Mac-1+, and Gr-1+Mac-1+), B cells (B220+), and T cells (CD3e+) shown in PB at the indicated times after transplantation. ***, P < 0.0001 by Mann-Whitney test. (C) Mean percentages ± SD of donor-derived HSPCs in BM of second generation recipients 11 wk after transplantation. ***, P < 0.0001 by Mann-Whitney test. (B and C) n = 23–28; four to five independent experiments. (D) Kaplan-Meier survival curve showing response of control and K3fl/flRosa26Cre-ERT2 chimeras (n = 7) to tamoxifen treatment. The dashed arrow indicates the median survival of tamoxifen-treated K3fl/flRosa26Cre-ERT2 chimeras. The control group consisted of K3fl/flRosa26Cre-ERT2 (without TAM, n = 4) and K3fl/fl (with TAM, n = 7; or without TAM, n = 3) chimeras. *, P = 0.0385 by log-rank test. (E) Kaplan-Meier sur-vival curve of K3fl/flRosa26Cre-ERT2 (n = 10) and control mice to 5-FU treatment. The control group contained K3fl/flRosa26Cre-ERT2 (without TAM, n = 7), K3+/+Rosa26Cre-ERT2 (with TAM, n = 6; or without TAM, n = 5), and K3fl/fl (with TAM, n = 2; or without TAM, n = 2) mice. ***, P < 0.0001 by log-rank test.
on October 8, 2015
jem.rupress.org
Dow
nloaded from
Published August 17, 2015
JEM Vol. 212, No. 9
Article
1425
Figure 6. Kindlin-3 retains active HSCs and HPCs in the BM. (A) Design showing the generation of mix chimeras. E14.5 FL cells (CD45.2+) were mixed with WT congenic B6.SJL E14.5 FL cells (CD45.1+) and transplanted to lethally irradiated (C57BL/6 × congenic B6.SJL) F1 generation recipient mice (CD45.1+/CD45.2+). (B) Representative FACS plots of PB from mix chimeras 4 mo after transplantation. The top panels show whole leukocytes, and the
on October 8, 2015
jem.rupress.org
Dow
nloaded from
Published August 17, 2015
1426 Kindlin-3 is essential for activated HSCs and HPCs | Ruppert et al.
bottom panels show lin cells from CD45.2+ and CD45.1+ populations gated for c-kit against Sca-1. Numbers represent mean overall frequencies (per-centage of live PB leukocytes) ± SD. n = 6–8 per genotype; six independent experiments. (C) G-CSF–induced mobilization of LSK cells in mix chimeras. The histogram shows the mean number of LSK cells per milliliter PB ± SD. ns, P > 0.05; **, P < 0.01; and ***, P < 0.001 by a one-way analysis of variance fol-lowed by Tukey’s multiple comparison test. n = 5–6 per genotype and treatment. (D–F) Percentage of donor-derived LSK CD150+CD48CD34 (D), LSK CD150+CD48 (E), and LSK CD150CD48+ populations (F) in the BM of mix chimeras at the indicated times after transplantation. Dots show the mean percentage ± SD. ns, P > 0.05; ***, P < 0.001 by unpaired t test. n = 4–11 per genotype and time point; two independent experiments. (G) LRC assay with mix chimeras. Percentages of BrdU LRCs in the indicated populations after 45–50 d of chase phase. Total LSK (*, P = 0.0286), LSK CD150CD48+ (*, P = 0.0286), LSK CD150+CD48 (ns, P = 0.0571), and LSK CD150+CD34 cells (ns, P = 0.1143) by Mann-Whitney test. Error bars represent mean percentage ± SD. n = 4 per genotype; two independent experiments. (H) Percentage of Ki67+ donor cells (CD45.2+) in the indicated populations. ns, P > 0.05 by un-paired t test. n = 8 per genotype; three independent experiments. (I–K) Percentage of donor-derived LSK CD150+CD48CD34 (I), LSK CD150+CD48 (J), and LSK CD150CD48+ (K) populations in BM from K3+/+Rosa26Cre-ERT2 (blue) and K3fl/flRosa26Cre-ERT2 (red) mix chimeras untreated (Ctrl.), treated with tamoxifen (TAM PBS), or treated with tamoxifen and 5-FU (TAM 5-FU). The histogram shows the mean percentage ± SD. ns, P > 0.05; *, P < 0.05; and ***, P < 0.0006 by unpaired t test. n = 4–6 per genotype and treatment. (L) Competitive repopulation assay with BM LSK CD150+CD45.2+ cells from mix chimeras. Recipients received LSK CD150+CD45.2+ cells and host-type whole Spl cells. Shown are percentages of donor-derived whole leukocytes (CD45+), myeloid cells (Gr-1+, Mac-1+, and Gr-1+Mac-1+), B cells (B220+), and T cells (CD3e+) from individual recipients at the indicated times after transplantation. Significant differences in mean lineage engraftment are indicated (4 wk after transplantation: leukocytes [ns, P = 0.8707] by unpaired t test; myeloid cells [**, P = 0.0093], B cells [*, P = 0.0337], and T cells [**, P = 0.0074] by Mann-Whitney test; 8 and 12 wk after transplantation: leukocytes: ***, P < 0.0001 by unpaired t test; myeloid, B, and T cells: ***, P < 0.0001 [or P = 0.0006 for myeloid cells after 8 wk] by Mann-Whitney test). M) Mean percentage ± SD of donor-derived HSPCs in BM of second generation recipients 12 wk after transplantation. ***, P < 0.0001 by Mann-Whitney test. (L and M) n = 14–17; four independent experiments. ns, not significant; Wt, wild type.
Rosa26Cre-ERT2 mice (C57BL/6; CD45.2+) mixed in a 1:1 ratio with WT BM cells from congenic B6.SJL (CD45.1+) into lethally irradiated F1 (CD45.2+CD45.1+) recipients, treated them with tamoxifen 3 mo after transplantation, and performed Ki67 and DAPI staining with BM cells 1 mo after tamoxifen treatment. The results showed similar Ki67 levels in K3+/+ and K3/ LSK, LSK CD150CD48+, and LSK CD150+CD48 populations (Fig. 6 H). Third, we treated in-ducible mix chimeras with tamoxifen 3 mo after transplanta-tion, induced hematopoietic stress with a weekly dose of 5-FU (starting 5 wk after the last tamoxifen treatment), and quantified CD45.2+ donor-derived HSPCs in the BM 3 wk after the last treatment. Control experiments without 5-FU revealed that the ratio of CD45.2+ donor-derived LSK CD150+CD48CD34 and LSK CD150+CD48 cell pop-ulations was unaffected in tamoxifen- and PBS-treated K3fl/flRosa26Cre-ERT2 and K3+/+Rosa26Cre-ERT2 mix chimeras (Fig. 6, I and J), whereas the LSK CD150CD48+ population
decreased after tamoxifen-mediated Kindlin-3 deletion (Fig. 6 K). However, treatment with 5-FU dramatically decreased donor-derived LSK CD150+CD48CD34 and LSK CD150+CD48 cells in tamoxifen-pretreated K3fl/flRosa26Cre-ERT2 mix chimeras (Fig. 6, I and J). Hence, these findings confirm that Kindlin-3 is dispensable for HSCs under homeostasis but essential when the hematopoietic system is under stress. Fourth, we tested whether K3/ LSK CD150+ cells maintained under ho-meostatic conditions in K3/ mix chimeras exhibit an improved reconstitution potential over K3/ LSK CD150+ cells isolated from 100% FL chimeras (Fig. 5, B and C; and unpublished data). Around 450 FACS-purified K3+/+ or K3/ LSK CD150+CD45.2+ cells isolated from mix chime-ras were mixed with 5 × 10⁶ whole Spl cells from WT con-genic B6.SJL mice (CD45.1+) and transplanted into lethally irradiated WT congenic B6.SJL recipients (CD45.1+). Although the mean percentages of K3+/+ and K3/ donor-derived whole leukocytes were similar in the PB 4 wk after transplantation,
Table 2. Blood counts of K3+/+ and K3/ mix chimeras
Tests K3+/+ mix chimera K3/ mix chimera P-value K3+/+ versus K3/
Normal range
WBC (103/µl) 18.5 ± 6.4 31.1 ± 8.9 <0.0001 1.8–10.7NE (103/µl) 2.5 ± 1.1 6.0 ± 3.8 0.0002 0.1–2.4LY (103/µl) 14.7 ± 5.4 21.7 ± 5.3 0.0003 0.9–9.3RBC (103/µl) 9.9 ± 0.4 8.8 ± 0.6 <0.0001 6.36–9.42Hb (g/dl) 17.0 ± 1.0 15.9 ± 1.2 0.0072 11.0–15.1HCT (%) 43.7 ± 2.0 40.7 ± 2.3 0.0001 35.1–45.4MCV (fl) 44.2 ± 0.9 46.6 ± 1.5 <0.0001 45.4–60.3MCH (pg) 17.2 ± 0.9 18.2 ± 1.2 <0.0064 14.1–19.3PLT (103/µl) 599.5 ± 108.1 725.8 ± 64.7 <0.0001 592–2,972
Values shown are the mean ± SD for 16–22 mice per genotype. WBC, white blood cell; NE, neutrophil; LY, lymphocyte; Hb, hemoglobin; HCT, hematocrit; MCV, mean corpuscular volume; MCH, mean corpuscular hemoglobin; PLT, platelet.
on October 8, 2015
jem.rupress.org
Dow
nloaded from
Published August 17, 2015

JEM Vol. 212, No. 9
Article
1427
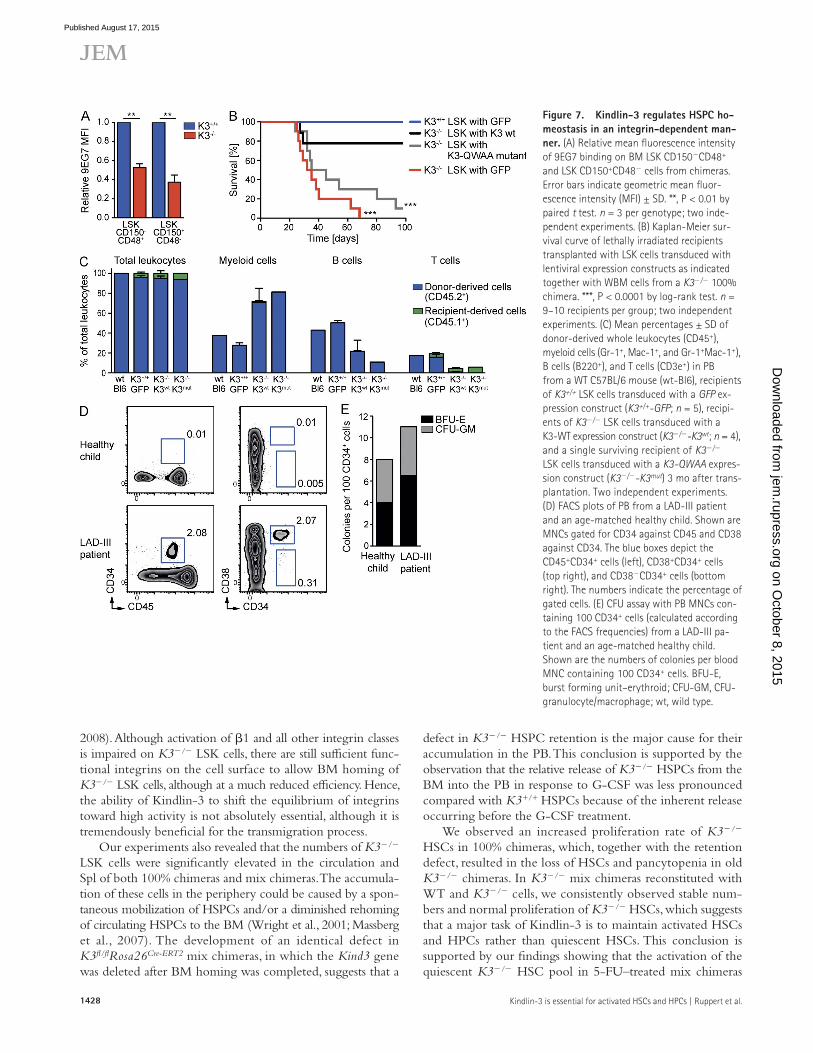
Kindlin-3 in human HSPC maintenanceTo test whether the role of Kindlin-3 for regulating HSPCs is conserved in man, we quantified the number of CD45+CD34+, CD34+CD38+, and CD34+CD38 cells in the PB of a LAD-III patient who carried a nonsense mutation at amino acid position 529 in the KIND3 gene, leading to loss of protein expression (unpublished data). The experiment was controlled by determining the number of HSPCs in a blood sample from a healthy child of the same age as the LAD-III patient (Fig. 7 D). Our analyses revealed that CD45+CD34+ and CD34+CD38+ cells were 200 times and CD34+CD38 cells were 60 times higher in the blood of the LAD-III pa-tient compared with the healthy subject. Importantly, the CFU assay revealed that blood samples from the healthy indi-vidual as well as from the LAD-III patient produced similar numbers of CFU-granulocyte/macrophage and burst form-ing unit–erythroid colonies when whole leukocytes were cultured with a calculated number of 100 CD34+ cells (Fig. 7 E). These results indicate that the absence of Kindlin-3 in LAD-III patients is associated with an accumulation of HSPCs in the PB and hence are in line with the observations made in mice lacking Kindlin-3 (Fig. 4, G–J).
DISCUSSIONKindlin-3 is expressed in all hematopoietic cells, including HSPCs, and is required for bidirectional integrin signaling (Moser et al., 2009a). HSPCs express several integrins (Grassinger et al., 2009), and therefore one would predict that Kindlin-3 serves important roles for HSC homeostasis. To test this hy-pothesis, we used a range of experiments to demonstrate that Kindlin-3 is essential for BM homing and, most notably, for the retention of activated HSCs and HPCs. Consequently, in the absence of Kindlin-3 expression, activated HSCs and HPCs are not properly retained in the BM but accumulate in the circulation, leading to a strong and continuous activation of Kindlin-3–deficient HSCs, and finally to their exhaustion. The activation and exhaustion of the HSCs are aggravated by feedback signals from dysfunctional effector cells (anemia, leu-kocyte adhesion deficiency, etc.), whereas Kindlin-3–deficient HSCs can enter and remain in a quiescent state for at least 1 yr when the loss of HSPCs is compensated for by the presence of WT cells.
The homing of HSPCs to the BM is a multistep process that commences with their adhesion to the BM vessel wall and continues with their trans-endothelial migration and col-onization of the stem cell niches (Magnon and Frenette, 2008; Morrison and Scadden, 2014). Our analysis showed that dis-ruption of the Kind3 gene in LSK cells diminished their ca-pacity for short-term BM homing. A few K3/ LSK cells assumed long-lasting adhesions to endothelial cells and crossed the vessel wall, which gave rise to significant numbers of K3/ HSPC populations in the BM of recipient mice 1 mo after transplantation. Previous studies already demonstrated that 1 class integrins (mainly through 41 and possibly 91 binding to VCAM-1) are essential for BM homing of HSPCs (Taooka et al., 1999; Potocnik et al., 2000; Magnon and Frenette,
the mean percentages of CD45.2+ donor-derived myeloid, B, and T cells differed significantly in the respective recipient mice. These differences between K3+/+ and K3/ CD45.2+ donor-derived effector cells further increased 8 and 12 wk after transplantation (Fig. 6 L). In the BM, the K3+/+ LSK CD150+ CD45.2+ donor cells replenished almost 100% of all HSPC populations 12 mo after transplantation, whereas K3/ LSK CD150+CD45.2+ donor cells generated 50% of all HSPC populations (Fig. 6 M). This finding indicates that, despite the impaired reconstitution (probably as a result of defective hom-ing), K3/ LSK CD150+ cells derived from mix chimeras dis-play a higher reconstitution potential compared with LSK CD150+ cells isolated from K3/ chimeras.
Altogether, these findings demonstrate that quiescent HSCs are maintained without Kindlin-3. However, main-tenance of active HSCs and HPCs requires expression of Kindlin-3 irrespective of whether WT or K3/ effector cells are present.
Kindlin-3 maintains HSPCs in the BM by activating integrinsThe results so far indicate that Kindlin-3 is essential to retain active HSCs and HPCs in the BM. To test whether Kindlin-3 executes this function through integrin-mediated adhesion, we compared the affinity state of 1 integrins on LSK CD150 CD48+ and LSK CD150+CD48 cells from K3+/+ and K3/ chimeras by measuring the activation-associated 9EG7 epit-ope levels on 1 integrins. The results showed significantly decreased 9EG7 levels on K3/ LSK CD150CD48+ and LSK CD150+CD48 cells compared with the K3+/+ control populations (Fig. 7 A). To corroborate a role of Kindlin-3 for integrin activation, K3+/+ and K3/ LSK cells were isolated from the BM of 100% chimeras and lentivirally transduced with either a WT or an integrin binding–deficient Kind3 ex-pression construct, in which amino acid residues QW597/598 were substituted with alanines (Moser et al., 2008). Approxi-mately 1.5 × 10⁴ of the transduced LSK cells were transplanted together with 8.8 × 10⁵ (CD45.2+) WBM cells isolated from a K3/ 100% chimera into lethally irradiated WT congenic (CD45.1+) B6.SJL recipients. The reconstitution potential of K3+/+ LSK cells transduced with GFP (K3+/+ LSK with GFP; positive control) and K3/ LSK cells transduced with either GFP (K3/ LSK with GFP; negative control), a K3-WT expression construct (K3/ LSK with K3-WT), or a K3-QWAA expression construct (K3/ LSK with K3-QWAA) was compared by monitoring the survival of recipients. Re-cipients transplanted with K3/ LSK cells transduced with either a GFP or K3-QWAA construct developed severe pan-cytopenia and died within 68 d (Fig. 7 B), whereas recipients transplanted with K3+/+ LSK cells transduced with a GFP construct, or K3/ LSK cells transduced with a K3-WT con-struct, showed multilineage long-term rescue of all recipients (Fig. 7, B and C). The stable transduction of the different viral expression constructs in donor-derived blood cells of surviv-ing recipients was confirmed by different PCRs (unpublished data).These findings demonstrate that Kindlin-3 regulates HSPC homeostasis in an integrin-dependent manner.
on October 8, 2015
jem.rupress.org
Dow
nloaded from
Published August 17, 2015
1428 Kindlin-3 is essential for activated HSCs and HPCs | Ruppert et al.
defect in K3/ HSPC retention is the major cause for their accumulation in the PB. This conclusion is supported by the observation that the relative release of K3/ HSPCs from the BM into the PB in response to G-CSF was less pronounced compared with K3+/+ HSPCs because of the inherent release occurring before the G-CSF treatment.
We observed an increased proliferation rate of K3/ HSCs in 100% chimeras, which, together with the retention defect, resulted in the loss of HSCs and pancytopenia in old K3/ chimeras. In K3/ mix chimeras reconstituted with WT and K3/ cells, we consistently observed stable num-bers and normal proliferation of K3/ HSCs, which suggests that a major task of Kindlin-3 is to maintain activated HSCs and HPCs rather than quiescent HSCs. This conclusion is supported by our findings showing that the activation of the quiescent K3/ HSC pool in 5-FU–treated mix chimeras
2008). Although activation of 1 and all other integrin classes is impaired on K3/ LSK cells, there are still sufficient func-tional integrins on the cell surface to allow BM homing of K3/ LSK cells, although at a much reduced efficiency. Hence, the ability of Kindlin-3 to shift the equilibrium of integrins toward high activity is not absolutely essential, although it is tremendously beneficial for the transmigration process.
Our experiments also revealed that the numbers of K3/ LSK cells were significantly elevated in the circulation and Spl of both 100% chimeras and mix chimeras. The accumula-tion of these cells in the periphery could be caused by a spon-taneous mobilization of HSPCs and/or a diminished rehoming of circulating HSPCs to the BM (Wright et al., 2001; Massberg et al., 2007). The development of an identical defect in K3fl/flRosa26Cre-ERT2 mix chimeras, in which the Kind3 gene was deleted after BM homing was completed, suggests that a
Figure 7. Kindlin-3 regulates HSPC ho-meostasis in an integrin-dependent man-ner. (A) Relative mean fluorescence intensity of 9EG7 binding on BM LSK CD150CD48+ and LSK CD150+CD48 cells from chimeras. Error bars indicate geometric mean fluor-escence intensity (MFI) ± SD. **, P < 0.01 by paired t test. n = 3 per genotype; two inde-pendent experiments. (B) Kaplan-Meier sur-vival curve of lethally irradiated recipients transplanted with LSK cells transduced with lentiviral expression constructs as indicated together with WBM cells from a K3/ 100% chimera. ***, P < 0.0001 by log-rank test. n = 9–10 recipients per group; two independent experiments. (C) Mean percentages ± SD of donor-derived whole leukocytes (CD45+), myeloid cells (Gr-1+, Mac-1+, and Gr-1+Mac-1+), B cells (B220+), and T cells (CD3e+) in PB from a WT C57BL/6 mouse (wt-Bl6), recipients of K3+/+ LSK cells transduced with a GFP ex-pression construct (K3+/+-GFP; n = 5), recipi-ents of K3/ LSK cells transduced with a K3-WT expression construct (K3/-K3wt; n = 4), and a single surviving recipient of K3/ LSK cells transduced with a K3-QWAA expres-sion construct (K3/-K3mut) 3 mo after trans-plantation. Two independent experiments. (D) FACS plots of PB from a LAD-III patient and an age-matched healthy child. Shown are MNCs gated for CD34 against CD45 and CD38 against CD34. The blue boxes depict the CD45+CD34+ cells (left), CD38+CD34+ cells (top right), and CD38CD34+ cells (bottom right). The numbers indicate the percentage of gated cells. (E) CFU assay with PB MNCs con-taining 100 CD34+ cells (calculated according to the FACS frequencies) from a LAD-III pa-tient and an age-matched healthy child. Shown are the numbers of colonies per blood MNC containing 100 CD34+ cells. BFU-E, burst forming unit–erythroid; CFU-GM, CFU-granulocyte/macrophage; wt, wild type.
on October 8, 2015
jem.rupress.org
Dow
nloaded from
Published August 17, 2015

JEM Vol. 212, No. 9
Article
1429
HSCs and HPCs in the BM. This exquisite function is not essential for quiescent HSCs, although stem cells in other tis-sues, such as the hair bulge or nervous system, require integ-rin adhesion for their maintenance (Brakebusch et al., 2000; Raghavan et al., 2000; Campos et al., 2004). Furthermore, the important role of Kindlin-3 for integrin activation in HSPCs is conserved between mouse and man, as an individual suffer-ing from LAD-III also has dramatically increased levels of HSPCs in the circulation.
MATERIALS AND METHODSMice. K3/ chimeras have been described previously (Moser et al., 2008, 2009b). In brief, the Kindlin-3 gene was disrupted by deleting exons 3–6 (Moser et al., 2008). To generate FL cell chimeras, 5 × 10⁶ unfractionated FL cells (C57BL/6; CD45.2+) from K3/ and K3+/+ littermate embryos were iso-lated at E14.5 and transplanted into lethally irradiated WT congenic B6.SJL (CD45.1+) recipient mice. In Kind3 floxed mice, the exons 3–6 are flanked by loxP sites. Mice were kept under specific pathogen-free conditions in the animal facility of the Max Planck Institute of Biochemistry. The mouse ex-periments were performed with approval from the District Government of Upper Bavaria.
LAD-III patient. The LAD-III patient was a 6-mo-old female carrier of a homozygous nonsense mutation in exon 13 of the KIND3 gene leading to a premature stop codon at the position coding for amino acid 529 and a loss of protein expression. All tests were performed after obtaining a signed informed consent form from the parents.
Generation of BM and FL chimeras. 100% chimeras were generated as described previously (Moser et al., 2008, 2009b). In brief, FL cells were iso-lated from PCR-genotyped K3+/+ or K3/ E14.5 embryos, and 5 × 10⁶ whole FL cells were injected into the tail vein of lethally irradiated congenic B6.SJL recipient mice. Mice were irradiated with a Cs-137 irradiator (Biobeam 2000; Gamma Service) and received an irradiation dose of 1 × 7.5 Gy and 1 × 6 Gy with 4 h in between. For the generation of FL mix chime-ras, a total of 5 × 10⁶ whole E14.5 FL cells from K3+/+ or K3/ C57BL/6 embryos, respectively, were mixed with whole E14.5 FL cells from congenic B6.SJL WT embryos in a ratio of 1:1 for K3+/+ and 20:1 for K3/ mix chi-meras and transplanted into lethally irradiated F1 (C57BL/6× congenic B6.SJL) recipient mice.
To generate K3fl/flRosa26Cre-ERT2 mice, we crossed the K3fl/fl mice with the Rosa26Cre-ERT2 mice (provided by G.W. Bornkamm, Helmholtz Zentrum München, Munich, Germany; Hameyer et al., 2007). For the generation of K3fl/flRosa26Cre-ERT2 chimeras, 5 × 10⁶ WBM cells from the K3fl/flRosa26Cre-ERT2 mice were transplanted into lethally irradiated congenic B6.SJL recipient mice. To delete Kindlin-3 in the chimeras, a dose of 5 mg tamoxifen (Sigma-Aldrich) per mouse was administered orally with a feeding needle in two sets of three consecutive administrations 3 d apart, 2–3 mo after transplantation. All chimeras were maintained on antibiotic-containing water (Borgal; Virbac).
BM and PB transplantation. For noncompetitive serial transplantation, WBM cells were isolated from one mouse of the previous generation, and 5 × 10⁶ cells were intravenously injected each into five lethally irradiated WT congenic B6.SJL recipients. After, a 10–12-wk transplantation to the next gen-eration recipients was performed using the same conditions. For competitive BM HSC transplantations, 1,000 FACS-sorted BM LSK CD150+ cells from K3+/+ or K3/ chimeras or 450 FACS-sorted BM LSK CD150+ cells from K3+/+ or K3/ mix chimeras, together with 5 × 10⁶ whole Spl competitor cells, were injected into the tail vein of lethally irradiated F1 WT recipients. For the rescue experiment, Kind3-WT and -mutant cDNA was cloned into the lentiviral vector RRL-CMV-GFP (provided by A. Pfeifer, University of Bonn, Bonn, Germany), and 1.5 × 10⁴ lentiviral-infected LSK cells together with 8.8 × 10⁵ total K3/ BM cells were transplanted. The percentage of donor-derived cells in the PB or BM and Spl of recipient mice was analyzed
resulted in a dramatic reduction of their numbers irrespective of dysfunctions in K3/ effector cell populations. The re-duction is caused by the loss of K3/ HPCs and activated K3/ HSCs into the circulation, coupled with the demand to replenish their decreasing pools. In 5-FU–treated mix chi-meras, the WT HSCs compensate for the gradual decline of K3/ HSCs, whereas in 100% chimeras, the loss of K3/ HSPCs into the circulation eventually leads to the reduction of the quiescent HSC pool and to the death of the animal. Untreated K3/ mix chimeras gradually fill HPC niches with WT cells, which leads to the displacement of K3/ HPCs, diminished accumulation of K3/ progenitors in the circulation, and consequently to K3/ HSC quiescence.
Hematopoietic stress, such as anemia, can activate HSPCs (Trumpp et al., 2010) and therefore accelerate the defective maintenance of Kindlin-3–deficient HSPCs in the BM. The cause for the poor BM retention is the inability of K3/ HSPCs to activate integrins. This conclusion is based on the observations that the 9EG7 epitope, which is only present on activated 1 integrins, is dramatically reduced in K3/ HSPCs and that lethally irradiated recipients cannot be reconstituted with K3/ LSK cells expressing an integrin binding–deficient Kindlin-3. Interestingly, Wnt–-catenin and TGF- signal-ing, which are essential in cutaneous stem cells (Rognoni et al., 2014), were unaffected in K3/ HSPCs (unpublished data). This is likely because of differences in the niche microenviron-ment, the different properties of the Kindlin isoforms, and the different integrin subtypes expressed in different tissue stem cells. For example, cutaneous stem cells express high levels of the epithelial integrin v6, which is not expressed in HSPCs (Yamazaki et al., 2011; Klimmeck et al., 2012) and hence is not used to liberate TGF- and regulate TGF- signaling.
Why is Kindlin-3 only required in activated HSCs and HPCs and not in quiescent HSCs? It is possible that different classes of adhesion molecules such as CD44, selectins, or N-cadherin compensate for each other on quiescent HSCs. These adhesion molecules are probably sufficient to retain quiescent HSCs in their BM compartments but insufficient to retain proliferating HSCs and HPCs. In this regard, it has been shown that cells encounter a particularly low adhesion strength during mitosis when integrins translocate to the mi-totic furrow to loosen adhesion and to allow the rounding up of the dividing cell (Yamaguchi et al., 1998; Pellinen et al., 2008). It is also conceivable that activated and quiescent HSCs reside in different niches (Morrison and Scadden, 2014), which differ in their niche components and hence require different adhesion molecules for cell retention. In line with these hy-potheses, our findings indicate that Kindlin-3–mediated integ-rin adhesion is essential for proliferating HSCs as well as HPCs and to a lesser extent for quiescent HSCs. Live imaging micros-copy of HSCs in the BM should allow one to see whether HSCs move to different BM compartments during cell divi-sion and/or whether they round up and detach during cell di-vision and become lost when they lack Kindlin-3 expression.
In summary, our findings assign Kindlin-3–induced integrin adhesion an important role for maintaining actively proliferating
on October 8, 2015
jem.rupress.org
Dow
nloaded from
Published August 17, 2015

1430 Kindlin-3 is essential for activated HSCs and HPCs | Ruppert et al.
to cover an axial depth of 30–300 µm. BM vasculature was either visualized by injecting FITC dextran (mol wt of 2,000,000 daltons) or Qdot 695 nm (Life Technologies). FACS-sorted LSK cells were stained with CMTMR. To allow imaging of cells during their first passage through the right cranium, a cathe-ter was inserted into the right external carotid artery for fluorescent cell and dye injection. The first passage imaging area was detected via injection of FITC dextran or Qdot 695 nm before cell injection, and the area with the most rapid appearance of the dye within the vasculature was chosen for ex-periments. Cells were considered as firmly adherent to the BM endothelium when cells adhered at a position within the vessel for at least 60 s.
To assess the absolute numbers of LSK cells outside the vessels within 18 h after adoptive transfer via tail vein injection, an area of 4 × 4 mm in xy direction surrounding the sagittal venous sinus and reaching a maximum axial depth of 300 µm was imaged.
For the quantification of CMTMR- or CFSE-positive LSK cells in the BM, WBM cells from all long bones of recipient mice were isolated 18 h after injection, counted, and analyzed with a flow cytometer (FACSCanto II). The homing efficiency was calculated by determining the ratio between the number of CMTMR- or CFSE-positive K3+/+ or K3/ LSK cells in the BM and the total number of injected labeled LSK cells.
In vitro flow chamber assay. Rectangular microglass capillaries (Vitro-Com) were coated with 30 µg/ml rmE-selectin, 20 µg/ml rmCXCL12, and 20 µg/ml rmVCAM-1 in different combinations as previously described (Frommhold et al., 2008). FACS-sorted LSK cells from BM or E14.5 FLs were resuspended in DMEM containing 1% BSA, 1-mM CaCl2, 1-mM MgCl2, and 10-mM Hepes to a final concentration of 0.5 × 10⁶ cells/ml. K3+/+ LSK cells preincubated with anti–4 integrin–blocking mAb (CD49d, subunit of VLA4, and clone PS2; ATCC) were used as a control. Cells were perfused through coated capillaries for 12 min under shear (shear stress 1 dyne/cm2). After washing and fixation of adherent cells with Türks solution for 80 s, ad-herent cells were quantified using a microscope (Axioskop40; Carl Zeiss).
LTC-IC assay. An LTC-IC assay was performed with purified donor-derived WBM leukocytes by FACS depletion of CD45.1+ cells or whole FL cells ac-cording to the instructions of STEMCELL Technologies. For preparation of the stromal layer, WBM cells were isolated from WT C57BL/6 mice and seeded in 96-well plates at a concentration of 6 × 10⁵ cells/well in MyeloCult medium (STEMCELL Technologies) supplemented with 10-µM hydrocorti-sone (STEMCELL Technologies). After 2 wk, a confluent adherent cell layer was formed and irradiated with 30 Gy using a Cs-137 irradiator. FACS-sorted CD45.2+ BM cells from K3+/+ and K3/ chimeras or whole FL cells were added on the stromal layers at concentrations of 105, 6 × 10⁴, 3 × 10⁴, 1.5 × 10⁴, 104, 5 × 10³, and 103 cells per well in a total of 25–30 wells per con-centration for BM cells. The co-cultures were further incubated for 5 wk with weekly changes of half of the medium. Each well was then trypsinized for 5 min, washed with PBS, resuspended in MyeloCult medium, and then plated in MethoCult medium (M3434; STEMCELL Technologies). 14 d later, each well was scored for the formation of colonies as a positive well (≥1 CFU) or a negative well (no CFU). The LTC-IC frequency was calculated using extreme limiting dilution analysis software (Hu and Smyth, 2009).
CFU-C assay. CD45.2+ BM, PB, or Spl cells were isolated by FACS and subsequently assessed for CFU-C frequency in MethoCult medium accord-ing to the manufacturer’s instructions. Triplicate cultures were prepared for each sample and maintained at 37°C, 5% CO2, and 95% humidity. Colonies were scored 14 d after plating.
G-CSF mobilization assay. BM chimeras (3–4 mo after transplantation) were injected subcutaneously with G-CSF (Filgrastrim; Hexal) at 250 µg/kg (in 100 µl/10 g PBS) twice daily, 8 h apart, consecutively for 6 d. Before treatment (day 0) and on days 2, 4, and 6, PB and Spl from G-CSF– and PBS-treated chimeras from each genotype were analyzed.
Administration of 5-FU. For the polyI:C (GE Healthcare) and 5-FU (Sigma-Aldrich) double treatment, 10 mg/kg polyI:C and 150 mg/kg 5-FU
by FACS at time points after transplantation as indicated in the figures. For competitive PB transplantation, 3 × 106 PB MNCs were mixed with 4 × 10⁶ host-type whole Spl cells and injected into the tail vein of lethally irradiated WT congenic B6.SJL recipients. The percentage of donor-derived lymphoid and myeloid cells in the PB of recipient mice was analyzed 5, 8, 12, and 16 wk after transplantation. In all transplantation experiments, recipient mice received a total body irradiation of 13.5 Gy (7.5 Gy and 6 Gy 4 h apart).
Flow cytometry and cell sorting. For FACS analysis, MNCs from BM (2× femur, 2× tibia, 2× pelvis, and 2× humerus), PB, or Spl were isolated, immunostained according to standard procedures, and analyzed with a flow cytometer (FACSCalibur or FACSCanto II; BD). HSPC subpopulations were gated as shown in Fig. 3 C. For the eight-color FACS staining (FITC, PE, PE-Cy7, PerCP, APC, APC-Cy7, Pacific blue, and AmCyan) of HSCs, cells were stained with a cocktail of biotinylated lineage antibodies containing CD3 (145-2C11), CD4 (GK1.5), CD8 (53-6.7), B220 (RA3-6B2), Mac-1 (M1/70), Gr-1 (RB6-8C5), Ter119 (TER-119), and NK1.1 (PK136) followed by streptavidin conjugated with either APC-Cy7 or PerCP. In addition, directly conjugated antibodies were used to further define BM subsets as follows: Sca1-PE (D7), c-kit-APC-Cy7 (2B8), CD48-FITC (HM48-1), CD34-APC (RAM34; eBioscience), and CD150-PerCP (TC15-12F12.2; BioLegend). For congenic strain discrimination, anti-CD45.1 (A20) and anti-CD45.2 (104) antibodies conjugated to APC or Pacific blue (eBioscience) were used. HSPC subpopulations were gated as shown in Fig. 3 C. For BrdU incorporation, we used the FITC- or APC-BrdU Flow kit (BD) according to the manufacturer’s protocol and combined it with the LSK CD150+ or LSK CD34+ cell staining. To analyze expression of integrins on HSPCs, LSK cells were additionally stained with anti–1 integrin (eBioHMb1-1), anti–2 integrin (M18/2), anti–3 integrin (2C9.G3), anti–2 integrin (Ha1/29), anti–4 integrin (R1-2), anti–5 integrin (5H10-27), anti–6 integrin (eBioGoH3), anti–L integrin (M17/4), and anti–V integrin (RMV-7; eBioscience); anti–9 integrin (R&D Systems); or anti–1 integrin (9EG7; BD). Seven-color FACS sorting (FITC, PE, PE-Cy7, PerCP, APC, APC-Cy7, and Pacific blue) of LSK or LSK CD150+ cells was performed with a cell sorter (FACSAria II; BD). CD31 (R&D Systems) and EpCAM (G8.8; BD) were used for FL cell staining.
Cell cycle analysis. For cell cycle analysis, BM LSK cells were stained as described in the previous section. Dead cell discrimination was performed with ethidium monoazide bromide (Invitrogen). After fixation and permea-bilization using the Cytofix/Cytoperm Fixation/Permeabilization kit (BD), cells were labeled with anti-Ki67–FITC or FITC conjugate isotype control (BD) to distinguish between G1, S/G2/M, and G0 phases of the cell cycle. DNA was stained with DAPI (Sigma-Aldrich).
BrdU uptake and LRC assay. For BrdU uptake experiments, BM chime-ras were intraperitoneally injected with 1.5 mg BrdU (Sigma-Aldrich) 12–14 h before analysis. BrdU+ HSPCs were quantified by combining surface stain-ing to define different HSPC populations with intracellular staining for BrdU using the FITC- or APC-BrdU Flow kit. For the LRC assay, BM chimeras were fed 2 mo after transplantation with drinking water containing 0.8 mg/ml BrdU and 5% glucose for 14–18 d. After a BrdU-free chase phase of 45–50 d, the number of BM-derived HSPCs retaining BrdU was quanti-fied by FACS as described in the section Flow cytometry and cell sorting.
Short-term homing assay and multiphoton intravital imaging. 1.85–3.2 × 10⁵ FACS-sorted K3+/+ or K3/ LSK cells were stained with CMTMR or CFSE. Short-term homing was assessed directly after injection to the right external carotid artery or 18 h after tail vein injection using flow cytometry or two-photon intravital microscopy (LaVision BioTec).
Mouse calvarial BM was prepared as described previously (Mazo et al., 1998; Mazo and von Andrian, 1999). A TriMScope system (LaVision BioTec) and Ti:Sapphire laser (MaiTai; Spectra-Physics) with a 20× water immersion objective lens (NA 0.95; Olympus) and ImSpectorPro software (LaVision BioTec) were used to acquire images. For three-dimensional acquisition, the stacks were acquired at an 800-nm wavelength and at a vertical spacing of 4 µm
on October 8, 2015
jem.rupress.org
Dow
nloaded from
Published August 17, 2015

JEM Vol. 212, No. 9
Article
1431
Oostendorp, and S. Massberg performed experiments and analyzed data; A.S. Schulz provided blood samples from the LAD-III patient; R. Fässler initiated, conceptualized, and directed the study; and R. Fässler and R. Ruppert wrote the manuscript. All authors discussed the results and read the manuscript.
Submitted: 11 February 2015Accepted: 7 July 2015
REFERENCESAdams, G.B., K.T. Chabner, I.R. Alley, D.P. Olson, Z.M. Szczepiorkowski,
M.C. Poznansky, C.H. Kos, M.R. Pollak, E.M. Brown, and D.T. Scadden. 2006. Stem cell engraftment at the endosteal niche is specified by the calcium-sensing receptor. Nature. 439:599–603. http://dx.doi .org/10.1038/nature04247
Arroyo, A.G., J.T. Yang, H. Rayburn, and R.O. Hynes. 1999. 4 integrins regulate the proliferation/differentiation balance of multilineage hema-topoietic progenitors in vivo. Immunity. 11:555–566. http://dx.doi.org/ 10.1016/S1074-7613(00)80131-4
Brakebusch, C., R. Grose, F. Quondamatteo, A. Ramirez, J.L. Jorcano, A. Pirro, M. Svensson, R. Herken, T. Sasaki, R. Timpl, et al. 2000. Skin and hair follicle integrity is crucially dependent on 1 integrin ex-pression on keratinocytes. EMBO J. 19:3990–4003. http://dx.doi.org/ 10.1093/emboj/19.15.3990
Campos, L.S., D.P. Leone, J.B. Relvas, C. Brakebusch, R. Fässler, U. Suter, and C. ffrench-Constant. 2004. 1 integrins activate a MAPK signal-ling pathway in neural stem cells that contributes to their maintenance. Development. 131:3433–3444. http://dx.doi.org/10.1242/dev.01199
Essers, M.A.G., S. Offner, W.E. Blanco-Bose, Z. Waibler, U. Kalinke, M.A. Duchosal, and A. Trumpp. 2009. IFN activates dormant hae-matopoietic stem cells in vivo. Nature. 458:904–908. http://dx.doi.org/ 10.1038/nature07815
Frommhold, D., A. Ludwig, M.G. Bixel, A. Zarbock, I. Babushkina, M. Weissinger, S. Cauwenberghs, L.G. Ellies, J.D. Marth, A.G. Beck-Sickinger, et al. 2008. Sialyltransferase ST3Gal-IV controls CXCR2-mediated firm leukocyte arrest during inflammation. J. Exp. Med. 205:1435–1446. http://dx.doi.org/10.1084/jem.20070846
Grassinger, J., D.N. Haylock, M.J. Storan, G.O. Haines, B. Williams, G.A. Whitty, A.R. Vinson, C.L. Be, S. Li, E.S. Sørensen, et al. 2009. Thrombin-cleaved osteopontin regulates hemopoietic stem and progenitor cell functions through interactions with 91 and 41 in-tegrins. Blood. 114:49–59. http://dx.doi.org/10.1182/blood-2009-01- 197988
Hameyer, D., A. Loonstra, L. Eshkind, S. Schmitt, C. Antunes, A. Groen, E. Bindels, J. Jonkers, P. Krimpenfort, R. Meuwissen, et al. 2007. Toxicity of ligand-dependent Cre recombinases and generation of a conditional Cre deleter mouse allowing mosaic recombination in peripheral tissues. Physiol. Genomics. 31:32–41. http://dx.doi.org/10.1152/physiolgenomics .00019.2007
Hu, Y., and G.K. Smyth. 2009. ELDA: extreme limiting dilution analysis for comparing depleted and enriched populations in stem cell and other assays. J. Immunol. Methods. 347:70–78. http://dx.doi.org/10.1016/j.jim .2009.06.008
Hynes, R.O. 2002. Integrins: bidirectional, allosteric signaling machines. Cell. 110:673–687. http://dx.doi.org/10.1016/S0092-8674(02)00971-6
Jordan, C.T., C.M. Astle, J. Zawadzki, K. Mackarehtschian, I.R. Lemischka, and D.E. Harrison. 1995. Long-term repopulating abilities of enriched fetal liver stem cells measured by competitive repopulation. Exp. Hematol. 23:1011–1015.
Kiel, M.J., and S.J. Morrison. 2008. Uncertainty in the niches that main-tain haematopoietic stem cells. Nat. Rev. Immunol. 8:290–301. http://dx.doi.org/10.1038/nri2279
Kiel, M.J., Ö.H. Yilmaz, T. Iwashita, O.H. Yilmaz, C. Terhorst, and S.J. Morrison. 2005. SLAM family receptors distinguish hematopoietic stem and progenitor cells and reveal endothelial niches for stem cells. Cell. 121:1109–1121. http://dx.doi.org/10.1016/j.cell.2005.05.026
Klimmeck, D., J. Hansson, S. Raffel, S.Y. Vakhrushev, A. Trumpp, and J. Krijgsveld. 2012. Proteomic cornerstones of hematopoietic stem cell differentiation: distinct signatures of multipotent progenitors and myeloid
were injected intraperitoneally into BM chimeras (3–4 mo after transplantation). For weekly 5-FU treatment, 5-FU was injected intraperitoneally at a dose of 150 mg/kg for the first two injections and 100 mg/kg for the subsequent injections. In both experiments, survival was monitored daily.
Histology. Long bones were either embedded in Shandon cryomatrix (Thermo Fisher Scientific) or decalcified in 10% EDTA/PBS and embedded in paraffin. E14.5 FLs were embedded in cryomatrix. Cryosections were stained with tartrate-resistant acid phosphatase (TRAP kit; Sigma-Aldrich) and with antibodies against CD31 (R&D Systems), EpCAM (G8.8; BD), Osteocalcin (Abcam), and CD3e (145-2C11), B220 (RA3-6B2), Mac-1 (M1/70), and Gr-1 (RB6-8C5; eBioscience).
Genotyping PCR and quantitative real-time PCR analysis. The ge-notyping PCR was performed according to standard procedures with the fol-lowing primers used for genotyping of lentivirally transduced cells. CMV-GFP PCR: CMV forward (5-AGGTCTATATAAGCAGAGCTC-3; located in CMV promoter) and GFP reverse (5-GGCGAGCTGCACGCTGCC-GTCGTC-3; located in GFP cDNA); CMV-K3 PCR: K3 foward (5-TGT-GAGGTGGTCCCTGAT-3; located in K3 cDNA) and WPRE reverse (5-AAGCAGCATATCCACATAGCG-3; located in WPRE sequence); K3 genomic PCR: K3 forward (5-CAGCTCCACAGCAGGTGCATG-3; lo-cated at exon 5/intron 5 transition of endogenous K3 gene), Poly A down for-ward (5-CTGCTCTTTACTGAAGGCTCTTT-3; located in Poly A domain of neomycin resistance cassette), and K3 reverse (5-TTCAGAACCCAGCT-CACCTTG-3; located at intron 6/exon 6 transition of endogenous K3 gene); K3 genomic/CMV-K3 PCR: Ex 3 forward (5-GCAAGCAGGACT-GGTCTGACC-3; located in exon 3 of endogenous K3 gene and K3 cDNA) and Ex 6 reverse (5-AATCGCAGCCAAAGCACATCC-3; located in exon 6 of endogenous K3 gene and K3 cDNA). For the quantitative real-time PCR, total RNA from FACS-sorted CD150+ or CD150 LSK cells were extracted with an RNeasy Mini extraction kit (QIAGEN) following the manufacturer’s instructions. cDNA was prepared with an iScript cDNA Synthesis kit (Bio-Rad Laboratories). Real-time PCR was performed with a LightCycler480 sys-tem (Roche) using iQ SYBR Green Supermix (Bio-Rad Laboratories). Each sample was measured in triplicate, and values were normalized to gapdh. The following real-time PCR primers were used: gapdh forward (5-TCCTGCAC-CACCAACTGCTTAGC-3) and reverse (5-TGGATGCAGGGATGAT-GTTCTGG-3), Kind3 forward (5-CACAGCACCGACCTGTCATC-3) and reverse (5-CCGCCAGCTAAGACAACCTTT-3), p21 forward (5-CCTGGTGATGTCCGACCTG-3) and reverse (5-CCATGAGCG-CATCGCAATC-3), p27 forward (5-AGTGTCCAGGGATGAGGAAGC-GAC-3) and reverse (5-TTCTTGGGCGTCTGCTCCACAGTG-3), and p57 forward (5-GCGCAAACGTCTGAGATGAGT-3) and reverse (5-AGAGTTCTTCCATCGTCCGCT-3).
Statistical analysis. Unless otherwise noted, all values are reported as mean ± SD. Statistical tests used for each experiment are described in the figure leg-ends. Statistical significance was assumed at P < 0.05. NS, P > 0.05; *, P < 0.05; **, P < 0.01; and ***, P < 0.001. Statistical analyses were performed using Prism (GraphPad Software) or MedCalc software (MedCalc Software).
Online supplemental material. Video 1 shows K3+/+ and Videos 2 and 3 show K3/ LSK cells in BM microvessels after adoptive transfer into irra-diated WT recipients. Online supplemental material is available at http://www.jem.org/cgi/content/full/jem.20150269/DC1.
We thank K. Hirsch, A. Felber, S. Bierschenk, and S. Longhi for expert technical assistance; A. Pfeifer for the lentiviral vector; G.W. Bornkamm for the R26creERT2 mouse; and R. Zent for critically reading the manuscript.
This work was supported by the Deutsche Forschungsgemeinschaft (grants SFB 914 and FOR 2033) and the Max Planck Society.
The authors declare no competing financial interests.
Author contributions: R. Ruppert designed, performed, and analyzed most experiments; M. Moser, M. Sperandio, E. Rognoni, M. Orban, W.-H. Liu, R.A.J.
on October 8, 2015
jem.rupress.org
Dow
nloaded from
Published August 17, 2015

1432 Kindlin-3 is essential for activated HSCs and HPCs | Ruppert et al.
Rizo, A., E. Vellenga, G. de Haan, and J.J. Schuringa. 2006. Signaling path-ways in self-renewing hematopoietic and leukemic stem cells: do all stem cells need a niche? Hum. Mol. Genet. 15:R210–R219. http://dx.doi .org/10.1093/hmg/ddl175
Rognoni, E., M. Widmaier, M. Jakobson, R. Ruppert, S. Ussar, D. Katsougkri, R.T. Böttcher, J.E. Lai-Cheong, D.B. Rifkin, J.A. McGrath, and R. Fässler. 2014. Kindlin-1 controls Wnt and TGF- availability to regulate cutaneous stem cell proliferation. Nat. Med. 20:350–359. http://dx.doi .org/10.1038/nm.3490
Schmidt, S., I. Nakchbandi, R. Ruppert, N. Kawelke, M.W. Hess, K. Pfaller, P. Jurdic, R. Fässler, and M. Moser. 2011. Kindlin-3–mediated signal-ing from multiple integrin classes is required for osteoclast-mediated bone resorption. J. Cell Biol. 192:883–897. http://dx.doi.org/10.1083/ jcb.201007141
Shattil, S.J., C. Kim, and M.H. Ginsberg. 2010. The final steps of integrin activation: the end game. Nat. Rev. Mol. Cell Biol. 11:288–300. http://dx.doi.org/10.1038/nrm2871
Svensson, L., K. Howarth, A. McDowall, I. Patzak, R. Evans, S. Ussar, M. Moser, A. Metin, M. Fried, I. Tomlinson, and N. Hogg. 2009. Leukocyte adhesion deficiency-III is caused by mutations in KINDLIN3 affecting integrin activation. Nat. Med. 15:306–312. http://dx.doi.org/ 10.1038/nm.1931
Taooka, Y., J. Chen, T. Yednock, and D. Sheppard. 1999. The integrin 91 me-diates adhesion to activated endothelial cells and transendothelial neutro-phil migration through interaction with vascular cell adhesion molecule-1. J. Cell Biol. 145:413–420. http://dx.doi.org/10.1083/jcb.145.2.413
Trumpp, A., M. Essers, and A. Wilson. 2010. Awakening dormant haemato-poietic stem cells. Nat. Rev. Immunol. 10:201–209. http://dx.doi.org/ 10.1038/nri2726
Ussar, S., H.-V. Wang, S. Linder, R. Fässler, and M. Moser. 2006. The Kindlins: subcellular localization and expression during murine devel-opment. Exp. Cell Res. 312:3142–3151. http://dx.doi.org/10.1016/ j.yexcr.2006.06.030
van der Loo, J.C., X. Xiao, D. McMillin, K. Hashino, I. Kato, and D.A. Williams. 1998. VLA-5 is expressed by mouse and human long-term repopulating hematopoietic cells and mediates adhesion to extracellular matrix protein fibronectin. J. Clin. Invest. 102:1051–1061. http://dx.doi .org/10.1172/JCI3687
Wilson, A., and A. Trumpp. 2006. Bone-marrow haematopoietic-stem-cell niches. Nat. Rev. Immunol. 6:93–106. http://dx.doi.org/10.1038/ nri1779
Wilson, A., E. Laurenti, G. Oser, R.C. van der Wath, W. Blanco-Bose, M. Jaworski, S. Offner, C.F. Dunant, L. Eshkind, E. Bockamp, et al. 2008. Hematopoietic stem cells reversibly switch from dormancy to self- renewal during homeostasis and repair. Cell. 135:1118–1129. http://dx.doi.org/10.1016/j.cell.2008.10.048
Wright, D.E., A.J. Wagers, A.P. Gulati, F.L. Johnson, and I.L. Weissman. 2001. Physiological migration of hematopoietic stem and progenitor cells. Science. 294:1933–1936. http://dx.doi.org/10.1126/science.1064081
Yamaguchi, M., K. Ikebuchi, F. Hirayama, N. Sato, Y. Mogi, J. Ohkawara, Y. Yoshikawa, K. Sawada, T. Koike, and S. Sekiguchi. 1998. Different adhesive characteristics and VLA-4 expression of CD34+ progenitors in G0/G1 versus S+G2/M phases of the cell cycle. Blood. 92:842–848.
Yamazaki, S., H. Ema, G. Karlsson, T. Yamaguchi, H. Miyoshi, S. Shioda, M.M. Taketo, S. Karlsson, A. Iwama, and H. Nakauchi. 2011. Non-myelinating Schwann cells maintain hematopoietic stem cell hiberna-tion in the bone marrow niche. Cell. 147:1146–1158. http://dx.doi .org/10.1016/j.cell.2011.09.053
Zou, P., H. Yoshihara, K. Hosokawa, I. Tai, K. Shinmyozu, F. Tsukahara, Y. Maru, K. Nakayama, K.I. Nakayama, and T. Suda. 2011. p57Kip2 and p27Kip1 cooperate to maintain hematopoietic stem cell quiescence through interactions with Hsc70. Cell Stem Cell. 9:247–261. http://dx.doi.org/10.1016/j.stem.2011.07.003
committed cells. Mol. Cell. Proteomics. 11:286–302. http://dx.doi.org/10 .1074/mcp.M111.016790
Kuijpers, T.W., E. van de Vijver, M.A.J. Weterman, M. de Boer, A.T.J. Tool, T.K. van den Berg, M. Moser, M.E. Jakobs, K. Seeger, O. Sanal, et al. 2009. LAD-1/variant syndrome is caused by mutations in FERMT3. Blood. 113:4740–4746. http://dx.doi.org/10.1182/blood-2008-10-182154
Magnon, C., and P.S. Frenette. 2008. Hematopoietic stem cell trafficking. In Stembook. Harvard Stem Cell Institute, Cambridge, MA.
Malinin, N.L., L. Zhang, J. Choi, A. Ciocea, O. Razorenova, Y.-Q. Ma, E.A. Podrez, M. Tosi, D.P. Lennon, A.I. Caplan, et al. 2009. A point mutation in KINDLIN3 ablates activation of three integrin subfamilies in humans. Nat. Med. 15:313–318. http://dx.doi.org/10.1038/nm.1917
Massberg, S., P. Schaerli, I. Knezevic-Maramica, M. Köllnberger, N. Tubo, E.A. Moseman, I.V. Huff, T. Junt, A.J. Wagers, I.B. Mazo, and U.H. von Andrian. 2007. Immunosurveillance by hematopoietic progeni-tor cells trafficking through blood, lymph, and peripheral tissues. Cell. 131:994–1008. http://dx.doi.org/10.1016/j.cell.2007.09.047
Matsumoto, A., S. Takeishi, T. Kanie, E. Susaki, I. Onoyama, Y. Tateishi, K. Nakayama, and K.I. Nakayama. 2011. p57 is required for quies-cence and maintenance of adult hematopoietic stem cells. Cell Stem Cell. 9:262–271. http://dx.doi.org/10.1016/j.stem.2011.06.014
Mazo, I.B., and U.H. von Andrian. 1999. Adhesion and homing of blood-borne cells in bone marrow microvessels. J. Leukoc. Biol. 66:25–32.
Mazo, I.B., J.C. Gutierrez-Ramos, P.S. Frenette, R.O. Hynes, D.D. Wagner, and U.H. von Andrian. 1998. Hematopoietic progenitor cell rolling in bone marrow microvessels: parallel contributions by endothelial selectins and vascular cell adhesion molecule 1. J. Exp. Med. 188:465–474. http://dx.doi.org/10.1084/jem.188.3.465
Mazo, I.B., S. Massberg, and U.H. von Andrian. 2011. Hematopoietic stem and progenitor cell trafficking. Trends Immunol. 32:493–503. http://dx.doi.org/10.1016/j.it.2011.06.011
Moretti, F.A., M. Moser, R. Lyck, M. Abadier, R. Ruppert, B. Engelhardt, and R. Fässler. 2013. Kindlin-3 regulates integrin activation and ad-hesion reinforcement of effector T cells. Proc. Natl. Acad. Sci. USA. 110:17005–17010. http://dx.doi.org/10.1073/pnas.1316032110
Morita, Y., H. Ema, and H. Nakauchi. 2010. Heterogeneity and hierarchy within the most primitive hematopoietic stem cell compartment. J. Exp. Med. 207:1173–1182. http://dx.doi.org/10.1084/jem.20091318
Morrison, S.J., and D.T. Scadden. 2014. The bone marrow niche for hae-matopoietic stem cells. Nature. 505:327–334. http://dx.doi.org/10 .1038/nature12984
Moser, M., B. Nieswandt, S. Ussar, M. Pozgajova, and R. Fässler. 2008. Kindlin-3 is essential for integrin activation and platelet aggregation. Nat. Med. 14:325–330. http://dx.doi.org/10.1038/nm1722
Moser, M., K.R. Legate, R. Zent, and R. Fässler. 2009a. The tail of in-tegrins, talin, and kindlins. Science. 324:895–899. http://dx.doi.org/ 10.1126/science.1163865
Moser, M., M. Bauer, S. Schmid, R. Ruppert, S. Schmidt, M. Sixt, H.-V. Wang, M. Sperandio, and R. Fässler. 2009b. Kindlin-3 is required for 2 integrin–mediated leukocyte adhesion to endothelial cells. Nat. Med. 15:300–305. http://dx.doi.org/10.1038/nm.1921
Pellinen, T., S. Tuomi, A. Arjonen, M. Wolf, H. Edgren, H. Meyer, R. Grosse, T. Kitzing, J.K. Rantala, O. Kallioniemi, et al. 2008. Integrin trafficking regulated by Rab21 is necessary for cytokinesis. Dev. Cell. 15:371–385. http://dx.doi.org/10.1016/j.devcel.2008.08.001
Potocnik, A.J., C. Brakebusch, and R. Fässler. 2000. Fetal and adult hematopoi-etic stem cells require 1 integrin function for colonizing fetal liver, spleen, and bone marrow. Immunity. 12:653–663. http://dx.doi.org/10.1016/ S1074-7613(00)80216-2
Raghavan, S., C. Bauer, G. Mundschau, Q. Li, and E. Fuchs. 2000. Conditional ablation of 1 integrin in skin. Severe defects in epidermal proliferation, basement membrane formation, and hair follicle invagination. J. Cell Biol. 150:1149–1160. http://dx.doi.org/10.1083/jcb.150.5.1149
on October 8, 2015
jem.rupress.org
Dow
nloaded from
Published August 17, 2015