kinematic and kinetic analysis of squat jump and...
TRANSCRIPT

KINEMATIC AND KINETIC ANALYSIS OF SQUAT JUMP AND
COUNTER-MOVEMENT JUMP
A Thesis Submitted in Partial Fulfillment
of the Requirement for the Degree of
Bachelor of Technology
in
Biomedical Engineering
by
SUBHASHISH KUMAR SATPATHY
111BM0546
Under the supervision of
Dr. A. THIRUGNANAM
Department of Biotechnology & Medical Engineering
National Institute of Technology
Rourkela, Odisha-769008
May 2015

CERTIFICATE
This is to certify that the report entitled “KINEMATIC AND KINETIC ANALYSIS OF SQUAT
JUMP AND COUNTER-MOVEMENT JUMP” submitted by Subhashish Kumar Satpathy
(111BM0546) towards the partial fulfillment of the requirement for the degree of Bachelors of
Technology in Biomedical Engineering at Department of Biotechnology & Medical Engineering,
NIT Rourkela is a record of bonafide work carried out by him under my guidance and
supervision.
Rourkela Dr. A. THIRUGNANAM
Date Dept. of Biotechnology and Medical Engineering
National Institute of Technology, Rourkela

ACKNOWLEDGEMENT
I feel immense pleasure and privilege in expressing my deep gratitude, indebtedness and
thankfulness towards all the people who have helped, inspired and encouraged me during the
preparation of this report.
I would like to thank Dr. A. Thirugnanam, who provided me this opportunity to
highlight the key aspects of an upcoming technology and guided me during the project work
preparation. I place on record my sincere gratitude to Prof. Krishna Pramanik, Head of
Department, Department of Biotechnology and Medical Engineering, NIT Rourkela for her
constant encouragement.
I would like to thank Mr. Shreeshan Jena, Mr. Krishna Kumar Ramajayam, Ms.
Reshmi Dey, Ms Deepshika Mahapatra and Mr Artatrana Tandi, Department of
Biotechnology and Medical Engineering, NIT Rourkela for their regular support, help and
motivation.
Last but not the least, I would like to thank whole heartedly my parents and family
members whose love and unconditional support, both on academic and personal front, enabled
me to see the light of this day.
Subhashish Kumar Satpathy
111BM0546

CONTENTS
TABLE OF CONTENTS PAGE NO
ACKNOWLEDGEMENT i
ABBREVIATIONS iv
LIST OF FIGURES v
ABSTRACT vii
CHAPTER 1 1
INTRODUCTION
1.1 Overview 2
1.2 Sports Biomechanics analysis 3
1.3 Gait analysis 3
1.4 3D motion capture system 4
1.5 Multi-axial force platform 5
CHAPTER 2 7
LITERATURE REVIEW
CHAPTER 3 10
METHODOLOGY
3.1 Equipment and software 11
3.2 Methods 13
CHAPTER 4 19
RESULT AND DISCUSSION
4.1 Kinetic analysis 20
4.2 Analysis of jump height for squat jump and counter-movement jump 24

4.3 Relation between the jump height and knee angle 25
4.4 Relation between the jump height and hip angle 27
4.5 Relation between the jump height and ankle angle 29
4.6 Discussion 31
CONCLUSION 35
SCOPE FOR FUTURE WORK 36
REFERENCES 37

ABBREVIATIONS
ADC = Analog to digital converter
CM = Counter-movement
COM = Center of mass
DAQ = Data acquisition system
EMG = Electromyography
FM1 = Head of first metatarsus
FM5 = Head of fifth metatarsus
GRF = Ground reaction force
QTM = Qualisys track manager
R_FAL, L_FAL = Fibula apex of lateral malleolus
R_FLE, L_FLE = Femur lateral epicondyle
R_FME, L_FME = Femur medial epicondyle
R_FTC, L_FTC = Femur greater trochanter.
R_ICT, L_ICT = Ilium crest tubercle (Iliac Crest)
R_TAM, L_TAM = Tibia apex of medial malleolus

LIST OF FIGURES
Figure
Number
Description Page
number
1 Multi-axial force platform used in present study 11
2 Retro-reflective marker used in motion capture analysis 13
3 Lab set-up of 3D motion capture system 14
4 Volunteer performing squat jump with markers on force platform and
subsequently captured on 3D motion capture system
15
5 Schematic diagram of markers position and naming 15
6 Model developed by Visual3D V5 professional (a) lower body model, (b)
crouch position
17
7 3D model showing crouch phase of squat jump and the GRF plot 20
8 GRF pattern curve for (a) squat jump, (b) Counter-movement jump 21
9 Acceleration of squat jump for (a) a non-athlete, (b) an athlete 22
10 Acceleration of CM jump for (a) a non-athlete, (b) an athlete 23
11 GRF before take-off plot for squat jump and counter-movement jump for all
volunteers
24
12 Scattered plot of squat and counter-movement jump height for (a) athletes,
(b) non-athletes
25
13 Scattered plot between squat and counter-movement jump height and knee
angle (a) for athletes, (b) for non-athletes
26
14 Scattered plot between athletes’ and non-athletes’ height and knee angle for
(a) squat jump (b) CM jump
27

15 Scattered plot between squat and counter-movement jump height and hip
angle (a) for athletes, (b) for non-athletes
28
16 Scattered plot between athletes’ and non-athletes’ jump height and hip
angle for (a) counter-movement (b) squat jump
29
17 Scattered plot between squat and counter-movement jump height and ankle
angle for (a) athletes, (b) non-athletes
30
18 Scattered plot between athletes’ and non-athletes’ height and ankle angle
for (a) squat jump, (b) counter-movement jump
31

ABSTRACT
This study presents the investigation of maximum height of jump for volunteers
executing a squat jump and counter-movement (CM) jump. This analysis was carried out with
the help of a 3D motion capture system. The study was aimed at finding out the difference in
jumping patterns and jump height for specific groups of participants comprising individuals
regularly involved in sports activities and others who rarely take part in a specific sports activity.
The ground reaction force (GRF) patterns are utilized in order to analyze both types of jumps.
Variation of the maximum jump height in contrast to the knee angle, hip angle and ankle angle
was studied. The gait cycle of the jump has essentially four parts: crouch phase, push-off phase,
flight phase and landing phase. The change in GRF serves as an indicator for the momentum
change of the center of mass. The GRF value decreases at the time of crouch phase and again
increases with change in acceleration for counter-movement jump. The decrease in GRF value
produces a negative impulse and accordingly negative kinetic energy. In push-off phase a
positive kinetic energy is developed which should be more than the kinetic energy developed in
crouch phase to attain maximum height of jump. To achieve maximum height of jump the knee
angle before take-off varies from 800 to 100
0 and the hip angle varies from 70
0 to 90
0. Hence at a
hip angle of 900 the maximum jump height is achieved according the experimental data. It is
observed that moment at the knee angle and hip angle will be maximum for 900 joint angle. Due
to maximum moment about the knee and hip joint, jump height attained will be maximum.
Keywords: jump, counter-movement, motion capture, ground reaction force, knee angle

1
Chapter 1
Introduction

2
1.1 Overview
Most of the sports like basketball, volleyball, football, etc. involves lots of lower body
movement. To achieve a maximum jump height while playing real life sport, the sportsperson
has to train their body accordingly. The participant applies a force against a substrate, which
generates a reactive force that propels the participant away from the surface. Any solid or
liquid capable of producing an opposing force can serve as a substrate, including ground or
water. This study is based on the jumping activity of two different types of standing jumps
i.e. squat jump and counter-movement jump. In squat jump the moment generated from the
upper body is restricted by crossing the arms. The participant starts from an upright standing
position, makes a preparatory descending motion by flexing the knees and hips so that the
thigh is parallel to the ground, then extends the knees and hips again to hop vertically up off
the ground. In counter-movement jump the participant uses the moment and muscle action
from upper body also to achieve a maximum height. Squat jumping is a basic exercise in
sports training to strengthen the muscles of the lower body. A jumping pattern can be
essentially divided into four phases: crouch phase, push-off phase, flight phase and landing
phase [1]. Crouch phase represents the transition from standing posture to the maximum
flexion of knee and hip joints. Push-off phase represents the extension of knee and hip until
the take-off of the body. Flight phase represents the interval between take-off and landing
when the body is in air. The landing phase represents the part when the foot comes into
contact with the ground surface. From a review of data presented by researchers it is known
that the jump height of counter-movement jump is more than that of a squat jump [2]. This
can be attributed to the additional moment and muscular energy input from the action of
upper body segments. To study the parameters one first needs to understand the functioning
of biomechanical instruments and learn about human gait analysis.

3
1.2 Sports biomechanics analysis
The sports biomechanics analysis are carried out by qualitative and quantitative
methods. The qualitative analysis is descriptive in nature and performed in four steps[3]. The
method presented here includes procedures common to existing methods and provides a
systematic way of biomechanically analyzing human movements.
A qualitative biomechanical analysis to improve technique involves four steps i.e.
description, observation, evaluation, and instruction. Description is the process of developing
a theoretical model of the most effective technique and describing what it would look like.
This is to observe the performance of the participant to determine what the technique actually
looks like. Evaluation involves the comparison of the observed performance to the ideal
technique and to identify and evaluate the errors. The performers are needed to be
acknowledged about the feedbacks and the instruction necessary to correct those errors. The
analysis has to be repeated again to minimize the error.
A quantitative analysis involves measurement of the parameters of performance. The
resulting analysis based on these measurements is a quantitative biomechanical analysis. As
the level of performance increases, the magnitude of the errors in performance decreases.
Errors made by novices are large and easy to detect visually using qualitative biomechanical
analysis techniques. With improved performance, the errors decrease in size and become
more difficult to detect; and at the elite level, a comprehensive quantitative biomechanical
analysis may be necessary to detect them.
1.3 Gait analysis
Gait analysis is the systematic study of animal locomotion, more specifically the
study of human motion, using the eye and the brain of observers, augmented
by instrumentation for measuring body movements, body mechanics, and the activity of the
muscles [4]. It has a wide area of application in sports biomechanics. The measurement of the

4
variables of the gait is mostly done by the use of a force platform and 3D motion capture
system. Other instruments like force transducers (strain gauge), pressure sensors, EMG
(electromyography), velocity meters etc. can be used for specific quantity measurement. Gait
analysis is generally carried out by the measurement of ground reaction force (GRF) patterns
in order to identify the phases involved in the type of motion under study.
1.4 3D motion capture system
3D motion capture is a process of capturing real-time trajectories of various segments
of the human body with the use of high-speed cameras. This process involves the attachment
of passive markers at specific anatomical locations of a subject’s body. For a biomechanics
study the motion capture system is capable of capturing joint and segmental motion of the
body parts such as head, upper body and lower body. Even small scale body movement such
as facial expression can be captured with this system, although it requires the use of other
professional software for post-processing. The motion capture system consists of a set high
speed infra-red cameras integrated with the computer and an interfacing software to process
and display the captured data by means of marker trajectories. Two types of motion capture
systems are available, one being marker-less motion capture system and the other being the
motion capture system which makes use of either active or passive markers for recording
data. The system used in this study is of the latter kind, making use of passive retro-reflective
markers. The system allows to capture 2-dimesional, 3-dimensional, and 6-degree of freedom
data in real-time with minimal latency. The markers are used to define the spatial locations of
various anatomical segments of the human body by attaching them on the medial and lateral
orientations of appropriate joints. The retro-reflective markers act as an enhanced reflecting
medium which reflects the infra-red light emitted by the diodes surrounding the aperture of
the cameras. The retro-reflective markers are of special construction in that not only do they

5
reflect a particular wavelength of light properly, but they also provide a large angle of
reflection, which is essential in order for multiple cameras to capture the reflected light.
The process of motion capture involves the steps of initialization or calibration,
tracking, pose estimation, and recognition. Initialization of the system is carried out by
proper placement of the cameras followed by synchronization with the system. Before
conducting trials calibration of the lab volume is done with the help of a standardized
calibration kit. After initialization the system has to capture the motion executed by the body.
In the tracking process the trajectories of individual markers are obtained through an
interfacing software. Pose estimation is the process where with the individual markers are
visually recognized by the user and the corresponding anatomical notations are assigned.
Recognition is the process where the user identified markers are used to define and generate
the body segments in a representative static model. This process is usually carried out with
the help of a post-processing software. Some such post-processing software contain
predefined musculoskeletal models of the human body and only require the user input to
organize the segmental parts in tandem with the dynamic location of identified markers.
With the help of the 3D motion capture system one can analyze the kinematics of the
human body. From the motion capture system the linked based parameters such as distance,
velocity, acceleration, the angle between two segments (joint angle), joint moment, energy of
the segments etc. can be obtained. For kinetic analysis a multi-axial force platform is
integrated to the system so all the biomechanics parameters which are needed for the analysis
can be obtained.
1.5 Multi-axial force platform
Force platforms are used in clinical gait laboratories to assess the effectiveness of
treatments of patients having neuromuscular diseases or to assess the progress of

6
rehabilitation from musculoskeletal injuries. The patterns revealed in the force– time plots
give coaches and scientists information about differences in technique that may affect
performance.
The force platform has a very simple construction. The load on the force platform is
shared by four piezo-electric transducers positioned at the four corners. The voltage output
from the transducers is directly proportional to the load applied on the platform and
subsequently to the GRF offered by the ground. Each piezo-electric transducer will generate a
charge proportional to the load shared[5]. The output is then converted to voltage using the
equation
𝑉 =𝑄
𝐶 - (1)
Where, V = voltage, Q = charge generated when the force is applied and C =
capacitance.

7
Chapter 2
Literature
Review
8
While performing a squat jump, the lower limbs produce mechanical work to elevate
the center of mass from its initial vertical position to that of maximal height. At the initial
position the vertical velocity (and hence kinetic energy) being zero, the total work done can
be calculated as the change in potential-energy from the initial vertical position and
maximum height position [6].
Furthermore, the mean power (P) development of the lower limb is [6]:
𝑃 = 𝑚𝑔 (𝐻
Hpo+ 1) √
𝑔𝐻
2 − eq (2)
Where m = the body mass, g = the gravitational acceleration, Hpo = the vertical push-off
distance and H = the jump height.
The ability to quickly accelerate the body from a resting position is considered to be
particularly important for successful performance in many sport activities. Based on Hill’s
muscle mechanical model, this ‘‘explosive’’ ability is directly related to the mechanical
characteristics of the muscle contractile component, and maximal power output [6]. Further,
testing the maximal power output of lower limbs extensor muscles is a common practice in
the assessment of human exercise performance [7].
Different formulae have been proposed to estimate power output from vertical jump
height and body mass. Some of them are derived from fundamental laws of mechanics but
challenged due to the biomechanics model. Indeed, it has been argued that Lewis’s formula
divides the change in potential energy by the aerial ascending phase duration instead of that
of the push-off, and does not take into account the change in potential energy during push-
off. Gray’s formula assumes that the vertical acceleration of the center of mass (COM) is
constant during push-off, which is in contradiction to some experimental results frequently
presented in the literature[8].

9
The maximum height of jump is greater in case of CM jump in comparison to that of
a squat jump. Various researchers have speculated musculoskeletal action as the reason
behind this phenomena. Pre-stretching allows the muscles to develop a high level of active
state and generate a larger force before starting to shorten[9].Other researchers attribute the
sudden release of elastic energy stored in the muscles and tendons to the extra work required
to attain a greater jump height [10]. Another study on the proteins of muscles explains the
enhancement through the ‘potentiation’ of the contractile proteins of the muscle or because of
the spinal reflexes [11].
The use of arm moment in counter-movement jump increases the jump height by
increasing vertical take-off velocity. The work done at hip joint is increased by the movement
of arms but the effect on knee and ankle joint is negligible[12]. With a shorter push-off
duration and small movement, the moments and mean power output at the knee and ankle
were found to be larger in drop jump than in counter-movement jump [13]. Athletic
individuals exhibited a larger magnitude of joint moment, power and work at the ankle, knee
and hip joints and therefore attained greater jump height. This shows that a higher jump
height for athletes is influenced to a high degree by the large amounts of energy generated at
the driving joints rather than the techniques adopted for execution[14].
Objectives
The main objectives of this current study are:
1. To study the pattern of forces for a squat and counter-movement jump performed by a
group of athletic and non-athletic individuals.
2. To compare and study the maximum jump height for athletes and non-athletes in case of
squat and counter-movement jumps.
3. To analyze the jump height with respect to the different parameters such as knee angle,
ankle angle and hip angle.

10
Chapter 3
Methodology

11
3.1 Equipment and software
3.1.1 3D motion capture system
The 3D motion capture system consists of four infra-red Oqus cameras, an integrated
multi-axial force platform and Qualisys proprietary tracking software (QTM, Qualisys track
manager). Qualisys’ proprietary tracking software allows users to capture 2-dimensional, 3-
dimensional and 6-degree of freedom data in real-time, with minimal latency.
3.1.2 Multi-axial force plate
The force platform used in this study was Kistler’s multiaxial force platform (model
AA9260) shown in Figure 1. The dimensions of the plate are 500×590× 50 mm. This force
platform can measure ground reaction forces (GRF), moments, torque, center of pressure,
coefficient of friction, velocity, acceleration, work done, impulse and displacement of the
center of mass of the body.
Figure 1: Force plate used in this study
3.1.3 Data Acquisition System (DAQ)
The integration of force platform with the 3D motion capture system is achieved with
the help of Kistler’s data acquisition system (DAQ) (type 5691A1). The analog output from

12
the force platform passes through an internal amplifier and reaches the DAQ where data
sampling is done to generate a digital signal. Simultaneously the marker position data is
acquired from Oqus high-speed cameras is synchronized with the digital output of the force
platform data. This synchronized data is reflected in Qualisys track manager software.
3.1.4 Qualisys Track Manager software
Qualisys Track Manager is a Windows based data interfacing software with an
interface that allows the user to perform 2D and 3D motion capture. QTM is designed to
provide both advanced features required by technically advanced users and a simple method
of application for the inexperienced user. Together with the Qualisys line of optical
measurement hardware, QTM will streamline the coordination of all features in a
sophisticated motion capture system and provide the possibility of rapid production of
distinct and accurate 3D, 2D and 6DOF data. During the capture, real time 3D, 2D and 6DOF
information is displayed allowing instant confirmation of accurate data acquisition. The
individual 2D camera data is quickly processed and converted into 3D data by advanced
algorithms, which are adaptable to different movement characteristics. The data can then be
exported to analysis software via several external formats.
3.1.5 Visual3D V5 professional software
Visual3D is a proprietary general purpose bio-motion modeling and analysis software
package developed and published by C-Motion, Inc. The software makes use of the .c3d file
format for input data as well as real-time motion data streamed by several hardware
manufacturers. The program is not restricted in terms of marker sets and provides a historical
audit trail of data changes. Modeling features include kinematics, inverse dynamics (kinetics)
and inverse kinematics.
13
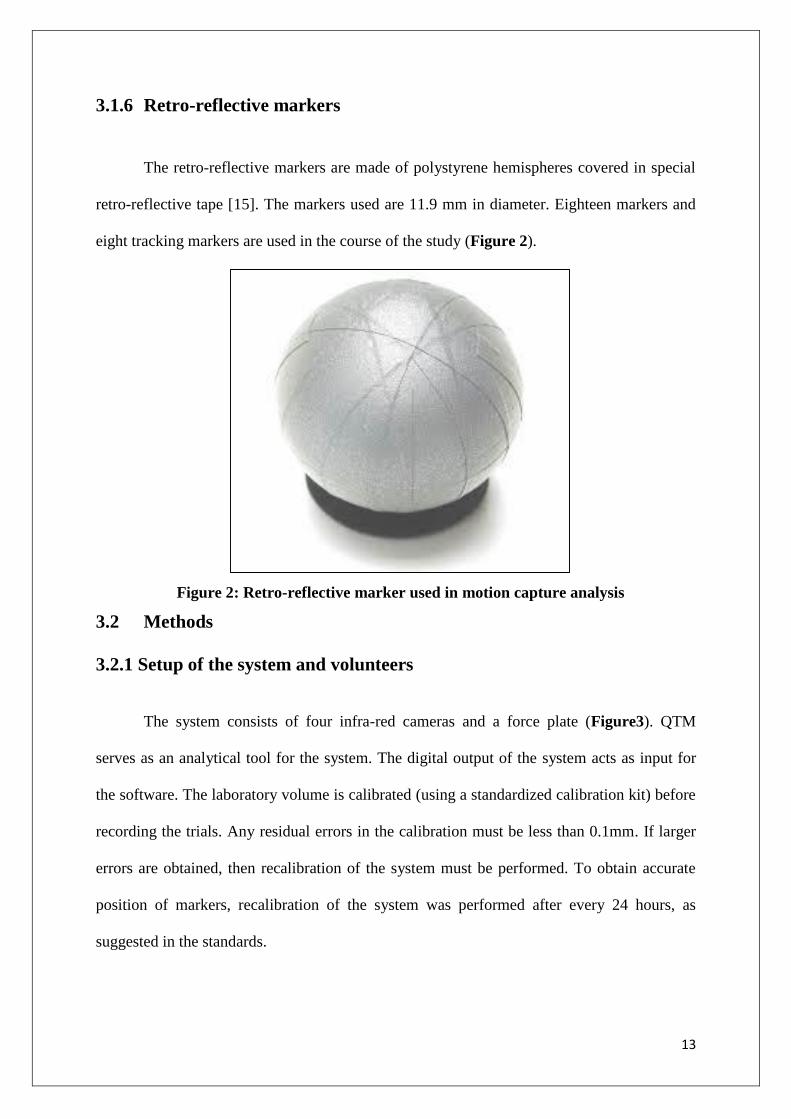
3.1.6 Retro-reflective markers
The retro-reflective markers are made of polystyrene hemispheres covered in special
retro-reflective tape [15]. The markers used are 11.9 mm in diameter. Eighteen markers and
eight tracking markers are used in the course of the study (Figure 2).
Figure 2: Retro-reflective marker used in motion capture analysis
3.2 Methods
3.2.1 Setup of the system and volunteers
The system consists of four infra-red cameras and a force plate (Figure3). QTM
serves as an analytical tool for the system. The digital output of the system acts as input for
the software. The laboratory volume is calibrated (using a standardized calibration kit) before
recording the trials. Any residual errors in the calibration must be less than 0.1mm. If larger
errors are obtained, then recalibration of the system must be performed. To obtain accurate
position of markers, recalibration of the system was performed after every 24 hours, as
suggested in the standards.

14
Figure 3: Laboratory set-up of the motion capture system at NIT Rourkela
Volunteers
For this study twenty volunteers were selected from within the institute. The
volunteers were characterized into two groups, namely athletic and non-athletic participants.
The athletic volunteers are belonged to different sports background such as basketball,
volleyball and football whereas the non-athletic participants were not involved in any regular
sports activity. All the volunteers for this study were aged between 19 and 24 years. Informed
consent was obtained from each participant before conducting the trial.
The retro-reflective markers were attached to distinct anatomical points on the lower
body. Eighteen markers and eight tracking markers were used in each case to represent the
lower body (Figure 4). In the course of this study each volunteer was made to jump on the
force plate. The markers were named according to the anatomical position of the body. For
lower body the markers used were named as R_ICT, L_ICT, R_IAS, L_IAS, R_FTC,
L_FTC, R_FLE, R_FME, L_FLE, L_FME, R_FAL, R_TAM, L_FAL, L_TAM, R_FM5,

15
R_FM1, L_FM5, L_FM1 and tracking markers can be named according to choice. The
positions are specified in (Figure 5) shown below.
Figure 4: Volunteer performing squat jump with markers and subsequently
captured on 3D motion capture system
Figure 5: Markers position and naming

16
3.2.2 Segment Designing in Visual3D V5
3.2.2.1 Pelvis Segment
R_ICT and L_ICT are the proximal lateral and medial marker representation for the
pelvis R_FTC and L_FTC are the distal lateral and medial marker representation for pelvis
respectively.
3.2.2.2 Thigh Segment
Visual3D treats the thigh as a geometrical primitive. The proximal radius is the
geometrical radius of the proximal end of the thigh. Calipers can be used to measure or the
radius can be defined as one quarter of the distance between the greater trochanters. For
proximal part FTC is selected as the proximal lateral part of the thigh and none is selected for
the proximal medial part of the thigh. For distal part FLE is selected as the lateral position
and FME is selected as medial position.
3.2.2.3 Shank Segment
Consistent with our recommendation for the thigh, we recommend that users avoid the lateral
knee marker as a tracking marker unless the medial knee marker is also a tracking marker.
FLE and FME are selected as proximal lateral and medial part of the shank. FAL and TAM
are selected as the distal lateral and medial part of the shank.
3.2.2.4 One Segment Foot
This model is consistent with a one segment foot segment. FAL and TAM are selected as
proximal lateral and medial part of the shank. FM5 and FM1 are selected as the distal lateral
and medial part of the shank. Whenever required the orientation of the segment is modified
by using ‘scaling’, ‘rotation’ and ‘move’ options.

17
3.3 Procedure
Two modes of trials were recorded for each participant, one for squat jump and
another for counter-movement jump. Each trial presented one cycle of the jump. For each
participant at least three sets of trials were conducted. From this set a single trial containing a
clean jump was selected. A clean trial is defined as one in which all marker trajectories are
detected throughout the jump cycle and hence no segmental deformation will occur during
post processing the 3D model. The markers of the captured data are named and exported in
the .c3d file format for analysis of the captured data. The .c3d files were imported into
Visual3D software to analyze different kinematic and kinetic parameter related to the jump.
The model of the lower body is designed using the Visual3D software (Figure 6(a), (b)).
Figure 6: Model developed by visual3D V5 professional (a): the lower body
model, (b): crouch position
Various plots of kinematic and kinetic data were custom defined and the generated
reports were then processed by a low pass filter. Data interpolation was carried out so as to
obtain a smooth and continuous graph. The useful region from the graphical plots were
18
extracted and used for analyzing the jump. The jump height was measured as a difference of
the maximum height achieved by the center of mass (COM) during flight phase and the
height of the COM while standing still. The ankle angle was defined as the angle between the
foot and shank segments of the skeletal model. The knee angle was defined by the angle
between the shank and the thigh segments of the skeletal model. Similarly the hip angle was
defined as the angle between the pelvis and thigh segments of the skeletal model. All
temporal plots of the kinematic data, i.e. joint angles were calculated on the Y-Z plane.
Temporal plots of GRF, ankle angle, knee angle, and hip angle were generated in Visual3D
V5 professional software. The result and analysis of this study are presented in the next
chapter.

19
Chapter 4
Results and
discussion

20
4.1 Kinetic analysis
4.1.1 Analysis of GRF during the Squat jump and counter-movement jump
The pattern of the ground reaction force of the jump is studied in four phases. The
first is crouch phase, push-off phase, flight phase, and landing phase. The plots shown in
Figure 8 (a) & (b) below represent the GRF acting normal to the ground for the squat jump
and CM jump respectively. Even though the jump height varies in case of athletes and non-
athletes, still the pattern of GRF remains distinct for squat jumps and CM jumps.
The weight of the volunteer, whose jump pattern is to be analyzed, is 553.65 N. When
the participant is in the crouch phase the GRF in normal direction decreases as the COM of
the body and deviates from the normal direction to the negative X-direction. The force
applied is distributed among the X-, Y-, and Z-direction. In the crouch phase, (shown in
Figure 7) the GRF decreases first and then the body accelerates upwards in the push-off
phase to achieve the required force to take-off from the ground. The body accelerates with a
linearly increasing acceleration in the push-off phase. When the body gets enough force to
take-off the body goes in the flight phase where the GRF values is found to be 0N at the
flight phase for both squat and CM jumps. The time of flight in case of counter-movement
jump (0.48s) is more than that of squat jump (0.44s).
Figure 7: 3D model showing crouch phase of squat jump and the GRF plot

21
Figure 8: GRF pattern curve for (a) squat jump, (b) Counter-movement jump
4.1.2 Acceleration plots for an athlete and a non-athlete
Acceleration plots provide a distinct advantage in comparing the jump patterns of different
individuals in that the ‘mass’ term is removed from the equation. An athlete and a non-athlete
with nearly same body mass (60±1Kg) and comparable height (1.78±0.05) were chosen from
the list of volunteers. The athlete achieved a jump height of 0.414m and 0.489m whereas the
non-athlete achieved a jump height of 0.31m and 0.44m in squat jump and CM jump
respectively. A comparative set of study of the acceleration plots is provided in Figure 9 and
10. For the squat jumps GRF and acceleration pattern (Figure 9 (a) & (b)) obtained was
found to be nearly identical for both athletes and non-athletes. The only difference was the
time of flight that was found to be 0.56s for athlete and 0.46s for non-athlete in this particular
0
200
400
600
800
1000
1200
1400
1600
1
23
45
67
89
11
1
13
3
15
5
17
7
19
9
22
1
24
3
26
5
28
7
30
9
33
1
35
3
37
5
39
7
41
9
44
1
46
3
48
5
50
7
52
9
55
1
57
3
59
5
61
7
Gro
und
Rea
ctio
n f
orc
e (i
n N
)
Time (in frame number)
(a) GRF for squat jump
GRF
Wieght
0
200
400
600
800
1000
1200
1400
1600
1
13
25
37
49
61
73
85
97
10
9
12
1
13
3
14
5
15
7
16
9
18
1
19
3
20
5
21
7
22
9
24
1
GR
F(i
n N
)
Time (in frame numbers)
(b) GRF for CM jump
GRF for Counter-movement
jump
Weight of the person

22
case which indicates towards a greater jump height for the athlete. Similarly for CM jump the
athlete had a greater time of flight as compared to non-athlete ((Figure 10 (a) & (b)).
Figure 9: Acceleration of squat jump for (a) a non-athlete, (b) an athlete
-5
0
5
10
15
20
25
30
1
47
93
13
9
18
5
23
1
27
7
32
3
36
9
41
5
46
1
50
7
55
3
59
9
64
5
69
1
73
7
78
3
82
9
87
5
92
1
96
7
Acc
eler
atio
n (
in m
/s2)
Time (in frames)
(a) Acceleration for squat jump in z-direction for a non-athlete
Acceleration for squat
jump in z-direction for
a non-athlete
0
5
10
15
20
25
30
1
49
97
14
5
19
3
24
1
28
9
33
7
38
5
43
3
48
1
52
9
57
7
62
5
67
3
72
1
76
9
81
7
86
5
91
3
96
1
Acc
eler
atio
n (
in m
/s2)
Time (in frames)
(b) Acceleration for squat jump in z-direction for an athlete
Acceleration for squat
jump in z-direction for
an athlete

23
Figure 10: Acceleration of CM jump for (a) a non-athlete, (b) an athlete
-5
0
5
10
15
20
25
301
45
89
13
3
17
7
22
1
26
5
30
9
35
3
39
7
44
1
48
5
52
9
57
3
61
7
66
1
70
5
74
9
79
3
83
7
88
1
92
5
96
9
Acc
eler
ati
on
(in
m/s
2)
Time( in frames)
(a) Acceleration of CM jump in Z-direction for a non-athlete
Acceleration of CM jump
in Z-direction for a non-
athlete
0
5
10
15
20
25
30
1
43
85
12
7
16
9
21
1
25
3
29
5
33
7
37
9
42
1
46
3
50
5
54
7
58
9
63
1
67
3
71
5
75
7
79
9
84
1
88
3
92
5
96
7
Acc
eler
atio
n (
in m
/s2)
Time (in frames)
(b) Acceleration of CM jump in Z-direction for an athlete
Acceleration of CM
jump in Z-direction for
an athlete

24
4.1.3 GRF analysis before take-off for squat jump and counter-movement
jump
The graph (Figure 11) below represents the plot of GRF values before take-off of the
jump. It can be clearly observed that the GRF for the counter-movement jump is greater than
that of squat jump.
Figure 11: GRF before take-off plot for squat and counter-movement jump for
all volunteers
4.2 Analysis of jump height for squat jump and counter-movement jump
By analyzing the jump height achieved by the volunteers it is found that the jump
height for the counter-movement jump is more than the jump height achieved by the squat
jump for both athletic and non-athletic volunteers (Figure 12(a), (b)). There is plot of the
height difference between the squat jump height and counter-movement jump height. On an
average the difference varies from 0.06m to 0.11m for the non-athletes whereas the
difference varies from 0.6m to 0.14m for the athletes.
0
500
1000
1500
2000
0 1 2 3 4 5 6 7 8 9 10 11 12 13 14 15 16 17 18 19 20 21
GR
F b
efo
re t
ake-
off
( in
N)
Volunteers
GRF before take-off
GRF for squat jump before take-off GRF for CM jump before take-off

25
Figure 12: Scattered plot of squat and counter-movement jump height for (a) athletes,
(b) non-athletes
4.3 Relation between jump height and knee angle during push-off phase of
the jump
From the plot (Figure 13(a)) given below it can be seen that the knee angle of the
athletes in case of CM jump varies from 800 to 1000. For squat jump the knee angle varies
within the range of 800 to 1400. The knee angle between 800 and 1000 shows a higher
concentration of large jump height in cases both squat and counter-movement jump.
0
0.1
0.2
0.3
0.4
0.5
0.6
0.7
0 1 2 3 4 5 6 7 8 9 10 11
Jum
p h
eight
(in m
)
Volunteers
(a) Squat and CM jump height
Squat jump height for athletes CM jump height for athletes
0
0.1
0.2
0.3
0.4
0.5
0 1 2 3 4 5 6 7 8 9 10 11
Jum
p h
eight
(in m
)
Volunteers
(b) Squat and CM jump height
Squat jump height for non athletic volunteers Cmjump height for non-athletic volunteers

26
From the following plot (Figure 13(b)) knee angle for squat jump of non-athletes was
observed to be in the range of 1000 to 1400. For CM jump the knee angle varies mostly from
800 to 1000.
Figure 13: Scattered plot between squat and counter-movement jump height and knee
angle (a) for athletes, (b) for non-athletes
From the plot (Figure 14(a)) below it is clearly observed that the athletes achieved
maximum jump height as the knee angle varied between 800 and 1000. But for the non-
athletes knee angle during push-off was found to be more than 1000. As of now no specific
relationship has been established for the jump height with the knee angle for variation in the
range of 1000 to 1400.
0
0.1
0.2
0.3
0.4
0.5
0.6
0.7
0 20 40 60 80 100 120 140 160 180 200
Jum
p h
eight(
in m
)
Knee Angle ( in degrees)
(a) Jump height vs knee angle
Sportsmen squat jump height
Sportsmen CM jump height
0
0.1
0.2
0.3
0.4
0.5
0 20 40 60 80 100 120 140 160
Jum
p h
eigh
t(in
m)
Knee Angle (in degrees)
(b)Jump height vs knee angle
normal people(male) squat jump height
Normal people(male) CM jump height

27
Non-athletes and the athletes achieved more jump height when the knee angle
remains between 800 and 1000. It was observed that for the knee angle below 800 or above
1000 the jump height decreases drastically (Figure 14(b)).
Figure 14: Scattered plot between athletes’ and non-athletes’ height and knee angle for
(a) squat jump (b) CM jump
4.4 Relation between jump height and hip angle during push-off
From the plot (Figure 15(a)) below it can be observed that the for CM jump the hip
angle is less than that for squat jump. It can be seen that when hip angle increases beyond 900
the jump height decreases. The plot below shows that at an angle of 900 maximum height of
jump is obtained. From the plot (Figure 15(b)) below the jump height for counter-movement
0
0.1
0.2
0.3
0.4
0.5
0.6
0 20 40 60 80 100 120 140 160 180 200
Jum
p h
eight(
in m
)
Knee Angle (in degrees)
(a)Jump height vs knee angle
Sportsmen squat jump height
normal people(male) squat jump height
0
0.1
0.2
0.3
0.4
0.5
0.6
0.7
0 20 40 60 80 100 120 140 160
Jum
p h
eight(
in m
)
Knee Angle (in degrees)
(b) Jump height vs knee angle
Sportsmen CM jump height
Normal people(male) CM jump
height

28
jump the hip angle is less as compared to the squat jump. Here less hip angle represents more
flexion at hip.
Figure 15: Scattered plot between squat and counter-movement jump height and hip
angle (a) for athletes, (b) for non-athletes
4.4.3 Relation between counter-movement jump height and hip angle
athletes and non-athletes
From the plot (Figure 16(a)) below it can be analyzed that the athletes have hip angle
between 700 and 900 whereas the non-athletes have the hip angle in a long domain of hip
angle. When the hip angle of the non-athletes falls in the region 700 and 900 the jump height
is relatively greater than when the hip angle falls beyond the region of 700 and 900.
0
0.1
0.2
0.3
0.4
0.5
0.6
0.7
0 20 40 60 80 100 120 140 160
Jum
p h
eight(
in m
)
Hip angle (in degrees)
(a) Jump height vs hip angle
Sportsmen squat jump height
sportsmen CM jump height
0
0.1
0.2
0.3
0.4
0.5
0 20 40 60 80 100 120 140 160
Jum
p h
eight(
in m
)
Hip angle (in degrees)
(b) Jump height vs hip angle
normal people(male) squat jump height
normal people(male) CM jump height
29
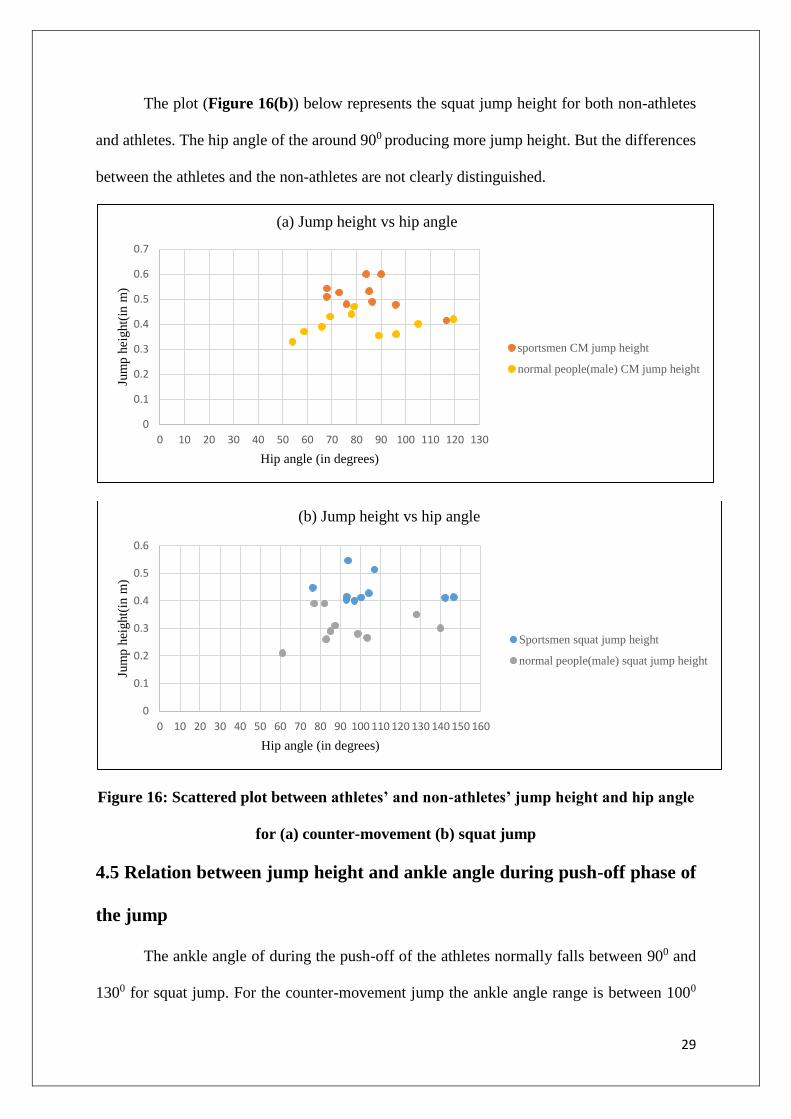
The plot (Figure 16(b)) below represents the squat jump height for both non-athletes
and athletes. The hip angle of the around 900 producing more jump height. But the differences
between the athletes and the non-athletes are not clearly distinguished.
Figure 16: Scattered plot between athletes’ and non-athletes’ jump height and hip angle
for (a) counter-movement (b) squat jump
4.5 Relation between jump height and ankle angle during push-off phase of
the jump
The ankle angle of during the push-off of the athletes normally falls between 900 and
1300 for squat jump. For the counter-movement jump the ankle angle range is between 1000
0
0.1
0.2
0.3
0.4
0.5
0.6
0.7
0 10 20 30 40 50 60 70 80 90 100 110 120 130
Jum
p h
eight(
in m
)
Hip angle (in degrees)
(a) Jump height vs hip angle
sportsmen CM jump height
normal people(male) CM jump height
0
0.1
0.2
0.3
0.4
0.5
0.6
0 10 20 30 40 50 60 70 80 90 100 110 120 130 140 150 160
Jum
p h
eight(
in m
)
Hip angle (in degrees)
(b) Jump height vs hip angle
Sportsmen squat jump height
normal people(male) squat jump height

30
and 1200 (Figure 17(a)). The plot (Figure 17(b)) here represents the ankle angle varies
between 950 and 1100. The squat jump and the counter-movement jump both are likely to
achieve the same ankle angle during the push-off phase of the jump.
Figure 17: Scattered plot between squat and counter-movement jump height and
ankle angle for (a) athletes, (b) non-athletes
The plot (Figure 18(a)) below shows that the maximum jump is attained is associated
with the ankle angle of 900 to 1200. From the plot (Figure 18(b)) below the ankle angle for
maximum jump height remains between 900 and 1200.
0
0.1
0.2
0.3
0.4
0.5
0.6
0.7
0 10 20 30 40 50 60 70 80 90 100 110 120 130
Jum
p h
eight(
in m
)
Ankle angle (in degrees)
(a) Jump height vs Ankle Angle
sportsmen squat jump height
Sportsmen CM jump height
0
0.05
0.1
0.15
0.2
0.25
0.3
0.35
0.4
0.45
0.5
0 10 20 30 40 50 60 70 80 90 100 110 120 130
Jum
p h
eight(
in m
)
Ankle angle (in degrees)
(b) Jump height vs Ankle Angle
normal people (male) squat jump
height
normal people(male) CM jump height

31
Figure 18: Scattered plot between athletes’ and non-athletes’ height and ankle angle
for (a) squat jump, (b) counter-movement jump
4.6 Discussion
In case of counter-movement jump the GRF value varies same way as the squat jump
but the magnitude of the force at crouch phase for counter-movement jump is less than that of
the squat jump and the magnitude of the force at the time take-off for counter-movement
0
0.1
0.2
0.3
0.4
0.5
0.6
0 10 20 30 40 50 60 70 80 90 100 110 120 130
Jum
p h
eight(
in m
)
Ankle angle (in degrees)
(a) Jump height vs ankle angle
sportsmen squat jump height
normal people (male) squat jump height
0
0.1
0.2
0.3
0.4
0.5
0.6
0.7
0 10 20 30 40 50 60 70 80 90 100 110 120 130
Jum
p h
eigh
t(in
m)
Ankle angle (in degrees)
(b) Jump height vs Ankle Angle
Sportsmen CM jump height
normal people(male) CM jump height

32
jump (Figure 8, 9) is more than that of the squat jump. In case of counter-movement jump a
negative impulse is created at the crouch phase.
From the impulse-momentum theory of mechanics
∆𝑝 = ∫ 𝑓 𝑑𝑡 − 𝑒𝑞(2)
Where ∆𝑝 represents the change in momentum, 𝑓 is the GRF, 𝑑𝑡 change in time.
As the GRF is decreasing in case counter-movement jump (figure), there will be a negative
impulse and hence negative kinetic energy. Let during the crouch phase the kinetic energy be
–KC, potential energy be Pc, during the push-off phase the kinetic energy be Kp work done is
positive during push-off phase, potential energy be Pp. According to the conservation of
energy the kinetic energy at highest jump height will be zero and the sum of the above energy
will be converted to potential energy. Hence Kp–KC will play an important role to decide
maximum jump height. Kp–KC should be maximized to attain maximum jump height.
The crouch phase for the non-athlete shows some negative impulse and as discussed
above the negative impulse will generate a negative kinetic energy which will decrease the
total kinetic energy before take-off and hence the jump height is less though the acceleration
before take-off is more for the non-athlete. In case of CM jump, the time of flight is less for
the non-athlete than the athlete and hence the jump height is more for the athlete.
The GRF and the acceleration is more in case of CM jump in comparison to squat
jump. The acceleration provides velocity and hence the kinetic energy. Hence in case of
counter-movement jump the kinetic energy more just before take-off as compared to the
squat jump. According to the energy conservation theorem the whole kinetic energy and the
negligible potential energy will be converted to the maximum potential energy of the body
which is achieved at the height of jump as the kinetic energy at that point is zero. So this is

33
the key reason of maximum jump height generally achieved during the counter-movement
jump in comparison to the squat jump.
Knee angle of the participant during push-off plays a very important role to achieve
maximum jump height. According to the experimental values the knee angle between 800 and
1000 gives maximum jump height in the respective background for counter-movement jump.
In case of squat jump the angle for all the non-athletes and some athletes are found to be
more than 1000 whereas some athletes attains maximum jump height at a knee angle ranged
between 800 to 1000. Hence when there is more flexion the jump height decreases. This is one
of the reasons why the jump height in case of the squat jump is less than the counter-
movement jump. The reason behind the take-off of the body is to create a torque around the
knee joint by the muscles of the leg for which the body can create some angular motion at the
knee joint and that rotational energy transform into kinetic energy when rotation is restricted
by the knee joint and the body goes upward. The knee angle should be such that the moment
generated is maximum. As the moment is the cross product of the force and the moment arm.
𝝉 = 𝒓 × 𝑭 − eq(3)
Where 𝝉 = moment, r = the moment arm, and F = force applied.
To maximize the moment the knee angle should be 900 according the moment
formula. From the experimental value for knee angle versus maximum jump height best
performance of participants is observed to lie within the range 800 to 1000.
It was found that the jump height is related to the hip angle. The hip angle of the
around 900 producing more jump height. This can be explained by the moment theorem of
mechanics. As the moment is cross product of force and moment arm, the angle plays
important role for producing the maximum moment and hence maximum height can be

34
achieved. As the hip angle is 900, maximum moment will be achieved. Hence the flexion
should be such that the hip angle attains 900 to achieve more jump height.
During push-off, the ankle angle of the participants are normally falls between 900
and 1200.For the sportspersons the ankle angle range is between 1000 and 1200. The ankle
angle shows the ability of the participants to give a push-off to the body to jump higher. As
the angle increases the jump height will increase but when the ankle angle crosses 1200 the
center of mass of the body comes forward and deviate from the center line of the body, and
the body balance is lost, hence jump height will decrease after the 1200 of ankle angle.
35
Conclusion
The study on the squat jump and the counter-movement jump was carried out using
3D Motion capture system. The study suggested that the jump height for the counter-
movement jump is more than that for the squat jump. The GRF in normal direction for both
the jumps represents the four different phases of the squat jump and counter-movement jump.
The phases are termed as the crouch phase, push-off phase, flight phase, landing phase
respectively. The GRF value decreases at the time of crouch phase and again increases with
change in acceleration for counter-movement jump. The decrease in GRF value produces a
negative impulse and accordingly negative kinetic energy. In push-off phase a positive
kinetic energy is developed which should be more than the kinetic energy developed in
crouch phase to attain maximum height. The acceleration of the GRF increases more rapidly
in case of counter-movement jump. The jump height varies with respect to knee angle and hip
angle. From the analysis it is found that the athletes achieve maximum jump height at a knee
angle between 800 and 1000 in counter-movement jump whereas for people from non-sports
background the knee angle exceeds 1000 which reduces the moment arm and moment will be
less at the knee joint for which the jump height is less. From the above observations and
analysis it is found that the jump height is related to the hip angle and maximum height of
jump is achieved at around 900-1000 of hip angle. This can be explain by the moment
theorem of mechanics. As the resultant moment is a cross product of force and moment arm,
the angle plays important role for producing the maximum moment and hence maximum
height can be achieved. As the hip angle is 900, maximum moment will be achieved. Hence
the flexion should be such that the hip angle and knee angle attain 900 to achieve maximum
jump height. The ankle angle of before the take-off of the participants normally falls between
900 and 1200. As of data collected till now no specific relationship of jump height with ankle
angle is established. But irrefutably, the stability of the jump depends on the ankle angle.

36
Scope for Future Work
Present work shows the analysis of the lower body for squat jump and counter-
movement jump. Further, full body analysis should be carried out for better understanding of
different jumps. Moreover the analysis should be carried out on sports persons from different
background and a regression analysis can be performed. The analysis carried out in this study
is based on the different joint angle (ankle angle, knee angle, hip angle) and their relationship
with jump height. The jump height also depends on other parameters like moments at the
lower body joints, muscular activity and muscle strain. Future work may be focused on
studying these musculoskeletal properties. Hence these points are important to have a sound
idea on squat jump and counter-movement jump and to suggest any important implications
which these findings may have for athletes. If a particular range of knee and hip angle is
found to favor maximum jump height a device may be designed to train athletes during
workouts to carry out jumps within the same angles in order to achieve maximum
performance.

37
References
1 David Levine, Jim Richards, and Michael W Whittle, Whittle's gait analysis. Elsevier Health Sciences, fourth edition, USA (2012).
2 Maarten F Bobbert, Karin GM Gerritsen, Maria CA Litjens, and Arthur J Van Soest, "Why is countermovement jump height greater than squat jump height?," Medicine and science in sports and exercise 28, 1402-1412 (1996).
3 Duane Knudson, Fundamentals of biomechanics. Springer Science & Business Media, second edition, USA (2007).
4 Michael W Whittle, "Clinical gait analysis: A review," Human Movement Science 15 (3), 369-387 (1996).
5 Graham E Caldwell, D Gordon E Robertson, and Saunders N Whittlesey, "Forces and their measurement," Research methods in biomechanics, 73-102 (2004).
6 Pierre Samozino, Jean-Benoît Morin, Frédérique Hintzy, and Alain Belli, "A simple method for measuring force, velocity and power output during squat jump," Journal of biomechanics 41 (14), 2940-2945 (2008).
7 Jack M Winters, "Hill-based muscle models: a systems engineering perspective", in Multiple muscle systems (Springer, 1990), Ney York, USA pp. 69-93.
8 Carmelo Bosco, Pekka Luhtanen, and Paavo V Komi, "A simple method for measurement of mechanical power in jumping," European journal of applied physiology and occupational physiology 50 (2), 273-282 (1983).
9 C Bosco, G Montanari, I Tarkkai, F Latteri, M Cozzi, G Iachelli, M Faina, R Colli, A MONTE, and M ROSA, "The effect of pre‐stretch on mechanical efficiency of human skeletal muscle," Acta physiologica scandinavica 131 (3), 323-329 (1987).
10 Peter Aerts, "Vertical jumping in Galago senegalensis: the quest for an obligate mechanical power amplifier," Philosophical Transactions of the Royal Society B: Biological Sciences 353 (1375), 1607-1620 (1998).
11 Nihat Özkaya, Margareta Nordin, David Goldsheyder, and Dawn Leger, Fundamentals of biomechanics: equilibrium, motion, and deformation. Springer Science & Business Media, (2012).
12 Kuangyou B Cheng, Chih-Hung Wang, Hui-Chuan Chen, Chin-Dai Wu, and Hung-Ta Chiu, "The mechanisms that enable arm motion to enhance vertical jump performance—A simulation study," Journal of biomechanics 41 (9), 1847-1854 (2008).
13 MF Bobbert, M Mackay, D Schinkelshoek, PA Huijing, and GJ van Ingen Schenau, "Biomechanical analysis of drop and countermovement jumps," European journal of applied physiology and occupational physiology 54 (6), 566-573 (1986).
14 Athanasios Vanezis and Adrian Lees, "A biomechanical analysis of good and poor performers of the vertical jump," Ergonomics 48 (11-14), 1594-1603 (2005).
15 Alvaro Muro-de-la-Herran, Begonya Garcia-Zapirain, and Amaia Mendez-Zorrilla, "Gait analysis methods: an overview of wearable and Non-wearable systems, highlighting clinical applications," Sensors 14 (2), 3362-3394 (2014).