kinematic and tectonic significance of the fold- and fault
TRANSCRIPT
Georgia State UniversityScholarWorks @ Georgia State University
Geosciences Dissertations Department of Geosciences
5-2-2007
Kinematic and Tectonic Significance of the Fold-and Fault- Related Fracture Systems in the ZagrosMountains, Southern IranKatayoun Mobasher
Follow this and additional works at: https://scholarworks.gsu.edu/geosciences_diss
Part of the Geography Commons, and the Geology Commons
This Dissertation is brought to you for free and open access by the Department of Geosciences at ScholarWorks @ Georgia State University. It has beenaccepted for inclusion in Geosciences Dissertations by an authorized administrator of ScholarWorks @ Georgia State University. For more information,please contact [email protected].
Recommended CitationMobasher, Katayoun, "Kinematic and Tectonic Significance of the Fold- and Fault- Related Fracture Systems in the Zagros Mountains,Southern Iran." Dissertation, Georgia State University, 2007.https://scholarworks.gsu.edu/geosciences_diss/1
KINEMATIC AND TECTONIC SIGNIFICANCE OF THE FOLD- AND FAULT-RELATED FRACTURE SYSTEMS IN THE ZAGROS MOUNTAINS,
SOUTHERN IRAN
by
KATAYOUN MOBASHER
Under the Direction of Hassan A., Babaie
ABSTRACT
Enhancement methods applied on various satellite images (ASTER, ETM and
RADAR SAT-1) facilitated the identification and mapping of tectonic fractures in the
Zagros fold-and-thrust belt in southwest Iran. The results of the fracture analysis on these
enhanced images reveal four principal fracture sets within each fold structure: (i) an axial
set defined by normal faults oriented parallel to the fold axial trace, (ii) a cross-axial,
extensional fracture set oriented perpendicular to the fold axial trace, (iii) and two sets of
intersecting shear fractures, oriented at an acute angle to the cross-axial set. Study of the
enhanced images also revealed five fracture sets along the Kazerun fault zone: (i) Riedel
R- and R’-shear fracture sets, (ii) extensional T fracture set oriented at a high angle to the
trace of the main Kazerun fault, (iii) oblique, synthetic P-shear fracture set, at a low angle
to the trace of the main Kazerun fault, and (iv) synthetic Y-shear displacement fracture
set, oriented sub-parallel to the main trace of the fault. The estimated mean azimuths of
the shortening that developed the fold- and fault-related fracture systems are remarkably
close, and are oriented perpendicular to the general NW-SE trend of the Zagros fold-and-
thrust belt.
The sampling and analysis of the fold- and fault-related fracture systems were
done in a GIS environment. This study shows that an analysis of enhanced satellite
images can reveal significant information on the deformation style, timing, and
kinematics of the Zagros fold-and-thrust belt. This study suggests that the Zagros
orogenic belt, which has mainly been forming since Miocene, due to the convergence of
the Iranian and Arabian subplates, has evolved both by thin- and thick-skinned tectonics.
Reconfiguration of the Precambrian basement blocks, and the ensuing slip and rotation
along the Precambrian faults during the Zagros orogeny, have deformed the folds, and
redistributed the fold-related fractures through rigid-body rotation.
INDEX WORDS: Fracture Analysis, Fold-and Fault-Related Fractures, Kazerun Fault Zone, Lineament Extraction, Image Enhancement Techniques, Fold-and-Thrust Belt, Thin- and Thick-Skinned Tectonics, GIS, Remote Sensing, Zagros, Iran.
KINEMATIC AND TECTONIC SIGNIFICANCE OF THE FOLD- AND FAULT-
RELATED FRACTURE SYSTEMS IN THE ZAGROS MOUNTAINS,
SOUTHERN IRAN
by
KATAYOUN MOBASHER
A Dissertation submitted in Partial Fulfillment of Requirements for the Degree of
Doctor of Philosophy
in the College of Arts and Science
Georgia State University
2007

Copyright by
Katayoun Mobasher
2007
KINEMATIC AND TECTONIC SIGNIFICANCE OF THE FOLD- AND FAULT-RELATED FRACTURE SYSTEMS IN THE ZAGROS MOUNTAINS,
SOUTHERN IRAN
by
KATAYOUN MOBASHER
Major Professor: Hassan A. Babaie Committee : Timothy E. La Tour (Chair of Department) Pamela C. Burnley Zhi –Young (John) Yin Electronic Version Approved Office of Graduate studies College of Arts and Science Georgia State University May 2007

iv
ACKNOWLEDGMENTS
I would like to express my appreciation to all those whose cooperation and support
allowed the completion of this study. I wish to offer my sincerest gratitude to my advisor
Dr. Hassan Babaie who has supported me with his help and knowledge during different
stages of this undertaking. I attribute the level of my Ph.D degree to his endless effort
and encouragements. Special thanks are likewise expressed to Dr. Timothy La Tour
whose help, exceptional inspiring advice and encouragement contributed significantly to
this end and I am grateful for his effort in many directions on my behalf throughout my
career as a student. I wish to acknowledge, most gratefully, to Dr. Pamela Burnley for
her valuable advice and constructive comments on this dissertation. I am also indebted to
Dr. John Yin, now at University of San Diego, for his precious time in reading this
dissertation and his critical comments about it.
My thanks go to Dr. Crawford Elliott, my graduate advisor, for his tireless effort
during my study and to Mr. Ken Terrell for always being there and offering his valuable
advice and help. Ms. Tyra Hines, thank you for the kind assistance of the administration.
I acknowledge a dissertation grant from Georgia State University and research grant from The Geological Society of America (#7748-04) which supported my research. I would like to thank Dr. Shuhab Khan for providing me with satellite image data and his
help. My parents deserve a very special mention for their support. My father, Dr. Iraj
Mobasher, who instilled the fundamentals of learning in my character and was the first
person who showed me the joy of intellectual pursuit for as long as I can remember and

v
my mother, Jaleh Ardebili, for her caring and unconditional love. Ladan Mobasher and
Dr. Kambiz Mobasher for being my supporting and caring siblings. Farid Azadi, my
brother-in-law, who always supported me and reminded me to have a sense of humor
throughout my study. My dear friend, Farideh Shojaei, for offering her wise advice and
help. And last but certainly not least, words fail me to express my appreciation to my
husband, Dax Flinn, whom without his dedication, help, love and support the completion
of my study would not be possible.
vi
Table of Contents Acknowledgment iv List of Tables ix List of Figures xi List of Abbreviations xvii Chapter 1- Introduction 1.1. Introduction and Objectives 1 1.1.1. The Study Area 5 1.2. Geological and Tectonic Setting 6 1.2.1. Morphotectonic divisions of the Zagros 10 1.2.1.1. The High Zagros Thrust Belt or the Zagros Imbricate Zone 11 1.2.1.2. The Simply Folded Belt (SFB) 11 1.2.1.3. The Zagros Foredeep and the Dezful Embayment 17 1.2.1.4. The Zagros Coastal Plain 18 1.2.1.5. The Persian Gulf - Mesopotamian Lowlands 18 1.2.2. Salt Diapirism in the Zagros 18 1.2.3. Seismotectonic in the Zagros 21 1.2.3.1. The Major Zagros Reverse Fault (MZRF) 24 1.2.3.2. The Main Recent Fault (MRF) 24 1.2.3.3. The High Zagros Fault (HZF) 25 1.2.3.4. The Mountain Front Fault (MFF) 25 1.2.3.5. The Dezful Embayment Fault (DEF) 26 1.2.3.6. The Zagros Foredeep Fault (ZFF) 26 Chapter 2- Methodology 2. Methodology 27
2.1. Image Processing 28 2.1.1. Image Rectifications and Geo-referencing 28 2.1.1.1. LANDSAT 7 Enhanced Thematic Mapper plus (ETM+) 29 2.1.1.2. Advanced Spaceborne Thermal Emission and Reflection Radiometer (ASTER ) 30 2.1.1.3. RADARSAT 1- SAR 35 2.1.2. Visualization of Multi-band Images 40 2.1.3. Image Enhancement 43 2.1.3.1. Contrast Enhancement or Radiometric Enhancement 44 2.1.3.1.1. Contrast Stretching 44
vii
2.1.3.1.2. Histogram-Equalized Stretching 45 2.1.3.2. Spatial Enhancement 46 2.1.3.2.1. Image Inversion 46 2.1.3.2.2. Edge Enhancement and High-Pass Filters 46 2.1.3.2.3. Texture Analysis 47 2.1.3.2.4. Speckle Reduction for Radar Image 47 2.1.3.3. Multi-band Operations or Spectral Enhancement 49 2.1.3.3.1. Principal Component Analysis 49 2.1.3.3.2. Image Fusion 50 2.1.3.3.3. Band Ratios 50 2.1.3.4. Image Classification 53 2.1.3.4.1. Unsupervised Classification 54 2.2. Fracture Sampling and Data Processing 54
2.2.1. Fold-related Fractures 55 2.2.2. Fault-related Fractures 58
2.2.3. Fractures in Fold Structures Deformed in the Fault Zone 59 2.3. Domain Boundaries 60
Chapter 3- Structural Analysis 3. Structural Analysis 64 3.1. Results: Fold-related Fractures 64 3.1.1. Geometrical relationship between the anticlines and their fractures 67
3.2. Fault-related Fractures 75 3.2.1. The Kazerun Fault and the Strike Slip Faulting 75 3.2.2. Fractures in Strike-Slip Faults and Background 76
3.2.2.1. Strike Slip Faults and their Associated Structures 76 3.2.2.2. Strike Slip Faulting and Block Rotation 79 3.2.2.3. Deformation System in Strike-Slip Faults 80 3.2.2.3.1. Pure Shear Deformation System 80 3.2.2.3.2. Simple Shear Deformation System 81
3.2.3. Results: Fault-related Fractures 85 3.3. Results: Deformed Folds in the Kazerun Fault Zone 93 3.4. Results: Remote Sensing Techniques 99
Chapter 4- Discussion 4.1. Structural Analyses 104 4.2. Thin-skinned vs. Thick-skinned Tectonics 112 Chapter 5- Conclusion
5. Conclusion 115

viii
References 118
ix
List of Tables Table 1.1- Generalized stratgraphical divisions of the Zagros simply folded belt (Hessami et al., 2001). 7 Table 1.2- The Cenozoic sedimentation in the northern rim on the Persian Gulf (Farhoudi et al., 1989). 15 Table 1.3- Structural, lithological, and stratgraphical divisions of the Zagros simply folded belt, modified from O’Brine, 1950 (Colman-Sadd, 1978). 17 Table 2.1- Landsat 7 +bands with bandwidth and resolution. 29 Table 2.2- Major characteristics of ASTER data. 32 Table 2.3– RADARSAT beam modes and resolutions. 38 Table 2.4- The characteristics of the structural domains along the Zagros fold-and-thrust belt. 61 Table 3.1- Range and mean orientation of the fold-related sets of fracture in each structural domain (Roman numerals). ‘n’ is the total number of fractures in each domain. α1 is the mean angle between SO1 and SX, and α2 is the mean angle between SO1 and SX. 74 Table 3.2- The range of the orientation of the Riedel shears, P-shear, Y-shear, and extensional T fractures in different segments of the Kazerun fault zone. The table also shows the mean of the angles ρ, λ, η, and φ in each segment of the Kazerun fault zone. 91 Table 3.3- The range and mean orientation of the fractures in the unrotated (southern) and rotated (northern) parts of the Sarbalesh anticline (Kamarij segment of the Kazerun fault zone). ‘n’ is the total number of fractures measured in the unrotated and rotated part of each fold. 97 Table 3.4- The range and mean orientation of the fractures in the unrotated (southern) and rotated (northern) parts of the Gisakan anticline (Burazjan segment of the Kazerun fault zone). ‘n’ is the total number of fractures measured
x
in each part of the fold. 97 Table 3.5- The range and mean orientation of the fractures in the unrotated (southern) and rotated (northern) parts of the Khormuj anticline (Burazjan segment of the Kazerun fault zone). ‘n’ is the total number of measured fractures in each part of the fold. 98 Table 3.6- The range and mean orientation of the fractures in the unrotated (southern) and rotated (northern) parts of the Seyah anticline (Burazjan segment of the Kazerun fault zone). ‘n’ is the total number of measured fractures in each part of the fold. 98 Table 3.7- The range and mean orientation of the fractures in the unrotated (southern) and rotated (northern) parts of the Chah Pir anticline (Burazjan segment of the Kazerun fault zone). ‘n’ is the total number of measured fractures in each part of the fold. 99 Table 3.8- The statistical summary of total number of lineaments accentuated from the satellite images. 100
xi
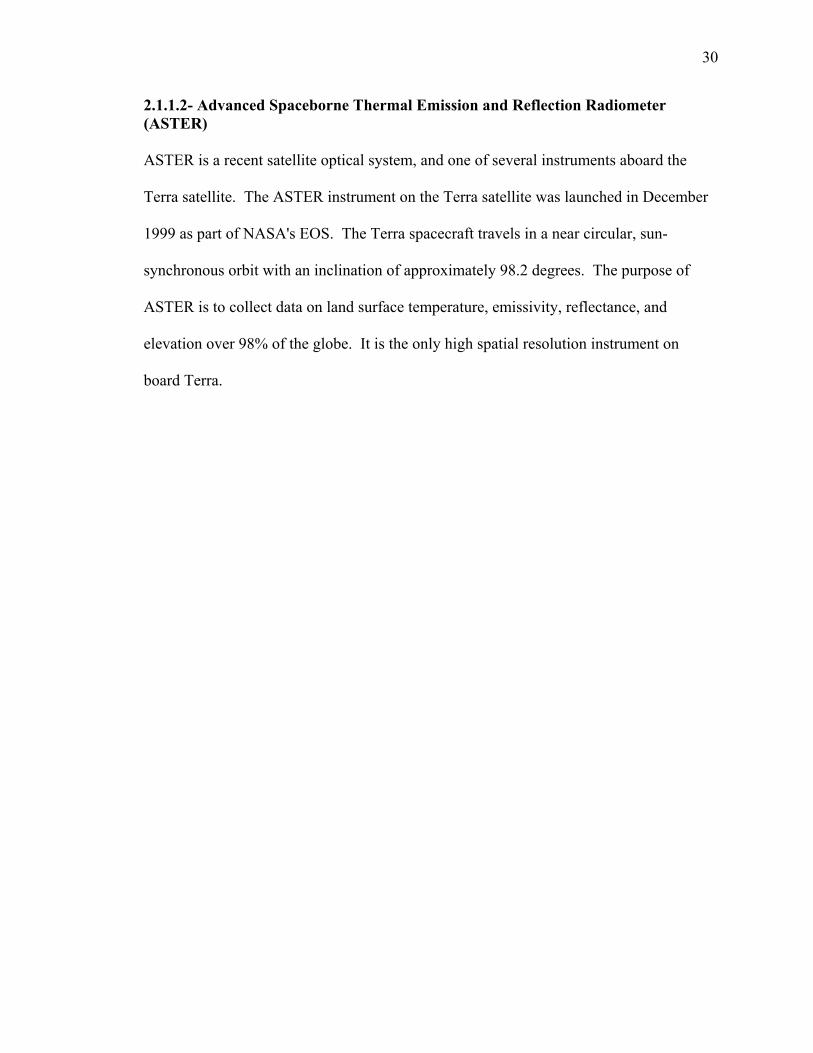
List of Figures Figure 1.1- Map showing structures in the Zagros fold-and-thrust belt, southwest Iran. Inset map shows location of the study area in the Middle East. Legend: A, Main Zagros thrust fault; B, Boundary of Imbricate Zone and Simply Folded zone; C, Kazerun Fault; D, Oman Line; E, Zagros Deformation Front; F, Axial trace of anticlines; G, Salt Domes. 4 Figure 1.2- Structural setting of the Zagros fold-thrust belt (modified from Berberian, 1995). 10 Figure 1.3- The major morphotectonic features of the Zagros. (See the text for explanations). The major right-lateral strike-slip faults are: B=Borzajan fault; K= Kazerun fault; KB=Kareh Bas fault; S=Sarvestan fault; SP=Sabz Pushan fault zone; BR=Bala Roud left-lateral shear zone (Berberian, 1995). 14 Figure 1.4- The uneven distribution of the Hormuz salt diapirs in the Zagros Simply Folded Belt. The Bandar Abbas-Sarvestan area in the southeast is separated by a transitional area, which is void of salt domes, from the Kazerun area in the northwest; Legend: A, Salt Domes; B, Main Zagros thrust fault; C, Boundary of Imbricate Zone and Simply Folded zone; D, Kazerun Fault; E, Oman Line; F, Zagros Deformation Front. 21 Figure 1.5- The distribution of the earthquake hypocenters (magnitudes > 3.5 Mb) in the study area; Legend: A) The depth of the earthquakes foci; B) Main Zagros thrust fault; C) Boundary of the Zagros Imbricate Zone and Zagros Simply Folded Belt; D) Zagros Deformation Front. 23 Figure 2.1- Grey scale ETM+ satellite image mosaic of the Kazerun fault zone, showing the location of anticlinal axes, the Kazerun fault segments (Yasuj, Kamarij, and Burazjan), and digitized traces of fractures. Inset map shows the location of the area. 31 Figure 2.2- 4, 6, 8-band combination of SWIR image showing a part of the Kazerun fault zone, and Khormuj,
xii
Gisakan, Ateshgah, Chah Pir, Kaki, and Seyah anticlines. 34 Figure 2.3- A hillshade map derived from the SRTM dataset. 35 Figure 2.4- Electromagnetic spectrum showing the microwave section (1mm to 1 meter). 36 Figure 2.5- Surface roughness and their related reflections. 37
Figure 2.6 - The beam selection modes, characterized by a specific beam elevation angle. 38 Figure 2.7 - RADARSAT -1 image showing the Sisakht, Yasuj, and Kamarij segments of the Kazerun fault zone. The area comprises Oligo-Miocene Asmari Formation to the east of the Kamarij and Yasuj segments of the fault. The Asmari Formation is juxtaposed against Middle Miocene Gachsaran Formation to the west of the fault zone. 40 Figure 2.8- A true color simulation of an ASTER pseudo-colored composition (RGB: 3, 2, 1) showing the Yasuj and Kamarij segments of the Kazerun fault zone. 43 Figure 2.9 - Principle of contrast enhancement (Lillesand and Kiefer, 2000). 46
Figure 2.10- Examples of the contrast and spatial enhancement techniques applied to the selected bands 4 (red), 3 (green), and 2 (blue) of the ETM+ sub-scenes in the Zagros Mts. In the Kaki anticline: (A) Equalized Histogram; (B) Edge Enhancement; (C) Texture analysis (see text for explanations). 48 Figure 2.11- - (A) Image inversion applied to the band 1, 5, 4 assigned for the color guns, red, green, and blue on the ETM+ sub-scene of the Kuh-e Buzpar and Kuh-e Neyzar, Zagros Mts. 48 Figure 2.12- Enhancement methods applied to the ASTER sub-scenes in the Zagros Mountains: principal component analysis of SWIR on the left side, and principal component analysis of VNIR on the right side. 49 Figure 2.13 – (a) Image fusion enhancement method applied to ASTER and RADARSAT-1 fused data. (b) Fracture map
xiii
produced using the image fusion enhancement technique. 51 Figure 2.14- Band-ratio (5/6, 4/8, 5/9) assigned to color guns (red, green, blue) applied to the ASTER sub-scene in the Zagros Mountains. 53 Figure 2.15 - Subscenes of the study area showing a) textural changes of rocks delineating a fault, b) shear displacement in the sedimentary layers of an anticline, c) straight arrangements of water bodies, d) linear, left-lateral displacement of river trace along a fault. 56 Figure 2.16- A) Schematic illustration of four fracture sets associated with a fold (Modified after Stearns, D.W., and Friedman, M., 1972). The maximum principal shortening axis (Z) is assumed to be parallel the maximum principal compressive stress (σ1). B) Schematic illustration of fault-related sets of fracture for the right lateral Kazerun fault zone. 57 Figure 2.17- The structural domain boundaries. Legend: A, Boundary of Imbricate Zone and Simply Folded zone; B, Zagros Deformation Front. 62 Figure 2.18- Structural domains and seismcity. Seismic data from: http://www.seismology.harvard.edu/CMTsearch.html; (Ni and Barzangi, 1986; Baker et al., 1993). Legend: A) Boundary of Zagros Imbricate Zone and Zagros Simply Folded Belt; B) Zagros Deformation Front; C) The earthquakes foci with magnitude greater than 3.5 Mb, and foci deeper than 14 km. 63 Figure 3.1- Map of the study area showing the boundaries of the structural domains, and the distribution of measured fractures in each domain. The trans-fold fractures are solid line in the domains (highlighted in blue). Red polygons show the distribution of the Hormuz salt. 66 Figure 3.2- Schematic illustration of four fracture sets (axial [SA], cross-axial [Sx], and the two oblique sets [SO1 and SO2]) associated with the folds. The mean minimum principal stretch axis (Z) (i.e., shortening direction), calculated from these sets of fracture, is assumed to parallel the maximum principal compressive stress (σ1). The mean trend of the four fold-related fracture sets are also given. The angle α is measured between the cross-axial and the two oblique sets. 69 Figure 3.3- ETM+ satellite image of part of the Kazerun fault zone, showing the spatial location of anticlines and fold-related fractures of (a) Sarbalesh and Davan anticlines around the Kamarij segment of the
xiv
fault zone, and (b) Gisakan, Seyah, Chah Pir, and Beyrani anticlines around the Burazjan segment of the Kazerun fault zone. Inset maps show the map area. 70 Figure 3.4- A) Normal color composite image of enhanced ETM sub-scene showing the Kuh-e- Buzpar and Kuh-e-Neyzar anticlines. Band 3, 2, 1 assigned for the color guns, red, green, and blue. Poly-lines are anticlinal axial trace and fracture sets (see legend). The NE-SW trending cross-axial fractures (SX) bisect the angle between the mean oblique shear fracture sets (SO1 & SO2). The NE-SW horizontal shortening (Z) is perpendicular to the main NW-SE trend of the Zagros fold-and-thrust belt. Inset map shows the location of the area. B) Grey scale image of enhanced ETM sub-scene showing the Khormuj anticline and its four sets of fold-related fractures. Inset rose diagram shows the orientations of four sets of fracture in the Khormuj anticline. Inset diagram is the rose diagram that shows the relative length and trend of these fractures. 72 Figure 3.5- Rose diagrams showing the mean orientations of the fold-related sets of fracture in different structural domains. 73 Figure 3.6- The geometrical relationship of the first order strike-slip fault with the secondary structures developed in the basement (a) and cover rocks (b), (Price and Cosgrove, 1990). 77 Figure 3.7- Schematic diagram showing the evolution history of structures associated with the basement strike-slip fault. C and E arrows represent the major compression and extension direction, respectively (Harding and Lowell, 1979). 78 Figure 3.8- Two-dimensional model demonstrating the simultaneous mechanisms of strike-slip faults movement and block rotation (Nur, et al, 1989). A) Pre-rotation geometry of the strike-slip faults and the blocks; B) with the start of the deformation, the right-lateral faults rotate in a counterclockwise sense, and the left-lateral faults rotate in a clockwise sense. 79 Figure 3.9- Two-dimensional model showing rotations more than 45o in the old strike-slip faults (Nur, et al, 1989). 80 Figure 3.10- (a) Riedel’s experimental model showing the deformation in the cover rocks due to the movement of the basement strike-slip fault; (b) The type of fractures (extension or shear) developed in the shear zone; (c) Interpretation of the shear system that formed fractures in figure b;
xv
(d) Tchalenko’s (1968) terminology for shear discontinuities formed due to the uniform shear in direction D, in a clay layer: Riedel Shears (R and R’), Tchalenko’s ‘thrust shears’ (P), and structures formed due to the concentration of stress at the edge of the shear box (Price and Cosgrove, 1990). 82 Figure 3.11- Orientation of fold and faults in a right-lateral simple shear system (Sylveter, 1988). 85 Figure 3.12- Structural map showing (a) the three segments of the Kazerun fault zone in the study area (modified after Sepehr and Cosgrove, 2005), and their related domains (II: Yasuj Domain; III: Kamarij Domain; IV: Burajzjan Domain), showing rotation of the folds, and (b) fault-related fractures and rotated folds along the fault segments in different domains. 87 Figure 3.13- Grey-scale image of enhanced ETM+ sub-scene showing the Khormuj anticline and its four sets of fault-related fractures. Inset rose diagram shows the orientations of the sets of fractures related to the Burazjan segment of the Kazerun fault. 89 Figure 3.14- The angular relationships measured from the right-lateral Kazerun fault zone to the synthetic Riedel R-shear fractures (λ), antithetic Riedel R’-shear fractures (η), and synthetic P-shear fractures (φ). The ρ angle is the acute angle between the two Riedel shear fractures. The range of the angles are also given for each set. 92 Figure 3.15- Structural map of part of the study area showing the mean azimuths of the estimated shortening direction for the Yasuj, Kamarij, and Burazjan fault segments. The mean shortening directions are perpendicular to the general NW-SE trend of the Zagros fold-and-thrust belt. 93 Figure 3.16- Schematic diagram of a fold rotated in the Kazerun fault zone. The four fold-related fracture sets: axial (SA), cross-axial (Sx), and the two oblique sets (SO1 and SO2) are shown both in rotated part (i.e., northern side of the fold) and unrotated part of the fold. The angle β is the angle of rotation of the fold axial trace (relative to the undeformed southern part of the fold). The angle α is measured between the cross-axial fracture set and each of the two oblique fracture sets. The angle γ is the acute angle between the trend of the unrotated and rotated Sx fracture sets in the fold. 96 Figure 4.1- Basement faults map (Yassaghi, 2006) align with some of the defined domain boundaries. Legend: A) Boundary of Zagros Imbricate Zone and Zagros Simply Folded Belt; B) Zagros Deformation Front; C) The earthquakes
xvi
foci with magnitude greater than 3.5 Mb, and foci deeper than 14 km. 109 Figure 4.2- The mean orientations of the shortening direction (arrows), calculated from the orientation of the mean fold-related fracture sets, in different structural domains (Roman numerals). The mean orientation of the shortening direction is assumed to be parallel that of the maximum principal compressive stress, in a homogeneous pure shear deformation regime. 110
xvii
List of abbreviations o = Degree km = Kilometer m = Meter Fm. = Formation Mb = Magnitude ZSFB = Zagros Simply Folded Belt MZRF = Major Zagros Reverse Fault MRF = Main Recent Fault HZF = High Zagros Fault MFF = Mountain Frontal Fault DEF = Dezful Embayment Fault ZFF = Zagros Foredeep Fault ASTER = Advanced Spaceborne Thermal Emission and Reflection Radiometer ETM+ = Enhanced Thematic Mapper plus µm = Micron DEM = Digital Elevation Model VNIR = Visible Near Infra Red SWIR = Short Wavelength Infra Red TIR = Thermal Infra Red RADAR = RAdio Detection And Ranging SAR = Synthetic Aperture Radar DN = Digital Value PCA = Principal component analysis R-G-B = Red- Green-Blue SA = Axial set of shear fractures SX = Cross-axial set of shear fractures SO1, SO2 = Oblique sets of shear fractures R = Synthetic sets of Riedel shear fracture R’ = Antithetic sets of Riedel shear fracture P = Oblique shear fracture set Y = Displacement shear fracture set T = Extensional fractures > = Greater than < = Less than % = Percentage σ1 = Maximum principal compressive stress σ3 = Minimum principal compressive stress Z = Mean azimuth of the shortening direction β = Angle of rotation of the fold axial trace. α = Angle between the cross-axial fracture and the two oblique sets.
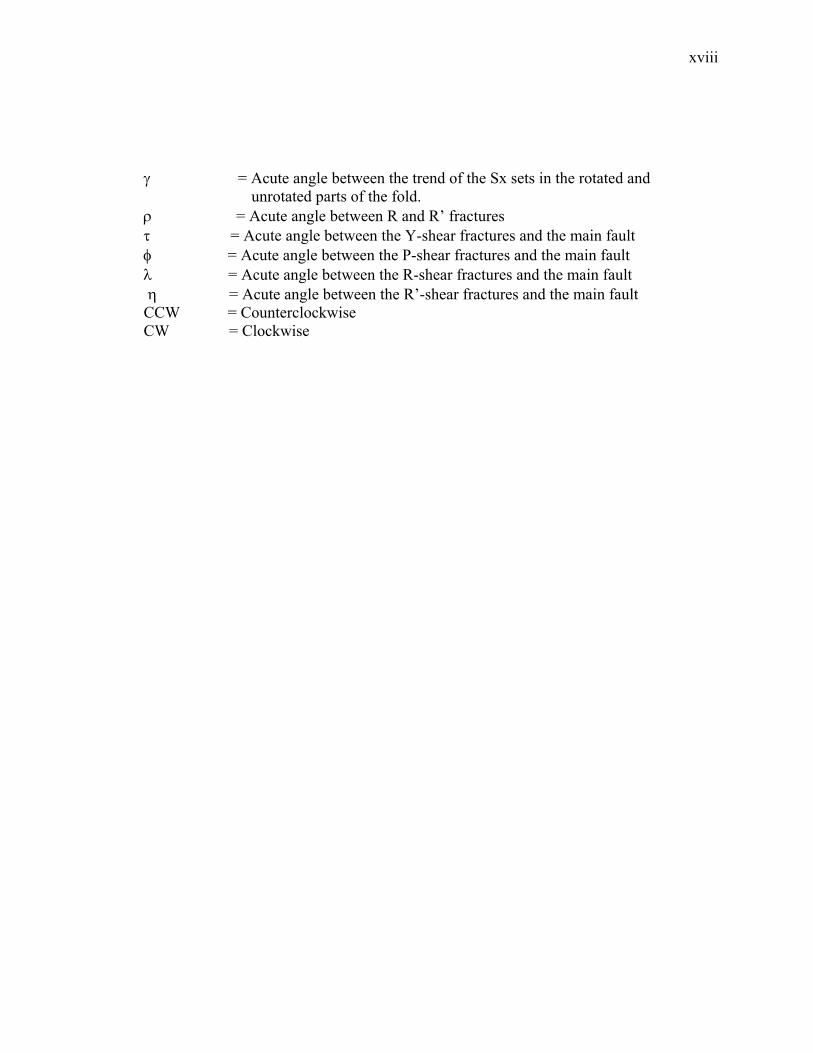
xviii
γ = Acute angle between the trend of the Sx sets in the rotated and unrotated parts of the fold. ρ = Acute angle between R and R’ fractures τ = Acute angle between the Y-shear fractures and the main fault φ = Acute angle between the P-shear fractures and the main fault λ = Acute angle between the R-shear fractures and the main fault η = Acute angle between the R’-shear fractures and the main fault CCW = Counterclockwise
CW = Clockwise
1
1.1- INTRODUCTION AND OBJECTIVES The Zagros fold-and-thrust belt (ZFTB), in southwest Iran, exposes extensive areas of
deformed Cambrian to Holocene (e.g., Sepehr and Cosgrove, 2005) sedimentary rocks
with minimum vegetation cover. This Phanerozoic sequence is folded and faulted above
the crystalline Precambrian basement, forming large (on the order of 104 m), doubly-
plunging asymmetric folds that host vast volumes of hydrocarbons in anticlinal traps.
The high hydrocarbon productivity of these fold traps is related to the presence of two
systems of fracture that have produced porosity in the carbonate reservoirs (Beydoun,
1991). Several sets of fold-related fractures, that constitute the first system, have a well-
defined relationship to the fold structural elements (axial trace, limb), and occur within
the boundaries of the fold structures. The spatial variation of these sets of fractures is a
function of the spatial variation of the fold elements and location within the fold-and-
thrust belt (Beydoun, 1991). The second fracture system includes several sets of
basement faults, and their related, subsidiary fractures, that cut through the folded
Phanerozoic sedimentary sequence. While the spatial density and variation of the fold-
related fractures correlate with that of folds, the fault-related fracture system is localized
along isolated linear zones possibly marking the boundaries of blocks of basement rock.
The fault-related fracture sets, which apparently have been active since the Precambrian,
cut across the fold-related fracture system that has been developing since Tertiary (e.g.,
Tartar et al., 2004; Allen et al., 2004, Vernant et al., 2004).
The ongoing processes involved in the collision between the Iranian subplate (part
of Eurasia) and Arabian subplate (e.g., Berberian, 1995; Allen et al., 2004; Tartar et al.,
2004; Vernant et al.), that started during the Miocene-Pliocene Epoch (Berberian, 1995),
2
account for folding and faulting of the Zagros Mountains. Because the exposed region of
the Zagros fold-and-thrust belt occupies a large area (200-300 km wide and 1800 km
long; Sepehr and Cosgrove, 2005), traditional methods of field mapping and localized
analysis of rock fracture systems may not capture the spatial variation in the orientation
and density of these structures. At these scales, the relationship of large geological
structures (e.g., fractures with trace length on the order of 103-105 m) can more
effectively be identified and studied through remote sensing in a Geographic information
system (GIS) environment. Mapping and analyzing these structures can reveal
significant gradients in the areal and linear density of the discontinuities, and orientation
of the calculated directions of shortening over large regions.
Although numerous investigations have studied Zagros using remote sensing
(Barzegar, 1994; Iranpanah, 1989; Bushara, 1995; Rangzan, 1995; Hessami et al., 2001;
Talebian et al., 2002; Blance et al., 2003; Ali et al., 2003; Ali and Pirasteh, 2004; Sepehr
and Cosgrove, 2005; and Yassaghi, 2006), detailed studies of the fracture patterns of the
Zagros area using satellite data at the scale conducted in this thesis are scarce. Moreover,
the kinematic relationship between the high-angle strike-slip faults such as Kazerun fault,
and smaller-scale faults and fractures that occur in narrow zones around these faults, and
those that occur within anticlinal structures, are not well known.
This study applies Geographic Information system (GIS) and remote sensing
using satellite images such as RADARSAT-1, Shuttle Radar Topography Mission
(SRTM), Advanced Spaceborne Thermal Emission and Reflection Radiometer (ASTER),
LANDSAT 7 Enhanced Thematic Mapper Plus (ETM+), ASTER derived Digital
elevation models (DEM), topographic maps, century earthquake data, and geological
3
maps to help establish the kinematic and genetic relationships between fold- and fault-
related fractures and large fold and fault structures, and analyze the tectonic history of the
area. This dissertation was conducted a discussion of the processing of these images with
the latest enhancement techniques to optimize the visualization of the lineaments, folds
and fractures. These remote sensing analyses included texture analysis, high-pass
filtering, histogram equalization, principal component analysis, inversion, supervised
image classification and edge enhancement. The study shows that GIS facilitates the
sampling, processing, and analysis of the fracture data, and is a very helpful tool in
distinguishing between different sets of fold- and fault-related fractures.
The significance of the study is to (i) define the kinematic characteristics of
fractures in the Zagros folds and faults; (ii) show the effect of basement tectonics on
deformation of the Phanerozoic sequences; and (iii) identify the implications for the
Zagros orogeny.
The main objectives of this study are: (i) Delineate, map, and collect information
about the fractures and faults based on interpretations of various satellite images. (ii)
Identify and distinguish between fold- and fault-related fractures. (iii) Determine the
spatial distribution and gradient of the fold- and fault-related fracture sets. (iv)
Determine the kinematic significance of each fracture system in several spatially
distributed structural domains. (v) Define any correlation between the fracture patterns
and the major structural elements of the area, such as Kazerun fault, in terms of
distribution, orientation, density, and size of fractures. (vi) Compare the orientation of
shortening inferred from each fracture system, and apply the knowledge of the spatial
variation in the orientation of the kinematic axes to the understanding of Zagros orogenic
4
movements. (vii) Test the competing thin- vs. thick-skinned tectonics hypotheses
proposed for the Zagros orogeny.
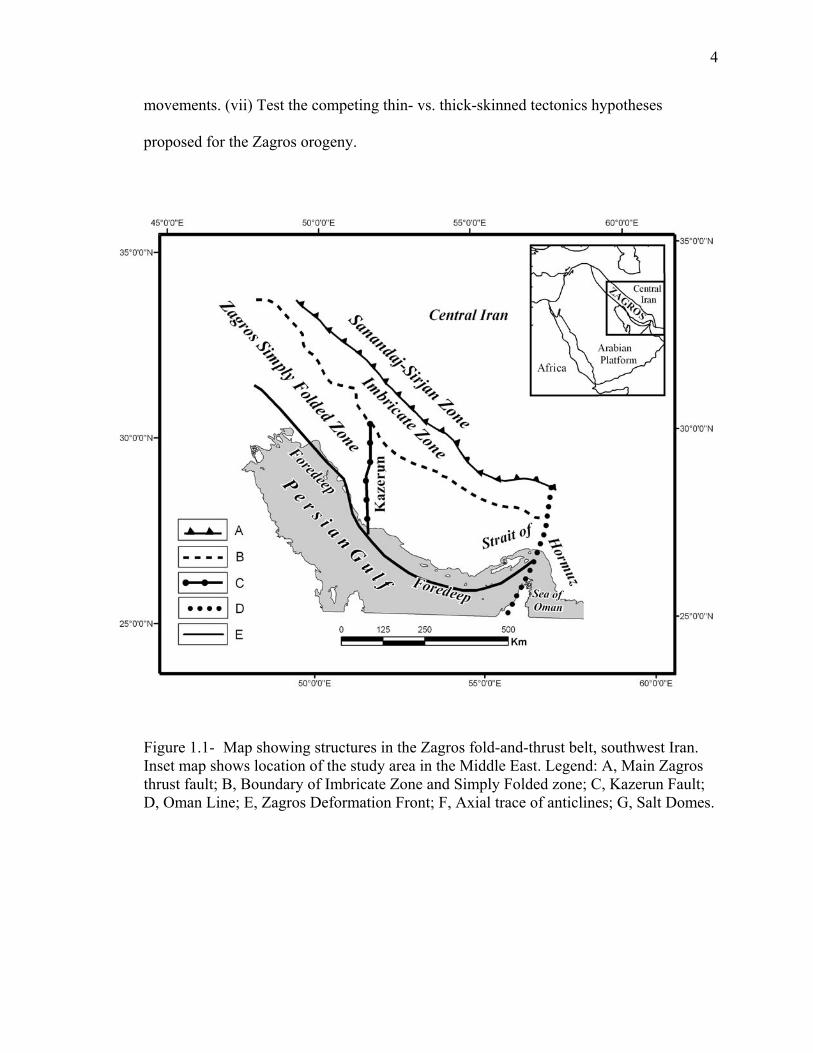
Figure 1.1- Map showing structures in the Zagros fold-and-thrust belt, southwest Iran. Inset map shows location of the study area in the Middle East. Legend: A, Main Zagros thrust fault; B, Boundary of Imbricate Zone and Simply Folded zone; C, Kazerun Fault; D, Oman Line; E, Zagros Deformation Front; F, Axial trace of anticlines; G, Salt Domes.
5
1.1.1- The Study Area
The study area is delineated by the Oman Line and the Kazerun right-lateral strike-slip
fault zone, between 26o 30’ N and 31o 30’ N latitudes, and 50o 30’ E and 57o 00’ E
longitudes, mostly in the eastern half of the Zagros fold-and-thrust belt (Figure1-1). The
Kazerun fault zone with its subsidiary faults is about 300-450 km long (Motiei, 1995;
Talbot et al., 1996; Sepehr and Cosgrove, 2005).
Three RADARSAT, sixteen ETM+, and seven ASTER scenes cover the study
area. Forty one DEMs covering the area were generated from the ASTER data. The
processed images and extracted lineaments were used in a GIS environment to analyze
the relationship between fold- and fault- related fractures and the kinematic significance
of the geological structures.
6
1.2- GEOLOGICAL AND TECTONIC SETTING The Zagros fold-and-thrust belt in southwest Iran extends from the northern area of the
Strait of Hormuz in the Persian Gulf through northeast Iraq (Figure 1-1). The belt hosts
more than half of the world’s known hydrocarbon reserves (Sepehr and Cosgrove, 2005).
Contractional tectonic has led to folding, thrusting, and large-scale strike-slip faulting of
the Phanerozoic sedimentary cover sequence, and significant crustal shortening in the
Zagros Mountains. The Phanerozoic sequence, partly exposed in the belt, was deposited
in the Tethys oceanic basin (James and Wynd, 1965; Stocklin, 1968; Kamen-Kaye, 1970;
Setudehnia, 1978; Berberian and King, 1981; Lensch et al., 1984; Dercourt et al., 1986;
Kazmin et al, 1986a, b; Ala, 1990) above a basement of Precambrian rocks (Table 1-1).
The basement is believed to have gone through an extensional tectonic event during the
Precambrian before the deposition of the Cambrian sediments (e.g., Stocklin, 1968;
Berberian and King, 1981). Little is known about the crystalline basement of Zagros due
to the lack of exposure of the basement except for rare exotic blocks carried to the surface
with salt diapirs (Haynes and McQuillan, 1974; Kent, 1979). The Phanerozoic
sedimentary cover is decoupled from the Precambrian basement by a dècollement
horizon on top of the late Proterozoic-Cambrian Hormuz salt (Table1-1; e.g. Colman-
Sadd, 1978; Alavi, 1994).
7
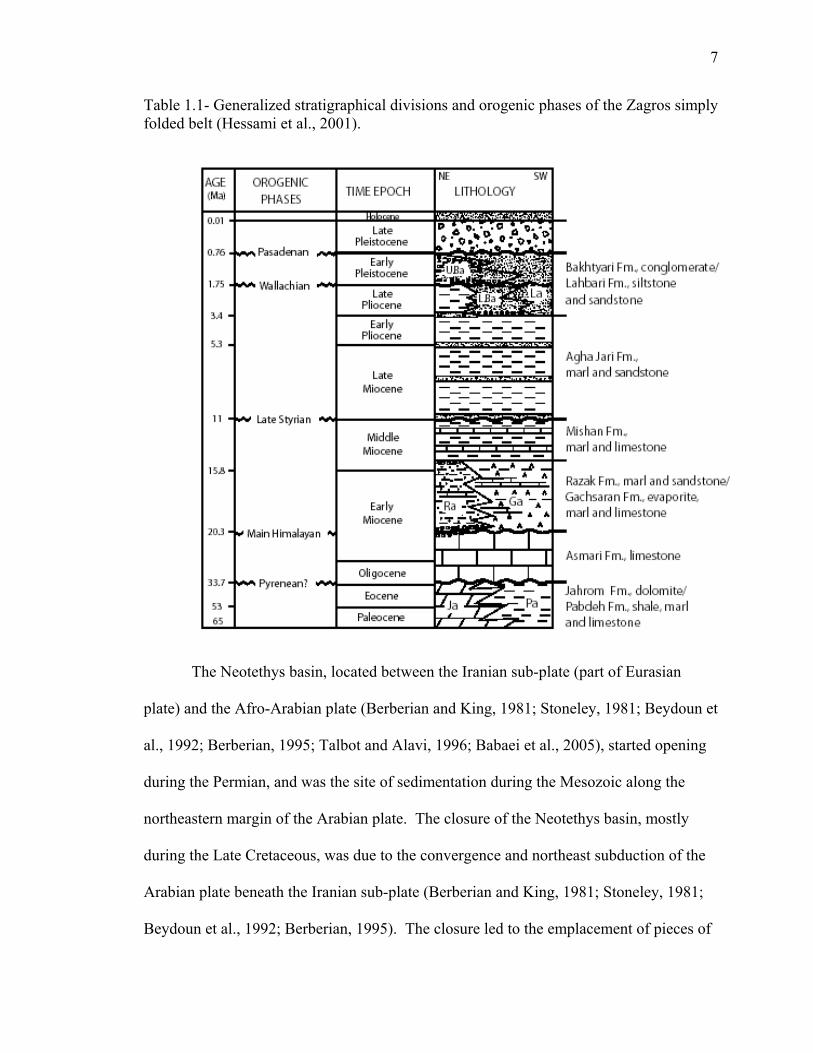
Table 1.1- Generalized stratigraphical divisions and orogenic phases of the Zagros simply folded belt (Hessami et al., 2001).
The Neotethys basin, located between the Iranian sub-plate (part of Eurasian
plate) and the Afro-Arabian plate (Berberian and King, 1981; Stoneley, 1981; Beydoun et
al., 1992; Berberian, 1995; Talbot and Alavi, 1996; Babaei et al., 2005), started opening
during the Permian, and was the site of sedimentation during the Mesozoic along the
northeastern margin of the Arabian plate. The closure of the Neotethys basin, mostly
during the Late Cretaceous, was due to the convergence and northeast subduction of the
Arabian plate beneath the Iranian sub-plate (Berberian and King, 1981; Stoneley, 1981;
Beydoun et al., 1992; Berberian, 1995). The closure led to the emplacement of pieces of
8
the Neotethyan oceanic lithosphere (i.e., ophiolites) onto the northeastern margin of the
Afro-Arabian plate (e.g., Babaie et al., 2001; Babaei et al., 2005; Babaie et al., 2006).
Continent-continent collision starting in Tertiary has led to the formation of the Zagros
fold-and-thrust belt (ZFTB), continued shortening of the mountain range, and creation of
the Zagros foreland basin. The SW-NE oriented contraction, that started in Miocene, led
to the development of NW-SE trending, SW-verging folds and NE-dipping thrusts in the
Phanerozoic sedimentary cover strata of the Afro-Arabian basement. This basement is
above a detachment zone of Infracambrian-Cambrian Hormuz evaporite (Kadinsky-Cade
and Barzangi, 1982; Alavi, 1994).
The shortening direction in the study area (southeastern Zagros) is N7oE
(Molinaro et al., 2005) within the sedimentary cover and it is reported to be around 45 to
85 km (e.g. Blanc et al., 2003; McQuarrie, 2004; and Molinaro et al., 2005) and 10km
(Molinaro et al., 2005) to 28km (Talebian and Jackson, 2004) within the basement.
Based on Global Positioning System (GPS) measurements, Hessami et al. (2002, 2006)
has demonstrated that the present-day shortening rate is not homogeneous along or across
the Zagros belt, and is faster across the SE Zagros. A shortening rate of 14-19 ±3 mm a–1
has been measured for the NW Zagros, east of the Kazerun fault zone (Hessami et al.,
2006; Vernant et al. 2004). Hessami et al., 2006, measured a shortening rate of 13-22 ±3
mm a–1 for the SE Zagros.
The NW-SE trending Zagros fold-and thrust belt (ZFTB) is divided into three,
NW-SE oriented, parallel structural and stratigraphic regions, which in southwest to
northeast order are: the Zagros Foredeep, the Zagros Simply-Folded Belt (ZSFB), and the
Zagros Imbricate Zone (Figure 1-1; Stocklin, 1968; Falcon, 1974; Berberian, 1995). The
9
ZFTB is also subdivided along strike into three lateral segments which comprise the
Lurestan Arc, the Dezful Embayment and the Fars Arc (Figure 1-2).
The study area (Figure 1-1) is part of the Zagros-Simply Folded Belt (Alavi,
2004) and Fars Arc, showing large volumes of Phanerozoic sedimentary rocks in doubly-
plunging folds. From bottom to top, the 250 km wide Zagros-simply folded belt consists
of a metamorphosed Precambrian basement and 14 km of Phanerozoic sedimentary rocks
(4 to 7 km of Paleozoic and Mesozoic faulted and folded rocks, Sepehr and Cosgrove,
2005; and 3 to 5 km of Cenozoic sedimentary rocks, Alavi, 2004).
The contractional Zagros orogeny formed a variety of asymmetric, NW-SE
trending, double- and multiple-hinged, en-echelon folds, and NE-dipping thrusts on the
southwestern limbs of the folds (Figure 1-1). Fold axial planes generally dip to N-NE, so
that the southern limbs of the folds are steeper, and in some cases they are overturned or
vertical. The length and width of these folds along the Zagros are in the order of tens of
kilometers. Their wavelengths range from a few hundred meters to more than ten
kilometer (Sepehr et al., 2006).
Surface lineaments reflecting basement faults such as the N-S trending Izeh,
Kazerun, and Mengarak fault zone (Falcon, 1969; Kadinsky-Cade and Barzangi, 1982;
Baker et al., 1993; Talbot et al., 1996) transect and deflect, with dextral separation,
several of the NW-SE trending folds in the Phanerozoic stratigraphic succession of the
Zagros Range in Iran and Iraq (McQuillan, 1973; Furst, 1990, Ameen, 1992; Bushara,
1995; Berberian, 1995; Talbot and Alavi, 1996).
10
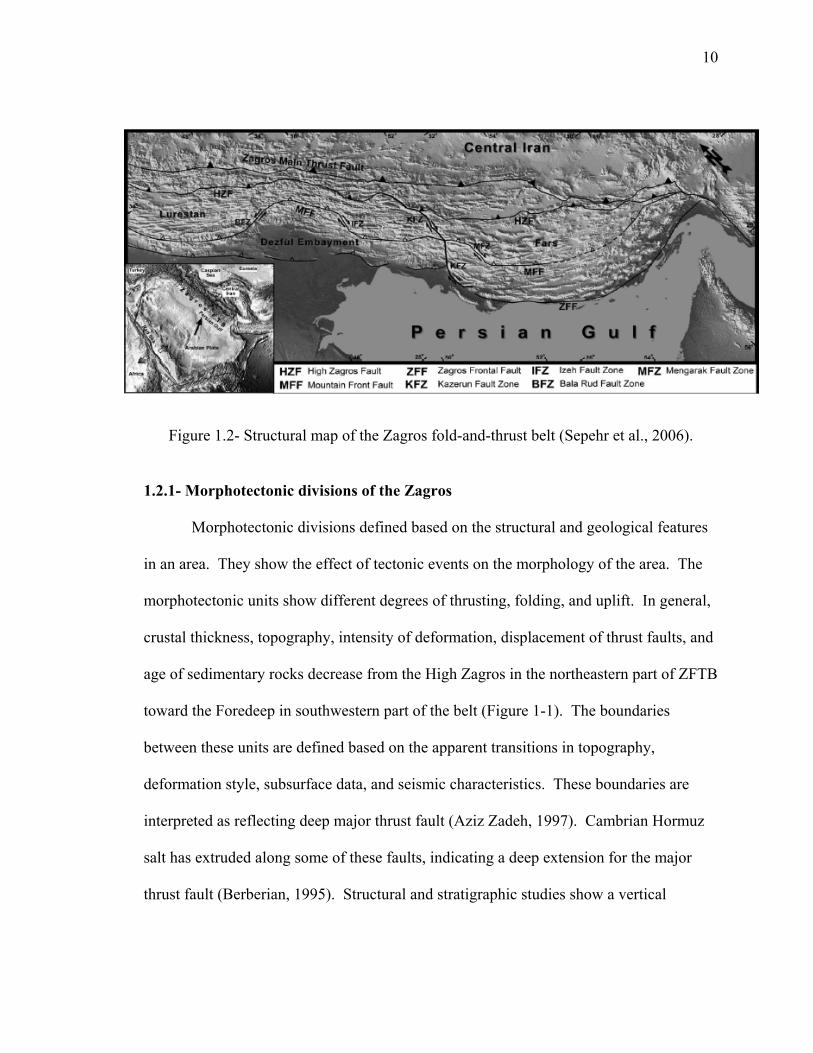
Figure 1.2- Structural map of the Zagros fold-and-thrust belt (Sepehr et al., 2006). 1.2.1- Morphotectonic divisions of the Zagros Morphotectonic divisions defined based on the structural and geological features
in an area. They show the effect of tectonic events on the morphology of the area. The
morphotectonic units show different degrees of thrusting, folding, and uplift. In general,
crustal thickness, topography, intensity of deformation, displacement of thrust faults, and
age of sedimentary rocks decrease from the High Zagros in the northeastern part of ZFTB
toward the Foredeep in southwestern part of the belt (Figure 1-1). The boundaries
between these units are defined based on the apparent transitions in topography,
deformation style, subsurface data, and seismic characteristics. These boundaries are
interpreted as reflecting deep major thrust fault (Aziz Zadeh, 1997). Cambrian Hormuz
salt has extruded along some of these faults, indicating a deep extension for the major
thrust fault (Berberian, 1995). Structural and stratigraphic studies show a vertical
11
displacement of about 6 km along these thrust faults (Falcon, 1969, 1974; James and
Wynd, 1965). The Zagros morphotectonic units are shown in Figure 1-3.
1.2.1.1- The High Zagros Thrust Belt (Zagros Imbricate Zone)
The High Zagros Thrust Belt (HZTB), with a width of more than 80km, is located
between the Main Zagros Reverse Fault (MZRF) and the Main Recent Fault (MRF) in the
northeastern part of the ZFTB, and the High Zagros Fault (HZF) in the southeastern part
of the HZTB (Figure 1-3).
The High Zagros Thrust Belt is an intensely deformed zone, characterized by high
mountains, with elevations of up to 4000 meters above sea level, and overthrust anticlines
that expose deep formations. Thrust faults are the dominant structure in this belt. The
HZTB was formed as a result of the Late Cretaceous subduction and Pliocene continent-
continent collision.
1.2.1.2- The Zagros Simply Folded Belt (ZSFB) The Zagros Simply Folded Belt borders the High Zagros Fault (HZF) along its
northeastern edge and the Mountain Frontal Fault (MFF) along the southwest (Figure 1-
3). This belt is 1375km long, 250km wide along the southern part, and 120km wide
along the northwestern edge. The Bala Rud and N-S trending Kazerun fault zones divide
the ZSFB laterally into different geological provinces; The Dezful Embayment and two
folded belts: the Lurestan province to the northwest and the Fars province to the southeast
(Figure 1-3; Sepehr and Cosgrove, 2005). The Fars province which is the main focus of
this study extends from the Kazerun fault to the Strait of Hormuz. Its southern border is
the Persian Gulf and most of the Hormuz salt diapirs are located in this province (Figure
1-4). The thickness and competence of the layers in a multilayer fold can control the
12
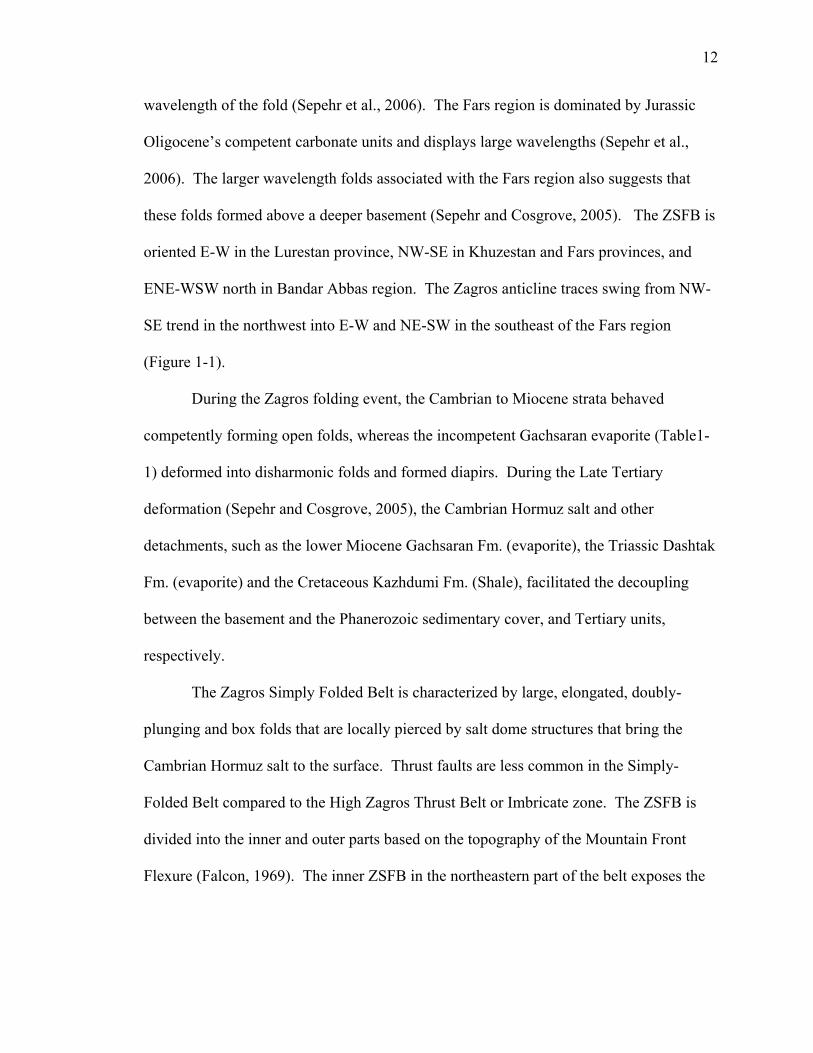
wavelength of the fold (Sepehr et al., 2006). The Fars region is dominated by Jurassic
Oligocene’s competent carbonate units and displays large wavelengths (Sepehr et al.,
2006). The larger wavelength folds associated with the Fars region also suggests that
these folds formed above a deeper basement (Sepehr and Cosgrove, 2005). The ZSFB is
oriented E-W in the Lurestan province, NW-SE in Khuzestan and Fars provinces, and
ENE-WSW north in Bandar Abbas region. The Zagros anticline traces swing from NW-
SE trend in the northwest into E-W and NE-SW in the southeast of the Fars region
(Figure 1-1).
During the Zagros folding event, the Cambrian to Miocene strata behaved
competently forming open folds, whereas the incompetent Gachsaran evaporite (Table1-
1) deformed into disharmonic folds and formed diapirs. During the Late Tertiary
deformation (Sepehr and Cosgrove, 2005), the Cambrian Hormuz salt and other
detachments, such as the lower Miocene Gachsaran Fm. (evaporite), the Triassic Dashtak
Fm. (evaporite) and the Cretaceous Kazhdumi Fm. (Shale), facilitated the decoupling
between the basement and the Phanerozoic sedimentary cover, and Tertiary units,
respectively.
The Zagros Simply Folded Belt is characterized by large, elongated, doubly-
plunging and box folds that are locally pierced by salt dome structures that bring the
Cambrian Hormuz salt to the surface. Thrust faults are less common in the Simply-
Folded Belt compared to the High Zagros Thrust Belt or Imbricate zone. The ZSFB is
divided into the inner and outer parts based on the topography of the Mountain Front
Flexure (Falcon, 1969). The inner ZSFB in the northeastern part of the belt exposes the

13
Asmari Fm. (Table 1-2) with older units in an elevated folded structure. The outer ZSFB
in the southwestern part of the belt exposes evaporite and clastic rocks in open folds.
14
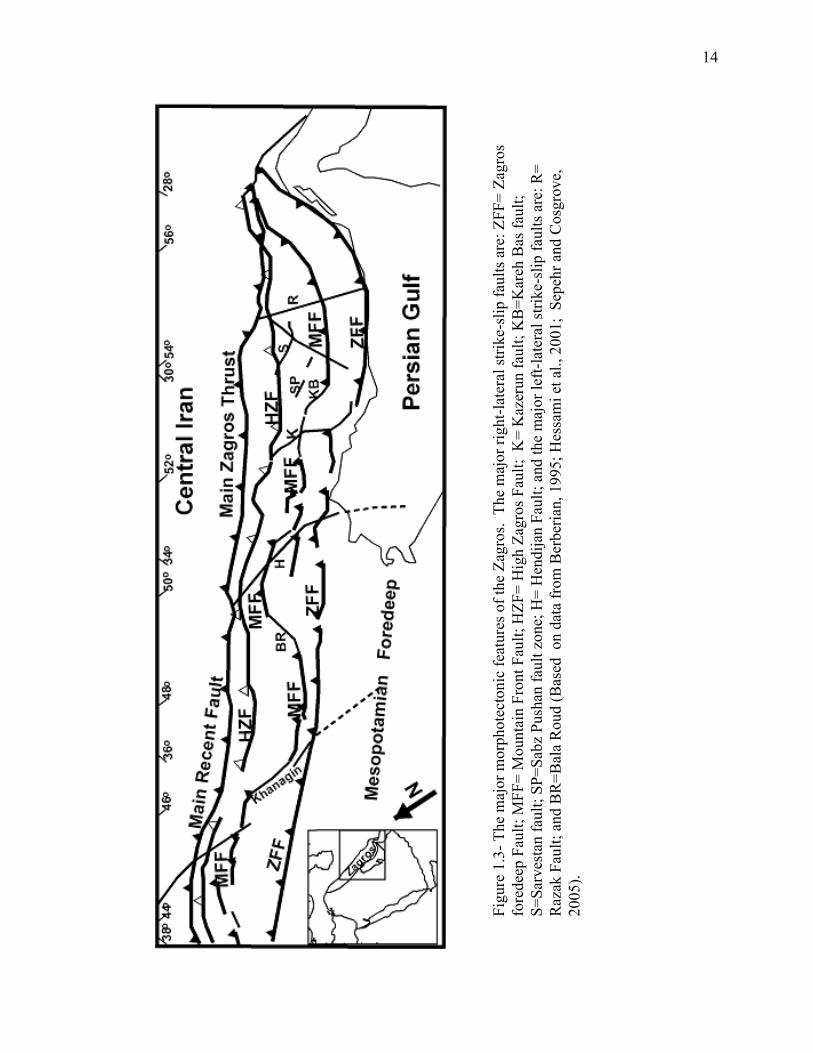
Figu
re 1
.3- T
he m
ajor
mor
phot
ecto
nic
feat
ures
of t
he Z
agro
s. T
he m
ajor
righ
t-lat
eral
strik
e-sl
ip fa
ults
are
: ZFF
= Za
gros
fo
rede
ep F
ault;
MFF
= M
ount
ain
Fron
t Fau
lt; H
ZF=
Hig
h Za
gros
Fau
lt; K
= K
azer
un fa
ult;
KB
=Kar
eh B
as fa
ult;
S=Sa
rves
tan
faul
t; SP
=Sab
z Pu
shan
faul
t zon
e; H
= H
endi
jan
Faul
t; an
d th
e m
ajor
left-
late
ral s
trike
-slip
faul
ts a
re: R
= R
azak
Fau
lt; a
nd B
R=B
ala
Rou
d (B
ased
on
data
from
Ber
beria
n, 1
995;
Hes
sam
i et a
l., 2
001;
Sep
ehr a
nd C
osgr
ove,
20
05).
15
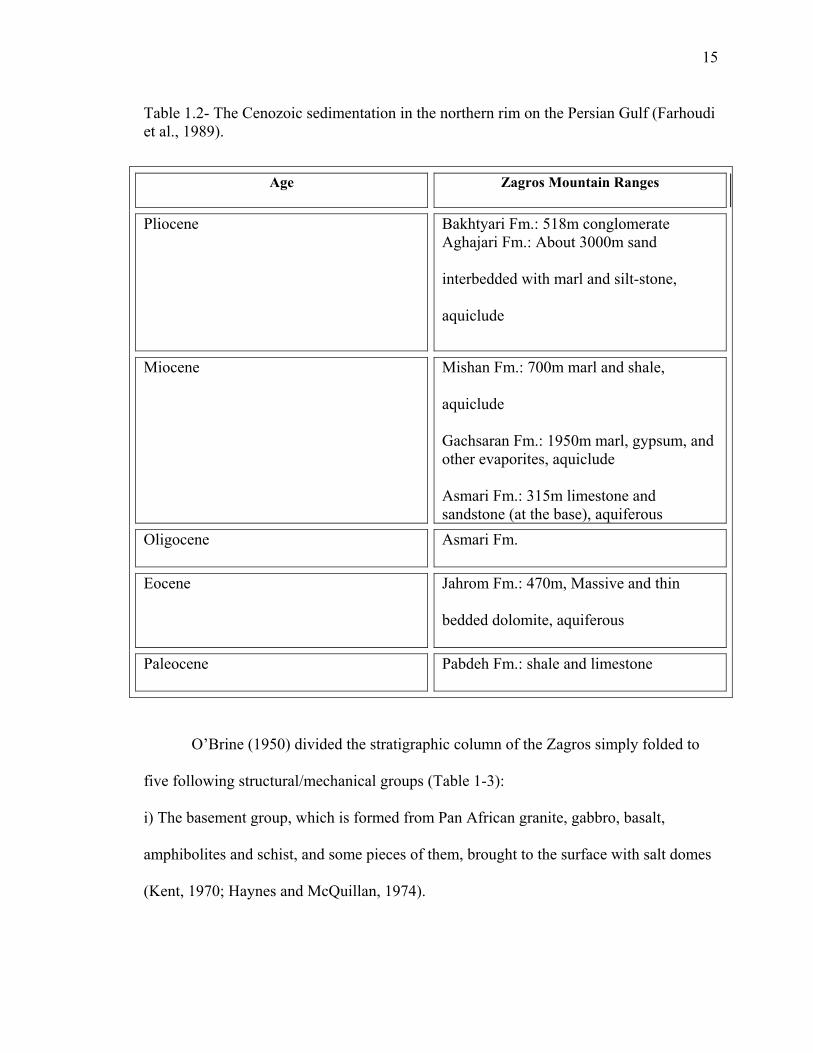
Table 1.2- The Cenozoic sedimentation in the northern rim on the Persian Gulf (Farhoudi et al., 1989).
Age Zagros Mountain Ranges
Pliocene Bakhtyari Fm.: 518m conglomerate Aghajari Fm.: About 3000m sand
interbedded with marl and silt-stone,
aquiclude
Miocene Mishan Fm.: 700m marl and shale,
aquiclude
Gachsaran Fm.: 1950m marl, gypsum, and other evaporites, aquiclude Asmari Fm.: 315m limestone and sandstone (at the base), aquiferous
Oligocene Asmari Fm.
Eocene Jahrom Fm.: 470m, Massive and thin
bedded dolomite, aquiferous
Paleocene Pabdeh Fm.: shale and limestone
O’Brine (1950) divided the stratigraphic column of the Zagros simply folded to
five following structural/mechanical groups (Table 1-3):
i) The basement group, which is formed from Pan African granite, gabbro, basalt,
amphibolites and schist, and some pieces of them, brought to the surface with salt domes
(Kent, 1970; Haynes and McQuillan, 1974).
16
ii) The lower mobile group, formed from 4 thousand meter Hormuz salt. The salt along
with gypsum, shale, carbonates, and pieces of basement’s igneous and metamorphic
rocks, comprise the Hormuz series (Stocklin, 1968; Kent, 1970).
iii) The competent group is the thickest section of the Zagros stratigraphic column. This
group is formed from 6-7 thousand meter of Cambrian to Lower Miocene platform
sediments, shale, sandstone, carbonates and evaporites.
iv) The upper mobile group is formed from 1600 meter Miocene gypsum, anhydrite, and
salt which serves as the cover rock for Asmari Fm.’s oil fields.
v) The incompetent group is formed from 3-4 thousand meter of Lower Miocene to
recent molasses including shale, sandstone, conglomerate, and anhydrite.

17
Table 1.3- Structural, lithological, and stratigraphical divisions of the Zagros simply folded belt, modified from O’Brine, 1950 (Colman-Sadd, 1978).
1.2.1.3- The Zagros Foredeep and the Dezful Embayment
The Zagros Foredeep is limited to the Mountain Front Fault (MFF) from
northeast, and to the Zagros Foredeep Fault (ZFF) from southwest (Figure 1-2). This belt
is characterized by symmetrical and elongated folds (Berberian, 1995).
There are two regional embayments in the Zagros Foredeep: (i) The Dezful
Embayment (a depressed area within the Zagros Folded Belt) in Iran, and (ii) the Kirkuk
18
Embayment in Iraq. The Dezful Embayment is a foreland basin and a thick sequence of
post-Miocene sediments were accumulated in this area. The borders of the Dezful
Embayment are surrounded by parts of the Mountain Front Fault (MFF) and the Dezful
Embayment Fault (DEF) from the north, the N-S trending Kazerun fault zone from the
east and southeast, parts of MFF and the E-W trending Bala Rud fault zone from the west
and northwest, and Zagros Foredeep Fault (ZFF) from the south and southwest (Figure 1-
2).
1.2.1.4- The Zagros Coastal Plain The Zagros Coastal Plain is a narrow region which is limited by the Zagros Foredeep
Fault (ZFF) from the north, and by the Zagros-Arabia boundary from the south (Figure 1-
2).
1.2.1.5- The Persian Gulf-Mesopotamian Lowlands This tectonically formed marginal sea is 1000km long and 250km wide (Figure 1-3). The
Persian Gulf is a foreland depression which formed on the southern rim of the Zagros
mountain range as a result of late Tertiary movements and opening of the red sea
(Farhoudi et al, 1989). From the Early Miocene to the present, uplifting of the Zagros
has been accompanied by the depression of the Persian Gulf (Less and Falcon, 1952).
1.2.2- Salt Diapirism in the Zagros
The Hormuz Formation comprises a thick (1-2 km) sequence of evaporates between the
crystalline basement and the Phanerozoic sedimentary cover (Colman-Sadd, 1978; Kent,
1979). The Hormuz evaporites acted as a basal de’collement during the Zagros orogeny,
allowing the sedimentary cover to be shortened and folded in a thin-skinned style
(Bahroudi et al., 2003). Sepehr and Cosgrove (2005) related the distribution of the
19
relatively open box fold anticlines in the Fars Arc and its less complex basin floor
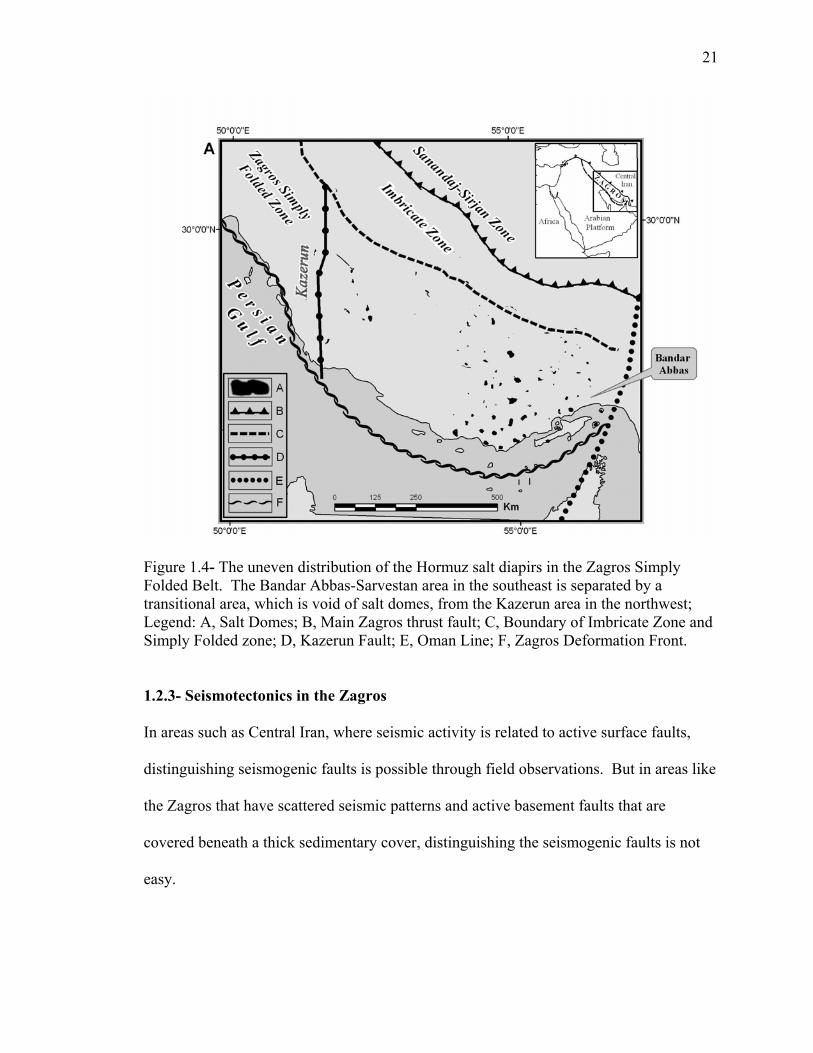
geometry to the presence of Hormuz salt. Salt domes are distributed extensively
(150,000 km2 area) and unevenly between the Kazerun fault in the west and Oman line in
the east. The uneven distribution of the Hormuz salt is attributed to the basement fault
reactivations (Husseini, 1988; Sepehr and Cosgrove, 2005).
Based on the density of the 120 salt domes distributed in the study area, the
Zagros Simply Folded Belt is divided into two separate areas: The Bandar Abbas-
Sarvestan area in the southeast that comprises most of the salt domes, and the Kazerun
area in the northwest with only 14 salt domes. East of the Kazerun fault, most of the
anticlines are either pierced with a salt dome or have some evidence of eroded salt domes
on them (Berberian, 1995). These two regions are separated by a transitional area
without any salt dome (Figure 1-4). Berberian (1976) and Kashfi (1983) attributed the
shallow earthquakes with small magnitudes that occur in the transitional zone of the
Zagros range to the movement of the Hormuz salt.
The Hormuz evaporite has breached to the surface at isolated points by piercing
through the core of many anticlines, at the crest of the anticlines, at their limbs, along
basement faults, and in the releasing stepovers between lineaments, especially in the Fars
Province (Talbot and Jarvis, 1984; Furst, 1990; Berberian, 1995; Yassaghi, 2006), and, in
places, in synclines (Aziz Zadeh, 1997). The Hormuz Fm. Carries up pieces of the
basement that underlies the Phanerozoic sequence to the surface.
Salt and anhydrite from the Infracambrian Hormuz evaporite, uppermost Jurassic,
and Miocene Gachsaran Fm (the youngest seal rock), were disharmonically folded with
the more competent rocks in the Zagros folds (Stocklin, 1968). The initial 1-2 km thick
20
Hormuz Fm. suggested by Colman-Sadd, 1978; and Kent, 1979, ranges in depth today
from zero where they are exposed as salt glaciers that have flowed into synclines to
thousands of meters where they are exposed in the core of the anticlines (Edgell, 1996)
due to the folding and subsequent remobilization of the salt.
If faults rooted in basement are the main pathways along which salt diapirs move
up to the surface through the 8-14 km of sedimentary cover (Kamen-Kaye, 1970; Talbot
and Jarvis, 1984; Furst, 1990; Berberian, 1995; Talbot and Alavi, 1996), then mapping of
the salt plugs and their spatial distribution would reveal the distribution and orientation of
the basement faults.
21
Figure 1.4- The uneven distribution of the Hormuz salt diapirs in the Zagros Simply Folded Belt. The Bandar Abbas-Sarvestan area in the southeast is separated by a transitional area, which is void of salt domes, from the Kazerun area in the northwest; Legend: A, Salt Domes; B, Main Zagros thrust fault; C, Boundary of Imbricate Zone and Simply Folded zone; D, Kazerun Fault; E, Oman Line; F, Zagros Deformation Front.
1.2.3- Seismotectonics in the Zagros
In areas such as Central Iran, where seismic activity is related to active surface faults,
distinguishing seismogenic faults is possible through field observations. But in areas like
the Zagros that have scattered seismic patterns and active basement faults that are
covered beneath a thick sedimentary cover, distinguishing the seismogenic faults is not
easy.
22
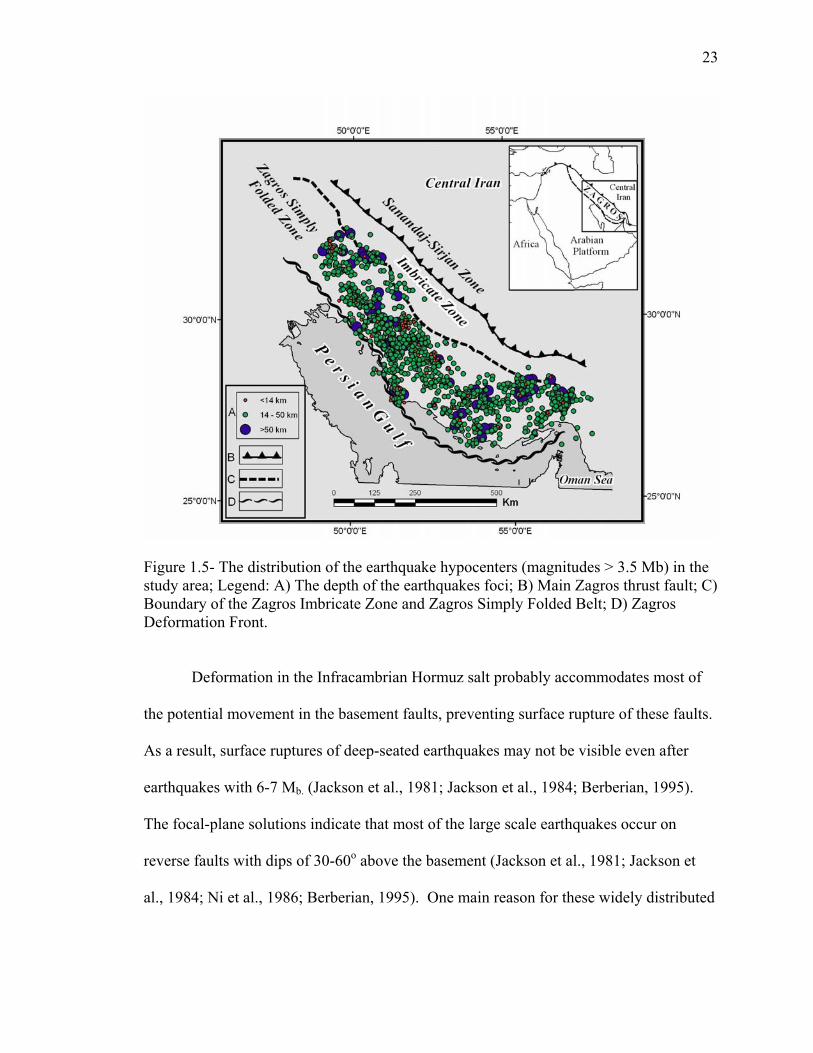
Study of the earthquakes size and distribution reveals that seismic activity is
relatively intense in the Zagros fold-and-thrust belt, and increases from northwest to
southeast (Figure 1-5). Most of the earthquakes in this belt are shallow and have
magnitudes mostly between 5-6 body-wave magnitude (Mb) and hypocenters located
between 8 and 14 km depths (mean <20 km) (Jackson and Fitch, 1980; Baker et al.,
1993; Berberian, 1995; Maggie et al., 2000; Talebian and Jackson, 2004). The
hypocenters of the earthquakes are located below the Hormuz salt and along reverse
faults (Molinaro, et al., 2005) suggesting the minimum estimate of the depth to basement
around 8km (Morris, 1977; Molinaro, et al., 2005). Most of the large earthquakes in the
Zagros range are measured and located by long-period teleseismic P and SH body waves
(Jackson et al., 1980; Kadinsky-Cade et al., 1982; Ni et al., 1986; Baker et al., 1993;
Berberian, 1995; Talebian and Jackson, 2004). Although the estimated foci of these
earthquakes are 8-14 km deep, Dewey and Grentz, 1973, reported some high magnitude
earthquakes with foci deeper than 15 km. Considering the thickness of the sedimentary
cover (8-14km) and the depth of the basement (25-50km), it is possible that the large-
scale earthquakes (5-6 Mb), with hypocenters located at depths of approximately 10-
20km, are not precisely located. If true, then the involvement of the basement in the
deformation of the Zagros Mountains cannot be discarded. (e.g., Baker et al., 1993).
Jackson and Fitch, 1981; Kadinski-Cade and Barzangi, 1982; Kashfi, 1983; Iranpanah,
1989; McQuillan, 1991; Edgell, 1992; Baker et al., 1993; Berberian, 1995; Talbot and
Alavi, 1996; Talebian and Jackson, 2004; Molinaro et al., 2005; Sherkati et al., 2005 also
believe that the basement is involved in the deformation of the Zagros.
23
Figure 1.5- The distribution of the earthquake hypocenters (magnitudes > 3.5 Mb) in the study area; Legend: A) The depth of the earthquakes foci; B) Main Zagros thrust fault; C) Boundary of the Zagros Imbricate Zone and Zagros Simply Folded Belt; D) Zagros Deformation Front.
Deformation in the Infracambrian Hormuz salt probably accommodates most of
the potential movement in the basement faults, preventing surface rupture of these faults.
As a result, surface ruptures of deep-seated earthquakes may not be visible even after
earthquakes with 6-7 Mb. (Jackson et al., 1981; Jackson et al., 1984; Berberian, 1995).
The focal-plane solutions indicate that most of the large scale earthquakes occur on
reverse faults with dips of 30-60o above the basement (Jackson et al., 1981; Jackson et
al., 1984; Ni et al., 1986; Berberian, 1995). One main reason for these widely distributed
24
earthquakes in the Zagros, is the presence of active blind thrusts, which are also related to
the development of the surface folds (Aziz Zadeh, 1997).
Seismologic and paleogeographic evidence indicate that these thrust faults are
formed due to reversed movement on the older normal faults that reactivated during
continental contractional deformation of the Zagros orogeny. The reactivation of these
basement faults was accompanied with vertical movement and folding and uplifting of
the Phanerozoic sedimentary cover. Studies by Berberian (1995) and Aziz Zadeh (1997)
show that the seismic regions in the Zagros range coincide with the location of major
blind thrust faults, mapped through other geophysical methods. Major blind faults mark
the boundaries of the morphotectonic units of the Zagros described earlier (Figures 1-2,
1-3). The thrust faults demarcate discrete segments of the basement that are as much as
110km long. The following sections give the description of these faults, along a traverse
from northeast to southwest margins of the ZFTB (Figures 1-2, 1-3).
1.2.3.1- The Major Zagros Reverse Fault (MZRF)
The MZRF marks the collision zone between the Central Iran domain and the Arabian
plate. This fault trends NW-SE from west of Iran to north of Bandar Abbas (Berberian,
1995).
1.2.3.2- The Main Recent Fault (MRF)
The MRF is a NW-SE trending, active, right-lateral strike-slip fault that generally follows
the trend of the MZRF (Tchalenko et al., 1974; Berberian, 1995; Figures 1-2, 1-3). This
fault is >640 km long, bounds the Zagros to the northeast, and is separated by Central
Iran from the ZFTB (Berberian et al., 2001). The average slip along this fault is
40mm/yr, and the fault is characterized by high-magnitude seismicity.
25
1.2.3.3- The High Zagros Fault (HZF) The active HZF separates the High Zagros Thrust Belt (HZTB), also referred as the
Imbricate zone, to the northeast from the Zagros Simply Folded Belt (ZSFB) in the
southwest (Figures 1-2, 1-3). Along this segmented reverse fault, Paleozoic rocks were
vertically displaced by 6km (Huber, 1977, Berberian, 1995). The result of this
displacement is obvious in the level of the exposure of the sedimentary cover strata in
both sides of the HZF. In various places along this fault, the Hormuz salt intrudes and
reaches the surface confirming that the HZF is a deep fault. There is some seismic
activity in the southeastern part of the HZF with strike-slip focal mechanism solutions
(Aziz Zadeh, 1997). This fault contains a seismic gap which extends for 440km.
1.2.3.4- The Mountain Frontal Fault (MFF) The MFF delineates the south-southwestern boundary of the ZSFB. This fault which
subdivides the Simply Folded Belt, is the surface manifestation of an active, reverse,
blind thrust (Berberian, 1995) and demarcates discrete segments of fault blocks with
length ranging from 15 to 115 km. (Figure 1-2). It is believed that since the early
Tertiary, the MFF had controlled sedimentation of the Zagros foreland basin (Sepehr and
Cosgrove, 2004; Sherkati and Letouzey, 2004). The apparent subsidence of the Zagros
Foredeep in the Dezful Embayment area is suggested by the thickening of sediments
formed after the deposition of the Asmari Fm. This is evidence of the relative motion
along the MFF and the Dezful Embayment Fault (DEF) from the Early Miocene (Aziz
Zadeh, 1997).
Stratigraphic, seismic, and drilling investigations show more than 6km vertical
displacement along MFF thrust fault (Falcon, 1974; Huber, 1977; Berberian, 1986). Due
26
to this vertical movement, the southwestern margin of the ZSFB was uplifted. The MFF
is displaced right-laterally about 140km by the Kazerun fault.
1.2.3.5- The Dezful Embayment Fault (DEF)
The DEF is located at the northeastern margin of the Dezful Embayment, between the
MFF in the north and the Zagros Foredeep Fault (ZFF) in the south.
1.2.3.6- The Zagros Foredeep Fault (ZFF) The Zagros Foredeep Fault (ZFF) which almost parallels the MFF, defines the
northeastern boundary of the Persian Gulf-Mesopotamian Lowlands. This fault has a
reverse sense and like the MFF, delineates discrete and discontinues segments of fault
(Figure 1-2). The ZFF is right-laterally displaced about 150 km by the Kazerun active
fault. Other blind faults in the ZFTB may remain undetected because of their lack of
seismic activity.
27
2. METHODOLOGY
Analysis of the spatial distribution, orientation, scale, and kinematic significance
of the fold- and fault-related fracture systems was conducted in a geographic information
system (GIS) environment using ArcGIS 9.1, using a series of remote sensing images
enhancement techniques. The traces of fractures in most of the fold structures, especially
around the Kazerun fault, were digitized and stored in the Geographic Information
System (GIS) database. Using ArcGIS 9.1 software, different fracture sets for each of
fold and fault structures were identified and categorized from the enhanced images. The
results of the analysis revealed the relationship between different fracture sets, and
allowed testing and comparison of the kinematic relationship between fracturing and
tectonics in the Zagros fold-and-thrust belt.
The remote sensing analysis utilized different satellite images such as Advanced
Spaceborne Thermal Emission and Reflection Radiometer (ASTER), LANDSAT 7
Enhanced Thematic Mapper plus (ETM+) with 30 meter resolution, and RADARSAT 1
SAR, as well as the Shuttle Radar Topography Mission (SRTM), ASTER-derived Digital
elevation models (DEM), geological maps (1:100,000, 1:250,000 and 1:1000,000)
published by the National Iranian Oil Company and the Geological Survey of Iran, and
topographic maps (1:250,000).
ArcGIS 9.1, ERDAS Imagine 8.7, Envi 4.3, and Rockwork software were used
in this study to: (i) determine the orientation (i.e., trend), length, and location of the
fracture traces, (ii) geo-reference and rectify the raw, digital image data, (iii) apply
various methods to enhance the visualization of the traces of the fracture sets on the
images, and (iv) conduct structural/kinematic analysis.
28
2.1- Image Processing
Digital images are usually affected by geometric distortions and require rectification.
Image processing is a sequence of processes applied on an image using computer
programs. It includes image rectification, enhancement, and interpretation of raw digital
images (Lillesand and Kiefer, 2000). A raw image is stored in a column and row
geometry.
2.1.1- Image Rectifications and Geo-referencing
When a raw image is obtained, usually there are no relationships between the real world
coordinates and the image’s coordinates. A process named geo-referencing, applied to
establish the relationship between the raw image and the real world coordinates, assigns a
reference for the image. In order to integrate various types of images and spatial data in a
GIS environment, the digital image data must first be in the same coordinate system and
geo-referenced. After geo-referencing the pixels in the new image keep their original
row and column values.
All data used in this study were geo-referenced in the Universal Transverse
Mercator (UTM) coordinate system as the map projection and World Geodetic System
(WGS) 1984 datum. In order to have comparable resolution, the majority of images were
resampled to 30 m. In some case where greater detailed analysis was needed, images
were resampled to 15 m resolution. The data was then rectified so that it could be
combined with other data sets which had a different datum.
ERDAS Imagine 8.7 and ENVI 4.3 were used to geo-reference and rectify the
raw digital image data, and to apply various enhancement methods. In this study, 3
29
RADARSAT, 16 ETM+, 7 ASTER, and two SRTM scenes that cover the study area were
used. 41 DEMs covering the area were generated and derived from the ASTER data.
2.1.1.1- LANDSAT 7 Enhanced Thematic Mapper Plus (ETM+)
LANDSAT 7 was launched on April 15, 1999, and followed its predecessors’ 16-day
orbit around the Earth. It captures a 185-km cross-track and 170 km along-track swath of
seven bands. LANDSAT 7 is sensitive to the Earth’s reflectivity at eight different
wavelengths (eight bands). LANDSAT bands 1 through 3 cover the visible range, bands
4, 5 and 7 cover the infrared range, band 6 covers the thermal, and band 8 is a
panchromatic image (Table 2-1). Color is achieved by combining any three of the optical
bands. The most important advantage of the ETM+ over the Thematic Mapper (TM)
image is the addition of the band 8, with 15 m resolution, that can be combined with the
other bands of ETM+ (30 m resolution) to produce a higher resolution. Because ETM+
was easily accessible, it was used as the base coverage of the Zagros area in this study
(Figure 2-1).
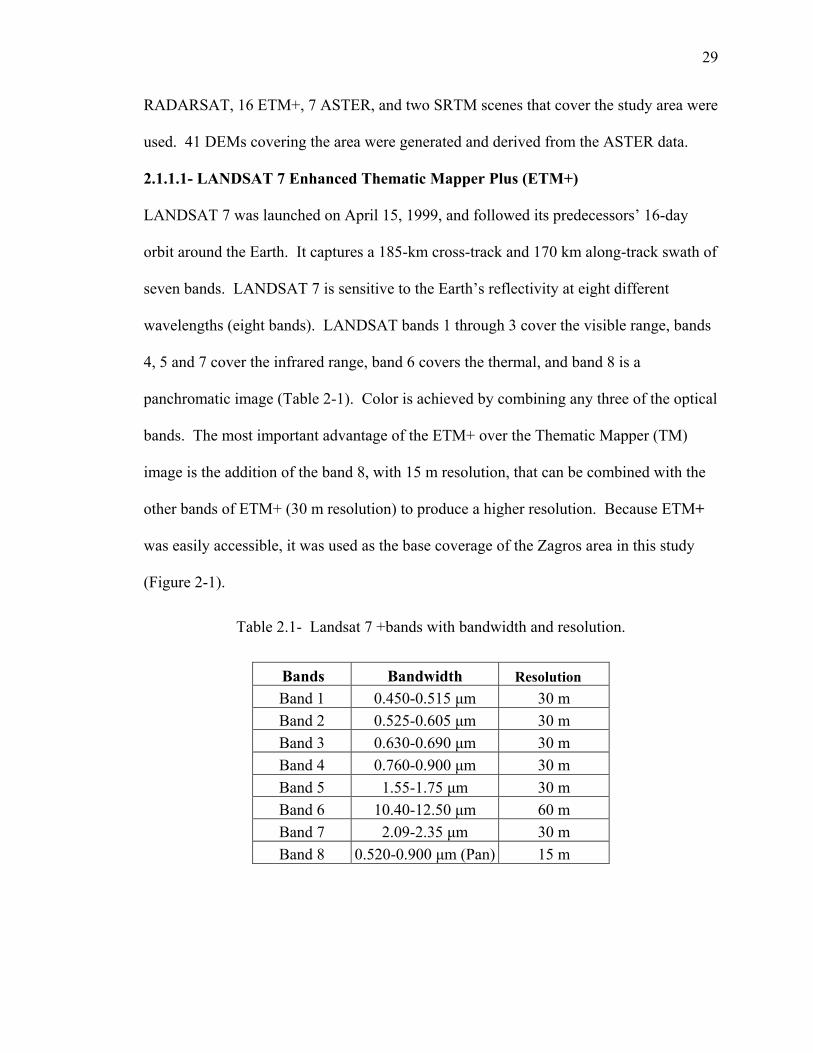
Table 2.1- Landsat 7 +bands with bandwidth and resolution.
Bands Bandwidth Resolution
Band 1 0.450-0.515 µm 30 m Band 2 0.525-0.605 µm 30 m Band 3 0.630-0.690 µm 30 m Band 4 0.760-0.900 µm 30 m Band 5 1.55-1.75 µm 30 m Band 6 10.40-12.50 µm 60 m Band 7 2.09-2.35 µm 30 m Band 8 0.520-0.900 µm (Pan) 15 m
30
2.1.1.2- Advanced Spaceborne Thermal Emission and Reflection Radiometer (ASTER) ASTER is a recent satellite optical system, and one of several instruments aboard the Terra satellite. The ASTER instrument on the Terra satellite was launched in December
1999 as part of NASA's EOS. The Terra spacecraft travels in a near circular, sun-
synchronous orbit with an inclination of approximately 98.2 degrees. The purpose of
ASTER is to collect data on land surface temperature, emissivity, reflectance, and
elevation over 98% of the globe. It is the only high spatial resolution instrument on
board Terra.
31
Figure 2.1- Grey scale ETM+ satellite image mosaic of the Kazerun fault zone, showing the location of anticlinal axes, the Kazerun fault segments (Yasuj, Kamarij, and Burazjan), and digitized traces of fractures. Inset map shows the location of the area.
ASTER collects data in 14 bands, within three subsystems (VNIR, SWIR, TIR),
and different regions of the electromagnetic spectrum. It provides 3 bands (not including
the backward-looking telescope in band 3 for digital stereo-pair used in DEM generation)
in the visible to near infrared (VNIR) at 15 m resolution, 6 bands in the short-wave
infrared (SWIR) at 30 m resolution, and 5 bands in the thermal-infrared (TIR) with the
lowest spatial resolution of the three subsystems at 90 m resolution (Table 2-2). The
32
ASTER data have 60 km wide swaths. All bands of the ASTER data were investigated
for use in this dissertation (e.g. Figure 2-2).
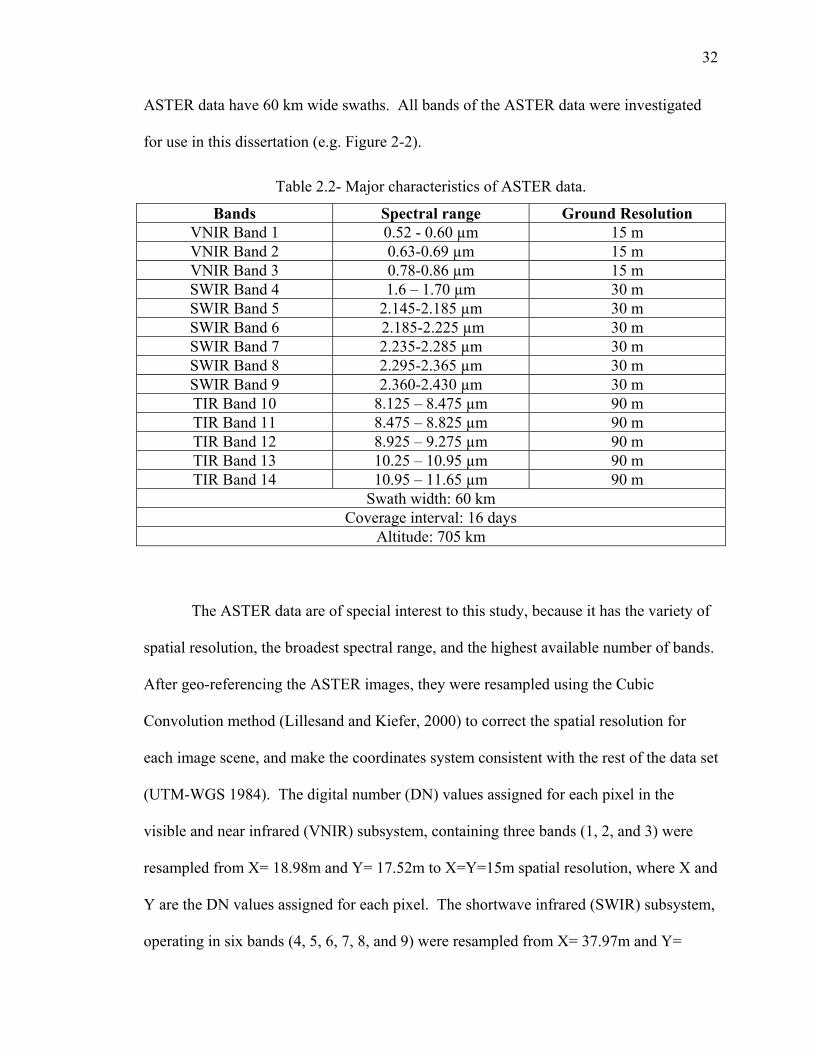
Table 2.2- Major characteristics of ASTER data.
Bands Spectral range Ground Resolution VNIR Band 1 0.52 - 0.60 µm 15 m VNIR Band 2 0.63-0.69 µm 15 m VNIR Band 3 0.78-0.86 µm 15 m SWIR Band 4 1.6 – 1.70 µm 30 m SWIR Band 5 2.145-2.185 µm 30 m SWIR Band 6 2.185-2.225 µm 30 m SWIR Band 7 2.235-2.285 µm 30 m SWIR Band 8 2.295-2.365 µm 30 m SWIR Band 9 2.360-2.430 µm 30 m TIR Band 10 8.125 – 8.475 µm 90 m TIR Band 11 8.475 – 8.825 µm 90 m TIR Band 12 8.925 – 9.275 µm 90 m TIR Band 13 10.25 – 10.95 µm 90 m TIR Band 14 10.95 – 11.65 µm 90 m
Swath width: 60 km Coverage interval: 16 days
Altitude: 705 km
The ASTER data are of special interest to this study, because it has the variety of
spatial resolution, the broadest spectral range, and the highest available number of bands.
After geo-referencing the ASTER images, they were resampled using the Cubic
Convolution method (Lillesand and Kiefer, 2000) to correct the spatial resolution for
each image scene, and make the coordinates system consistent with the rest of the data set
(UTM-WGS 1984). The digital number (DN) values assigned for each pixel in the
visible and near infrared (VNIR) subsystem, containing three bands (1, 2, and 3) were
resampled from X= 18.98m and Y= 17.52m to X=Y=15m spatial resolution, where X and
Y are the DN values assigned for each pixel. The shortwave infrared (SWIR) subsystem,
operating in six bands (4, 5, 6, 7, 8, and 9) were resampled from X= 37.97m and Y=
33
35.04 m to X=Y= 30m spatial resolution. The thermal infrared (TIR), operating in five
bands (10, 11, 12, 13, and 14) were resampled from X= 115.56 m and Y= 104.799 m to
X=Y= 90m spatial resolution. Mosaics of these overlapping images were made from
each of the subsystems in order to create a larger set of images.
The VNIR subsystem consists of two telescopes; nadir looking and backward
looking (27.7o off-nadir). Since these two sensors cover the same area from two different
angles, they provide a pair of stereo images that can be used in the generation of DEMs.
ASTER-derived DEMs, with 30 m resolution, were built to create a perspective view of
the study area. The DEMs were geo-referenced and put together in a mosaic, and
overlaid by the ASTER, ETM+, and RDARSAT, to improve the visual interpretation by
creating a 3D view. The topographic relief of the 3D view is exaggerated two times for a
more detailed perspective of fractures.
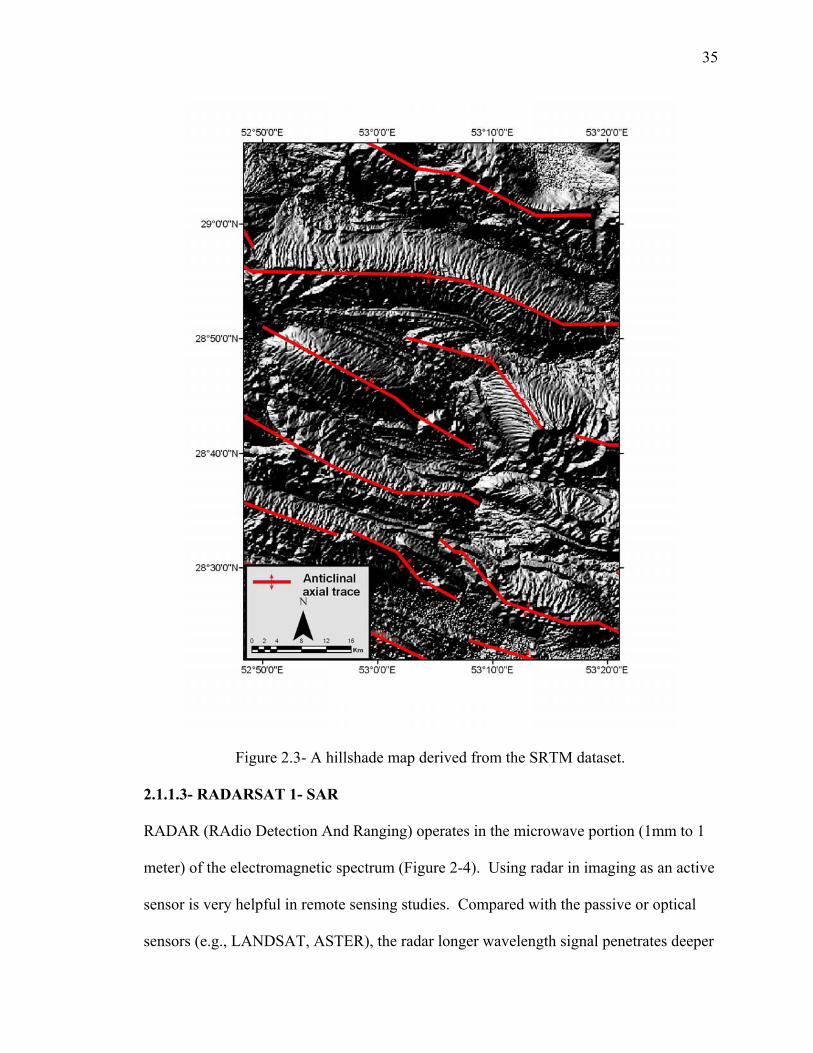
The Shuttle Radar Topography Mission (SRTM) is also capable of producing
DEMs with an X-Y resolution of (approximately 30 meters) and a vertical resolution (Z)
of 6 to 10 meters. The data have been degraded to 3 arc seconds for the study area (~ 90
meters). SRTM data used in this research were acquired from CGIAR Consortium for
Spatial Information (CGIAR-CSI) with 90-meter spatial resolution. Although the
ASTER-derived DEMs have a higher spatial resolution, the SRTM DEMs generally have
better reliability. A hillshade map was derived from the SRTM (Figure 2-3) using
ArcMap. The hillshade function used the SRTM elevation raster data to create a shaded
relief map of the study area. The hypothetical illumination of a surface which was useful
for fracture analysis in this study.
34
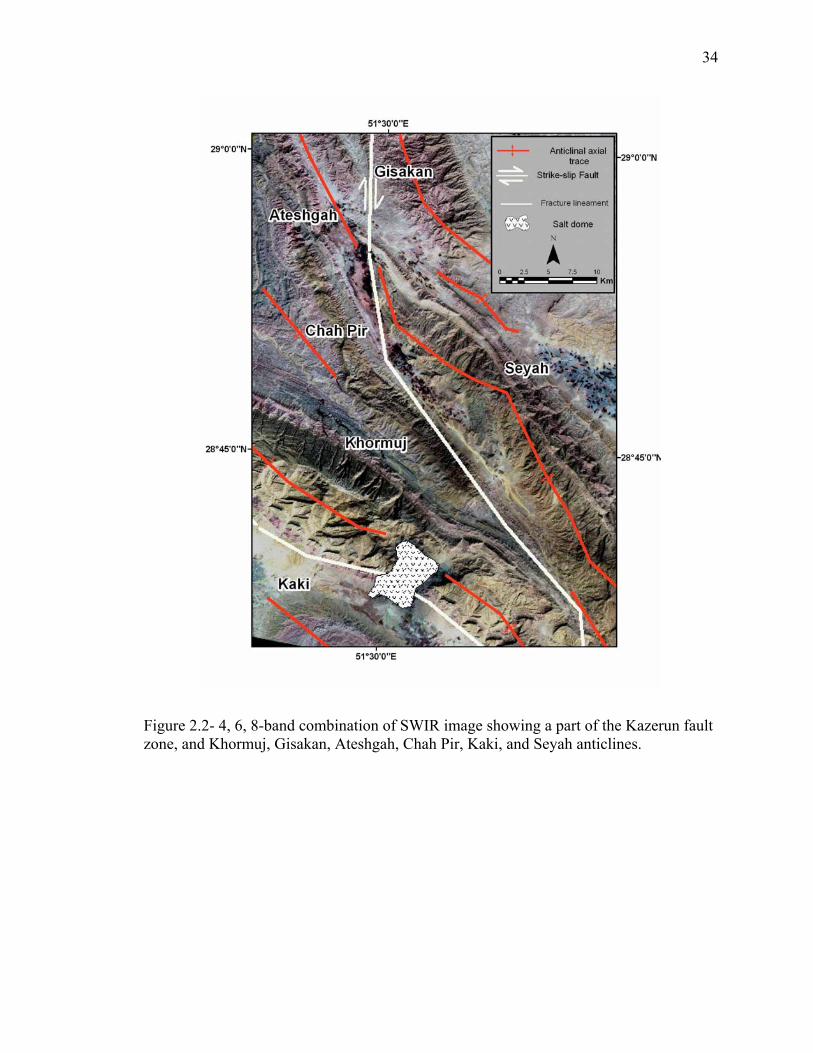
Figure 2.2- 4, 6, 8-band combination of SWIR image showing a part of the Kazerun fault zone, and Khormuj, Gisakan, Ateshgah, Chah Pir, Kaki, and Seyah anticlines.
35
Figure 2.3- A hillshade map derived from the SRTM dataset.
2.1.1.3- RADARSAT 1- SAR
RADAR (RAdio Detection And Ranging) operates in the microwave portion (1mm to 1
meter) of the electromagnetic spectrum (Figure 2-4). Using radar in imaging as an active
sensor is very helpful in remote sensing studies. Compared with the passive or optical
sensors (e.g., LANDSAT, ASTER), the radar longer wavelength signal penetrates deeper
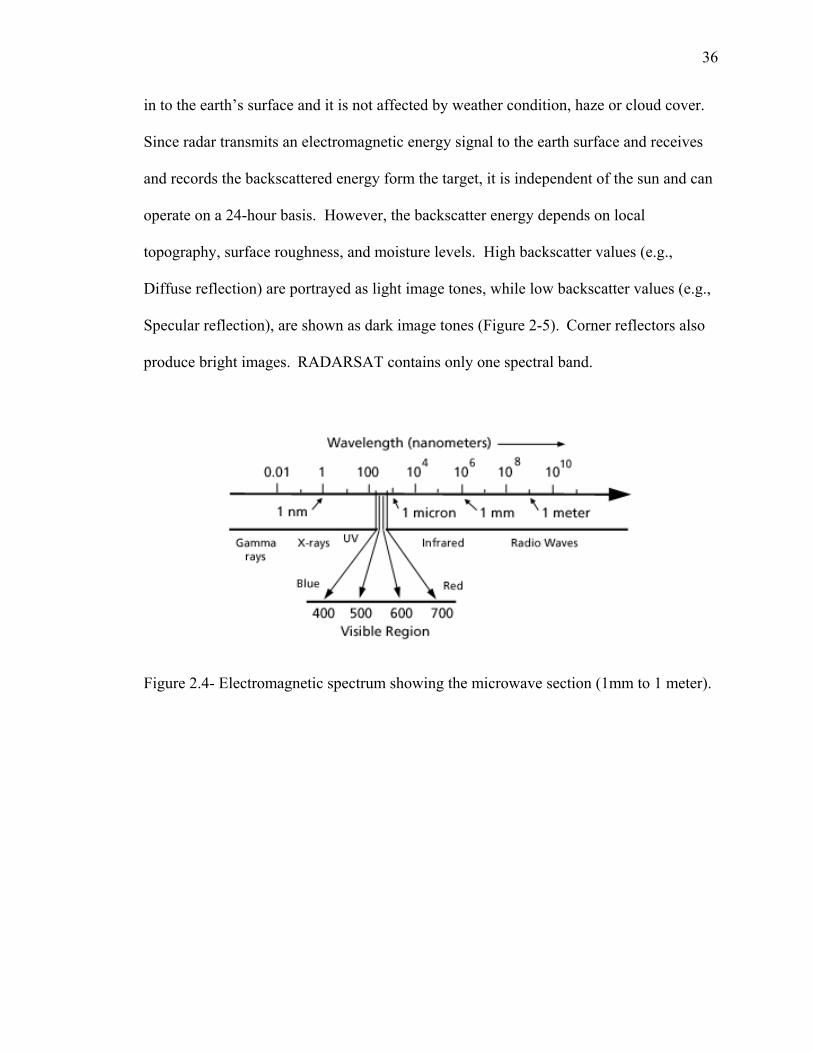
36
in to the earth’s surface and it is not affected by weather condition, haze or cloud cover.
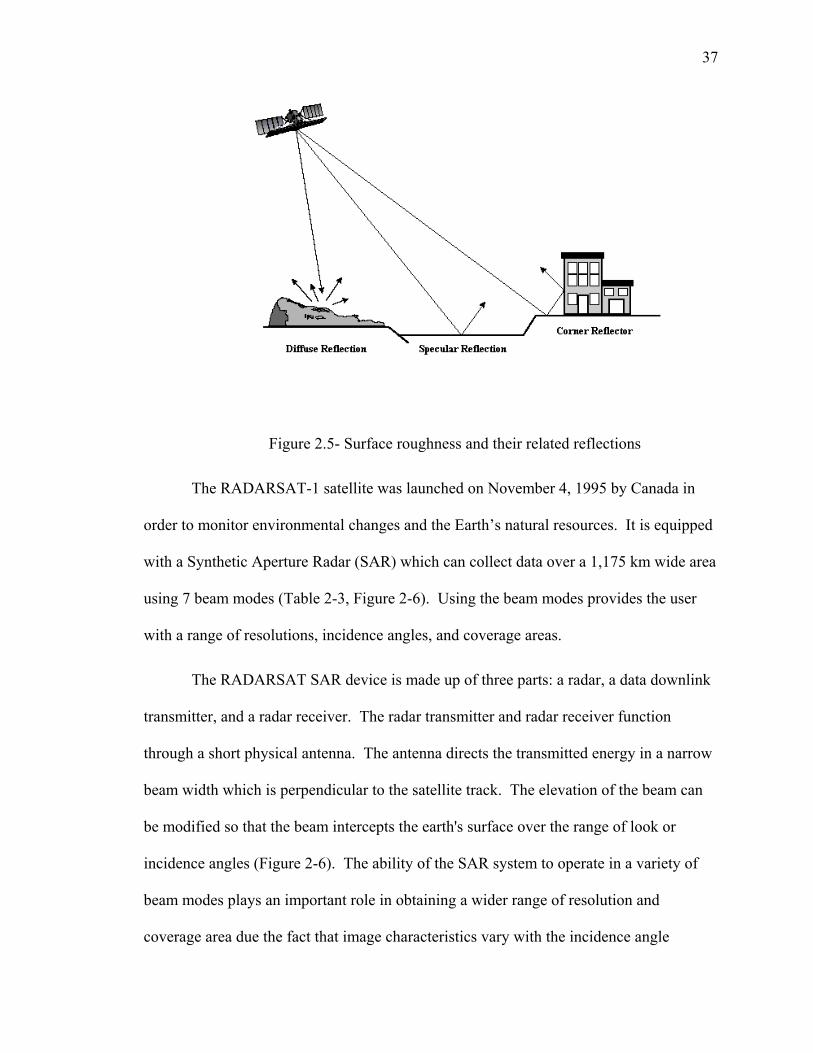
Since radar transmits an electromagnetic energy signal to the earth surface and receives
and records the backscattered energy form the target, it is independent of the sun and can
operate on a 24-hour basis. However, the backscatter energy depends on local
topography, surface roughness, and moisture levels. High backscatter values (e.g.,
Diffuse reflection) are portrayed as light image tones, while low backscatter values (e.g.,
Specular reflection), are shown as dark image tones (Figure 2-5). Corner reflectors also
produce bright images. RADARSAT contains only one spectral band.
Figure 2.4- Electromagnetic spectrum showing the microwave section (1mm to 1 meter).
37
Figure 2.5- Surface roughness and their related reflections
The RADARSAT-1 satellite was launched on November 4, 1995 by Canada in
order to monitor environmental changes and the Earth’s natural resources. It is equipped
with a Synthetic Aperture Radar (SAR) which can collect data over a 1,175 km wide area
using 7 beam modes (Table 2-3, Figure 2-6). Using the beam modes provides the user
with a range of resolutions, incidence angles, and coverage areas.
The RADARSAT SAR device is made up of three parts: a radar, a data downlink
transmitter, and a radar receiver. The radar transmitter and radar receiver function
through a short physical antenna. The antenna directs the transmitted energy in a narrow
beam width which is perpendicular to the satellite track. The elevation of the beam can
be modified so that the beam intercepts the earth's surface over the range of look or
incidence angles (Figure 2-6). The ability of the SAR system to operate in a variety of
beam modes plays an important role in obtaining a wider range of resolution and
coverage area due the fact that image characteristics vary with the incidence angle
38
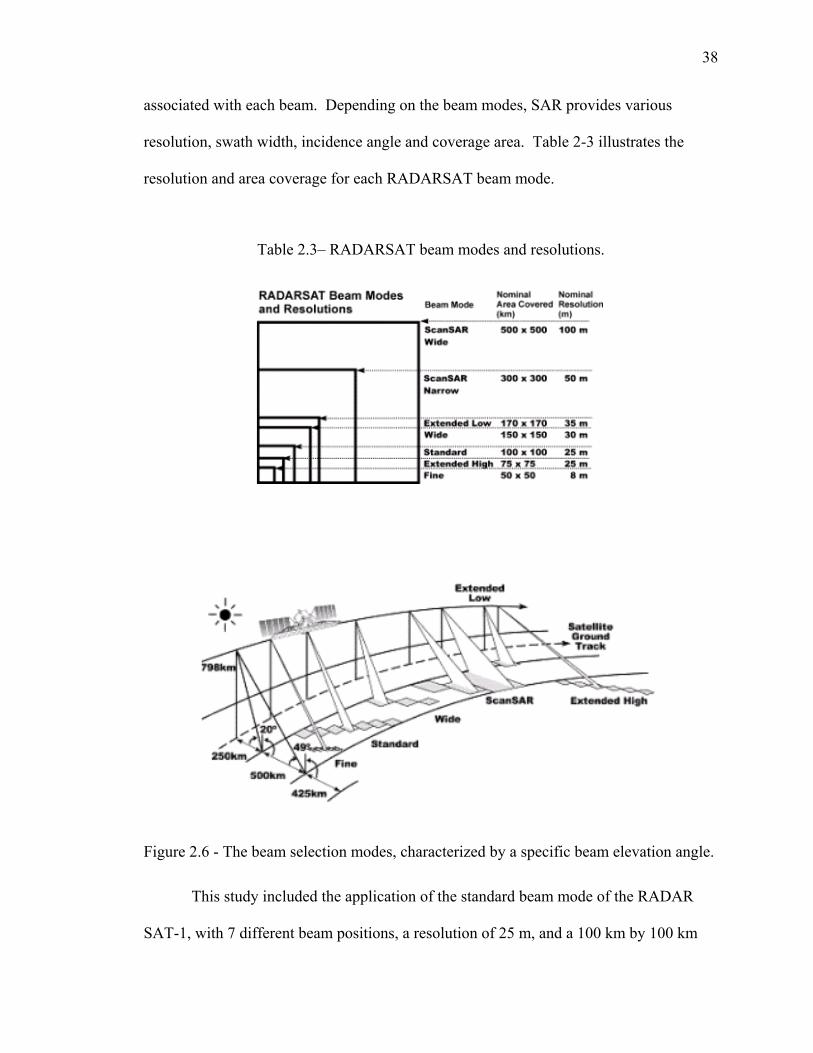
associated with each beam. Depending on the beam modes, SAR provides various
resolution, swath width, incidence angle and coverage area. Table 2-3 illustrates the
resolution and area coverage for each RADARSAT beam mode.
Table 2.3– RADARSAT beam modes and resolutions.
Figure 2.6 - The beam selection modes, characterized by a specific beam elevation angle.
This study included the application of the standard beam mode of the RADAR
SAT-1, with 7 different beam positions, a resolution of 25 m, and a 100 km by 100 km
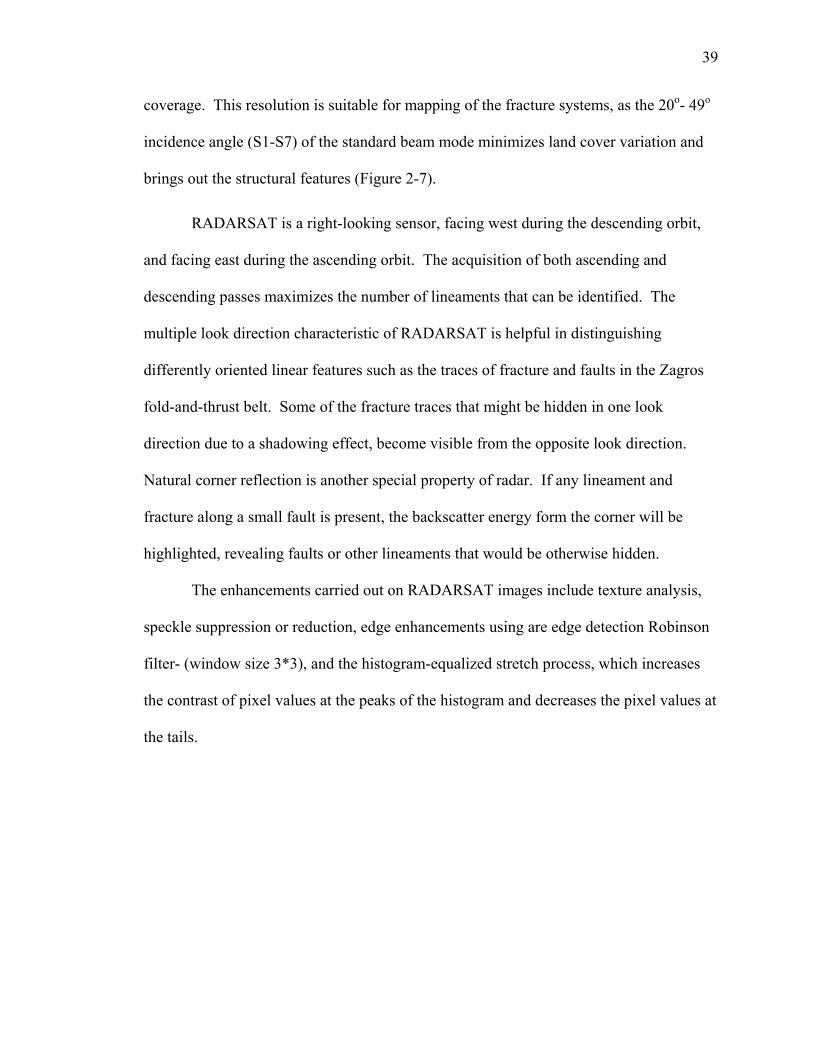
39
coverage. This resolution is suitable for mapping of the fracture systems, as the 20o- 49o
incidence angle (S1-S7) of the standard beam mode minimizes land cover variation and
brings out the structural features (Figure 2-7).
RADARSAT is a right-looking sensor, facing west during the descending orbit,
and facing east during the ascending orbit. The acquisition of both ascending and
descending passes maximizes the number of lineaments that can be identified. The
multiple look direction characteristic of RADARSAT is helpful in distinguishing
differently oriented linear features such as the traces of fracture and faults in the Zagros
fold-and-thrust belt. Some of the fracture traces that might be hidden in one look
direction due to a shadowing effect, become visible from the opposite look direction.
Natural corner reflection is another special property of radar. If any lineament and
fracture along a small fault is present, the backscatter energy form the corner will be
highlighted, revealing faults or other lineaments that would be otherwise hidden.
The enhancements carried out on RADARSAT images include texture analysis,
speckle suppression or reduction, edge enhancements using are edge detection Robinson
filter- (window size 3*3), and the histogram-equalized stretch process, which increases
the contrast of pixel values at the peaks of the histogram and decreases the pixel values at
the tails.
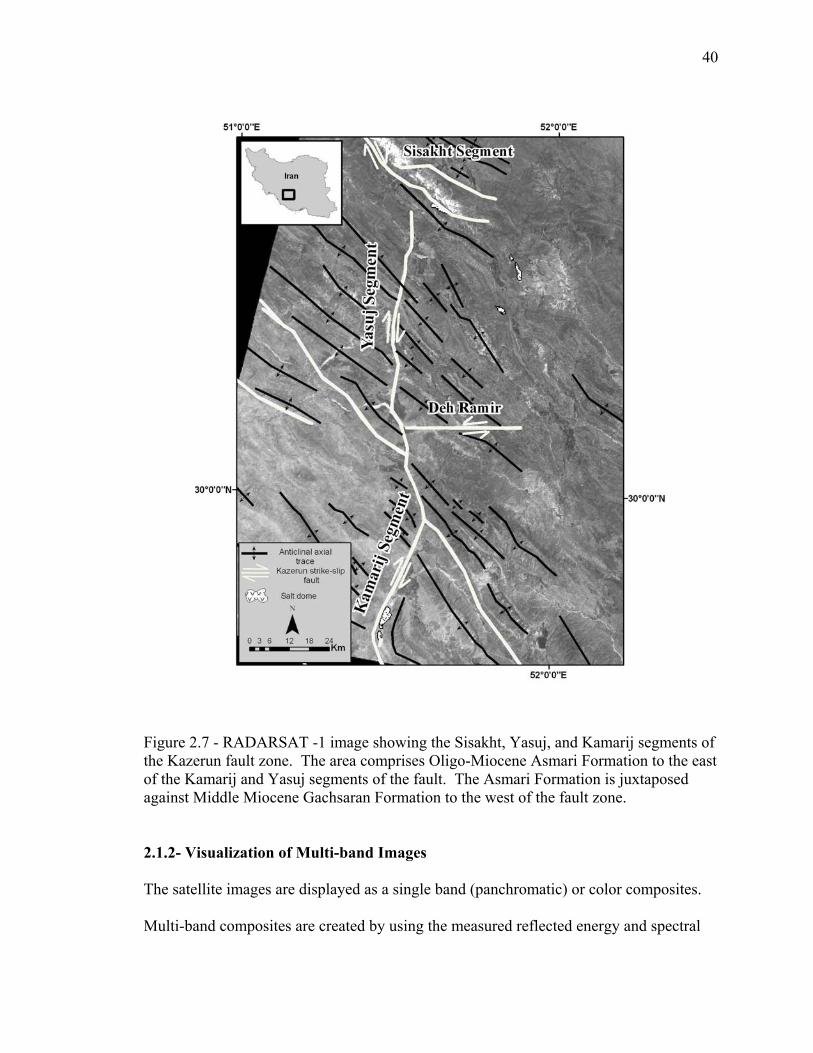
40
Figure 2.7 - RADARSAT -1 image showing the Sisakht, Yasuj, and Kamarij segments of the Kazerun fault zone. The area comprises Oligo-Miocene Asmari Formation to the east of the Kamarij and Yasuj segments of the fault. The Asmari Formation is juxtaposed against Middle Miocene Gachsaran Formation to the west of the fault zone.
2.1.2- Visualization of Multi-band Images
The satellite images are displayed as a single band (panchromatic) or color composites.
Multi-band composites are created by using the measured reflected energy and spectral
41
information in each of three spectral bands to control the amount of three primary colors;
red, green, and blue (R, G, and B), in a color output image. Many combinations of bands
are possible.
The way in which the bands in each type of images are mapped to the three
primary colors in the output image depends on the information desired to be highlighted
in the image. For some applications, it may be desirable that landcover classes be
associated with familiar colors, e.g., green for grass. In other cases, contrasting colors are
preferred to highlight objects of interest from the background.
In order to distinguish between different geological units and distinguish between
sets of lineaments, different band combinations were used in this study. An image using
for example, band 7 as a color gun red, band 4 as a color gun green, and band 2 as a color
gun blue would be designated (7,4,2). This convention was used in this study because it
works well in arid areas such as the Zagros and provides the greatest distinction between
rock types.
On the multi-spectral images, bands 3, 2, 1, also known as the True-Color
Composite image of the ASTER image (Figure 2-8), and bands 4, 3,2 of ETM+ as red,
green and blue, respectively, were selected. The true color composite made from ASTER
approximates the range of vision for the human eye, and hence these images appear to be
close to what we would expect to see in a normal photograph. The true-color images
tend to be low in contrast and somewhat hazy in appearance. This is because blue light is
more susceptible than other bandwidths to scattering by the atmosphere. Broad-based
analysis of underwater features and landcover are typical applications for the true-color
composites. This combination is much like the 4, 3,2 of Landsat, with the biggest
42
difference being that band 3 of ASTER but band 4 of Landsat measures the near-infrared
(Table 2-1and 2-2). A true color scene is one that assigns bands that are approximately
equal to the red, green, and blue portions of the electromagnetic spectrum. Thus the true
color composite images look partly realistic, and are useful as location maps, for
distinguishing important urban features such as roads and towns, as well as
geomorphologic features such as rivers, topography, and ridges. However, the colors of
the true color composite images are not completely natural because the bands of both
Landsat and ASTER do not exactly match the red-green-blue regions of the
electromagnetic spectrum.
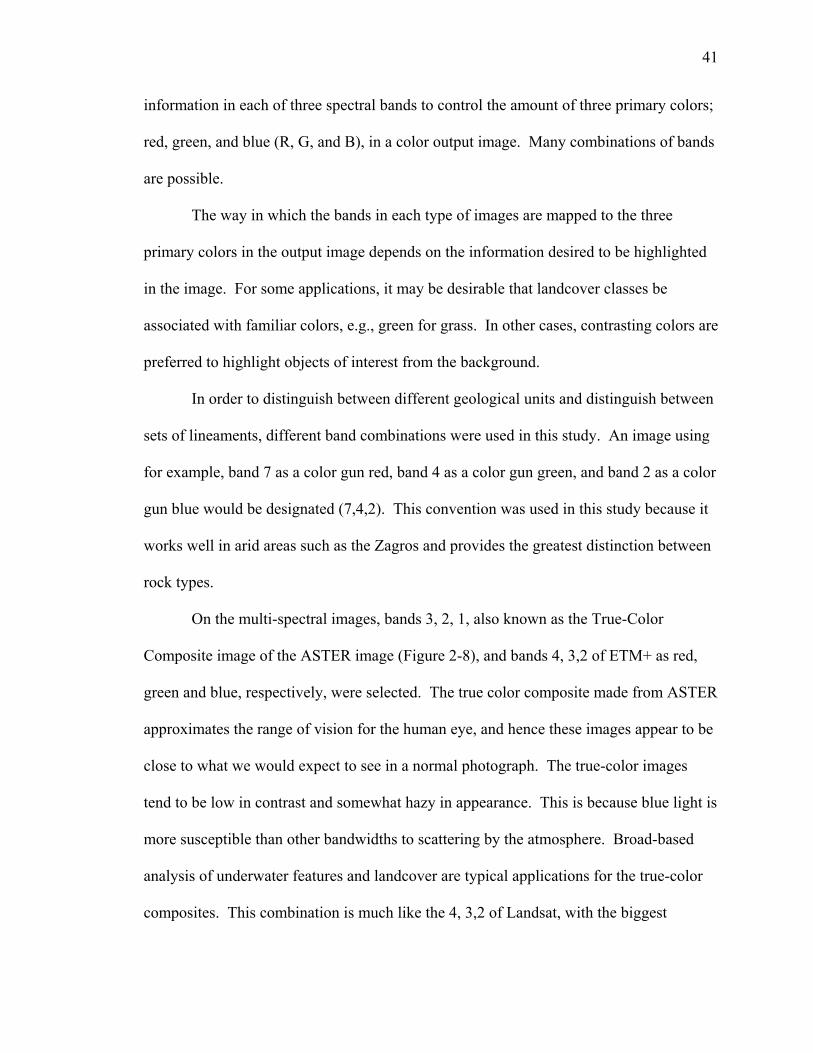
43
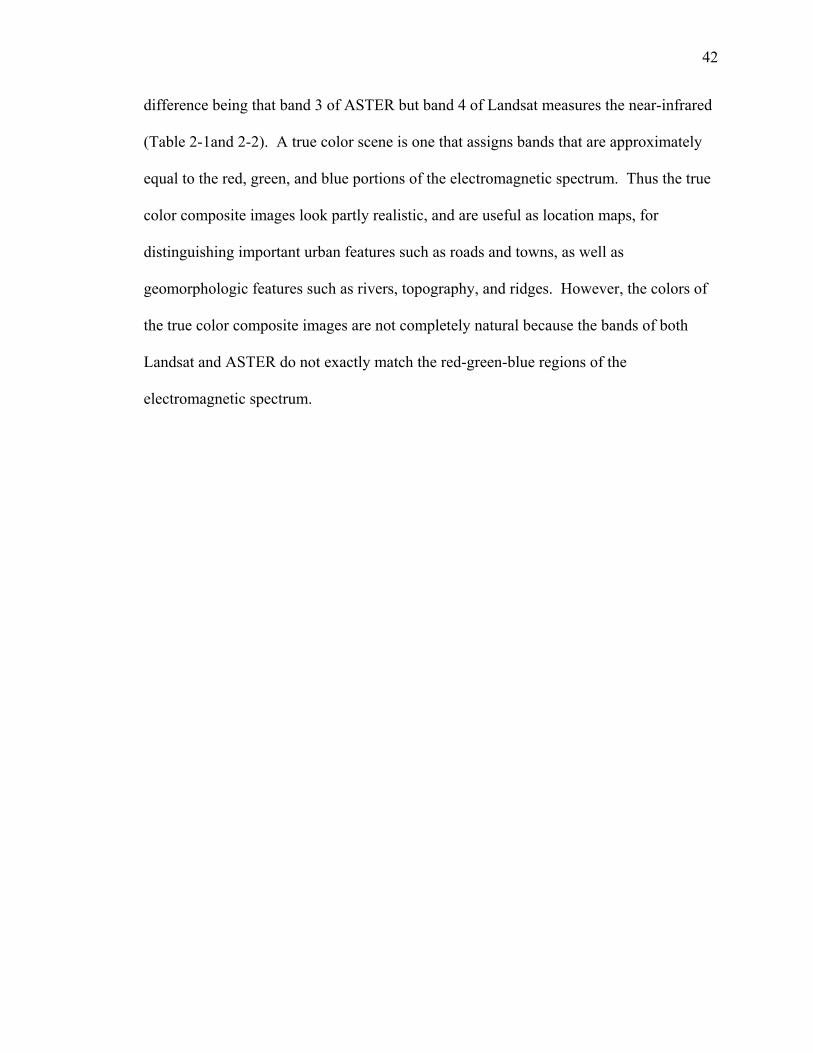
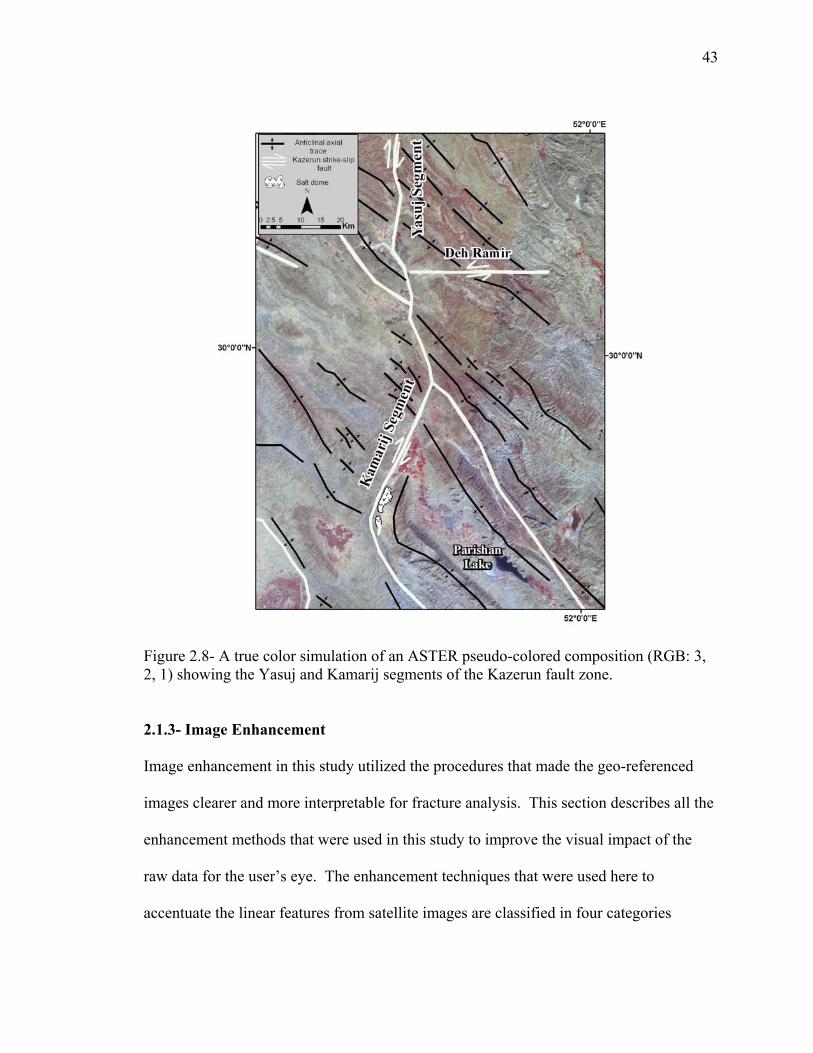
Figure 2.8- A true color simulation of an ASTER pseudo-colored composition (RGB: 3, 2, 1) showing the Yasuj and Kamarij segments of the Kazerun fault zone. 2.1.3- Image Enhancement
Image enhancement in this study utilized the procedures that made the geo-referenced
images clearer and more interpretable for fracture analysis. This section describes all the
enhancement methods that were used in this study to improve the visual impact of the
raw data for the user’s eye. The enhancement techniques that were used here to
accentuate the linear features from satellite images are classified in four categories

44
(described in detail in the following sections): (1) Contrast Enhancement or Radiometric
Enhancement (e.g., Contrast Stretching, and Histogram-Equalized Stretching); (2) Spatial
Enhancement (e.g., Image Inversion, Edge Enhancement, High-Pass Filters, Texture
Analysis, Speckle Reduction for Radar Image); (3) Multi-band Operations or Spectral
Enhancement (e.g., Principal Component Analysis, Band ratios, Image Fusion); (4)
Image Classification (e.g., Unsupervised Classification).
2.1.3.1- Contrast Enhancement or Radiometric Enhancement
This type of enhancement transforms and manipulates the raw digital image on each
individual value of the pixels in the image. The contrast enhancement, also called global
enhancement, increases the contrast ratio on an image (Figure 2-9). One of the major
causes of low contrast in satellite images is scattering of the EM wave by objects and
gases in the atmosphere. Thus this technique can also be used to minimize the effect of
haze. In a black and white image, our eye can distinguish 30 shades of gray. However,
the computer monitor is capable of displaying 256 gray levels (Drury, 2001). Thus the
energy expressed as digital number (DN) of satellite images, can vary in intensity from 0
(black) to 225 (maximum brightness) and reveal more information from an image
(Lillesand and Kiefer, 2000).
2.1.3.1.1- Contrast Stretching
The contrast stretch is linear and the simplest type of contrast enhancements. After the
histogram is calculated, a minimum DN value that belongs to the low end of the
histogram is set to 0 (extreme black), and the maximum DN value that belongs to the
high end of it, is assigned to 255 (extreme white) (Figure2-9). In other words, the image
is stretched so that the DN values range from 0 to 255. This way the range of data is
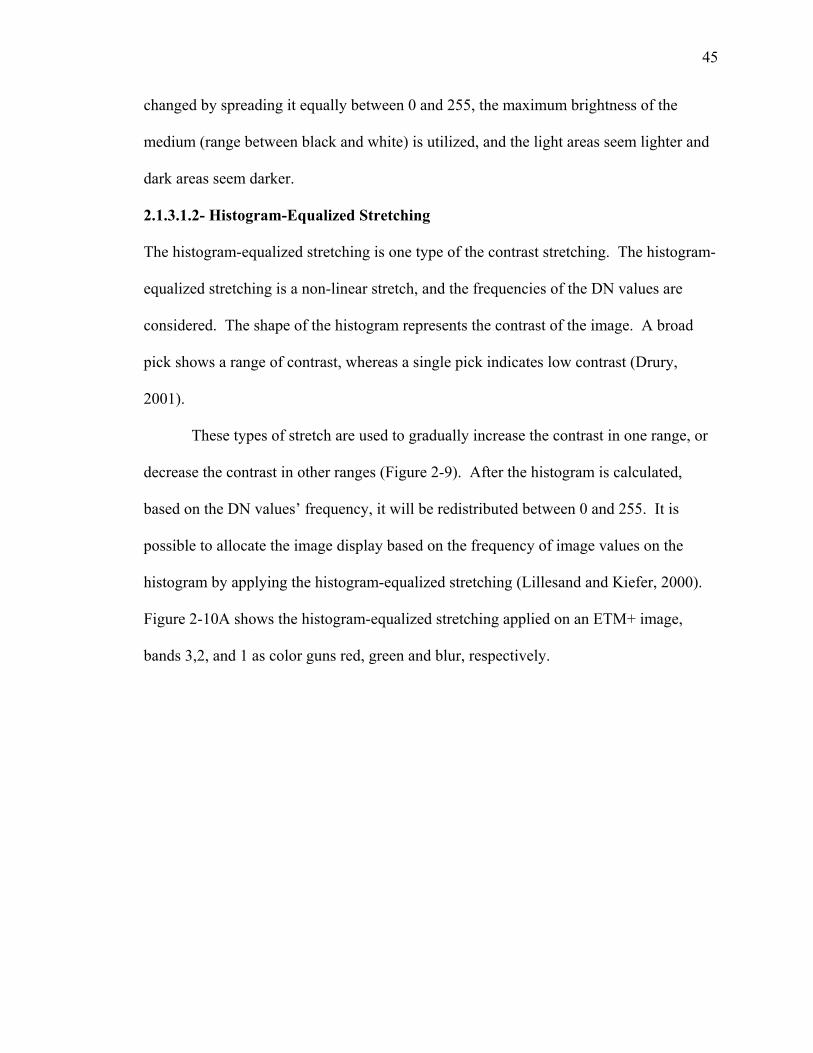
45
changed by spreading it equally between 0 and 255, the maximum brightness of the
medium (range between black and white) is utilized, and the light areas seem lighter and
dark areas seem darker.
2.1.3.1.2- Histogram-Equalized Stretching
The histogram-equalized stretching is one type of the contrast stretching. The histogram-
equalized stretching is a non-linear stretch, and the frequencies of the DN values are
considered. The shape of the histogram represents the contrast of the image. A broad
pick shows a range of contrast, whereas a single pick indicates low contrast (Drury,
2001).
These types of stretch are used to gradually increase the contrast in one range, or
decrease the contrast in other ranges (Figure 2-9). After the histogram is calculated,
based on the DN values’ frequency, it will be redistributed between 0 and 255. It is
possible to allocate the image display based on the frequency of image values on the
histogram by applying the histogram-equalized stretching (Lillesand and Kiefer, 2000).
Figure 2-10A shows the histogram-equalized stretching applied on an ETM+ image,
bands 3,2, and 1 as color guns red, green and blur, respectively.
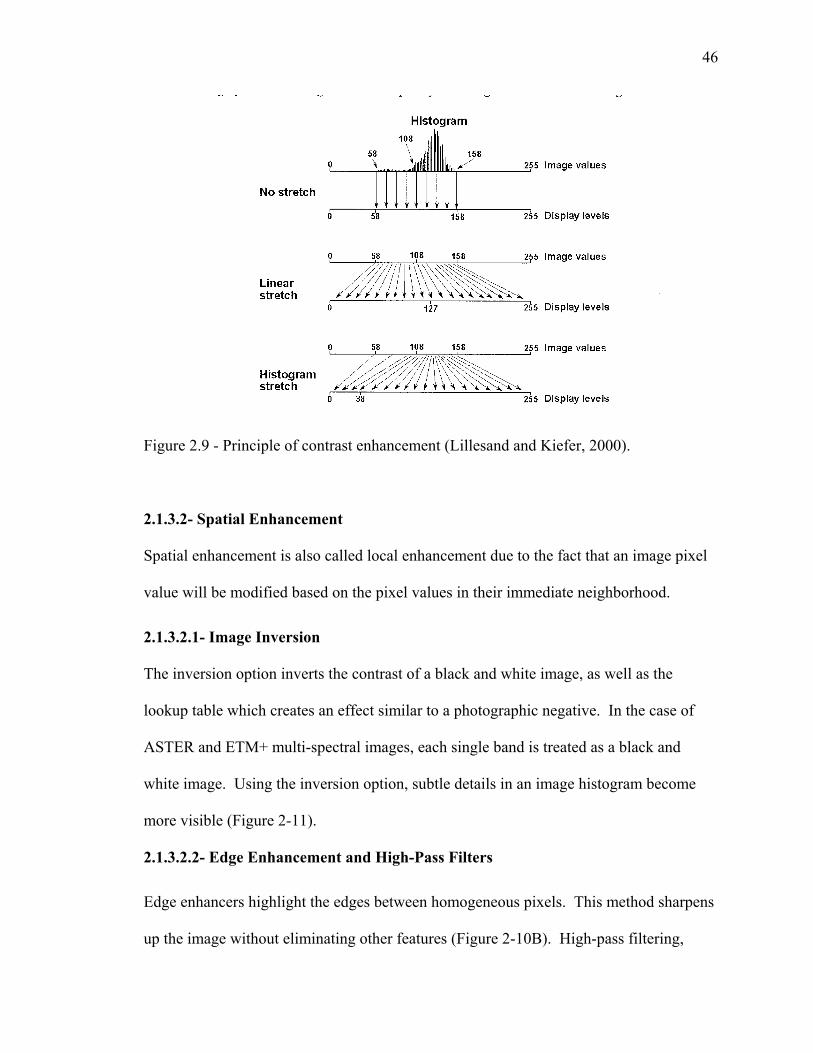
46
Figure 2.9 - Principle of contrast enhancement (Lillesand and Kiefer, 2000).
2.1.3.2- Spatial Enhancement
Spatial enhancement is also called local enhancement due to the fact that an image pixel
value will be modified based on the pixel values in their immediate neighborhood.
2.1.3.2.1- Image Inversion
The inversion option inverts the contrast of a black and white image, as well as the
lookup table which creates an effect similar to a photographic negative. In the case of
ASTER and ETM+ multi-spectral images, each single band is treated as a black and
white image. Using the inversion option, subtle details in an image histogram become
more visible (Figure 2-11).
2.1.3.2.2- Edge Enhancement and High-Pass Filters
Edge enhancers highlight the edges between homogeneous pixels. This method sharpens
up the image without eliminating other features (Figure 2-10B). High-pass filtering,
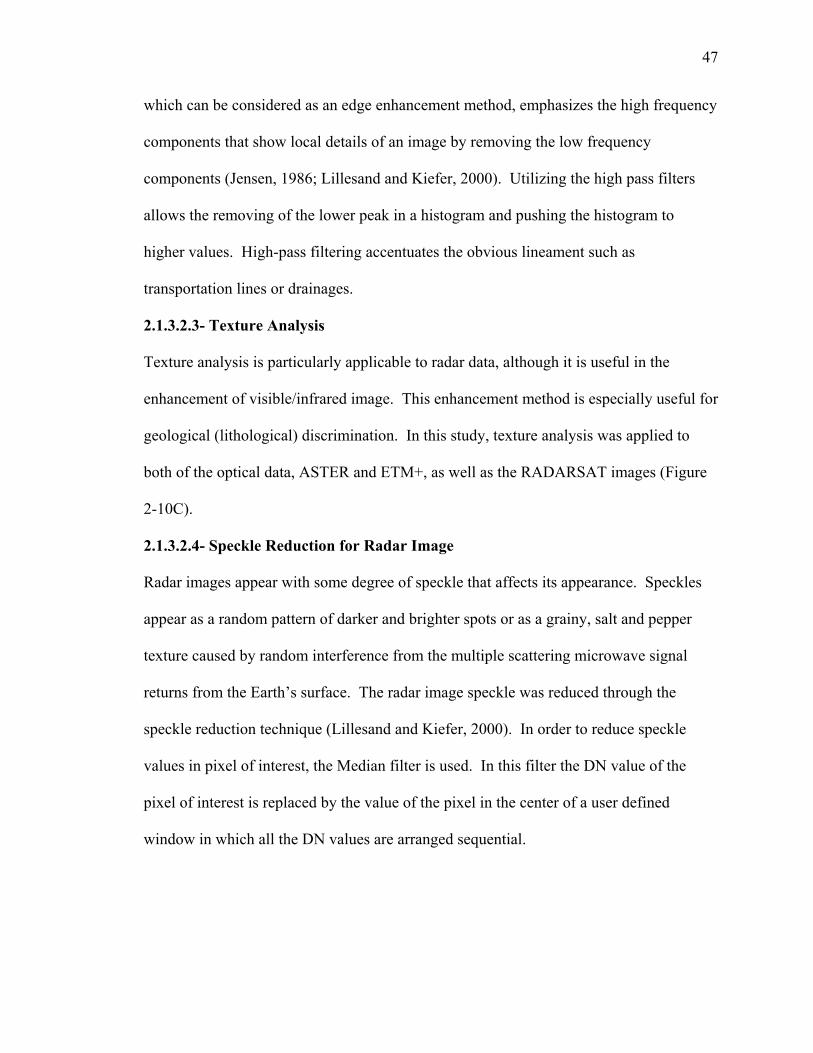
47
which can be considered as an edge enhancement method, emphasizes the high frequency
components that show local details of an image by removing the low frequency
components (Jensen, 1986; Lillesand and Kiefer, 2000). Utilizing the high pass filters
allows the removing of the lower peak in a histogram and pushing the histogram to
higher values. High-pass filtering accentuates the obvious lineament such as
transportation lines or drainages.
2.1.3.2.3- Texture Analysis
Texture analysis is particularly applicable to radar data, although it is useful in the
enhancement of visible/infrared image. This enhancement method is especially useful for
geological (lithological) discrimination. In this study, texture analysis was applied to
both of the optical data, ASTER and ETM+, as well as the RADARSAT images (Figure
2-10C).
2.1.3.2.4- Speckle Reduction for Radar Image
Radar images appear with some degree of speckle that affects its appearance. Speckles
appear as a random pattern of darker and brighter spots or as a grainy, salt and pepper
texture caused by random interference from the multiple scattering microwave signal
returns from the Earth’s surface. The radar image speckle was reduced through the
speckle reduction technique (Lillesand and Kiefer, 2000). In order to reduce speckle
values in pixel of interest, the Median filter is used. In this filter the DN value of the
pixel of interest is replaced by the value of the pixel in the center of a user defined
window in which all the DN values are arranged sequential.
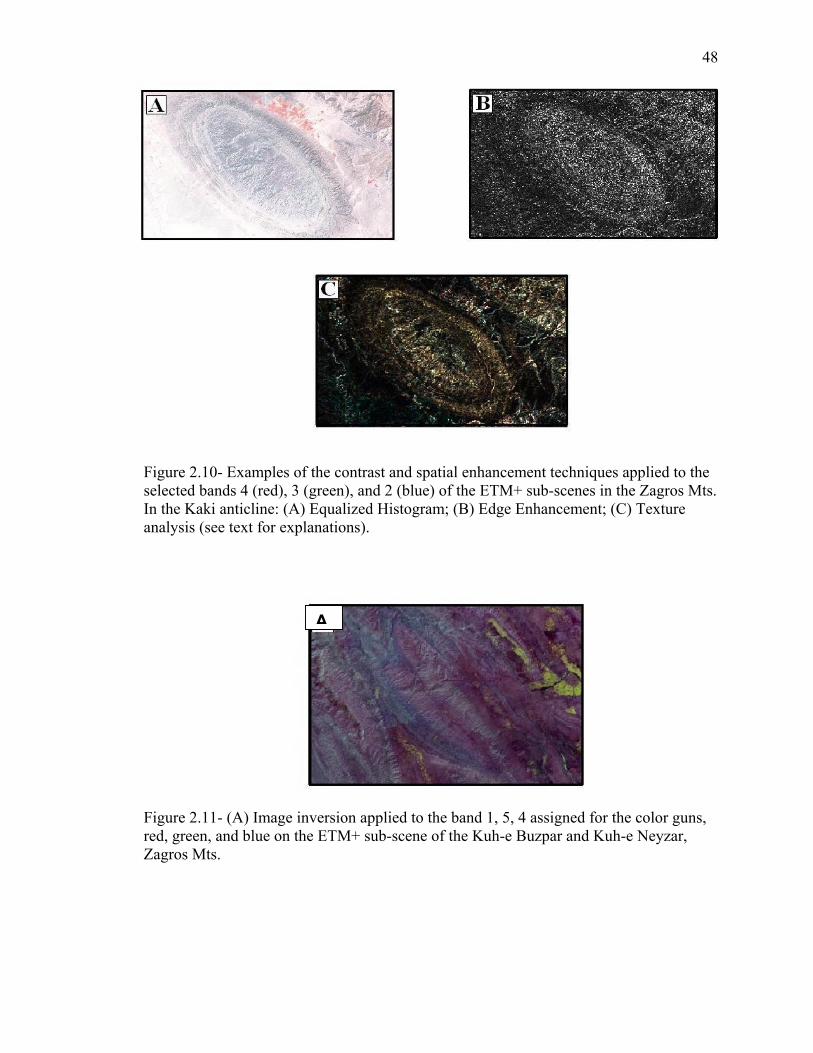
48
Figure 2.10- Examples of the contrast and spatial enhancement techniques applied to the selected bands 4 (red), 3 (green), and 2 (blue) of the ETM+ sub-scenes in the Zagros Mts. In the Kaki anticline: (A) Equalized Histogram; (B) Edge Enhancement; (C) Texture analysis (see text for explanations).
Figure 2.11- (A) Image inversion applied to the band 1, 5, 4 assigned for the color guns, red, green, and blue on the ETM+ sub-scene of the Kuh-e Buzpar and Kuh-e Neyzar, Zagros Mts.
A
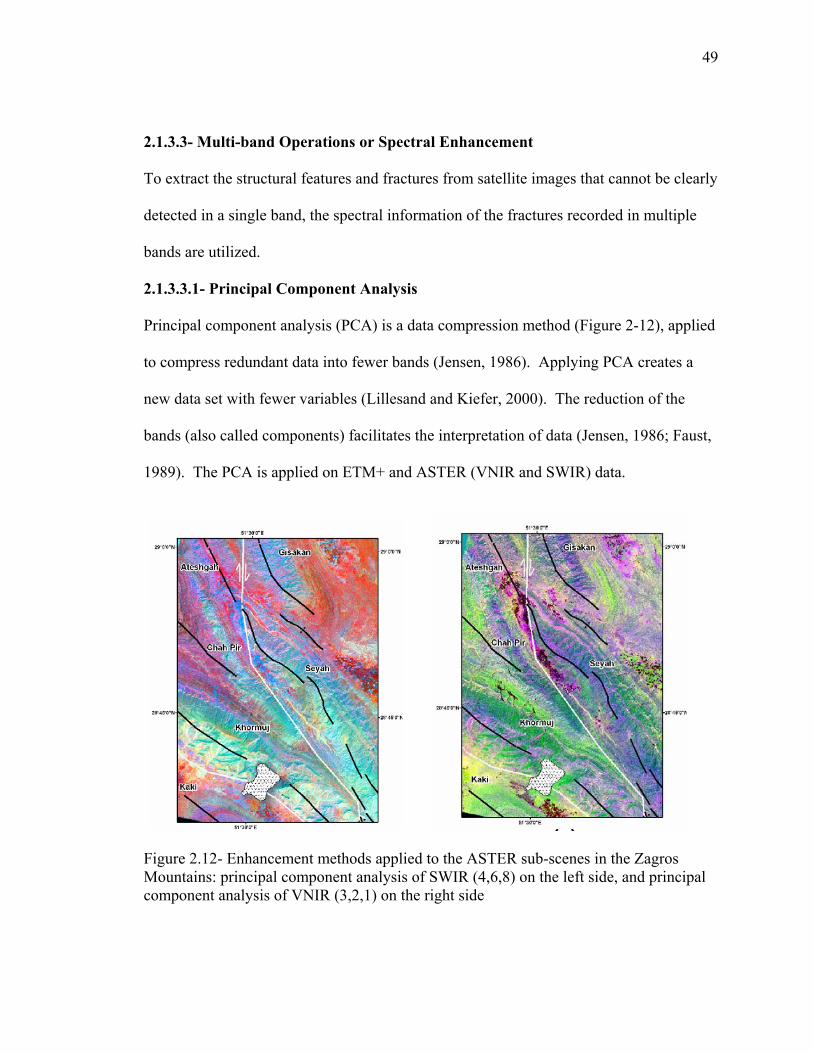
49
2.1.3.3- Multi-band Operations or Spectral Enhancement
To extract the structural features and fractures from satellite images that cannot be clearly
detected in a single band, the spectral information of the fractures recorded in multiple
bands are utilized.
2.1.3.3.1- Principal Component Analysis
Principal component analysis (PCA) is a data compression method (Figure 2-12), applied
to compress redundant data into fewer bands (Jensen, 1986). Applying PCA creates a
new data set with fewer variables (Lillesand and Kiefer, 2000). The reduction of the
bands (also called components) facilitates the interpretation of data (Jensen, 1986; Faust,
1989). The PCA is applied on ETM+ and ASTER (VNIR and SWIR) data.
Figure 2.12- Enhancement methods applied to the ASTER sub-scenes in the Zagros Mountains: principal component analysis of SWIR (4,6,8) on the left side, and principal component analysis of VNIR (3,2,1) on the right side
50
2.1.3.3.2- Image Fusion
There are many methods for data integration (Bretschneider and Kao, 2000). Image
fusion is one of the data integration methods and is the process of combining different
images. This method is used to obtain a high-resolution multi spectral image from a
lower spatial resolution (but higher spectral resolution) multi-spectral image is combined
with a higher spatial resolution (and lower spectral resolution) panchromatic image. In
this study, RADARSAT-1 (microwave) data were digitally fused with ASTER (optic)
images to combine the reflectance data from the ASTER image and the textural data from
the RADARSAT-1 image into a new set of data. RADARSAT shows surface roughness
and accentuates the terrain features, whereas ASTER retains most of its multispectral
information and shows reflectance which is controlled by chemistry. For data fusion, the
Color Normalized (CN) spectral sharpening technique was used (IDL, 2005). There is
mismatch in spectral data of two ASTER and RADARSAT data due to differences of
sensor platform altitude, date of imaging, atmospheric path and solar irradiance
conditions. The CN Spectral Sharpening enables correction for the mismatch (Gorin,
2004). The CN Spectral Sharpening is used here on the relatively low resolution ASTER
image. The result of this technique is the enhancement of the ASTER data based on the
high-resolution RADARSAT image. The final image, produced with this technique,
preserved the spectral information form ASTER, and incorporated the topography of
RADARSAT-1 (Figure 2-13). Both data sets were geo-referenced and resampled to a
15m resolution.
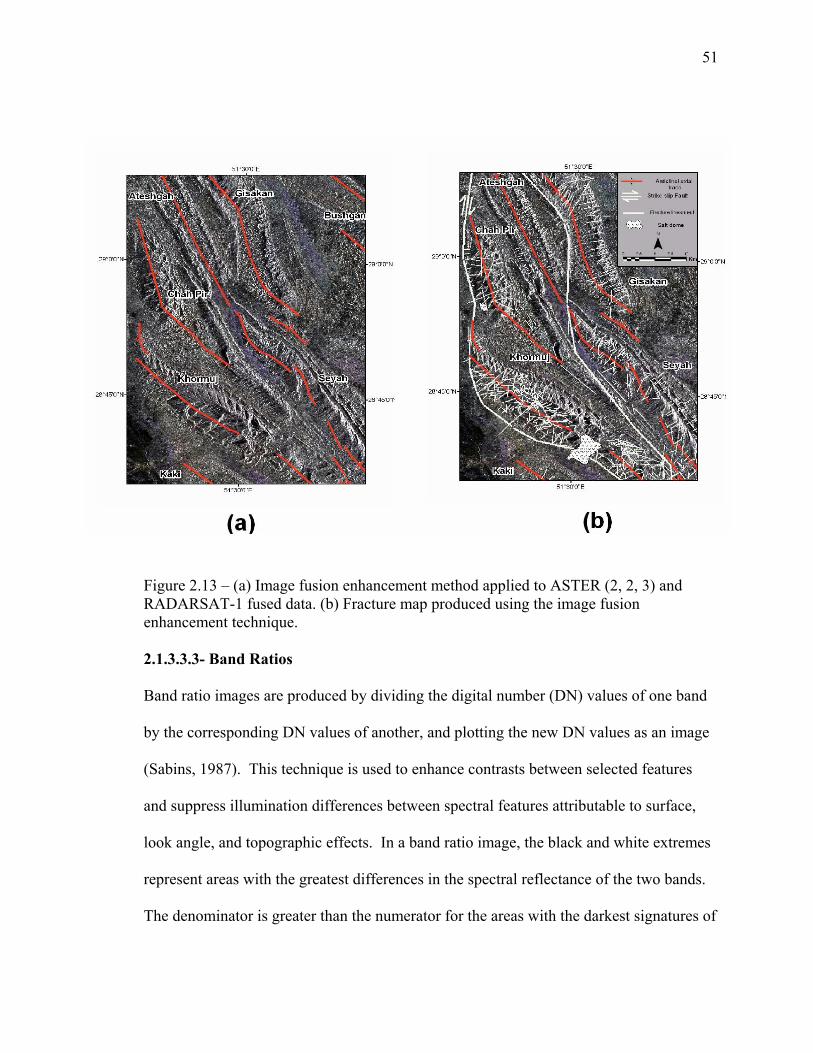
51
Figure 2.13 – (a) Image fusion enhancement method applied to ASTER (2, 2, 3) and RADARSAT-1 fused data. (b) Fracture map produced using the image fusion enhancement technique. 2.1.3.3.3- Band Ratios
Band ratio images are produced by dividing the digital number (DN) values of one band
by the corresponding DN values of another, and plotting the new DN values as an image
(Sabins, 1987). This technique is used to enhance contrasts between selected features
and suppress illumination differences between spectral features attributable to surface,
look angle, and topographic effects. In a band ratio image, the black and white extremes
represent areas with the greatest differences in the spectral reflectance of the two bands.
The denominator is greater than the numerator for the areas with the darkest signatures of
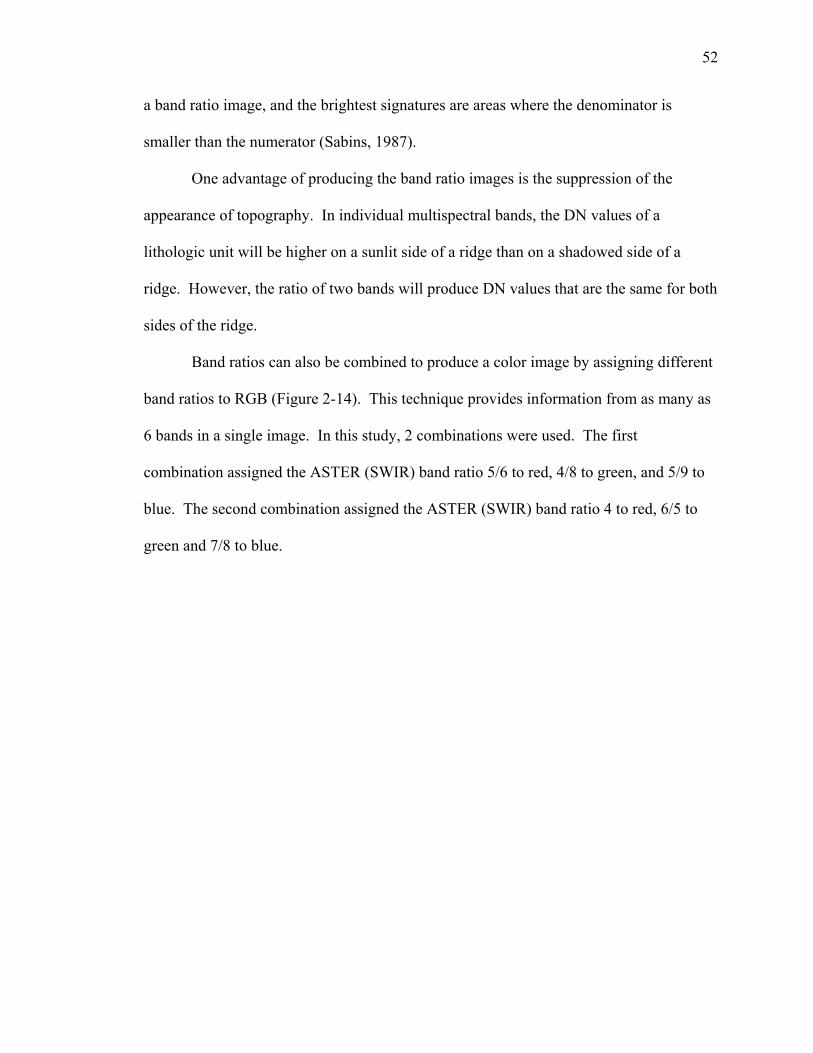
52
a band ratio image, and the brightest signatures are areas where the denominator is
smaller than the numerator (Sabins, 1987).
One advantage of producing the band ratio images is the suppression of the
appearance of topography. In individual multispectral bands, the DN values of a
lithologic unit will be higher on a sunlit side of a ridge than on a shadowed side of a
ridge. However, the ratio of two bands will produce DN values that are the same for both
sides of the ridge.
Band ratios can also be combined to produce a color image by assigning different
band ratios to RGB (Figure 2-14). This technique provides information from as many as
6 bands in a single image. In this study, 2 combinations were used. The first
combination assigned the ASTER (SWIR) band ratio 5/6 to red, 4/8 to green, and 5/9 to
blue. The second combination assigned the ASTER (SWIR) band ratio 4 to red, 6/5 to
green and 7/8 to blue.
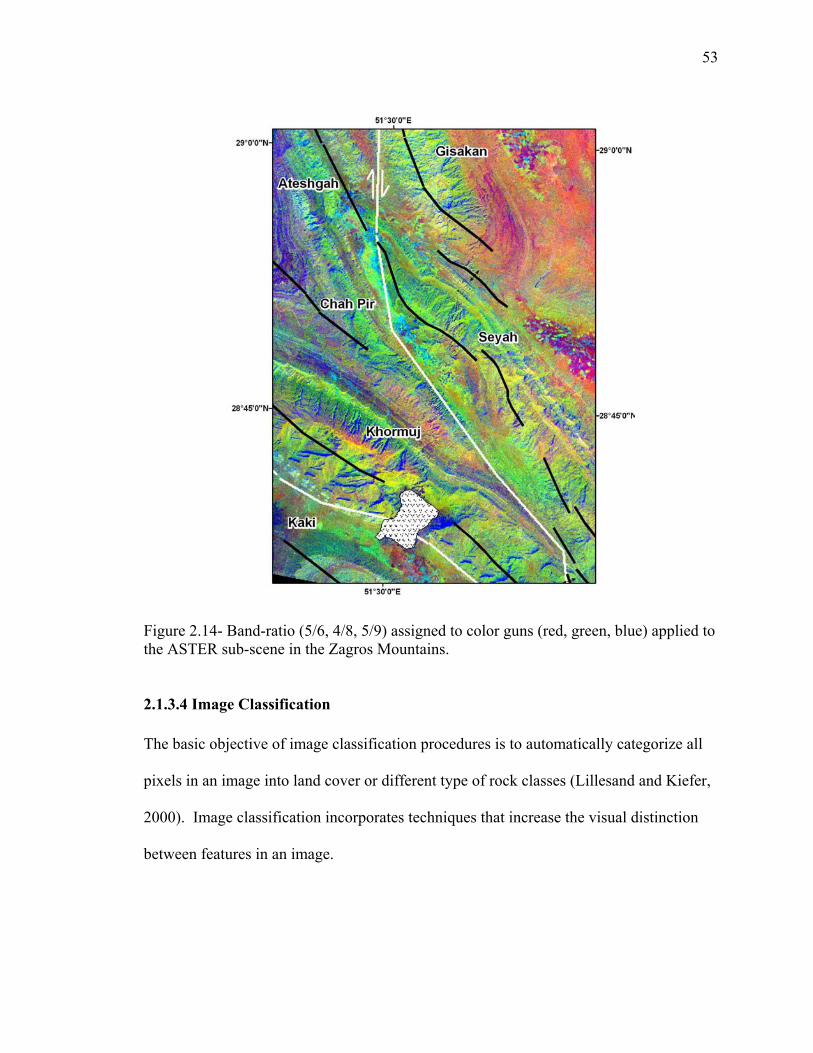
53
Figure 2.14- Band-ratio (5/6, 4/8, 5/9) assigned to color guns (red, green, blue) applied to the ASTER sub-scene in the Zagros Mountains. 2.1.3.4 Image Classification The basic objective of image classification procedures is to automatically categorize all
pixels in an image into land cover or different type of rock classes (Lillesand and Kiefer,
2000). Image classification incorporates techniques that increase the visual distinction
between features in an image.
54
2.1.3.4.1- Unsupervised classification
Unsupervised classifiers do not utilize training data as the basis for classification. There
are algorithms that examine the unknown pixels in an image and aggregate them into a
number of classes. Data in different classes should be separated from each other in the
measurement space, whereas values within a group type should be close together
(Lillesand and Kiefer, 2000).
Unsupervised classification on the 3-2-1-combination ASTER image was applied
in this study. All pixels in the data set have been clustered into 20 and 50 classes,
respectively, but because they are classified only based on the natural groupings in the
image values, the characteristics of the spectral classes will not be known. Therefore the
classified data were compared with the geological map as the reference data. The twenty
classes were only useful for a preliminary study of the area, whereas the fifty classes
provide more details about different geologic units.
2.2- Fracture sampling and data processing
After the enhancement were applied, linear geomorphological features such as the
horizontal traces of fractures and faults, fold axial traces through points of maximum
curvature of lithostratigraphic contacts on geological maps, and straight segments of
drainage systems on topographic maps, were traced and digitized in a geographic
information system (GIS) database. The spatial data for these observed linear features
and fractures were stored as line shapefiles in different layers in the GIS. The various
types of fracture were identified based on contrasting color tonation or hue, textural
changes of the rocks in the images (Figure 2-15a), distinct displacement in the
sedimentary layers (Figure 2-15b), straight arrangements of water bodies (Figure 2-15c),
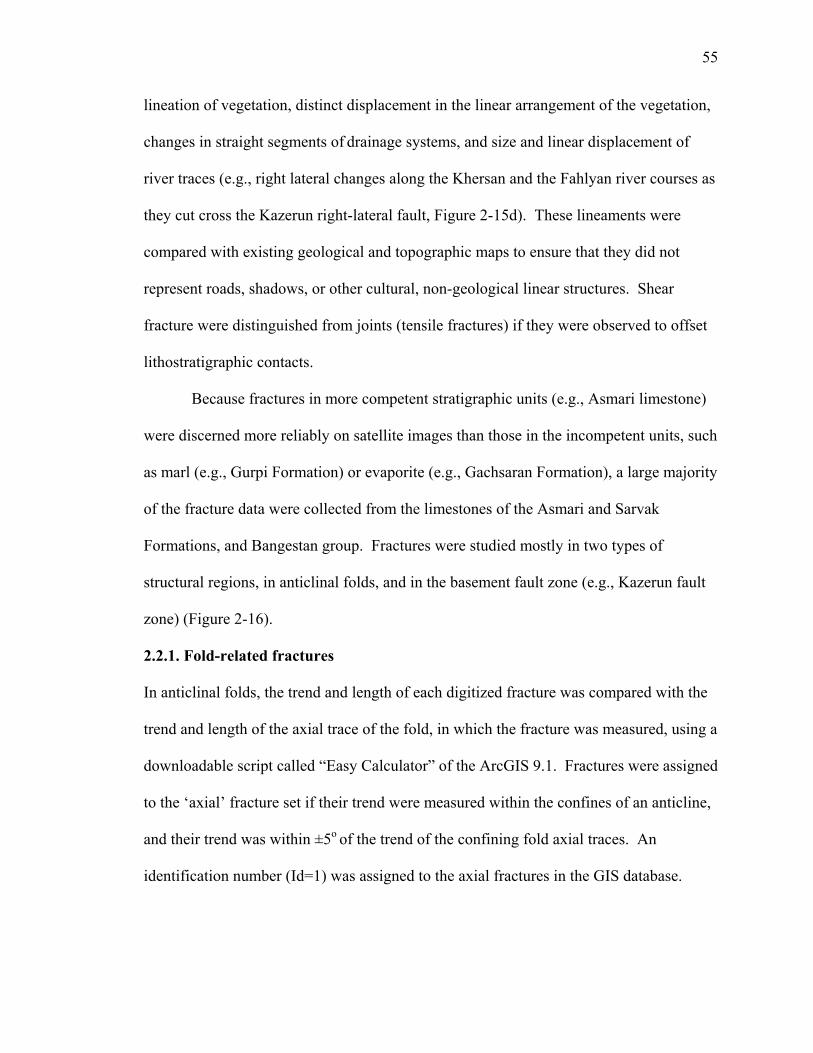
55
lineation of vegetation, distinct displacement in the linear arrangement of the vegetation,
changes in straight segments of drainage systems, and size and linear displacement of
river traces (e.g., right lateral changes along the Khersan and the Fahlyan river courses as
they cut cross the Kazerun right-lateral fault, Figure 2-15d). These lineaments were
compared with existing geological and topographic maps to ensure that they did not
represent roads, shadows, or other cultural, non-geological linear structures. Shear
fracture were distinguished from joints (tensile fractures) if they were observed to offset
lithostratigraphic contacts.
Because fractures in more competent stratigraphic units (e.g., Asmari limestone)
were discerned more reliably on satellite images than those in the incompetent units, such
as marl (e.g., Gurpi Formation) or evaporite (e.g., Gachsaran Formation), a large majority
of the fracture data were collected from the limestones of the Asmari and Sarvak
Formations, and Bangestan group. Fractures were studied mostly in two types of
structural regions, in anticlinal folds, and in the basement fault zone (e.g., Kazerun fault
zone) (Figure 2-16).
2.2.1. Fold-related fractures
In anticlinal folds, the trend and length of each digitized fracture was compared with the
trend and length of the axial trace of the fold, in which the fracture was measured, using a
downloadable script called “Easy Calculator” of the ArcGIS 9.1. Fractures were assigned
to the ‘axial’ fracture set if their trend were measured within the confines of an anticline,
and their trend was within ±5o of the trend of the confining fold axial traces. An
identification number (Id=1) was assigned to the axial fractures in the GIS database.
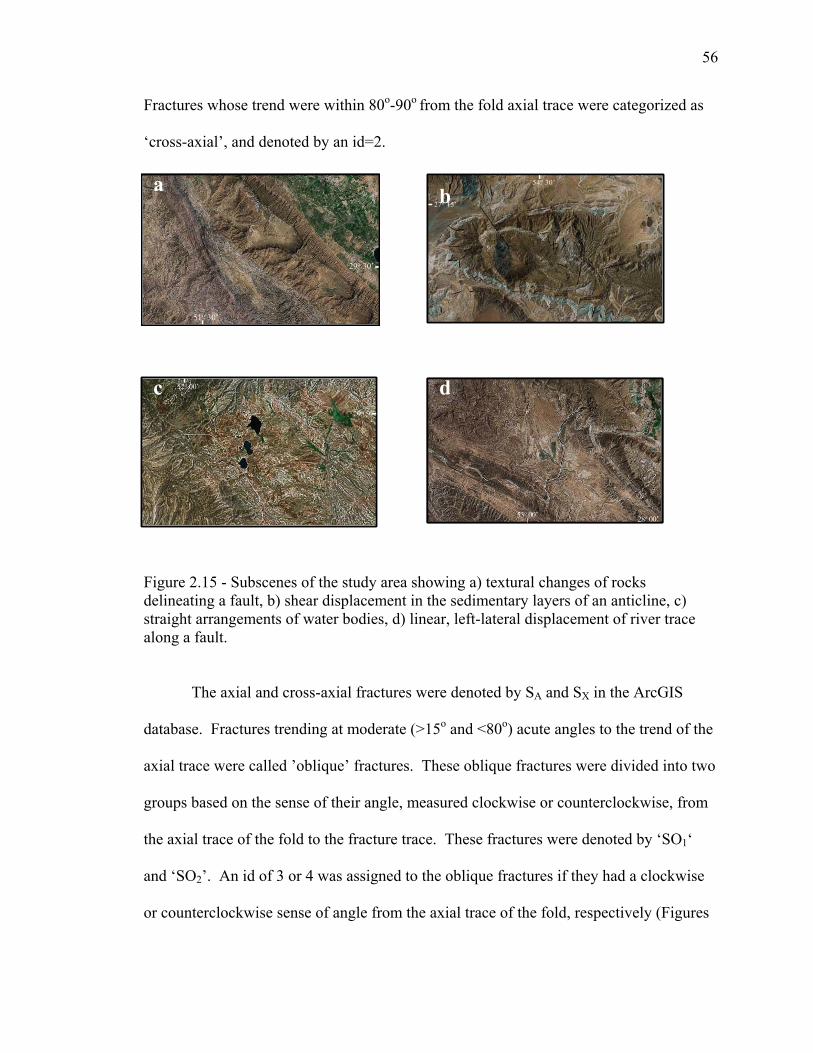
56
Fractures whose trend were within 80o-90o from the fold axial trace were categorized as
‘cross-axial’, and denoted by an id=2.
Figure 2.15 - Subscenes of the study area showing a) textural changes of rocks delineating a fault, b) shear displacement in the sedimentary layers of an anticline, c) straight arrangements of water bodies, d) linear, left-lateral displacement of river trace along a fault.
The axial and cross-axial fractures were denoted by SA and SX in the ArcGIS
database. Fractures trending at moderate (>15o and <80o) acute angles to the trend of the
axial trace were called ’oblique’ fractures. These oblique fractures were divided into two
groups based on the sense of their angle, measured clockwise or counterclockwise, from
the axial trace of the fold to the fracture trace. These fractures were denoted by ‘SO1‘
and ‘SO2’. An id of 3 or 4 was assigned to the oblique fractures if they had a clockwise
or counterclockwise sense of angle from the axial trace of the fold, respectively (Figures
54o 30’
27o 15’
54o 30’
27o 15’
51o 30’
29o 30’
51o 30’
29o 30’
29o 50’
52o 00’
29o 50’
52o 00’
53o 00’ 28o 00’53o 00’ 28o 00’
a
c d
b
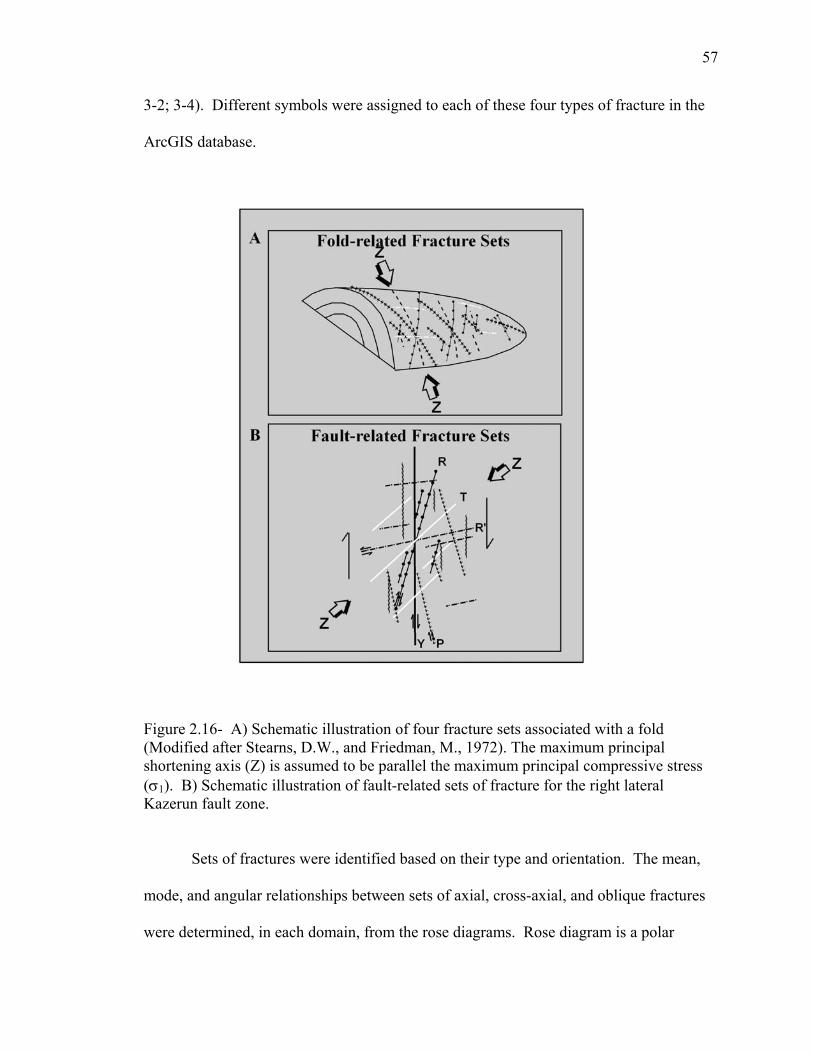
57
3-2; 3-4). Different symbols were assigned to each of these four types of fracture in the
ArcGIS database.
Figure 2.16- A) Schematic illustration of four fracture sets associated with a fold (Modified after Stearns, D.W., and Friedman, M., 1972). The maximum principal shortening axis (Z) is assumed to be parallel the maximum principal compressive stress (σ1). B) Schematic illustration of fault-related sets of fracture for the right lateral Kazerun fault zone.
Sets of fractures were identified based on their type and orientation. The mean,
mode, and angular relationships between sets of axial, cross-axial, and oblique fractures
were determined, in each domain, from the rose diagrams. Rose diagram is a polar
58
histogram which help to visualize the number of fractures with their orientations plotted
within a range (Van Der Pluijm and Marshak, 2004). The angles between sets of
fractures, along with the type of the fractures (tensile vs. shear) belonging to each set,
were examined for any apparent symmetry and relationship to the axial trace of the
containing fold. Tensile fractures do not show any displacement or offset of
lithostratigraphic contacts, where as shear fractures show offset of lithostratigraphic
contacts. Tensile fractures are usually filled with alluvium. If the angular relationships
between the shear and tensile fractures and the fold axial trace were consistent with the
angles detected during experimental deformation of rocks (e.g., Twiss and Moores,
1992), the angles were used to determine the direction of shortening (the minimum
principal strain, Z) for folding and fracturing.
2.2.2. Fault-related fractures
Fault-related fractures are sets of fractures that form subsidiary to a fault-zone to
accommodate motion along the main fault. In the Kazerun strike-slip fault zone, an array
of subsidiary faults, known as Riedel, Y and P-shears develops. A subsidiary fault is said
to have a synthetic or antithetic sense if it has the same or opposite sense of shear as its
main fault. The Riedel shears are short shear fractures that form first, at an angle to the
trace of the fault. The shear fractures, in the Kazerun fault zone, whose trends made an
angle between 15o-20o to the trace of the main Kazerun basement fault were classified as
the synthetic Riedel R-shear fractures. The shear fractures, in the fault zone, whose trend
made an angle of 65o-70o to the fault trace were classified as the antithetic Riedel R’
shear fractures (Riedel, 1929; Price and Cosgrove, 1990). As shear continues, the third
sets of fractures develop. These fractures were assigned to the P-shear set if they were
59
synthetic, and made angles smaller than 20o to the Kazerun fault trace (Figure 3-11). Y-
shear fractures were defined if they were synthetic and parallel (±3o) to the trace of the
main Kazerun fault. Y-shear fractures accommodate the main displacement in the fault
zone. Tensile fractures were assigned to the T-fractures if no offset of lithostratigraphic
contacts were observed along them. T-tensile fractures bisect the acute angle between
conjugate Riedel (R and R’) shear fractures and reflect the shortening direction.
2.2.3. Fractures in fold structures deformed in the fault zone
The Kazerun fault deforms several large-scale fold structures in the study area. The
deformation has led to: (i) the rigid body rotation of the fold limbs and the original fold-
related fractures (axial, cross-axial, and two oblique sets) in the fault zone, and (ii)
formation of fault-related fracture sets both within the boundaries of the folds and around
them, in the fault zone. The fault-related fractures that occur within the fold were
distinguished from the original rotated fold-related fractures by the angles that they
subtend relative to the axial trace of the folds. Fractures in the deflected part of the folds
with angles that matched those of the fault-related fracture system were assigned to R-
shear, R’-shear, P-shear, or Y-shear set (Figures 2-16).
Fractures measured inside the confines of folds, which were deformed in the fault
zone, were assigned to one of the fault-related R-, R’-, P-, or Y-shear sets if their
orientation (i) did not match any of the axial, cross-axial, or oblique sets, (ii) matched the
fault-related fractures outside of the fold.
The fractures that are digitized in the study area are those that had a good
exposure because of their occurrence in a competent lithology, commonly limestone
(Asmari and Sarvak Formation). Evaporites such as Gachsaran Formation provide poor
60
exposures, and hence do not clearly reveal fractures on the satellite images, rendering
them unsuitable for fracture analysis.
2.3- Domain Boundaries
The orientation and length of fractures, and position of the two ends of their traces were
determined in several structural domains. Structural domains were defined as areas
within which the measured linear elements remained homogeneous in their orientation.
Domains were assigned through a trial and error process, in which the linear data, plotted
in rose diagrams, appeared as well-defined narrow modes, with the least amount of
scatter and standard deviation (Figure 2-17). These domains were defined from the
Oman line (east of the study area) to the more structurally complex Kazerun fault zone
(west of the study area). The orientation of fold-related fractures were measured and
stored in the GIS database. At first larger areas were chosen as different domains and the
mean and standard deviation were calculated for each one. The area was reduced until
the variation of standard deviations of the orientations of the linear features for each
domain ranged between ±5 and ±12 from the mean orientation of the anticlinal axial
traces for that domain.
There are also examples where the domain boundaries can be distinguished on
satellite images by specific features such as sharp rotation of fold axial traces, and
displacement of stratigraphical contacts showing the shear faults. Using the topographic
maps and DEMs, the drainage patterns were also digitized and stored in the GIS database.
The mean orientation of drainage patterns was comparable with the mean of the axial
trace of the folds in each domain suggesting that the trend of the straight drainage
patterns follow the fractures. The boundaries of the domains were further refined using
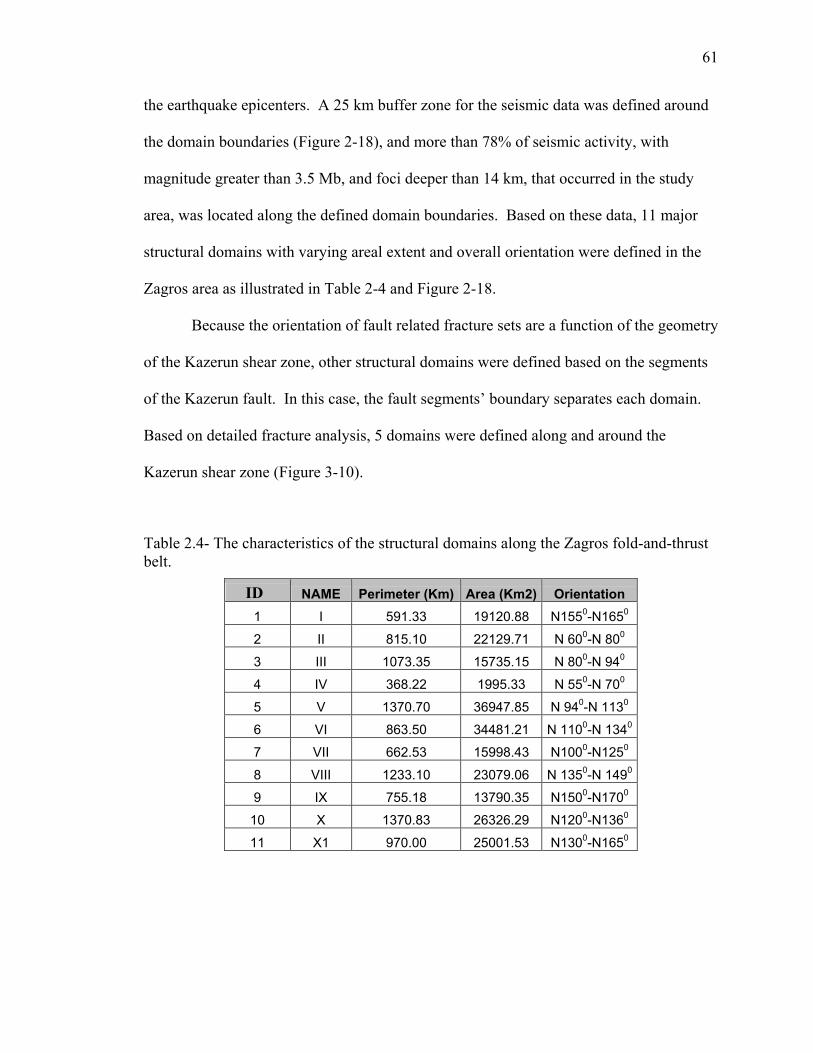
61
the earthquake epicenters. A 25 km buffer zone for the seismic data was defined around
the domain boundaries (Figure 2-18), and more than 78% of seismic activity, with
magnitude greater than 3.5 Mb, and foci deeper than 14 km, that occurred in the study
area, was located along the defined domain boundaries. Based on these data, 11 major
structural domains with varying areal extent and overall orientation were defined in the
Zagros area as illustrated in Table 2-4 and Figure 2-18.
Because the orientation of fault related fracture sets are a function of the geometry
of the Kazerun shear zone, other structural domains were defined based on the segments
of the Kazerun fault. In this case, the fault segments’ boundary separates each domain.
Based on detailed fracture analysis, 5 domains were defined along and around the
Kazerun shear zone (Figure 3-10).
Table 2.4- The characteristics of the structural domains along the Zagros fold-and-thrust belt.
ID NAME Perimeter (Km) Area (Km2) Orientation 1 I 591.33 19120.88 N1550-N1650
2 II 815.10 22129.71 N 600-N 800
3 III 1073.35 15735.15 N 800-N 940
4 IV 368.22 1995.33 N 550-N 700
5 V 1370.70 36947.85 N 940-N 1130
6 VI 863.50 34481.21 N 1100-N 1340
7 VII 662.53 15998.43 N1000-N1250
8 VIII 1233.10 23079.06 N 1350-N 1490
9 IX 755.18 13790.35 N1500-N1700
10 X 1370.83 26326.29 N1200-N1360
11 X1 970.00 25001.53 N1300-N1650
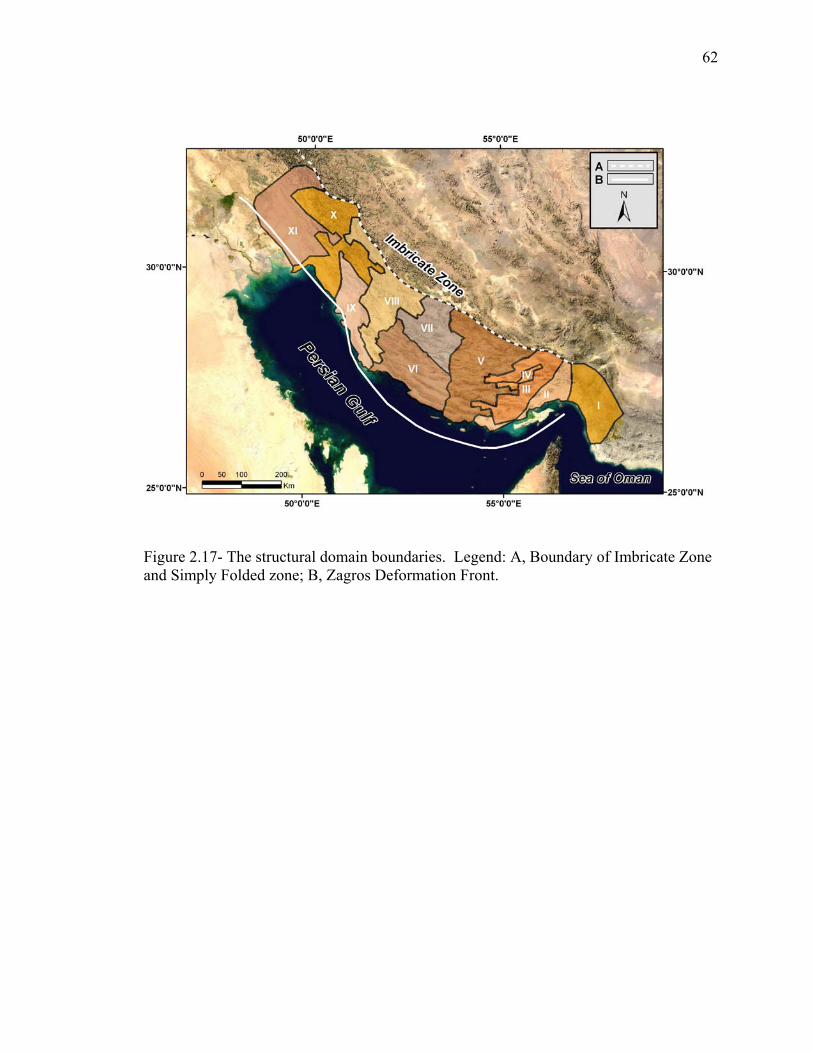
62
Figure 2.17- The structural domain boundaries. Legend: A, Boundary of Imbricate Zone and Simply Folded zone; B, Zagros Deformation Front.
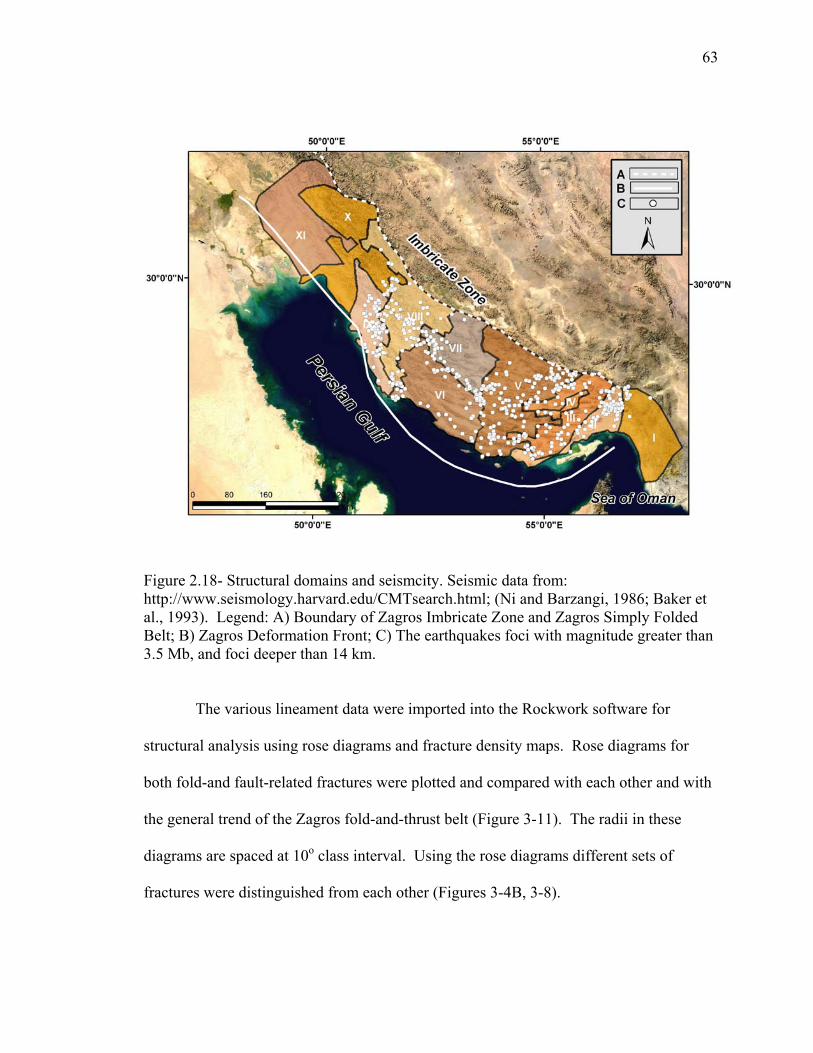
63
Figure 2.18- Structural domains and seismcity. Seismic data from: http://www.seismology.harvard.edu/CMTsearch.html; (Ni and Barzangi, 1986; Baker et al., 1993). Legend: A) Boundary of Zagros Imbricate Zone and Zagros Simply Folded Belt; B) Zagros Deformation Front; C) The earthquakes foci with magnitude greater than 3.5 Mb, and foci deeper than 14 km.
The various lineament data were imported into the Rockwork software for
structural analysis using rose diagrams and fracture density maps. Rose diagrams for
both fold-and fault-related fractures were plotted and compared with each other and with
the general trend of the Zagros fold-and-thrust belt (Figure 3-11). The radii in these
diagrams are spaced at 10o class interval. Using the rose diagrams different sets of
fractures were distinguished from each other (Figures 3-4B, 3-8).
64
3. STRUCTURAL ANALYSIS In this study, fractures that occur within the confines of anticlinal folds (i.e., intra- and
trans-fold fractures) have been analyzed separately from fault-related fractures that occur
in fault zones such as Kazerun. The structural data include the spatial distribution,
orientation, and length of individual fractures, and the statistical measures of each
fracture set. In this section, fracture data for the Kazerun fault zone and Zagros folds and
the general background information on the formation of fracture in strike-slip faults and
in folds are presented.
3.1- Results: Fold-related fractures
The deformation structures of the Zagros Range are dominated by elongated, doubly-
plunging, box-shaped folds extending to few tens of kilometers along the axial trace, and
blind, thrust faults beneath the folds (Berberian, 1995). Kashfi, (1983) based on
differences in fold structures divided the Zagros Range into two, NW and SE regions.
The anticlines in the SE region are symmetrical box-shaped folds, with steep limbs and
flat tops, and sliding of the strata over the Hormuz salt. In contrast, the folds in the NW
region are mainly asymmetric and flexural slip types, and are associated with thrust
faults. The study area is located in the SE region defined by Kashfi (1983), east of the
Kazerun fault, which he believes accommodates vertical movements of the basement
blocks via thick-skinned tectonics. Because of the vertical movements in this area, there
is a limited amount of shortening involved in these folds.
The anticlines are well-exposed and, in places, their cores are marked by salt
domes that have breached to the surface and eroded, whereas the synclines are buried by
younger, Quaternary alluvium. The anticlinal axial traces generally trend NW-SE, and
65
show a gradual but continuous regional variation in their orientation outside of the
Kazerun fault zone, and local rotation around the fault.
The folds selected for the analysis of the fold-related fractures in this study are
located between 27o 40’ N and 30o 30’N latitudes, and 51o 00’ E and 53o 00’ E longitudes.
Enhancements performed on the satellite images, especially the texture analysis on
RADARSAT image, histogram equalizer on ETM+ images, band ratio (5/6, 4/8, 5/9 and
4, 6/5, 7/8), hillshade map derived from the SRTM dataset, and 4,6,8 band combination
of SWIR and 1,3,2 band combination of VNIR of ASTER data, simplified the
identification of anticline folds (e.g., Figures 2-2, 2-3, 2-10A &C, 2-14).
Study of the anticlinal folds and their related fracture systems revealed the
presence of two general types of fracture: intra-fold and trans-fold fractures. An intra-
fold fracture has a length in the 102–104 m range, and is confined to the interior of fold
polygons. A trans-fold fracture, on the other hand, transects one or more fold polygons,
and has a length greater than 104 m.
About 2.75% of the fractures in the study area are of the trans-fold fracture type
(Figure 3-1). The frequency of the trans-fold fractures increases in the vicinity of the
structural domain boundaries (see below), and major fault zones (e.g., Kazerun fault
zone). Most of these trans-fold fractures strike between N-S and NE-SW. The N-S
fracture set parallels basement faults such as the Kazerun fault, and the NE-SW set is
perpendicular to the general trend of the trace of the anticlinal axial traces in the Zagros
Mountains.
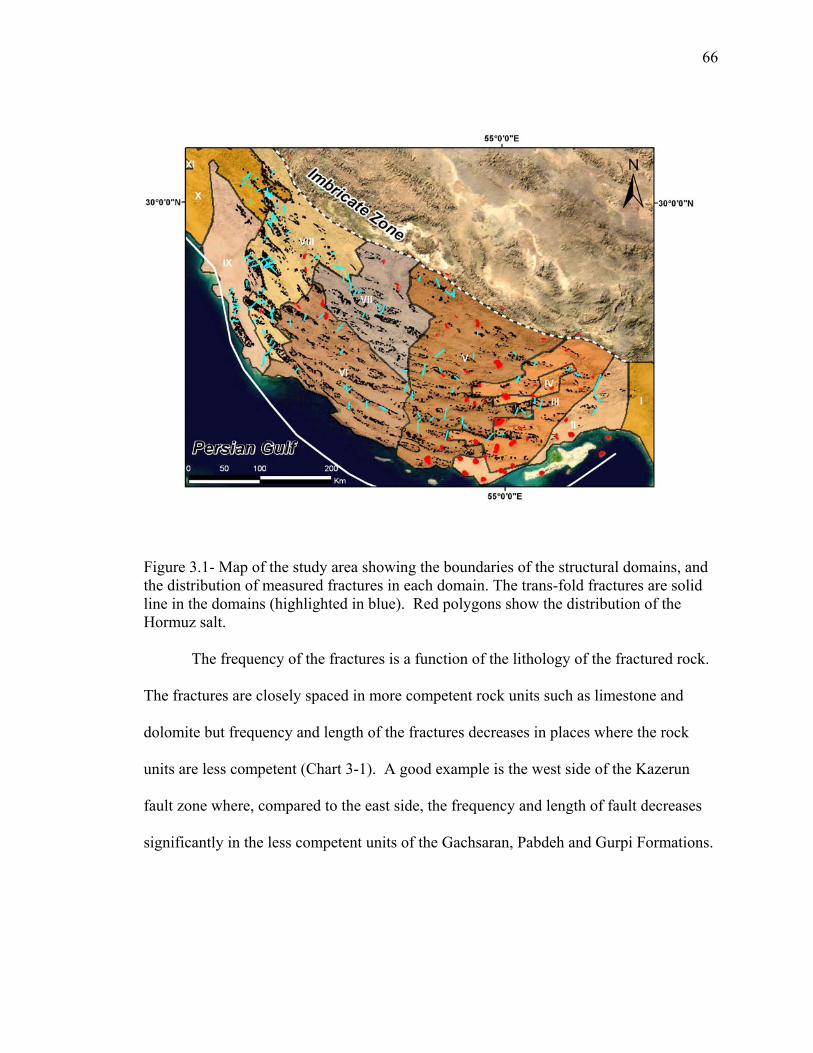
66
Figure 3.1- Map of the study area showing the boundaries of the structural domains, and the distribution of measured fractures in each domain. The trans-fold fractures are solid line in the domains (highlighted in blue). Red polygons show the distribution of the Hormuz salt.
The frequency of the fractures is a function of the lithology of the fractured rock.
The fractures are closely spaced in more competent rock units such as limestone and
dolomite but frequency and length of the fractures decreases in places where the rock
units are less competent (Chart 3-1). A good example is the west side of the Kazerun
fault zone where, compared to the east side, the frequency and length of fault decreases
significantly in the less competent units of the Gachsaran, Pabdeh and Gurpi Formations.
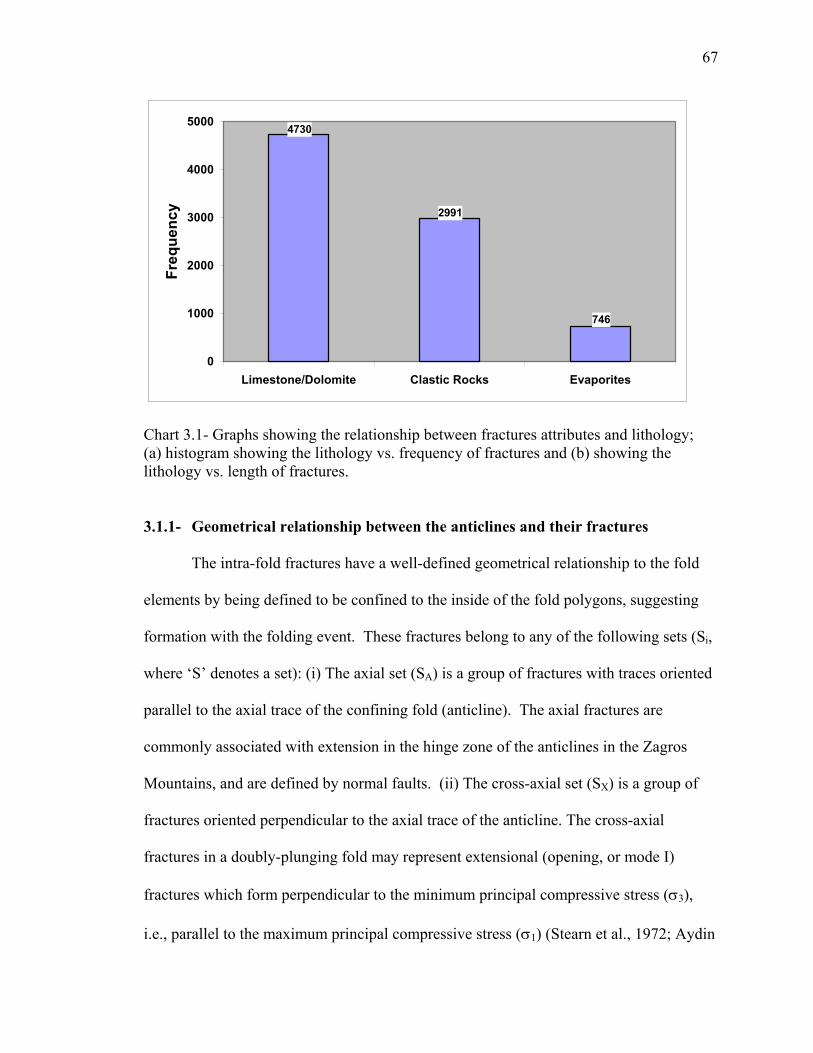
67
4730
2991
746
0
1000
2000
3000
4000
5000
Limestone/Dolomite Clastic Rocks Evaporites
Freq
uenc
y
Chart 3.1- Graphs showing the relationship between fractures attributes and lithology; (a) histogram showing the lithology vs. frequency of fractures and (b) showing the lithology vs. length of fractures.
3.1.1- Geometrical relationship between the anticlines and their fractures
The intra-fold fractures have a well-defined geometrical relationship to the fold
elements by being defined to be confined to the inside of the fold polygons, suggesting
formation with the folding event. These fractures belong to any of the following sets (Si,
where ‘S’ denotes a set): (i) The axial set (SA) is a group of fractures with traces oriented
parallel to the axial trace of the confining fold (anticline). The axial fractures are
commonly associated with extension in the hinge zone of the anticlines in the Zagros
Mountains, and are defined by normal faults. (ii) The cross-axial set (SX) is a group of
fractures oriented perpendicular to the axial trace of the anticline. The cross-axial
fractures in a doubly-plunging fold may represent extensional (opening, or mode I)
fractures which form perpendicular to the minimum principal compressive stress (σ3),
i.e., parallel to the maximum principal compressive stress (σ1) (Stearn et al., 1972; Aydin
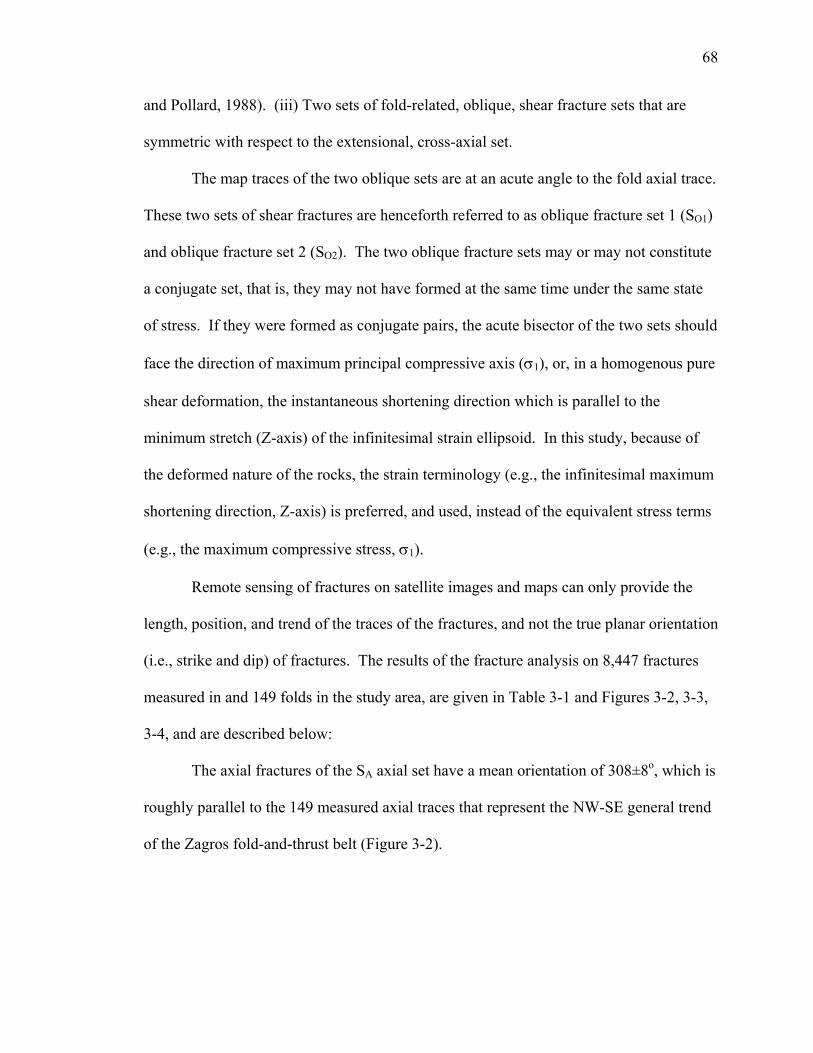
68
and Pollard, 1988). (iii) Two sets of fold-related, oblique, shear fracture sets that are
symmetric with respect to the extensional, cross-axial set.
The map traces of the two oblique sets are at an acute angle to the fold axial trace.
These two sets of shear fractures are henceforth referred to as oblique fracture set 1 (SO1)
and oblique fracture set 2 (SO2). The two oblique fracture sets may or may not constitute
a conjugate set, that is, they may not have formed at the same time under the same state
of stress. If they were formed as conjugate pairs, the acute bisector of the two sets should
face the direction of maximum principal compressive axis (σ1), or, in a homogenous pure
shear deformation, the instantaneous shortening direction which is parallel to the
minimum stretch (Z-axis) of the infinitesimal strain ellipsoid. In this study, because of
the deformed nature of the rocks, the strain terminology (e.g., the infinitesimal maximum
shortening direction, Z-axis) is preferred, and used, instead of the equivalent stress terms
(e.g., the maximum compressive stress, σ1).
Remote sensing of fractures on satellite images and maps can only provide the
length, position, and trend of the traces of the fractures, and not the true planar orientation
(i.e., strike and dip) of fractures. The results of the fracture analysis on 8,447 fractures
measured in and 149 folds in the study area, are given in Table 3-1 and Figures 3-2, 3-3,
3-4, and are described below:
The axial fractures of the SA axial set have a mean orientation of 308±8o, which is
roughly parallel to the 149 measured axial traces that represent the NW-SE general trend
of the Zagros fold-and-thrust belt (Figure 3-2).
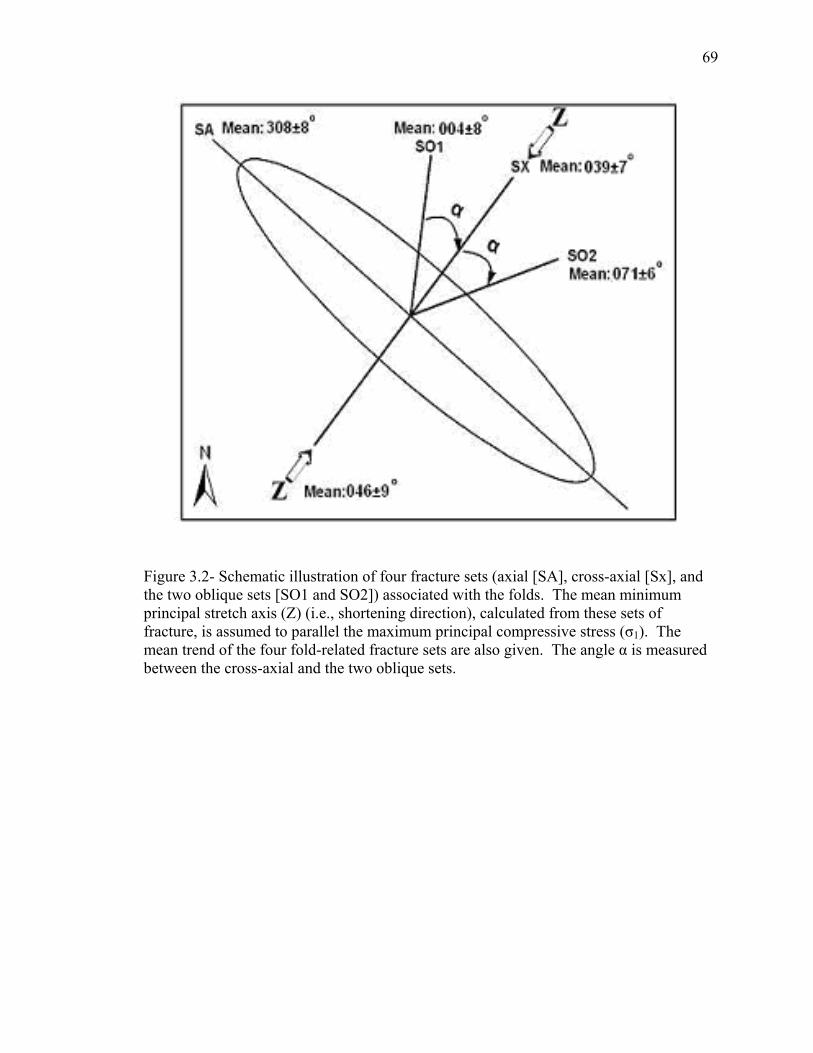
69
Figure 3.2- Schematic illustration of four fracture sets (axial [SA], cross-axial [Sx], and the two oblique sets [SO1 and SO2]) associated with the folds. The mean minimum principal stretch axis (Z) (i.e., shortening direction), calculated from these sets of fracture, is assumed to parallel the maximum principal compressive stress (σ1). The mean trend of the four fold-related fracture sets are also given. The angle α is measured between the cross-axial and the two oblique sets.
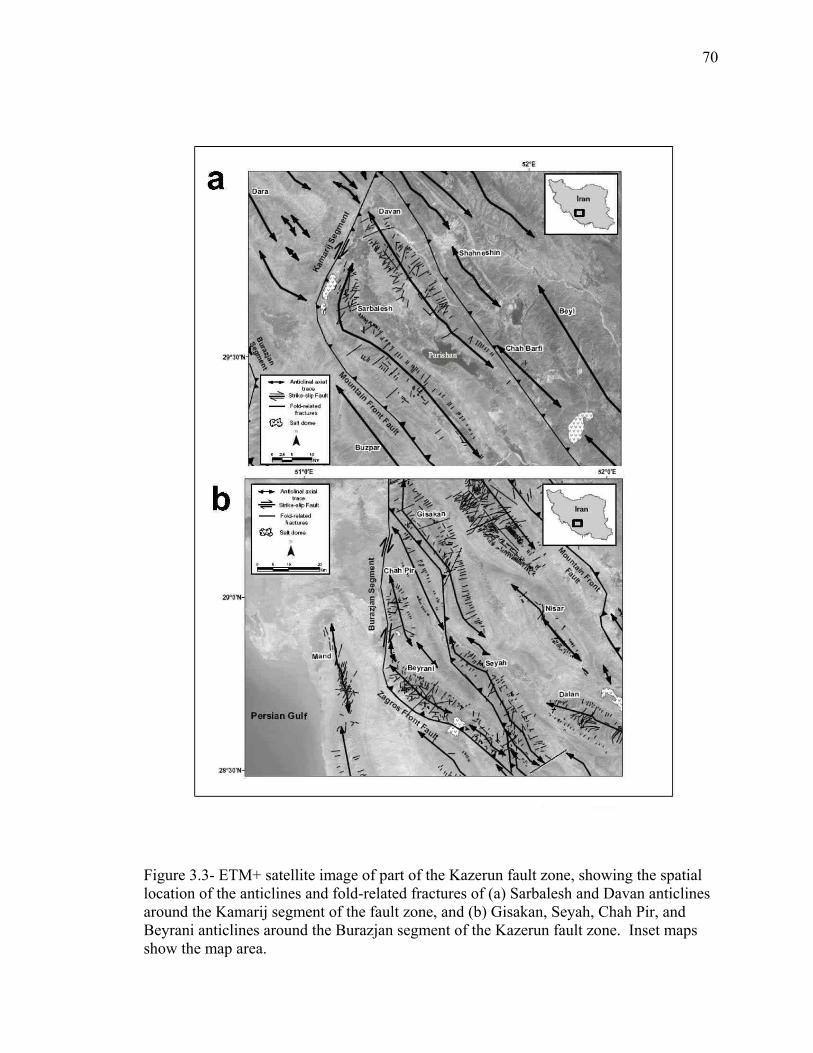
70
Figure 3.3- ETM+ satellite image of part of the Kazerun fault zone, showing the spatial location of the anticlines and fold-related fractures of (a) Sarbalesh and Davan anticlines around the Kamarij segment of the fault zone, and (b) Gisakan, Seyah, Chah Pir, and Beyrani anticlines around the Burazjan segment of the Kazerun fault zone. Inset maps show the map area.
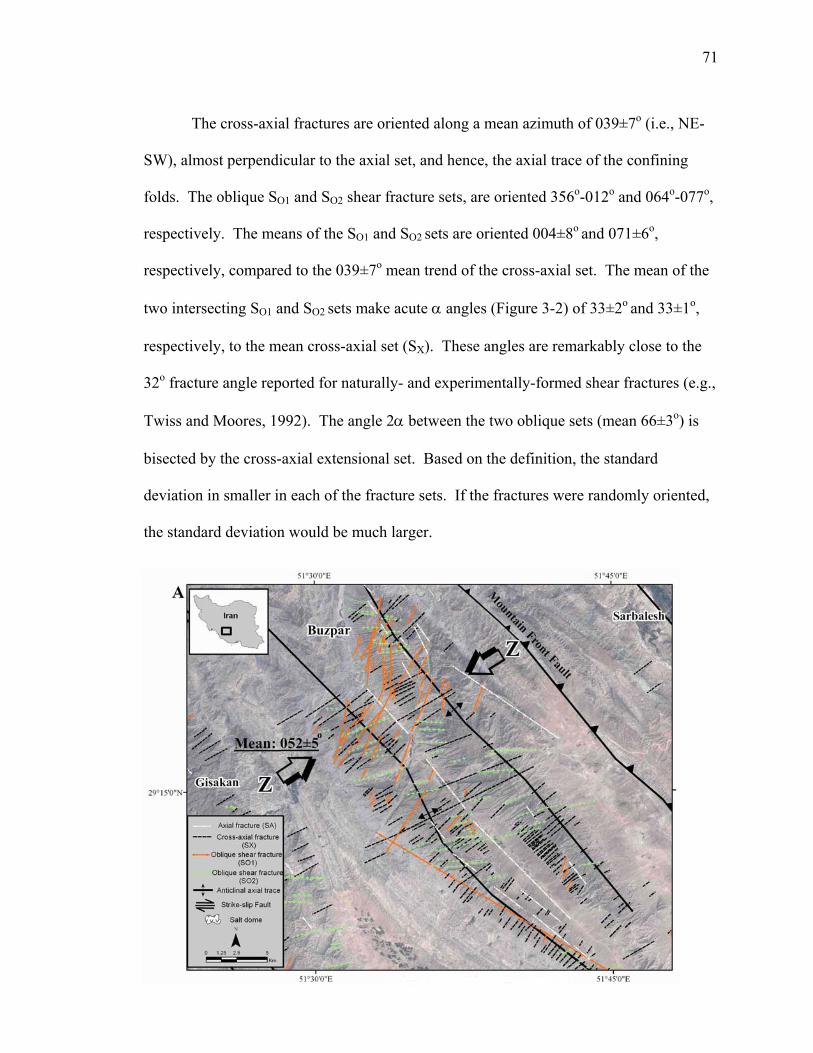
71
The cross-axial fractures are oriented along a mean azimuth of 039±7o (i.e., NE-
SW), almost perpendicular to the axial set, and hence, the axial trace of the confining
folds. The oblique SO1 and SO2 shear fracture sets, are oriented 356o-012o and 064o-077o,
respectively. The means of the SO1 and SO2 sets are oriented 004±8o and 071±6o,
respectively, compared to the 039±7o mean trend of the cross-axial set. The mean of the
two intersecting SO1 and SO2 sets make acute α angles (Figure 3-2) of 33±2o and 33±1o,
respectively, to the mean cross-axial set (SX). These angles are remarkably close to the
32o fracture angle reported for naturally- and experimentally-formed shear fractures (e.g.,
Twiss and Moores, 1992). The angle 2α between the two oblique sets (mean 66±3o) is
bisected by the cross-axial extensional set. Based on the definition, the standard
deviation in smaller in each of the fracture sets. If the fractures were randomly oriented,
the standard deviation would be much larger.
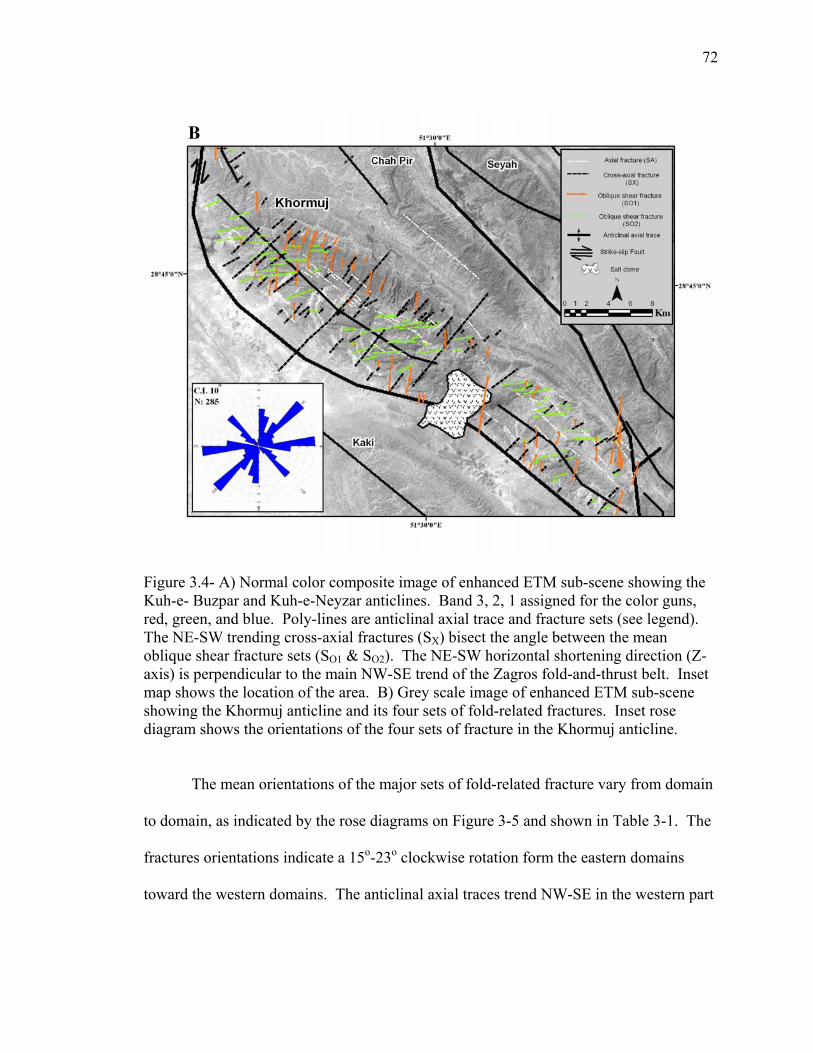
72
Figure 3.4- A) Normal color composite image of enhanced ETM sub-scene showing the Kuh-e- Buzpar and Kuh-e-Neyzar anticlines. Band 3, 2, 1 assigned for the color guns, red, green, and blue. Poly-lines are anticlinal axial trace and fracture sets (see legend). The NE-SW trending cross-axial fractures (SX) bisect the angle between the mean oblique shear fracture sets (SO1 & SO2). The NE-SW horizontal shortening direction (Z-axis) is perpendicular to the main NW-SE trend of the Zagros fold-and-thrust belt. Inset map shows the location of the area. B) Grey scale image of enhanced ETM sub-scene showing the Khormuj anticline and its four sets of fold-related fractures. Inset rose diagram shows the orientations of the four sets of fracture in the Khormuj anticline.
The mean orientations of the major sets of fold-related fracture vary from domain
to domain, as indicated by the rose diagrams on Figure 3-5 and shown in Table 3-1. The
fractures orientations indicate a 15o-23o clockwise rotation form the eastern domains
toward the western domains. The anticlinal axial traces trend NW-SE in the western part
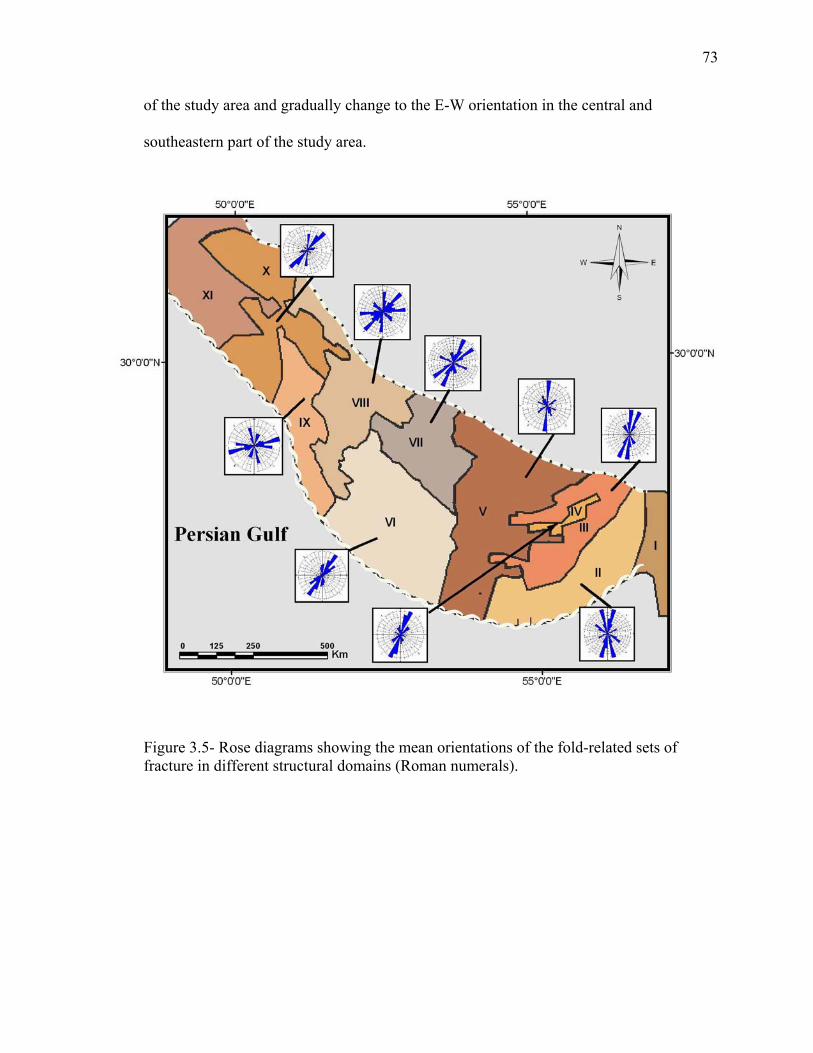
73
of the study area and gradually change to the E-W orientation in the central and
southeastern part of the study area.
Figure 3.5- Rose diagrams showing the mean orientations of the fold-related sets of fracture in different structural domains (Roman numerals).
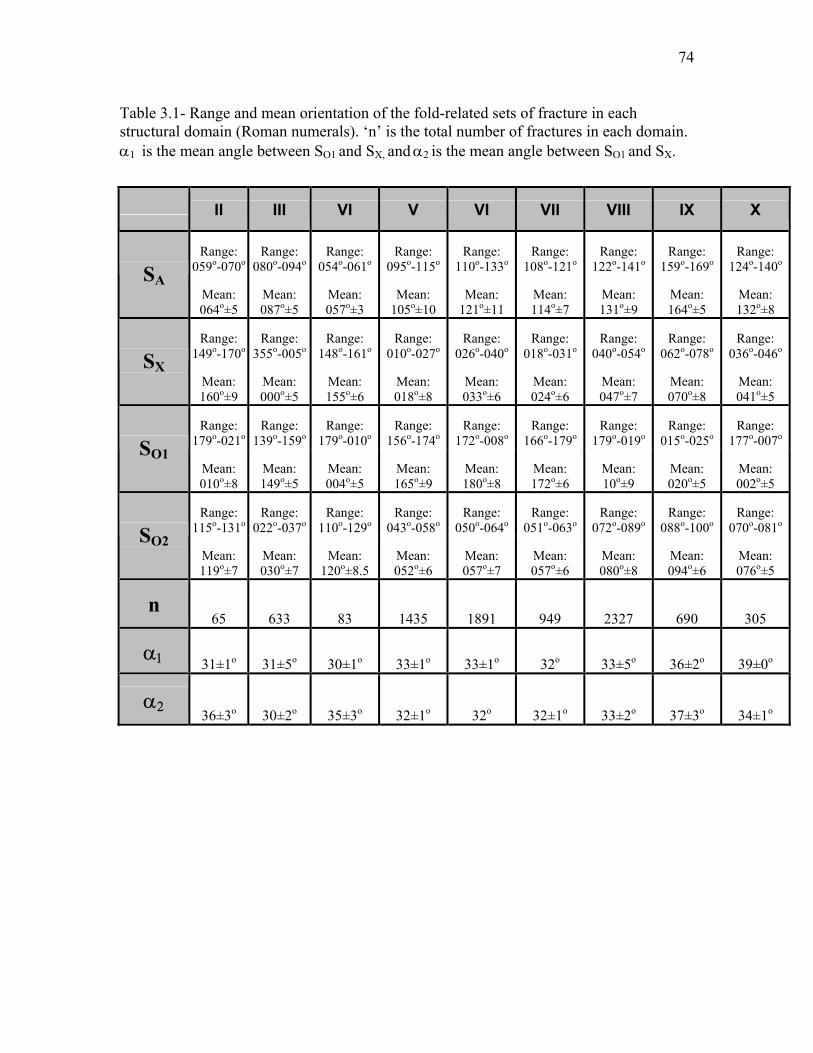
74
Table 3.1- Range and mean orientation of the fold-related sets of fracture in each structural domain (Roman numerals). ‘n’ is the total number of fractures in each domain. α1 is the mean angle between SO1 and SX, and α2 is the mean angle between SO1 and SX.
II III VI V VI VII VIII IX X
Range: 059o-070o
Range: 080o-094o
Range: 054o-061o
Range: 095o-115o
Range: 110o-133o
Range: 108o-121o
Range: 122o-141o
Range: 159o-169o
Range: 124o-140o
SA Mean: 064o±5
Mean: 087o±5
Mean: 057o±3
Mean: 105o±10
Mean: 121o±11
Mean: 114o±7
Mean: 131o±9
Mean: 164o±5
Mean: 132o±8
Range: 149o-170o
Range: 355o-005o
Range: 148o-161o
Range: 010o-027o
Range: 026o-040o
Range: 018o-031o
Range: 040o-054o
Range: 062o-078o
Range: 036o-046o
SX Mean: 160o±9
Mean: 000o±5
Mean: 155o±6
Mean: 018o±8
Mean: 033o±6
Mean: 024o±6
Mean: 047o±7
Mean: 070o±8
Mean: 041o±5
Range: 179o-021o
Range: 139o-159o
Range: 179o-010o
Range: 156o-174o
Range: 172o-008o
Range: 166o-179o
Range: 179o-019o
Range: 015o-025o
Range: 177o-007o
SO1 Mean: 010o±8
Mean: 149o±5
Mean: 004o±5
Mean: 165o±9
Mean: 180o±8
Mean: 172o±6
Mean: 10o±9
Mean: 020o±5
Mean: 002o±5
Range: 115o-131o
Range: 022o-037o
Range: 110o-129o
Range: 043o-058o
Range: 050o-064o
Range: 051o-063o
Range: 072o-089o
Range: 088o-100o
Range: 070o-081o
SO2 Mean: 119o±7
Mean: 030o±7
Mean: 120o±8.5
Mean: 052o±6
Mean: 057o±7
Mean: 057o±6
Mean: 080o±8
Mean: 094o±6
Mean: 076o±5
n 65 633 83 1435 1891 949 2327 690 305
α1 31±1o 31±5o 30±1o 33±1o 33±1o 32o 33±5o 36±2o 39±0o
α2 36±3o 30±2o 35±3o 32±1o 32o 32±1o 33±2o 37±3o 34±1o
75
3.2- Fault-related fractures 3.2.1- The Kazerun fault and the strike-slip faulting The Kazerun fault zone cuts across the NW-SE trending Zagros fold-and-thrust belt, with
roughly north-south trend, sub-parallel to the Oman line (Falcon, 1969, Stocklin, 1968)
which runs along the eastern boundary of the Zagros Mountains. The fault zone is a 300
km long strike-slip, basement fault zone (Falcon, 1969; Baker et al., 1993; Berebrian,
1995; Hessami et al., 2001a), which deforms the Zagros folds. The Kazerun fault is
comprised of several major, N-S striking fault segments (from north to south) Sisakht,
Yasuj (90km), Kamarij (40km), and Burazjan (Sepehr and Cosgrove, 2005) (Figures 2-1,
3-16). Strike-slip faults, similar to the Kazerun fault, obliquely cut across the fold axial
traces in the fold-and-thrust belts of northwest Greece and Albania (Baker et al., 1993).
Past studies of the Kazerun fault include Falcon (1969, 1974), Kent (1979), Baker (1993),
Berberian (1995), Talbot and Alavi (1996), Aziz Zadeh (1997), Nedaei (1999), Hessami
(2001a, 2006), Sherkati and Letouzey (2004), and Sepehr and Cosgrove (2004, 2005).
The Kazerun fault zone, and its subsidiary faults, which constitute a major focus
of this study, was initiated in the Early Cambrian as an active basin boundary fault. The
fault marked the western boundary of a salt basin in which the Hormuz evaporites were
deposited in the Fars region (Sepehr and Cosgrove, 2005). The basin was part of the
larger sedimentary environment which existed in central Iran and Pakistan (Berberian and
King, 1981). The Afro-Arabia-Eurasian continent-continent collision during the
Cretaceous reactivated the Kazerun and other N-S trending faults such as Izeh (Falcon,
1969; Baker et al., 1993; Berebrian, 1995; Hessami et al., 2001a). Reactivation of the
76
basement faults led to changes in the sedimentary environments, which resulted in facies
change and thickening of the sedimentary sequences (Sepehr and Cosgrove, 2005).
3.2.2- Fractures in strike-slip faults and background
3.2.2.1- Strike-slip faults and their associated structures
Based on their geological settings, strike-slip faults are divided into two main groups: (i),
the first group includes strike-slip faults that form in the upper part of the crust. These
faults range in size from very small structures to a few tens of kilometers. (ii) The second
group includes strike-slip faults that are distributed on the regional scale. These large
structures are located along the boundaries of lithospheric plates (Price and Cosgrove,
1990). Movements along strike slip faults form many secondary structures. Their types
depend on the shape, size, and development environment in which the fault develops.
Reactivation of basement faults deforms structures in the cover strata. A very
large amount of shear strain is required to rotate folds in the cover strata to near
parallelism with the strike of a first order, basement strike-slip fault (Price and Cosgrove,
1990).
A complex arrangement of secondary fractures may form around a major strike-
slip fault. Figure 3-6 illustrates the relationship between a strike-slip fault and its
secondary structures in the basement. The secondary fractures form not only in the
basement fault zone, but also in the sedimentary cover (Price and Cosgrove, 1990).
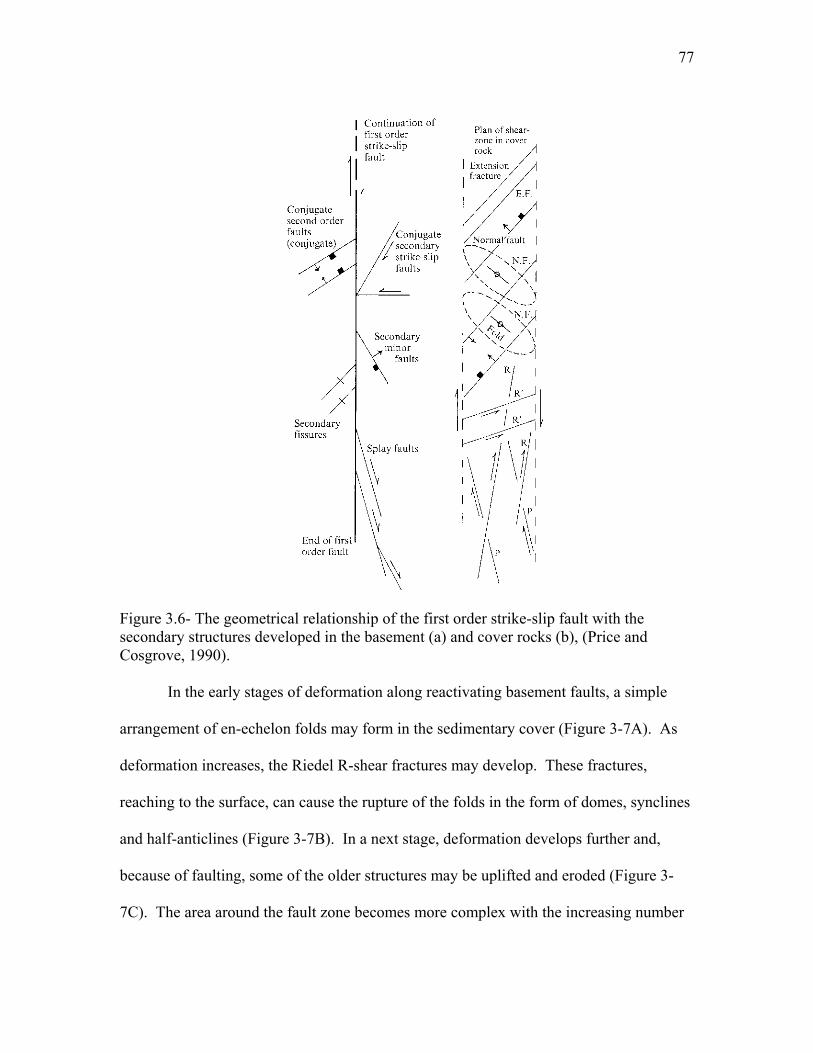
77
Figure 3.6- The geometrical relationship of the first order strike-slip fault with the secondary structures developed in the basement (a) and cover rocks (b), (Price and Cosgrove, 1990).
In the early stages of deformation along reactivating basement faults, a simple
arrangement of en-echelon folds may form in the sedimentary cover (Figure 3-7A). As
deformation increases, the Riedel R-shear fractures may develop. These fractures,
reaching to the surface, can cause the rupture of the folds in the form of domes, synclines
and half-anticlines (Figure 3-7B). In a next stage, deformation develops further and,
because of faulting, some of the older structures may be uplifted and eroded (Figure 3-
7C). The area around the fault zone becomes more complex with the increasing number
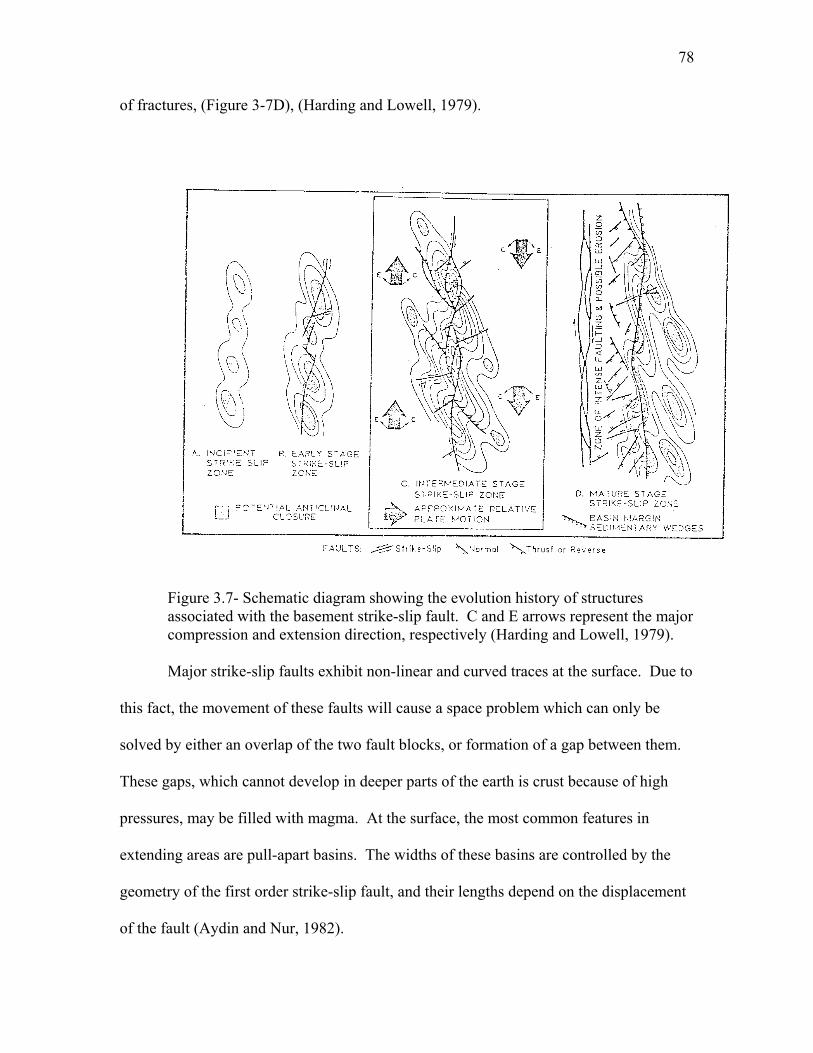
78
of fractures, (Figure 3-7D), (Harding and Lowell, 1979).
Figure 3.7- Schematic diagram showing the evolution history of structures associated with the basement strike-slip fault. C and E arrows represent the major compression and extension direction, respectively (Harding and Lowell, 1979). Major strike-slip faults exhibit non-linear and curved traces at the surface. Due to
this fact, the movement of these faults will cause a space problem which can only be
solved by either an overlap of the two fault blocks, or formation of a gap between them.
These gaps, which cannot develop in deeper parts of the earth is crust because of high
pressures, may be filled with magma. At the surface, the most common features in
extending areas are pull-apart basins. The widths of these basins are controlled by the
geometry of the first order strike-slip fault, and their lengths depend on the displacement
of the fault (Aydin and Nur, 1982).
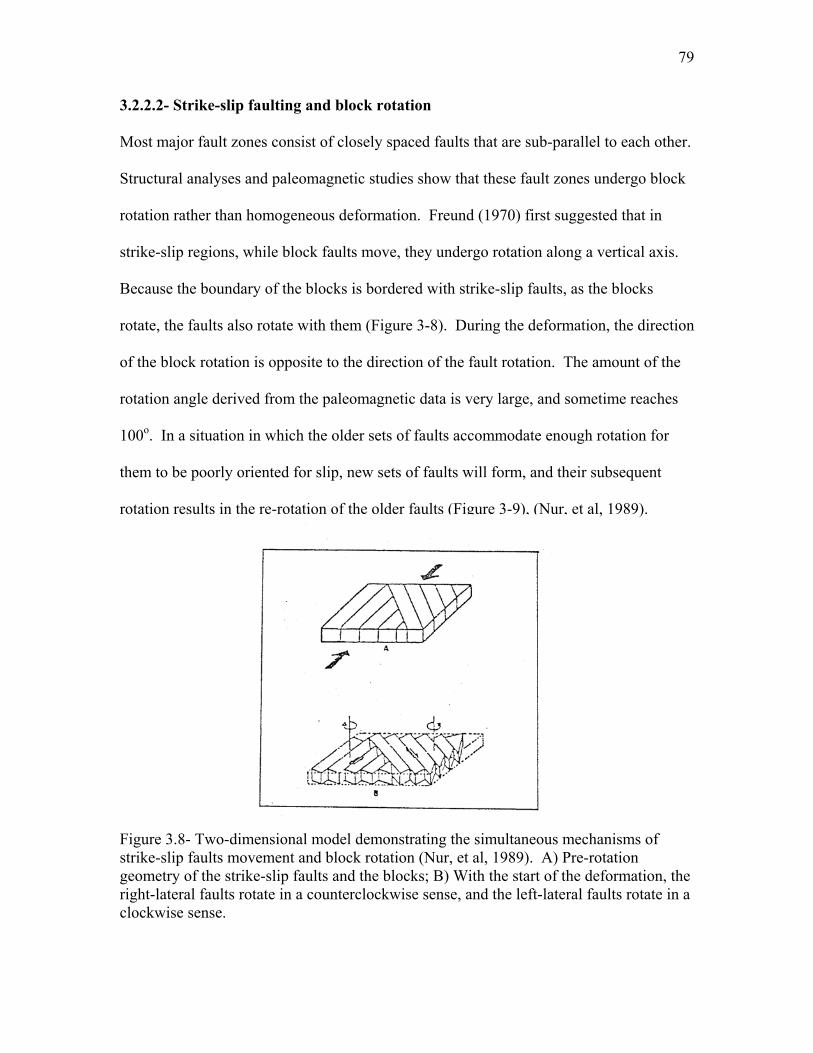
79
3.2.2.2- Strike-slip faulting and block rotation
Most major fault zones consist of closely spaced faults that are sub-parallel to each other.
Structural analyses and paleomagnetic studies show that these fault zones undergo block
rotation rather than homogeneous deformation. Freund (1970) first suggested that in
strike-slip regions, while block faults move, they undergo rotation along a vertical axis.
Because the boundary of the blocks is bordered with strike-slip faults, as the blocks
rotate, the faults also rotate with them (Figure 3-8). During the deformation, the direction
of the block rotation is opposite to the direction of the fault rotation. The amount of the
rotation angle derived from the paleomagnetic data is very large, and sometime reaches
100o. In a situation in which the older sets of faults accommodate enough rotation for
them to be poorly oriented for slip, new sets of faults will form, and their subsequent
rotation results in the re-rotation of the older faults (Figure 3-9), (Nur, et al, 1989).
Figure 3.8- Two-dimensional model demonstrating the simultaneous mechanisms of strike-slip faults movement and block rotation (Nur, et al, 1989). A) Pre-rotation geometry of the strike-slip faults and the blocks; B) With the start of the deformation, the right-lateral faults rotate in a counterclockwise sense, and the left-lateral faults rotate in a clockwise sense.
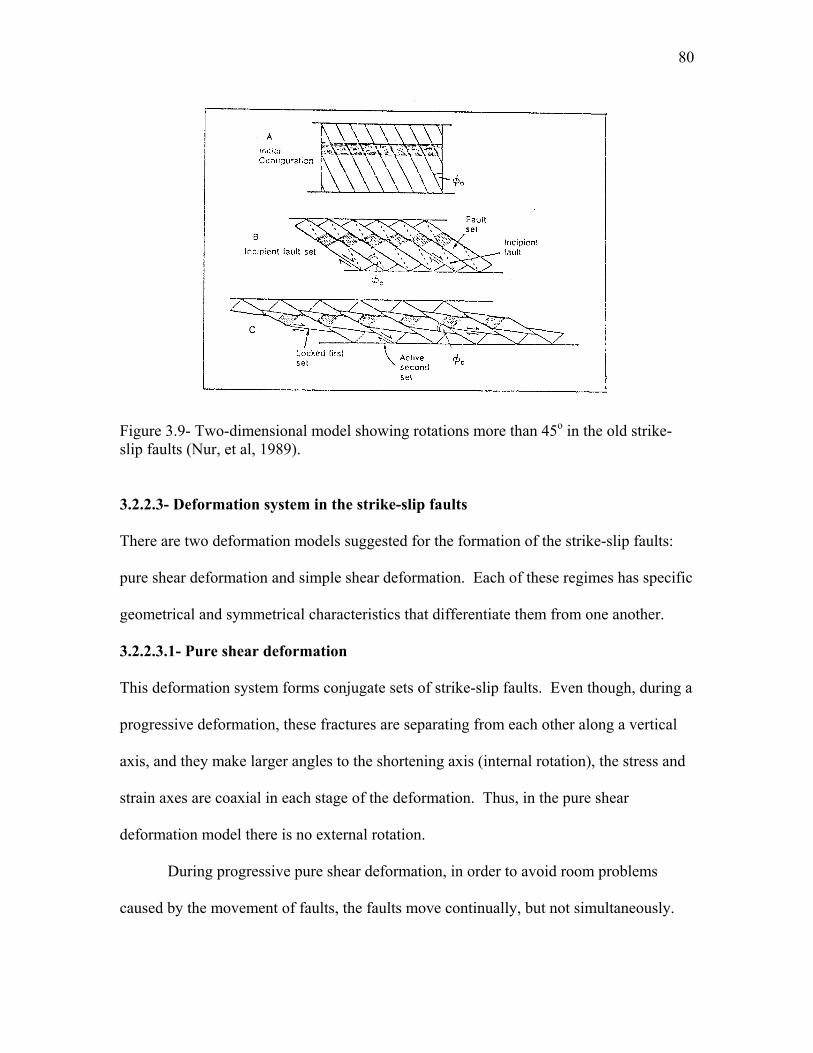
80
Figure 3.9- Two-dimensional model showing rotations more than 45o in the old strike-slip faults (Nur, et al, 1989). 3.2.2.3- Deformation system in the strike-slip faults There are two deformation models suggested for the formation of the strike-slip faults:
pure shear deformation and simple shear deformation. Each of these regimes has specific
geometrical and symmetrical characteristics that differentiate them from one another.
3.2.2.3.1- Pure shear deformation This deformation system forms conjugate sets of strike-slip faults. Even though, during a
progressive deformation, these fractures are separating from each other along a vertical
axis, and they make larger angles to the shortening axis (internal rotation), the stress and
strain axes are coaxial in each stage of the deformation. Thus, in the pure shear
deformation model there is no external rotation.
During progressive pure shear deformation, in order to avoid room problems
caused by the movement of faults, the faults move continually, but not simultaneously.
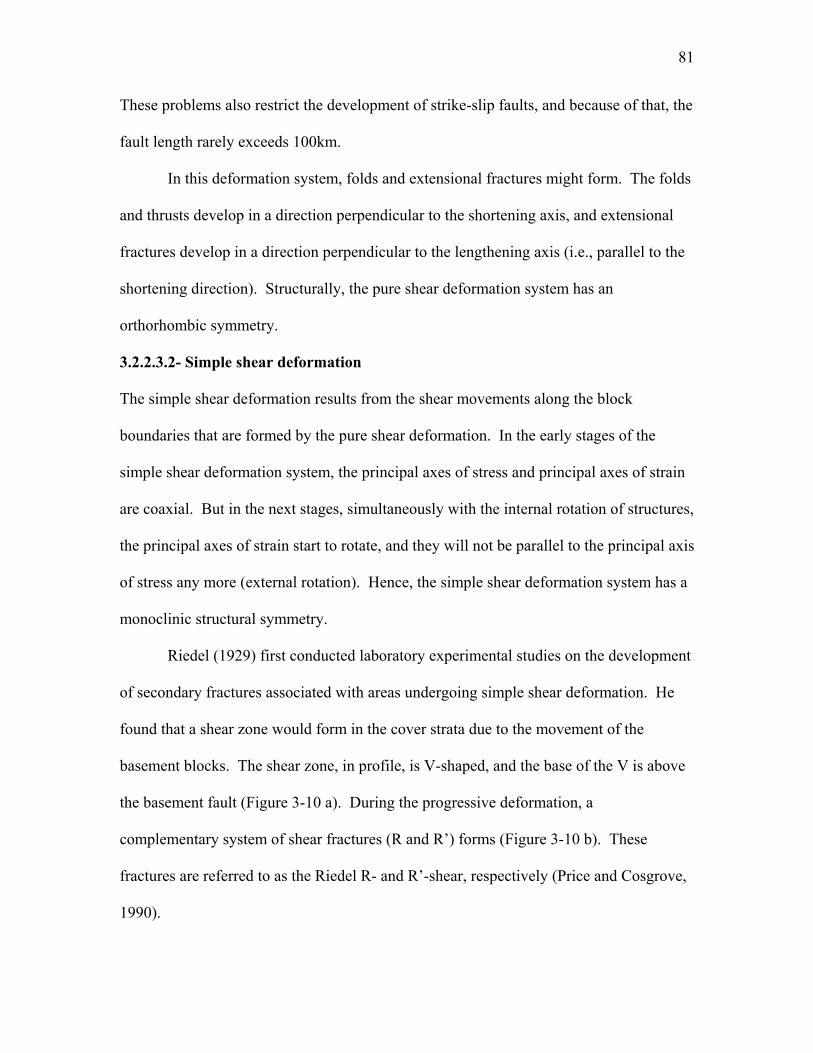
81
These problems also restrict the development of strike-slip faults, and because of that, the
fault length rarely exceeds 100km.
In this deformation system, folds and extensional fractures might form. The folds
and thrusts develop in a direction perpendicular to the shortening axis, and extensional
fractures develop in a direction perpendicular to the lengthening axis (i.e., parallel to the
shortening direction). Structurally, the pure shear deformation system has an
orthorhombic symmetry.
3.2.2.3.2- Simple shear deformation The simple shear deformation results from the shear movements along the block
boundaries that are formed by the pure shear deformation. In the early stages of the
simple shear deformation system, the principal axes of stress and principal axes of strain
are coaxial. But in the next stages, simultaneously with the internal rotation of structures,
the principal axes of strain start to rotate, and they will not be parallel to the principal axis
of stress any more (external rotation). Hence, the simple shear deformation system has a
monoclinic structural symmetry.
Riedel (1929) first conducted laboratory experimental studies on the development
of secondary fractures associated with areas undergoing simple shear deformation. He
found that a shear zone would form in the cover strata due to the movement of the
basement blocks. The shear zone, in profile, is V-shaped, and the base of the V is above
the basement fault (Figure 3-10 a). During the progressive deformation, a
complementary system of shear fractures (R and R’) forms (Figure 3-10 b). These
fractures are referred to as the Riedel R- and R’-shear, respectively (Price and Cosgrove,
1990).
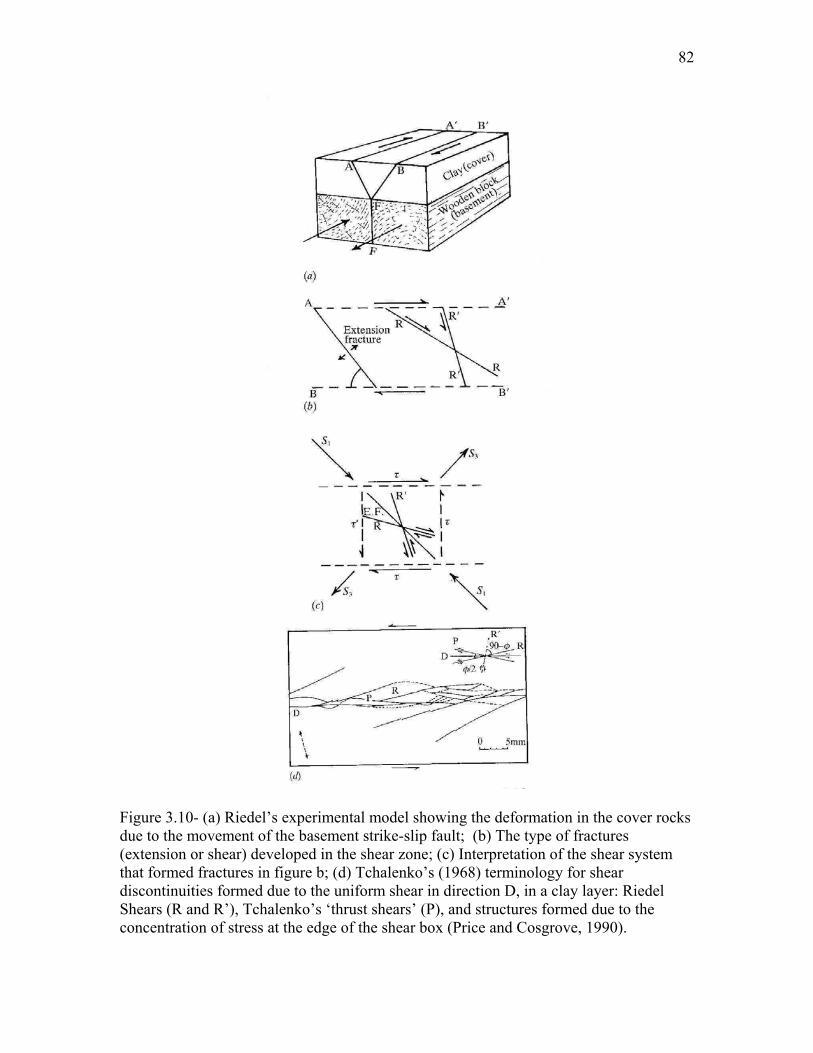
82
Figure 3.10- (a) Riedel’s experimental model showing the deformation in the cover rocks due to the movement of the basement strike-slip fault; (b) The type of fractures (extension or shear) developed in the shear zone; (c) Interpretation of the shear system that formed fractures in figure b; (d) Tchalenko’s (1968) terminology for shear discontinuities formed due to the uniform shear in direction D, in a clay layer: Riedel Shears (R and R’), Tchalenko’s ‘thrust shears’ (P), and structures formed due to the concentration of stress at the edge of the shear box (Price and Cosgrove, 1990).
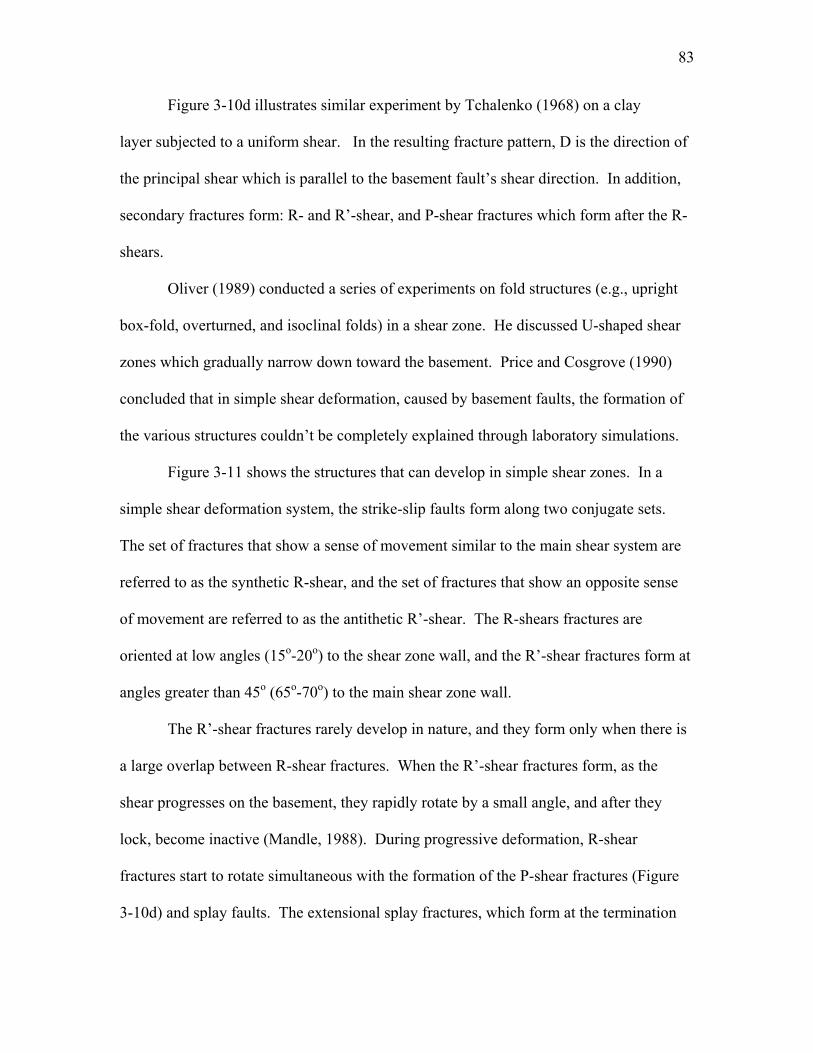
83
Figure 3-10d illustrates similar experiment by Tchalenko (1968) on a clay
layer subjected to a uniform shear. In the resulting fracture pattern, D is the direction of
the principal shear which is parallel to the basement fault’s shear direction. In addition,
secondary fractures form: R- and R’-shear, and P-shear fractures which form after the R-
shears.
Oliver (1989) conducted a series of experiments on fold structures (e.g., upright
box-fold, overturned, and isoclinal folds) in a shear zone. He discussed U-shaped shear
zones which gradually narrow down toward the basement. Price and Cosgrove (1990)
concluded that in simple shear deformation, caused by basement faults, the formation of
the various structures couldn’t be completely explained through laboratory simulations.
Figure 3-11 shows the structures that can develop in simple shear zones. In a
simple shear deformation system, the strike-slip faults form along two conjugate sets.
The set of fractures that show a sense of movement similar to the main shear system are
referred to as the synthetic R-shear, and the set of fractures that show an opposite sense
of movement are referred to as the antithetic R’-shear. The R-shears fractures are
oriented at low angles (15o-20o) to the shear zone wall, and the R’-shear fractures form at
angles greater than 45o (65o-70o) to the main shear zone wall.
The R’-shear fractures rarely develop in nature, and they form only when there is
a large overlap between R-shear fractures. When the R’-shear fractures form, as the
shear progresses on the basement, they rapidly rotate by a small angle, and after they
lock, become inactive (Mandle, 1988). During progressive deformation, R-shear
fractures start to rotate simultaneous with the formation of the P-shear fractures (Figure
3-10d) and splay faults. The extensional splay fractures, which form at the termination

84
end of the R-shear fractures, develop perpendicular to the lengthening strain axis (i.e.,
parallel to the shortening direction), and may rotate with continued shear along the main
fault. When R-shear fractures are not able to accommodate continued movement in the
basement anymore, the shortening axis rotates, and creates a local stress field that leads to
the formation of the P-fractures.
Folds and thrusts are among the secondary structures that accompany strike-slip
faults (Figure 3-11). Folds may form around shear zones in the early stages of the shear
zone deformation perpendicular to the shortening direction, and in places where segments
of the faults step or bend along the shear zone. During progressive deformation, these
folds gradually stretch and rotate until they are subparallel, or at a low-angle, to the shear
zone wall.
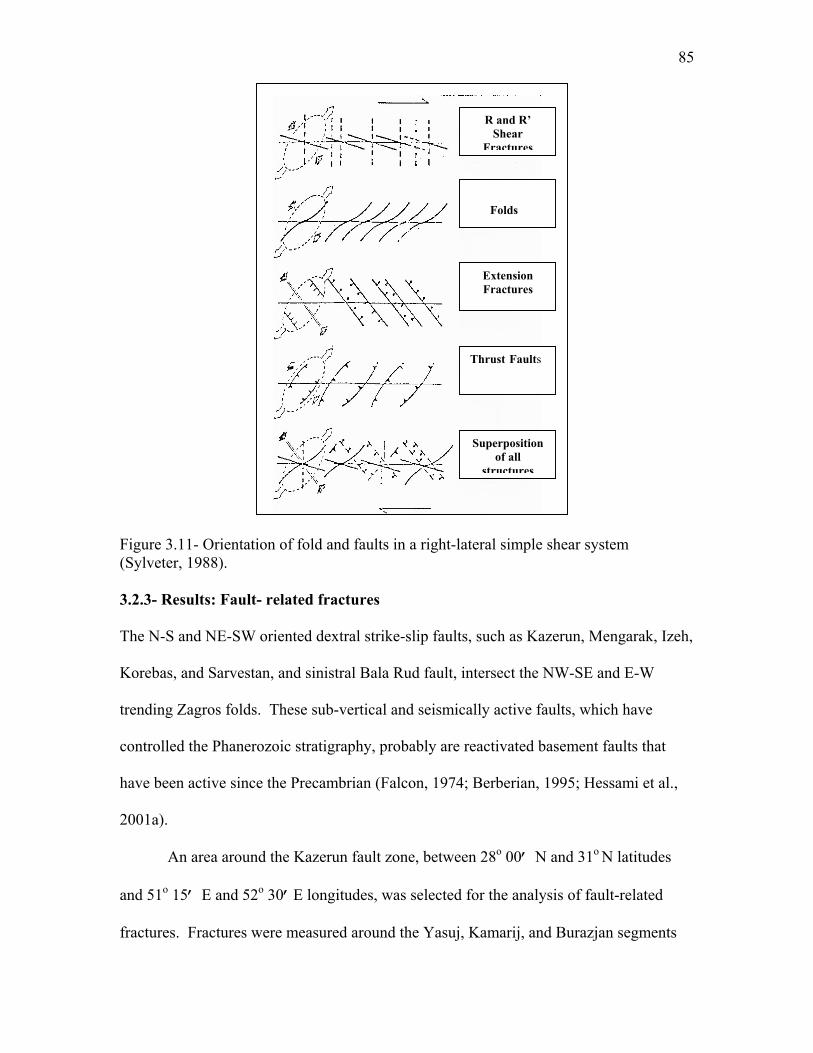
85
Figure 3.11- Orientation of fold and faults in a right-lateral simple shear system (Sylveter, 1988). 3.2.3- Results: Fault- related fractures The N-S and NE-SW oriented dextral strike-slip faults, such as Kazerun, Mengarak, Izeh,
Korebas, and Sarvestan, and sinistral Bala Rud fault, intersect the NW-SE and E-W
trending Zagros folds. These sub-vertical and seismically active faults, which have
controlled the Phanerozoic stratigraphy, probably are reactivated basement faults that
have been active since the Precambrian (Falcon, 1974; Berberian, 1995; Hessami et al.,
2001a).
An area around the Kazerun fault zone, between 28o 00’ N and 31o N latitudes
and 51o 15’ E and 52o 30’E longitudes, was selected for the analysis of fault-related
fractures. Fractures were measured around the Yasuj, Kamarij, and Burazjan segments
R and R’ Shear
Fractures
Folds
Extension Fractures
Thrust Faults
Superposition of all
structures
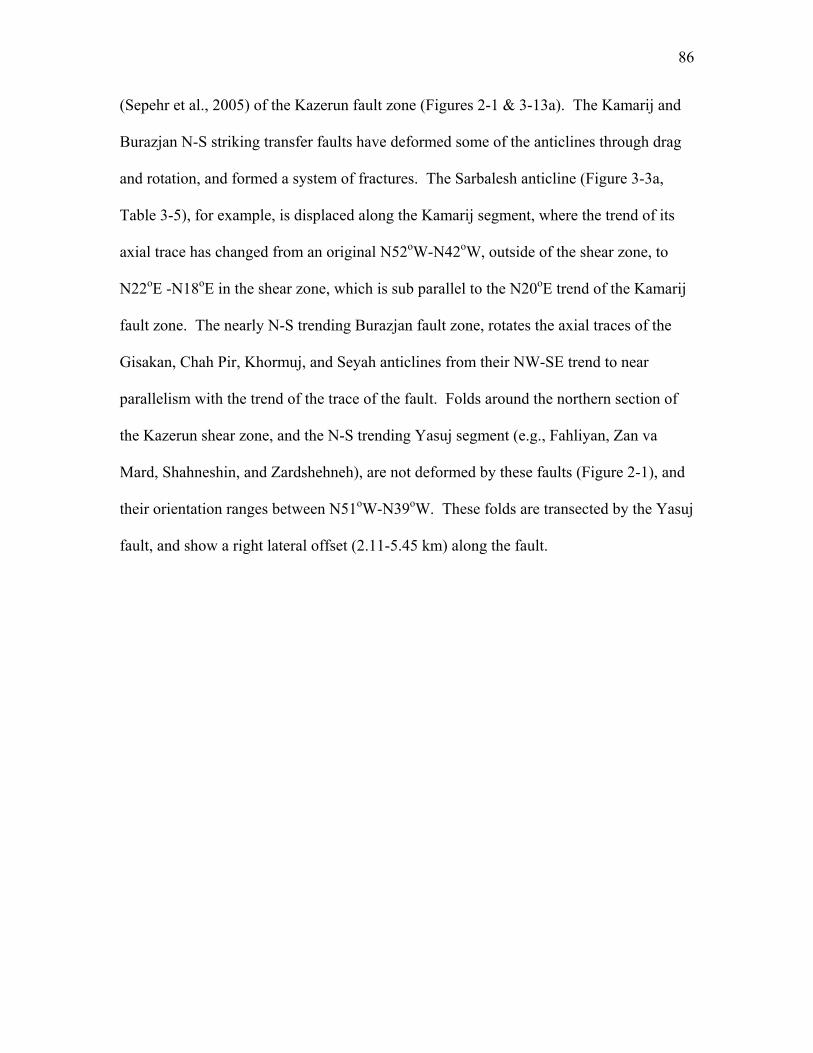
86
(Sepehr et al., 2005) of the Kazerun fault zone (Figures 2-1 & 3-13a). The Kamarij and
Burazjan N-S striking transfer faults have deformed some of the anticlines through drag
and rotation, and formed a system of fractures. The Sarbalesh anticline (Figure 3-3a,
Table 3-5), for example, is displaced along the Kamarij segment, where the trend of its
axial trace has changed from an original N52oW-N42oW, outside of the shear zone, to
N22oE -N18oE in the shear zone, which is sub parallel to the N20oE trend of the Kamarij
fault zone. The nearly N-S trending Burazjan fault zone, rotates the axial traces of the
Gisakan, Chah Pir, Khormuj, and Seyah anticlines from their NW-SE trend to near
parallelism with the trend of the trace of the fault. Folds around the northern section of
the Kazerun shear zone, and the N-S trending Yasuj segment (e.g., Fahliyan, Zan va
Mard, Shahneshin, and Zardshehneh), are not deformed by these faults (Figure 2-1), and
their orientation ranges between N51oW-N39oW. These folds are transected by the Yasuj
fault, and show a right lateral offset (2.11-5.45 km) along the fault.
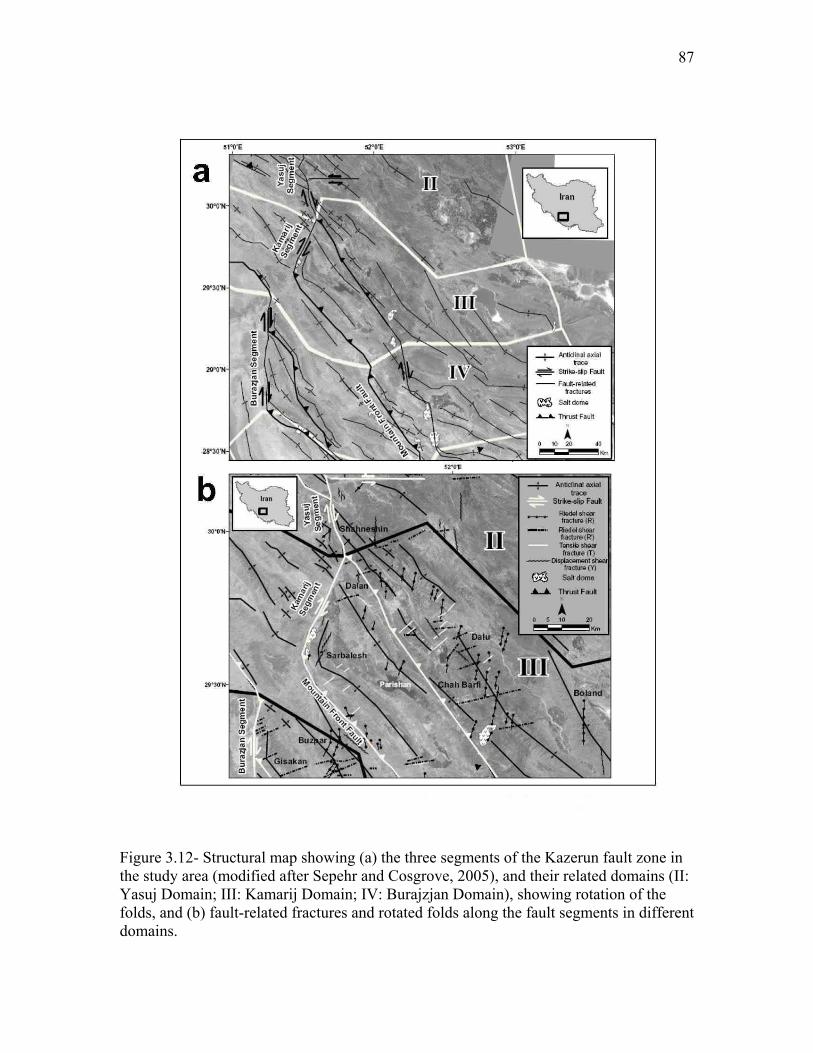
87
Figure 3.12- Structural map showing (a) the three segments of the Kazerun fault zone in the study area (modified after Sepehr and Cosgrove, 2005), and their related domains (II: Yasuj Domain; III: Kamarij Domain; IV: Burajzjan Domain), showing rotation of the folds, and (b) fault-related fractures and rotated folds along the fault segments in different domains.
88
Fault-related fractures that were digitized for this study are elements of different
sets of extensional and shear fracture that form subsidiary to a fault-zone to accommodate
motion along the main fault. The fracture system comprises the following subsidiary
fractures: (i) extensional fractures (T set) which may form parallel to the infinitesimal
principal shortening direction, and may rotate with continued slip. (ii) Synthetic (R-
shear) and antithetic (R’-shear) sets of the Riedel shear fracture form at oblique, acute
angles to the horizontal shortening direction (for a vertical main fault). (iii) P-shear
fractures may form at a small angle (<20 o) and be synthetic to the main fault. (iv) Y-
shear fractures form parallel and synthetic to the main fault, and accommodate the main
displacement. A complete or partial system of these sets of fracture can be used for
kinematic analysis, i.e., to estimate the directions of shortening and extension from the
fracture orientations. The extensional fractures of the T-set can be distinguished from the
R- R’-, P-, and Y-shear fractures because they do displace the lithostratigraphic contacts.
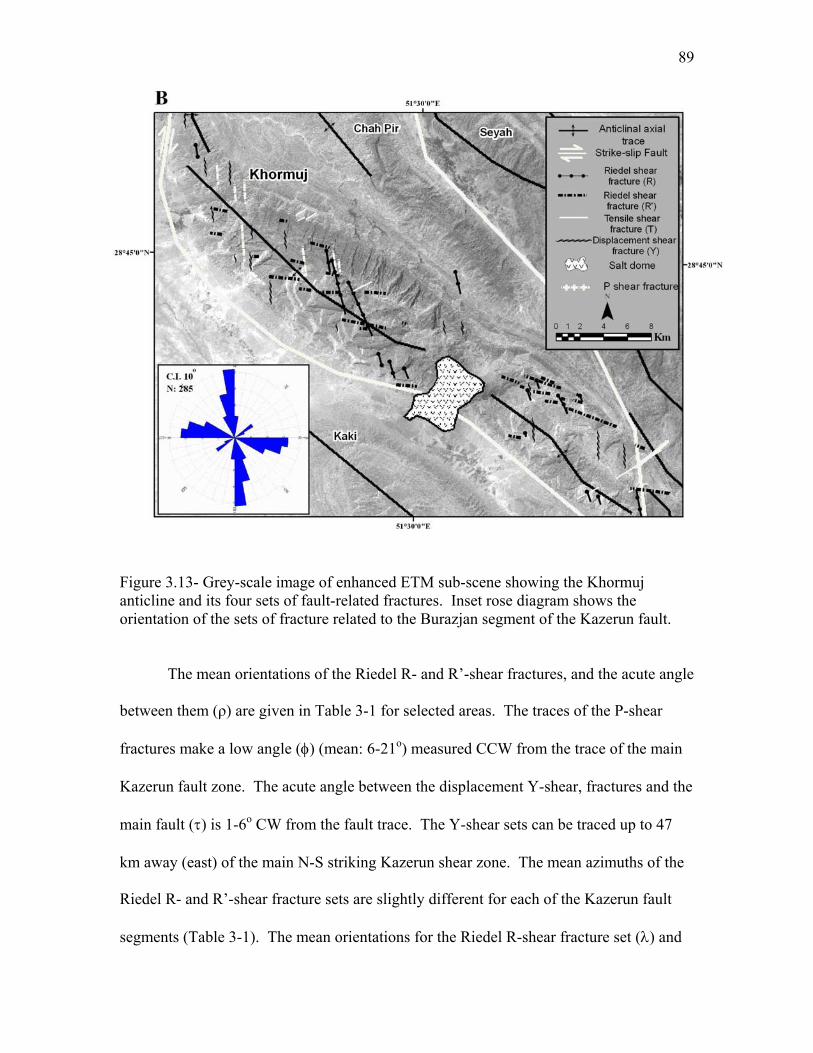
89
Figure 3.13- Grey-scale image of enhanced ETM sub-scene showing the Khormuj anticline and its four sets of fault-related fractures. Inset rose diagram shows the orientation of the sets of fracture related to the Burazjan segment of the Kazerun fault.
The mean orientations of the Riedel R- and R’-shear fractures, and the acute angle
between them (ρ) are given in Table 3-1 for selected areas. The traces of the P-shear
fractures make a low angle (φ) (mean: 6-21o) measured CCW from the trace of the main
Kazerun fault zone. The acute angle between the displacement Y-shear, fractures and the
main fault (τ) is 1-6o CW from the fault trace. The Y-shear sets can be traced up to 47
km away (east) of the main N-S striking Kazerun shear zone. The mean azimuths of the
Riedel R- and R’-shear fracture sets are slightly different for each of the Kazerun fault
segments (Table 3-1). The mean orientations for the Riedel R-shear fracture set (λ) and
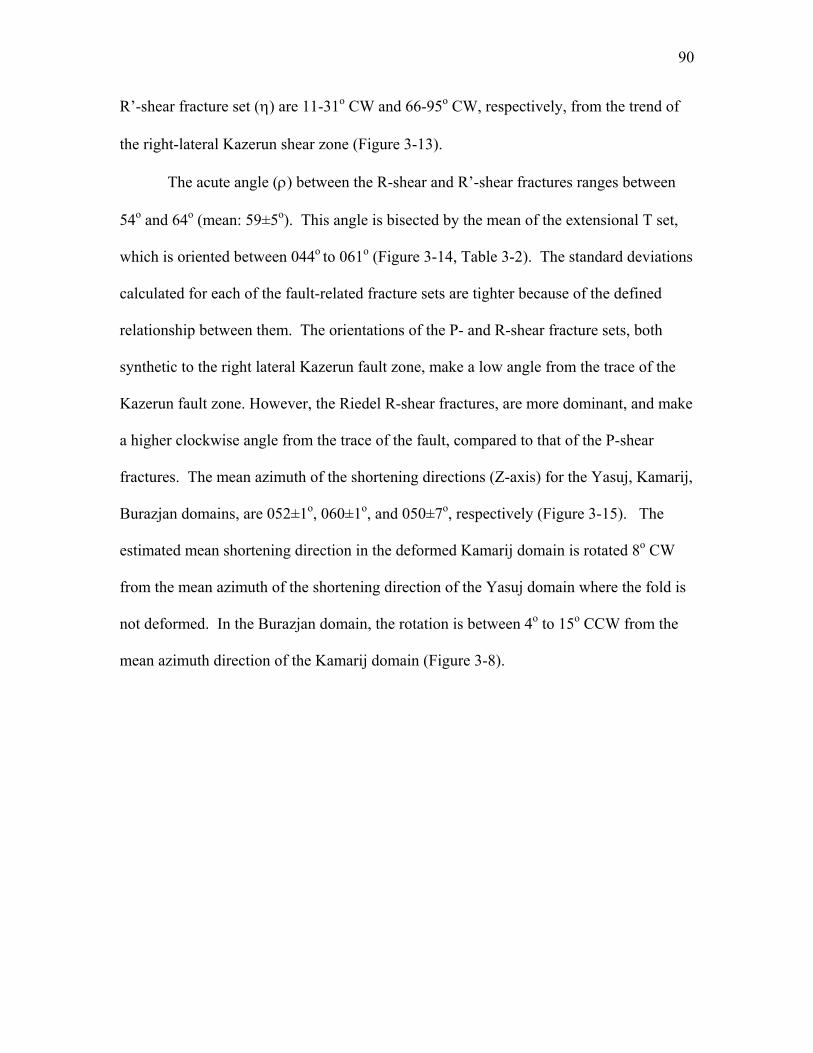
90
R’-shear fracture set (η) are 11-31o CW and 66-95o CW, respectively, from the trend of
the right-lateral Kazerun shear zone (Figure 3-13).
The acute angle (ρ) between the R-shear and R’-shear fractures ranges between
54o and 64o (mean: 59±5o). This angle is bisected by the mean of the extensional T set,
which is oriented between 044o to 061o (Figure 3-14, Table 3-2). The standard deviations
calculated for each of the fault-related fracture sets are tighter because of the defined
relationship between them. The orientations of the P- and R-shear fracture sets, both
synthetic to the right lateral Kazerun fault zone, make a low angle from the trace of the
Kazerun fault zone. However, the Riedel R-shear fractures, are more dominant, and make
a higher clockwise angle from the trace of the fault, compared to that of the P-shear
fractures. The mean azimuth of the shortening directions (Z-axis) for the Yasuj, Kamarij,
Burazjan domains, are 052±1o, 060±1o, and 050±7o, respectively (Figure 3-15). The
estimated mean shortening direction in the deformed Kamarij domain is rotated 8o CW
from the mean azimuth of the shortening direction of the Yasuj domain where the fold is
not deformed. In the Burazjan domain, the rotation is between 4o to 15o CCW from the
mean azimuth direction of the Kamarij domain (Figure 3-8).
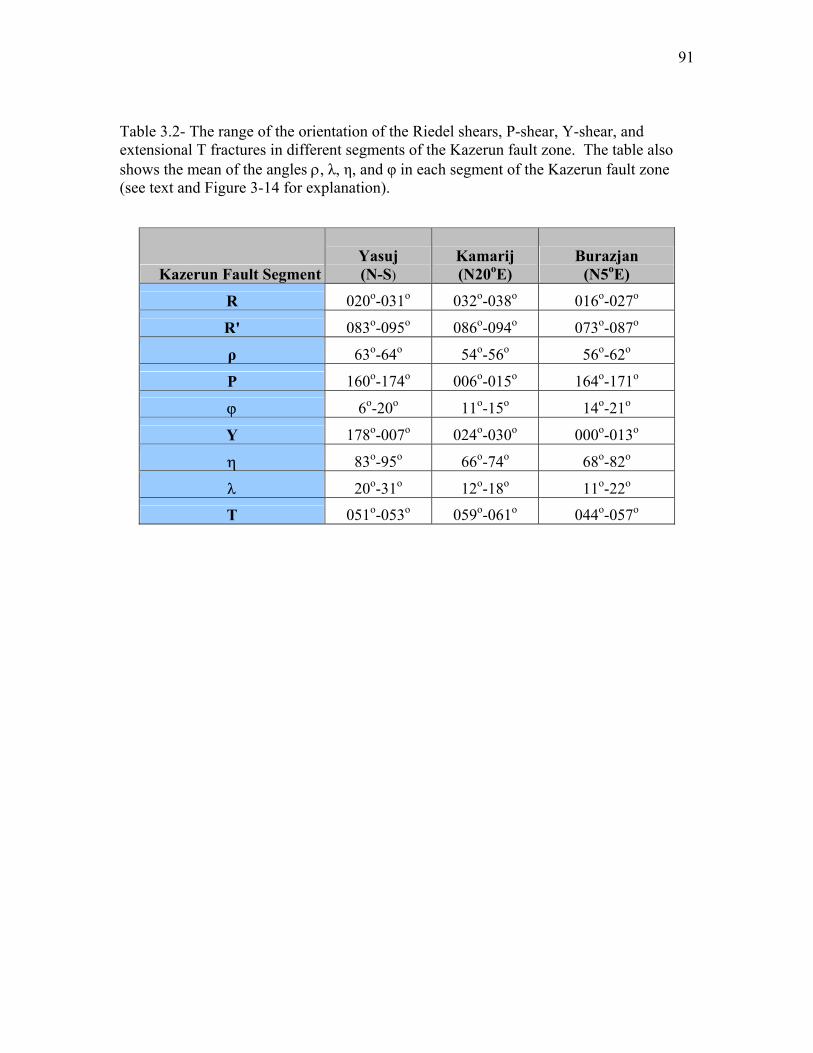
91
Table 3.2- The range of the orientation of the Riedel shears, P-shear, Y-shear, and extensional T fractures in different segments of the Kazerun fault zone. The table also shows the mean of the angles ρ, λ, η, and φ in each segment of the Kazerun fault zone (see text and Figure 3-14 for explanation).
Kazerun Fault Segment Yasuj (N-S)
Kamarij (N20oE)
Burazjan (N5oE)
R 020o-031o 032o-038o 016o-027o
R' 083o-095o 086o-094o 073o-087o
ρ 63o-64o 54o-56o 56o-62o
P 160o-174o 006o-015o 164o-171o
ϕ 6o-20o 11o-15o 14o-21o
Y 178o-007o 024o-030o 000o-013o
η 83o-95o 66o-74o 68o-82o
λ 20o-31o 12o-18o 11o-22o
T 051o-053o 059o-061o 044o-057o
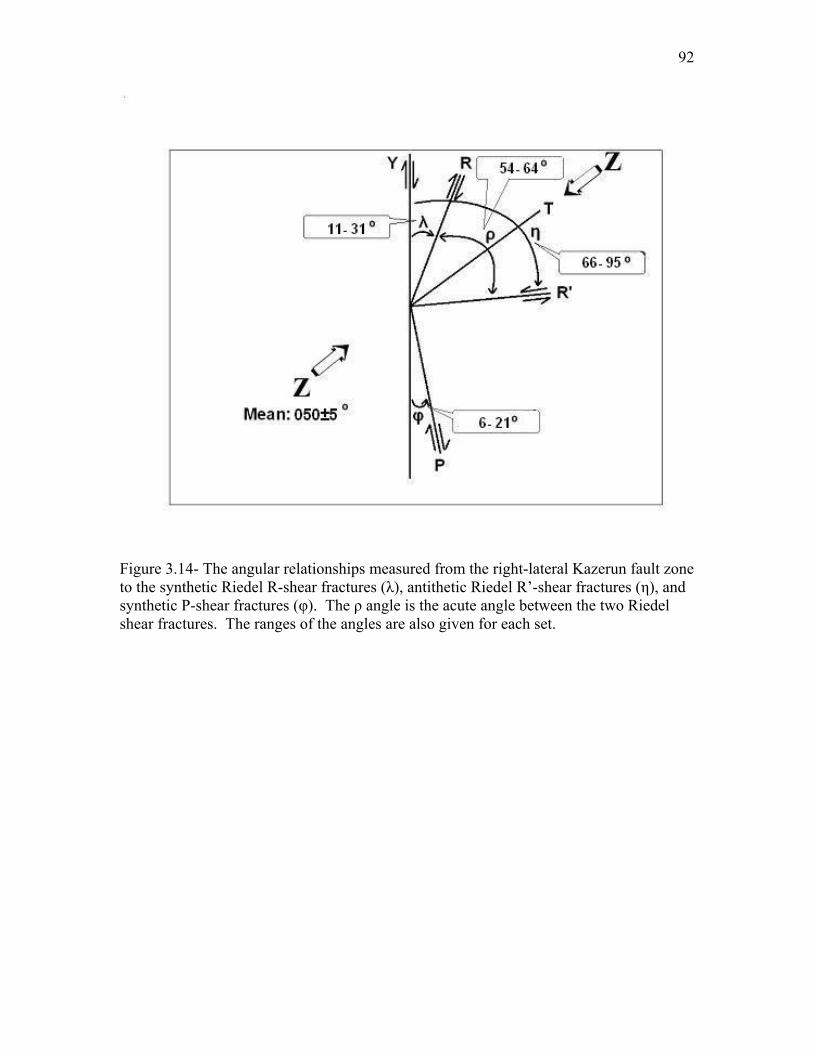
92
Figure 3.14- The angular relationships measured from the right-lateral Kazerun fault zone to the synthetic Riedel R-shear fractures (λ), antithetic Riedel R’-shear fractures (η), and synthetic P-shear fractures (φ). The ρ angle is the acute angle between the two Riedel shear fractures. The ranges of the angles are also given for each set.
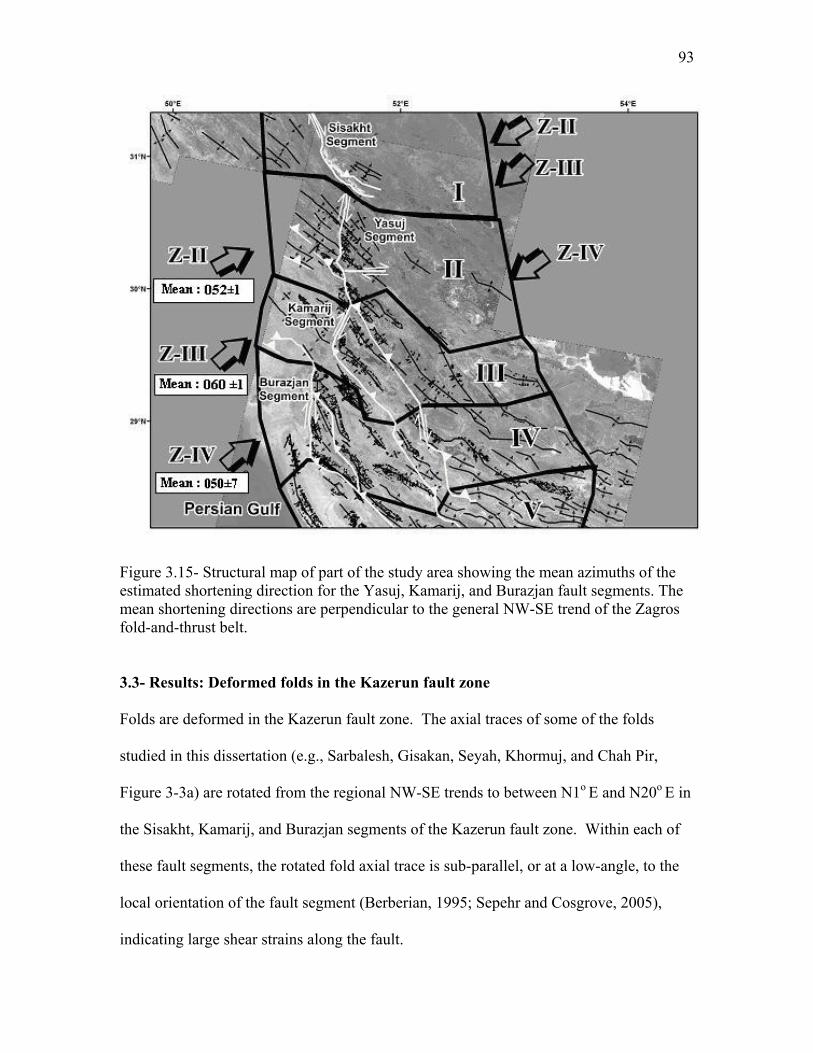
93
Figure 3.15- Structural map of part of the study area showing the mean azimuths of the estimated shortening direction for the Yasuj, Kamarij, and Burazjan fault segments. The mean shortening directions are perpendicular to the general NW-SE trend of the Zagros fold-and-thrust belt. 3.3- Results: Deformed folds in the Kazerun fault zone Folds are deformed in the Kazerun fault zone. The axial traces of some of the folds
studied in this dissertation (e.g., Sarbalesh, Gisakan, Seyah, Khormuj, and Chah Pir,
Figure 3-3a) are rotated from the regional NW-SE trends to between N1o E and N20o E in
the Sisakht, Kamarij, and Burazjan segments of the Kazerun fault zone. Within each of
these fault segments, the rotated fold axial trace is sub-parallel, or at a low-angle, to the
local orientation of the fault segment (Berberian, 1995; Sepehr and Cosgrove, 2005),
indicating large shear strains along the fault.
94
The rotated folds selected for analysis in this study are located in, and
immediately around, the Kazerun fault zone, between 29o 04’ N and 29o 30’ N latitudes
and 51o,24’E and 51o,48’E longitudes. Tables 3-4 to 3-8, Figure 3-16 show the data
used in the analysis of 774 fractures in this study. The data include the mean and range
of fracture orientations, sense of rotation (CW vs. CCW from the main fault), and the
mean angle of rotation in five rotated folds near the Kazerun shear zone.
The fractures of the SA axial set in the unrotated part of the folds have a mean
orientation of 314±8o, which is roughly parallel to the mean axial trace of the 149
measured folds that represent the NW-SE general trend of the Zagros fold-and-thrust belt
outside of the fault zone (Figure 3-16). The mean orientation of the SA axial fractures in
the rotated part of the folds in the Kazerun fault zone is 020±2o (in the Kamarij fault
segment) and 172±9o (in the Burazjan fault segment). The mean trend of the rotated
anticlinal axial traces varies as a function of the orientation of individual segment of the
Kazerun fault. In each segment, the mean axial trace is orientated sub-parallel to the
local trend of individual segment. For example, the mean azimuths of the rotated axial
traces around the Kamarij and Burazjan segments are 172±9o and 020±2o, respectively.
The Gisakan fold is rotated in two different places along its axial trace, and the upper part
of the fold is oriented 003o, which is parallel to the Burazjan fault segment (Figure 3-3b).
Folds are not deformed along the Yasuj segment of the fault.
East of the Kazerun fault zone, only the western parts of large anticlines located
in the shear zone are deformed by the fault. To quantify the rotation of the folds due to
faulting, the rotation angle (β) was defined as the horizontal acute angle measured from
the unrotated segment of the anticlinal axial trace to the rotated axial trace for each
95
deformed fold (Figure 3-16). The mean rotation angle for the deformed folds (β) is
63±3o clockwise in the Kamarij fault zone, and 35±3o clockwise in the Burazjan segment
of the Kazerun fault zone. Because the Gisakan and the Seyah anticline were rotated in
two different places, two clockwise rotation angles of β1 (42) and β2 (28±3o) were
defined for the Gisakan fold (Table 3-4), and two clockwise rotation angles of β1 (31±4o)
and β2 (26o) were defined for the Seyah fold (Table 3-6).
The cross-axial fractures in the undeformed part of folds in the fault zone are
oriented along a mean azimuth of 046±5o (i.e., NE-SW), almost perpendicular to the axial
set, and hence, the axial traces of the confining folds. The horizontal, acute rotation
angle (γ) measured from the mean trend of the cross-axial set in the unrotated part of a
fold outside of the Kazerun fault zone, to the rotated trend of the cross-axial set, in the
deformed part of the same fold in the Kazerun fault zone (Figure 3-16), is given in Tables
3-3 to 3-7. The mean of the γ rotation angles for the Kamarij and Burazjan fault
segments are clockwise 56±5o and 29±2o, respectively.
The oblique shear fractures of the SO1 and SO2 sets, in the unrotated segments of
the folds, are oriented 007o-017o (mean: 012±5o) and 076o-087o (mean: 044±4o),
respectively, relative to the 046±5o mean trend of the unrotated cross-axial set. The
means of the SO1 and SO2 sets in the rotated segments of the folds are oriented 040o-048o
(mean: 044±4o) and 108o-118o (mean: 113±5o), respectively, relative to the 079±4o(mean:
075o-083o) trend of the rotated cross-axial set. The mean of the two intersecting SO1 and
SO2 sets make a mean 2α angle (Figure 3-16) of 69±1o in the rotated segment, and 68±2o
in the unrotated segment. These angles are remarkably close to each other. The angle 2α
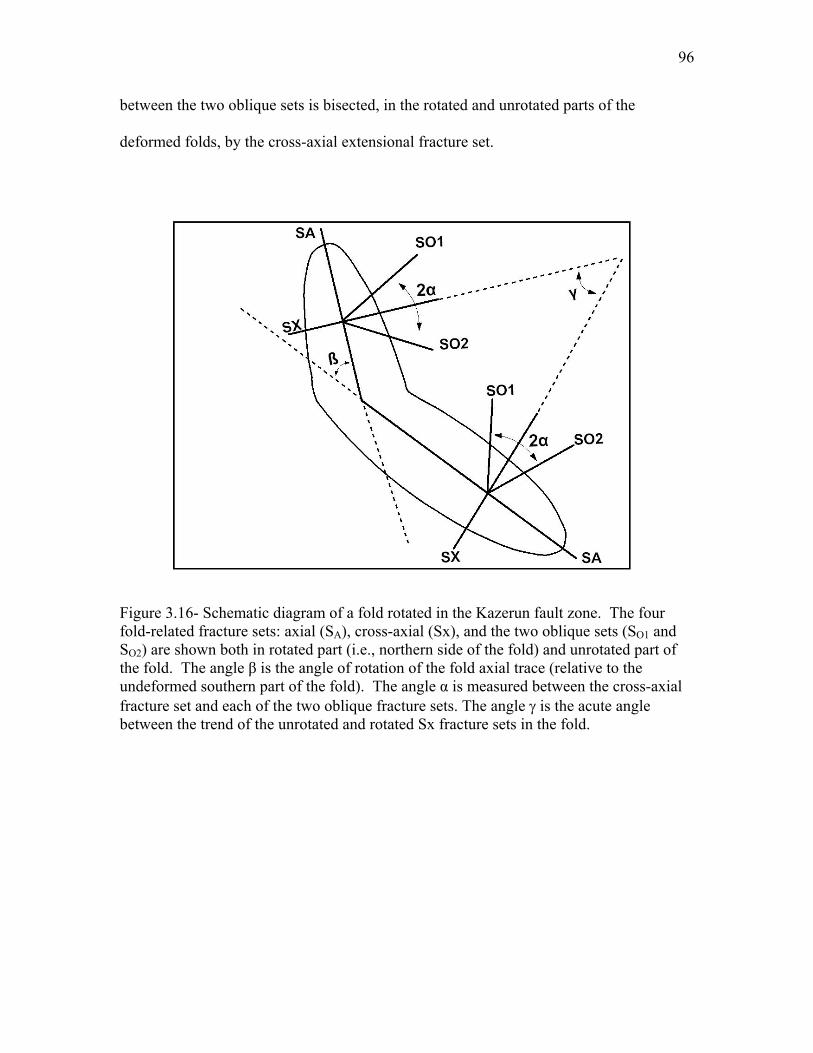
96
between the two oblique sets is bisected, in the rotated and unrotated parts of the
deformed folds, by the cross-axial extensional fracture set.
Figure 3.16- Schematic diagram of a fold rotated in the Kazerun fault zone. The four fold-related fracture sets: axial (SA), cross-axial (Sx), and the two oblique sets (SO1 and SO2) are shown both in rotated part (i.e., northern side of the fold) and unrotated part of the fold. The angle β is the angle of rotation of the fold axial trace (relative to the undeformed southern part of the fold). The angle α is measured between the cross-axial fracture set and each of the two oblique fracture sets. The angle γ is the acute angle between the trend of the unrotated and rotated Sx fracture sets in the fold.
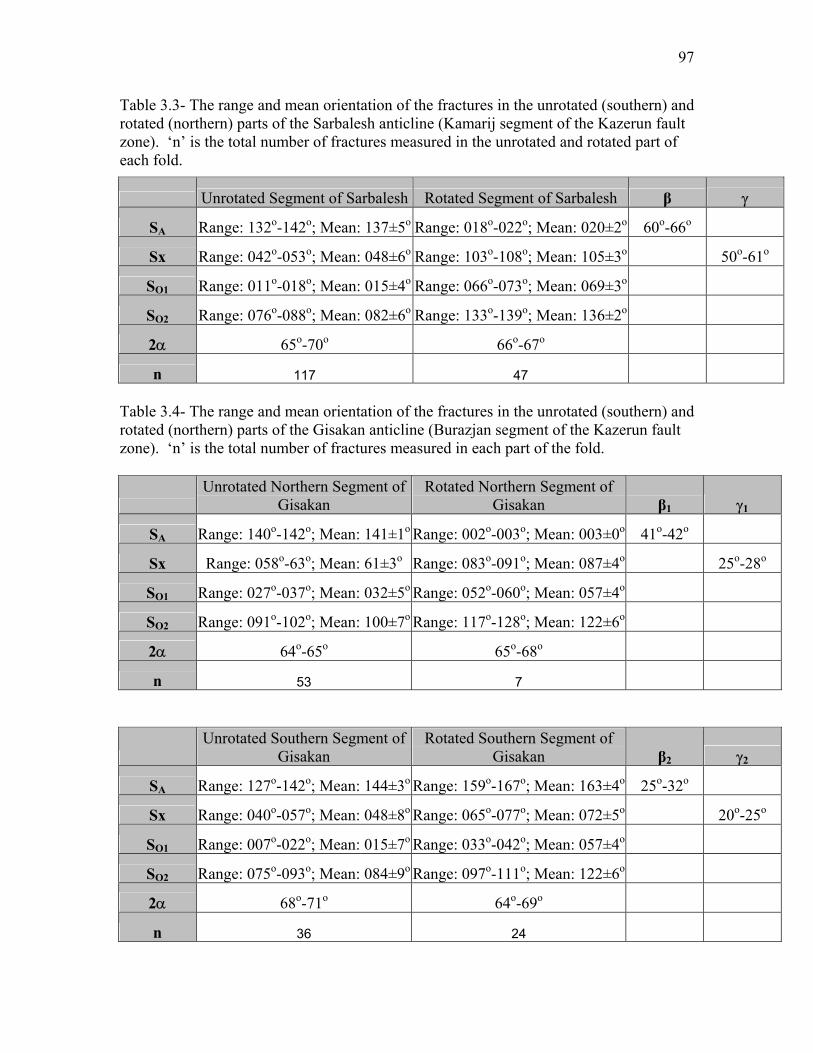
97
Table 3.3- The range and mean orientation of the fractures in the unrotated (southern) and rotated (northern) parts of the Sarbalesh anticline (Kamarij segment of the Kazerun fault zone). ‘n’ is the total number of fractures measured in the unrotated and rotated part of each fold.
Unrotated Segment of Sarbalesh Rotated Segment of Sarbalesh β γ
SA Range: 132o-142o; Mean: 137±5o Range: 018o-022o; Mean: 020±2o 60o-66o
Sx Range: 042o-053o; Mean: 048±6o Range: 103o-108o; Mean: 105±3o 50o-61o
SO1 Range: 011o-018o; Mean: 015±4o Range: 066o-073o; Mean: 069±3o
SO2 Range: 076o-088o; Mean: 082±6o Range: 133o-139o; Mean: 136±2o
2α 65o-70o 66o-67o
n 117 47 Table 3.4- The range and mean orientation of the fractures in the unrotated (southern) and rotated (northern) parts of the Gisakan anticline (Burazjan segment of the Kazerun fault zone). ‘n’ is the total number of fractures measured in each part of the fold.
Unrotated Northern Segment of
Gisakan Rotated Northern Segment of
Gisakan β1 γ1
SA Range: 140o-142o; Mean: 141±1o Range: 002o-003o; Mean: 003±0o 41o-42o
Sx Range: 058o-63o; Mean: 61±3o Range: 083o-091o; Mean: 087±4o 25o-28o
SO1 Range: 027o-037o; Mean: 032±5o Range: 052o-060o; Mean: 057±4o
SO2 Range: 091o-102o; Mean: 100±7o Range: 117o-128o; Mean: 122±6o
2α 64o-65o 65o-68o
n 53 7
Unrotated Southern Segment of
Gisakan Rotated Southern Segment of
Gisakan β2 γ2
SA Range: 127o-142o; Mean: 144±3o Range: 159o-167o; Mean: 163±4o 25o-32o
Sx Range: 040o-057o; Mean: 048±8o Range: 065o-077o; Mean: 072±5o 20o-25o
SO1 Range: 007o-022o; Mean: 015±7o Range: 033o-042o; Mean: 057±4o
SO2 Range: 075o-093o; Mean: 084±9o Range: 097o-111o; Mean: 122±6o
2α 68o-71o 64o-69o
n 36 24
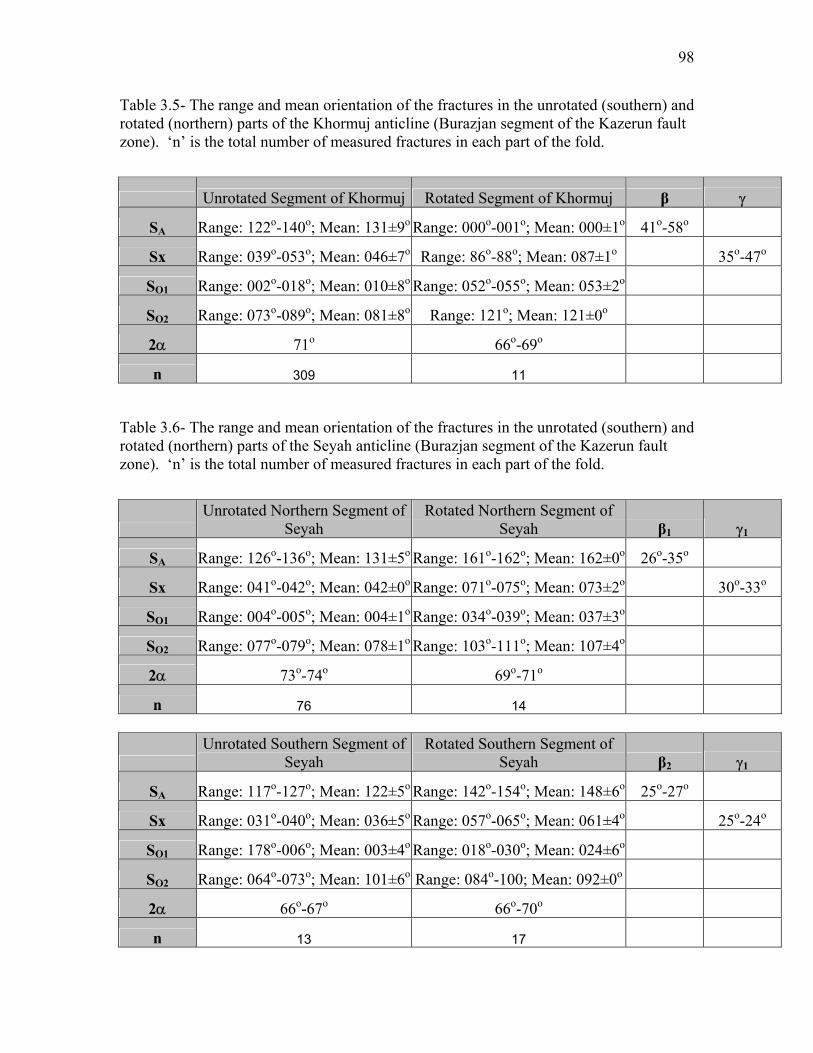
98
Table 3.5- The range and mean orientation of the fractures in the unrotated (southern) and rotated (northern) parts of the Khormuj anticline (Burazjan segment of the Kazerun fault zone). ‘n’ is the total number of measured fractures in each part of the fold.
Unrotated Segment of Khormuj Rotated Segment of Khormuj β γ
SA Range: 122o-140o; Mean: 131±9o Range: 000o-001o; Mean: 000±1o 41o-58o
Sx Range: 039o-053o; Mean: 046±7o Range: 86o-88o; Mean: 087±1o 35o-47o
SO1 Range: 002o-018o; Mean: 010±8o Range: 052o-055o; Mean: 053±2o
SO2 Range: 073o-089o; Mean: 081±8o Range: 121o; Mean: 121±0o
2α 71o 66o-69o
n 309 11
Table 3.6- The range and mean orientation of the fractures in the unrotated (southern) and rotated (northern) parts of the Seyah anticline (Burazjan segment of the Kazerun fault zone). ‘n’ is the total number of measured fractures in each part of the fold.
Unrotated Northern Segment of
Seyah Rotated Northern Segment of
Seyah β1 γ1
SA Range: 126o-136o; Mean: 131±5o Range: 161o-162o; Mean: 162±0o 26o-35o
Sx Range: 041o-042o; Mean: 042±0o Range: 071o-075o; Mean: 073±2o 30o-33o
SO1 Range: 004o-005o; Mean: 004±1o Range: 034o-039o; Mean: 037±3o
SO2 Range: 077o-079o; Mean: 078±1o Range: 103o-111o; Mean: 107±4o
2α 73o-74o 69o-71o
n 76 14
Unrotated Southern Segment of
Seyah Rotated Southern Segment of
Seyah β2 γ1
SA Range: 117o-127o; Mean: 122±5o Range: 142o-154o; Mean: 148±6o 25o-27o
Sx Range: 031o-040o; Mean: 036±5o Range: 057o-065o; Mean: 061±4o 25o-24o
SO1 Range: 178o-006o; Mean: 003±4o Range: 018o-030o; Mean: 024±6o
SO2 Range: 064o-073o; Mean: 101±6o Range: 084o-100; Mean: 092±0o
2α 66o-67o 66o-70o
n 13 17
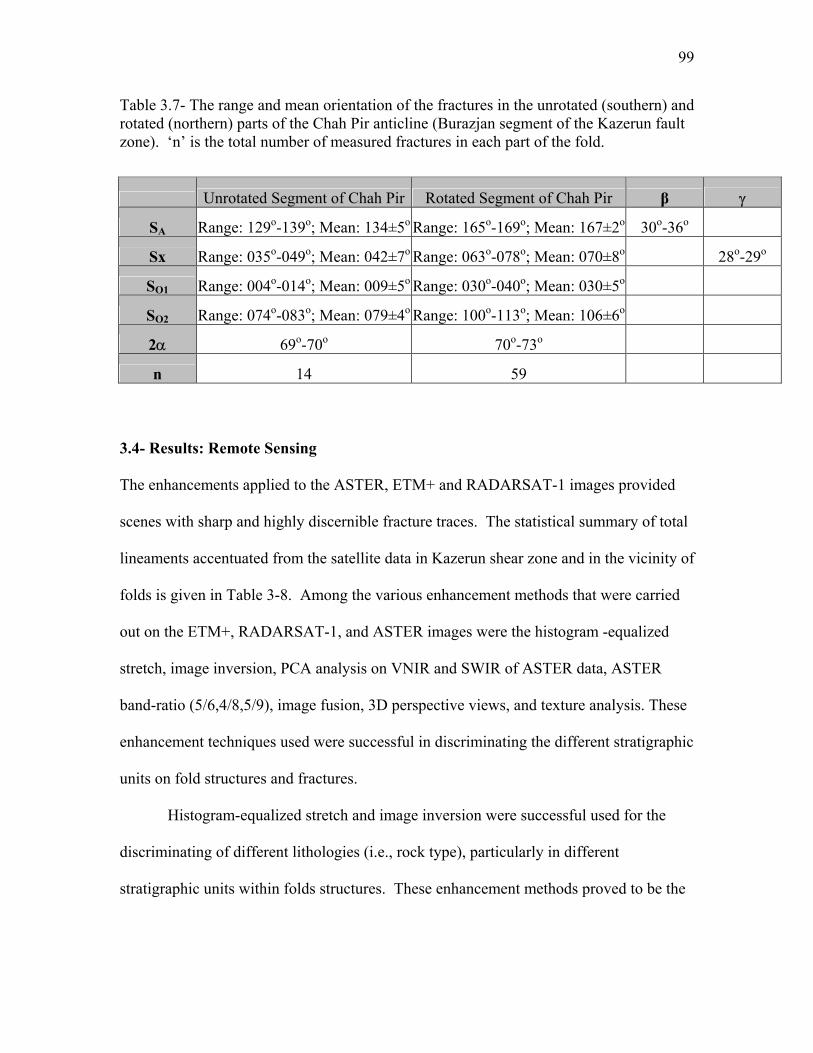
99
Table 3.7- The range and mean orientation of the fractures in the unrotated (southern) and rotated (northern) parts of the Chah Pir anticline (Burazjan segment of the Kazerun fault zone). ‘n’ is the total number of measured fractures in each part of the fold.
Unrotated Segment of Chah Pir Rotated Segment of Chah Pir β γ
SA Range: 129o-139o; Mean: 134±5o Range: 165o-169o; Mean: 167±2o 30o-36o
Sx Range: 035o-049o; Mean: 042±7o Range: 063o-078o; Mean: 070±8o 28o-29o
SO1 Range: 004o-014o; Mean: 009±5o Range: 030o-040o; Mean: 030±5o
SO2 Range: 074o-083o; Mean: 079±4o Range: 100o-113o; Mean: 106±6o
2α 69o-70o 70o-73o
n 14 59 3.4- Results: Remote Sensing The enhancements applied to the ASTER, ETM+ and RADARSAT-1 images provided
scenes with sharp and highly discernible fracture traces. The statistical summary of total
lineaments accentuated from the satellite data in Kazerun shear zone and in the vicinity of
folds is given in Table 3-8. Among the various enhancement methods that were carried
out on the ETM+, RADARSAT-1, and ASTER images were the histogram -equalized
stretch, image inversion, PCA analysis on VNIR and SWIR of ASTER data, ASTER
band-ratio (5/6,4/8,5/9), image fusion, 3D perspective views, and texture analysis. These
enhancement techniques used were successful in discriminating the different stratigraphic
units on fold structures and fractures.
Histogram-equalized stretch and image inversion were successful used for the
discriminating of different lithologies (i.e., rock type), particularly in different
stratigraphic units within folds structures. These enhancement methods proved to be the
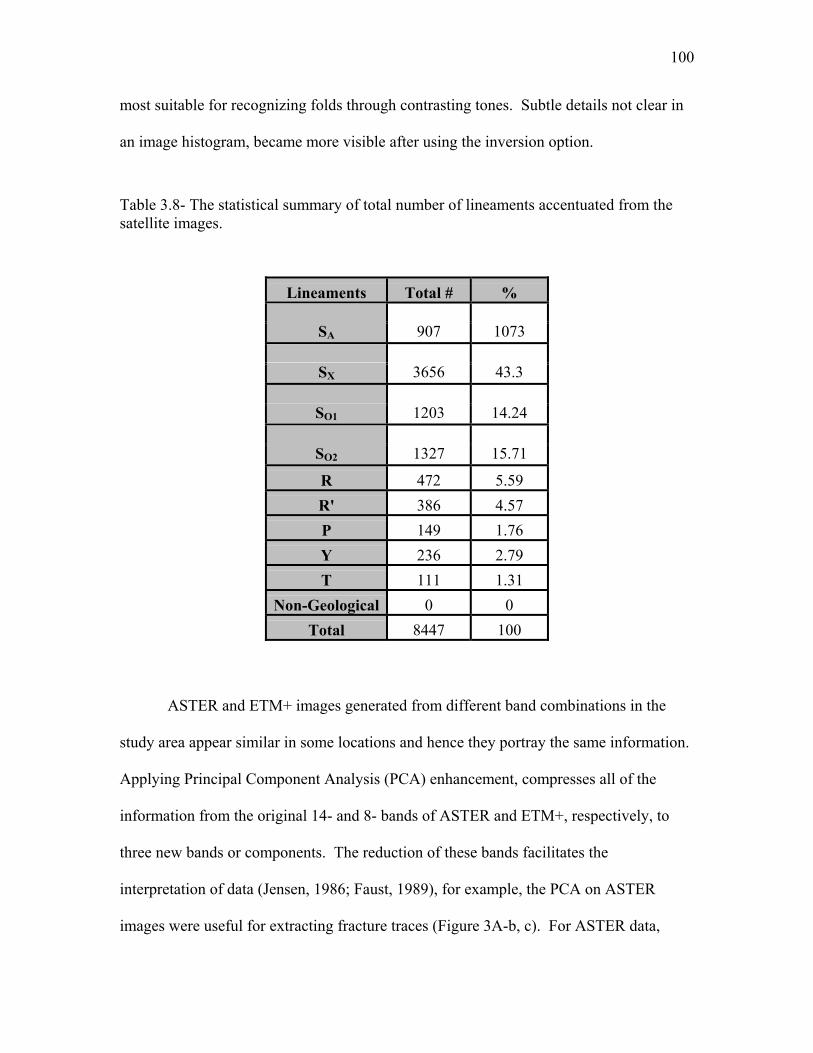
100
most suitable for recognizing folds through contrasting tones. Subtle details not clear in
an image histogram, became more visible after using the inversion option.
Table 3.8- The statistical summary of total number of lineaments accentuated from the satellite images.
Lineaments Total # %
SA 907 1073
SX 3656 43.3
SO1 1203 14.24
SO2 1327 15.71
R 472 5.59 R' 386 4.57 P 149 1.76 Y 236 2.79 T 111 1.31
Non-Geological 0 0 Total 8447 100
ASTER and ETM+ images generated from different band combinations in the
study area appear similar in some locations and hence they portray the same information.
Applying Principal Component Analysis (PCA) enhancement, compresses all of the
information from the original 14- and 8- bands of ASTER and ETM+, respectively, to
three new bands or components. The reduction of these bands facilitates the
interpretation of data (Jensen, 1986; Faust, 1989), for example, the PCA on ASTER
images were useful for extracting fracture traces (Figure 3A-b, c). For ASTER data,
101
three separate PCA images (with 3 new bands) generated for each VNIR (3-bands), and
SWIR (6-bands) subsystems. The results of the PCAs, generated for VNIR and SWIR,
were most helpful for accentuating the fractures. Two PCAs of SWIR and VNIR data are
complementary of each other, and the data from both of them were compared with each
other for data quality assurance. Applying the PCA enhancement on SWIR datasets is
especially useful in discriminating limestone from the alluvium that fill some of the
opened fractures. The PCA analysis, when applied to ETM+, was not very effective
especially for short fracture traces that were common in this study possibly due to a
higher number of original variables and bands compared to the VNIR and SWIR.
The applied band-ratio (5/6, 4/8, 5/9) on ASTER’s SWIR subsystem reduced the
topographic effect between multi-spectral bands, and helped distinguish lithological units
and especially lithologically-defined structures and faults. Application of this band-ratio
helped in extracting the larger number of fractures in the study area (Figure 3A-a). Band-
ratio enhancement was especially useful where the extensional fractures (e.g., Sx) were
filled with alluvium. Alluviums show a different spectral absorption and reflectance as
compared to the lithology (e.g., limestone) of the folded layers. Band 4 covers the
spectral region where most rocks and minerals have a maximum reflectivity, whereas
bands 5 to 9 cover the short wavelength infrared ranges where many carbonate minerals
have absorption features, allowing the discrimination of carbonate rocks, which defined
the folded and faulted structure, from other rocks.
The Bangestan and Khami Groups (Jurassic-Cretaceous), which are exposed in
the core of many anticlines, as well as the Asmari Formation (Oligocene) are dominated
by carbonate rocks (limestone and dolomite).
102
The rough surfaces of faults and boundaries of fracture zones are defined by
asperities and irregularities. Some of these irregularities act as natural corner reflectors
(Figure 2-5), especially where fractures are open and not filled with vein material or
alluvium, whereas the unfractured materials mimic near-diffuse to diffuse reflectors that
produce high amounts of backscatter and reflect almost uniformly in all directions
(Figure 2-5). The diffuse and corner reflectors produce a bright image in the
RADARSAT images that helped discriminating the fractures in the study area.
Due to the radar shadow-illumination effect, the side-looking geometry of the
Standard Beam mode of RADARSAT-1 data has been effective in structural studies
(Werle, 1999). Multiple side-look direction of RADAR provides precise information on
the subtle changes in the relief, and helps the features, hidden in shadow from one look
direction, to be revealed from another look direction. A look direction perpendicular to
the direction of lineaments enhanced the detection of these fractures.
Shadowing effect in these images enhances lineaments, joints, and faults, by
highlighting changes in feature orientation. Because RADARSAT brightens the sensor-
facing slopes of ridges while accentuating the lee slopes with shadow, linear ridges will
be easily distinguished and separated from fractures and faults.
The shallow incidence angles of the Standard Beam mode of RADARSAT-1 are
ideal for enhancing the subtle topographic relief of lineaments as they minimize the land
cover variations. Radar is also sensitive to changes in moisture and roughness, which
result in contrasting backscatter between different materials filling open fractures and the
sedimentary rocks forming the anticlines (Werle, 1999). Because edges of the images are
the areas that contain most of the information necessary for distinguishing and
103
discriminating between the adjacent objects, the edge enhancement technique were
carried out on these images. The fractures and the borders of the images are influenced
by the illumination condition (e.g., illumination direction, looking direction), and terrain
properties. Thus the result of this enhancement sharpened the edges of the image and
accentuated the fracture lineaments.
One of the most effective techniques used in this study was data fusion in which
ASTER and RADARSAT-1 data were combined using the PC Sharpening technique.
The image produced using this technique preserved the spectral information (e.g.,
distinction between different lithologies) from ASTER, and incorporated the structural
and topography information of the RADARSAT. The integration of these two types of
sensors, helped to enhance and extract the fracture traces (Figure 3B).
Unsupervised image classification, was not very useful for detailed fracture
analysis. Because of its sensitivity to the topography; landforms played a greater role in
the classification than differences in surface properties.
104
4. DISCUSSION 4.1- Structural Analysis The combined application of the remote sensing enhancement methods, orientation data
on rose diagrams, and GIS helped to distinguish fault- and fold-related fracture systems
in the study area. GIS, in particular, was very useful for sampling, processing, and
analyzing of the fractures over most of the study area. Four major fold-related fracture
sets, which provide qualitative constraints for the deformation of the Zagros, were
identified in the study area: (i) a NW-SE oriented axial set (SA); (ii) a NE-SW oriented
cross-axial, extensional set (SX); and (iii) two oblique sets of shear fracture, SO1 and SO2,
at 33±2o and 33±1o, respectively, to the mean cross-axial set. The axial fractures are less
dominant than the oblique and cross-axial fractures. The NW-SE trending axial fractures,
that are parallel to the axial trace of the corresponding folds in which fractures were
measured, are parallel with the main trend of the Zagros. The NE-SW trending cross-
axial fracture set bisects the acute angle between the two oblique sets of shear fractures
(SO1 and SO2), and resolves a NE-SW directed horizontal shortening axis, perpendicular to
the main trend of the Zagros (Figures 3-2).
Movement of deep-seated strike-slip faults can develop en-echelon folds and
lineaments in the overlaying sedimentary cover (Naylor et al., 1986). Examples of en-
echelon fold development can be seen along the Kazerun (e.g., Chah pir, Gisakan, Seyah,
and Khormuj anticlines) and Sabzpoushan faults (e.g., Nareh and Takhteh anticlines).
The movements along the basement strike-slip faults in the study area: have led to: (i) the
rotation of some of the folds in the Kazerun fault zone (e.g., the Gisakan and Sarbalesh
anticlines), (ii) extrusion of salt domes along the releasing stepovers of en-echelon
105
lineaments (Yassaghi, 2006), (iii) generation of new, undeformed folds at the restraining
stepovers of en-echelon lineaments (e.g., Nareh and Takhteh along the Sabzpushan fault),
and (iv) generation of a fracture system in the sedimentary cover (Naylor et al., 1986).
Moreover, slip due to the reactivation of the Kazerun fault zone has led to the
deformation of folds and formation of new sets of fault-related fractures in the deformed
anticlines.
Fracture sets in the Kazerun fault zone include the two Riedel shear fracture sets
(R, R’); a set of the extensional T fractures (mean orientation: 052±8o) parallel to the
shortening direction, an oblique shear fracture set (P) at an angle of 6o-21o CCW from the
Kazerun fault; and a NW-SE trending displacement shear (Y) fracture set, parallel to sub-
parallel to the Kazerun fault zone.
There is no displacement of stratigraphic contacts along the T-fractures set, which
are oriented perpendicular to the fold-related axial fracture set, implying that they formed
by extension. Table 3.1 shows that the acute angle α between the mean extensional T-
fracture set and the SO1 (33±2o) and SO2 (33±1o) oblique sets (Figure 3-2) are remarkably
close to the angle reported (~32o) for naturally- and experimentally-formed shear
fractures (e.g., Twiss and Moores, 1992). The mean of the measured T-fracture set
bisects the 2α angles between the intersecting SO1 and SO2 oblique fracture sets. These
angular relationships imply: (i) that the two oblique fractures are most probably members
of a conjugate shear fracture system that formed under the same state of stress and
synchronous with the cross-axial set, and (ii) that the direction of the horizontal,
minimum principal stretch (Z-axis), or shortening direction, is subparallel to the trace of
the cross-axial set. The means of the 2α angles measured in the rotated and unrotated
106
segments of deformed folds in the Kazerun fault zone (Figure 3-16) are remarkably close
to each other (Tables 3-3 through 3-7). This suggests that the folds are deformed by rigid
body rotation such that the angular relationship between the conjugate fractures is
preserved.
The orientation of the mean axial and cross-axial fold-related fracture set is
308±8o (i.e., NW-SE) and 039±7o (i.e., NE-SW), respectively, parallel and perpendicular
to the trend of the Zagros fold-and-thrust belt. The orientation of the mean axial and
cross-axial fold-related fracture set in the undeformed folds of the Kazerun fault zone is
314±8o (i.e., NW-SE) and 046±5o (i.e., NE-SW), respectively, parallel and perpendicular
to the trend of the Zagros fold-and-thrust belt. The shortening direction, resolved from
these fold-related fractures is oriented 046 ±9o, perpendicular to the grain (i.e., general
trend) of the Zagros orogenic belt. The shortening direction, resolved from the fold-
related fractures through out the ZFTB, in the undeformed folds, in the Kazerun fault
zone is oriented 046 ±5o, which is remarkably close to each other, and to the assumed
shortening direction of the Zagros Mountains. The shortening direction, determined
from the analysis of the fault-related fractures in the Kazerun basement fault zone, is
oriented 050o ±5o, subparallel to the shortening determined from the fold-related
fractures. This shows that the fold-related and fault-related fractures are kinematically
compatible. The horizontal shortening directions, resolved from both fold- and fault-
related fractures, in this study, are consistent with the current SW-NE convergence of the
Arabian and Eurasian plates measured using GPS (e.g. Vernant et al., 2004; Hessami et
al., 2006) and based on the detailed studies of the focal mechanisms (Jackson and Fitch,
1981).
107
It is widely believed (e.g., Falcon, 1969; McQuillan, 1991; Ameen, 1992) that the
basement of the fold-and-thrust belt of the Zagros is the continuation of the Arabian Plate
basement, which is fractured by N-S trending faults (e.g., Henson, 1951; Bushara, 1995).
The basement faults in the Zagros fold-and-thrust belt have been reactivated due to the
collision of the Arabian and Iranian plates. The reactivation of the basement faults is also
proposed for NW Iraq (Ameen, 1992) and in Saudi Arabia (Edgell, 1992).
Recent work by Yassaghi (2006) shows that basement faults (Oman, Bastak,
Bostaneh, Hendurabi, Razak, Sarvestan, and Kazerun), mapped using field observation
and integration of geomagnetic maps with remotely sensed data, align with some of the
domain boundaries, which were delineated in this study based on the fracture analysis,
and the regional changes in the fold axial traces (Figure 4-1). The changes in the axial
traces, from the general NW-trending in the Fars region to the EW-trending in Larestan,
and toward the Bandar Abbas region, can be explained by the presence of active deep-
seated faults (Yassaghi, 2006).
The defined domain boundaries, reported in this study, also align with the linear
clusters of the epicenters of recent seismic activity in the Zagros Range
(http://www.seismology.harvard.edu/CMTsearch.html, Ni and Barzangi, 1986; Baker et
al., 1993), which are thought to mark the boundaries of the Precambrian blocks that lie
beneath the Phanerozoic sequence (Figure 4-1). Some of the trans-fold fractures (length
≥ 104 m, Figure 3-1) that cut across several folds, occur along fault segments which
probably mark the boundaries of these Precambrian blocks (Figure 3-1). The spatial
distribution of the Hormuz salt, to the east in the Fars region, also seems to correlate with
some of the domain boundaries reported in this dissertation (Figure 3-1). Their
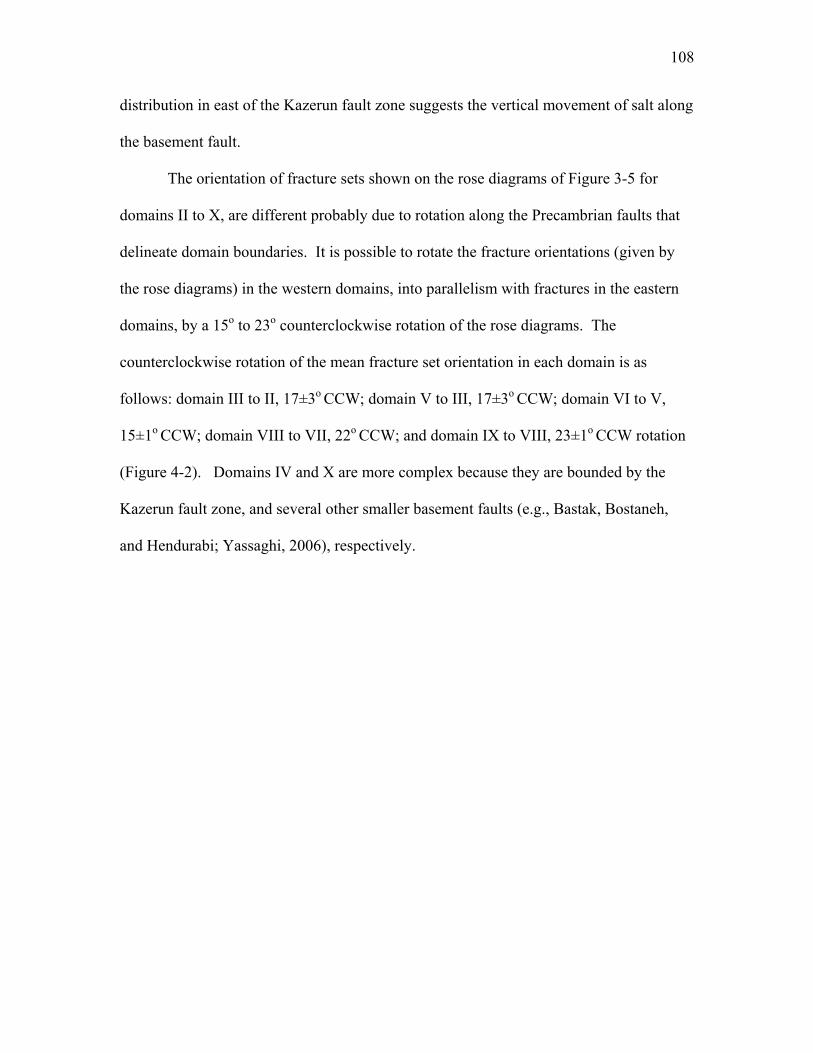
108
distribution in east of the Kazerun fault zone suggests the vertical movement of salt along
the basement fault.
The orientation of fracture sets shown on the rose diagrams of Figure 3-5 for
domains II to X, are different probably due to rotation along the Precambrian faults that
delineate domain boundaries. It is possible to rotate the fracture orientations (given by
the rose diagrams) in the western domains, into parallelism with fractures in the eastern
domains, by a 15o to 23o counterclockwise rotation of the rose diagrams. The
counterclockwise rotation of the mean fracture set orientation in each domain is as
follows: domain III to II, 17±3o CCW; domain V to III, 17±3o CCW; domain VI to V,
15±1o CCW; domain VIII to VII, 22o CCW; and domain IX to VIII, 23±1o CCW rotation
(Figure 4-2). Domains IV and X are more complex because they are bounded by the
Kazerun fault zone, and several other smaller basement faults (e.g., Bastak, Bostaneh,
and Hendurabi; Yassaghi, 2006), respectively.
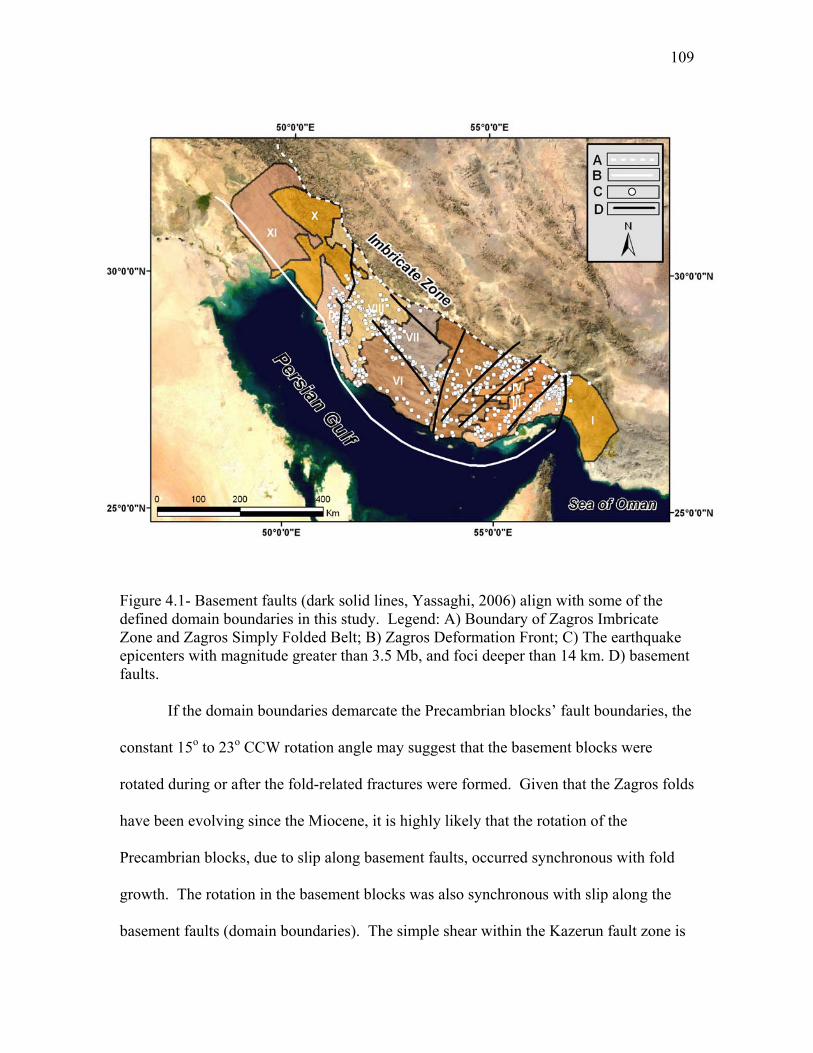
109
Figure 4.1- Basement faults (dark solid lines, Yassaghi, 2006) align with some of the defined domain boundaries in this study. Legend: A) Boundary of Zagros Imbricate Zone and Zagros Simply Folded Belt; B) Zagros Deformation Front; C) The earthquake epicenters with magnitude greater than 3.5 Mb, and foci deeper than 14 km. D) basement faults.
If the domain boundaries demarcate the Precambrian blocks’ fault boundaries, the
constant 15o to 23o CCW rotation angle may suggest that the basement blocks were
rotated during or after the fold-related fractures were formed. Given that the Zagros folds
have been evolving since the Miocene, it is highly likely that the rotation of the
Precambrian blocks, due to slip along basement faults, occurred synchronous with fold
growth. The rotation in the basement blocks was also synchronous with slip along the
basement faults (domain boundaries). The simple shear within the Kazerun fault zone is
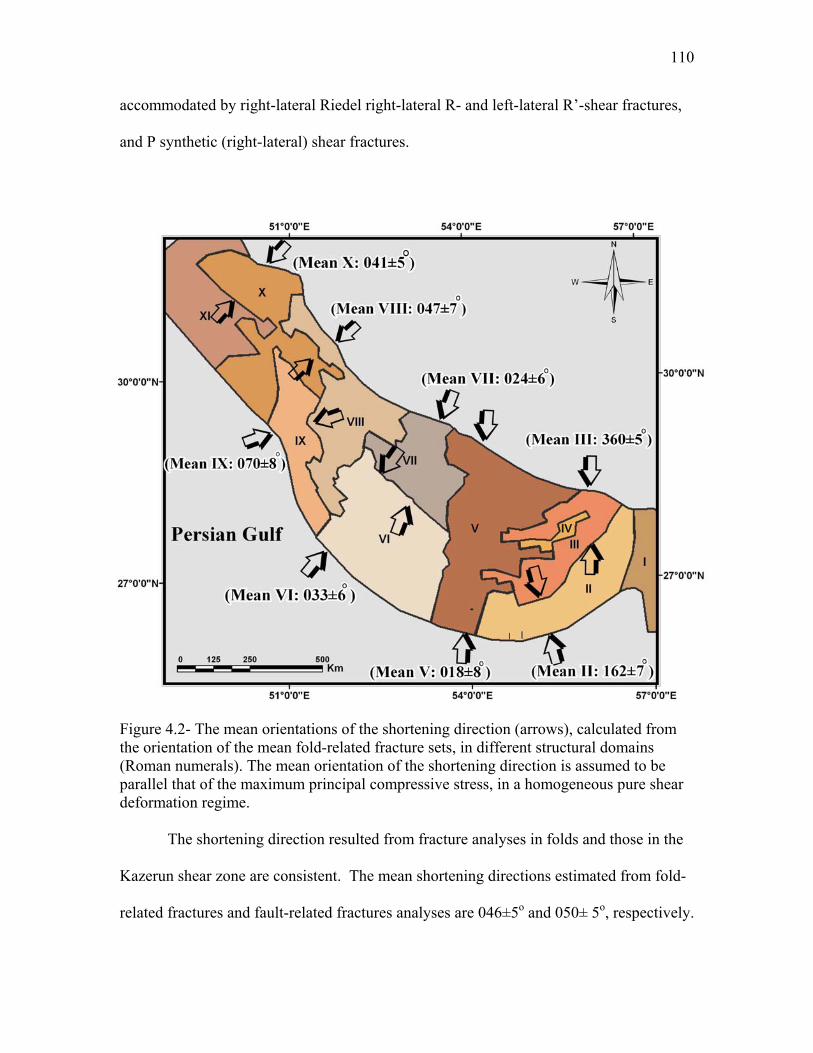
110
accommodated by right-lateral Riedel right-lateral R- and left-lateral R’-shear fractures,
and P synthetic (right-lateral) shear fractures.
Figure 4.2- The mean orientations of the shortening direction (arrows), calculated from the orientation of the mean fold-related fracture sets, in different structural domains (Roman numerals). The mean orientation of the shortening direction is assumed to be parallel that of the maximum principal compressive stress, in a homogeneous pure shear deformation regime.
The shortening direction resulted from fracture analyses in folds and those in the
Kazerun shear zone are consistent. The mean shortening directions estimated from fold-
related fractures and fault-related fractures analyses are 046±5o and 050± 5o, respectively.
111
They are kinematically compatible and indicate that the fractures which formed with
folding event and those with faulting event generated under the same kinematic state of
shortening. Fracture analyses suggest that formation of folds and basement block
faulting occurred during the Zagros orogeny. These data also have implications for thin-
and thick-skinned tectonics that is discussed in next section. This study emphasizes the
significance of basement structures in the deformation of sedimentary cover and Zagros
orogeny.
112
4.2. Thin- vs. thick-skinned tectonics
The thin-skinned tectonics hypothesis assumes no or minor basement involvement in the
deformation of the younger cover strata. It suggests that the NW-SE orientation of the
fold-and-thrust belt of the Zagros, is due to the late Miocene-Pleistocene, SW-NE
directed shortening of the Phanerozoic cover strata, and has no structural contribution
from the underlying Precambrian basement structures (e.g., Blanc et al. 2003; Sepehr et
al., 2006).
An alternative but less advocated hypothesis (e.g., Kashfi, 1983; Iranpanah, 1989;
McQuillan, 1991; Edgell, 1992; Talbot and Alavi, 1996), assumes a thick-skinned
tectonic model that involves the Precambrian basement. The thick-skinned tectonics
hypothesis holds that several sets of Precambrian basement faults reactivated and led to
the formation of the Phanerozoic depositional basins through block faulting, and
controlled facies changes and propagation of the basement faults into the younger
sedimentary sequence since the Precambrian (Edgell, 1973; Stoneley, 1981, 1990).
Renewed movements of these faults led to the draping and shearing of the
sediments and possibly their syn-depositional deformation in fault-bounded troughs. The
faults may have led to the subsidence of the cover strata and compaction and maturation
of the source rock by displacing them to greater depths (Ala, 1990).
In some fold-and-thrust belts such as Appalachians and Canadian Rocky
Mountains, there are transverse or oblique structures which deform the fold axial traces
(Harris, 1970; Dahlstorm, 1970; Boyer and Elliott, 1982). They are described as lateral
ramps on thrust faults within the sedimentary cover, and are examples of thin-skinned
tectonics, in which the basement is not involved in the shortening and deformation of the
113
sedimentary cover. The Sheep Mountains in Wyoming (Rocky Mountains) fold-related
fractures show an example of thin-skinned tectonics with brittle deformation occurring in
the fold hinge (Bellahsen et al, 2006).
In contrast, in other fold-and-thrust belts such as Himalayas and Tien Shan
Mountains in Asia (Molnar and Tapponnier, 1975; Tapponnier and Molnar, 1979), the
strike-slip faults truncate and rotate the fold axial traces. These active, large strike-slip
faults, which are oblique to the strike of the belt and basement faults (Baker et al., 1993),
are examples of a thick-skinned tectonics in which the basement faults are involved in the
deformation (shortening) of the belt.
Our knowledge of the basement faults, and especially the Kazerun fault, is mostly
post-Cretaceous when sedimentary thickness and facies changes were the results of the
fault activity. It is likely that the pre-Cretaceous kinematic and tectonic history of the
Kazerun fault was different from what it is. The basement faults probably have had a
significant impact on the vertical tectonics and differential uplift throughout the
Phanerozoic in the Zagros Range. Attributing the more than 6 km of vertical tectonic
movement in the Zagros solely to the thrust faults in the basement may not explain other
related phenomena such as facies change and horizontal slip along regional strike-slip
faults. It is possible that both the low angle thrust faults in the sedimentary cover strata,
and vertical strike-slip faults in the basement have continuously shaped the tectonic,
sedimentary, and stratigraphic history of the Zagros Range since the Precambrian.
The Phanerozoic sedimentary cover, although mechanically detached from the
underlying basement blocks by the incompetent and weak Hormuz salt, probably was
continuously deforming throughout the Paleozoic and Mesozoic mainly by movements
114
along basement faults. Deformation of the Phanerozoic cover sequence by folding and
thrusting, which became dominant since the Cretaceous collision, due to the convergence
of the Arabian and Iranian subplates, probably occurred synchronous with movement
along the basement faults. This thick-skinned deformation rotated the Precambrian
blocks, and folded the sedimentary cover strata into a series of large symmetrical
detachment folds which overlie the Hormuz salt which acts as a de’collement. The shape
of the Jura-type box fold anticlines (Kashfi, 1983) in the study area is probably controlled
by the distribution and thickness of the Hormuz salt (Sepehr and Cosgrove, 2005;
Molinaro et al., 2005; Sepehr et al., 2006).
Most of the anticlines are not truncate by the basement faults (e.g., Kazerun fault
zone), and they plunge toward these faults and terminate against them (Figure 2-1, 3-3, 3-
13). It suggests that these folds are formed synchronously with basement block faulting
or they pre-date the basement faulting. Based on the analyses of fold- related and fault-
related fractures and remarkably close shortening directions estimated from them (046±5o
and 050± 5o, respectively), this study suggests synchronous basement block faulting and
folding in the Phanerozoic cover strata in a major part of the Zagros Range. The analyses
propose a combination of thin- and thick-skinned tectonics throughout the Phanerozoic.
115
5. CONCLUSIONS The Zagros fold-and-thrust belt in southwest Iran evolved through a protracted period of
basement block faulting and a later contractional deformation that reactivated slip along
basement faults. The contraction, which started in the Triassic due to the convergence of
Africa and Eurasia, culminated with the separation and northeastward movement of
Arabian subplate away from the African plate, and its convergence and ultimate collision
with the Iranian plate.
These tectonic movements have led to the formation of two major systems of
fracture. One system includes four sets of fracture which formed during folding of the
Phanerozoic cover strata. The spatial variation of the orientation of these fold-related sets
of fracture is a function of the variation of the axial trace of the related folds.
The second system of fractures includes five sets of fracture which formed due to
displacement along the Kazerun fault zone. The kinematics revealed by the fault-related
fracture system is compatible with simple shear deformation along the Kazerun, right-
lateral strike-slip fault zone. Although the orientations of the fault-related fractures vary
with the change in the orientation of the Kazerun fault, the angular relationships between
them and the fault remain constant. These angular relationships indicate formation of the
fractures under a right-lateral slip during and after folding.
The Kazerun fault deforms the fold-related fracture sets by a rigid body rotation,
whereby the angles among fractures of this system remain virtually unchanged. In the
Kazerun shear zone, the axial traces of some of the folds are rotated to the N-S trend,
subparallel to the general trend of the fault zone. The drag of the folds along the fault is
kinematically consistent with the dextral movement of the Kazerun fault.
116
The shortening directions systematically vary across the structural domain
boundaries which mark the basement faults. The mean shortening direction determined
from the fold-related and fault-related fractures is 046±5o and 050± 5o, respectively,
which are remarkably close. Both of these shortening directions are consistent with the
regional SW-NE directed contraction which has been acting perpendicular to the strike of
the Zagros since the convergence of the African and Eurasian plates began in the
Triassic.
Despite the prevalent work that predominantly supports the thin-skinned tectonics
model for the Zagros fold-and-thrust belt, this study shows evidence for deformation
involving the basement at least since the Zagros folding began, and continuing to the
present. While the Phanerozoic cover strata above the Infracambrian Hormuz salt
deformed mainly through folding and thrusting, the Precambrian basement, which was
segmented during the late Precambrian, deformed by slip along high-angle faults. The
fracture analyses conducted in this study suggest that both thin- and thick-skinned
tectonics (Edgell, 1996; Sherkati and Letouzy, 2004; Molinaro et al., 2005) have
simultaneously been involved in the Zagros orogeny.
Throughout this study, several different GIS and Remote Sensing applications and
analyses were used in conjunction with geological principals and methodology. GIS
allows the user to view and analyze spatial data of a large area easily and capture data
simultaneously. A geodatabase consisting of fractures, faults, drainage patterns,
lithology, domain boundaries, and earthquake data was created for the study area.
Calculation of the length and trend of each fracture as well as drainage patterns were
measured to complete the geodatabase. The resulting spatial data assisted in defining the
117
angular relationship between the different sets of fractures, quantifying the amount of
rotation on deformed folds in the Kazerun shear zone, distinguishing between different
characteristics of the sets of fractures and estimating the shortening direction of both
fold-related and fault-related fractures. The geodatabase was also essential in providing
statistics of the thousands of lineaments and data points that were needed to complete this
study and allowing for the defining of the relationship between fracture set attributes
(e.g., frequency and length) and the lithology.
This study confirms that the combination of various enhanced images, with
different resolutions and image processing methods applied on them, combined with
common GIS techniques, are very effective and possibly the most suitable approach for
the analysis of fractures in vast and structurally complex areas such as the Zagros fold-
and-thrust belt.
118
REFERENCE
Ala, M., 1990, Seventy-five Years of Petroleum Exploration and Production in the
Zagros Basin of Southwest Iran: Seventy-five Years of Progress in Oil Field Science & Technology: Balkema, Rotterdam, p.61-76.
Alavi, M., 1994, Tectonic of the Zagros orogenic belt of Iran: New data and interpretations. Tectonophysics, v. 229, p.211-238.
Alavi, M., 2004, Regional Stratigraphy of the Zagros Fold-Thrust Belt of Iran and Its Proforeland Evolution. American Journal of Science, v. 304: p.1-20.
Allen, M. B., J. Jackson, and R. Walker, 2004, Late Cenozoic reorganization of the Arabia-Eurasia collision and the comparison of the short-term and long-term deformation rates. Tectonics, v. 23, TC2008, dio:101029/2003TC001530.
Ali, S.A. and Pirasteh, S., 2004, Geological applications of Landsat Enhanced Thematic Mapper (ETM) data and Geographic Information System (GIS): Mapping and structural interpretation in southwest Iran, Zagros Structural Belt. International Journal of Remote Sensing, 25(21): 4715-4727.
Ali, S.A., Rangzan, K. and Pirasteh , S., 2003, Remote sensing and GIS study of tectonics and net erosion rates in the Zagros Structural Belt, Southwestern Iran. Mapping Sciences & Remote Sensing, 40(4): 258-267.
Ameen, M.S., 1992, Effects of Basement Tectonics on Hydrocarbon Generation, Migration, and Accumulation in Northern Iraq. American Association of Petroleum Geologists Bulletin: v. 76, p. 356-370.
Aydin, A., Nur, A., 1982, Evolution of pull-apart basins and their scale independence. Tectonophysics, 1, 91-105. Aziz Zadeh, M., 1997, Structural setting of the Qatar-Kazerun fault in the Zagros fold-
and thrust-belt: a structural model. Master thesis, Shahid Beheshti University, Tehran, Iran, 282p. (Persian).
Babaie, Hassan, A., Babaei, A., Ghazi, A. M., and Arvin, M., (2006) Geochemical, 40Ar/39Ar age, and isotopic data for crustal rocks of the Neyriz ophiolite, Iran. Canadian Journal of Earth Sciences, 43:57-70.
Babaei, A., Babaie, H. A., and Arvin, M., 2005, Tectonic evolution of the Neyriz ophiolite, Iran: an accretionary prism model. Ofioliti, v. 30 (2), p. 65-74.
Babaie, H. A., Ghazi, A.M., Babaei, A., La Tour, T.E., and Hassanipak, A. A. 2001, Geochemistry of arc volcanic rocks of the Zagros crust zone, Neyriz, Iran. Journal of Asian Earth Sciences, v.19, p. 61-76.
Bahroudi, A and Koyi, H., 2003, Effect of spatial distribution of Hormuz salt on deformation style in the Zagros fold and thrust belt: an analogue modeling approach. Journal of the Geological Society, v.160, p.719-733.
Baker, C., Jackson, J., and K. Priestley, 1993, Earthquakes on the Kazerun Line in the Zagros Mountains of Iran: Strike-slip Faulting Within a Fold-and Thrust Belt. Geophysical Journal International, v. 115, p. 41-61.
Barzegar, F.1994, Basement fault mapping of East Zagros folded belt (S.W. Iran), based on space-borne remotely sensed data. Proceeding of the tenth thematic conference on geologic remote sensing. 1: 455-466.
Bellahsen, N., Fiore, P., Pollard, D.D., 2006, The role of fractures in the structural
119
interpretation of Sheep Mountain Anticline, Wyoming. Journal of Structural Geology, 28, p. 850-867. Berberian, M., 1976, contribution to the seismotectonics of Iran (Part II). Geological Survey of Iran, 30. Berberian, M., 1986, Seismotectonics and earthquake-fault hazard study of the Karkheh river Project. Jahad-e Sazandegi, Tehran (Persian). Berberian, M., 1995, Master “Blind" thrust faults hidden under the Zagros folds: Active
basement tectonics and surface morphotectonics. Tectonophysics: v. 241, p.193-224.
Berberian, M. and G. C. King., 1981, Towards a Paleogeography and Tectonic Evolution of Iran. Canadian Journal of Earth Sciences, v. 18, p.210-265.
Berberian, M., Yeats, R. S., 2001, Contribution of archeological data to studies of earthquake history in the Iranian Plateau. Journal of Structural Geology, 23, p. 563-584.
Beydoun, Z. R., 1991, Arabian plate hydrocarbon geology and potential- a plate tectonic approach. AAPG studies in geology, 33, p.77.
Beydoun, Z. R., Hughes Clarke, M. W., and R. Stoneley, 1992, Petroleum in the Zagros Basin: A Late Tertiary Foreland Basin Overprinted onto the Outer Edge of a Vast Hydrocarbon-rich Paleozoic-Mesozoic Passive Margin Shelf. American Association of Petroleum Geologists Bulletin Memoir: v. 55, p.309-339.
Blance, 2003, Structural Styles in the Zagros Simple Folded Zone, Iran. Journal of the Geological Society, v.160, p.401-412.
Boyer, S.E., Elliott, D., 1982, Thrust systems. American Association of Petroleum Geologists Bulletin, 66, 1196-1230.
Bretschneider, T. and Kao, O., 2000. Image fusion in remote sensing. Proceedings of the 1st Online Symposium of Electronic Engineers (OSEE). British Petroleum CO. LTD., 1964, Geological maps, columns, and sections of the High
Zagros of SW Iran. 22nd Internat. Geol. Cong. Proc., Delhi, scale 1:250,000. Bushara, M. N., 1995, Subsurface Structure of the Eastern Edge of the Zagros Basin as
Inferred from Gravity and Satellite Data. American Association of Petroleum Geologists Bulletin, v. 79, p.1259-1274.
Chernyshev, S. N. and W. R. Dearman., 1991, Rock fractures: Butterworth-Heinemann, 272p.
Colman-Sadd, S.P., 1978. Fold Development in Zagros Simply Folded Belt, Southwest, Iran. American Association of Petroleum Geologists Bulletin, v. 62, p. 984-1003.
Dahlstorm, C.D.A., 1970, Structural geology in the eastern margin of the Canadian Rocky Mountains. Bulletin of Canadian Petroleum Geology, 18, 332-406.
Dercourt, J., Zonenshain, L. P., Ricou, L. E., Kazmin, V. G., Le Pichon, X., Knipper, A. L., Grandjacquet, C., Sbortshikov, I. M., Geyssant, J., Lepvrier, C., Pechersky, D. H., Boulin, J., Sibuet, J. C., Savostin, L.A., Sorokhtin, O., Westpal, M., Bazhenov, M. L., Lauer, J. P. and B. Biju-Duval., 1986. Geologial Evolution of the Tethys Belt from the Atlantic to the Pamirs since the Lias. Tectonophysics, v. 123, p.241-315.
Dewey, J. W., Grentz, a., 1973, The Ghir earthquake of April 10, 1972 in the Zagros Mountains of Southern Iran: Seismotectionc aspects and some results of a filed reconnaissance. Bull. Seism, Soc. Am., 63, p. 2071-2090
120
Drury, S., 2001, Image interpretation in geology, 3rd edition; Blackwell Science Inc., 290 p.
Edgell, H.S., 1996, Salt tectonism in the Persian Gulf Basin, in Salt Tectonics, edited by J.L. Alsop, D.J. Blundell, and I. Davison, Geological Society Special Publications, 100, p. 129-151.
IDL, 2005, The ENVI user’s guide, ITT Visual Information Solutions, Boulder, Colorado Falcon, N. L., 1969, Problem of the Relationship between Surface Structures and Deep
Displacements Illustrated By the Zagros Range: Time and Place in Orogeny. Geological Society Special Publications, v. 4, p. 9-22
Falcon, N. L., 1974, Southern Iran: Zagros Mountains: A. M. Spencer (ed), Mesozoic- Cenozoic Orogenic Belt. Geologic Society of London Special Publication, v. 4, p.199-211.
Farhoudi, G., Samani, N., Kowsar, A., 1989, The origin of freshwater in the Persian Gulf: A new hypothesis. Journal of Hydrology, 11(3).
Freund, R., 1970, Rotation of strike-slip fault is Sistan, southeastern Iran, Journal of Geology, 78.
Friedman, M., 1969, Structural Analysis of Fractures in Cores from Saticoy Filed, Ventura County, California. The American Association of Petroleum Geologists: v. 53(2), p.367-389.
Fürst, M., 1990, Strike-slip Faults and Diapirism of the South-Eastern Zagros Ranges. Symposium on Diapirism with Special Reference to Iran: p.149-181.
Gorin, B. A., 2004, Performance of spatial sharpening methods for hyperspectral imagery. SPIE digital library, v. 5409, Airborne Intelligence, Surveillance, Reconnaissance (ISR) Systems and Applications, p. 155-168
Harding, T. P., Lowell, J. D., 1979, Structural styles, their plate tectonic habitats, and hydrocarbon traps in petroleum provinces. AAPG bull, 63.
Harris, L.D., 1970, Details of thin-skinned tectonics in parts of Valley and Ridge and Cumberland Plateau Provinces of southern Appalachians, in studies of Appalachians geology: central and southern, p.161-173, eds Fisher, G, W., Pettijohn, F, J., Reed, J. C. and Weaver, K.N., Wiley interscience publishers, New York.
Haynes, S.J., McQuillan, H., 1974, Evolution of the Zagros suture zone, Southern Iran. Geological Society of America Bulletin, 85, p. 739-744.
Hessami, K., Koyi, H.A., and C.J. Talbot, 2001a, The significance of strike-slip faulting in the basement of the Zagros Fold and Thrust Belt. Journal of Petroleum Geology, v. 24(1), p.5-28.
Hessami, K., 2002, Tectonic history and present-day deformation in the Zagros Fold-Thrust Belt. Comprehensive summaries of Uppsala dissertations from the faculty of science and technology: Uppsala, Acta Universities Upsaliensis, v. 700, p.1-13.
Hessami, K., Nilforoushan, F., and Talbot, C.J. 2006, Active deformation within the Zagros Mountains deduced from GPS measurements. Journal of the Geological Society; London, v. 163, p.143-148.
Huber, 1977, Tectonic Map of Iran, 1: 2500000, NIOC Exploration and Prosuction. Husseini, M.I., 1988, The Arabian Infracambrian extensional system. Tectonophysics,
v.148, p.93-103. Iranpanah, A., 1989, Thematic mapping of basement-related cross-strike structural discontinuities and their relationship to potential oil-bearing structures.
121
Photogrammetric Engineering & Remote Sensing, 55(10): 1491-1496. Jackson, J. A., Fitch, T.J., 1981, Basement faulting and focal depth of the larger
earthquakes in the Zagros mountains (Iran). Geophysical Journal of the Royal Astronomical Society, 64, p. 561-586.
Jackson, J. A., McKenzie, D. P., 1984, Active tectonics of Alpine-Himalayan belt between western Turkey and Pakistan. Geophysical Journal of the Royal Astronomical Society, 77, p. 185-264.
Jensen, J. R., (Ed.), 1986, Introductory Digital Image Processing, Englewood Cliffs, New Jersey: Prentice-Hall. James, G. and J.G.Wynd, 1965, Stratigraphic Nomenclature of Iranian Oil Consortium Agreement Area. American Association of Petroleum Geologists Bulletin, v.49, p.2182-2245. Kadinsky-Cade, K. and M. Barzangi, 1982, Seismotectonics of Southern Iran: The Oman
line. Tectonics, v.1, p.389-412. Kamen-Kaye, M., 1970, Geology and Productivity of Persian Gulf Synclinarium.
American Association of Petroleum Geologists Bulletin, v.54, p. 2371-2394. Kashfi, M.S., 1983, Variations in tectonics styles in the Zagros geosyncline and their
relation to the diapirism of salt in Southern Iran. Journal of Petroleum Geology: v.6, 2, p. 195-206.
Kazmin, V., Ricou, L.E. and I.M. Sbortshikov, 1986a, Structure and Evolution of the Passive Margin of the Eastern Tethys. Tectonophysics, v.123, p.153-179.
Kent, P.E., 1979, The Emergent Hormuz Salt Plugs of Southern Iran. Journal of Petroleum Geology, v. 2, p.117-144.
Lensch, G., Schmidt, K. and M. Davoudzadeh., 1984, Introduction to the Geology of Iran. Neues Jahrbuch für Geologie und Paläontologie, v.168, p.155-164.
Less, G.M., Falcon, N.L., 1952, The geographical history of the Mesopotamian plains. Journal of Geography, p.118. Lillesandm, T.M. and Kiefer, R.W.,(Ed.), 2000, Remote Sensing and Image
Interpretation, New York, John Wiley & Sons. Mandl, G., 1988, Mechanics of the Tectonic Faulting, Models and Basic concepts:
Elsevier, 407pp. Maggie, A., Jackson, J., Priestley, K., Baker, C., 2000, A re-assessment of focal depth
distributuions in southern Iran, the Tien Shan and northern Indian: Do earthquakes really occur in the continental mantle?. Geophysical Journal International, v. 143, p. 629-661.
McQuarrie, N., 2004, Crustal scale geometry of the Zagros Fold-Thrust Belt, Iran. Journal of Structural Geology, v. 26, p. 519-535.
McQuillan, H., 1973, Small-Scale Fracture Density in Asmari Formation of Southwest Iran and Its Relation to Bed Thickness and Structural Setting. American Association of Petroleum Geologists Bulletin, v.57, p.2367-2385.
Molinaro, M., Leturmy, P., Guezou, J.-C., Frizone de Lamotte, D. and S. A.Eshraghi., 2005, The Structure and Kinematics of the Southeastern Zagros Fold-Thrust Belt, Iran: From Thin-Skinned to Thick Skinned Tectonics. Tectonics, v. 24(3), p. Tc3007.
122
Molnar, P., Tapponnier, P., 1975, Cenozoic tectonics of Asia: effects of a continental collision. Science, 189, p. 419-426.
Morris, P., 1977, Basement structure as suggested by aeromagnetic surveys in southwest Iran. Paper presented at Second Geological Symposium of Iran, Iranian Pet. Inst., Tehran.
Motiei, H., 1993, Stratigraphy of Zagros: Treatise on the Geology of Iran. Geological Survey of Iran, Tehran.
Naylor, M.A., Mandl, G., Sijpestenijin, C.H.K., 1986, Faults geometries in basement- induced wrench faulting under different initial stress states. Journal of structural geology, 8, p. 737-752.
Nedaei, M.,1999, Master thesis, Shiraz University, Shiraz, Iran, p. (Persian). Ni, J., Barzangi, M., 1986, Seismotectonics of the Zagros continental collision zone and a
comparison with the Himalayas. Journal of Geophysical Research, 9, p. 8205-8218.
Nur, A., Ron, H., Scotti, O., 1989, Mechanics of distributed fault and block rotation, in: C. Kissel and C. Laj (eds.), paleomagnetic rotations and continental deformation, Kluwer academic publishers.
Price, N.J., Cosgrove, J.W., 1990, Analysis of geological structures, Cambridge University Press, Cambridge, 502 pp.
Pollard, D.D. and A. Aydin, 1988, Progress in Understanding Jointing Over the Past Century. GSA Bulletin, v.100(8), p.1181-1204.
Rangzan, K. and Iqbaluddin , 1995, Morpho-Tectonic Study of Zagros Structural Belt of SW Iran Using Remote Sensing Techniques. Journal of the Indian Society of Remote Sensing, v. 23(4), p.211-224.
Regard, V., Bellier, J.C. Thomas, M.R. Abbasi, J. Mercier, E. Shabanian, K. Feghhi, and S. Soleymani, 2004, Accomodation of Arabia-Eurasia Convergence in the Zagros Makran Transfer Zone, SE Iran: A transition Between Collision and Subduction Through a Young Deformation System. Tectonics, v. 23, TC4007, doi: 10.1029/2003TC001599.
Sabins, F. F., 1987, Remote sensing; principles and interpretation. New York: 2nd Edition, (W.H. Freeman & Co.), 449p.
Sepehr, M. and Cosgrove, J.W., 2004, Structural Framework of the Zagros Fold-Thrust Belt, Iran. Mar, Pet. Geol.,v. 21, p.829-843.
Sepehr, M. and Cosgrove, J.W., 2005, Role of the Kazerun fault in the formation and deformation of the Zagros Fold-Thrust Belt, Iran. Tectonics, v. 24, TC5005, doi: 10.1029/2004TC001725, p. 1-13.
Sepehr, M., Cosgrove, J.W., Moieni, M., 2006, The impact of cover rock rheology on the style of folding in the Zagros fold-thrust belt. Tectonophysics, 427, p. 265-281.
Setudehnia, A., 1978, The Mesozoic Sequence in South-West Iran and Adjacent Areas. Journal of Petroleum Geology, v.1, p.3-42.
Sherkati, H. and Letouzy, J., 2004, Variation of Structural Style and Basin Evolution in the Central Zagros (Izeh Zone and Dezful Embayment), Iran. Journal of Petroleum Geology, v. 21, p. 535-554.
123
Sylveter, A.G., 1988, strike-slip faults, GSA Bulletin, 100. Stearns, D.W. and M. Friedman, 1972, Reservoirs in Fractures Rock. The American
Association of Petroleum Geologists reprinted from AAPG Memoir 16, Stratigraphic Oil and Gas Fields: p.82-106.
Stocklin, J., 1968, Possible Ancient Continental Margins in Iran. The Geology of Continental Margins, p. 873-887.
Stoneley, R., 1981, The Geology of the Kuh-e Dalneshin Area of Southern Iran, and Its Bearing on the Evolution of Southern Tethys. Journal of the Geological Society, London, v.138: p. 509-526.
Talbot, C.J. and M. Alavi., 1996, The Past of a Future Syntaxis across the Zagros. Journal of the Geological Society of London, v.100, p. 89-109.
Talebian, M., Jackson, J., 2004, A reappraisal of earthquake focal mechanisms and active shortening in the Zagros mountains in Iran. Geophysical Journal International, v. 156, p. 506-526.
Tapponnier, P., Molnar, P., 1979, Active faulting and late Cenozoic tectonics of the Tien Shan, Mongolia and Baykal region. Journal of Geophysical Research, 84, 3425-3459.
Tatar, M., Hatzfield, D., Ghafory-Ashtiyani, M., 2004, Tectonics of the Central Zagros (Iran) Deduced from Microearthquake Seismicity. Geophysical Journal International, v. 156, p. 255-266.
Tchalenko, J.S., Braud, J., 1974, Seismicity and structure of the Zagros (Iran): The main recent fault between 33o and 35o. Philos. Trans. R. Soc. London, 227(1262).
Twiss, R. J., and Moores, E. M., (Ed.), 1992, Structural Geology: New York, W. H. Freeman and Company, 532p.
Van Der Pluijm, B. A., Marshak, S., 2004, Earth Structure, An introduction to structural geology and tectonics, 2nd edition, W.W.Norton & Company, Inc., 656p.
Vernant, P., Nilforoushan, F., Hatzfeld, D., 2004, Present-Day Crustal Deformation and Plate Kinematics in the Middle East Constrained by GPS Measurements in Iran and Northern Omam. Geophysical Journal International, v. 157, p. 381-398.
Werle, D., 1999, Resources management, mapping and environmental monitoring in Iran, RADARSAT International Inc., Vancouver, BC/ CANADA, p.68.
Yamini-Fard, F., Hatzfeld, D., Tatar, M., Mokhtari, M., 2006, Microearthquake seismicity at the intersection between the Kazerun fault and the Main Recent Fault (Zagros, Iran). Geophysical Journal International, 166, no.1, p. 186-196.
Yassaghi, A., Integration of Landsat image interpretation and geomagnetic data on verification of deep-seated transverse fault lineaments in SE Zagros, Iran. International Journal of Remote Sensing, 27(18-20): 4529-4544.