kinematics/ travel graphs/ conversion graphs · pdf filethe gradient of a distance –...
TRANSCRIPT
KINEMATICS/ TRAVEL GRAPHS/
CONVERSION GRAPHS
DISTANCE – TIME GRAPHS:
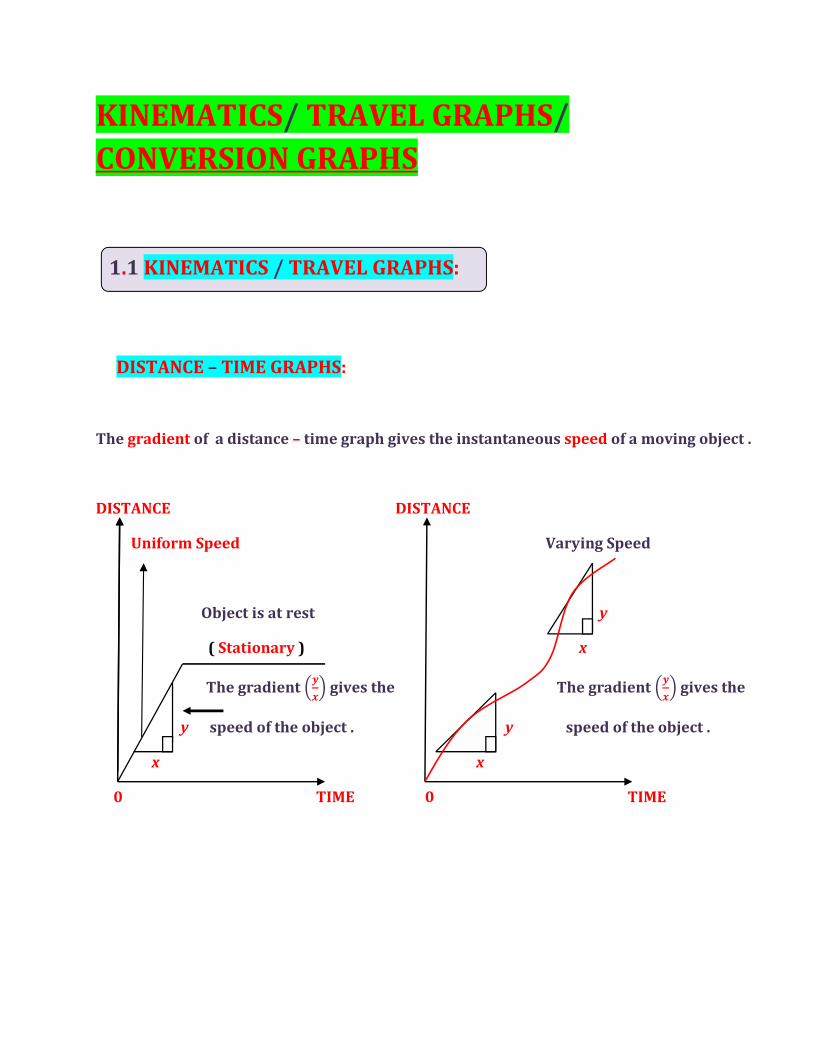
The gradient of a distance – time graph gives the instantaneous speed of a moving object .
DISTANCE DISTANCE
Uniform Speed Varying Speed
Object is at rest y
( Stationary ) x
The gradient ��
�� gives the The gradient �
�
�� gives the
y speed of the object . y speed of the object .
x x
0 TIME 0 TIME
1.1 KINEMATICS / TRAVEL GRAPHS:

EXAMPLE1:
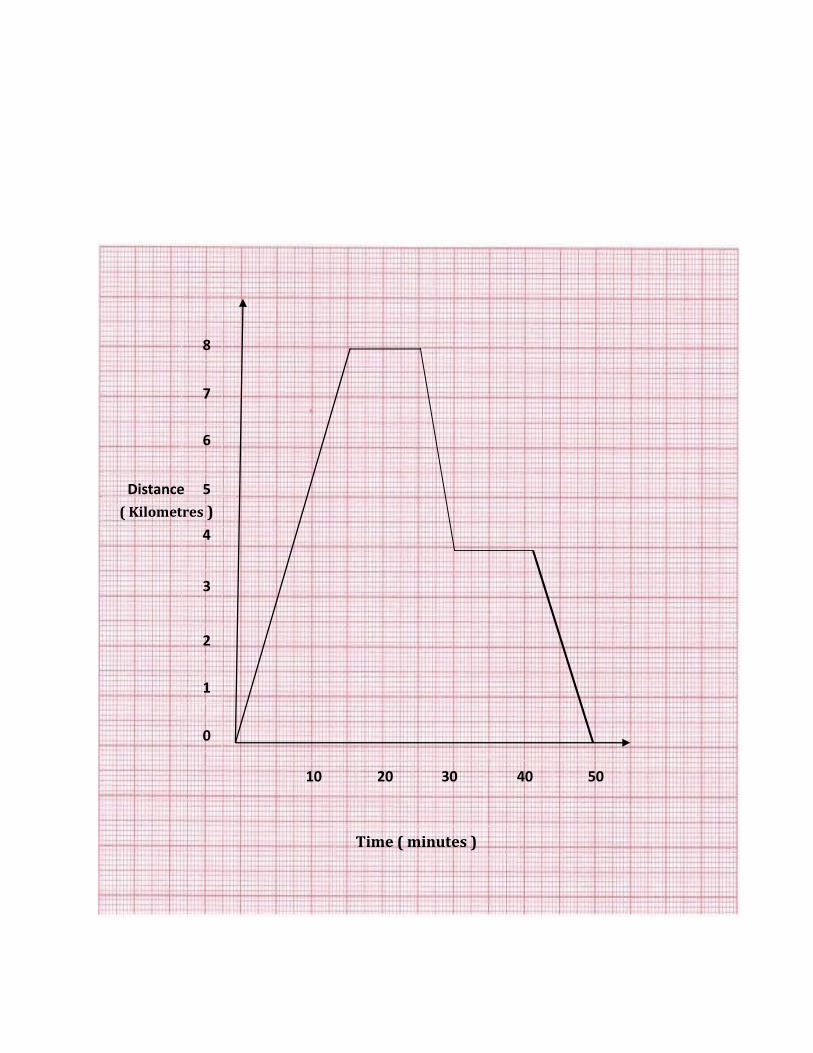
Andrew drove from home to the post office to send a parcel. On his way back, he stopped at
the library to return a book . The travel graph shows his journey.
a) What was his speed in the first 15 minutes ? Gives your answer in kilometers per hour.
b) How far is the post office from his home?
c) How long was he at the library?
d) What was his speed when t = 27?
e) What was his average speed for the whole journey?
AVERAGE SPEED = ����� �������� ���������
����� ���� �����
8
6
3
4
2
5
7
0
1
10 30 20 50 40
Distance
( Kilometres )
Time ( minutes )
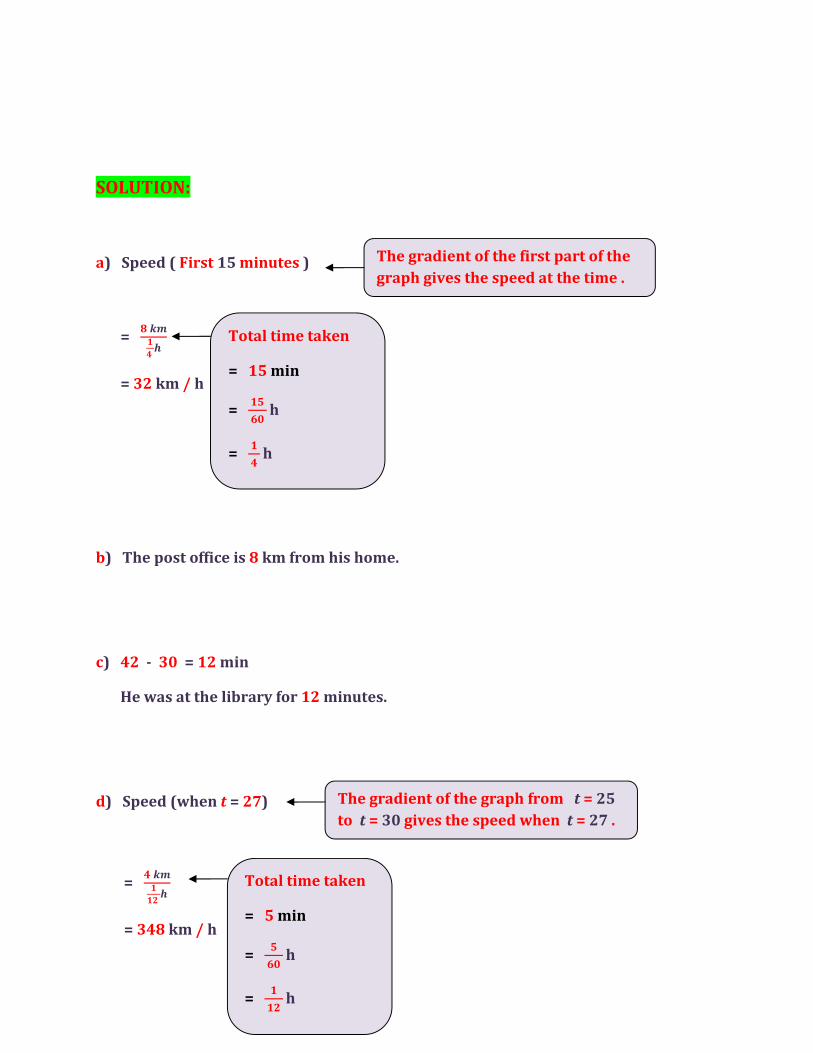
SOLUTION:
a) Speed ( First 15 minutes )
= � ��
�
� �
= 32 km / h
b) The post office is 8 km from his home.
c) 42 - 30 = 12 min
He was at the library for 12 minutes.
d) Speed (when t = 27)
= � ��
�
�� �
= 348 km / h
The gradient of the first part of the
graph gives the speed at the time .
Total time taken
= 15 min
= ��
�� �
= �
� �
Total time taken
= 5 min
= �
�� �
= �
�� �
The gradient of the graph from t = 25
to t = 30 gives the speed when t = 27 .

e) Average speed from the whole journey
= ����� �������� ���������
����� ���� �����
= �� ��
�
� �
= 19.2 km / h
EXAMPLE2:
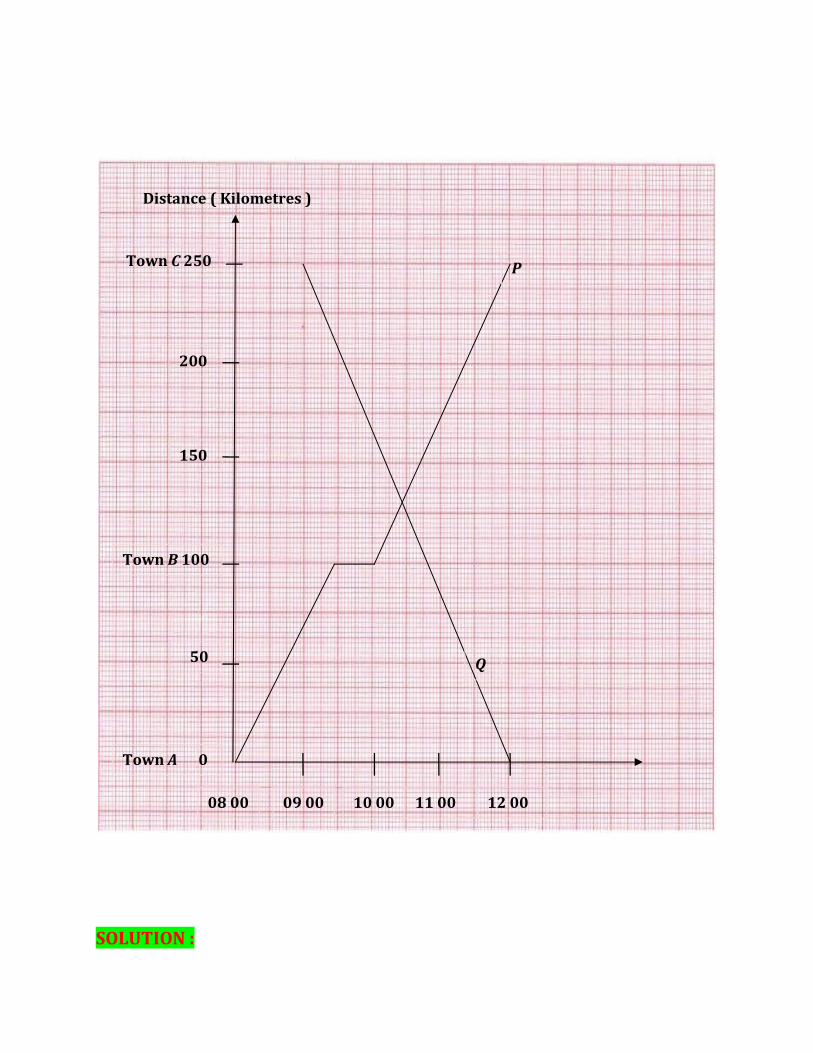
The travel graph show the journey of two trains P and Q travelling between towns A, B and
C . Town A and Town B are 100 km apart while Town B and Town C are 150 km apart . Train
P leaves Town A at 08 00 and arrives at Town C at 12 00, Train Q leaves Town A at 09 00
and arrives at Town A at 12 00 .
FIND
a) The speed of train P from
i) 08 00 to 09 30 ,
ii) 09 30 to 10 00 ,
Total distance travelled
= 8 + 8
= 16 km
Total time taken
= 50 min
= ��
�� �
= �
� �
iii) 10 00 to 12 00 .
b) The average speed of Train P for the whole journey ,
c) The average speed of Train Q for the whole journey ,
d) The distance from Town A when the trains cross each other ,
e) The time P would have reached Town C if it did not stop at Town B .

SOLUTION :
Distance ( Kilometres )
Town C 250
200
150
08 00
50
Town B 100
Town A 0
09 00 10 00 12 00 11 00
P
Q
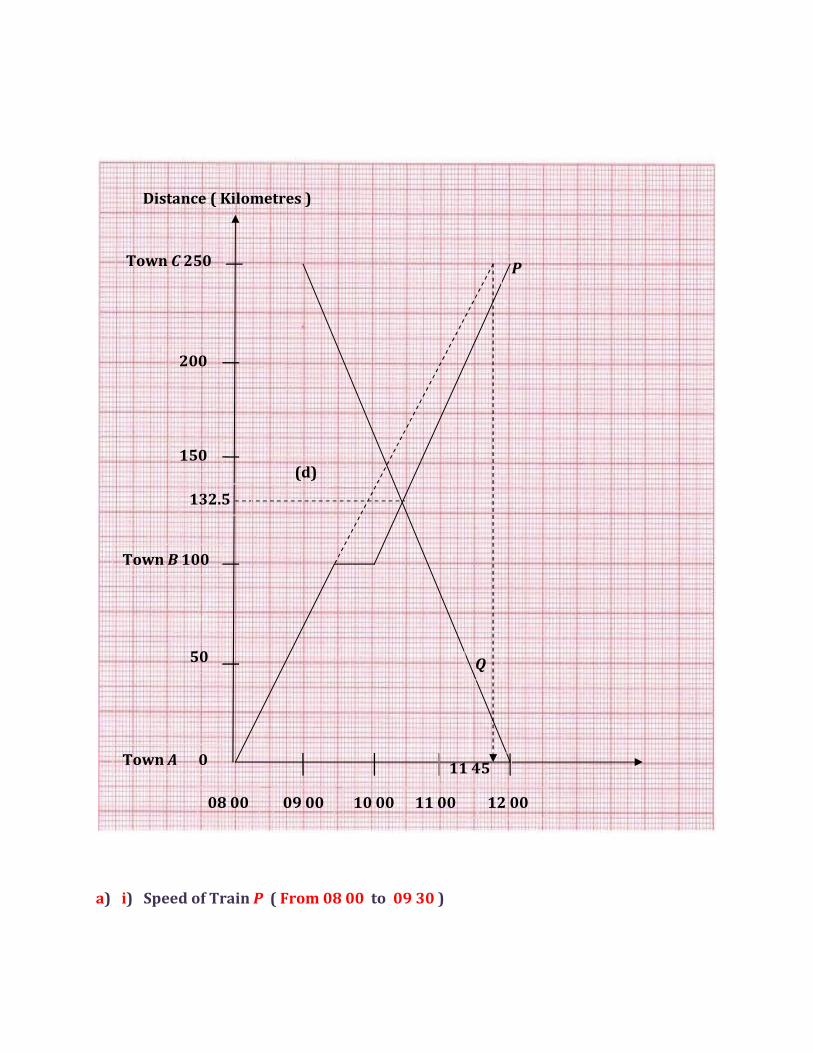
a) i) Speed of Train P ( From 08 00 to 09 30 )
Distance ( Kilometres )
Town C 250
200
150
08 00
50
Town B 100
Town A 0
09 00 10 00 12 00 11 00
P
Q
11 45
132.5
(d)
= ��� ��
��
� �
= ���
� km / h
ii) Speed of Train P ( From 09 30 to 10 00 )
= 0 km / h
iii) Speed of Train P ( From 10 00 to 12 00 )
= ( ���−��� )��
� �
= �� ��
� �
= 75 km / h
b) Average speed of Train P for the whole journey
= ����� �������� ���������
����� ���� �����
= ��� ��
� �
= = ���
� km / h
The gradient of the first part of the graph From 08
00 to 09 30 gives the speed at the time .
The gradient is zero as the graph is a horizontal
line From 09 30 to 10 00.
The gradient of the third part of the graph
From 10 00 to 12 00.
c) Average speed of Train P for the whole journey
= ����� �������� ���������
����� ���� �����
= ��� ��
� �
= = ���
� km / h
d) The trains cross each other when they are 132.5 km from Town A .
TIPS FOR STUDENTS:
The trains cross each other when their distance – time graph intersect .
e) Train P would have reached Town C at 11 : 45 if it did not stop at Town B .
EXAMPLE3:
The graph shows how Mailing swum in a 100 m freestyle swimming event. Find her speed
in meters per second when.
a) t = 7 ,
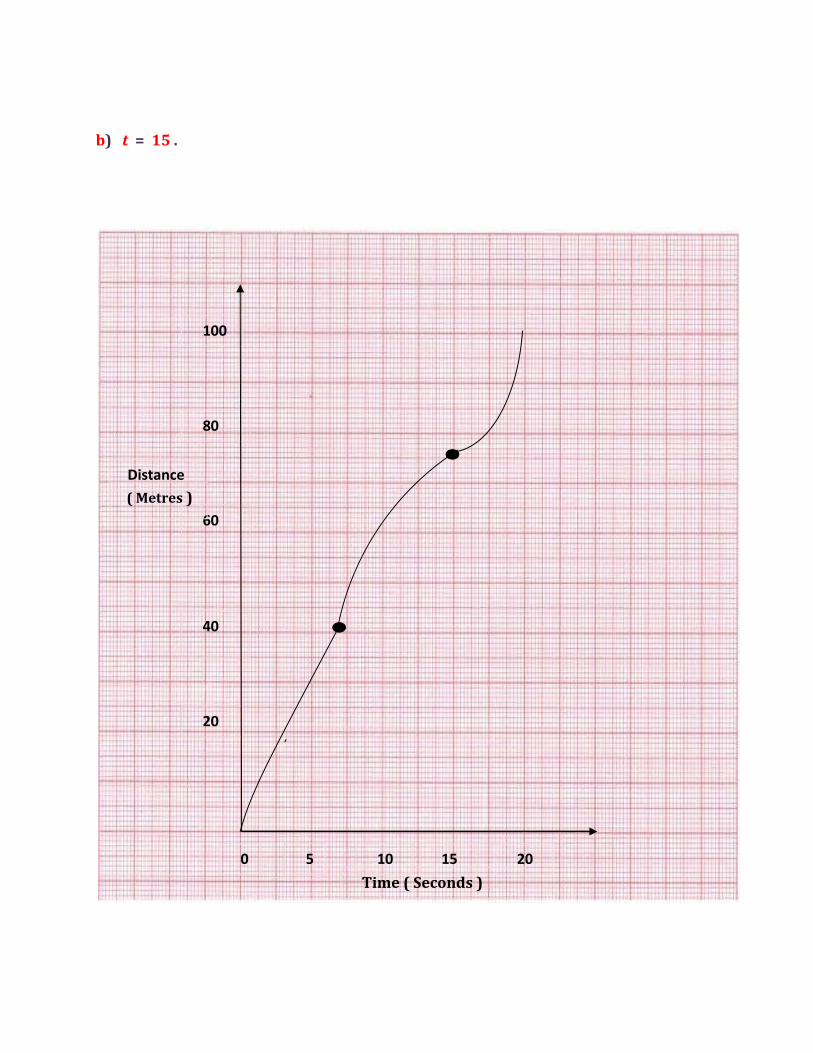
b) t = 15 .
100
80
60
40
20
Distance
( Metres )
Time ( Seconds )
5 0 10 15 20
SOLUTION:
Draw the tangent to the curve at each point to find the gradient .
b) t = 15 .
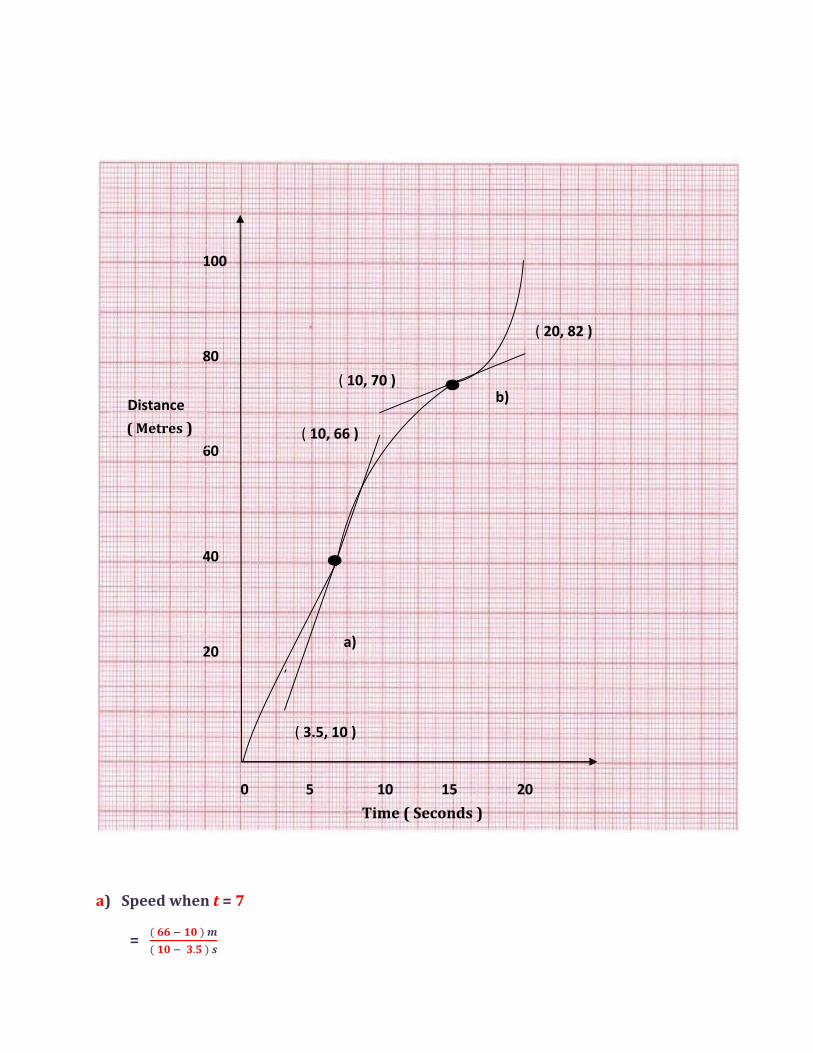
a) Speed when t = 7
= ( �� � �� ) �
( �� � �.� ) �
100
80
60
40
20
Distance
( Metres )
Time ( Seconds )
5 0 10 15 20
( 3.5, 10 )
a)
b)
( 20, 82 )
( 10, 70 )
( 10, 66 )
= �� ��
�.� �
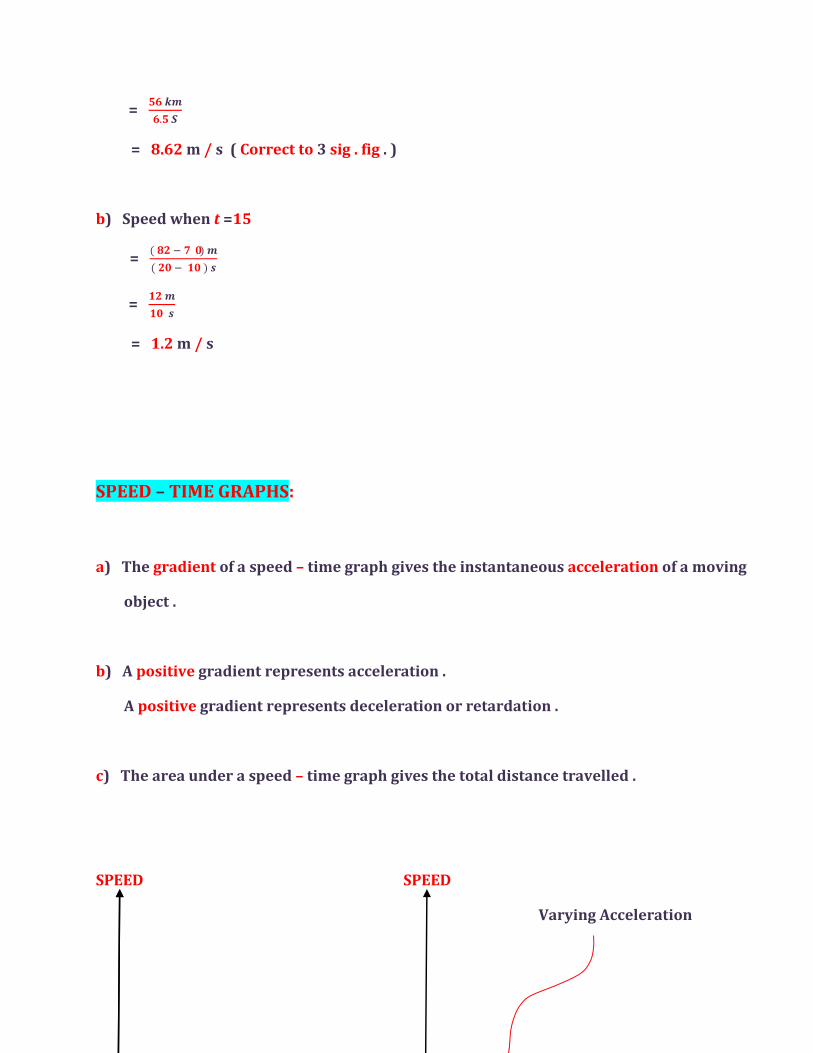
= 8.62 m / s ( Correct to 3 sig . fig . )
b) Speed when t =15
= ( �� � �� ) �
( �� � �� ) �
= �� �
�� �
= 1.2 m / s
SPEED – TIME GRAPHS:
a) The gradient of a speed – time graph gives the instantaneous acceleration of a moving
object .
b) A positive gradient represents acceleration .
A positive gradient represents deceleration or retardation .
c) The area under a speed – time graph gives the total distance travelled .
SPEED SPEED
Varying Acceleration
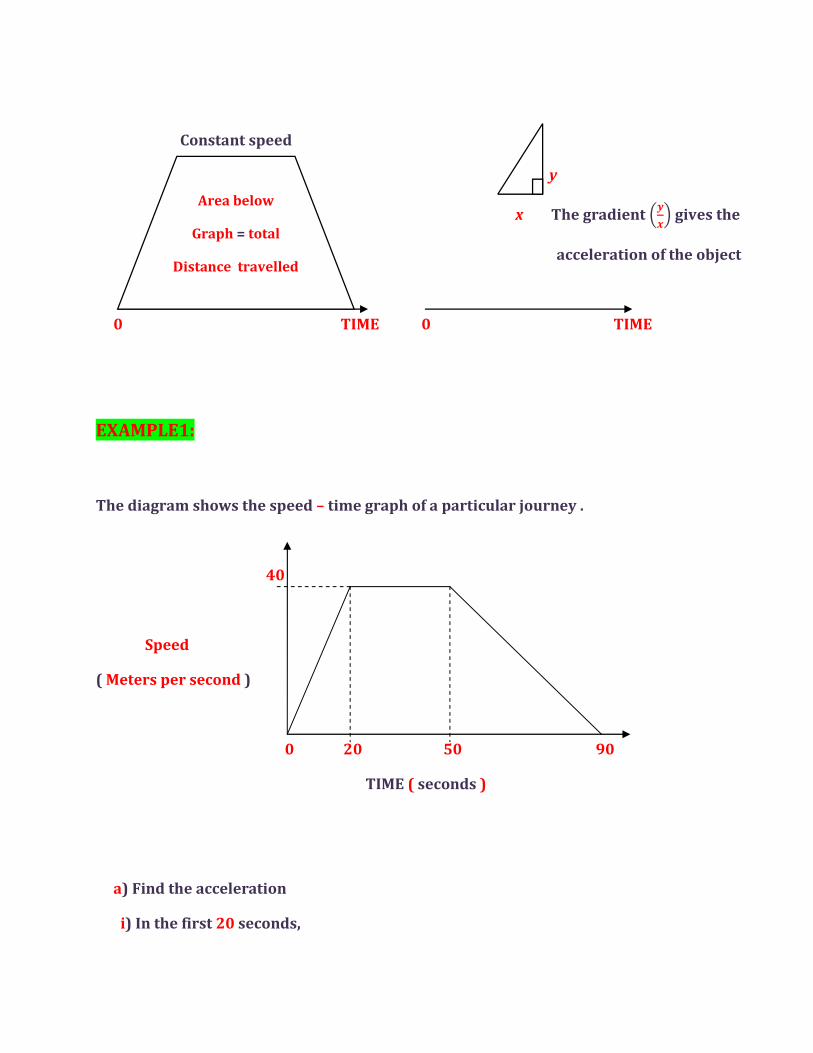
Constant speed
y
x The gradient ��
�� gives the
acceleration of the object
0 TIME 0 TIME
EXAMPLE1:
The diagram shows the speed – time graph of a particular journey .
40
Speed
( Meters per second )
0 20 50 90
TIME ( seconds )
a) Find the acceleration
i) In the first 20 seconds,
Area below
Graph = total
Distance travelled
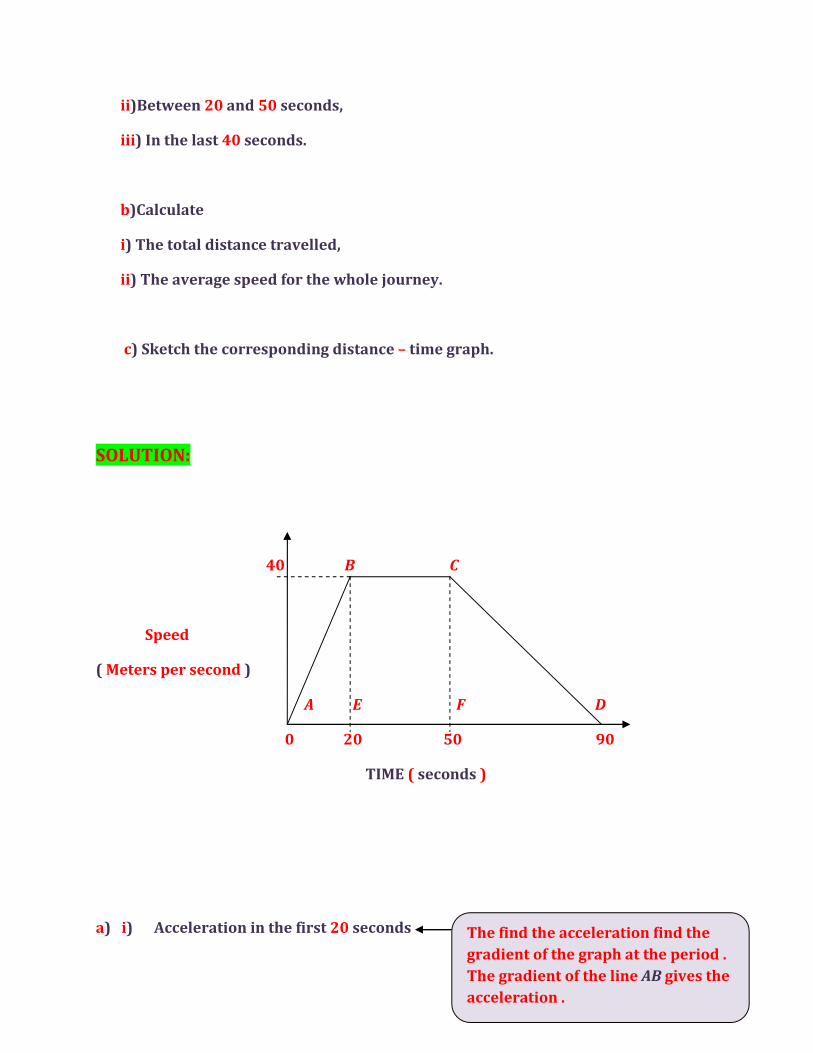
ii)Between 20 and 50 seconds,
iii) In the last 40 seconds.
b)Calculate
i) The total distance travelled,
ii) The average speed for the whole journey.
c) Sketch the corresponding distance – time graph.
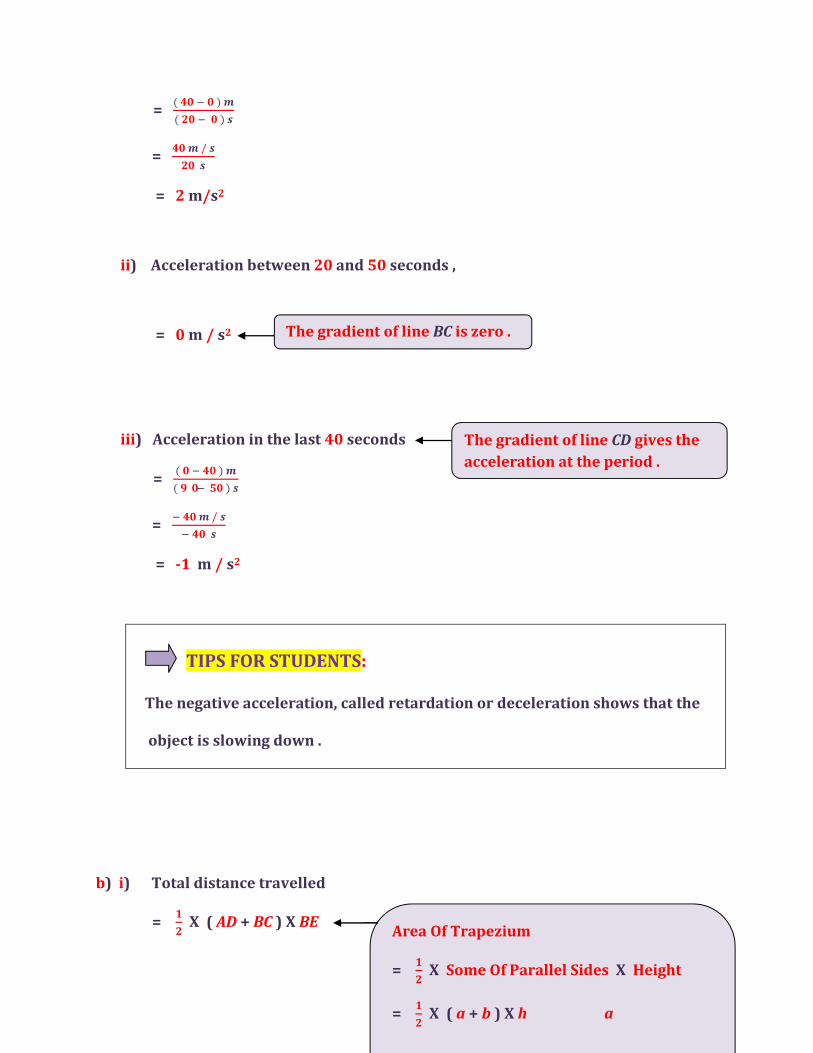
SOLUTION:
40 B C
Speed
( Meters per second )
A E F D
0 20 50 90
TIME ( seconds )
a) i) Acceleration in the first 20 seconds The find the acceleration find the
gradient of the graph at the period .
The gradient of the line AB gives the
acceleration .
= ( �� � � ) �
( �� � � ) �
= �� � / �
�� �
= 2 m/s2
ii) Acceleration between 20 and 50 seconds ,
= 0 m / s2
iii) Acceleration in the last 40 seconds
= ( � � �� ) �
( �� � �� ) �
= � �� � / �
� �� �
= -1 m / s2
TIPS FOR STUDENTS:
The negative acceleration, called retardation or deceleration shows that the object is slowing down .
b) i) Total distance travelled
= �
� X ( AD + BC ) X BE
The gradient of line BC is zero .
The gradient of line CD gives the
acceleration at the period .
Area Of Trapezium
= �
� X Some Of Parallel Sides X Height
= �
� X ( a + b ) X h a
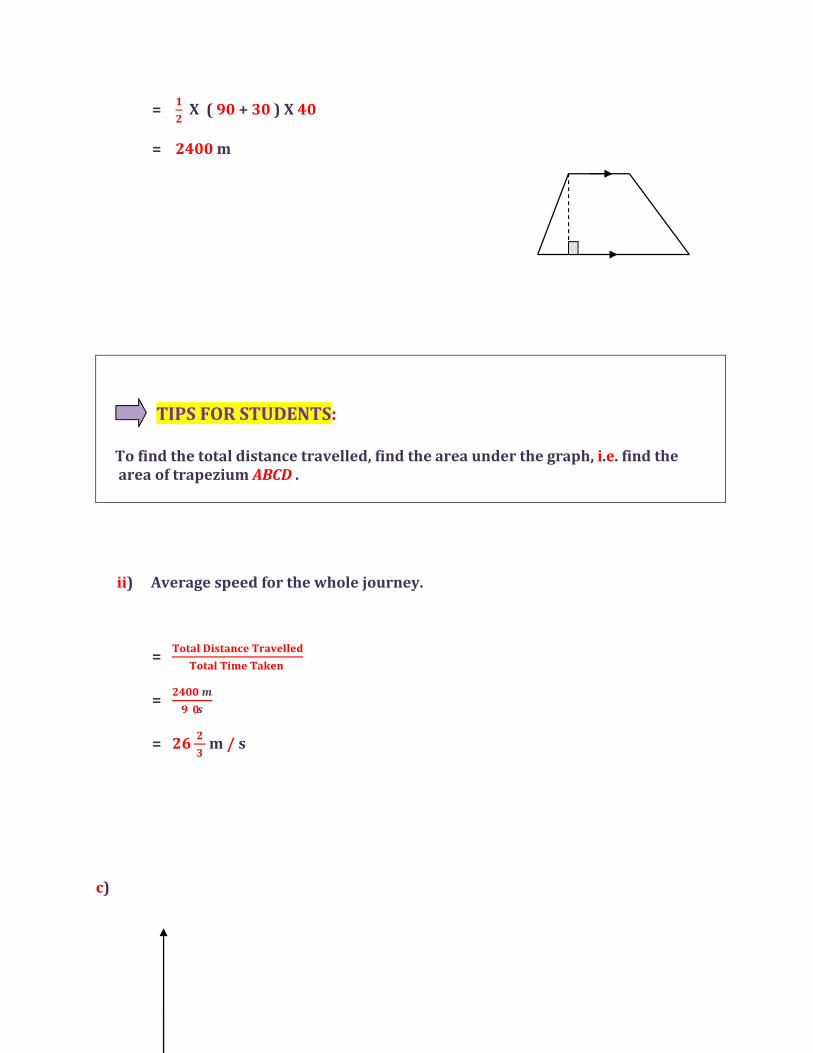
= �
� X ( 90 + 30 ) X 40
= 2400 m
TIPS FOR STUDENTS:
To find the total distance travelled, find the area under the graph, i.e. find the area of trapezium ABCD .
ii) Average speed for the whole journey.
= ����� �������� ���������
����� ���� �����
= ���� �
�� �
= ���
� m / s
c)
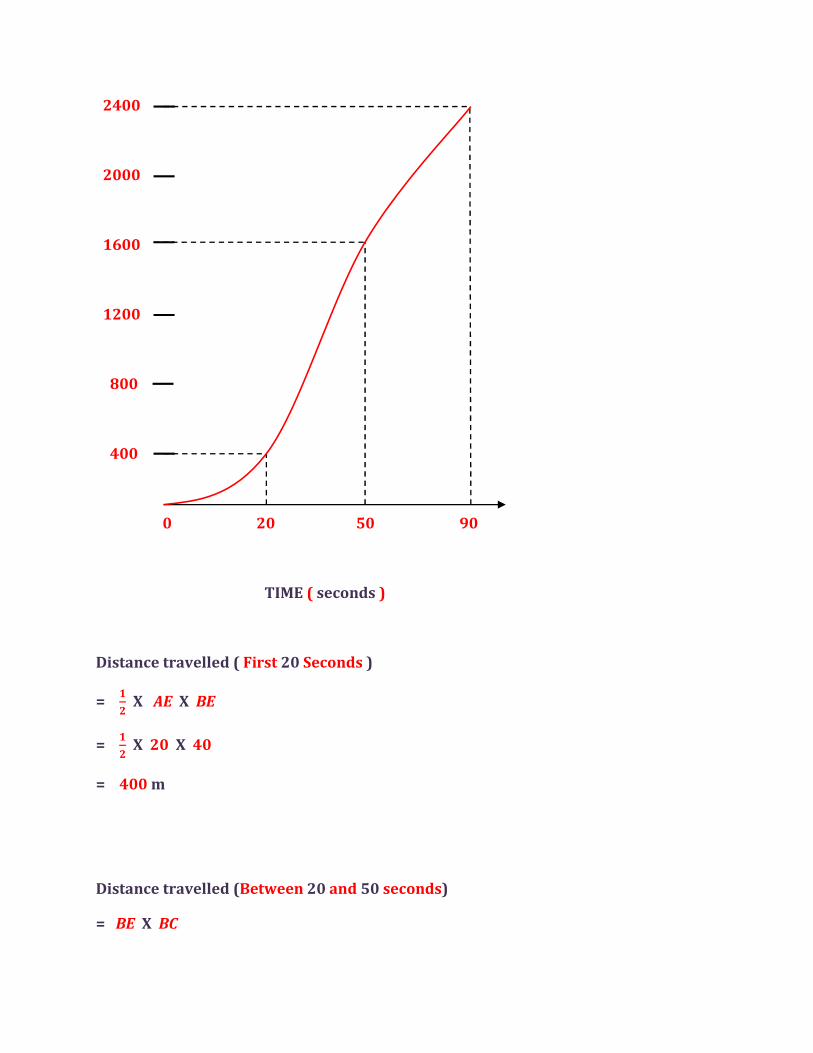
2400
2000
1600
1200
800
400
0 20 50 90
TIME ( seconds )
Distance travelled ( First 20 Seconds )
= �
� X AE X BE
= �
� X 20 X 40
= 400 m
Distance travelled (Between 20 and 50 seconds)
= BE X BC
= 40 X 30
= 1200 m
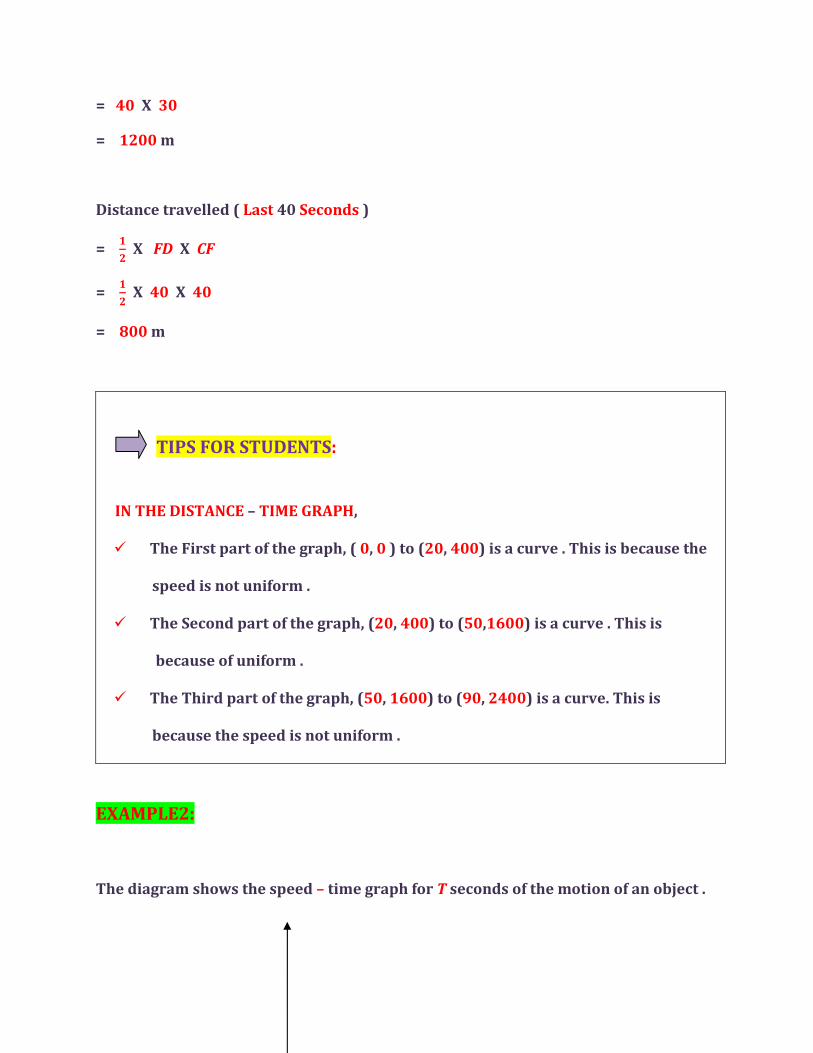
Distance travelled ( Last 40 Seconds )
= �
� X FD X CF
= �
� X 40 X 40
= 800 m
TIPS FOR STUDENTS:
IN THE DISTANCE – TIME GRAPH, The First part of the graph, ( 0, 0 ) to (20, 400) is a curve . This is because the
speed is not uniform . The Second part of the graph, (20, 400) to (50,1600) is a curve . This is
because of uniform . The Third part of the graph, (50, 1600) to (90, 2400) is a curve. This is
because the speed is not uniform .
EXAMPLE2:
The diagram shows the speed – time graph for T seconds of the motion of an object .
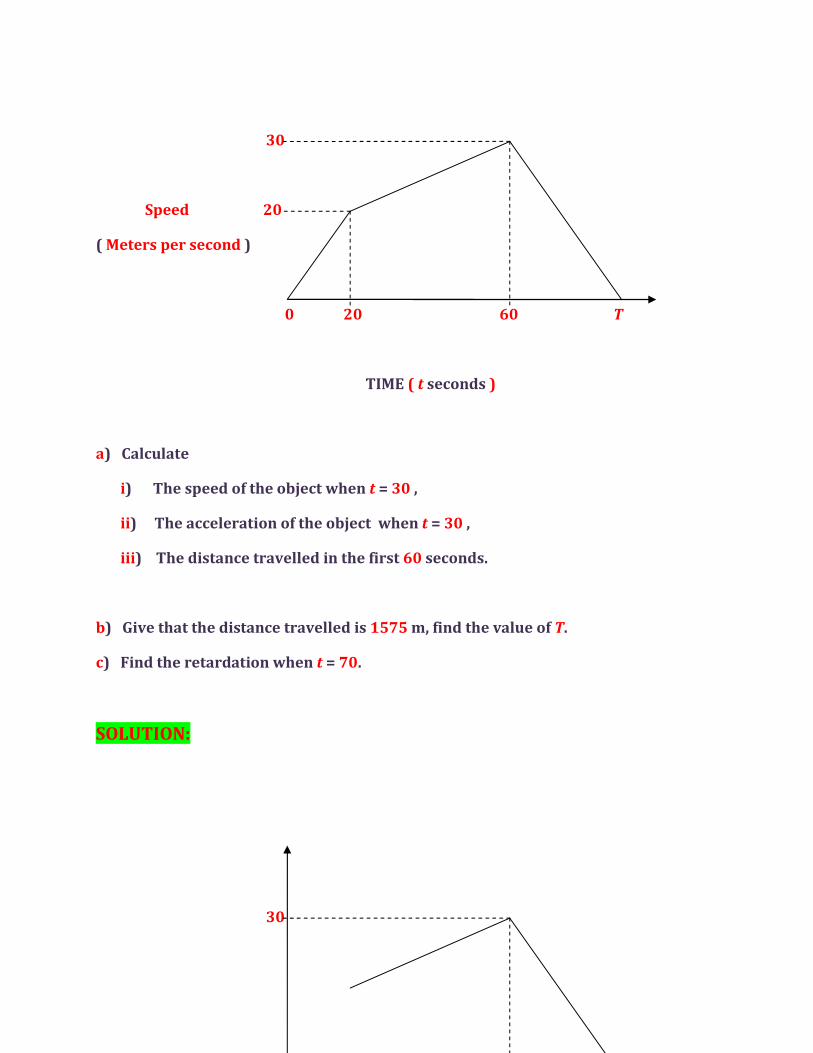
30
Speed 20
( Meters per second )
0 20 60 T
TIME ( t seconds )
a) Calculate
i) The speed of the object when t = 30 ,
ii) The acceleration of the object when t = 30 ,
iii) The distance travelled in the first 60 seconds.
b) Give that the distance travelled is 1575 m, find the value of T.
c) Find the retardation when t = 70.
SOLUTION:
30
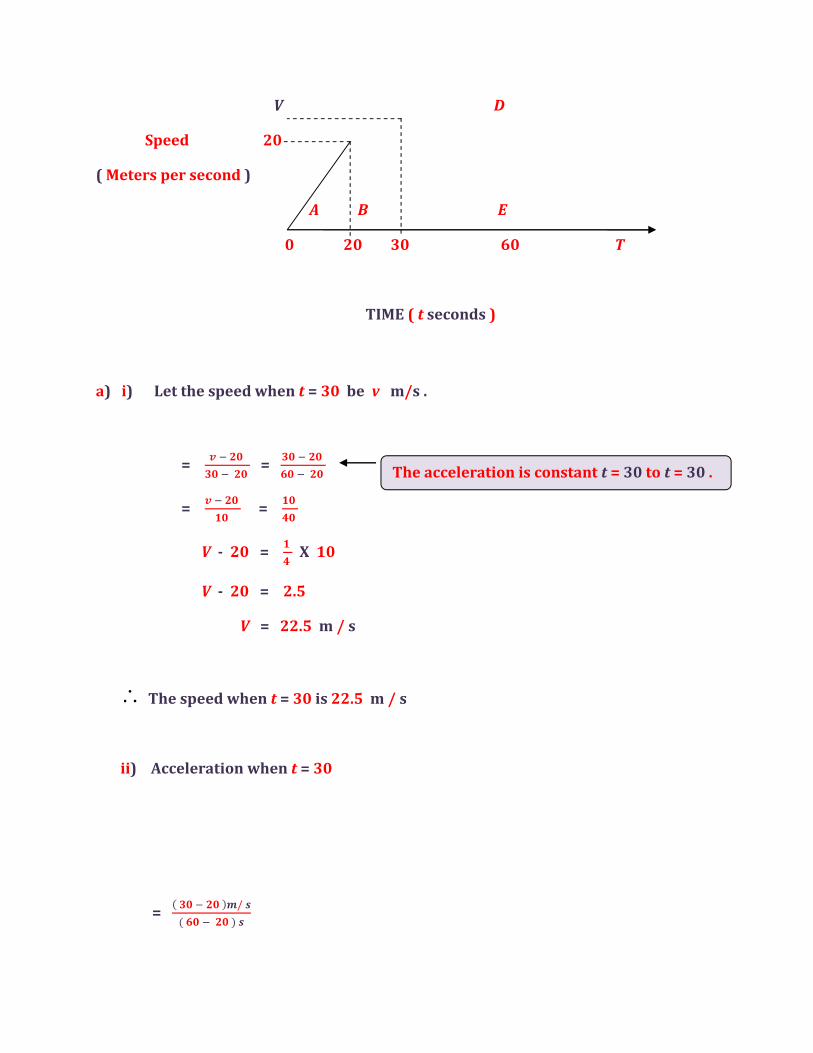
V D
Speed 20
( Meters per second )
A B E
0 20 30 60 T
TIME ( t seconds )
a) i) Let the speed when t = 30 be v m/s .
= � � ��
�� � �� =
�� � ��
�� � ��
= � � ��
�� =
��
��
V - 20 = �
� X 10
V - 20 = 2.5
V = 22.5 m / s
The speed when t = 30 is 22.5 m / s
ii) Acceleration when t = 30
= ( �� � �� )�/ �
( �� � �� ) �
The acceleration is constant t = 30 to t = 30 .
= �� � / �
�� �
= �
� m/s2
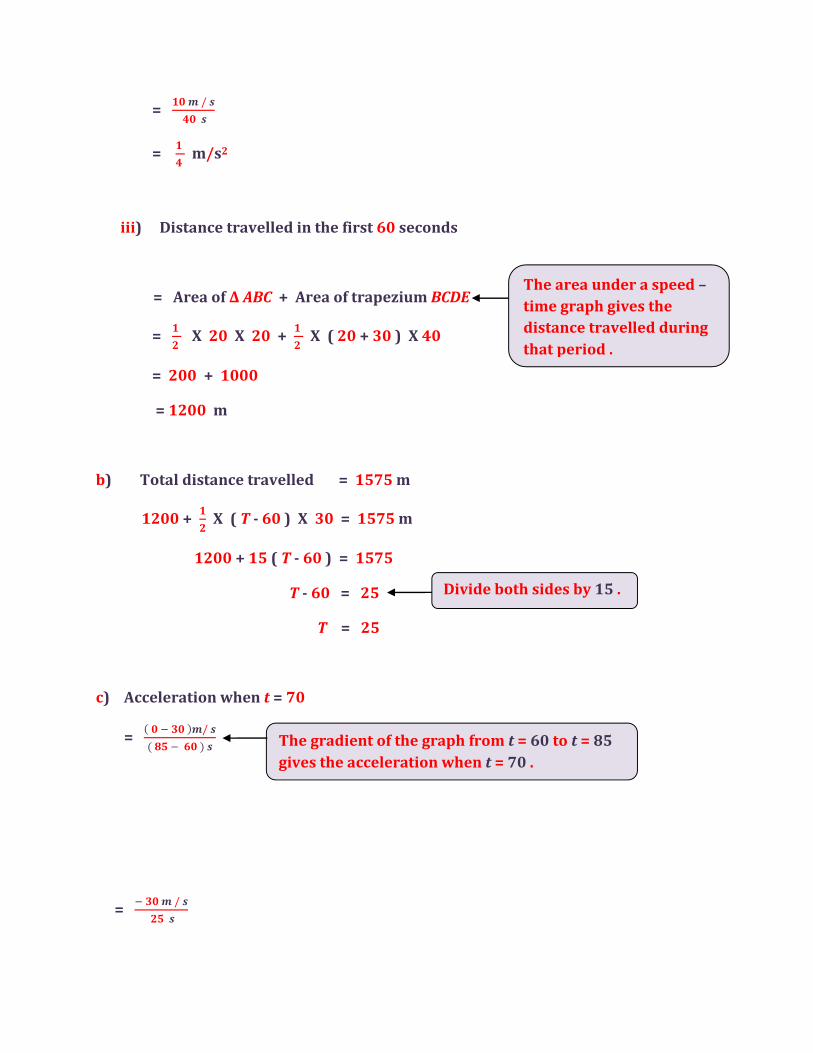
iii) Distance travelled in the first 60 seconds
= Area of Δ ABC + Area of trapezium BCDE
= �
� X 20 X 20 +
�
� X ( 20 + 30 ) X 40
= 200 + 1000
= 1200 m
b) Total distance travelled = 1575 m
1200 + �
� X ( T - 60 ) X 30 = 1575 m
1200 + 15 ( T - 60 ) = 1575
T - 60 = 25
T = 25
c) Acceleration when t = 70
= ( � � �� )�/ �
( �� � �� ) �
= � �� � / �
�� �
The area under a speed –
time graph gives the
distance travelled during
that period .
Divide both sides by 15 .
The gradient of the graph from t = 60 to t = 85
gives the acceleration when t = 70 .
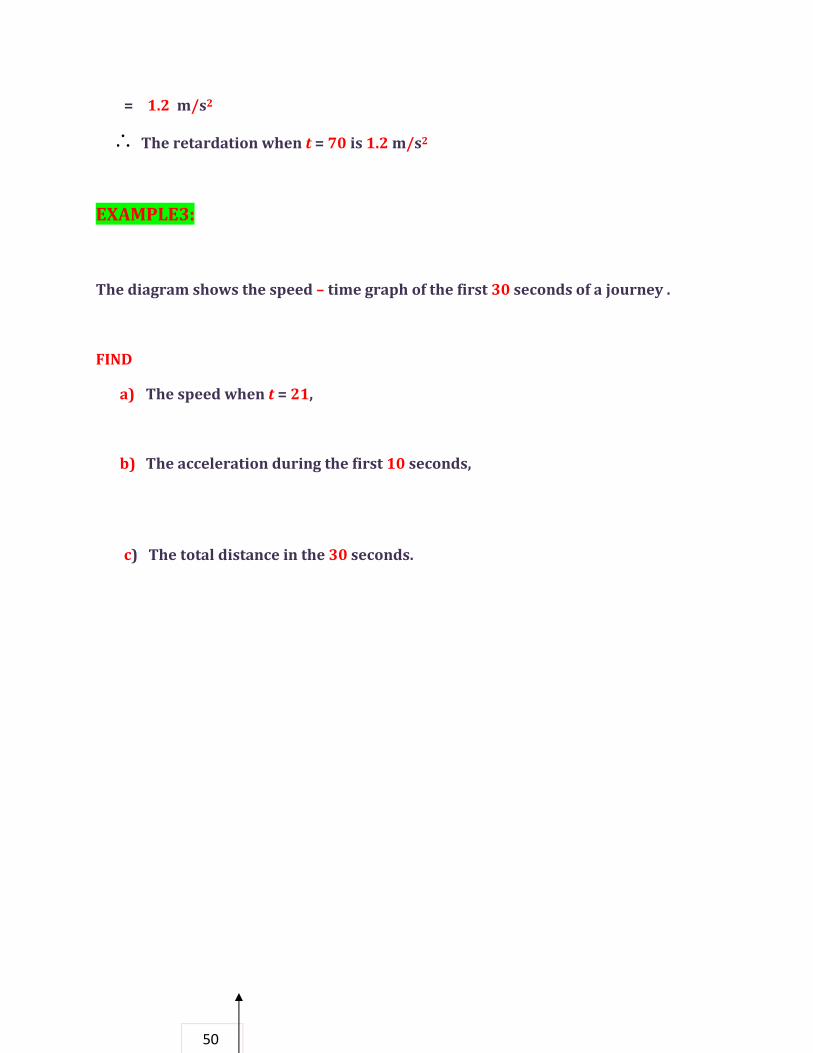
= 1.2 m/s2
The retardation when t = 70 is 1.2 m/s2
EXAMPLE3:
The diagram shows the speed – time graph of the first 30 seconds of a journey .
FIND
a) The speed when t = 21,
b) The acceleration during the first 10 seconds,
c) The total distance in the 30 seconds.
50
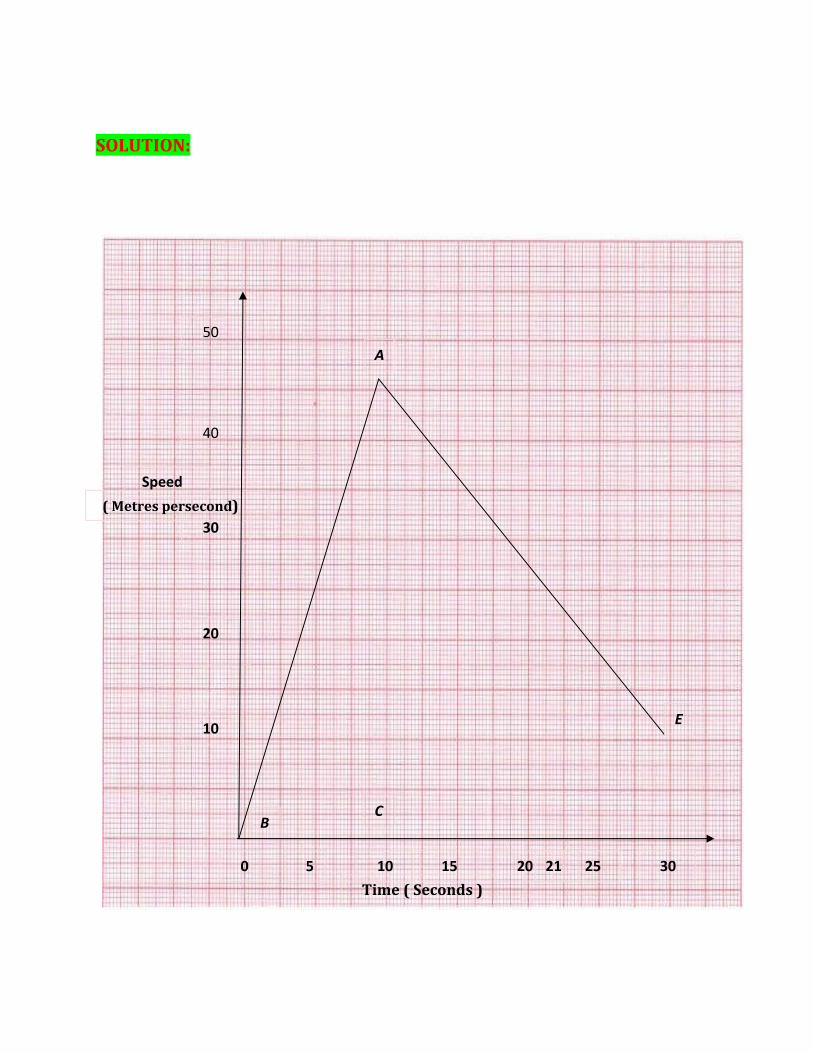
SOLUTION:
50
40
30
20
10
Speed
( Metres persecond)
Time ( Seconds )
5 0 10 15 20 25 30
C
E
A
B
21
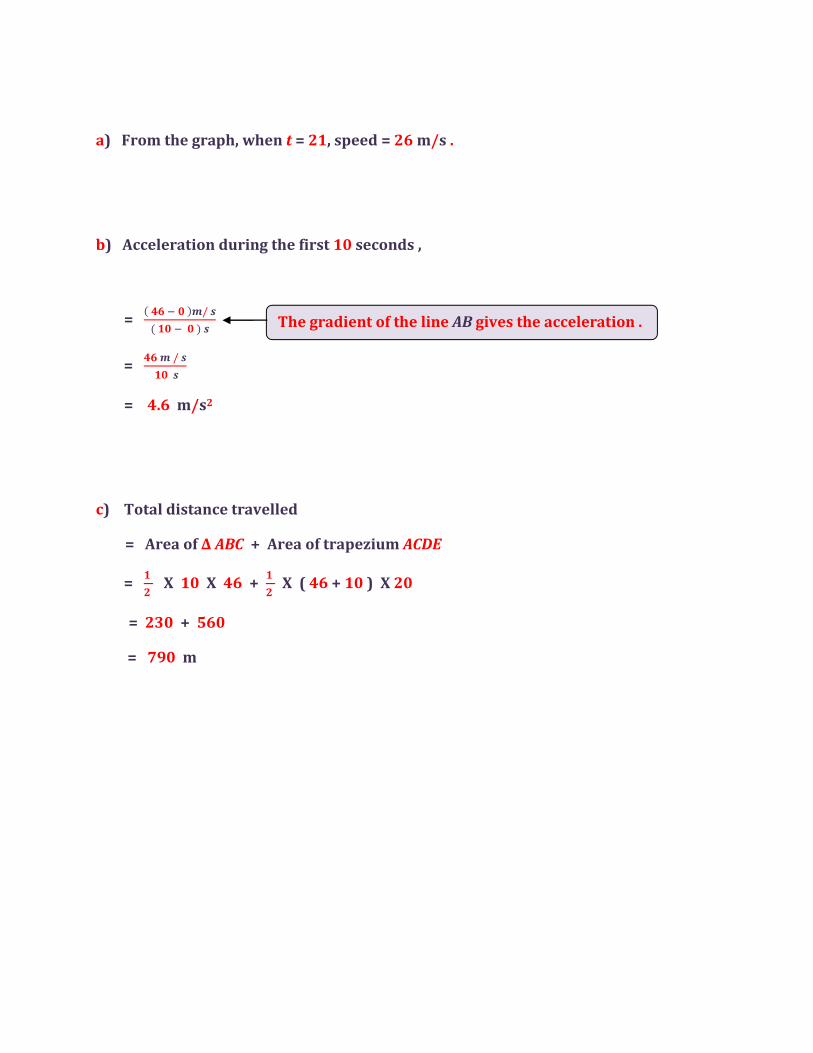
a) From the graph, when t = 21, speed = 26 m/s .
b) Acceleration during the first 10 seconds ,
= ( �� � � )�/ �
( �� � � ) �
= �� � / �
�� �
= 4.6 m/s2
c) Total distance travelled
= Area of Δ ABC + Area of trapezium ACDE
= �
� X 10 X 46 +
�
� X ( 46 + 10 ) X 20
= 230 + 560
= 790 m
The gradient of the line AB gives the acceleration .
EXAMPLE4:
DISTANCE ( meters )
20
18
16
14
12
10
8
6
4
2
0 2 4 6 8 10 12 14 16
TIME ( t second )
SPEED ( Meters per second )
20
18
16
14
12
10
8
6
4
2
0 2 4 6 8 10 12 14 16
TIME ( t second )
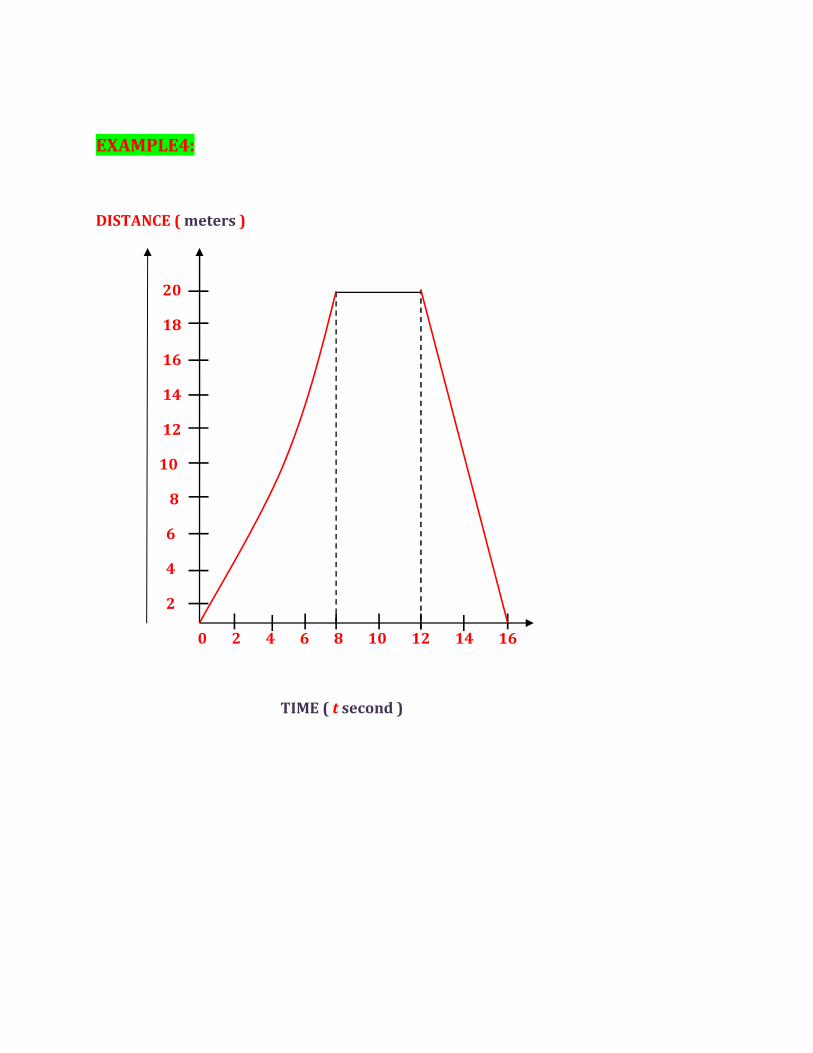
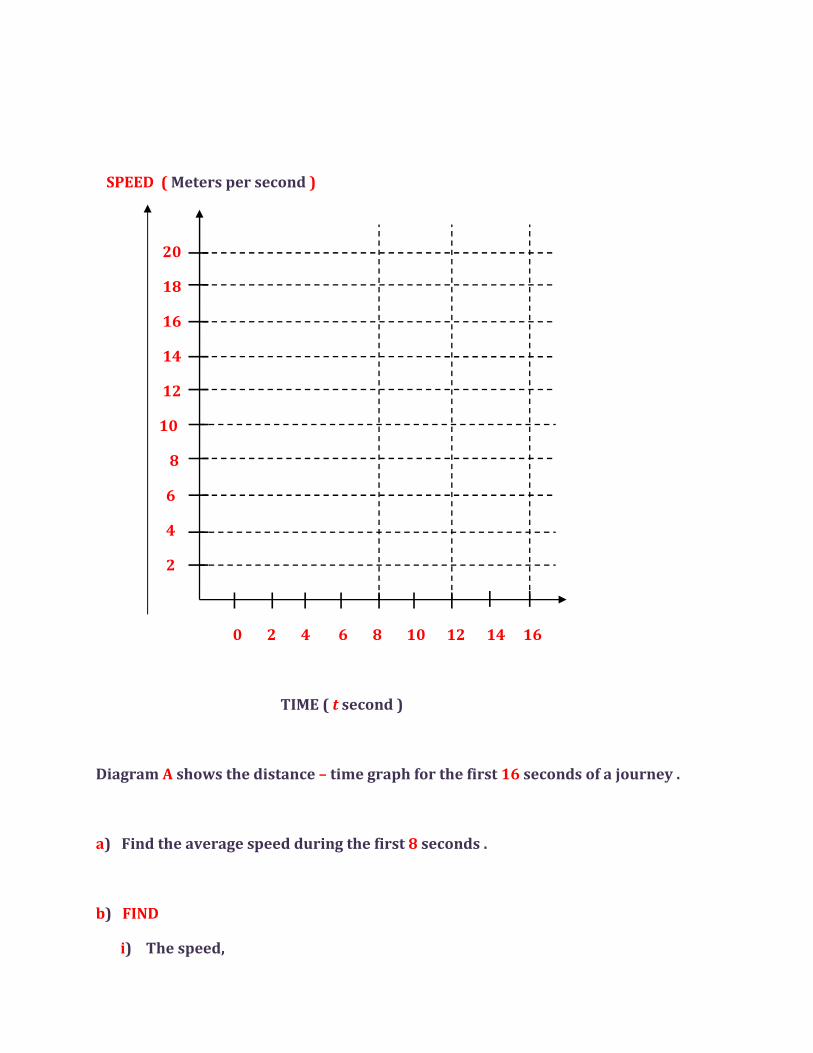
Diagram A shows the distance – time graph for the first 16 seconds of a journey .
a) Find the average speed during the first 8 seconds .
b) FIND
i) The speed,
ii) The acceleration,
During the last 4 second .
c) The speed increases uniformly from 6 m/s when t = 0 to 10 m/s when t = 8 . Sketch the
speed – time graph for the same journey in diagram B .
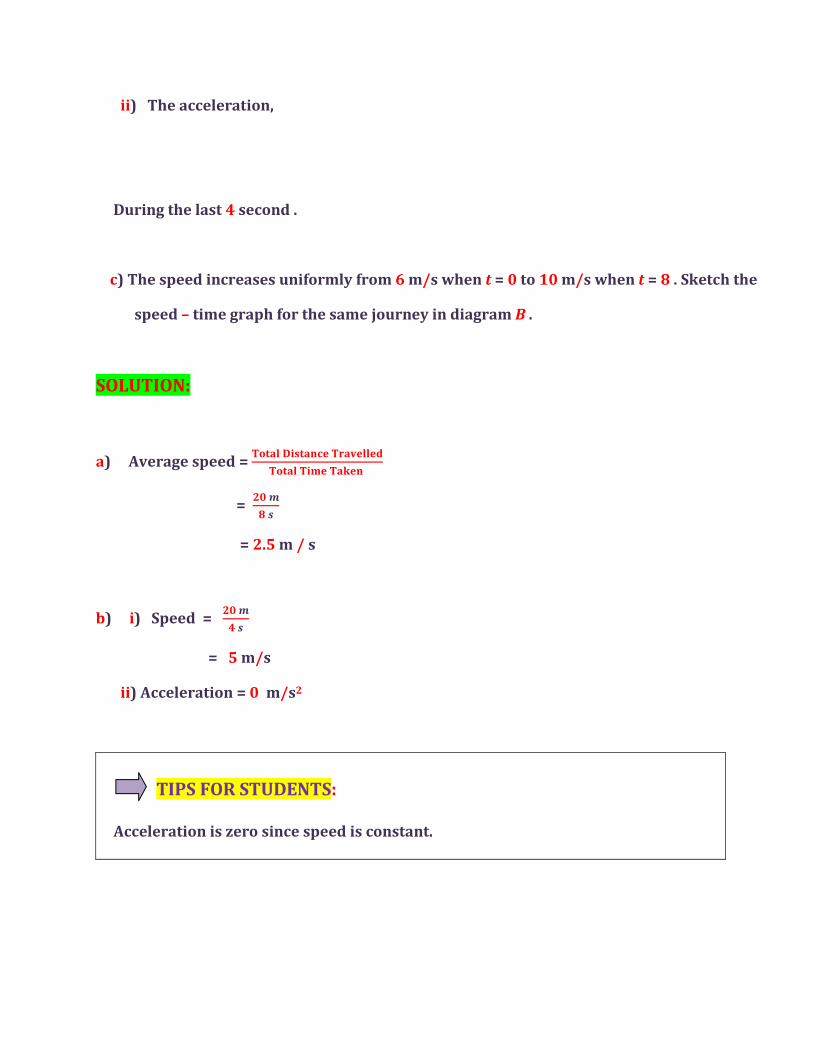
SOLUTION:
a) Average speed = ����� �������� ���������
����� ���� �����
= �� �
� �
= 2.5 m / s
b) i) Speed = �� �
� �
= 5 m/s
ii) Acceleration = 0 m/s2
TIPS FOR STUDENTS:
Acceleration is zero since speed is constant.
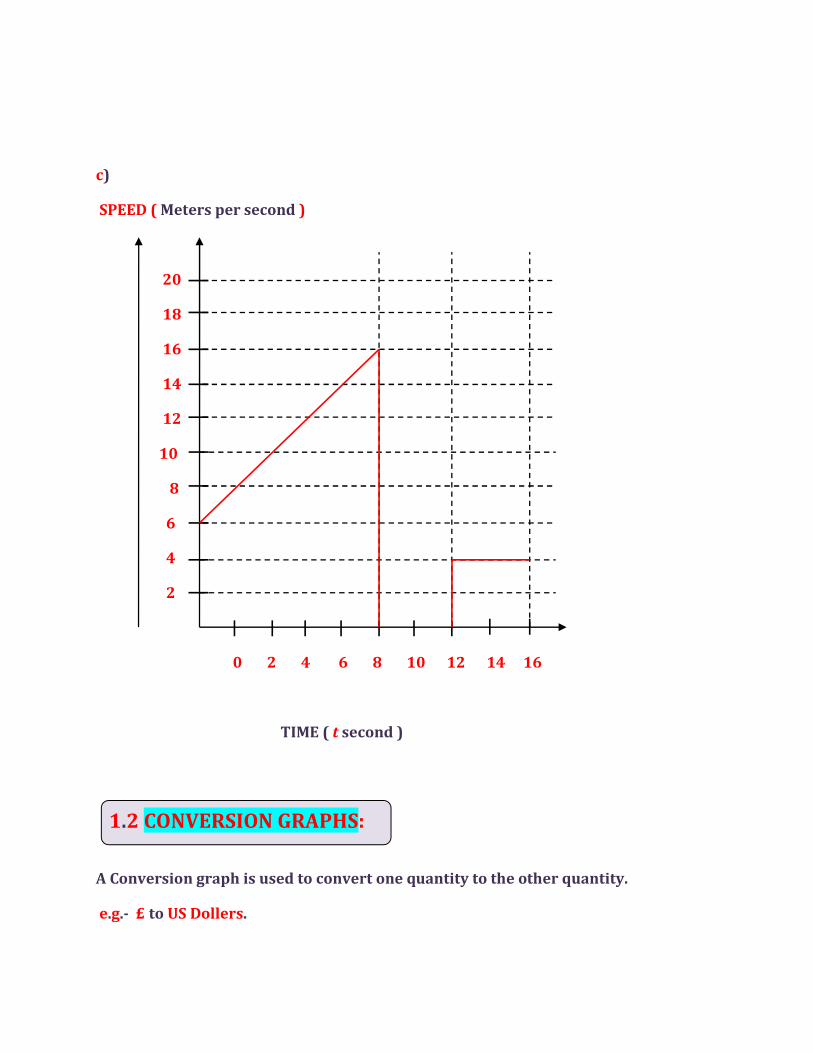
c)
SPEED ( Meters per second )
20
18
16
14
12
10
8
6
4
2
0 2 4 6 8 10 12 14 16
TIME ( t second )
A Conversion graph is used to convert one quantity to the other quantity.
e.g.- £ to US Dollers.
1.2 CONVERSION GRAPHS:

EXAMPLE:
The diagram shows a conversion graph between Singapore dollars ( S $ ) and the British
pounds (£ ).
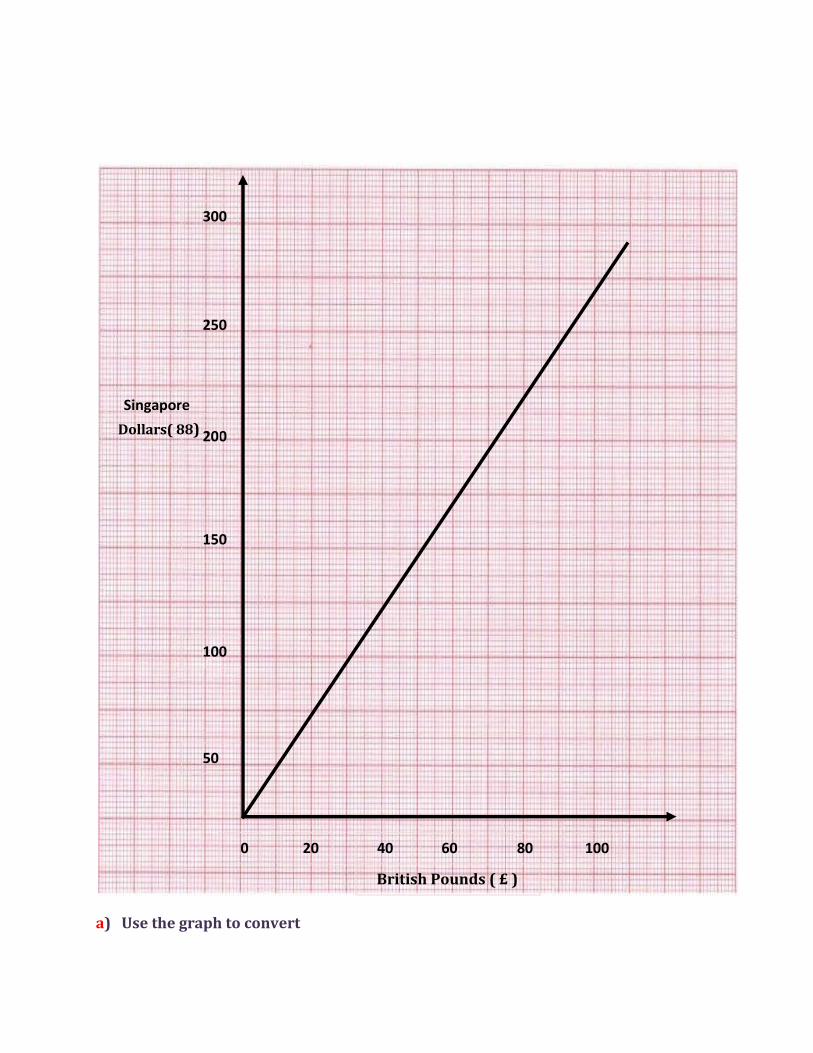
a) Use the graph to convert
300
250
200
150
100
Singapore
Dollars( 88)
British Pounds ( £ )
20 0 40 60 80 100
50

i) £ 100 to Singapore $,
ii) S $ 150 to British £.
b) Approximately how many Singapore dollars are equivalent to £ 1?
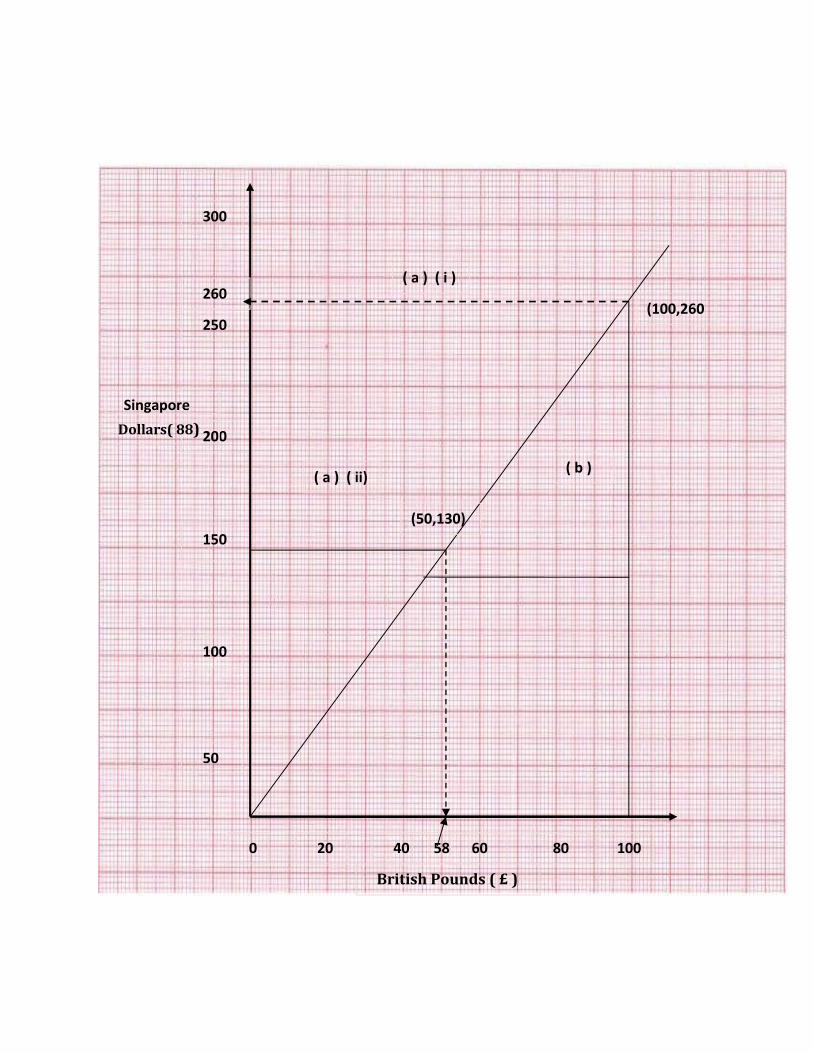
SOLUTION:
300
250
200
150
100
Singapore
Dollars( 88)
British Pounds ( £ )
20 0 40 60 80 100
50
260
58
(50,130)
(100,260
( a ) ( i )
( b ) ( a ) ( ii)
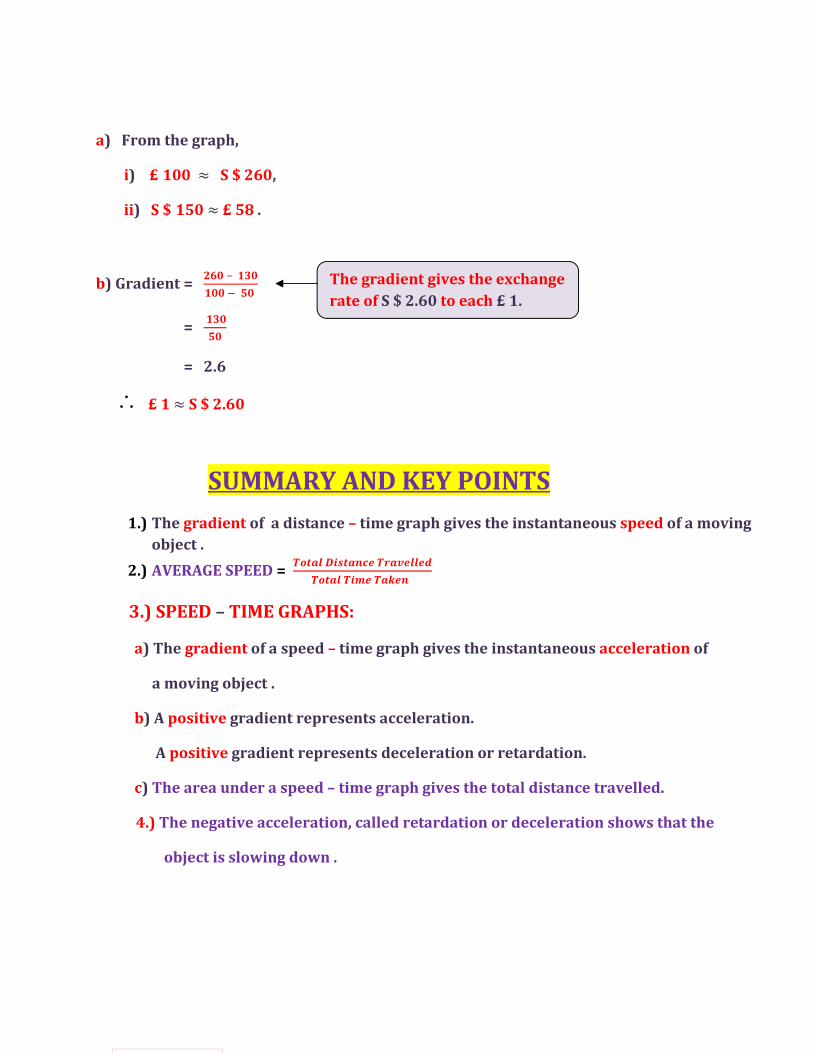
a) From the graph,
i) £ 100 ≈ S $ 260,
ii) S $ 150 ≈ £ 58 .
b) Gradient = ��� − ���
��� � ��
= ���
��
= 2.6
£ 1 ≈ S $ 2.60
SUMMARY AND KEY POINTS
1.) The gradient of a distance – time graph gives the instantaneous speed of a moving
object .
2.) AVERAGE SPEED = ����� �������� ���������
����� ���� �����
3.) SPEED – TIME GRAPHS:
a) The gradient of a speed – time graph gives the instantaneous acceleration of
a moving object .
b) A positive gradient represents acceleration.
A positive gradient represents deceleration or retardation.
c) The area under a speed – time graph gives the total distance travelled.
4.) The negative acceleration, called retardation or deceleration shows that the
object is slowing down .
The gradient gives the exchange
rate of S $ 2.60 to each £ 1.
5.) Average speed for the whole journey = ����� �������� ���������
����� ���� �����
6.) Acceleration is zero if speed is constant during distance travelled.
7.) A Conversion graph is used to convert one quantity to the other quantity
e.g. £ to US Dollars.