kinetic analysis of thermochemical processes for dried ... · kinetic analysis of thermochemical...
TRANSCRIPT
Kinetic analysis of thermochemical processes for dried cattle dung
Tejas Tankaria
Supervisor: Prof. Francisco Lemos, Prof. Amelia Lemos, Dr. Adam Klimanek
Instituto Superior Técnico, Lisbon, Portugal
September 2016
Summary
Cattle dung is a lignocellulosic material with high moisture and high ash content, which has the potential of energy
generation or conversion. Currently, for energy conversion it is utilized in anaerobic digestion and direct combustion
process. Anaerobic digestion generates biogas but has a low carbon conversion efficiency, and requires removal of
hydrogen sulfide and ammonia from the biogas before use. Direct combustion is only used in developing countries as
cheap energy resources for cooking and heating purposes in low efficiency stoves which causes many chronic
respiratory diseases and deaths due to poor indoor air quality. Cattle dung is a cheap source of fuel which can be utilized
in various thermochemical conversions to convert it into various solid, liquid and gaseous fuels, which are more efficient
and high in energy density. As, the fuel has to be dried for thermochemical conversion, dried cattle dung is used for
experiments.
In this thesis, the kinetics of three major types of thermochemical processes; pyrolysis, combustion and gasification
(partial oxidation) is studied. Ultimate and proximate analysis of dried dung is performed to predict behavior of fuel.
Thermo gravimetric (TG), Differential Thermo gravimetric (DTG) and Differential Scanning Calorimetry (DSC)
techniques are used to understand effect of heat rate and flow rate in thermochemical conversion processes. Cattle
dung ash that results from the thermochemical processes contains a high amount of mineral matter, majorly silica. It
contains various plant nutrition elements like phosphorus (P), potassium (K), magnesium (Mg), sodium (Na) etc.
Phosphorus and potassium being a major element for plant development, an experiment is performed to estimate the
elemental P and K content in ash. From the experimental content, usage of ash is discussed.
1. Introduction
Biomass can be defined as any general hydrocarbon material
which can be obtained from biodiversity. For political and
social reasons, other materials such as tires, manufactured
from either synthetic or natural rubbers may be included under
the category of biomass even though the material is not strictly
biogenic but considered into municipal solid waste or other
waste. [1, 2] Biomass contains high volatile matter that can be
transformed to other gaseous and liquid fuels through
thermochemical processes like pyrolysis, gasification and
combustion.
Pyrolysis is simply decay of the initial solid fuel into gases and
liquids without an oxidizing agent in presence of high heat.
The process of pyrolysis of biomass is very complicated and
consists of both concurrent and successive reactions when
biomass is heated in a non-reactive atmosphere. In this
process, thermal decay of organic components in biomass
starts at 350 °C–550 °C and goes up to 700 °C–800 °C in the
absenteeism of air/oxygen [4]. The long chains of carbon,
hydrogen and oxygen compounds in biomass crack into
smaller molecules in the form of gases, condensable vapors
(tars and oils) and solid charcoal under pyrolysis conditions.
Rate and extent of decomposition of each of these
components depends on reactor (pyrolysis) temperature,
biomass heating rate, pressure, reactor configuration,
feedstock etc. Process parameters. [3] Combustion is an
exothermic reaction between hydrocarbon and oxygen in
biomass. After complete combustion, biomass is converted to
H2O and CO2.
The production of generator gas (alias producer gas and
syngas) through gasification process is partial oxidation of
biomass and takes place at temperatures of about 1000 0C.

The reactor is called a Gasifier. [5] In gasification where
conditions are sub-stoichiometric, there is a surplus of solid
fuel (incomplete combustion) the products of combustion are
combustible gases like Carbon monoxide (CO), Hydrogen
(H2) and traces of Methane and non-useful products like tar
and dust. The production of these gases is by reaction of
water vapor and carbon dioxide through a glowing layer of
charcoal. Thus the key to Gasifier design is to create
conditions such that biomass is reduced to charcoal and
charcoal is converted at suitable temperature to produce CO
and H2. [6]
2. Motivation
2.1 Cattle Manure as Source of Energy
Emission from cattle manure consists in total 25% of total
emission from agriculture, which consists of 12% of global
GHG emission. So, directly animal manure consists of 3% of
global GHG emissions. This GHG emission can be reduced
by proper management and usage of manure.
As received cattle manure is composed of undigested
lignocellulose material, moisture (20-70%) and ash (15-20%
dry basis). Lignocellulose present in manure is undigested
feed to cattle. Manure contains methanogen bacteria that
continuously decomposes lignocellulose into methane and
carbon dioxide. If manure is not handled properly, greenhouse
gases like methane and carbon dioxide gets emitted into
atmosphere.
Presently, cattle manure is utilized for energy purposes in two
ways:
1. Anaerobic Digestion
2. Direct Combustion
2.2 Indoor air pollution due to combustion of dried dung
Indoor air pollution is the degradation of indoor air quality by
harmful chemicals and other materials. In developing
countries, comparatively level of indoor air pollution is higher
due to usage of lower grade biomass as fuel for cooking and
heating. Indoor air pollution from solid fuels accounted for 3.5
million deaths and 4.5% global daily-adjusted life year in 2010;
it also accounted for 16% particulate matter pollution. [7]
Dried dung is popular fuel for cooking and heating purposes
in developing countries. Direct combustion of this fuel
degrades indoor air quality. Amongst all general woody
biomass, dried dung causes maximum amount of indoor air
pollution. [8]
2.3 Dried Cattle dung as feedstock for thermochemical process and analysis of ash
Dried cattle dung’s thermochemical conversion has not been
studied much due to the popularity of anaerobic digestion
process. Also, to cope with indoor air pollution from
combustion of dried dung, study of thermochemical processes
is necessary. So, in this thesis, analysis of various kinetic
parameters of pyrolysis, combustion and gasification is
studied. Also, dried cattle dung ash contains significant
amount of phosphorus and potassium which is essential plant
feed. So, analysis of ash is also done to find out phosphorus
and potassium content.
3. Fuel Analysis
Thermal design of a biomass energy systems necessarily
needs the composition of the fuel as well as its energy content.
The following three primary properties describe its
composition and energy content: (1) ultimate analysis, (2)
proximate analysis, and (3) heating values.
3.1 Ultimate Analysis
Here, the composition of the biomass fuel is expressed in
terms of its basic elements except for its moisture (M) and
inorganic constituents (ASH). A typical ultimate analysis is
𝐶 + 𝐻 + 𝑂 + 𝑁 + 𝑆 + 𝐴𝑆𝐻 + 𝑀
= 100%
(1)
Here, C, H, O, N, and S are the weight percentages of carbon,
hydrogen, oxygen, nitrogen, and sulfur, respectively, in the
fuel. Not all fuels contain all of these elements. The moisture
or water in the fuel is expressed separately as M. Thus,
hydrogen or oxygen in the ultimate analysis includes hydrogen
and oxygen present in the organic components of the fuel.
3.2 Proximate Analysis
Proximate analysis gives the composition of the biomass in
terms of gross components such as moisture (M), volatile
matter (VM), ash (ASH), and fixed carbon (FC). The moisture
and ash determined in proximate analysis refer to the same
moisture and ash determined in ultimate analysis. The volatile
matter of a fuel is condensable and non-condensable vapor
released when the fuel is heated. Fixed carbon is solid carbon
in the biomass that remains in the char in the pyrolysis
process after devolatilization. Summation of all the content
present by weight percentages in proximate analysis must be
100%.
3.3 Higher Heating Value
Higher calorific value (HCV) is defined as the amount of heat
released by the unit mass or volume of fuel (initially at 25 °C)
once it is combusted and the products have returned to a
temperature of 25 °C. It includes the latent heat of vaporization
of water.
To find HCV from ultimate analysis of fuel, CY Yin has
suggested following equation (1.9) of Channiwala and Parikh
[9]. Equation is on dry basis which doesn’t account for
inherited moisture. With help of linear regression analysis,
equation (1.9) has comparatively low mean absolute error.
[10]
𝐻𝐶𝑉 (𝑀𝐽
𝑘𝑔) = 0.3491𝐶 + 1.1783𝐻 + 0.1005𝑆
− 0.1034𝑂 − 0.0151𝑁 − 0.0211
∗ 𝐴𝑠ℎ
(2)
3.4 Lower Heating Value
The lower calorific value (LCV) is defined as the amount of
heat released by fully combusting a specified quantity without
considering the heat of vaporization of the water in the
combustion product. To calculate LCV from HCV following
equation (1.10) is used. Enthalpy of evaporation of water at
25 0C is 2.442 MJ/kg.
𝐿𝐶𝑉 (𝑀𝐽
𝑘𝑔) = 𝐻𝐶𝑉 − (9 ∗ 𝐻
∗ 𝐸𝑛𝑡ℎ𝑎𝑙𝑝𝑦 𝑜𝑓 𝑒𝑣𝑎𝑝𝑜𝑟𝑎𝑡𝑖𝑜𝑛)
(3)
To know about characteristics of fuel, knowledge of fuel
composition is necessary. For that, proximate and ultimate
analysis of fuel is carried out. Proximate analysis was done
using TG characteristic graphs and ultimate analysis is done
using gas chromatography of flue gas from fuel.
3.5 Results
As the fuel quantity used in equipment was around 10
milligrams and that content of fuel can be non-homogeneous
in nature, so for that five reproducibility experiments were
done. Average result of five experiments are shown in table 1.
Table 1 Proximate Analysis of Dung cake
Parameter Average values
Moisture (%) 5.01
Volatile Matter (%) 66.11
Fixed Carbon (%) 13.83
Ash (%) 15.04
Total 100
This method is not a standard method. It is performed to have
an approximate measurement of all the entities of proximate
analysis.
Ultimate analysis is elemental analysis of fuel. It was carried
out in fuel research laboratory at IST, Lisbon using their
indigenous methodology M.M. 8.6 (A.E) (2009-05-06) and
using Fisons Instrument EA 1108 instrument. First, the fuel is
combusted and then amount of C, H, N, S are analyzed using
gas chromatography of flue gases. Analysis was performed
three times and average of the three values are taken as final
result. Result of the ultimate analysis is shown in table 2.
Table 2 Ultimate Analysis of Dung cake
As Received (%)
N 1.573
C 38.95
H 5.05
O 34.36
S <2%
Moisture 5.013
Ash 15.04
HCVa(kJ/kg) 15.65
LCVa(kJ/kg) 14.31
*a = dry basis
4. Thermal Analysis of Dried Dung
4.1 Sample Preparation
Dung cakes used in experiment collected from site and dried
in heat of Sun. When it gets dry, it is collected and used as
fuel. As, in TGA and DSC analysis, sample used is in small
quantity; it has to be ground to fine particles. Dung cake is
ground using mortar and pestle until it was fine grain.
4.2 Equipment TA Instruments SDT 2960 Simultaneous DSC-TGA
Equipment contains a standard furnace, which can be heated
1500° C. However, the highest temperature that samples
were heated, is to avoid burnout of the furnace. The heating
rates used ranged from 0.1 0C/min to 100 0C/min. A cooling of
the crucibles used for experiment is done by instrument air
which is forced inside the furnace. Aluminum Oxide crucibles
were used for loading the samples. Equipment is linked to a
computer installed with TA Instruments software, which was
used to control the equipment and display the results of the
experiments. Simultaneous DSC-TGA measures both the
heat flows (DSC) and weight changes (TGA) associated with
transitions in a material as a function of temperature and time
in a controlled atmosphere.
4.3 Pyrolysis
Procedure
Initially, around 10 mg of sample is taken into alumina pan
roughly measured in weighing machine. First, equipment has
to be tarred for the weight and energy balance for DTG and
DSC signal and then programming for the experiment in
equipment was done. Pyrolysis was done at four different
heat rates 5, 20, 50, 100 0C/min, from initial temperature 40
0C to 800 0C. Isothermal time maintained at 800 0C is 60
minutes for higher heat rates and 10 minutes for lower heat
rates. Char combustion after every pyrolysis experiment was
done with same condition i.e. heat rate 20 0C/min and
isothermal for 30 minutes at 800 0C. For inert medium in
furnace, nitrogen is used at constant flow rate of 50 ml/min
and for combustion, air is used at 50 ml/min for all the
experiments done.
Kinetic Analysis
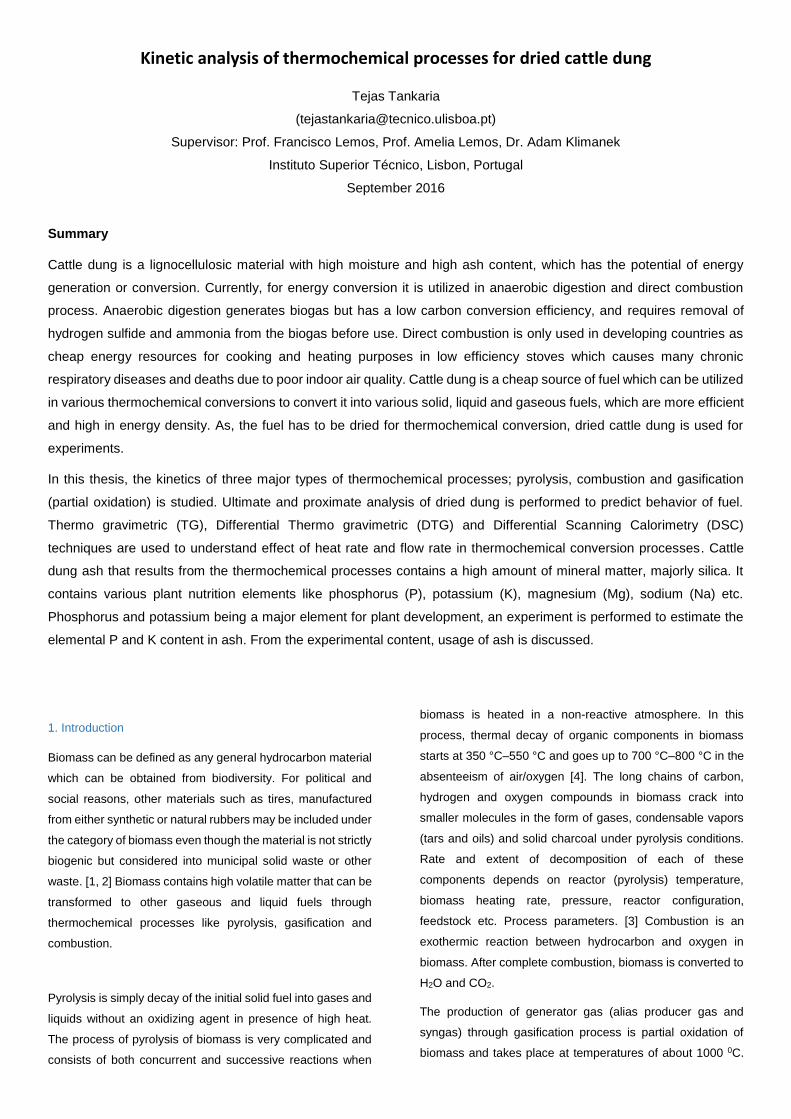
From figure 1, it is noticed that there are three stages of mass
losses, first from 40 0C to 200 0C, second from 200 0C to 350
0C and third in the end till 800 0C. This shows that there are
three types of materials present in the sample. First stage can
be explained by presence of moisture that evaporates till
sample reaches 200 0C.
FIGURE 1 PYROLYSIS OF DUNG CAKE AT DIFFERENT HEAT
RATE
As, dung cakes are Lignocellulosic materials, second and third
stage is decomposition of the presence of Lignocellulosic
materials. Second stage can be explained by the presence of
cellulose and hemicellulose and third stage can be explained
by presence of lignin. [11]
Effect of heat rate on volatile matter (VM) produced during
pyrolysis
Here, effect of heat rate on char production was studied by S.
Katyal et al. heating rate influences the rate of volatile
evolution from the biomass. The higher heating rate above
400°C promotes rapid volatile evolution. The molecular
disruption is extremely fast and volatile fragments are
released so rapidly that successive adjustments and
equilibrium leading to further primary reactions that yield char
have less opportunity to take place. [12] As the heat rate
increases amount of volatiles released increases.
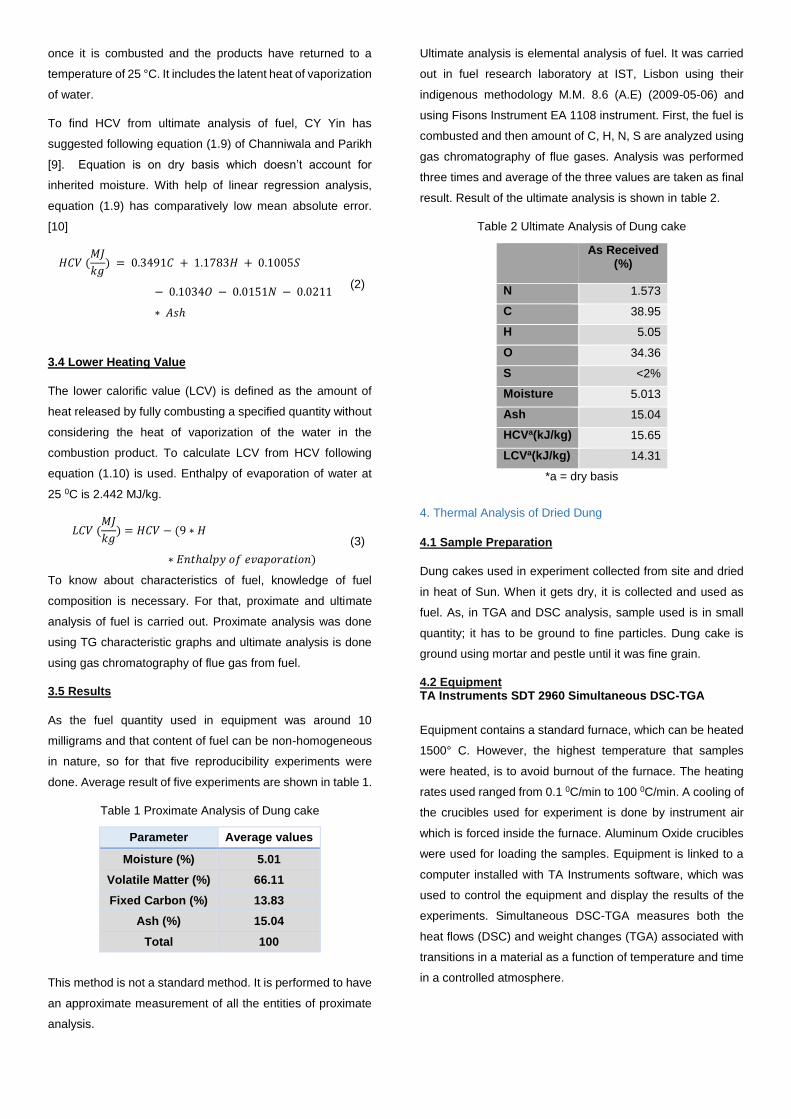
DSC curves of dung cake is shown in figure 2 with exothermic
values as positive. Initial deep from 40 0C to 200 0C is due to
moisture evaporation which is endothermic reaction. Heat
released during pyrolysis of biomass can be explained by
decomposition of the Lignocellulosic structure of biomass. At
higher temperatures (above 500 0C) , anhydrosugar
compounds in cellulose and hemicellulose undergo fission,
dehydration, disproportionation and decarboxylation reactions
to provide a mixture of low molecular weight gaseous and
volatile products.
FIGURE 2 DSC CURVES OF DUNG CAKE PYROLYSIS AT
DIFFERENT HEAT RATES
Effect of heat rate on char produced during pyrolysis
Here, amount of char produced after each pyrolysis process
is found out by combustion of char because char produced
contains generally two entities, fixed carbon and ash. Only
Char is combustible, so in the end of combustion operation
ash will be left.
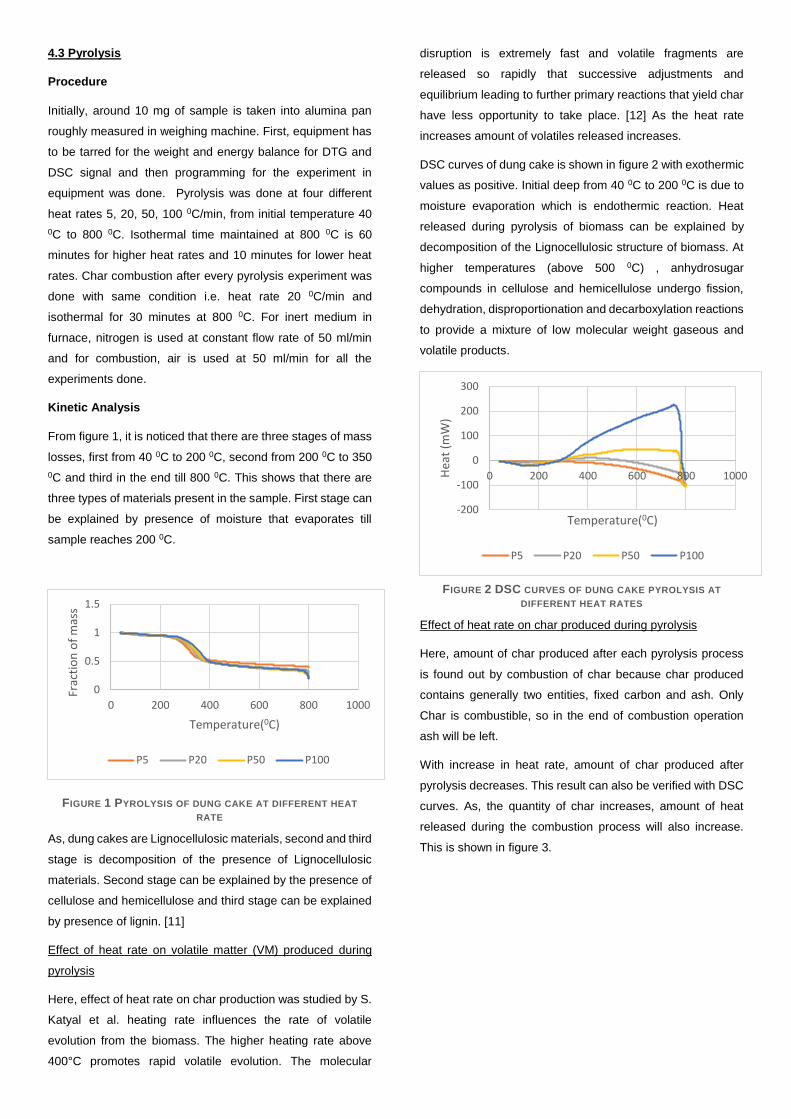
With increase in heat rate, amount of char produced after
pyrolysis decreases. This result can also be verified with DSC
curves. As, the quantity of char increases, amount of heat
released during the combustion process will also increase.
This is shown in figure 3.
0
0.5
1
1.5
0 200 400 600 800 1000
Frac
tio
n o
f m
ass
Temperature(0C)
P5 P20 P50 P100
-200
-100
0
100
200
300
0 200 400 600 800 1000Hea
t (m
W)
Temperature(0C)
P5 P20 P50 P100
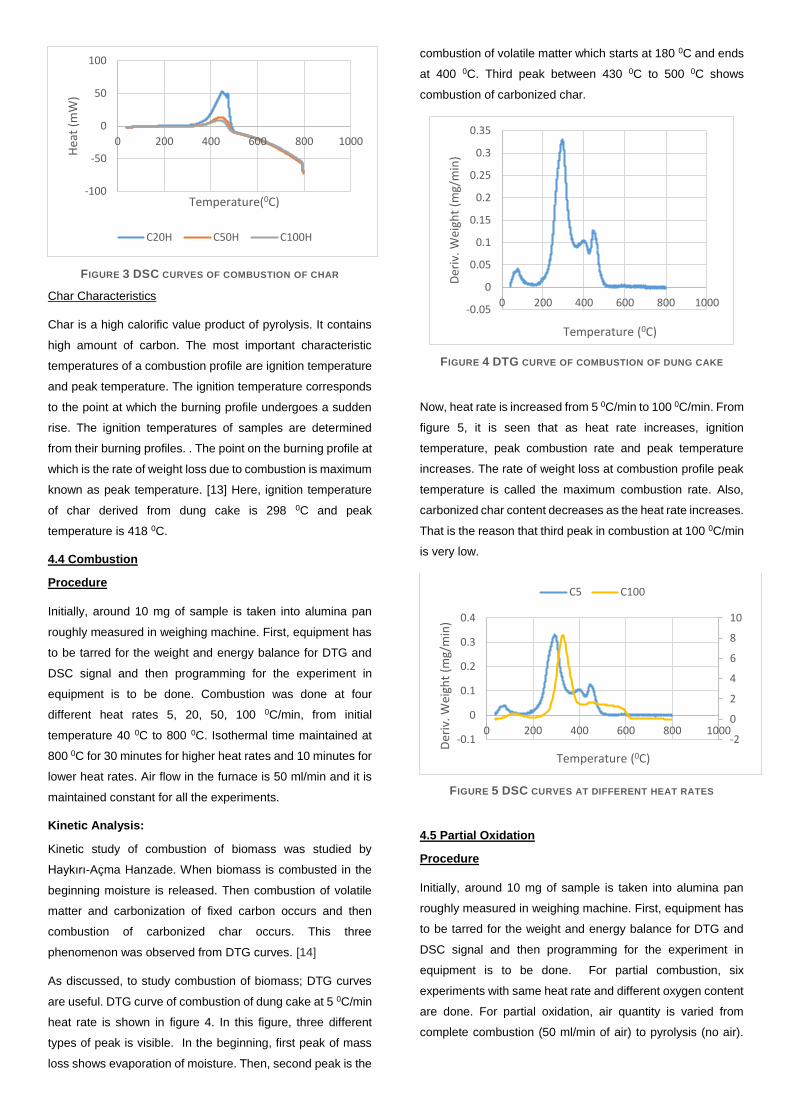
FIGURE 3 DSC CURVES OF COMBUSTION OF CHAR
Char Characteristics
Char is a high calorific value product of pyrolysis. It contains
high amount of carbon. The most important characteristic
temperatures of a combustion profile are ignition temperature
and peak temperature. The ignition temperature corresponds
to the point at which the burning profile undergoes a sudden
rise. The ignition temperatures of samples are determined
from their burning profiles. . The point on the burning profile at
which is the rate of weight loss due to combustion is maximum
known as peak temperature. [13] Here, ignition temperature
of char derived from dung cake is 298 0C and peak
temperature is 418 0C.
4.4 Combustion
Procedure
Initially, around 10 mg of sample is taken into alumina pan
roughly measured in weighing machine. First, equipment has
to be tarred for the weight and energy balance for DTG and
DSC signal and then programming for the experiment in
equipment is to be done. Combustion was done at four
different heat rates 5, 20, 50, 100 0C/min, from initial
temperature 40 0C to 800 0C. Isothermal time maintained at
800 0C for 30 minutes for higher heat rates and 10 minutes for
lower heat rates. Air flow in the furnace is 50 ml/min and it is
maintained constant for all the experiments.
Kinetic Analysis:
Kinetic study of combustion of biomass was studied by
Haykırı-Açma Hanzade. When biomass is combusted in the
beginning moisture is released. Then combustion of volatile
matter and carbonization of fixed carbon occurs and then
combustion of carbonized char occurs. This three
phenomenon was observed from DTG curves. [14]
As discussed, to study combustion of biomass; DTG curves
are useful. DTG curve of combustion of dung cake at 5 0C/min
heat rate is shown in figure 4. In this figure, three different
types of peak is visible. In the beginning, first peak of mass
loss shows evaporation of moisture. Then, second peak is the
combustion of volatile matter which starts at 180 0C and ends
at 400 0C. Third peak between 430 0C to 500 0C shows
combustion of carbonized char.
FIGURE 4 DTG CURVE OF COMBUSTION OF DUNG CAKE
Now, heat rate is increased from 5 0C/min to 100 0C/min. From
figure 5, it is seen that as heat rate increases, ignition
temperature, peak combustion rate and peak temperature
increases. The rate of weight loss at combustion profile peak
temperature is called the maximum combustion rate. Also,
carbonized char content decreases as the heat rate increases.
That is the reason that third peak in combustion at 100 0C/min
is very low.
FIGURE 5 DSC CURVES AT DIFFERENT HEAT RATES
4.5 Partial Oxidation
Procedure
Initially, around 10 mg of sample is taken into alumina pan
roughly measured in weighing machine. First, equipment has
to be tarred for the weight and energy balance for DTG and
DSC signal and then programming for the experiment in
equipment is to be done. For partial combustion, six
experiments with same heat rate and different oxygen content
are done. For partial oxidation, air quantity is varied from
complete combustion (50 ml/min of air) to pyrolysis (no air).
-100
-50
0
50
100
0 200 400 600 800 1000
Hea
t (m
W)
Temperature(0C)
C20H C50H C100H
-0.05
0
0.05
0.1
0.15
0.2
0.25
0.3
0.35
0 200 400 600 800 1000
Der
iv. W
eigh
t (m
g/m
in)
Temperature (0C)
-2
0
2
4
6
8
10
-0.1
0
0.1
0.2
0.3
0.4
0 200 400 600 800 1000
Der
iv. W
eigh
t (m
g/m
in)
Temperature (0C)
C5 C100
Total flow in the furnace is 50 ml/min and it is maintained
constant for all the experiments.
Kinetic Analysis
Kinetic study of partial oxidation of lignocellulosic biomass
was studied by Amutio Maider et al. As oxygen supplied to
biomass decreases during different oxidation experiments,
ignition temperature, peak temperature increases and peak
combustion rate decreases. [15]
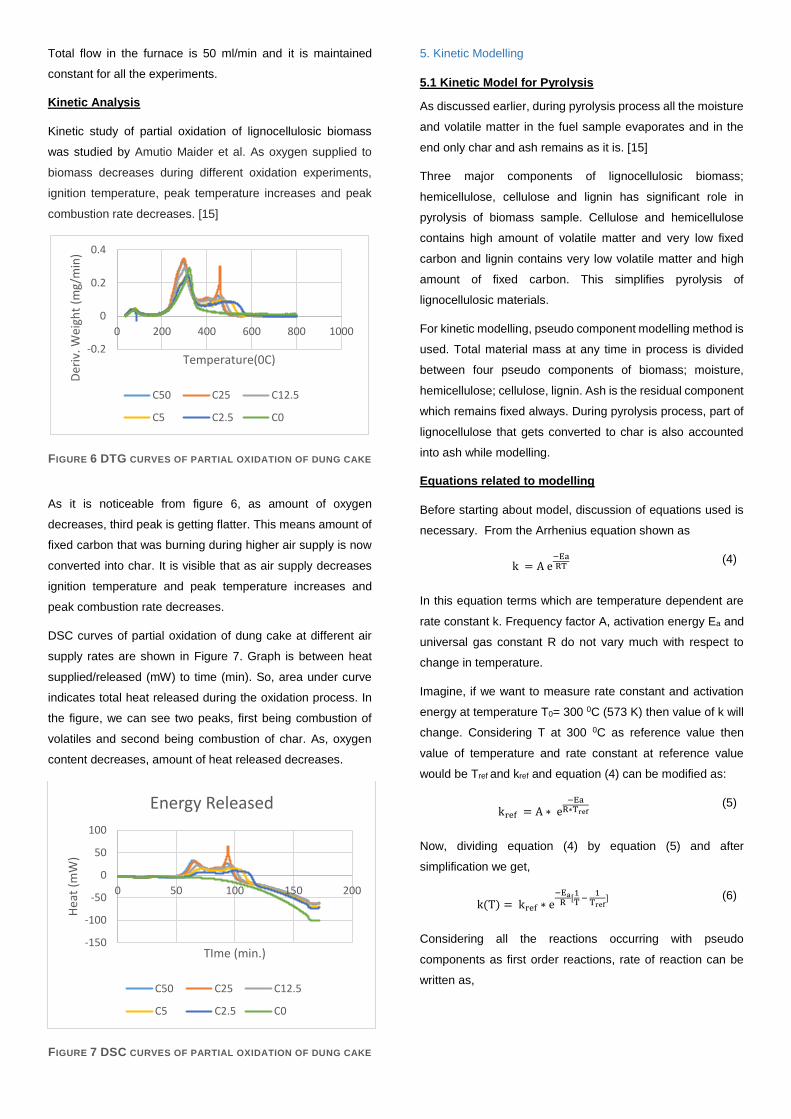
FIGURE 6 DTG CURVES OF PARTIAL OXIDATION OF DUNG CAKE
As it is noticeable from figure 6, as amount of oxygen
decreases, third peak is getting flatter. This means amount of
fixed carbon that was burning during higher air supply is now
converted into char. It is visible that as air supply decreases
ignition temperature and peak temperature increases and
peak combustion rate decreases.
DSC curves of partial oxidation of dung cake at different air
supply rates are shown in Figure 7. Graph is between heat
supplied/released (mW) to time (min). So, area under curve
indicates total heat released during the oxidation process. In
the figure, we can see two peaks, first being combustion of
volatiles and second being combustion of char. As, oxygen
content decreases, amount of heat released decreases.
FIGURE 7 DSC CURVES OF PARTIAL OXIDATION OF DUNG CAKE
5. Kinetic Modelling
5.1 Kinetic Model for Pyrolysis
As discussed earlier, during pyrolysis process all the moisture
and volatile matter in the fuel sample evaporates and in the
end only char and ash remains as it is. [15]
Three major components of lignocellulosic biomass;
hemicellulose, cellulose and lignin has significant role in
pyrolysis of biomass sample. Cellulose and hemicellulose
contains high amount of volatile matter and very low fixed
carbon and lignin contains very low volatile matter and high
amount of fixed carbon. This simplifies pyrolysis of
lignocellulosic materials.
For kinetic modelling, pseudo component modelling method is
used. Total material mass at any time in process is divided
between four pseudo components of biomass; moisture,
hemicellulose; cellulose, lignin. Ash is the residual component
which remains fixed always. During pyrolysis process, part of
lignocellulose that gets converted to char is also accounted
into ash while modelling.
Equations related to modelling
Before starting about model, discussion of equations used is
necessary. From the Arrhenius equation shown as
k = A e−EaRT
(4)
In this equation terms which are temperature dependent are
rate constant k. Frequency factor A, activation energy Ea and
universal gas constant R do not vary much with respect to
change in temperature.
Imagine, if we want to measure rate constant and activation
energy at temperature T0= 300 0C (573 K) then value of k will
change. Considering T at 300 0C as reference value then
value of temperature and rate constant at reference value
would be Tref and kref and equation (4) can be modified as:
kref = A ∗ e−Ea
R∗Tref
(5)
Now, dividing equation (4) by equation (5) and after
simplification we get,
k(T) = kref ∗ e−Ea
R[1T
− 1
Tref]
(6)
Considering all the reactions occurring with pseudo
components as first order reactions, rate of reaction can be
written as,
-0.2
0
0.2
0.4
0 200 400 600 800 1000
Der
iv. W
eigh
t (m
g/m
in)
Temperature(0C)
C50 C25 C12.5
C5 C2.5 C0
-150
-100
-50
0
50
100
0 50 100 150 200
Hea
t (m
W)
TIme (min.)
Energy Released
C50 C25 C12.5
C5 C2.5 C0

dW
dt= k(T) ∗ W
(7)
Where, W is the weight of pseudo component at time t and k
(T) is rate constant at temperature T. Now, quantity of pseudo
component at any time can be found out by using Euler’s
method for solution of first order differential equation.
Therefore, quantity of pseudo component at time t can be
written as,
W1 = W0 + dW
dt∗ (t − t0)
(8)
Where W0 is the weight of sample at time t0. Time step (t –
t0) is 0.001 second.
Model
Initially thermo gravimetric analysis was performed on dung
cake at different heat rates (5, 20, 50, 100 0C/min) with
nitrogen. For pseudo component model, every component
(moisture, hemicellulose; cellulose, lignin) was assigned initial
value (later on taken as variable value) and using equation (6)
their rate constants were found at any time t. After finding rate
constant rate of each pseudo component was found out by
using equation (7). From rate of reaction, pseudo weight was
found out by using equation (8). At any time t, summation of
mass of every pseudo component with dead mass of ash will
give amount of matter left in pan in analyzer. Total modelled
weight Wmodel of sample at any time t during process will be,
𝑊𝑚𝑜𝑖 + 𝑊ℎ𝑒𝑚𝑖 + 𝑊𝑐𝑒𝑙𝑙 + 𝑊𝑙𝑖𝑔 + 𝑊𝑎𝑠ℎ
= 𝑊 𝑚𝑜𝑑𝑒𝑙
(9)
Where, Wmoi is moisture content, Whemi is hemicellulose
content, Wcell is cellulose content, Wlig is lignin content, Wash is
ash content, and Wmodel is total weight of sample at any time
t.
Modelling is done using excel solver program. In which first
objective function has to be set up. In this model objective
function is taken as summation of square of error (difference
of practical weight Wpractical and modelled weight) at different
heat rates. Objective function is shown as,
𝑂. 𝐹. = ∑∗
4
𝑖=1
∑(𝑊𝑝𝑟𝑎𝑐𝑡𝑖𝑐𝑎𝑙 − 𝑊𝑚𝑜𝑑𝑒𝑙)2
𝑁
𝑗=1
(10)
Where, j = 1,2.., N is the total no. of steps in the experiments
and j=1,2,3 and 4 are values of total square of error at heat
rates of 5, 20, 50 and 100 0C/min respectively.
Results
The activation energies for the pyrolysis of the different
pseudo components are shown in table 3. From the
experiments of J. J. Orfão et al. of pyrolysis of different
components of lignocellulosic biomass it can be concluded
that while pyrolyzing biomass initially moisture evaporates
followed by destruction of hemicellulose, cellulose and lignin
structure destruction [52].
Table 3 Activation energies estimated for the pyrolysis of the
different pseudo components considered.
Hemicellulose
Cellulose
Lignin
Moisture
k(300) (1/min) 0.62 0.07 0.01 22.48
Ea (kcal/mol) 18.04 24.98 5.53 9.46
High values of k(300) and activation energy Ea suggests that
hemicellulose will decompose at lower temperatures and
lower values of k(300) and Ea suggests that lignin will
decompose in wide range of temperature. Whereas, cellulose
will have higher peak because of high value of Ea and
decompose after hemicellulose because of lower value of
k(300).
5.2 Kinetic Model for Combustion
Model
Experiments were performed at four different heat rates (5,
20, 50 and 100 0C/min) using same amount of air flow (50
ml/min) from initial temperature of 40 0C to 800 0C. Kinetic
modelling of combustion process is similar to modelling of
pyrolysis. All the equations (equations (6) to (10)) and process
mentioned in modelling of pyrolysis is used in the same
manner except for equation (7). Equation (7) has to be
modified to account for combustion. Equation (11) is the
modified equation which has an extra component multiplied
i.e. partial pressure of oxygen which is constant for all
experiments pO2=0.21 atm. [61]
dW
dt= k(T) ∗ W ∗ 𝑝𝑂2
(11)
Results
Activation energies of pseudo components are shown in table
4. From the experiments of J. J. Orfão of combustion of
different components of lignocellulosic biomass it can be
deducted that while combusting biomass initially moisture
evaporates followed by combustion of hemicellulose,
cellulose (volatiles) and lignin (char) structure. [16]
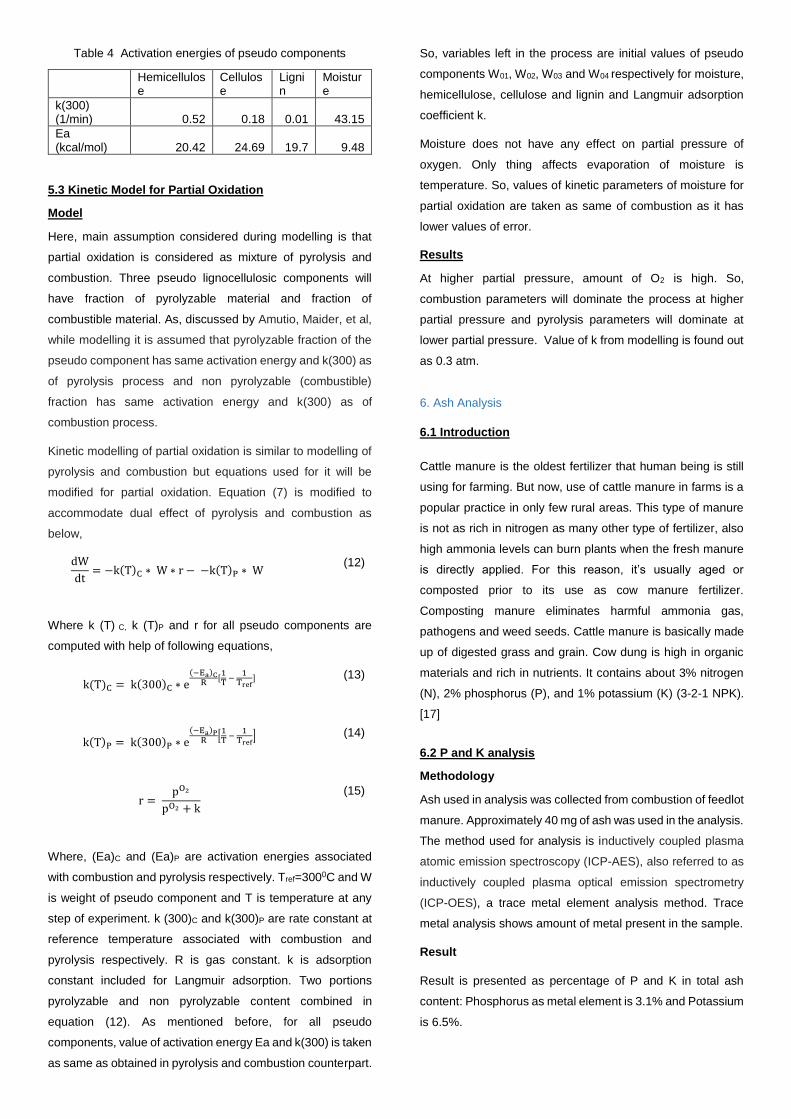
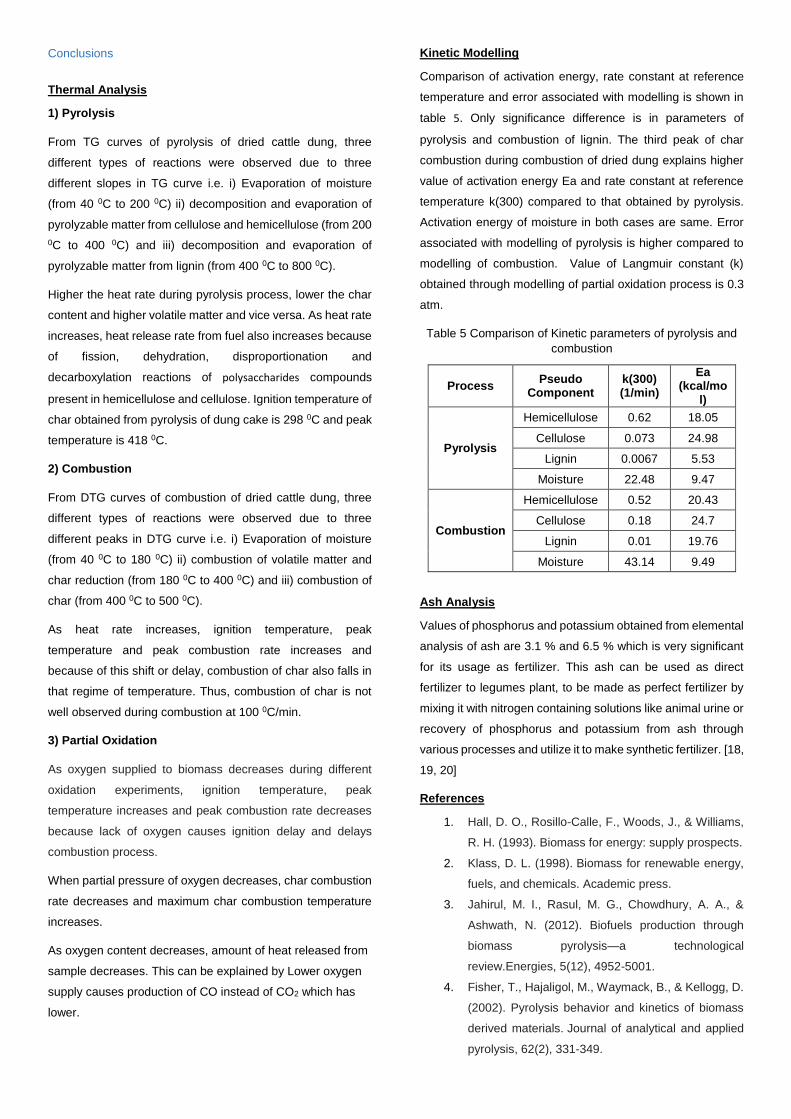
Table 4 Activation energies of pseudo components
Hemicellulose
Cellulose
Lignin
Moisture
k(300) (1/min) 0.52 0.18 0.01 43.15
Ea (kcal/mol) 20.42 24.69 19.7 9.48
5.3 Kinetic Model for Partial Oxidation
Model
Here, main assumption considered during modelling is that
partial oxidation is considered as mixture of pyrolysis and
combustion. Three pseudo lignocellulosic components will
have fraction of pyrolyzable material and fraction of
combustible material. As, discussed by Amutio, Maider, et al,
while modelling it is assumed that pyrolyzable fraction of the
pseudo component has same activation energy and k(300) as
of pyrolysis process and non pyrolyzable (combustible)
fraction has same activation energy and k(300) as of
combustion process.
Kinetic modelling of partial oxidation is similar to modelling of
pyrolysis and combustion but equations used for it will be
modified for partial oxidation. Equation (7) is modified to
accommodate dual effect of pyrolysis and combustion as
below,
dW
dt= −k(T)C ∗ W ∗ r − −k(T)P ∗ W
(12)
Where k (T) C, k (T)P and r for all pseudo components are
computed with help of following equations,
k(T)C = k(300)C ∗ e(−Ea)C
R[1T
− 1
Tref]
(13)
k(T)P = k(300)P ∗ e(−Ea)P
R[1T
− 1
Tref]
(14)
r = pO2
pO2 + k
(15)
Where, (Ea)C and (Ea)P are activation energies associated
with combustion and pyrolysis respectively. Tref=3000C and W
is weight of pseudo component and T is temperature at any
step of experiment. k (300)C and k(300)P are rate constant at
reference temperature associated with combustion and
pyrolysis respectively. R is gas constant. k is adsorption
constant included for Langmuir adsorption. Two portions
pyrolyzable and non pyrolyzable content combined in
equation (12). As mentioned before, for all pseudo
components, value of activation energy Ea and k(300) is taken
as same as obtained in pyrolysis and combustion counterpart.
So, variables left in the process are initial values of pseudo
components W01, W02, W03 and W04 respectively for moisture,
hemicellulose, cellulose and lignin and Langmuir adsorption
coefficient k.
Moisture does not have any effect on partial pressure of
oxygen. Only thing affects evaporation of moisture is
temperature. So, values of kinetic parameters of moisture for
partial oxidation are taken as same of combustion as it has
lower values of error.
Results
At higher partial pressure, amount of O2 is high. So,
combustion parameters will dominate the process at higher
partial pressure and pyrolysis parameters will dominate at
lower partial pressure. Value of k from modelling is found out
as 0.3 atm.
6. Ash Analysis
6.1 Introduction
Cattle manure is the oldest fertilizer that human being is still
using for farming. But now, use of cattle manure in farms is a
popular practice in only few rural areas. This type of manure
is not as rich in nitrogen as many other type of fertilizer, also
high ammonia levels can burn plants when the fresh manure
is directly applied. For this reason, it’s usually aged or
composted prior to its use as cow manure fertilizer.
Composting manure eliminates harmful ammonia gas,
pathogens and weed seeds. Cattle manure is basically made
up of digested grass and grain. Cow dung is high in organic
materials and rich in nutrients. It contains about 3% nitrogen
(N), 2% phosphorus (P), and 1% potassium (K) (3-2-1 NPK).
[17]
6.2 P and K analysis
Methodology
Ash used in analysis was collected from combustion of feedlot
manure. Approximately 40 mg of ash was used in the analysis.
The method used for analysis is inductively coupled plasma
atomic emission spectroscopy (ICP-AES), also referred to as
inductively coupled plasma optical emission spectrometry
(ICP-OES), a trace metal element analysis method. Trace
metal analysis shows amount of metal present in the sample.
Result
Result is presented as percentage of P and K in total ash
content: Phosphorus as metal element is 3.1% and Potassium
is 6.5%.
Conclusions
Thermal Analysis
1) Pyrolysis
From TG curves of pyrolysis of dried cattle dung, three
different types of reactions were observed due to three
different slopes in TG curve i.e. i) Evaporation of moisture
(from 40 0C to 200 0C) ii) decomposition and evaporation of
pyrolyzable matter from cellulose and hemicellulose (from 200
0C to 400 0C) and iii) decomposition and evaporation of
pyrolyzable matter from lignin (from 400 0C to 800 0C).
Higher the heat rate during pyrolysis process, lower the char
content and higher volatile matter and vice versa. As heat rate
increases, heat release rate from fuel also increases because
of fission, dehydration, disproportionation and
decarboxylation reactions of polysaccharides compounds
present in hemicellulose and cellulose. Ignition temperature of
char obtained from pyrolysis of dung cake is 298 0C and peak
temperature is 418 0C.
2) Combustion
From DTG curves of combustion of dried cattle dung, three
different types of reactions were observed due to three
different peaks in DTG curve i.e. i) Evaporation of moisture
(from 40 0C to 180 0C) ii) combustion of volatile matter and
char reduction (from 180 0C to 400 0C) and iii) combustion of
char (from 400 0C to 500 0C).
As heat rate increases, ignition temperature, peak
temperature and peak combustion rate increases and
because of this shift or delay, combustion of char also falls in
that regime of temperature. Thus, combustion of char is not
well observed during combustion at 100 0C/min.
3) Partial Oxidation
As oxygen supplied to biomass decreases during different
oxidation experiments, ignition temperature, peak
temperature increases and peak combustion rate decreases
because lack of oxygen causes ignition delay and delays
combustion process.
When partial pressure of oxygen decreases, char combustion
rate decreases and maximum char combustion temperature
increases.
As oxygen content decreases, amount of heat released from
sample decreases. This can be explained by Lower oxygen
supply causes production of CO instead of CO2 which has
lower.
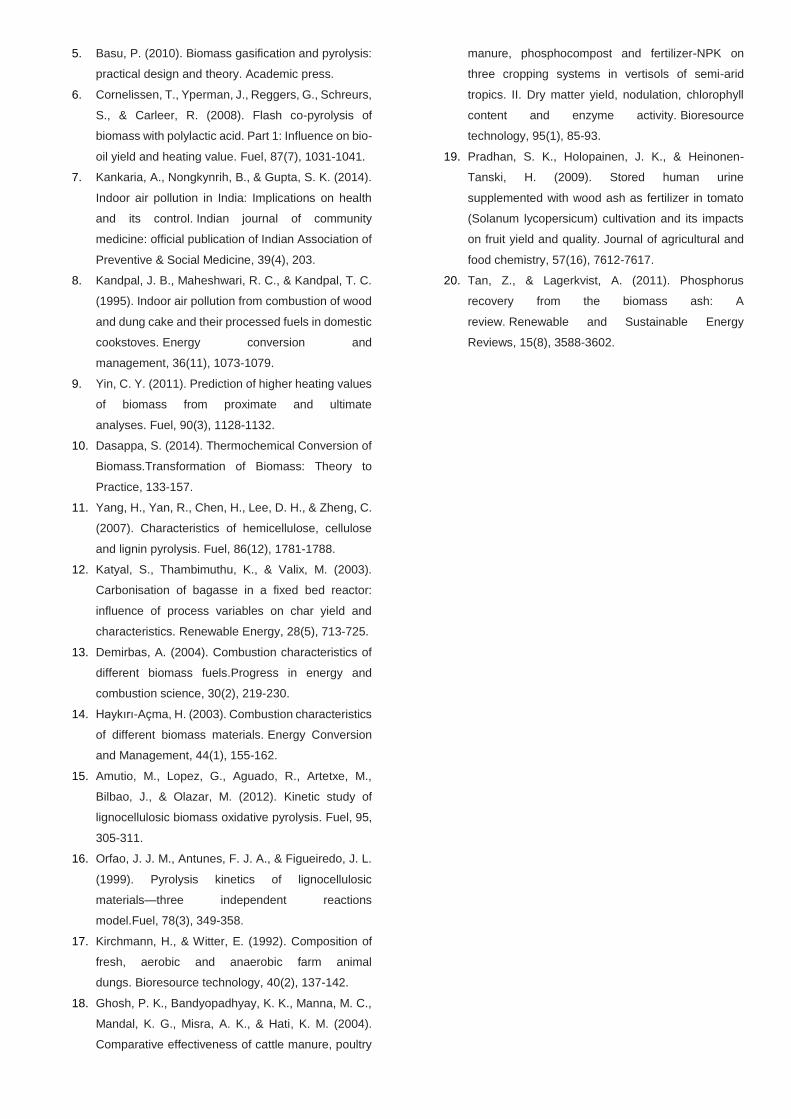
Kinetic Modelling
Comparison of activation energy, rate constant at reference
temperature and error associated with modelling is shown in
table 5. Only significance difference is in parameters of
pyrolysis and combustion of lignin. The third peak of char
combustion during combustion of dried dung explains higher
value of activation energy Ea and rate constant at reference
temperature k(300) compared to that obtained by pyrolysis.
Activation energy of moisture in both cases are same. Error
associated with modelling of pyrolysis is higher compared to
modelling of combustion. Value of Langmuir constant (k)
obtained through modelling of partial oxidation process is 0.3
atm.
Table 5 Comparison of Kinetic parameters of pyrolysis and
combustion
Process Pseudo
Component k(300) (1/min)
Ea (kcal/mo
l)
Pyrolysis
Hemicellulose 0.62 18.05
Cellulose 0.073 24.98
Lignin 0.0067 5.53
Moisture 22.48 9.47
Combustion
Hemicellulose 0.52 20.43
Cellulose 0.18 24.7
Lignin 0.01 19.76
Moisture 43.14 9.49
Ash Analysis
Values of phosphorus and potassium obtained from elemental
analysis of ash are 3.1 % and 6.5 % which is very significant
for its usage as fertilizer. This ash can be used as direct
fertilizer to legumes plant, to be made as perfect fertilizer by
mixing it with nitrogen containing solutions like animal urine or
recovery of phosphorus and potassium from ash through
various processes and utilize it to make synthetic fertilizer. [18,
19, 20]
References
1. Hall, D. O., Rosillo-Calle, F., Woods, J., & Williams,
R. H. (1993). Biomass for energy: supply prospects.
2. Klass, D. L. (1998). Biomass for renewable energy,
fuels, and chemicals. Academic press.
3. Jahirul, M. I., Rasul, M. G., Chowdhury, A. A., &
Ashwath, N. (2012). Biofuels production through
biomass pyrolysis—a technological
review.Energies, 5(12), 4952-5001.
4. Fisher, T., Hajaligol, M., Waymack, B., & Kellogg, D.
(2002). Pyrolysis behavior and kinetics of biomass
derived materials. Journal of analytical and applied
pyrolysis, 62(2), 331-349.
5. Basu, P. (2010). Biomass gasification and pyrolysis:
practical design and theory. Academic press.
6. Cornelissen, T., Yperman, J., Reggers, G., Schreurs,
S., & Carleer, R. (2008). Flash co-pyrolysis of
biomass with polylactic acid. Part 1: Influence on bio-
oil yield and heating value. Fuel, 87(7), 1031-1041.
7. Kankaria, A., Nongkynrih, B., & Gupta, S. K. (2014).
Indoor air pollution in India: Implications on health
and its control. Indian journal of community
medicine: official publication of Indian Association of
Preventive & Social Medicine, 39(4), 203.
8. Kandpal, J. B., Maheshwari, R. C., & Kandpal, T. C.
(1995). Indoor air pollution from combustion of wood
and dung cake and their processed fuels in domestic
cookstoves. Energy conversion and
management, 36(11), 1073-1079.
9. Yin, C. Y. (2011). Prediction of higher heating values
of biomass from proximate and ultimate
analyses. Fuel, 90(3), 1128-1132.
10. Dasappa, S. (2014). Thermochemical Conversion of
Biomass.Transformation of Biomass: Theory to
Practice, 133-157.
11. Yang, H., Yan, R., Chen, H., Lee, D. H., & Zheng, C.
(2007). Characteristics of hemicellulose, cellulose
and lignin pyrolysis. Fuel, 86(12), 1781-1788.
12. Katyal, S., Thambimuthu, K., & Valix, M. (2003).
Carbonisation of bagasse in a fixed bed reactor:
influence of process variables on char yield and
characteristics. Renewable Energy, 28(5), 713-725.
13. Demirbas, A. (2004). Combustion characteristics of
different biomass fuels.Progress in energy and
combustion science, 30(2), 219-230.
14. Haykırı-Açma, H. (2003). Combustion characteristics
of different biomass materials. Energy Conversion
and Management, 44(1), 155-162.
15. Amutio, M., Lopez, G., Aguado, R., Artetxe, M.,
Bilbao, J., & Olazar, M. (2012). Kinetic study of
lignocellulosic biomass oxidative pyrolysis. Fuel, 95,
305-311.
16. Orfao, J. J. M., Antunes, F. J. A., & Figueiredo, J. L.
(1999). Pyrolysis kinetics of lignocellulosic
materials—three independent reactions
model.Fuel, 78(3), 349-358.
17. Kirchmann, H., & Witter, E. (1992). Composition of
fresh, aerobic and anaerobic farm animal
dungs. Bioresource technology, 40(2), 137-142.
18. Ghosh, P. K., Bandyopadhyay, K. K., Manna, M. C.,
Mandal, K. G., Misra, A. K., & Hati, K. M. (2004).
Comparative effectiveness of cattle manure, poultry
manure, phosphocompost and fertilizer-NPK on
three cropping systems in vertisols of semi-arid
tropics. II. Dry matter yield, nodulation, chlorophyll
content and enzyme activity. Bioresource
technology, 95(1), 85-93.
19. Pradhan, S. K., Holopainen, J. K., & Heinonen-
Tanski, H. (2009). Stored human urine
supplemented with wood ash as fertilizer in tomato
(Solanum lycopersicum) cultivation and its impacts
on fruit yield and quality. Journal of agricultural and
food chemistry, 57(16), 7612-7617.
20. Tan, Z., & Lagerkvist, A. (2011). Phosphorus
recovery from the biomass ash: A
review. Renewable and Sustainable Energy
Reviews, 15(8), 3588-3602.