kinetic monte carlo simulations for birefringence ... · the journal of chemical physics 144,...
TRANSCRIPT

Kinetic Monte Carlo simulations for birefringence relaxation of photo-switchablemolecules on a surfaceRaffaele Tavarone, Patrick Charbonneau, and Holger Stark Citation: The Journal of Chemical Physics 144, 104703 (2016); doi: 10.1063/1.4943393 View online: http://dx.doi.org/10.1063/1.4943393 View Table of Contents: http://scitation.aip.org/content/aip/journal/jcp/144/10?ver=pdfcov Published by the AIP Publishing Articles you may be interested in Polarimetry in turbid, birefringent, optically active media: A Monte Carlo study of Mueller matrix decompositionin the backscattering geometry J. Appl. Phys. 105, 102023 (2009); 10.1063/1.3116129 One-dimensional birefringent photonic crystal laser J. Appl. Phys. 103, 033103 (2008); 10.1063/1.2838184 Kinetics of diffraction gratings formation in a polymer matrix containing azobenzene chromophores:Experiments and Monte Carlo simulations J. Chem. Phys. 119, 6789 (2003); 10.1063/1.1603736 Photoluminescence emission and Raman scattering polarization in birefringent organic microcavities in thestrong coupling regime J. Appl. Phys. 93, 5003 (2003); 10.1063/1.1563826 A Monte Carlo simulation study of the temperature dependence for the conformation distribution of 1,2-dimethoxyethane in water J. Chem. Phys. 106, 2411 (1997); 10.1063/1.473152
Reuse of AIP Publishing content is subject to the terms: https://publishing.aip.org/authors/rights-and-permissions. Downloaded to IP: 130.149.114.89 On: Tue, 15 Mar
2016 08:57:20
THE JOURNAL OF CHEMICAL PHYSICS 144, 104703 (2016)
Kinetic Monte Carlo simulations for birefringence relaxationof photo-switchable molecules on a surface
Raffaele Tavarone,1,a) Patrick Charbonneau,2 and Holger Stark1,b)1Institut für Theoretische Physik, Technische Universität Berlin, Hardenbergstrasse 36, D-10623 Berlin,Germany2Departments of Chemistry and Physics, Duke University, Durham, North Carolina 27708, USA
(Received 23 December 2015; accepted 18 February 2016; published online 11 March 2016)
Recent experiments have demonstrated that in a dense monolayer of photo-switchable dye methyl-redmolecules the relaxation of an initial birefringence follows a power-law decay, typical for glass-likedynamics. The slow relaxation can efficiently be controlled and accelerated by illuminating themonolayer with circularly polarized light, which induces trans-cis isomerization cycles. To elucidatethe microscopic mechanism, we develop a two-dimensional molecular model in which the transand cis isomers are represented by straight and bent needles, respectively. As in the experimentalsystem, the needles are allowed to rotate and to form overlaps but they cannot translate. The out-of-equilibrium rotational dynamics of the needles is generated using kinetic Monte Carlo simulations.We demonstrate that, in a regime of high density and low temperature, the power-law relaxation canbe traced to the formation of spatio-temporal correlations in the rotational dynamics, i.e., dynamicheterogeneity. We also show that the nearly isotropic cis isomers can prevent dynamic heterogeneityfrom forming in the monolayer and that the relaxation then becomes exponential. C 2016 AIPPublishing LLC. [http://dx.doi.org/10.1063/1.4943393]
I. INTRODUCTION
The possibility to control organic and inorganic materialsat the molecular nanoscale level is crucial for a large varietyof technological applications and for a deeper understandingof matter.1–8 Among possible tools for molecular control,light is one of the most promising. Some of the appealingapplications include: illuminating the metallic tip of a scanningforce microscopy to precisely control the position of singlemolecules,2 using nanowires to build miniaturized photonicdevices,4 and inscribing nano-sized geometrical patterns on asurface by photolithography.9
Photochromic molecular switches, molecules that un-dergo configurational changes between two (or even more)isomeric states when irradiated by light,10 offer yet anotherappealing way to control material properties with light. Forexample, they are used to fabricate functional surfaces withtunable chirality, wettability, conductivity etc.11,12 Amongother things,13 photoswitching molecules illuminated by lightcan reorient a nematic liquid crystal or directly controlboth the formation and relaxation of orientational order ina monolayer.1,14–17 Thus, many material properties such asmass transport, mobility, and viscosity can be efficiently tunedwhile producing hardly any heat. Although these phenomenahave attracted much interest for many years, details of themicroscopic dynamics still need to be clarified.
In theory, the rotational dynamics of light-switchablemolecules is mainly described by Fokker-Planck equationsfor the molecular orientational distribution functions of each
a)Electronic mail: [email protected])Electronic mail: [email protected]
isomeric configuration supplemented by source terms.18–27
Molecular interactions are treated within mean-field approxi-mation, where microscopic details such as the different shapesof the isomers are neglected.
In this article we consider a self-assembled monolayer oflight-switchable molecules tethered to a surface. Instead ofthe method mentioned above, we perform kinetic Monte Carlosimulations for a molecular model, where we approximate thetwo isomeric states, called trans and cis, by a straight and abent needle, respectively. The simplicity of the model allowsus to study the long-time collective dynamics of a statisticalensemble consisting of 10 000 molecules,28 much more thanatomistic molecular dynamics simulations can handle. In aprevious work we have investigated the phase ordering of bentneedles with varying shape.29
Our work is motivated by a recent experimental studyof Fang et al.1 on the glasslike orientational dynamics ofa self-assembled monolayer of photo-switching molecules.After aligning the molecules with light, the authors observedthe decay of orientational order (or birefringence) under eitherthermal erasure or erasure with circularly polarized (CP) light.In both cases they find that the relaxation of birefringencefollows a power law, which is typical for glasslike dynamics.
Within our relatively simple model we can reproduce thisfeature in a system containing straight needles alone (transmolecules), if the density is sufficiently high and temperatureis low. We demonstrate that the needles, when randomizingtheir orientations, develop dynamic heterogeneities in spaceand time,30,31 which ultimately cause the power-law decay. Thepresence of cis molecules, which have a rather isotropic shape,can prevent the formation of such spatio-temporal variationsin the local structure and the birefringence relaxation then
0021-9606/2016/144(10)/104703/12/$30.00 144, 104703-1 © 2016 AIP Publishing LLC
Reuse of AIP Publishing content is subject to the terms: https://publishing.aip.org/authors/rights-and-permissions. Downloaded to IP: 130.149.114.89 On: Tue, 15 Mar
2016 08:57:20

104703-2 Tavarone, Charbonneau, and Stark J. Chem. Phys. 144, 104703 (2016)
becomes exponential. In the following, we clarify underwhich conditions our model nevertheless reproduces theexperimental observation of a power-law decay by tuningisomerization probabilities.
The plan of this paper is as follows. In Sec. II wethoroughly review the experimental motivation for our workand explain the model and simulation method in Sec. III.The system of pure trans molecules is studied in detail inSec. IV and in Sec. V we discuss the birefringence relaxationin a system with light-switchable molecules. We close with asummary of the results and a conclusion in Sec. VI.
II. EXPERIMENTAL MOTIVATION
The work presented in this paper is strongly inspiredby recent experiments of Fang et al.1 that have attractedconsiderable attention. In this section we first shortlysummarize their results.
A self-assembled monolayer (SAM) with glasslikedynamics is realized by covering at high in-plane densitya glass surface with dye Methyl-Red (dMR) molecules andtethering them with covalent bonds at random positions.The molecules are then free to rotate but their translationalfreedom is constrained to ≈1 nm displacements. In the groundstate dMR molecules assume a rod-like trans configurationwith anisotropic optical properties. The light-induced cisconfiguration has a bent-core shape and is nearly isotropic.Because of their photo-switchable azo-core, isomerizationbetween the two configurations can efficiently be inducedby illumination with light at a 514 nm wavelength. Theabsorption spectra of the cis and trans isomers partiallyoverlap and illumination with light of this wavelength inducesboth cis-to-trans and trans-to-cis transitions.
In Ref. 1 the initial orientation of the molecules in theSAM was random. Under illumination with linearly polarizedlight (writing process), molecules preferentially aligned alongthe light polarization vector more likely switch toward thecis configuration, while the remaining trans molecules formnematic order perpendicular to the light polarization (hole-burning).32–34 The monolayer thus exhibits some birefringenceQ(t). Since light illumination also induces the reverse, cis-to-trans transition, in steady state a mixture of both isomersexists at a relative concentration that mostly depends on thelight intensity and the monolayer density.
Reference 1 investigated the relaxation of the birefrin-gence under two different illumination conditions followingthe writing process:
(1) The SAM is left in the dark, resulting in the relaxationbeing driven by thermal fluctuations (thermal erasure). Atroom temperature all molecules in the cis configurationrelax back to the trans form after a characteristic time.35
They assume random orientations and the nematic orderis lost.
(2) The SAM, immediately after the end of the writingprocess, is instead illuminated with circularly polarizedlight at 514 nm, which makes the molecules cyclebetween the trans and cis configurations and speeds upthe relaxation dynamics of the birefringence (CP erasure).
FIG. 1. Schematic representation of the relaxation of the birefringence, Q(t),obtained in the experiment discussed in Ref. 1. The birefringence inscribedin the monolayer by illuminating it with linearly polarized light can be erasedeither by thermal fluctuations at room temperature (thermal erasure) or byillumination with circularly polarized light (CP erasure). In both cases therelaxation is well described by the long-time power law decay of Eq. (1).Parameters τt are shown as a diamond marker. Other parameters are η = 0.25for the thermal erasure curve and η = 0.63 for the CP erasure curve.
A schematic of the typical experimental results is givenin Fig. 1, where the temporal evolution of the birefringenceQ(t) is shown for both thermal and CP erasure processes.Fang et al.1 showed that the relaxation of the birefringenceis non-exponential, and is instead accurately described by afunctional form of the type
Q(t) = [1 + (t/τt)]−η. (1)
An asymptotic power-law relaxation starts at t ≈ τt andproceeds as Q(t) ≈ (t/τt)−η for t > τt.
Non-exponential relaxations are characteristic of a glassystate, i.e., of systems sampling a rugged free energylandscape.36–39 The underlying dynamics does not possessa single characteristic time scale, but rather a distributionof them. It has been suggested1,16 that the distribution ofenergetic barriers that leads to the power-law relaxation in theSAM originates from (i) the high packing density and (ii) themolecular rotations proceeding in discrete jumps as moleculespass each other by stretching or squeezing the covalent bonds.
In the following we describe a molecular model, whichincorporates the essential features of the experiment outlinedin this section and consider its dynamical behavior underconditions that mimic those studied experimentally.1
III. MODEL AND SIMULATION METHODS
In this section we detail the molecular model andthe kinetic Monte Carlo simulations that we implementedto investigate the relaxation of the birefringence in theexperimental system.
A. Molecular model
As explained in Sec. II, when the monolayer of tetheredmolecules studied in Ref. 1 is illuminated by light, moleculescycle between an anisotropic, rod-like trans configuration anda nearly isotropic, bent-like cis configuration [see Fig. 2(a)].We model the trans isomer as an infinitely thin, straight needleof unit length L = 1 and the cis isomer as a bent, infinitelythin needle also of total length L [see Fig. 2(b)]. In the cis
Reuse of AIP Publishing content is subject to the terms: https://publishing.aip.org/authors/rights-and-permissions. Downloaded to IP: 130.149.114.89 On: Tue, 15 Mar
2016 08:57:20
104703-3 Tavarone, Charbonneau, and Stark J. Chem. Phys. 144, 104703 (2016)
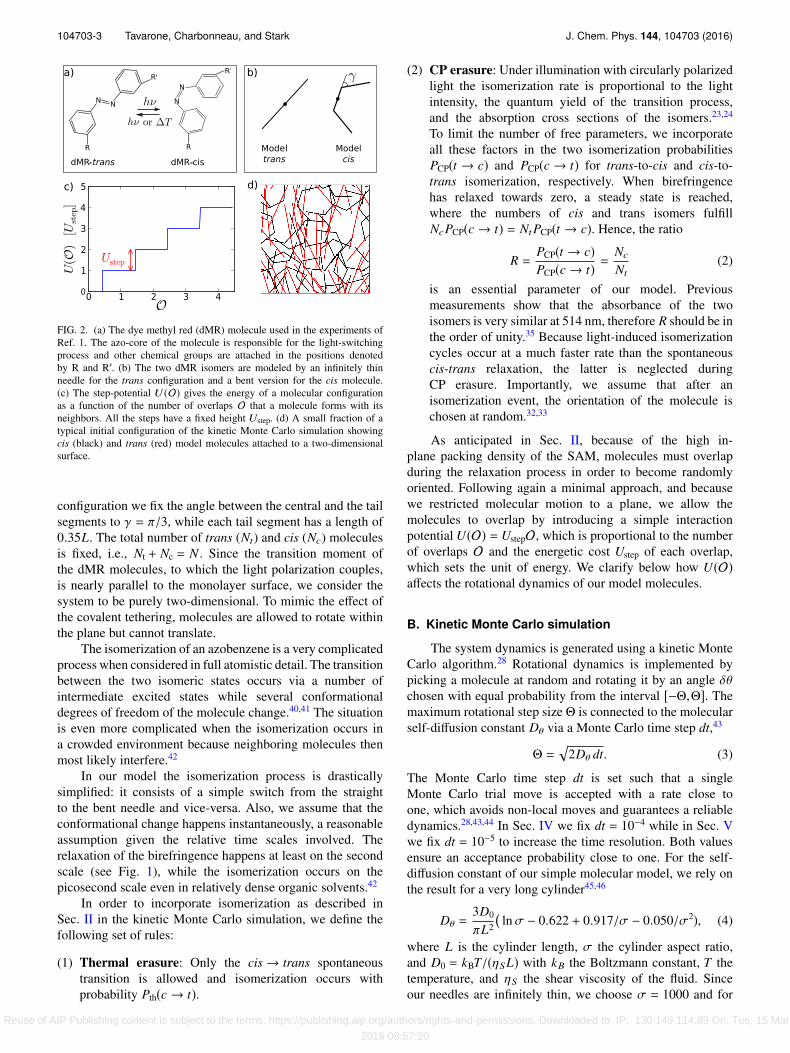
FIG. 2. (a) The dye methyl red (dMR) molecule used in the experiments ofRef. 1. The azo-core of the molecule is responsible for the light-switchingprocess and other chemical groups are attached in the positions denotedby R and R′. (b) The two dMR isomers are modeled by an infinitely thinneedle for the trans configuration and a bent version for the cis molecule.(c) The step-potential U (O) gives the energy of a molecular configurationas a function of the number of overlaps O that a molecule forms with itsneighbors. All the steps have a fixed height Ustep. (d) A small fraction of atypical initial configuration of the kinetic Monte Carlo simulation showingcis (black) and trans (red) model molecules attached to a two-dimensionalsurface.
configuration we fix the angle between the central and the tailsegments to γ = π/3, while each tail segment has a length of0.35L. The total number of trans (Nt) and cis (Nc) moleculesis fixed, i.e., Nt + Nc = N . Since the transition moment ofthe dMR molecules, to which the light polarization couples,is nearly parallel to the monolayer surface, we consider thesystem to be purely two-dimensional. To mimic the effect ofthe covalent tethering, molecules are allowed to rotate withinthe plane but cannot translate.
The isomerization of an azobenzene is a very complicatedprocess when considered in full atomistic detail. The transitionbetween the two isomeric states occurs via a number ofintermediate excited states while several conformationaldegrees of freedom of the molecule change.40,41 The situationis even more complicated when the isomerization occurs ina crowded environment because neighboring molecules thenmost likely interfere.42
In our model the isomerization process is drasticallysimplified: it consists of a simple switch from the straightto the bent needle and vice-versa. Also, we assume that theconformational change happens instantaneously, a reasonableassumption given the relative time scales involved. Therelaxation of the birefringence happens at least on the secondscale (see Fig. 1), while the isomerization occurs on thepicosecond scale even in relatively dense organic solvents.42
In order to incorporate isomerization as described inSec. II in the kinetic Monte Carlo simulation, we define thefollowing set of rules:
(1) Thermal erasure: Only the cis → trans spontaneoustransition is allowed and isomerization occurs withprobability Pth(c → t).
(2) CP erasure: Under illumination with circularly polarizedlight the isomerization rate is proportional to the lightintensity, the quantum yield of the transition process,and the absorption cross sections of the isomers.23,24
To limit the number of free parameters, we incorporateall these factors in the two isomerization probabilitiesPCP(t → c) and PCP(c → t) for trans-to-cis and cis-to-trans isomerization, respectively. When birefringencehas relaxed towards zero, a steady state is reached,where the numbers of cis and trans isomers fulfillNcPCP(c → t) = NtPCP(t → c). Hence, the ratio
R =PCP(t → c)PCP(c → t) =
Nc
Nt(2)
is an essential parameter of our model. Previousmeasurements show that the absorbance of the twoisomers is very similar at 514 nm, therefore R should be inthe order of unity.35 Because light-induced isomerizationcycles occur at a much faster rate than the spontaneouscis-trans relaxation, the latter is neglected duringCP erasure. Importantly, we assume that after anisomerization event, the orientation of the molecule ischosen at random.32,33
As anticipated in Sec. II, because of the high in-plane packing density of the SAM, molecules must overlapduring the relaxation process in order to become randomlyoriented. Following again a minimal approach, and becausewe restricted molecular motion to a plane, we allow themolecules to overlap by introducing a simple interactionpotential U(O) = UstepO, which is proportional to the numberof overlaps O and the energetic cost Ustep of each overlap,which sets the unit of energy. We clarify below how U(O)affects the rotational dynamics of our model molecules.
B. Kinetic Monte Carlo simulation
The system dynamics is generated using a kinetic MonteCarlo algorithm.28 Rotational dynamics is implemented bypicking a molecule at random and rotating it by an angle δθchosen with equal probability from the interval [−Θ,Θ]. Themaximum rotational step size Θ is connected to the molecularself-diffusion constant Dθ via a Monte Carlo time step dt,43
Θ =
2Dθ dt. (3)
The Monte Carlo time step dt is set such that a singleMonte Carlo trial move is accepted with a rate close toone, which avoids non-local moves and guarantees a reliabledynamics.28,43,44 In Sec. IV we fix dt = 10−4 while in Sec. Vwe fix dt = 10−5 to increase the time resolution. Both valuesensure an acceptance probability close to one. For the self-diffusion constant of our simple molecular model, we rely onthe result for a very long cylinder45,46
Dθ =3D0
πL2
�lnσ − 0.622 + 0.917/σ − 0.050/σ2), (4)
where L is the cylinder length, σ the cylinder aspect ratio,and D0 = kBT/(ηSL) with kB the Boltzmann constant, T thetemperature, and ηS the shear viscosity of the fluid. Sinceour needles are infinitely thin, we choose σ = 1000 and for
Reuse of AIP Publishing content is subject to the terms: https://publishing.aip.org/authors/rights-and-permissions. Downloaded to IP: 130.149.114.89 On: Tue, 15 Mar
2016 08:57:20

104703-4 Tavarone, Charbonneau, and Stark J. Chem. Phys. 144, 104703 (2016)
simplicity, the rotational diffusion constants of trans and cismolecule are assumed to be the same.
Both rotational motion and isomerization take place underthe influence of the interaction potential U(O). At each MonteCarlo step a molecule is picked at random and rotated andisomerized using the set of rules defined in Sec. III A. After atrial move of a single molecule, the number of overlaps andthe energy U(Onew) of the new configuration are evaluated andcompared to the old configuration with U(Oold). Followingthe standard Metropolis scheme, the move is accepted withprobability
p = min 1,exp(−1/(kBT)[U(Onew) −U(Oold)]). (5)
In the following we express kBT in units of Ustep.A complete sweep consists of N trial moves and the
running Monte Carlo time is measured in units of dt. Thus,tMC = Ns, where Ns is the number of Monte Carlo sweeps.The number density of the model molecules is defined asρ = N/l2, where l, in units of L, is the side length of thesquare simulation box. For all the results presented in thefollowing, we use a total of N = 10 000 molecules underperiodic boundary conditions.
As initial condition, we use a configuration, in whichboth isomers are equally present. The trans molecules exhibitorientational order while cis molecules are randomly oriented.Starting from this configuration, we then follow the relaxationof the birefringence towards equilibrium.
C. Birefringence relaxation
The degree of alignment within the system is evaluatedby the nematic order parameter S(t). Since trans isomershave much higher shape anisotropy than cis isomers,47 weevaluate the nematic order parameter only for the transisomers. We calculate the nematic order parameter as thepositive eigenvalue of the tensor order parameter
Tαβ(t) =
N−1t (t)
Nt(t)i=1
i∈{trans}
(2uiα(t)ui
β(t) − δαβ), (6)
where uiα(t) is the αth Cartesian coordinate of the unit vector
pointing along the central segment of the ith molecule in thetrans configuration at time t and ⟨. . .⟩ denotes non-equilibriumaveraging, for which we used at least 10 different runs. For aperfectly aligned system, S = 1. The monolayer birefringence∆n(t) is proportional to both the degree of molecular alignmentand the number of rod-like molecules.48 Therefore, to monitorbirefringence relaxation, we keep track of
Q(t) = ∆n(t)∆n(0) =
S(t)Nt(t)S(0)Nt(0) . (7)
The data points in Fig. 3 give a typical temporal relaxation ofQ(t) from our kinetic Monte Carlo scheme.
We now illustrate how we discriminate between threepossible functional forms of the relaxation dynamics ofQ(t). Recall that simple relaxation processes are expectedto show an exponential form φ(t) = e−t/τ (a Maxwell-Debyerelaxation), which is characterized by a well-defined timeτ that fully determines the kinetics of the system. In some
FIG. 3. Time evolution of Q(t) as defined in Eq. (7). Blue points are thekinetic Monte Carlo data. Fitting functions are shown as continuous lines.The horizontal blue line gives the equilibrium value Qeq of Q(t). The insetzooms in on the squared area with log scale on the horizontal axis and linearscale on the vertical axis. The simulation data correspond to a thermal erasureprocess with kBT = 4.5, ρ = 20, S(0)= 0.633, Nt(0)= N , and dt= 10−4.
systems, however,36 the relaxation significantly deviates froman exponential form and is described either by a stretchedexponential decay φ(t) = e−(t/τ)β with 0 < β < 1 or by anasymptotic power law as in Eq. (1).
The following procedure is used to discriminate betweenan exponential, a stretched-exponential, and an asymptoticpower-law relaxation of Q(t). For each choice of modelparameters, we run kinetic Monte Carlo simulations untilQ(t) has reached a clear steady-state value Qeq (illustratedas a horizontal line in Fig. 3). The equilibration time teq isthe first time for which Q(teq) = Qeq. Q(t) is then fitted byleast-square minimization over the range t ∈ [0, teq] with thethree functional forms given in Fig. 3.
For each fit curve a goodness-of-fit test49 is performed.The most reliable fit function is chosen as the one with thevalue of the reduced χ2 closest to 1. In the example givenin Fig. 3, we obtain χ2 = 9.65 for the exponential function,χ2 = 2.32 for the stretched-exponential, and χ2 = 0.54 for theasymptotic power law. The power law thus clearly providesthe best fit of the simulation data. The results of the fittingprocedure in different regions of parameter space and underdifferent initial conditions will be discussed in Secs. IV–V.
IV. RESULTS: PURE TRANS SYSTEM
In this section we present the results of the kineticMonte Carlo simulations for a system that only contains transmolecules.
First, we characterize the equilibrium properties of thesystem with temperature T and density ρ. Figure 4 showsthe equilibrium value of the nematic order parameter, Seq,determined after equilibration. The main plot refers tomolecules with hard-core interactions that cannot overlapat all. The steady-state value of the nematic order parametershows a steep increase with ρ. The inset in Fig. 4 instead plotsSeq versus kBT at ρ = 20. If the temperature is sufficientlyhigh, molecules can pass over their neighbors by creating
Reuse of AIP Publishing content is subject to the terms: https://publishing.aip.org/authors/rights-and-permissions. Downloaded to IP: 130.149.114.89 On: Tue, 15 Mar
2016 08:57:20

104703-5 Tavarone, Charbonneau, and Stark J. Chem. Phys. 144, 104703 (2016)
FIG. 4. Equilibrium value of the nematic order parameter Seq in a system oftrans molecules with finite size. Main plot: Seq versus ρ for hard needles thatare not allowed to overlap. Inset: Seq versus kBT for fixed ρ = 20. Lines areguides for the eye.
overlaps and thereby drastically reduce Seq. So, allowing themolecules to overlap results in an isotropic state at sufficientlyhigh temperatures even at high in-plane packing density.
We now characterize the relaxation dynamics of thebirefringence at different temperatures. We fix the initialdegree of the nematic order to S(0) = 0.6 (the samequalitative results are obtained using values from S(0) ≈ 0.5to S(0) ≈ 1.0) and follow the temporal evolution of S(t) whileit relaxes back to its equilibrium value Seq. First, we analyzethe rotational diffusion of the molecules, which results inthe decay of Q(t), by looking at the rotational mean squaredisplacement
⟨∆θ2(t)⟩ = 1N
Ni=1
(θi(t) − θi(0))2�, (8)
where θi(t) is the orientation angle of the ith moleculeat time t. In Fig. 5(a), we plot ⟨∆θ2(t)⟩ versus tMC fordifferent temperatures in a system with fixed density ρ = 20.In addition, Fig. 5(b) shows the logarithmic derivative ofthe rotational mean square displacement, which gives thelocal exponent ν in ⟨∆θ2(t)⟩ ∝ tν. Anomalous diffusion hasν , 1. Initially, the molecules diffuse with a diffusion constantDs that increases linearly with temperature, as expectedfrom the Einstein relation [see inset of Fig. 5(b)]. Whenthe needles start to overlap, a subdiffusive regime emergesand its extent increases with decreasing temperature [seeFig. 5(b)]. Ultimately, normal diffusion is recovered even insystems where nematic order is well developed (for instance,at kBT = 2.5 one finds Seq ≈ 0.6 in Fig. 4). In order to diffuse,molecules have to pass each other by creating overlaps. Atlow temperatures, crossing energy barriers makes rotationaldiffusion an activated process. Hence, the long-time diffusionconstant Dl is no longer linear in temperature [see inset ofFig. 5(b)].
Rotational diffusion causes initial nematic order to fullydecay for kBT ≥ 4. Figure 6(a) shows the relaxation ofQ(t) = S(t)/S(0) at fixed ρ = 20 and different kBT , whilein Figure 6(b) we keep temperature at kBT = 4.5 and varydensity ρ. In a high-temperature or low-density regime therelaxation is very well fitted by an exponential function[kBT ≥ 7.0 in Fig. 6(a) and ρ ≤ 14.0 in Fig. 6(b)], while in a
FIG. 5. Rotational dynamics in a system of trans molecules for differentkBT , at density ρ = 20, and with initial nematic order S(0)= 0.6. The leg-end in (a) applies to both graphs. (a) Rotational mean square displacement⟨∆θ2(t)⟩ versus time. (b) The logarithmic derivative of ⟨∆θ2(t)⟩ to extractthe local exponent ν in ⟨∆θ2(t)⟩∝ tν. The extent of the subdiffusive regime(ν < 1) increases with decreasing temperature. The inset shows the short-(blue circles) and long-time (red squares) diffusion constants as a functionof kBT .
high-density, low-temperature regime [kBT ≤ 5.0 in Fig. 6(a)and ρ ≥ 18.0 in Fig. 6(b)] the power-law decay defined inEq. (1) provides an excellent fit of the simulation data. Inthis regime both the exponential and stretched-exponentialfunctions give significant residual errors. Our Monte Carloresults are best fitted by a stretched exponential function withβ ≈ 0.8 in an intermediate regime [kBT = 5.5,6 in Fig. 6(a)and ρ = 16.0 in Fig. 6(b)]. To summarize, the interactionwith neighboring molecules, which is more relevant at lowtemperatures and high densities, causes a transition from anexponential decay of Q(t) to a power-law relaxation.
As anticipated in Sec. III, non-exponential relaxationoriginates from the presence of a wide distribution ofrelaxation times in the system. In the concept of dynamicheterogeneity,30,31 this distribution is traced back to spatial andtemporal variations in the local structure of the system, whichthen determines its dynamic evolution. Molecules diffusingslower or faster than the average become spatially correlated,giving rise to regions with slow and fast dynamics. Hence,averaging the dynamics over this heterogeneous environmentleads to an overall non-exponential relaxation. A typical
Reuse of AIP Publishing content is subject to the terms: https://publishing.aip.org/authors/rights-and-permissions. Downloaded to IP: 130.149.114.89 On: Tue, 15 Mar
2016 08:57:20

104703-6 Tavarone, Charbonneau, and Stark J. Chem. Phys. 144, 104703 (2016)
FIG. 6. Relaxation of the birefringence Q(t) in a system of trans moleculeswith initial nematic order S(0)= 0.6: (a) for different kBT at density ρ = 20,and (b) at different ρ for kBT = 4.5. Circles show the numerical results andthe continuous lines the best-fitting functions with blue for exponential, greenfor stretched-exponential, and red for power-law decay. The characteristictimes of the relaxation curves are indicated as diamonds. Horizontal dashedlines show the equilibrium value of Q(t) with matching colors.
quantity to monitor this dynamic heterogeneity is a four-pointcorrelation function, which we introduce here for the angulardisplacement following Ref. 30. We define the mobility ci(t),in order to quantify how mobile the molecule i is
ci(t) = exp[−∆θi(t)2] − 1N
Nj=1
exp[−∆θ j(t)2], (9)
where ∆θi(t)2 is defined as in Eq. (8). The variable ci(t)has zero mean and is positive (negative) if the ith moleculemoves less (more) than the average. The four-point correlationfunction is then
G4(r, t) =
i, jci(t)cj(t)δ(r − |r⃗i j |)i, jδ(r − |r⃗i j |) , (10)
where |r⃗i j | is the distance between molecule i and j and δis the Dirac delta function. The correlation function G4(r, t)measures the spatiotemporal correlations in the dynamics ofthe molecules over a distance r at time t. The presenceof correlated domains in space and the degree of dynamicheterogeneity is monitored by the dynamical four-point
susceptibility for the angular displacement,31,50
χ4(t) =
dr G4(r, t). (11)
It increases with increasing size of correlated domains.Figure 7(b) illustrates the heterogeneity in the rotational
mobility of the molecules by plotting the color-coded ci(t) inthe whole simulation box for kBT = 4.0 and ρ = 20. Extendeddomains of correlated molecular rotations are clearly visible.The inset in Figure 7(a) shows the corresponding four-pointcorrelation function G4(r, t) for kBT = 4.0 at tMC = 3.0 × 10⁴,where the correlations in time and space are largest comparedto other times. In order to monitor the complete temporalevolution of the dynamical heterogeneities, we present thesusceptibility χ4(t) in the main graph of Fig. 7(a) fordifferent temperatures and at density ρ = 20. The dynamicalsusceptibility shows a clear peak, which coincides with thetime window, during which the power-law relaxation of Q(t)is observed in Fig. 6(a). The color plot of Fig. 7(b) is obtainedat the maximum of χ4(t) at kBT = 4. The maximum increaseswith decreasing temperature and therefore demonstrates thatregions of correlated motion become more relevant at lowtemperatures.
FIG. 7. (a) Temporal evolution of the dynamical susceptibility χ4(t)for different kBT at ρ = 20 and with S(0)= 0.6. Inset: Four-pointcorrelation function G4(r, t) plotted versus r at different times forkBT = 4.0 and ρ = 20.0. The peak in χ4(t) indicates extended do-mains of correlated rotational motion. (b) The mobility ci(t) definedin Eq. (9) color-coded in the whole simulation box for kBT = 4.0,ρ = 20.0, and at time tMC= 3.0×10⁴, right at the maximum of χ4(t).
Reuse of AIP Publishing content is subject to the terms: https://publishing.aip.org/authors/rights-and-permissions. Downloaded to IP: 130.149.114.89 On: Tue, 15 Mar
2016 08:57:20

104703-7 Tavarone, Charbonneau, and Stark J. Chem. Phys. 144, 104703 (2016)
FIG. 8. (a) Square displacement of selected individual molecules plottedversus time for kBT = 4.0 and ρ = 20.0. The thick black line is the mean valueover all molecules. (b) Temporal evolution of the non-Gaussian parameterα2 of the probability distribution P(∆θ(t)) for different kBT at ρ = 20 andwith S(0)= 0.6. Values of α2, 0 indicate non-Gaussian tails in the distri-bution P(∆θ(t)) of rotational steps, i.e., an excessive number of moleculessignificantly faster or slower than the average. Inset: Example of P(∆θ(t)) attMC= 7.0×10³ and for kBT = 4.0. The red line shows a Gaussian distribution.
Spatio-temporal variations in the local environment ofthe pinned molecules are also responsible for the anomalousdiffusion, which we demonstrate in Fig. 5. In Fig. 8(a) we showindividual molecular trajectories for kBT = 4.0 and ρ = 20.0.One already senses that some molecules rotate significantlyfaster than the average (shown as a thick black line), whileall trajectories indicate that rotational diffusion proceeds bysudden jumps. This feature, together with the spatio-temporalcorrelations discussed before, is a common signature of glass-like dynamics.51–54 In particular, it has been suggested recentlythat a non-Gaussian distribution of molecular displacements isa universal feature of finite-dimensional glass-like dynamics.55
To investigate this point, we evaluated the non-Gaussianparameter α2 of the distribution of molecular displacementP(∆θ). In two dimensions it is calculated using the secondand fourth moment of P(∆θ),
α2(t) = ⟨∆θ4(t)⟩⟨∆θ2(t)⟩2 − 3, (12)
where for a Gaussian distribution one has α2 = 0. In Fig. 8(b),we show α2 for different temperatures kBT and at densityρ = 20. The distribution P(∆θ) becomes highly non-Gaussianas also demonstrated in the inset, which shows P(∆θ) forkBT = 4.0 and at the time, when α2(t) is maximal. Fastrotating molecules are responsible for the non-Gaussian tails
of the distribution. The peak in α2 increases and shifts tolater times upon cooling, which again coincides with thedeveloping non-exponential relaxation of the birefringence.Interestingly, the characteristic times in the relaxation lawsfor Q(t), shown as diamond markers in Fig. 8(a), agree nicelywith the locations of the maxima in α2(t).
V. RESULTS: RELAXATION WITH ISOMERIZATION
In this section we explore the relaxation of birefringenceQ(t) in a system, in which both trans and cis molecules arepresent. In particular, we investigate how the nearly isotropiccis molecules influence the relaxational dynamics of Q(t)under two different isomerization scenarios: thermal erasureand CP erasure.
The model has a rather rich parameter space and its fullexploration is beyond the scope of this paper. In the following,we fix the initial conditions to be close to the experimentalvalues and explore the relaxational dynamics of Q(t) fordifferent isomerization rates. We prepare the initial state withan equal number of trans and cis molecules, Nt(0) = Nc(0),and order parameter S(0) = 0.6; both values are close to theestimates carried out in Ref. 1. The cis molecules are randomlyoriented at t = 0 and do not contribute to S(t). In this sectionwe choose the time step dt = 10−5 to increase the temporalresolution, which results in an equilibration time of up to 9weeks on an Intel Xeon X5550 machine with a 2.66 GHzCPU. In order to compare the results of this section directlywith the results of Sec. IV, we still give the Monte-Carlo timetMC in units of dt = 10−4.
A. Thermal erasure
Here, we discuss the relaxation of the birefringence whenthe monolayer is not illuminated. Since the trans isomer isthe ground-state of the dMR, all the molecules in the cisconfiguration will isomerize back to the trans state after somecharacteristic time. As discussed in detail in Sec. III A, thecis to trans isomerization rate of isolated molecules is theisomerization probability Pth(c → t).
In view of the results discussed in Sec. IV, we expect therelaxation dynamics to be exponential in the high-temperatureand low-density regime, regardless of the isomerizationprobability. Therefore, we fix both temperature and densityto kBT = 4.0 and ρ = 20.0, respectively, where the pure transsystem shows a clear power-law decay of the birefringence,and monitor how this decay is influenced by the isomerizationrate.
Figure 9(b) shows the temporal evolution of the numberof trans isomers for different Pth(c → t). We expect anexponential relaxation and, indeed, the Monte Carlo data(circles) are well fitted with
Nt(t)N= 1 − Nc(0)
Ne−t/τc, (13)
where the fit parameter, the relaxation time τc, is proportionalto the inverse isomerization probability, τc = 1.54 P−1
th (c → t)[see inset of Fig. 9(b)]. We find τc > P−1
th (c → t) because ina crowded environment some of the attempted isomerization
Reuse of AIP Publishing content is subject to the terms: https://publishing.aip.org/authors/rights-and-permissions. Downloaded to IP: 130.149.114.89 On: Tue, 15 Mar
2016 08:57:20

104703-8 Tavarone, Charbonneau, and Stark J. Chem. Phys. 144, 104703 (2016)
FIG. 9. Relaxation towards equilibrium during thermal erasure in a system with ρ = 20.0 and kBT = 4.0. The legend in (c) applies to all graphs. (a) Temporalevolution of the nematic order parameter S(t)/S(0). The horizontal dashed line marks the equilibrium value to which all the curves have to converge. The insetshows the equilibrium value Seq as a function of the relative number of trans isomers, Nt/N . (b) Relative number of trans isomers, Nt/N , during thermalerasure. Fits of the simulation data with Eq. (13) are shown as solid lines with matching colors. The inset plots the isomerization time τc versus P−1
th (c→ t) (redsquares). The fitted blue line is τc= 1.54 P−1
th (c→ t). (c) Temporal relaxation of the birefringence Q(t). The horizontal dashed line marks the equilibrium valueof Q(t). The full lines are the best fits to an exponential (magenta), a stretched exponential (green), or a power law (red). Diamonds indicate the characteristictimes of the power law relaxation. The inset shows the dynamical susceptibility χ4(t) for trans molecules already present at t = 0. As a reference the blackcircles give χ4(t) for the pure trans system at the same ρ and kBT .
events are rejected as they generate more overlaps betweenthe molecules.
In Figs. 9(a) and 9(c) we show the respective temporalevolutions of the nematic order parameter S(t)/S(0) andthe birefringence Q(t) ∝ Nt(t)S(t), which originate from thealignment of the trans isomers. We also evaluate the dynamicalsusceptibility χ4(t) defined in Eq. (11), but only on thesubset of molecules that are in the trans configuration atthe beginning of the simulation at tMC = 0. The results areplotted in the inset of Fig. 9(c), where we also include thedynamical susceptibility for the pure trans system at ρ = 20at kBT = 4.0 (black circles) as a reference. This will allowus to quantify how the presence of the cis isomers influencesthe development of dynamic heterogeneities. The temporalrelaxation of both S(t) and Q(t) strongly depends on theisomerization rate. Analyzing Figs. 10(a)–10(c), we identifyfour different regimes:
(1) For sufficiently small relaxation rate [Pth(c → t) = 10−5
in Fig. 9], the birefringence Q(t) relaxes exponentially.On the time scale of the declining S, the number of cismolecules stays constant [compare plots (a) and (b)]. Theythus create a more uniform environment, as indicated bythe nearly vanishing dynamical susceptibility χ4, in whichS(t) and Q(t) relax exponentially and much faster than thepure trans system for the same temperature and densityin Sec. IV. Note that at late times Q(t) first falls belowits equilibrium value (dashed horizontal line) and thenincreases again. The reason is that the equilibrium valueof S depends on the number of trans molecules [inset ofFig. 9(a)] because the presence of the nearly isotropic cismolecules decreases Seq. Since Nt increases for tMC > 104,Q(t) also increases.
(2) For Pth(c → t) = 10−4 and 2.5 · 10−4 the best fittingfunction for the temporal evolution of Q(t) is providedby a stretched exponential with β ≈ 0.8 indicating thetransition to the power-law decay.
(3) At intermediate isomerization rates Pth(c → t)= 3.5 · 10−4 and 5.0 · 10−4 the power-law relaxationprovides the best fit of the simulation data. Here, theisomerization of the randomly oriented cis moleculesinto the trans state happens on the same time scaleas the relaxation of the nematic order parameter. Thus,Q(t) does not decay in the static disordered distributionof cis molecules but in a dynamic and heterogeneousenvironment, as demonstrated by the clear peak in χ4(t).As a result, the relaxation of Q(t) follows a power law. Itscharacteristic time τt does not change significantly, but theisomerization probability seems to control the power-lawexponent. We find η = 0.281 at Pth(c → t) = 3.5 · 10−4
and η = 0.225 at Pth(c → t) = 5.0 · 10−4.(4) The situation changes again if the isomerization rate
is very large [Pth(c → t) = 10−2 in Fig. 9]. All the cisisomers rapidly isomerize into trans molecules withrandom orientation and S(t) drops to S(0)/2. This iscompensated by the resulting increase in Nt(t), whichultimately generates a bump in Q(t) at tMC ≈ 102. Onceisomerization is completed at tMC ≈ 103, the system iscomposed of only trans molecules, the alignment ofwhich relaxes via rotational motion. This is the samesituation as discussed in Sec. IV. The environment isheterogeneous as indicated by the peak in the dynamicalsusceptibility, which is nearly as large as in the puretrans system of Sec. IV. Without the initial bump, Q(t) isfitted well by a power-law with a larger characteristictime and a larger power-law exponent η ≈ 0.5 as
Reuse of AIP Publishing content is subject to the terms: https://publishing.aip.org/authors/rights-and-permissions. Downloaded to IP: 130.149.114.89 On: Tue, 15 Mar
2016 08:57:20

104703-9 Tavarone, Charbonneau, and Stark J. Chem. Phys. 144, 104703 (2016)
FIG. 10. Relaxation of the birefringence Q(t) and of the relative number of trans isomers, Nt(t)/N , during CP erasure for different ratios R at fixedρ = 20 and kBT = 4. The trans-to-cis isomerization rate is PCP(t → c)= 5.0 ·10−1 in (a) and PCP(t → c)= 10−1 in (b). The cis-to-trans isomerization ratesare PCP(c→ t)= PCP(t → c)/R. The best-fitting functions for the relaxation of Q(t) are shown as solid lines, blue for the exponential, green for thestretched-exponential, and red for the power-law relaxation of Eq. (1). The diamond markers with matching colors indicate the characteristic times τt . Thefitted exponents are given in Table I. The horizontal dashed lines mark the steady-state value of Q(t) for different R with matching colors. The numerical resultsfor Nt(t)/N are fitted with Eq. (15) (solid lines).
compared to case (3) but similar to the pure transsystem.
Summarizing the results in Fig. 9, we find that cisisomers pinned at random positions not only accelerate thebirefringence relaxation compared to the pure trans system butalso prevent the development of the dynamical heterogeneitythat is responsible for a non-exponential decay. We attributethis behavior to the nearly isotropic shape of cis isomers,which, regardless of their orientations, create a similarenvironment for the existing trans isomers. In contrast, newlyformed trans isomers can adjust their orientations to theirneighbors and thereby allow for the formation of dynamicalheterogeneities. In the experiments of Ref. 35 the lifetime ofcis isomers during thermal erasure is estimated as 0.7 s, whilethe characteristic time of the power-law decay is measured asτth ≈ 2 s. These values are achievable by isomerization ratesbetween our cases (3) and (4).
B. CP erasure
Illumination of the SAM with CP light induces trans-cis isomerization cycles at a rate much faster than thespontaneous relaxation due to thermal erasure. Therefore,we neglect the thermally induced cis-to-trans transitionwhen modeling the CP erasure process. As discussed inSec. III A, in order to take into account the different lightabsorption of the two isomers, we introduce the two respectiveprobabilities, PCP(t → c) and PCP(c → t), for trans-to-cis andcis-to-trans isomerization. Since light is circularly polarized,
the isomerization probabilities do not depend on the molecularorientation.
In order to limit the computational cost, we do notexplore the full range of isomerization probabilities. Instead,we choose their values such that the characteristic timesof birefringence relaxation for thermal and CP erasurematch the experimental observations, where they differ byapproximately two decades in time (see the diamond markersin Fig. 1). Because illumination of the monolayer producesa very negligible amount of heat,1 we fix both density andtemperature at ρ = 20 and kBT = 4, exactly as during thermalerasure discussed in Sec. V A.
In Fig. 10 we show the relaxation of Q(t) and Nt(t)towards their steady-state values starting with Nt = 0.5 att = 0. In Fig. 10(a) we set PCP(t → c) = 5.0 · 10−1 while inFig. 10(b) PCP(t → c) = 10−1. The backward isomerizationrates, PCP(c → t), are chosen by the ratio R = PCP(t → c)/PCP(c → t), which also determines the number of isomersin steady state: R = Nc(t → ∞)/Nt(t → ∞), as discussed inSec. III A.
The implementation of our kinetic Monte-Carlo simu-lations suggests that the number of trans isomers evolvesaccording to the following kinetic equation:
d Nt(t)d t
= − 1τtc
Nt(t) + 1τct
Nc(t), (14)
where τct and τtc are characteristic relaxation times andNc(t) = N − Nt(t). It is solved by
Nt(t)/N = a + b exp(−t/τ), (15)
Reuse of AIP Publishing content is subject to the terms: https://publishing.aip.org/authors/rights-and-permissions. Downloaded to IP: 130.149.114.89 On: Tue, 15 Mar
2016 08:57:20
104703-10 Tavarone, Charbonneau, and Stark J. Chem. Phys. 144, 104703 (2016)
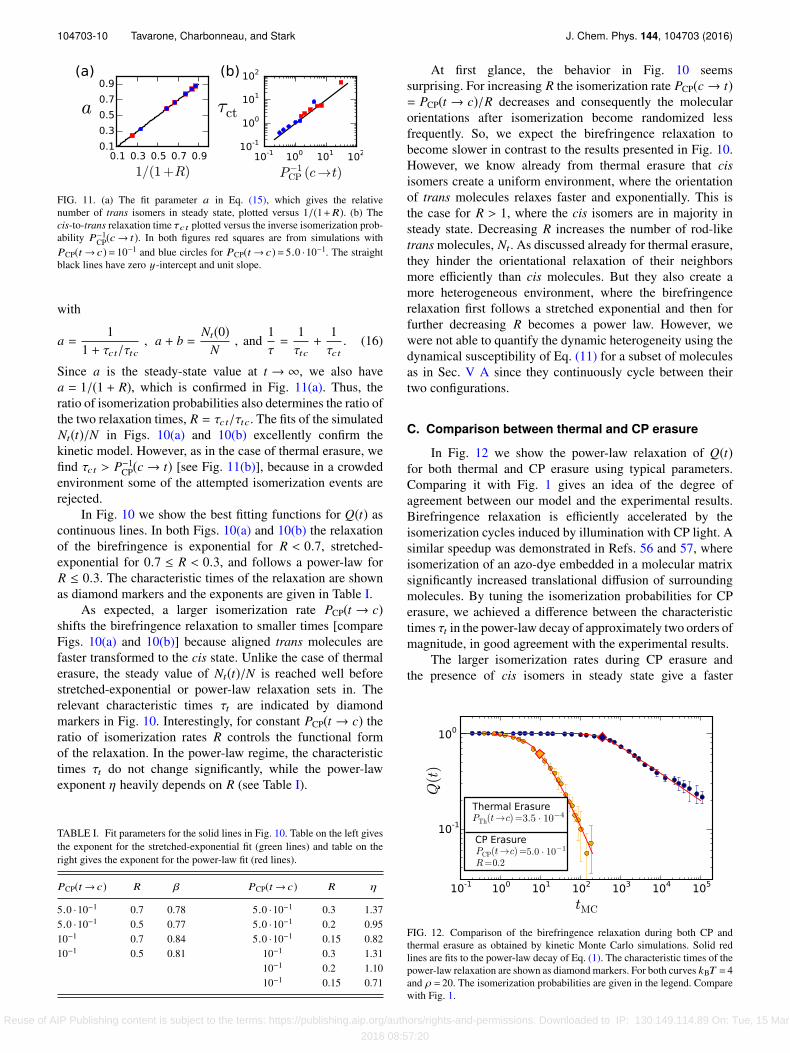
FIG. 11. (a) The fit parameter a in Eq. (15), which gives the relativenumber of trans isomers in steady state, plotted versus 1/(1+R). (b) Thecis-to-trans relaxation time τct plotted versus the inverse isomerization prob-ability P−1
CP(c→ t). In both figures red squares are from simulations withPCP(t → c)= 10−1 and blue circles for PCP(t → c)= 5.0 ·10−1. The straightblack lines have zero y-intercept and unit slope.
with
a =1
1 + τct/τtc, a + b =
Nt(0)N
, and1τ=
1τtc+
1τct
. (16)
Since a is the steady-state value at t → ∞, we also havea = 1/(1 + R), which is confirmed in Fig. 11(a). Thus, theratio of isomerization probabilities also determines the ratio ofthe two relaxation times, R = τct/τtc. The fits of the simulatedNt(t)/N in Figs. 10(a) and 10(b) excellently confirm thekinetic model. However, as in the case of thermal erasure, wefind τct > P−1
CP(c → t) [see Fig. 11(b)], because in a crowdedenvironment some of the attempted isomerization events arerejected.
In Fig. 10 we show the best fitting functions for Q(t) ascontinuous lines. In both Figs. 10(a) and 10(b) the relaxationof the birefringence is exponential for R < 0.7, stretched-exponential for 0.7 ≤ R < 0.3, and follows a power-law forR ≤ 0.3. The characteristic times of the relaxation are shownas diamond markers and the exponents are given in Table I.
As expected, a larger isomerization rate PCP(t → c)shifts the birefringence relaxation to smaller times [compareFigs. 10(a) and 10(b)] because aligned trans molecules arefaster transformed to the cis state. Unlike the case of thermalerasure, the steady value of Nt(t)/N is reached well beforestretched-exponential or power-law relaxation sets in. Therelevant characteristic times τt are indicated by diamondmarkers in Fig. 10. Interestingly, for constant PCP(t → c) theratio of isomerization rates R controls the functional formof the relaxation. In the power-law regime, the characteristictimes τt do not change significantly, while the power-lawexponent η heavily depends on R (see Table I).
TABLE I. Fit parameters for the solid lines in Fig. 10. Table on the left givesthe exponent for the stretched-exponential fit (green lines) and table on theright gives the exponent for the power-law fit (red lines).
PCP(t → c) R β PCP(t → c) R η
5.0 ·10−1 0.7 0.78 5.0 ·10−1 0.3 1.375.0 ·10−1 0.5 0.77 5.0 ·10−1 0.2 0.9510−1 0.7 0.84 5.0 ·10−1 0.15 0.8210−1 0.5 0.81 10−1 0.3 1.31
10−1 0.2 1.1010−1 0.15 0.71
At first glance, the behavior in Fig. 10 seemssurprising. For increasing R the isomerization rate PCP(c → t)= PCP(t → c)/R decreases and consequently the molecularorientations after isomerization become randomized lessfrequently. So, we expect the birefringence relaxation tobecome slower in contrast to the results presented in Fig. 10.However, we know already from thermal erasure that cisisomers create a uniform environment, where the orientationof trans molecules relaxes faster and exponentially. This isthe case for R > 1, where the cis isomers are in majority insteady state. Decreasing R increases the number of rod-liketrans molecules, Nt. As discussed already for thermal erasure,they hinder the orientational relaxation of their neighborsmore efficiently than cis molecules. But they also create amore heterogeneous environment, where the birefringencerelaxation first follows a stretched exponential and then forfurther decreasing R becomes a power law. However, wewere not able to quantify the dynamic heterogeneity using thedynamical susceptibility of Eq. (11) for a subset of moleculesas in Sec. V A since they continuously cycle between theirtwo configurations.
C. Comparison between thermal and CP erasure
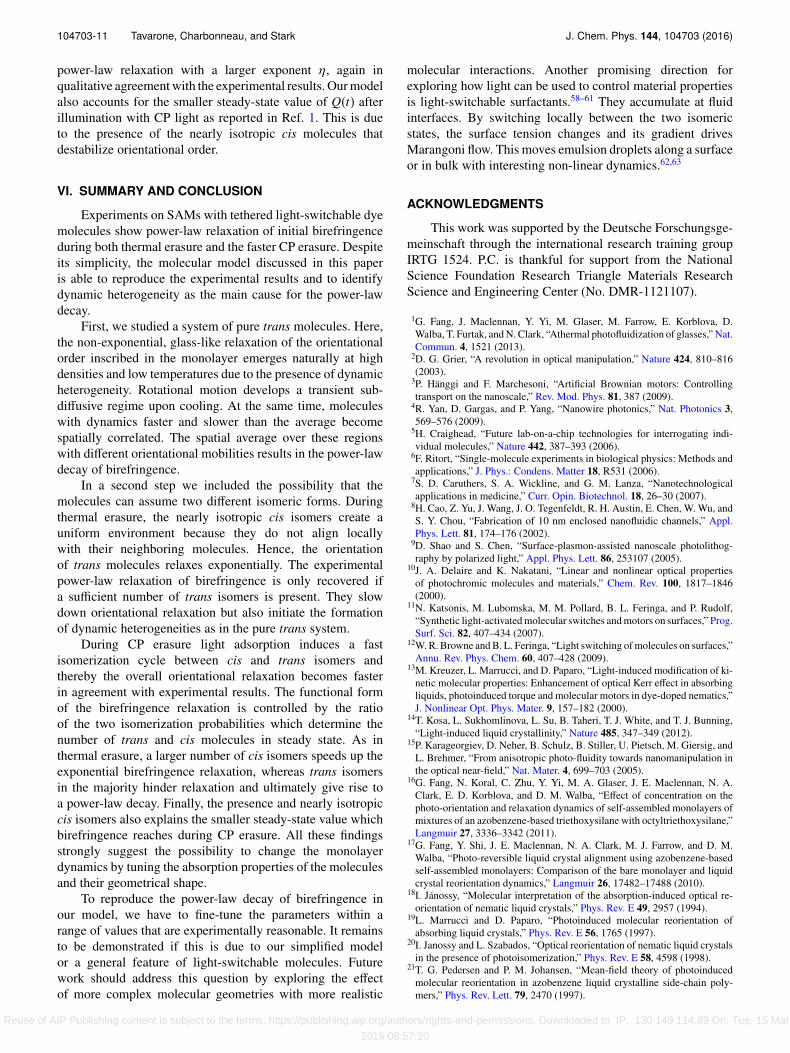
In Fig. 12 we show the power-law relaxation of Q(t)for both thermal and CP erasure using typical parameters.Comparing it with Fig. 1 gives an idea of the degree ofagreement between our model and the experimental results.Birefringence relaxation is efficiently accelerated by theisomerization cycles induced by illumination with CP light. Asimilar speedup was demonstrated in Refs. 56 and 57, whereisomerization of an azo-dye embedded in a molecular matrixsignificantly increased translational diffusion of surroundingmolecules. By tuning the isomerization probabilities for CPerasure, we achieved a difference between the characteristictimes τt in the power-law decay of approximately two orders ofmagnitude, in good agreement with the experimental results.
The larger isomerization rates during CP erasure andthe presence of cis isomers in steady state give a faster
FIG. 12. Comparison of the birefringence relaxation during both CP andthermal erasure as obtained by kinetic Monte Carlo simulations. Solid redlines are fits to the power-law decay of Eq. (1). The characteristic times of thepower-law relaxation are shown as diamond markers. For both curves kBT = 4and ρ = 20. The isomerization probabilities are given in the legend. Comparewith Fig. 1.
Reuse of AIP Publishing content is subject to the terms: https://publishing.aip.org/authors/rights-and-permissions. Downloaded to IP: 130.149.114.89 On: Tue, 15 Mar
2016 08:57:20
104703-11 Tavarone, Charbonneau, and Stark J. Chem. Phys. 144, 104703 (2016)
power-law relaxation with a larger exponent η, again inqualitative agreement with the experimental results. Our modelalso accounts for the smaller steady-state value of Q(t) afterillumination with CP light as reported in Ref. 1. This is dueto the presence of the nearly isotropic cis molecules thatdestabilize orientational order.
VI. SUMMARY AND CONCLUSION
Experiments on SAMs with tethered light-switchable dyemolecules show power-law relaxation of initial birefringenceduring both thermal erasure and the faster CP erasure. Despiteits simplicity, the molecular model discussed in this paperis able to reproduce the experimental results and to identifydynamic heterogeneity as the main cause for the power-lawdecay.
First, we studied a system of pure trans molecules. Here,the non-exponential, glass-like relaxation of the orientationalorder inscribed in the monolayer emerges naturally at highdensities and low temperatures due to the presence of dynamicheterogeneity. Rotational motion develops a transient sub-diffusive regime upon cooling. At the same time, moleculeswith dynamics faster and slower than the average becomespatially correlated. The spatial average over these regionswith different orientational mobilities results in the power-lawdecay of birefringence.
In a second step we included the possibility that themolecules can assume two different isomeric forms. Duringthermal erasure, the nearly isotropic cis isomers create auniform environment because they do not align locallywith their neighboring molecules. Hence, the orientationof trans molecules relaxes exponentially. The experimentalpower-law relaxation of birefringence is only recovered ifa sufficient number of trans isomers is present. They slowdown orientational relaxation but also initiate the formationof dynamic heterogeneities as in the pure trans system.
During CP erasure light adsorption induces a fastisomerization cycle between cis and trans isomers andthereby the overall orientational relaxation becomes fasterin agreement with experimental results. The functional formof the birefringence relaxation is controlled by the ratioof the two isomerization probabilities which determine thenumber of trans and cis molecules in steady state. As inthermal erasure, a larger number of cis isomers speeds up theexponential birefringence relaxation, whereas trans isomersin the majority hinder relaxation and ultimately give rise toa power-law decay. Finally, the presence and nearly isotropiccis isomers also explains the smaller steady-state value whichbirefringence reaches during CP erasure. All these findingsstrongly suggest the possibility to change the monolayerdynamics by tuning the absorption properties of the moleculesand their geometrical shape.
To reproduce the power-law decay of birefringence inour model, we have to fine-tune the parameters within arange of values that are experimentally reasonable. It remainsto be demonstrated if this is due to our simplified modelor a general feature of light-switchable molecules. Futurework should address this question by exploring the effectof more complex molecular geometries with more realistic
molecular interactions. Another promising direction forexploring how light can be used to control material propertiesis light-switchable surfactants.58–61 They accumulate at fluidinterfaces. By switching locally between the two isomericstates, the surface tension changes and its gradient drivesMarangoni flow. This moves emulsion droplets along a surfaceor in bulk with interesting non-linear dynamics.62,63
ACKNOWLEDGMENTS
This work was supported by the Deutsche Forschungsge-meinschaft through the international research training groupIRTG 1524. P.C. is thankful for support from the NationalScience Foundation Research Triangle Materials ResearchScience and Engineering Center (No. DMR-1121107).
1G. Fang, J. Maclennan, Y. Yi, M. Glaser, M. Farrow, E. Korblova, D.Walba, T. Furtak, and N. Clark, “Athermal photofluidization of glasses,” Nat.Commun. 4, 1521 (2013).
2D. G. Grier, “A revolution in optical manipulation,” Nature 424, 810–816(2003).
3P. Hänggi and F. Marchesoni, “Artificial Brownian motors: Controllingtransport on the nanoscale,” Rev. Mod. Phys. 81, 387 (2009).
4R. Yan, D. Gargas, and P. Yang, “Nanowire photonics,” Nat. Photonics 3,569–576 (2009).
5H. Craighead, “Future lab-on-a-chip technologies for interrogating indi-vidual molecules,” Nature 442, 387–393 (2006).
6F. Ritort, “Single-molecule experiments in biological physics: Methods andapplications,” J. Phys.: Condens. Matter 18, R531 (2006).
7S. D. Caruthers, S. A. Wickline, and G. M. Lanza, “Nanotechnologicalapplications in medicine,” Curr. Opin. Biotechnol. 18, 26–30 (2007).
8H. Cao, Z. Yu, J. Wang, J. O. Tegenfeldt, R. H. Austin, E. Chen, W. Wu, andS. Y. Chou, “Fabrication of 10 nm enclosed nanofluidic channels,” Appl.Phys. Lett. 81, 174–176 (2002).
9D. Shao and S. Chen, “Surface-plasmon-assisted nanoscale photolithog-raphy by polarized light,” Appl. Phys. Lett. 86, 253107 (2005).
10J. A. Delaire and K. Nakatani, “Linear and nonlinear optical propertiesof photochromic molecules and materials,” Chem. Rev. 100, 1817–1846(2000).
11N. Katsonis, M. Lubomska, M. M. Pollard, B. L. Feringa, and P. Rudolf,“Synthetic light-activated molecular switches and motors on surfaces,” Prog.Surf. Sci. 82, 407–434 (2007).
12W. R. Browne and B. L. Feringa, “Light switching of molecules on surfaces,”Annu. Rev. Phys. Chem. 60, 407–428 (2009).
13M. Kreuzer, L. Marrucci, and D. Paparo, “Light-induced modification of ki-netic molecular properties: Enhancement of optical Kerr effect in absorbingliquids, photoinduced torque and molecular motors in dye-doped nematics,”J. Nonlinear Opt. Phys. Mater. 9, 157–182 (2000).
14T. Kosa, L. Sukhomlinova, L. Su, B. Taheri, T. J. White, and T. J. Bunning,“Light-induced liquid crystallinity,” Nature 485, 347–349 (2012).
15P. Karageorgiev, D. Neher, B. Schulz, B. Stiller, U. Pietsch, M. Giersig, andL. Brehmer, “From anisotropic photo-fluidity towards nanomanipulation inthe optical near-field,” Nat. Mater. 4, 699–703 (2005).
16G. Fang, N. Koral, C. Zhu, Y. Yi, M. A. Glaser, J. E. Maclennan, N. A.Clark, E. D. Korblova, and D. M. Walba, “Effect of concentration on thephoto-orientation and relaxation dynamics of self-assembled monolayers ofmixtures of an azobenzene-based triethoxysilane with octyltriethoxysilane,”Langmuir 27, 3336–3342 (2011).
17G. Fang, Y. Shi, J. E. Maclennan, N. A. Clark, M. J. Farrow, and D. M.Walba, “Photo-reversible liquid crystal alignment using azobenzene-basedself-assembled monolayers: Comparison of the bare monolayer and liquidcrystal reorientation dynamics,” Langmuir 26, 17482–17488 (2010).
18I. Jánossy, “Molecular interpretation of the absorption-induced optical re-orientation of nematic liquid crystals,” Phys. Rev. E 49, 2957 (1994).
19L. Marrucci and D. Paparo, “Photoinduced molecular reorientation ofabsorbing liquid crystals,” Phys. Rev. E 56, 1765 (1997).
20I. Janossy and L. Szabados, “Optical reorientation of nematic liquid crystalsin the presence of photoisomerization,” Phys. Rev. E 58, 4598 (1998).
21T. G. Pedersen and P. M. Johansen, “Mean-field theory of photoinducedmolecular reorientation in azobenzene liquid crystalline side-chain poly-mers,” Phys. Rev. Lett. 79, 2470 (1997).
Reuse of AIP Publishing content is subject to the terms: https://publishing.aip.org/authors/rights-and-permissions. Downloaded to IP: 130.149.114.89 On: Tue, 15 Mar
2016 08:57:20

104703-12 Tavarone, Charbonneau, and Stark J. Chem. Phys. 144, 104703 (2016)
22V. Chigrinov, S. Pikin, A. Verevochnikov, V. Kozenkov, M. Khazimullin, J.Ho, D. D. Huang, and H.-S. Kwok, “Diffusion model of photoaligning inazo-dye layers,” Phys. Rev. E 69, 061713 (2004).
23Z. Sekkat, J. Wood, and W. Knoll, “Reorientation mechanism of azoben-zenes within the trans. fwdarw. cis photoisomerization,” J. Phys. Chem. 99,17226–17234 (1995).
24D. Statman and I. Janossy, “Study of photoisomerization of azo dyes in liquidcrystals,” J. Chem. Phys. 118, 3222–3232 (2003).
25A. Kiselev, “Kinetics of photoinduced anisotropy in azopolymers: Modelsand mechanisms,” J. Phys.: Condens. Matter 14, 13417 (2002).
26J. Chen, D. Johnson, P. J. Bos, X. Wang, and J. L. West, “Model of liquidcrystal alignment by exposure to linearly polarized ultraviolet light,” Phys.Rev. E 54, 1599 (1996).
27L. Marrucci, D. Paparo, P. Maddalena, E. Massera, E. Prudnikova, and E.Santamato, “Role of guest-host intermolecular forces in photoinduced re-orientation of dyed liquid crystals,” J. Chem. Phys. 107, 9783–9793 (1997).
28C. C. Battaile, “The kinetic Monte Carlo method: Foundation, implementa-tion, and application,” Comput. Methods Appl. Mech. Eng. 197, 3386–3398(2008).
29R. Tavarone, P. Charbonneau, and H. Stark, “Phase ordering of zig-zag andbow-shaped hard needles in two dimensions,” J. Chem. Phys. 143, 114505(2015).
30L. Berthier, “Dynamic heterogeneity in amorphous materials,” Physics 4, 42(2011).
31L. Berthier and G. Biroli, “Theoretical perspective on the glass transition andamorphous materials,” Rev. Mod. Phys. 83, 587 (2011).
32A. D. Kiselev, V. G. Chigrinov, and H.-S. Kwok, “Kinetics of photoinducedordering in azo-dye films: Two-state and diffusion models,” Phys. Rev. E 80,011706 (2009).
33Y. Yi, M. J. Farrow, E. Korblova, D. M. Walba, and T. E. Furtak, “High-sensitivity aminoazobenzene chemisorbed monolayers for photoalignmentof liquid crystals,” Langmuir 25, 997–1003 (2008).
34V. G. Chigrinov, V. M. Kozenkov, and H.-S. Kwok, Photoalignment of LiquidCrystalline Materials: Physics and Applications (John Wiley & Sons, 2008),Vol. 17.
35Y. Yi, G. Fang, J. E. Maclennan, N. A. Clark, J. Dahdah, T. E. Furtak,K. Kim, M. J. Farrow, E. Korblova, and D. M. Walba, “Dynamics of cisisomers in highly sensitive amino-azobenzene monolayers: The effect ofslow relaxation on photo-induced anisotropy,” J. Appl. Phys. 109, 103521(2011).
36M. F. Shlesinger, “Fractal time in condensed matter,” Annu. Rev. Phys.Chem. 39, 269–290 (1988).
37R. Metzler and J. Klafter, “From stretched exponential to inverse power-law:Fractional dynamics, Cole–Cole relaxation processes, and beyond,” J. Non-Cryst. Solids 305, 81–87 (2002).
38M. H. Vainstein, I. V. Costa, R. Morgado, and F. A. Oliveira, “Non-exponential relaxation for anomalous diffusion,” EPL 73, 726 (2006).
39R. Böhmer, K. Ngai, C. Angell, and D. Plazek, “Nonexponential relaxa-tions in strong and fragile glass formers,” J. Chem. Phys. 99, 4201–4209(1993).
40L. Brzozowski and E. H. Sargent, “Azobenzenes for photonic networkapplications: Third-order nonlinear optical properties,” J. Mater. Sci.: Mater.Electron. 12, 483–489 (2001).
41T. Cusati, G. Granucci, and M. Persico, “Photodynamics and time-resolvedfluorescence of azobenzene in solution: A mixed quantum-classical simula-tion,” J. Am. Chem. Soc. 133, 5109–5123 (2011).
42G. Tiberio, L. Muccioli, R. Berardi, and C. Zannoni, “How does thetrans–cis photoisomerization of azobenzene take place in organic solvents?,”ChemPhysChem 11, 1018–1028 (2010).
43A. Patti and A. Cuetos, “Brownian dynamics and dynamic Monte Carlosimulations of isotropic and liquid crystal phases of anisotropic colloidalparticles: A comparative study,” Phys. Rev. E 86, 011403 (2012).
44E. Sanz and D. Marenduzzo, “Dynamic Monte Carlo versus Browniandynamics: A comparison for self-diffusion and crystallization in colloidalfluids,” J. Chem. Phys. 132, 194102 (2010).
45H. Löwen, “Brownian dynamics of hard spherocylinders,” Phys. Rev. E 50,1232 (1994).
46P. Kählitz, M. Schoen, and H. Stark, “Clustering and mobility of hard rods ina quasicrystalline substrate potential,” J. Chem. Phys. 137, 224705 (2012).
47T. G. Pedersen, P. Ramanujam, P. M. Johansen, and S. Hvilsted, “Quantumtheory and experimental studies of absorption spectra and photoisomeriza-tion of azobenzene polymers,” J. Opt. Soc. Am. B 15, 2721–2730 (1998).
48S. Elston and R. Sambles, The Optics of Thermotropic Liquid Crystals(Taylor & Francis, London, 1998).
49P. R. Bevington and D. K. Robinson, Data Reduction and Error Analysis forthe Physical Sciences (McGraw–Hill, New York, 2003).
50S. Franz and G. Parisi, “On non-linear susceptibility in supercooled liquids,”J. Phys.: Condens. Matter 12, 6335 (2000).
51T. Kawasaki and H. Tanaka, “Structural signature of slow dynamics and dy-namic heterogeneity in two-dimensional colloidal liquids: Glassy structuralorder,” J. Phys.: Condens. Matter 23, 194121 (2011).
52Z. Zheng, F. Wang, and Y. Han, “Glass transitions in quasi-two-dimensionalsuspensions of colloidal ellipsoids,” Phys. Rev. Lett. 107, 065702 (2011).
53M. Hurley and P. Harrowell, “Kinetic structure of a two-dimensional liquid,”Phys. Rev. E 52, 1694 (1995).
54V. Teboul, J.-B. Accary, and M. Chrysos, “Isomerization of azobenzene andthe enhancement of dynamic heterogeneities in molecular glass formers,”Phys. Rev. E 87, 032309 (2013).
55P. Chaudhuri, L. Berthier, and W. Kob, “Universal nature of particle displace-ments close to glass and jamming transitions,” Phys. Rev. Lett. 99, 060604(2007).
56V. Teboul, M. Saiddine, J.-M. Nunzi, and J.-B. Accary, “An isomerization-induced cage-breaking process in a molecular glass former below Tg,”J. Chem. Phys. 134, 114517 (2011).
57V. Teboul, M. Saiddine, and J.-M. Nunzi, “Isomerization-induced dynamicheterogeneity in a glass former below and above Tg,” Phys. Rev. Lett. 103,265701 (2009).
58O. Karthaus, M. Shimomura, M. Hioki, R. Tahara, and H. Nakamura,“Reversible photomorphism in surface monolayers,” J. Am. Chem. Soc. 118,9174–9175 (1996).
59J. Y. Shin and N. L. Abbott, “Using light to control dynamic surface tensionsof aqueous solutions of water soluble surfactants,” Langmuir 15, 4404–4410(1999).
60K. Ichimura, S.-K. Oh, and M. Nakagawa, “Light-driven motion of liquidson a photoresponsive surface,” Science 288, 1624–1626 (2000).
61J. Eastoe and A. Vesperinas, “Self-assembly of light-sensitive surfactants,”Soft Matter 1, 338–347 (2005).
62A. Diguet, R.-M. Guillermic, N. Magome, A. Saint-Jalmes, Y. Chen, K.Yoshikawa, and D. Baigl, “Photomanipulation of a droplet by the chromo-capillary effect,” Angew. Chem., Int. Ed. 121, 9445–9448 (2009).
63M. Schmitt and H. Stark, “Marangoni flow at droplet interfaces: Three-dimensional solution and applications,” Phys. Fluids 28, 012106 (2016).
Reuse of AIP Publishing content is subject to the terms: https://publishing.aip.org/authors/rights-and-permissions. Downloaded to IP: 130.149.114.89 On: Tue, 15 Mar
2016 08:57:20