kinetics and thermodynamics of bezaktiv yellow he-4g on ... · kinetics and thermodynamics of...
TRANSCRIPT

Kinetics and thermodynamics of Bezaktiv Yellow HE-4G on mixture of date pits and olive stone from
aqueous solution
H. Babaci, H. Aksas, K. Louhab*
Laboratoire de technologie alimentaire -Facultyof engineer science, University of Boumerdes - 35000, Algieria
*E-mail address: [email protected]
ABSTRACT
In this paper, the adsorption of an anions dye Bezaktiv Yellow HE-4G onto mixture biosorbent,
olive stones and date pits was investigated in aqueous solution. The effect of operational parameter
such as initial dye concentration, time contact, temperature and pH was evaluated. The pseudo first-
order and the pseudo second-order were used to describe the kinetics data. The data were evaluated for
compliance with Freundlich and Langmuir models. Biosorptions data were successfully described by
Freundlich isotherm model and the pseudo second-order model. Thermodynamic parameters indicated
that the biosorption of BY HE-4G onto biosorbent mixture was spontaneous and endothermic in
nature. The results indicated that the mixture of date pits and olive stone could be used as an adsorbent
for textile waste water treatment without high cost.
Keywords: anions dye; sorption; kinetics; olive stone; date pit
1. INTRODUCTION
There has been an increase for effluent being disposed to natural water bodies due to
rapid industrialization. Major contaminants found in waste water include biodegradable,
volatile and recalcitrant organic compounds, toxic metals, suspended solids, plant nutrients,
dyes, microbial pathogens and parasites [1].
Colored dye waste water arises as a direct result of the production of the dye and also as
a consequence of its use in textile and other industries [2]. The dye waste water from textile
mills represents a serious pollution problem because of its high both color and organic content
affecting the aquatic flora and fauna [3].
Synthetics dyes used in textile industry are eventually released into effluents that get its
way to the environments; about 2% of dye synthesized are released directly in aqueous
effluents and consequently produce a sizeable amount of colored waste water [1].
Azo dyes are synthetic organic compounds widely used in textile dyeing, paper printing
and other industrial processes such as the manufacture of pharmaceutical drugs, toys and
foods including candies. This chemical class of dyes, which is characterized by the presence
of at least one azo bond (N=N) bearing aromatic rings, dominates the worldwide market
International Letters of Chemistry, Physics and Astronomy Online: 2015-01-20ISSN: 2299-3843, Vol. 45, pp 1-15doi:10.18052/www.scipress.com/ILCPA.45.12015 SciPress Ltd, Switzerland
SciPress applies the CC-BY 4.0 license to works we publish: https://creativecommons.org/licenses/by/4.0/

of dyes tuffs with a share of about 70% [4].Reactive azo dyes released from textile dyeing
plants are highly recalcitrant to conventional waste water treatment processes.
The most widely used methods for removing dyes from waste water systems include
physicochemical, chemical and biological methods, such as flocculation, coagulation,
precipitation, adsorption, membrane filtration, electrochemical techniques, ozonation and
fungal decolorisation.
However, waste waters containing various dyes are very difficult to treat using
conventional waste water treatment methods, since the dyes are generally stable under the
influence of light and oxidizing agents [5].
Of the numerous techniques mentioned, adsorption in particular is an effective process
for the removal of dyes from waste effluents: it is low-cost, highly efficient, simple, easy to
perform and insensitive to toxic substances [6]. Biosorption is usually fast method and make
use of cheaper materials; for instance waste biomass from agriculture and industry being
plenteous in nature, economical and require minute processing.
Biosorption is a finishing technology and it reduces the concentration of dyes in bulky
volumes of wastewaters to very small levels [6].
This research paper illustrates the use of different mixture of date pits waste and olive
stone waste in their native form for the removal of reactive textile dye (Bezaktiv yellow HE -
4G). The factors studied are initial dye concentration, pH, temperature, and contact time. The
isotherm, kinetic and thermodynamics of dye adsorption were studied.
2. MATERIALS AND METHODS
2.1. Dye characterization
Dye used in this study is Bezaktiv yellow HE- 4G obtained from firm Bezema Suisse. It
is a monochlorotriazoique, the maximum adsorption wavelength of this dye is 360nm.
2.2. Adsorbents
Preparation of sorbent: date pits were obtained from southern of Algeria and olive
stones from northern of Algeria were used as starting material. The olive stones first washed
with water to remove the adhering dirt and then it were input in hexane for 24 hours to
eliminate residual oil, and then were washed with distilled water and then were dried. Date
pits were washed and dried. The dried olive stones and date pits were then crushed, milled
and sieved into different particle sizes. Studies were focused on a size fraction of 0.4 to 0.8
mm. the olive stone waste with date pits waste are mixed at different percentage. In this study,
we used five samples such that their composition is given in table 1.
2 ILCPA Volume 45

Table 1. Percentage of olive stone and date pits in different mixture.
Sample number Percent of olive stone Percent of date pits
1
2
3
4
5
6
7
100
0
88
85
80
66
60
0
100
12
15
20
34
40
2.3. Adsorption studies
The dye stock solution was prepared by dissolving accurately 1g amounts of dye into
1000 ml of distilled water and the experimental solutions were obtained by diluting the stock
solution to the required concentrations. Adsorption experiments were performed at different
dye concentrations (100,200,300,400,500,600 and 700mg/l) using 0.2g adsorbent mixture and
15 ml of dye solution in a conical flask. The conical was then shaken at a constant speed of
350rpm at pH 5.6 at 20C°. The initial pH value was adjusted to 3, 5, 8 and 10with 0.1 M HCl
or 1.0M NaOH. The effect of temperature on sorption was studied using four different
temperatures 20, 30, 40 and 50C°.At the end of experiments biosorbent dye mixtures were
centrifuged at 5000 rpm for 3min and the supernatants were analyzed spectrophotometrically
at 360nm to determine the residual concentration of reactive dye.
The amount of dye sorbet by weight of dry mixture wastes was calculated by the
relationship:
Qt=(Ci –Ct)× (1)
Where Ci and Ct (mg.L¯) are initial dye and at time t dye solution concentration
respectively, v (L) is the solution volume and m (g) is the dry weight of the sorbent.
3. RESULTS AND DISCUSSION
3.1. Effect of contact time
From an economical point of view, the contact time required to reach equilibrium is an
important parameter in wastewater treatment [7].
The amount of Bezaktiv yellow HE -4G onto mixture adsorbent is given as a function of
time (1 to 30min) in fig 1. The adsorption of dye is rapid in the initial stages of contact time
and gradually decreased with lapse of time until equilibrium. The optimal removal efficiency
was reached within about 15 min. There was no significant change in equilibrium
concentration after 15 min. The rapid adsorption at the initial contact time can be explained
by the availability of the positively charged surface of the sorbent mixture that led to fast
electrostatic attraction of the anionic Bezaktiv yellow HE-4G from the solution.
It is clear from the figure that the reaction of adsorption nearly reached equilibrium within
30min.
International Letters of Chemistry, Physics and Astronomy Vol. 45 3

Fig. 1. Effect of contact time on sorption kinetics of BY HE-4G adsorption by mixture
sorbent(C00.1g/l, pH 5.6, t° 20°,m adsorbent 0.2g, 350rpm).
3.2. Effect of initial dye concentration
The initial dye concentration provides an important driving force to overcome all mass
transfer resistances of dyes between the aqueous and solid phases [8]. The kinetics of
adsorption of Bezaktiv yellow HE-4G onto different mixture biosorbent at different initial
concentrations was achieved. Figure2 shows the extent of dye adsorption as function of
reaction time. The experiment were done at different dye concentrations
(100,300,500,700,900and 1000mg/L). It was found that, when the initial concentration
increases, the amount of dye adsorbed per gram amount of adsorbent increase, the results are
shown in figure 2. The value of q increase from 7.425 to 37.056mg/g when increasing of the
initial dye concentration dye from 0.1to 0.5mg/l. Then it can be attributed that the active sites
on adsorbent for dye removal decreases when dye concentration increases. The kinetics
adsorption curves are smooth and continuous leading to saturation of biosorbent mixtures by
BY HE-4G. This result suggests the possibility of –layer coverage adsorption of RY HE-4G
on biosorbent mixtures [9]. This phenomena is illustrated in figure3.
Fig. 2. Effect of dye concentration on amount of dye removal by biosorbent on sample 6 (p H 5.6,T
20C°, 350rpm).
4 ILCPA Volume 45

Fig. 3. Adsorption isotherm.
3.3. Effect of pH
The wastewater from textile industries usually has a wide range of pH values. This pH
of the system plays an important role in the textile wastes treatment [10]. The effect of
solution pH on Bezaktiv yellow HE-4G adsorption by adsorbent mixture was studied at the
pH ranges of 2 to 10 and the results are given in figure 4. This figure indicates that an increase
in the initial pH has a negative effect on the removal capacity of biosorbent. Lower adsorption
of Bezaktiv Yellow HE-4G (anionic dye) at alkaline pH is probably due to the presence of
excess of OH¯ ions competing with the dye anions for the adsorption sites. Therefore
maximum biosorption capacity has found to be average 74mg/g in the rage of 2 to 6. At the
acidic pH, the number of positively charged sites increase, which favors the adsorption of the
anions due to electrostatic attraction.
Fig. 4. Effect of pH on the adsorption of Bezaktiv yellow HE-4G on mixture biosorbent.
(C0 1g/l,T 20 c°).
International Letters of Chemistry, Physics and Astronomy Vol. 45 5

3.4. Effect of temperature
The temperature has two major effects on the adsorption process. Increasing the
temperature is known to increase the rate of diffusion of the adsorbed molecules across the
external boundary layer and the internal pores of the adsorbent particles owing to the decrease
in the viscosity of the solution [9]. The removal of the BY HE-4G increase from 73.84 to 74.9
mg/g by increasing the temperature of the solution from 20 to 50 c°, indicating that the
process to be endothermic. The results are shown in figure 5.
Fig. 5. Effect of temperature on the removal of adsorption of BY HE-4G.(C0 1g/l, pH 5.6)
3.5. Adsorption kinetic studies
The kinetic investigation is performed to determine the effiency of dye adsorption onto
adsorbent. The several kinetic models are usec to examine the biosorption mechanism such as
mass transfer and chemical reaction. One of them is Lagergren’s pseudo-first-order model and
it assumes that the occupation rate of biosorption sites is proportional to the number of
unoccupied sites [11, 12]. A linear form of pseudo-first-order model (equation 2) is:
–qt)=lnqe-k1.t (2)
Where qe and qt are the amount of biosorbed BY HE-4G on biosorbent mixture at
equilibrium and at time t (mg g¯) respectively. k₁ is the pseudo-first-order rate constant
(min¯). The value of K1and qe .were calculated from slope and intercept, respectively, of the
plot of ln(qe-qt) .
6 ILCPA Volume 45

Fig. 6. Plot of pseudo-first order kinetic model BY HE-4G adsorption onto mixture biosorbent.
(C0 =1000mg/g).
The pseudo-second –order kinetic equation13
is expressed as:
(3)
Where k₂ is the rate constant of pseudo-second-order kinetic model (g.mg⁻.min⁻). Values of
k₂ and q₂ were calculated from a plot of t/qt against t. figure 7 .All the results are listed in
table 2.
Table 2. Kinetic parameters for dye adsorption at 1000 mg/L dye concentration.
Samples qexp
mg/g
Pseudo- first -order Pseudo -second -.order
qecal
mg/g K1 R
2
qecal
mg/g K2 R
2
1
2
3
4
5
6
7
73.84
73.86
73.88
73.83
73.83
73.86
73.83
4.137
4.95
5.10
4.90
4.72
4.06
4.49
0.652
0.730
0.648
0.644
0.567
0.730
0.660
0.452
0.520
0.535
0.525
0.484
0.471
0.478
76.92
76.92
76.92
76.92
76.92
76.92
76.92
0.169
0.0845
0.169
0.169
0.169
0.169
0.0845
0.999
0.999
1
1
1
0.999
0.999
According to high R2 values (R
2=1) in table 2, the pseudo-second-order kinetic model
showed satisfactory fits. The qe values estimated from the pseudo-second-order-kinetic model
were also good agreement with the experimental values. These finding indicated that the
pseudo-second order kinetic model is more suitable to describe the BY HE-4G biosorption
into biosorbent mixture.
International Letters of Chemistry, Physics and Astronomy Vol. 45 7
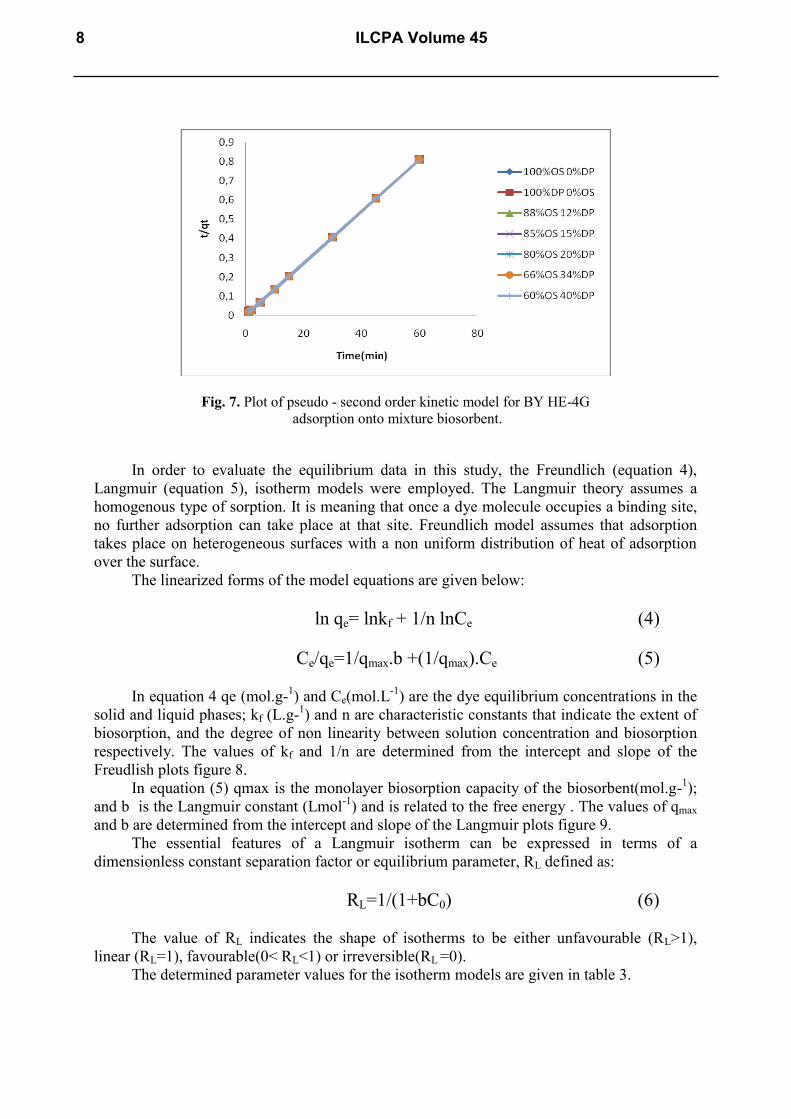
Fig. 7. Plot of pseudo - second order kinetic model for BY HE-4G
adsorption onto mixture biosorbent.
In order to evaluate the equilibrium data in this study, the Freundlich (equation 4),
Langmuir (equation 5), isotherm models were employed. The Langmuir theory assumes a
homogenous type of sorption. It is meaning that once a dye molecule occupies a binding site,
no further adsorption can take place at that site. Freundlich model assumes that adsorption
takes place on heterogeneous surfaces with a non uniform distribution of heat of adsorption
over the surface.
The linearized forms of the model equations are given below:
ln qe= lnkf + 1/n lnCe (4)
Ce/qe=1/qmax.b +(1/qmax).Ce (5)
In equation 4 qe (mol.g-1) and Ce(mol.L
-1) are the dye equilibrium concentrations in the
solid and liquid phases; kf (L.g-1) and n are characteristic constants that indicate the extent of
biosorption, and the degree of non linearity between solution concentration and biosorption
respectively. The values of kf and 1/n are determined from the intercept and slope of the
Freudlish plots figure 8.
In equation (5) qmax is the monolayer biosorption capacity of the biosorbent(mol.g-1);
and b is the Langmuir constant (Lmol-1
) and is related to the free energy . The values of qmax
and b are determined from the intercept and slope of the Langmuir plots figure 9.
The essential features of a Langmuir isotherm can be expressed in terms of a
dimensionless constant separation factor or equilibrium parameter, RL defined as:
RL=1/(1+bC0) (6)
The value of RL indicates the shape of isotherms to be either unfavourable (RL>1),
linear (RL=1), favourable(0< RL<1) or irreversible(RL =0).
The determined parameter values for the isotherm models are given in table 3.
8 ILCPA Volume 45

The results indicated that isotherm data of BY HE-4G followed Freundlich isotherm
models. The value of RL for the adsorption of BY HE-4G greater than zero and less than unity
showing favorable sorption of BY HE-4G onto the mixture of biosorbent.
Table 3. Equilibrium constants for adsorption into mixture biosorbent.
Samples
qexp mg/g
Langmuir constants Freundlich constants
qmax mg/g b R2 RL n Kf R
2F
1
2
3
4
5
6
7
73.83
73.83
73.88
73.88
73.90
73.84
73.86
333.33
333.33
250
200
250
250
250
0.018
0.018
0.026
0.037
0.027
0.027
0.027
0.676
0.646
0.745
0.732
0.720
0.709
0.672
0.052
0.052
0.037
0.026
0.035
0.035
0.035
0.873
0.881
1.156
0.910
1.18
0.857
1.204
0.112
0.118
6.91
0.124
7.24
0.100
7.644
0.993
0.994
0.993
0.978
0.994
0.993
0.985
Fig. 8. Freundlich isotherm plot for the biosorption of BY HE-4G onto biosorbent mixture.
Fig. 9. Langmuir isotherm plot for the biosorption of BY HE-4G onto biosorbent mixture.
International Letters of Chemistry, Physics and Astronomy Vol. 45 9

Intra particule diffusion model
The possibility of intraparicule diffusion resistance affecting adsorption was explored
by using the intraparticule diffusion model.
qt = kint.t1/2
+xi (7)
Where qt ,kint and xi are amount of dye adsorbent (mg/g) at time t (min). The results are shown
in table 4. and fig. 10.
Fig. 10. Intra particule diffusion model (c0 1000mg/l,T° 20C°, sample 1).
Table 4. Results of intra particule diffusion model.
Samples Time (min) Kint (mg/g.min1/2
) Xi (mg/g) R2
1
1 à1.5 6.909 49.26 1
2 à 60 0.004 73.80 0.733
2
1 à 1.5 15.59 38.44 1
2 à 60 0.004 73.90 0.656
3
1 à 1.5 7.818 49.98 1
2 à 60 0.004 73.80 0.656
4
1 à 1.5 3.681 54.78 1
2 à 60 0.007 73.83 0.723
5
1 à 1.5 6.045 52.42 1
2 à 60 0.009 73.83 0.643
6
1 à 1.5 23 29.63 1
2 à 60 0.002 73.82 0.699
7
1 à 1.5 18.27 36.06 1
2 à 60 0.005 73.82 0.699
10 ILCPA Volume 45

Dubinin-Radushkevich(D_R) isotherm
The D-R isotherm model does not assume a homogenous surface or constant sorption
potential [14]. It was applied to estimate the porosity apparent free energy and the
characteristic of adsorption and it has commonly been applied in the following form eq (8)
and its linear form can be shown in eq (9).
qe = Qm exp(-kε2) (8)
lnqe = lnQm- kε2 (9)
Where k is a constant related to the adsorption energy, Qm the theoretical saturation capacity,
and ε is the Polanyi potential that can be calculated from eq(10).
ε = RTln (1+1/Ce) (10)
The plot of ln qe versus ε2 of the experimental data for the adsorption of BY HE -4G
onto the mixture of bioadsorbent is shown onto fig .11, the slope gives K [mol2.(kj
2)-1
] and the
intercept yields the adsorption capacity, Qm(mg g-1
).the mean free energy of adsorption (E)
,defiened as the free energy change when one mole of ion is transferred from infinity in
solution to the surface of the sorbent. E was calculated from the k value using the following
relation eq (11).
E = 1/√2k (11)
The calculated D-R constants for the adsorption of BY HE-4G onto mixture of
biosorbent are shown in fig 11 and table 5.
Fig. 11. D-R isotherm model for the adsorption of BY HE-4G onto biosorbent mixture.
International Letters of Chemistry, Physics and Astronomy Vol. 45 11

Table 5. D-R constants for the adsorption of BY HE-4G onto mixture of biosorbent.
Samples Qm mg/g K(mol
2kj
2)
.10-3
E Kj/mol R2
1 73.92 6.7 0.115 0.792
2 73.84 13.4 0.163 0.788
3 73.99 6.7 0.115 0.842
4 73.92 13.4 0.163 0.841
5 73.92 6.7 0.115 0.850
6 73.92 13.4 0.163 0.905
7 73.62 6.7 0.115 0.988
The maximum adsorption capacity Qm obtained using D-R isotherm model is similar as
experimental values .the value of E calculated (E<8KJ/mol) indicating that physisorption play
a significant role in the adsorption process of BY HE-4G onto biosorbent mixture.
3.6. Thermodynamic parameters
The thermodynamic data reflect the feasibility and spontaneous nature of adsorption
process. The parameters such as free energy change (ΔG⁻), enthalpy change (ΔH⁻) and
entropy change(ΔS) can be estimated by equilibrium constants changing with temperature.
They were evaluated using the following equations and can be calculated from a plot ln kl
against 1/T . The results were shown in figure (12)and table (6).
ΔG = -RTlnKL (12)
ln KL = -ΔG/RT = -ΔH/RT + ΔS/R (13)
Where KL is the Langmuir isotherm constant, R is the universal gas constant (8.314
j.mol⁻.K⁻) and T is temperature (K).
The positive value of ΔS suggests increase randomness at solid/ solution interface
occurs in the internal structure of the adsorption of the BY HE-4G onto biosorbent mixture.
The negative value of ΔG suggests that the adsorption of BY HE-4G onto biosorbent mixture
is a spontaneous process. The positive value of ΔH shows the adsorption is an endothermic
process.
12 ILCPA Volume 45

Table 6. Value of the thermodynamic of adsorption at various temperatures (C0=1000 mg/L).
samples 1/T° ( ) Lin K Δ G ΔH ΔS
60%OS
40%DP
0,0034 1,56 -4.745
62.352 229.10-3
0,762 0,0033 1,67 -7.035
0,0032 2,06 -9.325
0,0031 4,028 -11.615
66%OS
34%DP
0,0034 1,58 -4.8108
46.640 175,6.10-3
0,776 0,0033 1,704 -6.5668
0,0032 1,984 -8.135
0,0031 3,43 -9.885
85%OS
15%DP
0,0034 1,6 -4.51
39.44 150,7.10-3
0,835 0,0033 1,67 -6.01
0,0032 2,07 -7.51
0,0031 3,11 -9.01
80%OS
20%DP
0,0034 1.58 -2.791
50.535 182.10-3
0.762 0,0033 1.63 -4.611
0,0032 1.975 -6.431
0,0031 3.491 -8.251
88%OS
12%DP
0.0034 1.61 -2.984
50.635 183.10-3
0.789 0.0033 1.68 -4.814
0.0032 2.07 -6.644
0.0031 3.51 -8.474
100%DP
0%OS
0.0034 1,55 -4.687
47.760 179.10-3
0.820 0.0033 1,63 -6.477
0.0032 2,08 -8.267
0.0031 3,39 -10.057
100%OS
0%DP
0,0034 1,554 -2.688
47.708 172,9.10-3
0,825 0,0033 1,66 -4.408
0,0032 2,07 -6.409
0,0031 3,33 -7.848
Fig. 10. The plot of ln KL versus 1/T for the estimation of thermodynamic parameters.
International Letters of Chemistry, Physics and Astronomy Vol. 45 13

4. CONCLUSION
In this investigation, the mixture biosorbent (date pits and olive stones)as a low-cost
natural adsorbent was studied for adsorptive removal of BY HE-4G from aqueous solution in
batch mode. The results of adsorption showed that mixture biosorbent can be effectively used
as a biosorbent for the removal of anionic dye. Adsorption of BY HE-4G was favored by a
decrease in pH.
The kinetics studies of dyes on biosorbent mixtures followed the pseudo-second- order
at different mixture biosorbent. The equilibrium data have been analyzed, the results showed
that the BY HE-4G followed Freudlich isotherm. The thermodynamic studies indicated that
the adsorption was spontaneous and endothermic.
All these results indicated that the biosorbent mixture could be used as an adsorbent for textile
wastewater treatment and it may be an alternative to more costly adsorbent.
References
[1] A.Gurses, C. Dogar, M.Yalcin, M.Acikyildiz, R.Bayrak, S.Karaca. The adsorption
kinetics of cations dye, methylene blue, onto clay, J. Hazard. Mater. B131 (2006) 217-
228.
[2] T. Robinson, G. McMullan, R. Marchant, P. Nigam, Removal of dyes from a
synthetictextile dye effluent by biosorption on apple pomace and wheat straw. Water Res.
36(2002) 2824-2830.
[3] M. P.Elizalde-Gonzalez, V. Hernandez-Montoya. Removal of acid orange 7 by guava
seed carbon: A four parameter optimization study. J. Hazard. Mater. 168 (2009) 515-
522.
[4] Soares GMB, Amorim MTP, Hrdina R, M.Costa-Ferreira. Studies on the
biotransformation of novel diazo dyes by laccase. Process Biochem. 581(2002) 7-37.
[5] A. Gucek, S.Sener, S.Bilgen, M.A. Mazmanci, adsorption and kinetic studies of cationic
and anionic dyes on pyrophyllite from aqueous solutions, J. Colloid Interface
Sci.286(2005) 53-60.
[6] S. Karthikeyan, R. Balasubramanian, C.S.P. Lyer. Evaluation of the marine algae Ulva
fasciata and Sargassum sp.for the biosorption of Cu(II) from aqueous solutions.
Bioresour. Technol. 98(2007) 452-455.
[7] T.Robinson,B.Chandron and P.Nigam,Removal of dyes from a synthetic textile dye
effluent by biosorption on apple pomace and wheat straw.Water Res.,36(2002)2824-
2830.
[8] Zeynep Eren,Filiz Nuran Acar ; Adsorption of Reactive Black 5 from an aqueous
solution :equilibrium and kinetic studies. Desalination 194(2006) 1-10.
[9] N.Barka; S.Qourzal ;A.Assabbane;A.Nounah;Y.Ait-Ichou. Removal of Reactive Yellow
84 from aqueous solutions by adsorption onto hydroxyapatite. Journal of Saudi Chemical
Society.(2010)
14 ILCPA Volume 45

[10] Y.Safa, H.Nawaz Bhatti. Adsorptive removal of direct textile dyes by low cost
agricultural waste: Application of factorial design analysis. Chemical Engineering
Journal 167(2011)35-41.
[11] T.Akar,I.Tosun,Z.kaynak,E.Ozkara,O.Yeni.An Attractive Agro-industial by – product in
environmental cleanup: Dye biosorption ootential of untreated olive pomace. J.of Hazard.
Mater. 166(2009) 1217-1225.
[12] N.ERTUGAY, Y.K. Bayhan. Biosorption of Cr (VI) from aqueous solutions by biomass
of Agaricus bisporus ,J.Hazard.Mater. 154(2008) 432-439.
[13] T. Akar, I.Tosun, Z.Kaynak, E.Kavas, G.Incirkus, S.T.Akar. assessment of the
biosorption characteristics of a macro-fungus for the decolorization of Acid Red
44(AR44) dye ,J.Hazard.Mater. 17152009° 865-871.
[14] A.Khled,A.ElNemr, A.El Sikaily, O.Abdelwahab. Treatment of artificial textile dye
effluent containing Direct Yellow 12 by orange peel carbon. Desalination 238(2009)
210-232.
( Received 15 December 2014; accepted 28 December 2014 )
International Letters of Chemistry, Physics and Astronomy Vol. 45 15