kinetics and thermodynamics of multistep nucleation and self-assembly in nanosize materials...
TRANSCRIPT
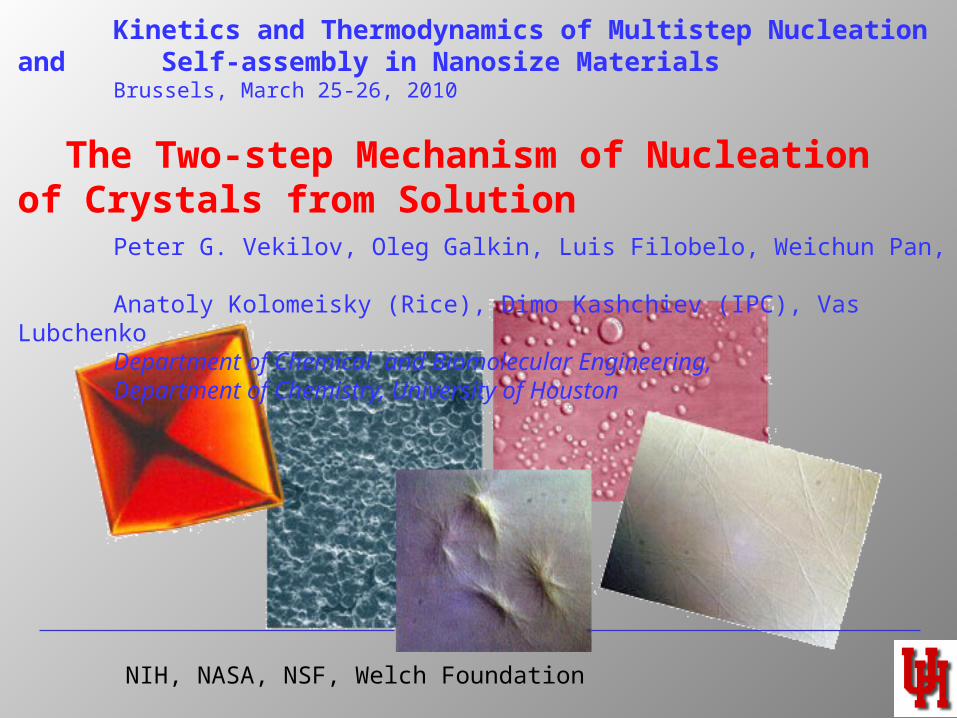
Kinetics and Thermodynamics of Multistep Nucleation and Self-assembly in Nanosize Materials
Brussels, March 25-26, 2010
The Two-step Mechanism of Nucleation of Crystals from Solution
Peter G. Vekilov, Oleg Galkin, Luis Filobelo, Weichun Pan, Anatoly Kolomeisky (Rice), Dimo Kashchiev (IPC), Vas Lubchenko Department of Chemical and Biomolecular Engineering,Department of Chemistry, University of Houston
NIH, NASA, NSF, Welch Foundation
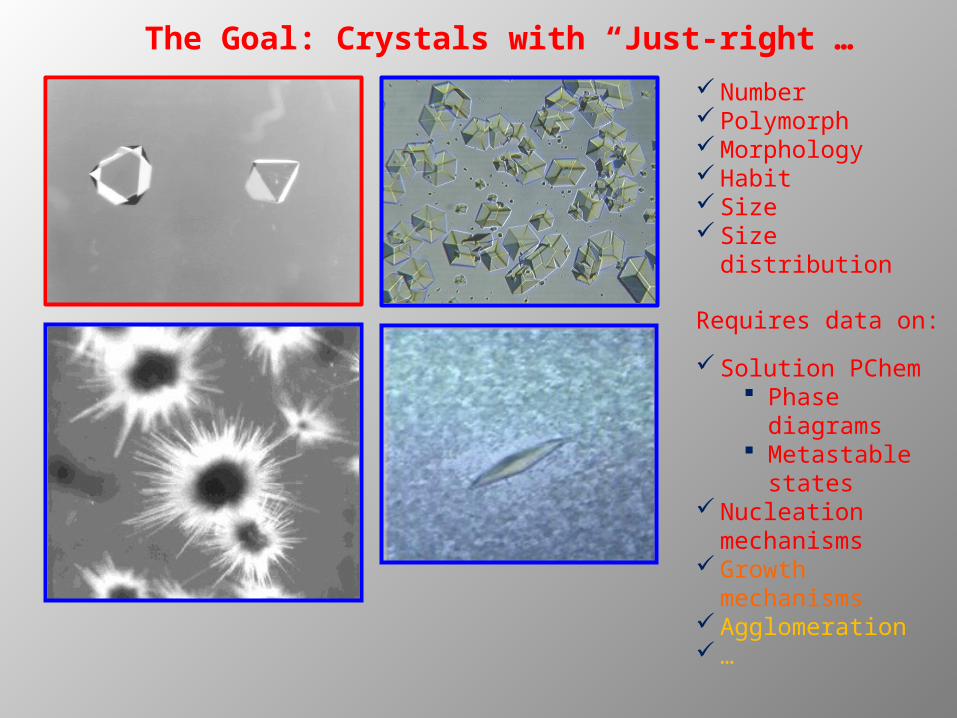
The Goal: Crystals with “Just-right”…
Number PolymorphMorphologyHabitSizeSize distribution
Requires data on:
Solution PChem Phase
diagrams Metastable
statesNucleation
mechanismsGrowth
mechanismsAgglomeration…
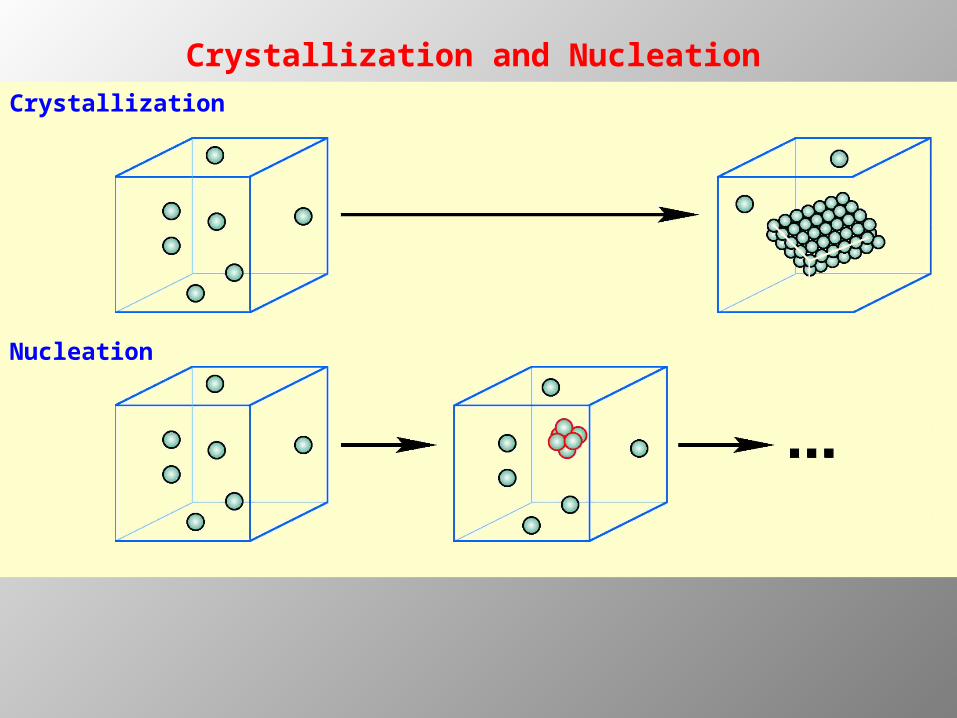
Crystallization
Nucleation
Crystallization and Nucleation

Crystallization
Nucleation
Crystallization and Nucleation

Crystallization as Sequential Transition along Two Order Parameters
Concentration
Str
uct
ure
…
Classical viewpoint: direct nucleation along a “diagonal line” envisioned;
Protein Concentration
Tem
per
atu
re
Solubility
Gelation
Binodal
Spinodal
Two-step mechanism: suggested by t W & F, T & O for critical point for L-L phase separation for proteins
Everywhere else in phase diagram—classical crystal nucleation predicted P.R. ten Wolde, D. Frenkel,Science 277 (1997) 1975
V. Talanquer, D.W. Oxtoby, J. Chem. Phys. 109 (1998) 223
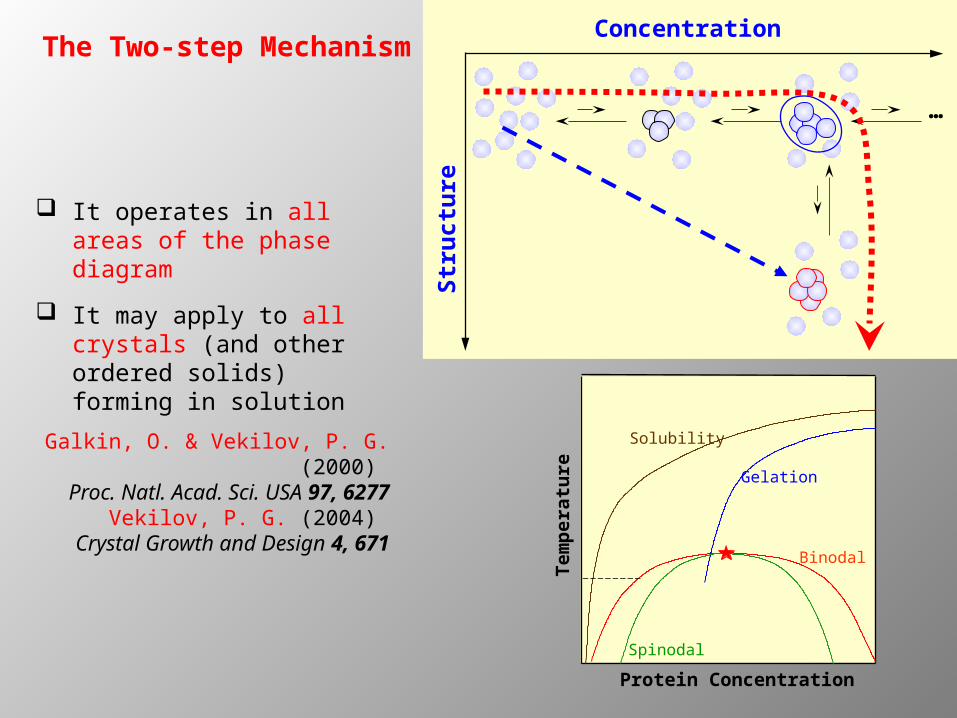
The Two-step MechanismConcentration
Str
uct
ure
…
It operates in all areas of the phase diagram
It may apply to all crystals (and other ordered solids) forming in solution
Protein Concentration
Tem
per
atu
re
Solubility
Gelation
Binodal
Spinodal
Galkin, O. & Vekilov, P. G. (2000) Proc. Natl. Acad. Sci. USA 97, 6277
Vekilov, P. G. (2004) Crystal Growth and Design 4, 671
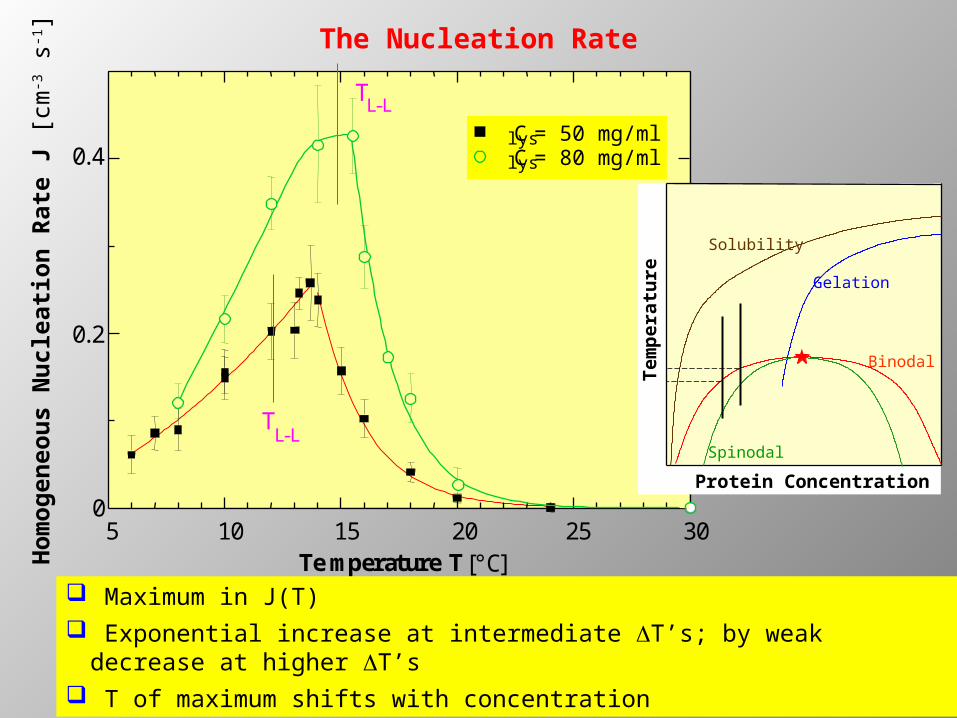
5 10 15 20 25 300
0.2
0.4
TL-L
TL-L
Clys = 50 mg/ml Clys = 80 mg/ml
Temperature T [°C]Hom
og
en
eou
s N
ucle
ati
on
Rate
J [
cm-3 s
-1]
The Nucleation Rate
Maximum in J(T) Exponential increase at intermediate DT’s; by weak decrease at
higher DT’s T of maximum shifts with concentration
Protein Concentration
Tem
per
atu
re
Solubility
Gelation
Binodal
Spinodal

Two steps:Which One is Rate Determining
Critical level of ordering
Critical size of ordered nucleus
Concentration
Str
uct
ure
…
*2G
*2G
*1G
*1G
s
olut
ion
de
nse
liqui
d
cr
ysta
ls
DGL-L
DGL-L
Fre
e E
ner
gy
G
Nucleation Reaction Coordinate
Rate of cluster formationJ1 ~ J01exp(– /kBT)
Rate of nucleation within clustersJ2 ~ J02exp(– / kBT)
Is > ?
Is J01 more important than ?
Is J02 more important than ?
*1G
*2G
*1G *
2G
*1G
*2G
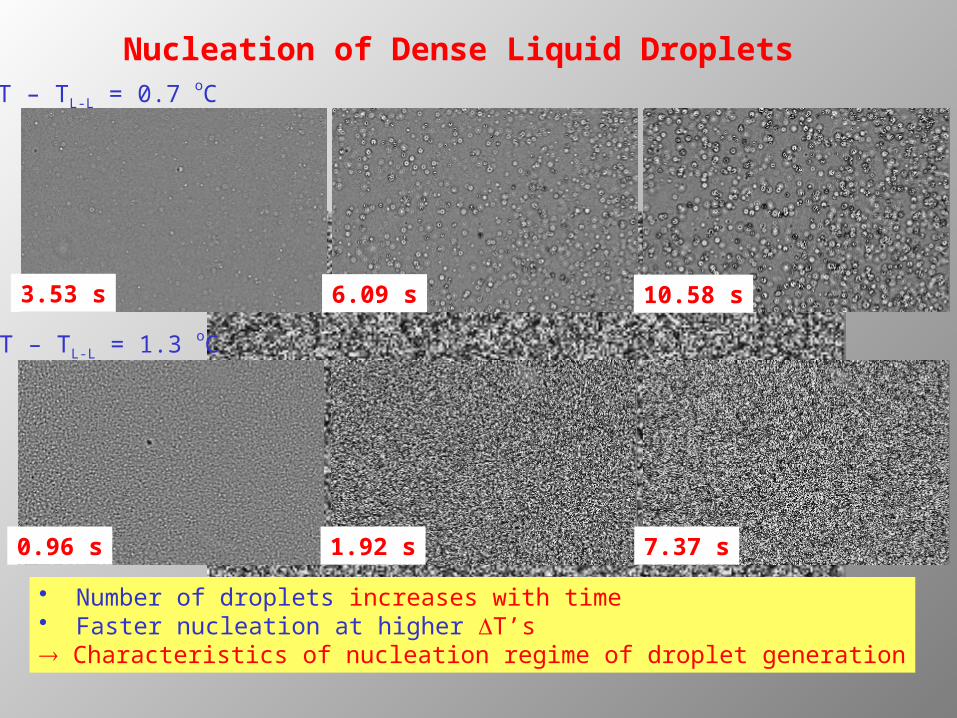
Nucleation of Dense Liquid Droplets
3.53 s 10.58 s6.09 s
0.96 s 1.92 s 7.37 s
T – TL-L = 0.7 oC
T – TL-L = 1.3 oC
• Number of droplets increases with time• Faster nucleation at higher DT’s Characteristics of nucleation regime of droplet generation
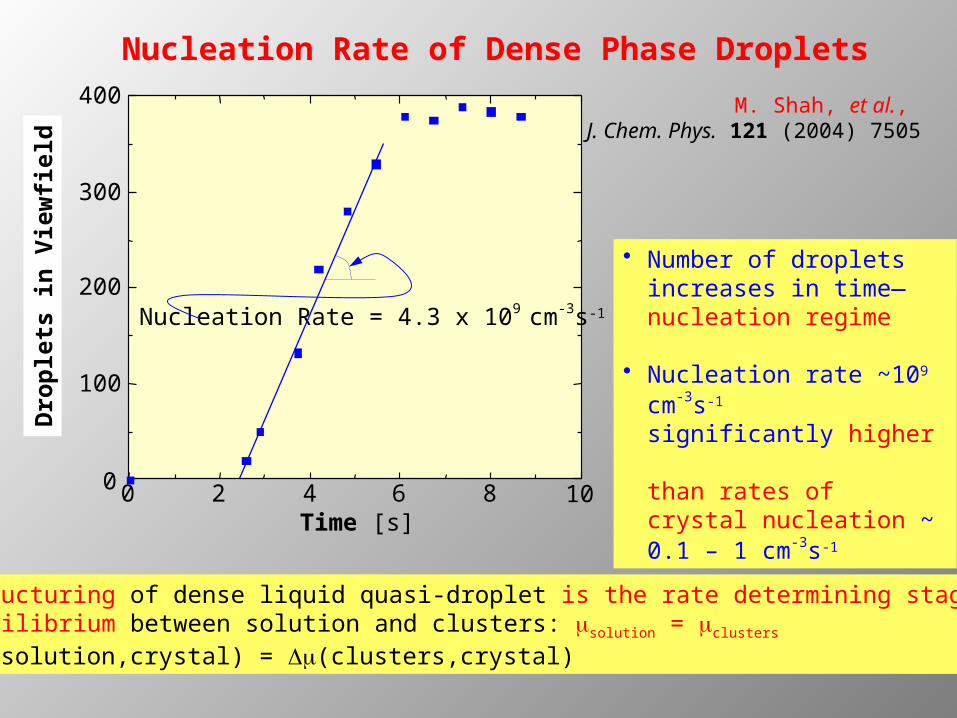
Nucleation Rate of Dense Phase Droplets
Time [s]
Dro
ple
ts in
Vie
wfi
eld
0 2 4 6 8 100
100
200
300
400
Nucleation Rate = 4.3 x 109 cm-3s-1
• Number of droplets increases in time—nucleation regime
• Nucleation rate ~109 cm-
3s-1
significantly higher than rates of crystal nucleation ~ 0.1 – 1 cm-
3s-1
M. Shah, et al., J. Chem. Phys. 121 (2004) 7505
Structuring of dense liquid quasi-droplet is the rate determining stage Equilibrium between solution and clusters: msolution = mclusters Dm(solution,crystal) = Dm(clusters,crystal)
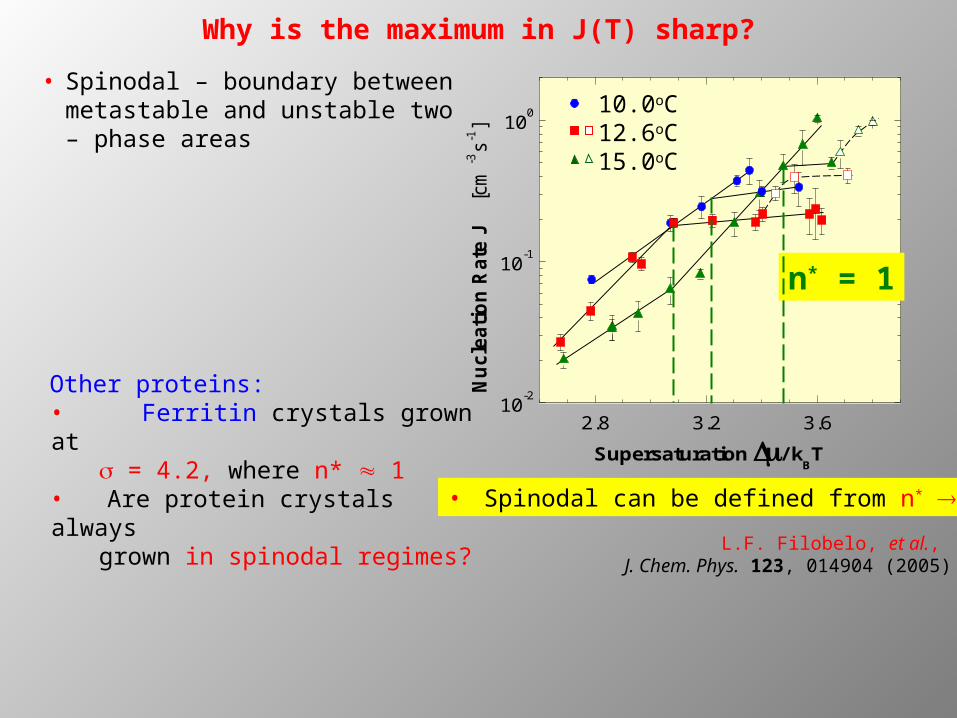
10.0oC12.6oC15.0oC
2.8 3.2 3.610-2
10-1
100
Nuc
leat
ion
Rat
e J
[cm
-3s-1
]Supersaturation / k
BT
n* = 1
• Spinodal can be defined from n* 1
• Spinodal – boundary between metastable and unstable two – phase areas
Other proteins: • Ferritin crystals grown at
s = 4.2, where n* 1 • Are protein crystals always
grown in spinodal regimes?
L.F. Filobelo, et al., J. Chem. Phys. 123, 014904 (2005)
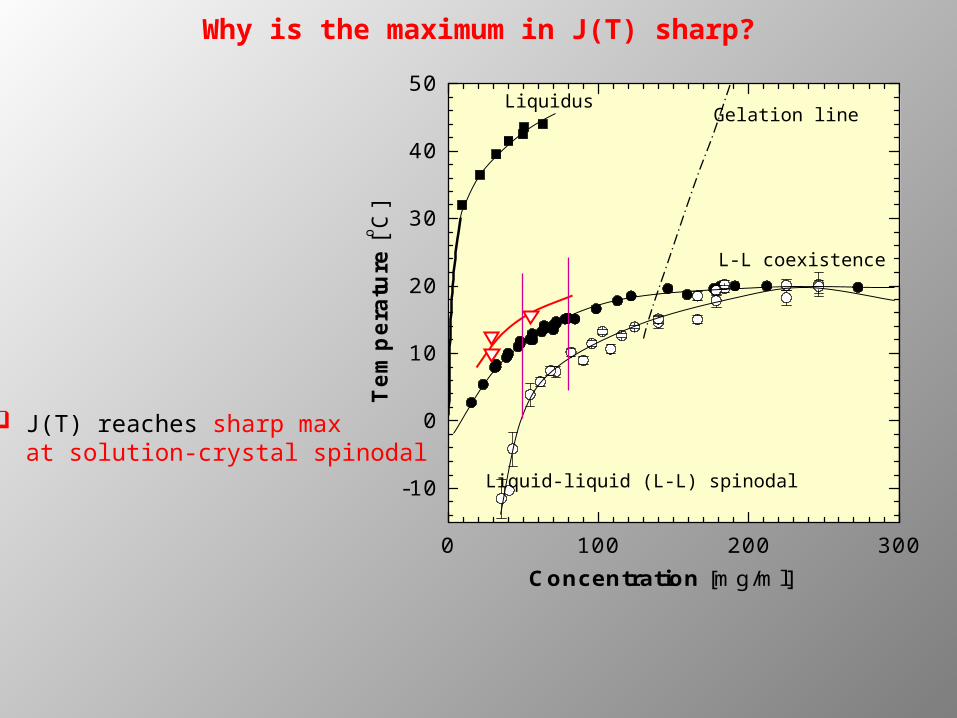
Why is the maximum in J(T) sharp?

20 mm
0 100 200 300
-10
0
10
20
30
40
50
Tem
per
atu
re [o C
]
Concentration [mg/ml]
Liquidus or solubility of crystals
L-L spinodal
L-L coexistenceSolution-crystalspinodal
Gelation line
Pre-exponential Factors and Barriers for Structuring
D.N. Petsev, et al., J. Phys. Chem. B 107 (2003) 3921
L.F. Filobelo, et al., J. Chem. Phys. 123 (2005) 014904
Why is the maximum in J(T) sharp?
0 100 200 300
-10
0
10
20
30
40
50
Tem
per
atu
re [o C
]
Concentration [mg/ml]
Liquidus
Liquid-liquid (L-L) spinodal
L-L coexistence
Gelation line
J(T) reaches sharp max at solution-crystal spinodal
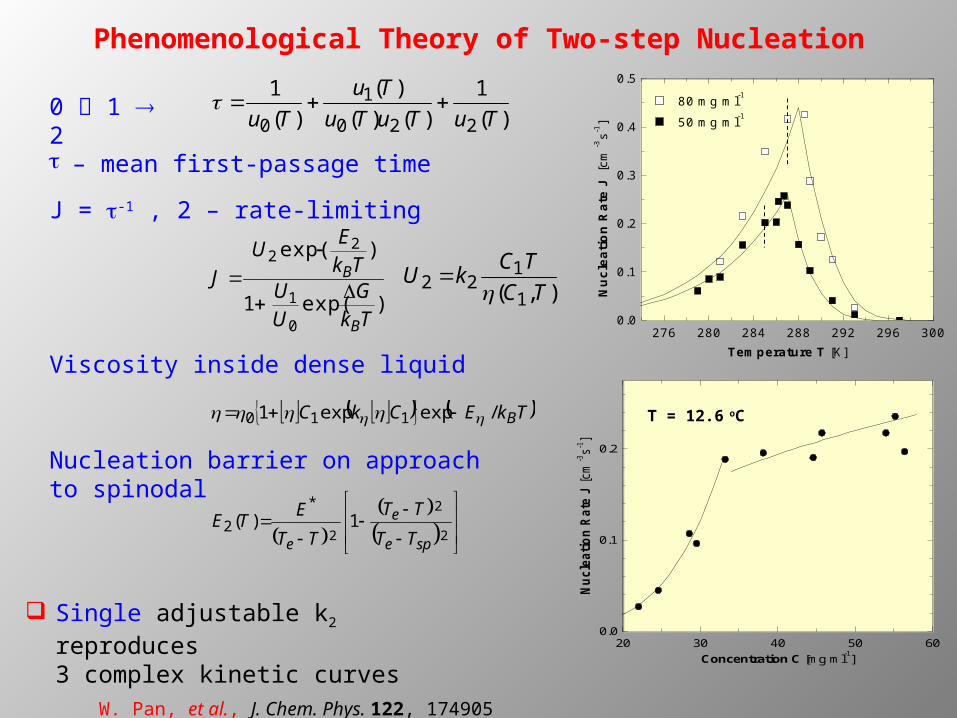
Phenomenological Theory of Two-step Nucleation
0 1 2
t – mean first-passage time
J = t-1 , 2 – rate-limiting
)(
1
)()(
)(
)(
1
220
1
0 TuTuTu
Tu
Tu
)exp(1
)exp(
0
1
22
TkG
UU
TkE
U
J
B
B
),( 1
122 TC
TCkU
TkECkC B/expexp1 110
2
2
21)(
*
2spe
e
e TT
TT
TT
ETE
276 280 284 288 292 296 3000.0
0.1
0.2
0.3
0.4
0.5
Nu
clea
tio
n R
ate
J [c
m-3s-1
]
Temperature T [K]
80 mg ml-1
50 mg ml-1
20 30 40 50 600.0
0.1
0.2
Nu
clea
tio
n R
ate
J [c
m-3s-1
]
Concentration C [mg ml-1]
Single adjustable k2 reproduces 3 complex kinetic curves
W. Pan, et al., J. Chem. Phys. 122, 174905 (2005)
T = 12.6 oC
Nucleation barrier on approach to spinodal
Viscosity inside dense liquid
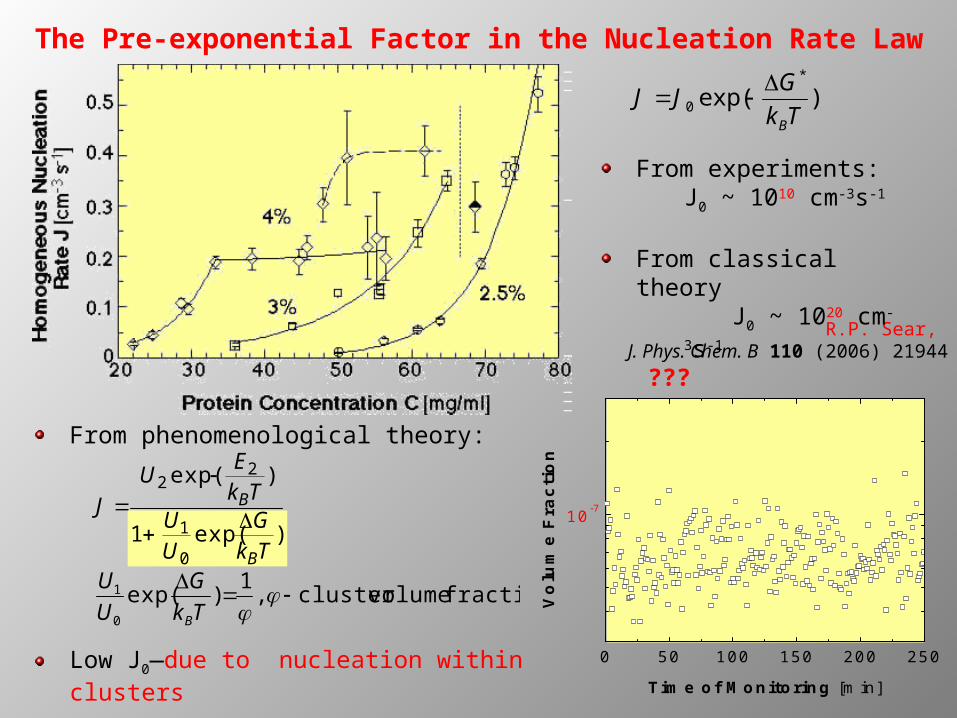
The Pre-exponential Factor in the Nucleation Rate Law
R.P. Sear, J. Phys. Chem. B 110 (2006) 21944
)exp(1
)exp(
0
1
22
TkG
UU
TkE
U
J
B
B
)exp(*
0 Tk
GJJ
B
From experiments: J0 ~ 1010 cm-3s-1
From classical theoryJ0 ~ 1020
cm-3s-1
???
From phenomenological theory:
fractionvolumecluster,1
)exp(0
1
Tk
G
U
U
B
0 50 100 150 200 250
10-7
Vo
lum
e F
rac
tio
n
Time of Monitoring [min]Low J0—due to nucleation within clusters
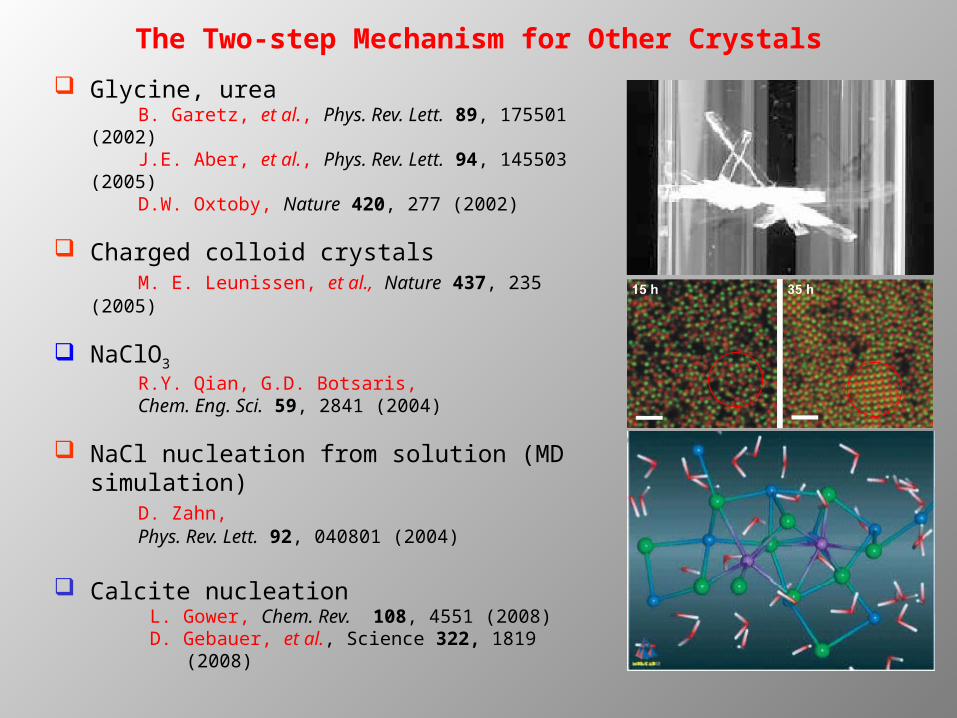
The Two-step Mechanism for Other Crystals
Glycine, ureaB. Garetz, et al., Phys. Rev. Lett. 89, 175501
(2002)J.E. Aber, et al., Phys. Rev. Lett. 94, 145503
(2005)D.W. Oxtoby, Nature 420, 277 (2002)
Charged colloid crystalsM. E. Leunissen, et al., Nature 437, 235
(2005)
NaClO3
R.Y. Qian, G.D. Botsaris, Chem. Eng. Sci. 59, 2841 (2004)
NaCl nucleation from solution (MD simulation)
D. Zahn, Phys. Rev. Lett. 92, 040801 (2004)
Calcite nucleationL. Gower, Chem. Rev. 108, 4551 (2008)D. Gebauer, et al., Science 322, 1819 (2008)
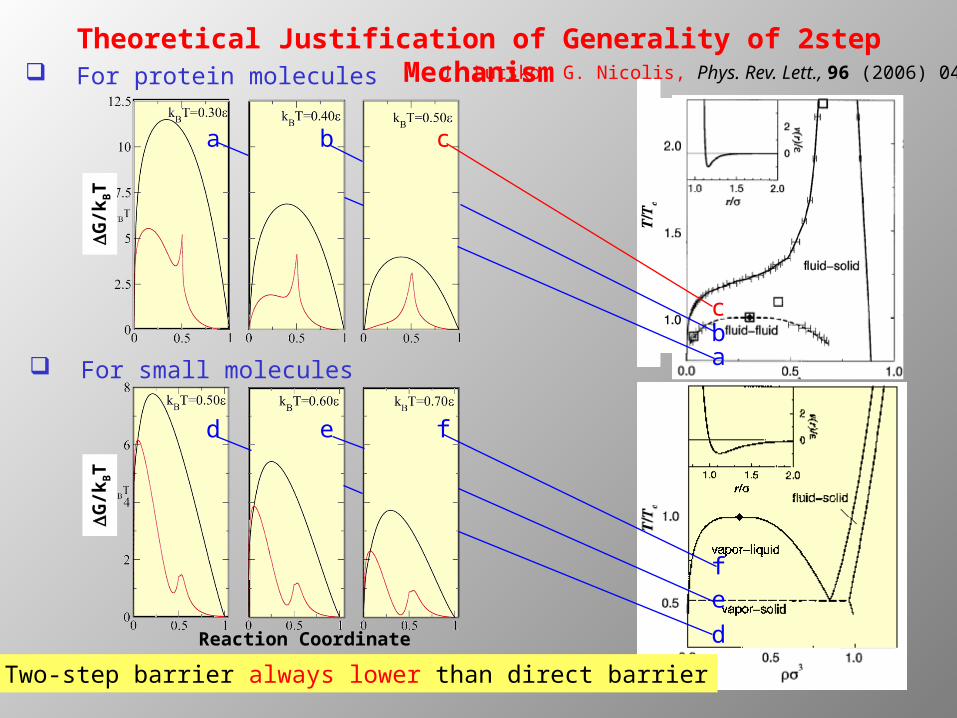
Theoretical Justification of Generality of 2step MechanismJ. Lutsko, G. Nicolis, Phys. Rev. Lett., 96 (2006) 046102 For protein molecules
cba
d
ef
cba
d e f
For small molecules
Two-step barrier always lower than direct barrier
Reaction Coordinate
DG
/kBT
DG
/kBT
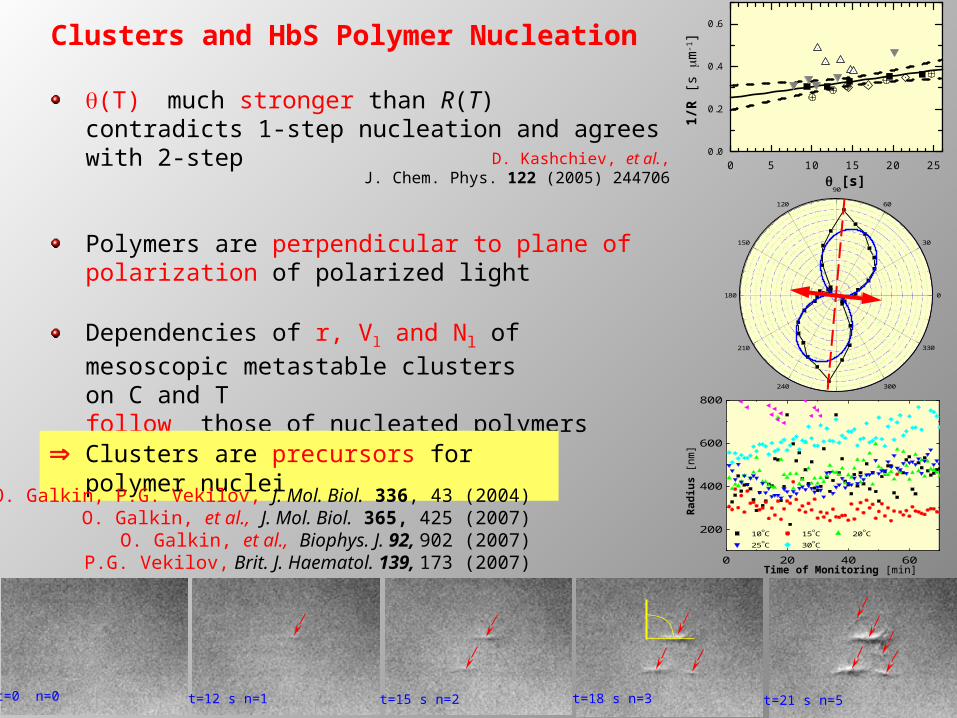
Clusters and HbS Polymer Nucleation
t=12 s n=1 t=15 s n=2 t=18 s n=3 t=21 s n=5
q(T) much stronger than R(T)contradicts 1-step nucleation and agrees with 2-step
Polymers are perpendicular to plane of polarization of polarized light
Dependencies of r, Vl and Nl of mesoscopic metastable clusters on C and T follow those of nucleated polymers
0
30
60
90
120
150
180
210
240
270
300
330
Time of Monitoring [min]0 20 40 60
200
400
600
800
10oC 15oC 20oC
25oC 30oC
Rad
ius
[nm
] Clusters are precursors for polymer nucleiO. Galkin, P.G. Vekilov, J. Mol. Biol. 336, 43 (2004)
O. Galkin, et al., J. Mol. Biol. 365, 425 (2007)O. Galkin, et al., Biophys. J. 92, 902 (2007)
P.G. Vekilov, Brit. J. Haematol. 139, 173 (2007)
t=0 n=0
D. Kashchiev, et al.,J. Chem. Phys. 122 (2005) 244706
0 5 10 15 20 250.0
0.2
0.4
0.6
q [s]
1/R
[s m
m-1]
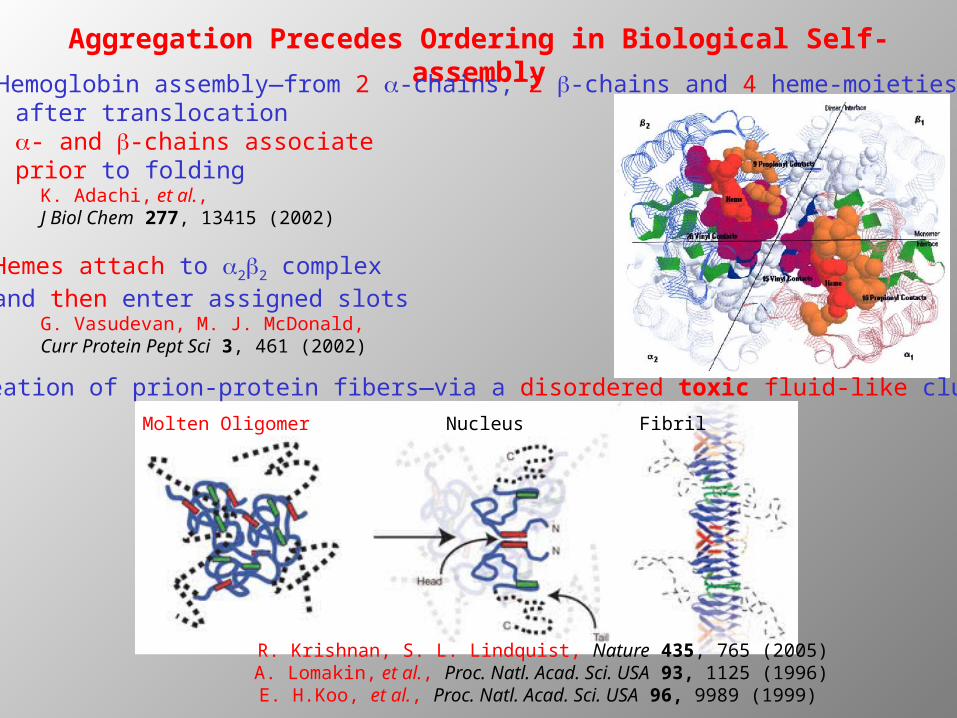
Aggregation Precedes Ordering in Biological Self-assembly Hemoglobin assembly—from 2 a-chains, 2 b-chains and 4 heme-moieties
after translocation a- and b-chains associate prior to folding
K. Adachi, et al., J Biol Chem 277, 13415 (2002)
Hemes attach to a2b2 complex and then enter assigned slots
G. Vasudevan, M. J. McDonald, Curr Protein Pept Sci 3, 461 (2002)
Nucleation of prion-protein fibers—via a disordered toxic fluid-like cluster
R. Krishnan, S. L. Lindquist, Nature 435, 765 (2005)A. Lomakin, et al., Proc. Natl. Acad. Sci. USA 93, 1125 (1996)
E. H.Koo, et al., Proc. Natl. Acad. Sci. USA 96, 9989 (1999)
Molten Oligomer Nucleus Fibril
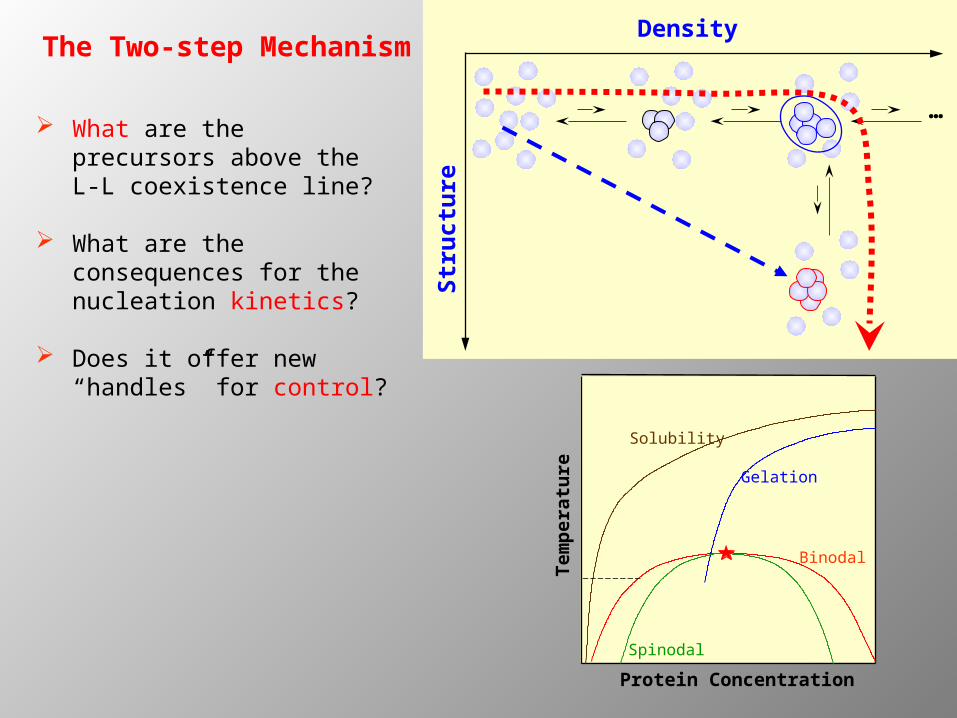
The Two-step MechanismDensity
Str
uct
ure
… What are the precursors
above the L-L coexistence line?
What are the consequences for the nucleation kinetics?
Does it offer new “handles” for control?
Protein Concentration
Tem
per
atu
re
Solubility
Gelation
Binodal
Spinodal
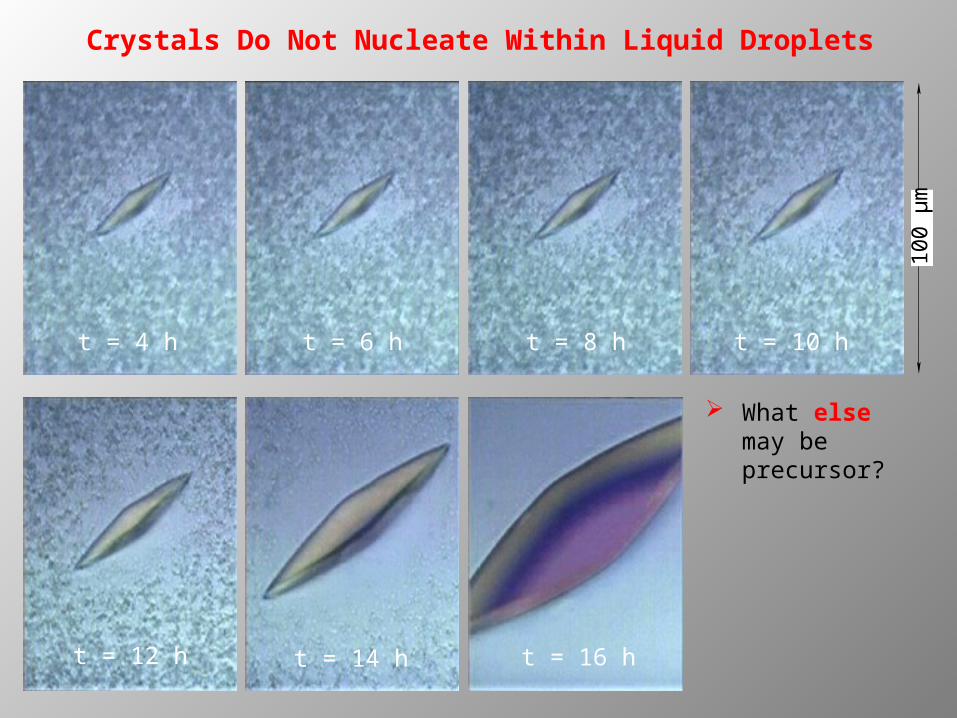
What else may be precursor?
.
100
µm
t = 4 h t = 6 h t = 8 h t = 10 h
t = 12 h t = 14 h t = 16 h
Crystals Do Not Nucleate Within Liquid Droplets
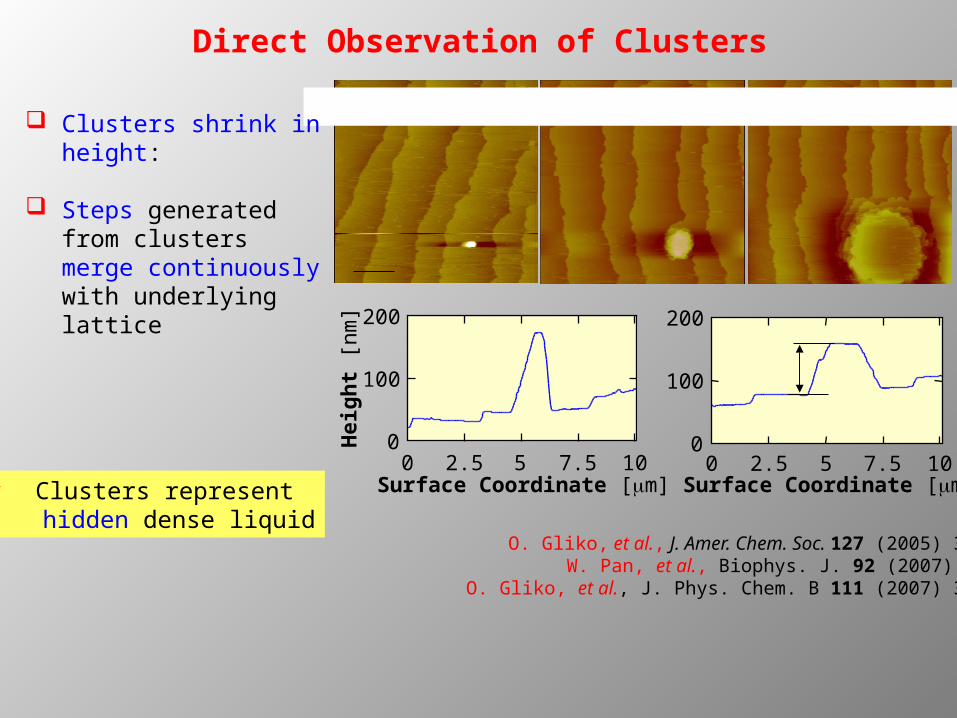
Direct Observation of Clusters
0
100
200
0 2.5 5 7.5 10Surface Coordinate [m]
Hei
gh
t [n
m]
0
100
200
0 2.5 5 7.5 10Surface Coordinate [m]
lumazine synthase 3 mg/ml 1.3 M phosphate 24 C Clusters shrink in height:
Steps generated from clusters merge continuously with underlying lattice
O. Gliko, et al., J. Amer. Chem. Soc. 127 (2005) 3433 W. Pan, et al., Biophys. J. 92 (2007) 267
O. Gliko, et al., J. Phys. Chem. B 111 (2007) 3106
Clusters represent hidden dense liquid
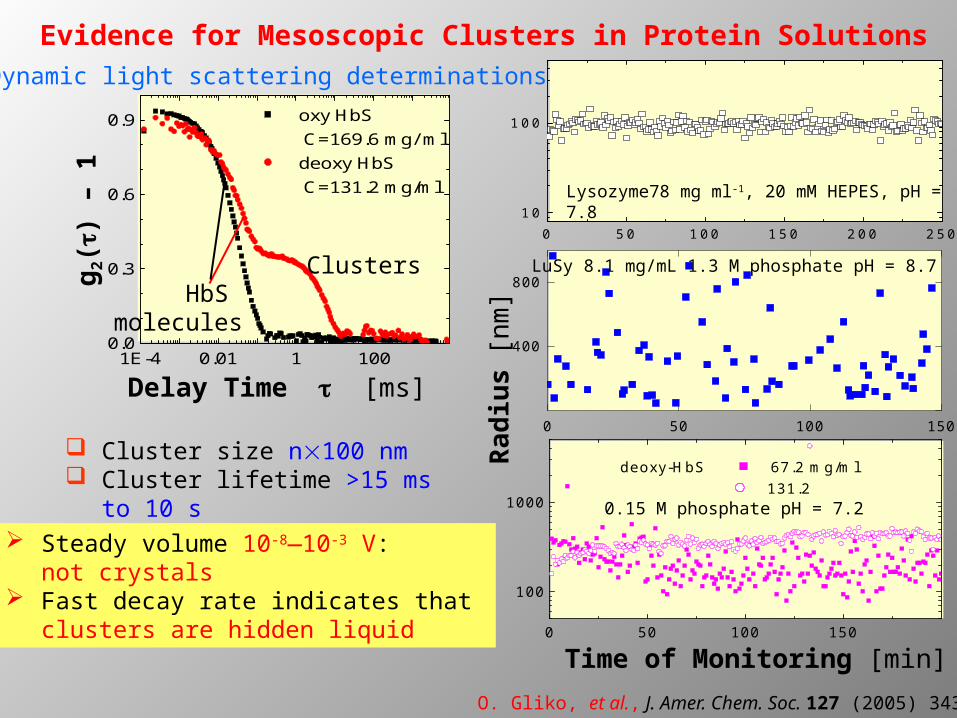
Evidence for Mesoscopic Clusters in Protein Solutions
1E-4 0.01 1 1000.0
0.3
0.6
0.9
oxy HbS C=169.6 mg/ ml
deoxy HbS C=131.2 mg/ml
Delay Time t [ms]
g2(t
) –
1
HbS molecules
Clusters
Dynamic light scattering determinations
Ra
diu
s[
nm
]
0 50 100 150
100
1000
deoxy-HbS 67.2 mg/ml 131.2
Time of Monitoring [min]
0 50 100 150
400
800
Lysozyme78 mg ml-1, 20 mM HEPES, pH = 7.8
LuSy 8.1 mg/mL 1.3 M phosphate pH = 8.7
0.15 M phosphate pH = 7.2
Cluster size n100 nm Cluster lifetime >15 ms to 10
s
O. Gliko, et al., J. Amer. Chem. Soc. 127 (2005) 3433
Steady volume 10-8—10-3 V: not crystals
Fast decay rate indicates that clusters are hidden liquid
0 50 100 150 200 25010
100
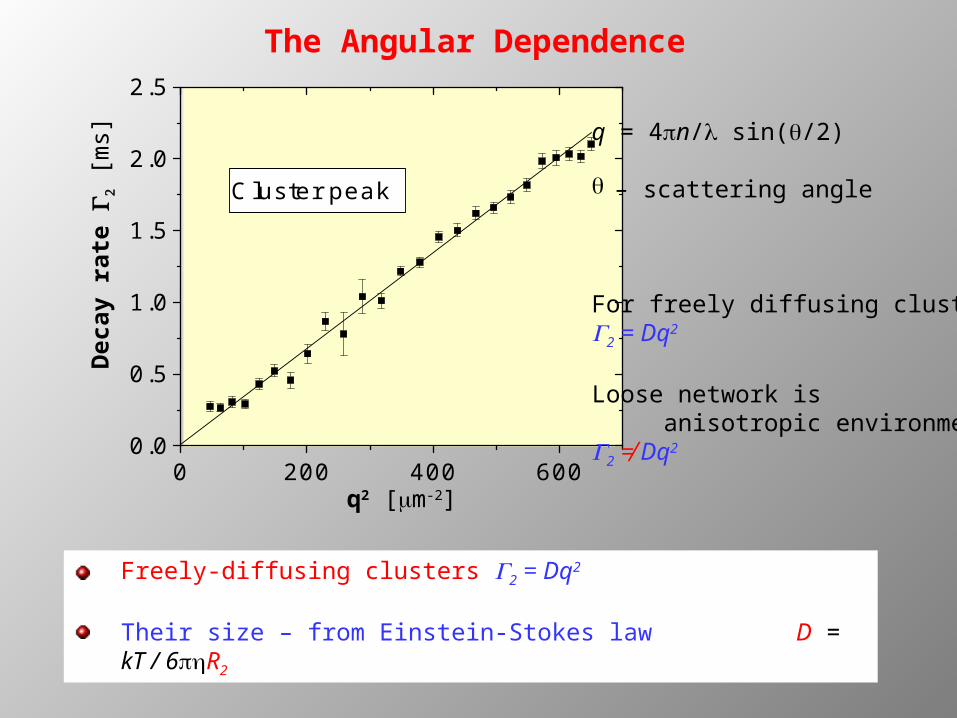
The Angular Dependence
q2 [mm-2]0 200 400 600
0.0
0.5
1.0
1.5
2.0
2.5
Cluster peak
Dec
ay r
ate
G2
[ms]
q = 4pn/l sin(q/2)
q – scattering angle
For freely diffusing clustersG2 = Dq2
Loose network is anisotropic environmentG2 ≠ Dq2
Freely-diffusing clusters G2 = Dq2
Their size – from Einstein-Stokes law D = kT / 6R2
0
5
10
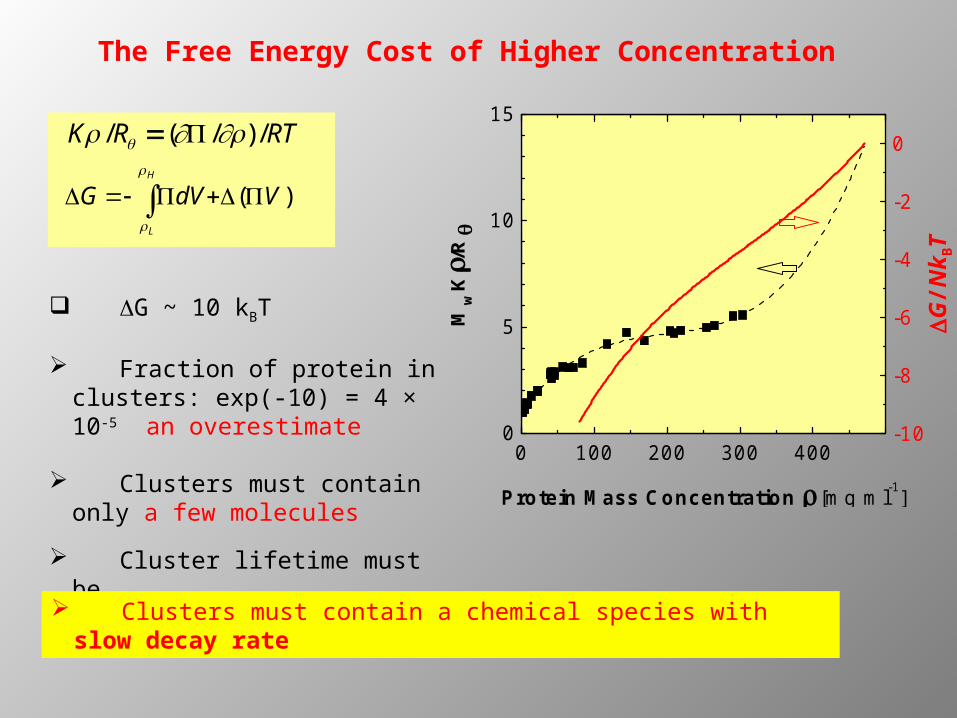
15
Mw
K/
R
0 100 200 300 400-10
-8
-6
-4
-2
0
Protein Mass Concentration [mg ml-1]
DG
/Nk B
T
The Free Energy Cost of Higher Concentration
DG ~ 10 kBT
Fraction of protein in clusters: exp(-10) = 4 × 10⁻⁵ an overestimate
Clusters must contain only a few molecules
Cluster lifetime must be O(tdiff) = 10 ms
K /R ( /) /RT
)( VdVGH
L
Clusters must contain a chemical species with slow decay rate
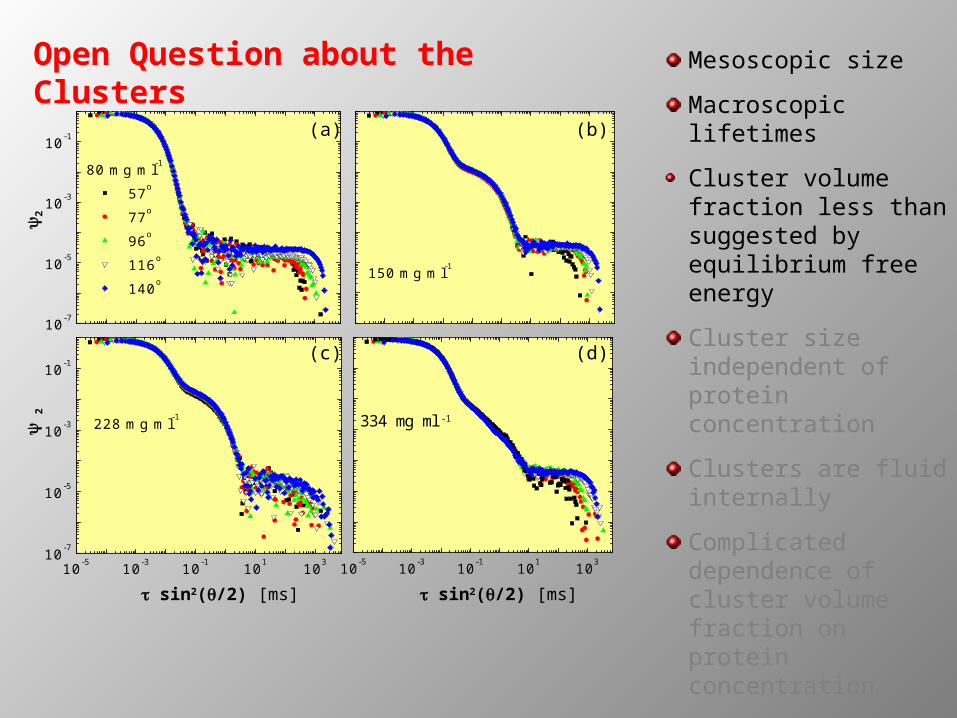
150 mg ml-1
10-7
10-5
10-3
10-1
80 mg ml-1
57o
77o
96o
116o
140o
10-5 10-3 10-1 101 10310-7
10-5
10-3
10-1
228 mg ml-1
10-5 10-3 10-1 101 103
334 mg ml-1
(a)
(c)
(b)
(d)
t sin2(q/2) [ms] t sin2(q/2) [ms]
2
2Open Question about the Clusters
Mesoscopic size
Macroscopic lifetimes
Cluster volume fraction less than suggested by equilibrium free energy
Cluster size independent of protein concentration
Clusters are fluid internally
Complicated dependence of cluster volume fraction on protein concentration
Cluster shoulder--non-exponential at high concentrations


Microscopic Scenario and the Cluster Radius
Clusters consist of off-equilibrium mixture of monomers and oligomers, kinetically stabilized
Cluster radius R is determined by the decay rate and diffusivity of the oligomers:
R (D2/k2)1/2
Since R ≃ 100 nm, oligomer lifetime
k2-1 10 ms
Cluster radius does not depend on concentration
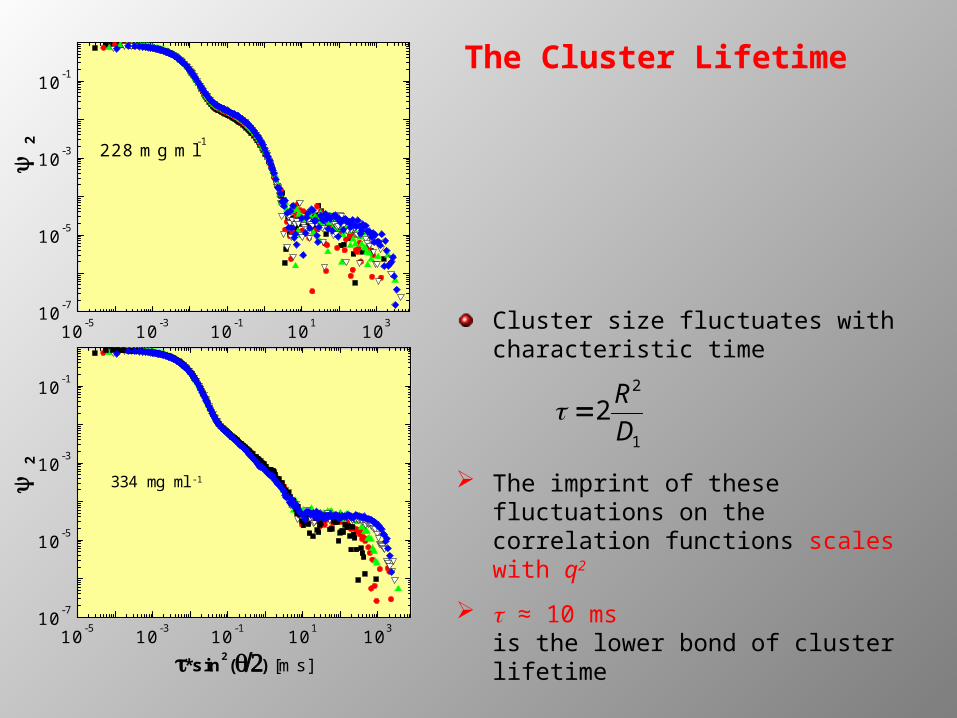
The Cluster Lifetime
10-5 10-3 10-1 101 10310-7
10-5
10-3
10-1
228 mg ml-1
10-5 10-3 10-1 101 10310-7
10-5
10-3
10-1
*sin2(2) [ms]
334 mg ml-1
2
2
Cluster size fluctuates with characteristic time
The imprint of these fluctuations on the correlation functions scales with q2
t ≈ 10 msis the lower bond of cluster lifetime
2 R2
D1
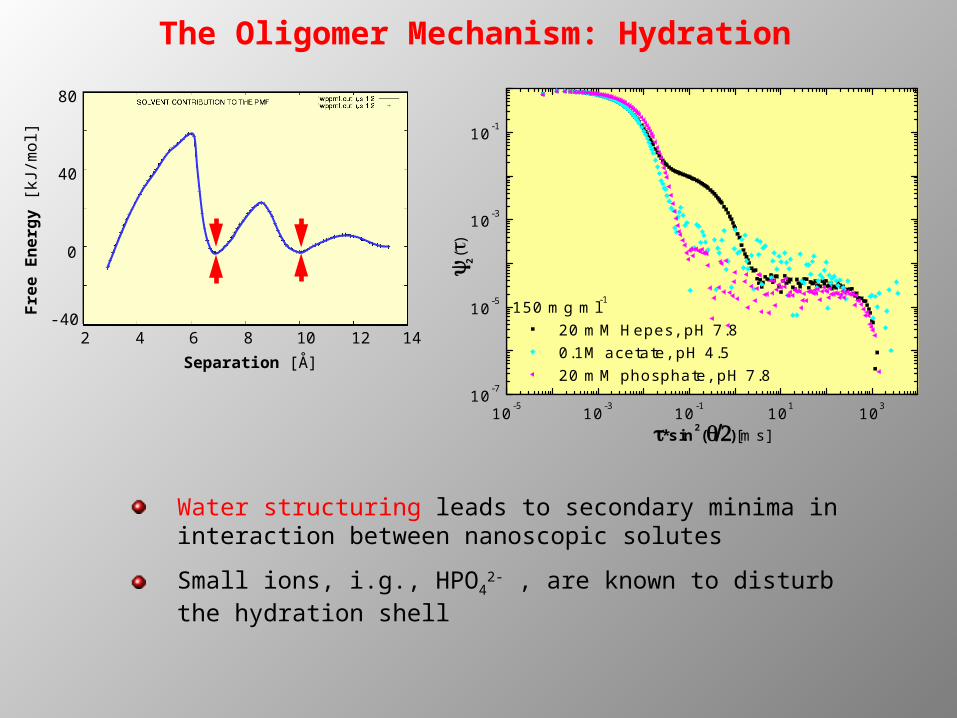
The Oligomer Mechanism: Hydration
Separation [Å]
Fre
e E
nerg
y [
kJ/m
ol]
2 4 6 8 10 12 14
0
-40
40
80
10-5 10-3 10-1 101 10310-7
10-5
10-3
10-1
2()
*sin2(2)[ms]
150 mg ml-1 20 mM Hepes, pH 7.8 0.1M acetate, pH 4.5 20 mM phosphate, pH 7.8
Water structuring leads to secondary minima in interaction between nanoscopic solutes
Small ions, i.g., HPO42- , are known to disturb the
hydration shell
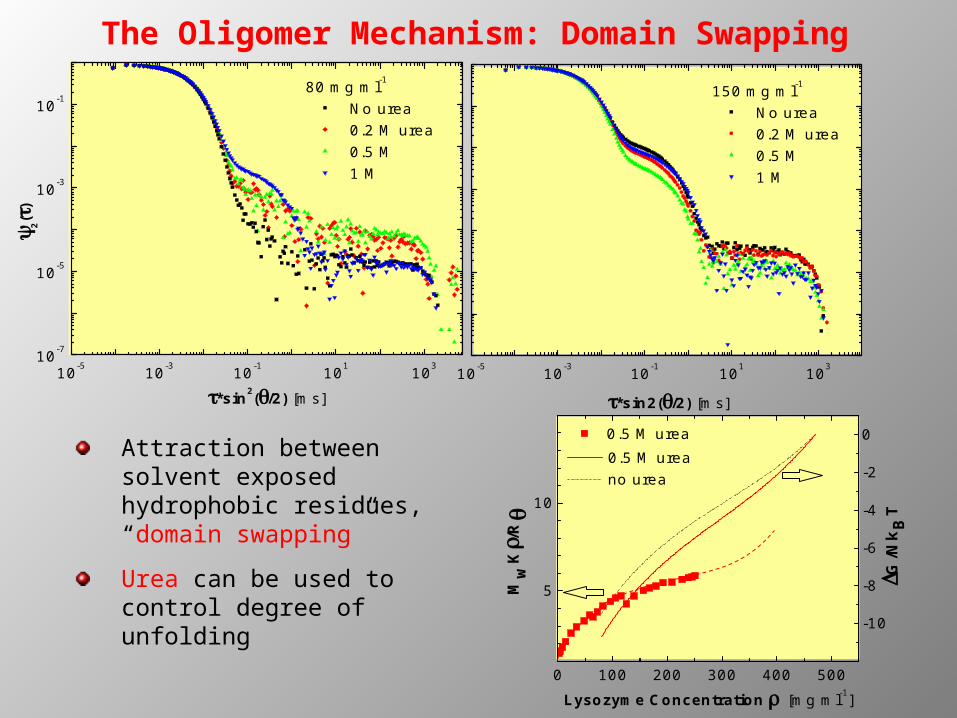
10-5 10-3 10-1 101 10310-7
10-5
10-3
10-180 mg ml-1
No urea 0.2 M urea 0.5 M 1 M
2
()
*sin2(/2) [ms]10-5 10-3 10-1 101 103
*sin2(/2) [ms]
150 mg ml-1 No urea 0.2 M urea 0.5 M 1 M
0 100 200 300 400 500
-10
-8
-6
-4
-2
0
5
10
0.5 M urea no urea
G/N
kB
T
Lysozyme Concentration [mg ml-1]
0.5 M urea
Mw
K/
R
Attraction between solvent exposed hydrophobic residues, “domain swapping”
Urea can be used to control degree of unfolding
The Oligomer Mechanism: Domain Swapping
Summary and Conclusions
Assembly of ordered arrays crystals, oligomers, fibers, etc.
is preceded by association into disordered clusters
The precursor is a metastable mesoscopic liquid cluster
Rate of crystal nucleation is determined by structuring of dense quasi-droplet
Polymorph selection is determined by kinetics factors rather than by high barriers
The low volume fraction of the nucleation precursors delays nucleation by ~ 1010
Understanding and control of nucleation in solution requires insights into the solution physicochemical mechanism nano- and
mesostuctures
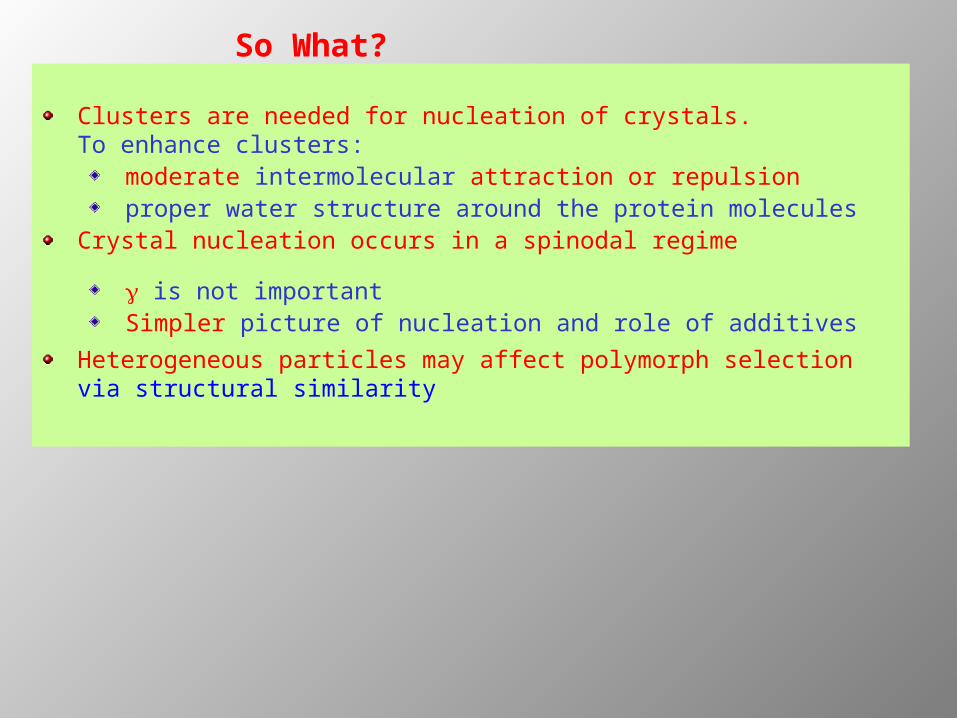
So What?
Clusters are needed for nucleation of crystals.To enhance clusters:
moderate intermolecular attraction or repulsionproper water structure around the protein molecules
Crystal nucleation occurs in a spinodal regime
g is not importantSimpler picture of nucleation and role of additives
Heterogeneous particles may affect polymorph selection via structural similarity